Attached files
Table of Contents
UNITED STATES
SECURITIES AND EXCHANGE COMMISSION
Washington, D.C. 20549
Form 10-K
(Mark One)
| x | ANNUAL REPORT PURSUANT TO SECTION 13 OR 15(d) OF THE SECURITIES EXCHANGE ACT OF 1934 |
For the Fiscal Year Ended December 31, 2011
OR
| ¨ | TRANSITION REPORT PURSUANT TO SECTION 13 OR 15(d) OF THE SECURITIES EXCHANGE ACT OF 1934 |
Commission file number: 001-35338
Imperva, Inc.
(Exact name of registrant as specified in its charter)
| Delaware | 03-0460133 | |
| (State or Other Jurisdiction of Incorporation or Organization) |
(I.R.S. Employer Identification No.) |
3400 Bridge Parkway, Suite 200
Redwood Shores, California 94065
(Address of Principal Executive Offices, including Zip Code)
(650) 345-9000
(Registrant’s Telephone Number, including Area Code)
Securities registered pursuant to Section 12(b) of the Act:
| Title of Each Class |
Name of Each Exchange on Which Registered | |
| Common Stock, par value $0.0001 per share | New York Stock Exchange |
Securities registered pursuant to Section 12(g) of the Act:
None
(Title of Class)
Indicate by check mark if the registrant is a well-known seasoned issuer, as defined in Rule 405 of the Securities Act. Yes ¨ No x
Indicate by check mark if the registrant is not required to file reports pursuant to Section 13 or Section 15(d) of the Act. Yes ¨ No x
Indicate by check mark whether the registrant (1) has filed all reports required to be filed by Section 13 or 15(d) of the Securities Exchange Act of 1934 during the preceding 12 months (or for such shorter period that the registrant was required to file such reports), and (2) has been subject to such filing requirements for the past 90 days. Yes x No ¨
Indicate by check mark whether the registrant has submitted electronically and posted on its corporate Web site, if any, every Interactive Data File required to be submitted and posted pursuant to Rule 405 of Regulation S-T (§ 232.405 of this chapter) during the preceding 12 months (or for such shorter period that the registrant was required to submit and post such files). Yes x No ¨
Indicate by check mark if disclosure of delinquent filers pursuant to Item 405 of Regulation S-K (§ 229.405) is not contained herein, and will not be contained, to the best of registrant’s knowledge, in definitive proxy or information statements incorporated by reference in Part III of this Form 10-K or any amendment to this Form 10-K. x
Indicate by check mark whether the registrant is a large accelerated filer, an accelerated filer, a non-accelerated filer, or a smaller reporting company. See the definitions of “large accelerated filer,” “accelerated filer” and “smaller reporting company” in Rule 12b-2 of the Exchange Act. (Check one):
| Large accelerated filer | ¨ | Accelerated filer | ¨ | |||
| Non-accelerated filer | x (Do not check if a smaller reporting company) | Smaller reporting company | ¨ | |||
Indicate by check mark whether the registrant is a shell company (as defined in Rule 12b-2 of the Act). Yes ¨ No x
As of June 30, 2011, the last business day of the registrant’s most recently completed second fiscal quarter, the registrant’s common stock was not listed on any exchange or over-the-counter market. The registrant’s common stock began trading on the New York Stock Exchange on November 9, 2011.
The number of outstanding shares of the registrant’s common stock as of March 1, 2012 was 23,021,259.
DOCUMENTS INCORPORATED BY REFERENCE
Portions of the definitive proxy statement for registrant’s 2012 Annual Meeting of Stockholders to be held on June 7, 2012 and to be filed pursuant to Regulation 14A within 120 days after registrant’s fiscal year ended December 31, 2011 are incorporated by reference into Part III of this Annual Report on Form 10-K.
Table of Contents

2011 ANNUAL REPORT ON FORM 10-K
TABLE OF CONTENTS
Table of Contents
Forward Looking Statements
The information in this Annual Report on Form 10-K contains forward-looking statements within the meaning of Section 27A of the Securities Act of 1933, as amended, or the Securities Act, and Section 21E of the Securities Exchange Act of 1934, as amended, or the Exchange Act. Such statements are based upon current expectations that involve risks and uncertainties. Any statements contained herein that are not statements of historical facts may be deemed to be forward-looking statements. For example, words such as “may,” “will,” “should,” “estimates,” “predicts,” “potential,” “continue,” “strategy,” “believes,” “anticipates,” “plans,” “expects,” “intends” and similar expressions are intended to identify forward-looking statements. Our actual results and the timing of certain events may differ significantly from the results discussed in the forward-looking statements. Factors that might cause or contribute to such differences include, but are not limited to, those discussed elsewhere in this Annual Report on Form 10-K in the section titled “Risk Factors” and the risks discussed in our other filings with the Securities and Exchange Commission, or the SEC. We undertake no obligation to publicly release any revisions to the forward-looking statements after the date of this Annual Report on Form 10-K.
PART I
Overview
We are a pioneer and leader of a new category of data security solutions focused on providing visibility and control over high-value business data across critical systems within the data center. Our SecureSphere Data Security Suite is a broad solution designed to prioritize and mitigate risks to high-value business data, protect against hackers and malicious insiders and address and streamline regulatory compliance. SecureSphere is an integrated, modular suite, which provides database, file and web application security and secures all business data across various systems in data centers, including traditional on-premise data centers as well as private, public and hybrid cloud computing environments. We also offer on-demand, cloud-based security services which we believe provide cost-effective web application security and denial of service protection.
We believe that organizations are facing numerous challenges in providing the visibility and control required to protect high-value business data from theft and exploitation. Enterprises must also comply with increasingly complex regulatory standards enacted to protect this data. As organizations adopt new technologies and architectures, they increase the complexity of, and open access to, the data center; thereby exposing their business data to new vulnerabilities. In addition, attacks, whether perpetrated by sophisticated hackers or malicious insiders, targeting high-value business data continue to increase in sophistication, scale and frequency. We believe that these challenges are driving the need for a new protection layer positioned closely around business data and systems in the data center and that traditional security and compliance products do not address this need.
We were incorporated as a Delaware corporation in 2002 with the vision of protecting high-value business data within the enterprise. As of December 31, 2011, we had over 1,700 end-user customers, who we refer to in this Annual Report on Form 10-K as our customers, in more than 50 countries. In addition, our solutions are used to protect thousands of organizations through cloud-based deployments with our Software-as-a-Service (“SaaS”) customers and managed security service provider (“MSSP”) and hosting partners. We primarily sell our products and services through our network of over 550 channel partners worldwide, including both distributors and resellers, which provide sales and support leverage to our sales organization. As of December 31, 2011, we had approximately 383 employees, including 135 employees in research and development. We generated revenue of $78.3 million in 2011, an increase of 41% over the $55.4 million in revenue we generated in 2010. We reduced our net loss attributable to our stockholders to $10.3 million in 2011 from $12.0 million in 2010.
Our Strategy
Our goal is to extend our leadership position in the data security market. Key elements of our growth strategy include:
| • | Enhance and extend our leadership position through technological and product innovation. We intend to continue to invest in product upgrades and product line extensions and to create new products and services that address emerging data security and regulatory compliance requirements. We also plan to invest in advanced threat research, conducted by our ADC, to increase our threat intelligence leadership, and to continue our investments in data security for cloud computing environments. For example, we recently introduced SecureSphere for SharePoint to enable our customers to monitor, audit and control access to high-value business data residing in Microsoft SharePoint, a widely-deployed enterprise collaboration tool. |
| • | Further penetrate our existing customer base. We intend to drive further penetration and deployment of our data security suite within our existing customer base. As of December 31, 2011, we had over 1,700 customers in more than 50 countries. Many of our customers initially deploy our solution on a limited portion of their business systems providing us with significant opportunities to sell them more of our products. We have enjoyed success from this strategy as more than 61% of our sales in 2011 were based on repeat sales to existing customers. In addition, as a leading provider of a broad data security solution, we believe we are well positioned to benefit as our customers expand the scope of their data security and compliance initiatives. As of December 31, 2011, approximately 29% of our customers have purchased more than one of our product families. |
3
Table of Contents
| • | Invest in our global distribution network to expand our customer base. We believe that our hybrid sales model, which combines the leverage of a channel sales model with the account control of a direct sales model, has played an important role in our success to date. |
Our hybrid sales model employs a direct touch sales organization and an overlay channel sales team that actively assist our extensive network of channel partners throughout the sales process. We have a network of over 550 channel partners worldwide, including both distributors and resellers, which provide sales and support leverage to our sales organization. In 2011, our channel partners originated approximately 55%, and fulfilled almost 90%, of our sales. We intend to continue to invest significant resources to further strengthen our existing relationships with channel partners and to expand our network by adding new channel partners. We also plan to expand and develop our relationships with global channel partners, such as Dimension Data plc, Verizon Enterprise and HP Enterprise Security Services. As we expand our base of partners, we intend to grow our direct touch sales team and enhance our marketing efforts to support our distribution network.
| • | Pursue data security opportunities as businesses adopt cloud computing. Our solutions are used to protect thousands of enterprises through cloud-based deployments with our SaaS customers and our MSSP and hosting partners. We intend to continue to focus on capturing the expected increases in spending on securing high-value business data as enterprises pursue cloud computing initiatives. We believe data security is a paramount concern of enterprises as they consider the adoption of cloud computing. Our approach of providing enterprises flexible and scalable data security over a broad range of enterprise cloud strategies has achieved early success. For example, our sales from cloud-based service providers, such as data center hosting vendors, have grown significantly since we first targeted these customers in 2008 and were approximately 9% of our sales in 2011. We intend to develop and expand our relationships with MSSPs and data center hosting providers, such as RackSpace Hosting, Inc. and Savvis, Inc. (which was acquired by CenturyLink, Inc.), and to increase sales to SaaS providers, such as salesforce.com, inc. |
| • | Increase our focus on the mid-market and SMB market. We believe there is a significant opportunity to provide data security solutions to smaller businesses as they are faced with increasing security threats and compliance mandates. We plan to increase our business with mid-market enterprises and SMBs by expanding our distribution channels and our cloud-based service offering. In 2011, we introduced the Imperva Cloud Web Application Firewall service for the mid-market and the Incapsula service for the SMB market, each of which provides cost-effective data security solutions optimized for the needs of their respective markets. |
| • | Increase awareness of the importance of data security and drive adoption of our solution. We believe the market for data security is in its early stages and is growing rapidly. We plan to continue to increase market awareness of the benefits of our broad data security solution and invest in our brand so that we can extend our leadership in the data security market. For example, we plan to continue our investments in a broad range of marketing programs, including expanding active tradeshow participation, print advertising, direct marketing, high-profile web events, online advertising initiatives and social media channels such as LinkedIn, Facebook and Twitter. |
Products
Our products include our SecureSphere Data Security Suite for enterprise data centers and our cloud-based security services that we provide through Incapsula, our majority owned subsidiary, for mid-market enterprises and SMBs. Our SecureSphere Data Security Suite secures high-value business data across critical systems within the data center from hackers and malicious insiders, provides an accelerated and cost-effective route to address regulatory compliance and establishes a repeatable process for data risk management. Our solution is designed on a common, modular platform that provides centralized management, in-depth analytics and customizable reporting and offers multiple, flexible deployment options that are quick to deploy and easy to scale. Our SecureSphere Data Security Suite incorporates our proprietary dynamic profiling, universal user tracking, transparent inspection and correlated attack validation technologies, which are described further below. Our solution includes database security, file security and web application security, which we believe differentiate us as providing one of the broadest data security offerings in the marketplace:
| • | Database Security. Provides full visibility and control over structured business data repositories, including database data usage, vulnerabilities and access rights and enables security, audit, risk and IT professionals to improve data security and address compliance requirements. |
| • | File Security. Provides full visibility and control over unstructured business data repositories, including file ownership, usage and access rights and enables security, audit, risk and IT professionals to improve file data security and address compliance requirements. |
| • | Web Application Security. Protects web applications from large scale cyber attacks, adapts to evolving threats to prevent data breaches and addresses compliance requirements. |
4
Table of Contents
SecureSphere Web Application Firewall (“WAF”), Database Activity Monitoring and File Activity Monitoring gateways are deployed in the network near the assets they are meant to protect. The File and Database gateways also work in conjunction with SecureSphere Agents that capture activity on the database and file servers themselves. Our broad SecureSphere solution is managed by a centralized management server, which incorporates information from ThreatRader and security updates from the Imperva Application Defense Center (“ADC”).
Database Security
Our database security products are designed to secure high-value business data in structured repositories in the data center. Our database security products are sold as physical or virtual appliances based on the feature and traffic capacity requirements of our customers. We also offer add-on products for our appliances that are sold separately. Our database products cover the following major enterprise database platforms: Oracle, MS-SQL, IBM DB2, Sybase, Informix, MySQL, Progress, Teradata and Netezza.
| Database Security |
Description | |
| Discovery and Assessment Server | • Automates the process of discovering databases and other business data on the network and performs a security assessment to identify risks to high-value business data | |
| • Includes assessments for over 1,000 known vulnerabilities and configuration flaws based on proprietary research from our ADC and industry best practices | ||
| • Enables organizations to review and manage their vulnerabilities and accurately scope security and compliance projects | ||
| Database Activity Monitoring | • Includes all Discovery and Assessment Server functionality | |
| • Delivers real-time, automated, scalable database activity monitoring, auditing and reporting for heterogeneous database environments | ||
| Database Firewall | • Includes Database Activity Monitoring functionality | |
| • Delivers real-time blocking of external attacks and internal threats from malicious users | ||
| User Rights Management for Databases | • Enables the management of user rights across heterogeneous enterprise databases by aggregating user rights to illustrate what rights users have to business data | |
| • Secures customer environments by evaluating user rights, eliminating excessive privileges and disabling dormant accounts | ||
| • Enables our customers to comply with regulatory requirements to limit user access rights based on business need to know | ||
| ADC Insights | • Optimized for quick and effective deployment of our SecureSphere database products within organizations running complex enterprise applications such as Oracle E-Business Suite, PeopleSoft and SAP | |
| • Provides user tracking for identifying the real end-user behind database transactions | ||
| • Includes policies to audit and protect database objects containing sensitive data and assessments for identifying known vulnerabilities | ||
File Security
Our file security products are designed to secure files, including spreadsheets, presentation slides, word processing documents and PDFs containing high-value business data that our customers store in unstructured repositories, such as file servers, network attached storage and storage area network devices. Our file security products are sold as physical or virtual appliances based on feature and traffic capacity requirements of our customers.
5
Table of Contents
| File Security |
Description | |
| User Rights Management for Files | • Sold as a part of the File Activity Monitoring and File Firewall solutions | |
| • Enables the management of user access rights across multiple different file storage systems by aggregating user rights based on organizational context and actual file usage to illustrate what rights users have to sensitive files | ||
| • Secures customer environments by evaluating user rights, eliminating excessive privileges and disabling dormant accounts | ||
| File Activity Monitoring | • Includes all User Rights Management for Files functionality | |
| • Delivers real-time, automated, scalable file activity monitoring, auditing and reporting | ||
| • Creates a detailed audit trail of file access activity, enabling customers to perform interactive audit analytics to identify file activity and user rights problems, measure risk and document compliance with regulatory requirements | ||
| File Firewall | • Includes all File Activity Monitoring functionality, and provides real-time blocking of suspicious activity that violates corporate policies | |
| • Guards against mistakes introduced at the access control list level | ||
| SecureSphere for SharePoint | • Includes all File Activity Monitoring functionality, including User Right Management for Files functionality, for data stored within SharePoint | |
| • Includes SecureSphere Web Application Firewall to protect against Web-based attacks on Microsoft SharePoint Web servers | ||
| • Includes SecureSphere Database Firewall to protect against unauthorized access to the Microsoft SQL database at the core of SharePoint | ||
Web Application Security
We believe that our web application firewall (“WAF”) product is one of the industry leading solutions for protecting web assets from application attacks. Our web application security products protect our customers’ applications and high-value business data from application attacks and enable compliance with regulatory requirements. Our web application security products are sold as physical or virtual appliances based on the feature and traffic capacity requirements of our customers. We also offer add-on services for our appliances that are sold separately.
6
Table of Contents
| Web Application Security |
Description | |
| Web Application Firewall | • Dynamically learns legitimate web application usage | |
| • Fortifies web defenses with research-driven intelligence on current threats | ||
| • Alerts or blocks requests that: | ||
| • Deviate from normal application and data usage | ||
| • Attempt to exploit known and unknown vulnerabilities | ||
| • Originate from malicious sources | ||
| • Indicate a sophisticated, multi-stage attack | ||
| • Virtually patches application vulnerabilities through integration with web application vulnerability scanners, reducing the window of exposure and impact of ad-hoc application fixes | ||
Our WAF has achieved web application firewall certification and PCI DSS Product Capability Assurance in November 2010 from ICSA Labs, an independent division of Verizon Business which provides third party product assurance and certification for security products and solutions.
Common Product Platform
Our SecureSphere Data Security Suite is built on a common modular platform, which includes a single operating system and common code base. All of the products in our SecureSphere Data Security Suite can be managed either individually as stand-alone appliances or collectively from our SecureSphere MX Management Servers, which provide centralized management, in-depth analytics and customizable reporting. Our SecureSphere MX Management Server product provides a single, centralized point for aggregating and managing SecureSphere security policies, real-time monitoring, logging, auditing and compliance reporting. With our MX server, administrators can simultaneously manage our database, file and web security products from a single console.
Flexible Deployment Options
Our common product platform allows us to offer multiple, flexible deployment options that are quick to deploy and easy to scale. Our platform includes physical and virtual network appliances that can be deployed both inline and non-inline via a variety of networking configurations. Our platform also includes software agents that provide additional ability to monitor local activity on database servers or file storage devices, including the actions of privileged users.
| • | Hardware Appliances. Our SecureSphere database security, file security and web application security products are available on five different hardware appliance models that can handle traffic throughput from 100 Mbps to 2Gbps. Our hardware appliances are built on a high performance architecture that allows organizations to manage heavy traffic loads without impacting application or network performance. With our SecureSphere platform, customers can combine multiple SecureSphere appliances to reach inspection speeds of up to 10Gpbs. |
| • | Virtual Appliances. SecureSphere virtual appliances provide our full suite of web application, database and file security products in a flexible, easy to install software-only solution. Our virtual appliances operate on VMware, Inc.’s hypervisor, which allows organizations to select their preferred hardware or leverage existing hardware for data center consolidation, to maximize server utilization and reduce power, cooling and support costs. Our virtual appliances offer adaptable, reliable and manageable security for organizations of all sizes that operate VMware, Inc. environments. |
| • | Agents. For comprehensive visibility into user activity, we offer SecureSphere agents, software that is installed on database or file servers, to extend monitoring, auditing, and enforcement capabilities to these host servers. A single SecureSphere agent can be installed on a server to monitor database activity, file activity or both, and to protect sensitive data with minimal impact to the server performance. Agent communications to the SecureSphere appliance are buffered and encrypted to prevent data loss or compromise. Our database agents can optionally block user activity and quarantine user accounts in the event of a security violation and we expect to add similar blocking capabilities for our file agents in a future product release. |
7
Table of Contents
Cloud-Based Services
A key focus of our business and product strategy is to develop hosted security services that we offer as subscriptions in a SaaS delivery model. Our primary cloud-based service offerings are our Incapsula service, the Imperva Cloud WAF Service and our ThreatRadar subscription service.
Incapsula Service
Leveraging our expertise in data security and our investment in intellectual property, our Incapsula service is purpose-built to deliver cloud-based security and content delivery optimization. Our Incapsula service is designed to be easy to deploy and to be accessible to small and medium size businesses that need data security and compliance solutions, but do not have the size or resources to deploy our SecureSphere WAF appliances into their own website infrastructure. With no requirement to purchase or install any hardware or software to use the Incapsula service, we estimate that most customers can set up the Incapsula service in less than 10 minutes. Our customers begin using the Incapsula service by changing their website’s Domain Name System setting to route traffic to Incapsula’s network. Incapsula’s global network of servers apply security and optimization solutions to the customers’ websites’ traffic according to the Incapsula service options purchased by the customer. The screened, filtered and optimized traffic is then routed by the Incapsula network to the customer’s websites.
Incapsula’s security and optimization offerings currently include the following services:
| • | Web Application Firewall Services: provides enterprise-grade blocking of attacks against web applications to help ensure website safety and availability, enhanced security through real-time and centralized threat detection across all protected websites and allows customers to address compliance requirements. |
| • | Content Delivery Optimization: optimizes website performance by reducing page load times, server load and bandwidth consumption. |
| • | Distributed Denial of Service-Attack Prevention: blocks malicious attack traffic and allows filtered, legitimate traffic to flow to the customer website helping its business to run without interruption. |
Customers sign up directly with Incapsula to receive the service under different pricing plans, based principally on website traffic bandwidth. These direct customers operate principally through Incapsula’s high volume, self service model—provisioning the Incapsula service themselves through Incapsula’s website and payment processor—and receive basic customer support.
Imperva Cloud WAF Service
For customers that desire a higher level of managed services and customer support, we launched an additional cloud-based service offering in May 2011 targeted at mid-market enterprises. This offering, which we market as the Imperva Cloud WAF powered by Incapsula, bundles the Incapsula service with managed support services from our Security Operations Center (“SOC”). Managed services include provisioning, security alert notifications and tuning, incident response, real time service dashboard and statistics, customer support and weekly reports on alerts and attack trends.
Imperva Cloud DDoS Protection Service
In September 2011, we launched an additional cloud service focused on helping customers protect against distributed denial of service, or DDoS, attacks. Imperva Cloud DDoS Protection is a simple, secure cloud-based service that safeguards businesses from the most debilitating and protracted DDoS attacks. As a service, Cloud DDoS Protection can be deployed quickly and can scale on demand to mitigate malicious traffic. Imperva’s experienced security professionals provide on-call, expert assistance and policy tuning in the event of a DDoS attack, providing businesses assurance that their applications will always be available.
ThreatRadarReputation Services
ThreatRadar Reputation Services is an add-on, premium subscription service for our SecureSphere WAF appliance that recognizes attack sources and dynamically adjusts web security policies within our SecureSphere WAF appliance to provide protection against attacks. These attack sources may include known malicious traffic sources that have attacked other web applications, anonymous proxies that may be used by hackers to launch attacks, traffic sources that launch anonymous attacks and phishing URLs. Our dedicated security research team, the ADC, globally tracks these different attack sources and compiles this information with third-party research on malicious sources into the ThreatRadar feed.
ThreatRadarFraud Prevention Services
ThreatRadar Fraud Prevention Services is designed to enable organizations to rapidly provision and manage fraud detection solutions without needing to update Web applications. By integrating with leading fraud security vendors, the SecureSphere Web Application Firewall (WAF) can transparently identify and help to stop fraudulent transactions. ThreatRadar Fraud Prevention also provides powerful monitoring and enforcement capabilities, allowing businesses to centrally manage WAF and fraud policies together.
8
Table of Contents
Security Operations Center
We offer our hosting partners that deploy our SecureSphere WAF appliances and Imperva Cloud WAF customers remotely managed security services through our team of specialized data security professionals in our SOC in Tel Aviv, Israel. For our hosting partners, our SOC remotely configures provisions, manages and monitors our SecureSphere WAF appliance in our hosting partners’ data centers; provides maintenance updates, patch management and backups; and delivers daily or weekly reports, real-time alerts and incident responses for suspicious activities. Our SOC services for our hosting partners also include customized rules, alerts, reports and dashboards to enable quick and cost effective steps towards compliance and security. While our SOC currently provides only managed security services to our hosting partners for our SecureSphere WAF appliances, we anticipate that in the future our SOC services will also support our database activity monitoring and file activity monitoring products.
Technology
Our SecureSphere Data Security Suite provides our customers with a single unified platform for protecting sensitive data from hackers and malicious insiders, providing a fast and cost-effective route to regulatory compliance and establishing a repeatable process for data risk management. Our solution includes the proprietary technologies described below.
| • | Dynamic Profiling: allows customers to create and monitor security policies based on actual application and database behavior, automatically recognizes valid application and database changes over time and automatically updates the profile according to these application and database changes. |
| • | Universal User Tracking: helps customers achieve the primary requirements of any audit and security process by tracking the individual end user that accessed or modified business data, including web application user tracking, web to database user tracking, SQL connection user tracking and direct user tracking that collectively enable our solution to audit end users regardless of how they connect to the database. |
| • | Transparent Inspection: provides application layer security without needing to intermediate web connections, allowing our solution to inspect traffic without compromising performance, latency or availability. |
| • | Correlated Attack Validation: provides our customers with protection against malicious activity by analyzing multiple data points, tracking events over time and correlating disparate events to identify and block sophisticated attacks. |
Services
Maintenance and Support
We offer our customers ongoing product support services for both hardware and software. These maintenance programs are typically sold to customers for one to three-year terms at the time of the initial product sale and typically renew for successive one to three-year periods. We offer a premium level of service which includes advance replacement and greater call center availability. While some of our channel partners provide tier one support, including MSSPs and data center hosting providers, in most instances we provide tier one level support and above.
Our ADC updates are included with maintenance and support contracts. The service consists of a content delivery mechanism by which we can distribute product content enhancements to our customers. Our ADC update servers deliver various types of security content to our appliances deployed in the field without the need for our customers to install a software patch or upgrade. Examples of ADC updates include new security signatures and policies for our WAF, new database assessment tests for our discovery and assessment server and new audit policy functionality for our database products.
Professional Services and Training
Our professional services consultants assist our customers in the deployment and configuration of our products. These fee-based services, provided by our professional services consultants, include providing advice on deployment planning, network design, product configuration and implementation, automating and customizing reports and tuning policies and configuration of our products for the particular characteristics of the customer’s environment. Additionally, we provide our customers with fee-based, hands-on training classes for our solution that are offered regularly and in different parts of the world.
Customers
We provide products and services to a variety of customers worldwide, including some of the world’s largest banks, retailers, insurers, technology and telecommunication companies, hospitals, as well as U.S. and other national, state and local government agencies. As of December 31, 2011, we had over 1,700 customers in more than 50 countries. In addition, our solutions are used to
9
Table of Contents
protect thousands of organizations through cloud-based deployments with our SaaS customers and our MSSP and hosting partners. Our customers include top telecommunications companies, commercial banks in the United States, financial data service firms, computer hardware companies and food and drug store companies in the United States, as well as over 150 government agencies around the world and more than 100 Fortune 1000 companies.
Our customer base is broad and diversified across multiple geographies and industry verticals, including banking and finance, government and military, technology, telecom, healthcare and retail. Since 2004, no customer has accounted for more than 10% of our sales in any year. In 2011, 2010 and 2009, we generated approximately 61%, 66% and 63% of our revenue from customers in the Americas and approximately 39%, 34% and 37% from customers outside of the Americas, respectively.
Sales and Marketing
We believe that our hybrid sales model, which combines the leverage of a channel sales model with the account control of a direct sales model, has played an important role in our success to date. Our hybrid model employs a direct touch sales organization and an overlay channel sales team that actively assist our extensive network of channel partners throughout the sales process. We primarily sell our products and services to our customers through our channel partners, including distributors and resellers. In 2011, our channel partners originated over 55% of our sales and fulfilled almost 90% of our sales. Although our products are designed for turnkey deployment, they are highly customizable, which allows our channel partners to provide a variety of value added services to our customers. We employ a direct touch sales organization to work closely with our channel partners on customer outreach efforts and a channel overlay organization to manage our channel partners. As of December 31, 2011, our network of channel partners included more than 550 resellers and distributors worldwide. We work with many global channel partners, such as Dimension Data plc and Wipro Limited, and leading security value added resellers, including Accuvant, Inc., FishNet Security, Inc. and Integralis AG. Our MSSP partners include some of the largest hosting companies including Rackspace Hosting, Inc., Savvis, Inc. (which was acquired by CenturyLink, Inc.) and Dell, Inc. (formerly SecureWorks, Inc.).
Sales
We support the sales of our products and services with a team of experienced channel account managers, sales professionals and sales engineers who provide business planning, joint marketing strategy, and pre-sales and operational sales support. Our overlay channel team is responsible for managing relationships with our resellers, MSSPs and distributors. Our sales professionals are responsible for assisting channel partners in gaining and supporting key customer accounts and acting as liaisons between the end customers and our marketing and product development organizations. Our sales professionals and sales engineers typically work alongside our channel partners and directly engage with customers to address their unique security and deployment requirements. We also have an inside sales team that is principally focused on lead generation for our reseller partners and regional sales professionals. To support our broadly dispersed global channel and customer base, we have, as of December 31, 2011, sales personnel in more than 20 countries. We plan to invest in our sales organization to support the growth of our channel partners.
Marketing
Our marketing strategy is focused on building our brand and driving customer demand for our security solutions. We execute this strategy by leveraging a combination of internal marketing professionals and a network of regional and global channel partners. Our internal marketing organization is responsible for branding, and product marketing and works with our business operations team to support channel marketing and sales support programs. We focus our resources on programs, tools and activities that can be leveraged by partners worldwide to extend our marketing reach, such as sales tools and collateral, information regarding product awards and technical certifications, training, regional seminars and conferences, webinars and various other demand-generation activities. Our marketing efforts also include public relations and our website, including our data security blog.
Research and Development
Our research and development efforts are focused primarily on improving and enhancing our existing data security products and services, as well as developing new products, features, and functionality and conducting advanced security research. We conduct our research and development activities in Israel, and we believe this provides us with access to some of the best engineering talent in the security industry. As of December 31, 2011, we had 135 employees dedicated to research and development, including our advanced security research group, the ADC.
When considering product improvements and enhancements, we communicate with our customers and partners who provide significant feedback for product development and innovation. We regularly release new versions of our products incorporating these improvements and enhancements. Our research and development team works with our customer support group to resolve escalated support issues by providing consultation, bug fixes and patches. Our research and development team also provides technical assistance to our other departments, including to our sales team by overseeing product pilots for potential customers.
In addition to enhancing our products and services, our research and development organization is made up of our engineering team and our ADC. We believe our ADC is an important differentiator for us in the security marketplace. Our ADC team performs security analysis, tracks hackers and trends in the hacker community and undertakes vulnerability discovery, in addition to providing
10
Table of Contents
us with regulatory compliance expertise. ADC research combines extensive lab work with hands-on testing in real world environments to ensure that our products, through advanced data security technology, deliver up-to-date threat protection and leading compliance automation. Our ADC has discovered numerous commercial application vulnerabilities and has issued numerous security advisories, providing insight into both published and unpublished security threats to help commercial application and database vendors and security professionals. Our ADC’s “Hacker Intelligence Initiative” focuses on improving risk management by tracking hackers, developments in attack techniques and potential targets in known hacker forums and chat rooms. The ADC’s research is also the foundation for many of our solution’s features and services, including attack signature updates, database vulnerability assessments and pre-defined compliance reports. We deliver automated feeds from our ADC to our products in the field to ensure that our customers are always armed with the latest defenses against new threats, and the most recent regulatory compliance best practices.
Our research and development expense was $17.6 million, $13.2 million and $10.5 million in 2011, 2010 and 2009, respectively.
Intellectual Property
To protect our intellectual property, both domestically and abroad, we rely primarily on patent, trademark, copyright and trade secret laws. As of December 31, 2011, we had six issued patents and nine pending patent applications in the United States. The claims for which we have sought patent protection relate primarily to methods, computer programs, devices and systems we have developed for our products. We also license software from third parties for integration into our products, including open source software and other software available on commercially reasonable terms.
Our industry is characterized by the existence of a large number of relevant patents and frequent claims and related litigation regarding patent and other intellectual property rights. In particular, leading companies in the security industry have extensive patent portfolios. From time to time, third parties, including certain of these leading companies, have asserted and may assert patent, copyright, trademark and other intellectual property rights against us, our channel partners or our customers. Successful claims of infringement by a third party could prevent us from distributing certain products or performing certain services or require us to pay substantial damages (including treble damages if we are found to have willfully infringed patents or copyrights), royalties or other fees. Such claims also could require us to cease making, licensing or using solutions that are alleged to infringe or misappropriate the intellectual property of others, or to expend additional development resources to attempt to redesign our products or services or otherwise to develop non-infringing technology; and to indemnify our partners and other third parties. Even if third parties may offer a license to their technology, the terms of any offered license may not be acceptable and the failure to obtain a license or the costs associated with any license could cause our business, operating results or financial condition to be materially and adversely affected. We typically indemnify our customers and distributors against claims that our products infringe the intellectual property of third parties.
Manufacturing and Suppliers
Our security hardware appliance products are manufactured to our specifications by Caswell, Inc., a Taiwanese original design manufacturer of network appliance hardware products. We have entered into non-exclusive contracts to purchase these hardware appliances from American Portwell Technology, Inc. (a wholly owned subsidiary of Portwell, Inc.), and Dan-el Technologies Ltd., which are value-added distributors of products manufactured by Caswell, Inc. These contracts will remain in effect until terminated by either party. Such contracts are terminable by us for any reason upon six months notice, by the value-added distributors upon nine months notice or by either party for an uncured material breach. We provide the value-added distributors with rolling product demand forecasts, but our contracts contain no obligation for us to purchase any minimum amount of products. We submit purchase orders to these value-added distributors that describe the types and quantities of our products to be manufactured, the delivery dates and other delivery terms. Our value-added distributors receive the hardware appliances from the manufacturer and configure and install our proprietary software on the appliances and then undertake quality testing at their fulfillment centers. Our value-added distributors then ship our appliances directly to our distributors, resellers or customers or our logistic partner, Base Logistics BV. We hold inventory in our value-added distributors’ fulfillment centers and in our logistic partner’s warehouses, in anticipation of orders for new appliances and to support our advance replacement program with new and repaired appliances. In addition, our contracts with these value-added distributors govern their use of our intellectual property and allocate the responsibilities for warranty repair, out of warranty repair and replacement costs with respect to damaged and defective products. We believe that having third parties manufacture, configure and test our products and provide a substantial portion of our logistics enables us to efficiently allocate capital, better adjust manufacturing volumes to meet changes in demand and more quickly deliver products, allowing us to focus resources on our core competencies.
The hardware components included in our products are sourced from various suppliers by our manufacturer and are principally industry standard parts and components that are available from multiple vendors. We have limited sources of supply for certain key components of our products, such as semiconductors, printed circuit boards and hard disk drives, which exposes us to the risk of component shortages or unavailability. For more information on risks related to product manufacturing and availability of components, see the section entitled “Risk Factors–Risks Related to Our Business–Delays or interruptions in the manufacturing and delivery of SecureSphere appliances by our sole source manufacturer may harm our business.”
11
Table of Contents
Competition
The market for data security solutions is intensely competitive and we expect competition to increase in the future. Our primary competitors by product area include:
| • | Database security. International Business Machines Corporation (through its acquisition of Guardium, Inc.), McAfee, Inc., a subsidiary of Intel Corporation (through its recent acquisition of Sentrigo, Inc.) and Oracle Corporation (through its acquisition of Secerno Ltd.) |
| • | File security. EMC Corporation and Symantec Corporation |
| • | Web application security. Citrix Systems, Inc. and F5 Networks, Inc. |
We believe that the principal competitive factors affecting the market for data security solutions include breadth of product offerings, security effectiveness, manageability, reporting, technical features, performance, ease of use, price, professional services capabilities, distribution relationships and customer service and support. We believe that our solutions generally compete favorably with respect to such factors.
Employees
As of December 31, 2011, our total headcount was 383 employees, with 135 in research and development, 146 in sales and marketing, 50 in services and support, 4 in manufacturing operations and 48 in a general and administrative capacity. As of December 31, 2011, our headcount was 154 people in the United States, 183 in Israel and 46 in other countries. None of our employees is represented by a labor union with respect to his or her employment with us. We have not experienced any work stoppages, and we consider our relations with our employees to be good.
Available Information
Our Internet address is www.imperva.com. There we make available, free of charge, our annual reports on Form 10-K, quarterly reports on Form 10-Q, current reports on Form 8-K and any amendments to those reports, as soon as reasonably practicable after we electronically file such material with, or furnish it to, the SEC. Our SEC reports can be accessed through the Investor Relations section of our website. The information found on our website is not part of this or any other report we file with or furnish to the SEC. The SEC also maintains an Internet website that contains reports, proxy and information statements and other information regarding registrants, such as Imperva, that file electronically with the SEC. The address of the website is www.sec.gov. In addition, you may read and copy any filing that we make with the SEC at the public reference room maintained by the SEC, located at 100 F Street, N.E., Washington, D.C. 20549. Please call the SEC at 1-800-SEC-0330 for further information about the public reference room.
Risks Related to Our Business
We have a history of losses, we may not become profitable and our revenue growth may not continue.
We have incurred net losses in each fiscal year since our inception, including net losses attributable to our stockholders of $10.3 million in 2011, $12.0 million in 2010 and $12.3 million in 2009. As a result, we had an accumulated deficit of $66.1 million at December 31, 2011. We may not become profitable in the future if we fail to increase revenue and manage our expenses, or if we incur unanticipated liabilities. Revenue growth may slow or revenue may decline for a number of possible reasons, including slowing demand for our products or services, increasing competition, a decrease in the growth of, or decline in, our overall market, or our failure to capitalize on growth opportunities or introduce new products and services. In addition, we have incurred, and anticipate that we will continue to incur, significant legal, accounting and other expenses relating to being a public company. If our revenues do not increase at a rate to proportionally offset these expected increases in operating expenses, our operating margins will suffer. Any failure by us to achieve and maintain profitability and continue our revenue growth could cause the price of our common stock to materially decline.
Our limited operating history and the rapidly evolving nature of the markets in which we operate may make it difficult for you to evaluate our business.
We were incorporated in 2002, and since that time have been developing products to meet the rapidly evolving demands of customers in the markets in which we operate. We shipped our initial web application security and data security products in 2002, in 2006, we expanded our database security product to include compliance features and in 2010, we launched our file security offering. In addition, in 2010, we launched our cloud-based services with ThreatRadar and, in 2011, we introduced our cloud-based offerings for mid-market enterprises and small to medium-sized businesses (“SMB”) through Incapsula, Inc., our majority-owned subsidiary. This limited operating history, as well as the early stage of our relationships with many of our channel partners, makes financial forecasting and evaluation of our business difficult. Furthermore, because we depend in part on the market’s acceptance of our products it is difficult to evaluate trends that may affect our business. We have a limited operating history, and we operate in a rapidly evolving market, and, as such, any predictions about our future revenue and expenses may not be as accurate as they would be if we had a longer operating history or operated in a more predictable market.
12
Table of Contents
Our quarterly operating results are likely to vary significantly and to be unpredictable, which could cause the trading price of our stock to decline.
Our operating results have historically varied from period to period, and we expect that they will continue to do so as a result of a number of factors, many of which are outside of our control, including:
| • | the level of demand for our products and services, and the timing of orders from our channel partners and end-user customers, who we refer to in this Annual Report on Form 10-K as our customers; |
| • | the timing of shipments of products, which may depend on many factors such as inventory and logistics and our ability to ship new products on schedule and accurately forecast inventory requirements; |
| • | the mix of products sold, the mix of revenue between products and services and the degree to which products and services are bundled and sold together for a package price; |
| • | seasonal buying patterns of our customers; |
| • | the level of perceived threats to data security, which may fluctuate from period to period; |
| • | changes in customer, distributor or reseller requirements or market needs; |
| • | changes in the growth rate of the data security market; |
| • | the timing and success of new product and service introductions by us or our competitors or any other change in the competitive landscape of our industry, including consolidation among our competitors or customers; |
| • | the introduction or adoption of new technologies that compete with our products and services; |
| • | deferral of orders from customers in anticipation of new products or product enhancements announced by us or our competitors; |
| • | decisions by potential customers to purchase data security solutions from larger, more established security vendors or from their primary network equipment vendors; |
| • | the announcement or adoption of new data security compliance regulations or changes to existing compliance regulations; |
| • | price competition; |
| • | insolvency or credit difficulties confronting our customers, affecting their ability to purchase or pay for our products and services; |
| • | insolvency or credit difficulties confronting our key suppliers, which could disrupt our supply chain; |
| • | changes in customer renewal rates for our services; |
| • | general economic conditions, both domestically and in our foreign markets; |
| • | the timing of revenue recognition for our sales, which may be affected by both the mix of sales by our channel partners and the extent to which we bring on new resellers and distributors; |
| • | future accounting pronouncements or changes in our accounting policies; and |
| • | increases or decreases in our expenses caused by fluctuations in foreign currency exchange rates, particularly the Israeli shekel, since a significant portion of our expenses are incurred and paid in the Israeli shekel and other currencies besides the U.S. dollar. |
Any one of the factors above or the cumulative effect of some of the factors referred to above may result in significant fluctuations in our quarterly operating results. This variability and unpredictability could result in our failure to meet our revenue or other operating result expectations or those of securities analysts or investors for a particular period. In addition, a significant percentage of our operating expenses are fixed in nature and based on forecasted revenue trends. Accordingly, in the event of revenue shortfalls, we are generally unable to mitigate the negative impact on margins in the short term. If we fail to meet or exceed expectations for our business for these or any other reasons, the market price of our shares could fall substantially and we could face costly lawsuits, including securities class action suits.
13
Table of Contents
The data security market is rapidly evolving and difficult to predict. If the data security market does not evolve as we anticipate or if customers do not adopt our broad data security solution, our sales will not grow as quickly as anticipated and our stock price could decline.
We are in a new, rapidly evolving category in the security industry that focuses on securing our customers’ high-value business data. As such, it is difficult to predict important market trends, including how large the data security market will be and what products customers will adopt. For example, organizations that use other security products, such as network firewalls, security information and event management (“SIEM”) products or data loss prevention (“DLP”) solutions, may believe that these security solutions sufficiently protect access to sensitive data. Therefore, they may continue spending their IT security budgets on these products and may not adopt our data security solutions in addition to such products.
We offer database, file and web application security in an integrated, modular data security solution. Currently less than 30% of our customers have purchased more than one of our product families. Even if customers purchase our products, they may not make repeat purchases or purchase other elements of our SecureSphere Data Security Suite.
If the market for data security does not evolve in the way we anticipate, if customers do not recognize the benefit our data security solution offers in addition to existing security products, or if we are unable to entice customers to buy products from multiple product families, then our revenue may not grow quickly or may decline, and our stock price could decline.
If we do not successfully anticipate market needs and opportunities and enhance our products and develop new products that meet those needs and opportunities on a timely basis, we may not be able to compete effectively and our ability to generate revenues will suffer.
The data security market is characterized by rapid technological advances, changes in customer requirements, including customer requirements driven by changes to legal, regulatory and self-regulatory compliance mandates, frequent new product introductions and enhancements and evolving industry standards in computer hardware and software technology. As a result, we must continually change and improve our products in response to changes in operating systems, application software, computer and communications hardware, networking software, data center architectures, programming tools and computer language technology. Moreover, the technology in our products is especially complex because it needs to effectively identify and respond to methods of attack and theft, while minimizing the impact on database, file system and web application performance. In addition, our products must successfully interoperate with products from other vendors.
We cannot guarantee that we will be able to anticipate future market needs and opportunities or be able to develop product enhancements or new products to meet such needs or opportunities in a timely manner or at all. Even if we are able to anticipate, develop and commercially introduce enhancements and new products, there can be no assurance that enhancements or new products will achieve widespread market acceptance. For example, while the majority of our current revenues are derived from the sales of our SecureSphere appliances, we are now offering cloud-based data security services through Incapsula. The market for cloud-based data security solutions is relatively new and it is uncertain whether Incapsula’s services will gain market acceptance.
Our product enhancements or new products could fail to attain sufficient market acceptance for many reasons, including:
| • | delays in releasing our enhancements or new products; |
| • | failure to accurately predict market demand in terms of product functionality and to supply products that meet this demand in a timely fashion; |
| • | inability to interoperate effectively with the database technologies, file systems or web applications of our prospective customers; |
| • | inability to protect against new types of attacks or techniques used by hackers or other data thieves; |
| • | defects, errors or failures; |
| • | negative publicity about their performance or effectiveness; |
| • | introduction or anticipated introduction of competing products by our competitors; |
| • | poor business conditions, causing customers to delay IT purchases; |
| • | easing or changing of regulatory requirements related to security; and |
| • | reluctance of customers to purchase products incorporating open source software. |
If we fail to anticipate market requirements or fail to develop and introduce product enhancements or new products to meet those needs in a timely manner, it could cause us to lose customers and such failure could substantially decrease or delay market acceptance and sales of our present and future products, which would significantly harm our business, financial condition and results of operations.
14
Table of Contents
We face intense competition, especially from larger, better-known companies and we may lack sufficient financial or other resources to maintain or improve our competitive position.
The market for data security products is intensely competitive and we expect competition to intensify in the future. Our competitors include companies such as Citrix Systems, Inc., F5 Networks, Inc., International Business Machines Corporation (“IBM”), McAfee, Inc. (a subsidiary of Intel Corporation), Oracle Corporation, Symantec Corporation and other point solution security vendors.
Many of our existing and potential competitors may have substantial competitive advantages such as:
| • | greater name recognition and longer operating histories; |
| • | larger sales and marketing budgets and resources; |
| • | broader distribution networks and more established relationships with distributors and customers; |
| • | access to larger customer bases; |
| • | greater customer support resources; |
| • | greater resources to make acquisitions; |
| • | greater resources to develop and introduce products that compete with our products; |
| • | lower labor and development costs; and |
| • | substantially greater financial, technical and other resources. |
In addition, some of our larger competitors have substantially broader product offerings and leverage their relationships based on other products or incorporate functionality into existing products in a manner that discourages customers from purchasing our products. Customers may elect to accept a bundled product offering from our competitors, even if it has more limited functionality than our product offering, instead of adding the additional appliances required to implement our offering. These larger competitors are also often in a better position to withstand any significant reduction in capital spending, and will therefore not be as susceptible to economic downturns. Also, many of our smaller competitors that specialize in providing protection from a single type of data security threat may deliver these specialized data security products to the market more quickly than we can. Conditions in our markets could change rapidly and significantly as a result of technological advancements or continuing market consolidation.
Our current and potential competitors may also establish cooperative relationships among themselves or with third parties that may further enhance their resources. Current or potential competitors may be acquired by third parties with greater available resources, such as IBM’s acquisition of Guardium, Inc., Oracle’s acquisition of Secerno, Ltd. and McAfee’s acquisition of Sentrigo, Inc. As a result of such acquisitions, our current or potential competitors might be able to adapt more quickly to new technologies and customer needs, devote greater resources to the promotion or sale of their products and services, initiate or withstand substantial price competition, take advantage of other opportunities more readily or develop and expand their product and service offerings more quickly than we do. Larger competitors with more diverse product offerings may reduce the price of products that compete with ours in order to promote the sale of other products or may bundle them with other products, which would lead to increased pricing pressure on our products and could cause the average sales prices for our products to decline. If we are unable to compete effectively for a share of the data security market, our business, financial condition and results of operations could be materially and adversely affected.
New or existing technologies that are perceived to address data security risks or address the risks in different ways could gain wide adoption and supplant our products and services, thereby weakening our sales and our financial results.
The introduction of products and services embodying new technologies could render our existing products and services obsolete or less attractive to customers. Other data security technologies exist or could be developed in the future, and our business could be materially negatively affected if such technologies are widely adopted. We may not be able to successfully anticipate or adapt to changing technology or customer requirements on a timely basis, or at all. If we fail to keep up with technological changes or to convince our customers and potential customers of the value of our solutions even in light of new technologies, our business, financial condition and results of operations could be materially and adversely affected.
If our products fail to protect against malicious attacks and our customers experience security breaches, our reputation and business could be harmed.
Data thieves are increasingly sophisticated, often affiliated with organized crime and operate large scale and complex automated attacks. In addition, their techniques change frequently and generally are not recognized until launched against a target. If we fail to identify and respond to new and increasingly complex methods of attack and to update our products to detect or prevent such threats in time to protect our customers’ high-value business data, our business and reputation will suffer.
15
Table of Contents
In addition, an actual or perceived security breach or theft of the sensitive data of one of our customers, regardless of whether the breach is attributable to the failure of our products or services, could adversely affect the market’s perception of our security products. Despite our best efforts, there is no guarantee that our products will be free of flaws or vulnerabilities, and even if we discover these weaknesses we may not be able to correct them promptly, if at all. Our customers may also misuse our products, which could result in a breach or theft of business data.
False detection of security breaches or false identification of malicious sources could adversely affect our business.
Our data security products may falsely detect threats that do not actually exist. For example, our ThreatRadar product relies on information on attack sources aggregated from third-party data providers who monitor global malicious activity originating from anonymous proxies, specific IP addresses, botnets and phishing sites. If the information from these data providers is inaccurate, the potential for false positives increases. These false positives, while typical in the industry, may impair the perceived reliability of our products and may therefore adversely impact market acceptance of our products. If our products and services restrict access to important databases, files or applications based on falsely identifying users or traffic as an attack or otherwise unauthorized, this could adversely affect customers’ businesses. Any such false identification of users or traffic could result in negative publicity, loss of customers and sales, increased costs to remedy any problem and costly litigation.
Our internal network system and website may be subject to intentional disruption that could adversely impact our reputation and future sales.
Because we are a leading provider of data security products, “hackers” and others may try to access our data or compromise our systems. For example, individuals purportedly associated with Anonymous have made threats against us. Similarly, experienced computer programmers may attempt to penetrate our network security or the security of our website and misappropriate proprietary information and/or cause interruptions of our services. Because the techniques used by such computer programmers to access or sabotage networks change frequently and may not be recognized until launched against a target, we may be unable to anticipate these techniques. The theft and/or unauthorized use or publication of our trade secrets and other confidential business information as a result of such an event could adversely affect our competitive position, reputation, brand and future sales of our products, and could impair our ability to operate our business, including our ability to provide subscription or maintenance and support services to our customers. We could suffer monetary and other losses and reputational harm in the event of such incidents.
Defects in our products or services could harm our reputation and business.
Our products and services are very complex and have contained and may contain undetected defects or errors, especially when first introduced or when new versions are released. Defects in our products may impede or block network traffic or cause our products or services to fail to help secure high-value business data. Defects in our products may lead to product returns and require us to implement design changes or software updates.
Any defects or errors in our products, or the perception of such defects or errors, could result in:
| • | expenditure of significant financial and product development resources in efforts to analyze, correct, eliminate or work around errors or defects; |
| • | loss of existing or potential customers or channel partners; |
| • | delayed or lost revenue; |
| • | delay or failure to attain market acceptance; |
| • | delay in the development or release of new products or services; |
| • | negative publicity, which will harm our reputation; |
| • | warranty claims against us, which could result in an increase in our provision for doubtful accounts; |
| • | an increase in collection cycles for accounts receivable or the expense and risk of litigation; and |
| • | harm to our results of operations. |
Although we have limitation of liability provisions in our standard terms and conditions of sale, they may not fully or effectively protect us from claims as a result of federal, state or local laws or ordinances or unfavorable judicial decisions in the United States or other countries. The sale and support of our products also entail the risk of product liability claims. We maintain insurance to protect against certain claims associated with the use of our products, but our insurance coverage may not adequately cover any claim asserted against us. In addition, even claims that ultimately are unsuccessful could result in our expenditure of funds in litigation and divert management’s time and other resources.
16
Table of Contents
If our products fail to help our customers achieve and maintain compliance with government regulations and industry standards, our business and results of operations could be materially adversely affected.
We generate a substantial portion of our revenues from our products and services because they help organizations achieve and maintain compliance with government regulations and industry standards, and we expect that will continue for the foreseeable future. For example, many of our customers purchase our web application security products to help them comply with the security standards developed and maintained by the Payment Card Industry (“PCI”) Security Standards Council (the “PCI Council”), which apply to companies that process or store credit card information. Industry organizations like the PCI Council may significantly change their security standards with little or no notice, including changes that could make their standards more or less onerous for businesses. Governments may also adopt new laws or regulations, or make changes to existing laws or regulations, that could impact whether our products and services enable our customers to demonstrate, maintain or audit their compliance. If we are unable to adapt our products and services to changing regulatory standards in a timely manner, or if our products fail to expedite our customers’ compliance initiatives, our customers may lose confidence in our products and could switch to products offered by our competitors. In addition, if regulations and standards related to data security are changed in a manner that makes them less onerous, our customers may view government and industry regulatory compliance as less critical to their businesses, and our customers may be less willing to purchase our products and services. In either case, our sales and financial results would suffer.
We rely on third party channel partners to generate a majority, and to fulfill, substantially all of our revenue, and if we fail to expand and manage our distribution channels, our revenues could decline and our growth prospects could suffer.
Historically our channel partners have originated more than 55% of our sales and fulfilled almost 90% of our sales, and we expect that channel sales will represent a substantial portion of our revenues for the foreseeable future. Our ability to expand our distribution channels depends in part on our ability to educate our channel partners about our products and services, which are complex. Our agreements with our channel partners are generally non-exclusive and many of our channel partners have more established relationships with our competitors. If our channel partners choose to place greater emphasis on products and services of their own or those offered by our competitors, our ability to grow our business and sell our products may be adversely affected. If our channel partners do not effectively market and sell our products and services, or if they fail to meet the needs of our customers, then our ability to grow our business and sell our products may be adversely affected. The loss of one or more of our larger channel partners, who may cease marketing our products with limited or no notice, and our possible inability to replace them could adversely affect our sales. Our failure to recruit additional channel partners, or any reduction or delay in their sales of our products and services or conflicts between channel sales and our direct sales and marketing activities could materially and adversely affect our results of operations.
If we are unable to increase market awareness of our company and our products, our revenue may not continue to grow, or may decline.
We have a limited operating history and we believe that we have not yet established sufficient market awareness in the data security market. Market awareness of our capabilities and products is essential to our continued growth and our success in all of our markets, particularly for the large enterprise, service provider and government entities markets. If our marketing programs are not successful in creating market awareness of our company and products, our business, financial condition and results of operations will be adversely affected, and we will not be able to achieve sustained growth.
Reliance on a concentration of shipments at the end of the quarter could cause our revenue to fall below expected levels, resulting in a decline in our stock price.
Historically, we have received a significant majority of a quarter’s sales orders and generated a significant majority of a quarter’s revenue during the last two weeks of the quarter. The fact that so many orders arrive at the end of a quarter means that our revenue may move from one quarter to the next if we cannot fulfill all of the orders and satisfy all of the revenue recognition criteria under our accounting policies before the quarter ends.
This pattern is a result of customer buying habits and the efforts of our sales force and channel partners to meet or exceed quarterly quotas. If expected revenue at the end of any quarter is delayed because anticipated purchase orders fail to materialize, our logistics partners’ fail to ship products on time, we fail to manage our inventory properly, we fail to release new products on schedule, or for any other reason, then our revenue for that quarter could fall below our expectations or those of securities analysts and investors, resulting in a decline in our stock price.
Delays or interruptions in the manufacturing and delivery of SecureSphere appliances by our sole source manufacturer may harm our business.
Our hardware appliances are built by a single manufacturer. Our reliance on a sole manufacturer, particularly a foreign manufacturer, involves several risks, including a potential inability to obtain an adequate supply of appliances and limited control over pricing, quality and timely delivery of products. In addition, replacing this manufacturer may be difficult and could result in an inability or delay in obtaining products.
17
Table of Contents
Our manufacturer’s ability to timely manufacture and ship our appliances in large quantities depends on a variety of factors. The manufacturer relies on a limited number of sources for the supply of functional components, such as semiconductors, printed circuit boards and hard disk drives. Functional component supply shortages or delays could prevent or delay the manufacture and shipment of appliances and, in the event of shortages or delays, we may not be able to procure alternative functional components on similar pricing terms, if at all. In addition, contractual restrictions or claims for infringement of intellectual property rights may restrict our manufacturer’s use of certain components. These restrictions or claims may require our manufacturer to utilize alternative components or obtain additional licenses or technologies, and may impede its ability to manufacture and deliver appliances on a timely or cost-effective basis.
In the event of an interruption from this manufacturer, we may not be able to develop alternate or secondary sources in a timely manner. If we are unable to buy our appliances in quantities sufficient to meet our requirements on a timely basis, we will not be able to deliver products to our channel partners and customers, which would seriously affect present and future sales.
We have operations outside of the United States and a significant portion of our customers and suppliers are located outside of the United States, which subjects us to a number of risks associated with conducting international operations.
We market and sell our products throughout the world and have personnel in many parts of the world. In addition, we have sales offices and research and development facilities outside the United States and we conduct, and expect to continue to conduct, a significant amount of our business with companies that are located outside the United States, particularly in Israel, Asia and Europe. We also source our components for our products from various geographical regions and ship products from a foreign production facility. Therefore, we are subject to risks associated with having international sales and worldwide operations, including:
| • | trade and foreign exchange restrictions; |
| • | foreign currency exchange fluctuations; |
| • | economic or political instability in foreign markets; |
| • | greater difficulty in enforcing contracts, accounts receivable collection and longer collection periods; |
| • | changes in regulatory requirements; |
| • | difficulties and costs of staffing and managing foreign operations; |
| • | the uncertainty and limitation of protection for intellectual property rights in some countries; |
| • | costs of compliance with foreign laws and regulations and the risks and costs of non-compliance with such laws and regulations; |
| • | costs of complying with U.S. laws and regulations for foreign operations, including import and export control laws, tariffs, trade barriers, economic sanctions and other regulatory or contractual limitations on our ability to sell our products in certain foreign markets, and the risks and costs of non-compliance; |
| • | heightened risks of unfair or corrupt business practices in certain geographies and of improper or fraudulent sales arrangements that may impact financial results and result in restatements of, and irregularities in, financial statements; |
| • | the potential for political unrest, acts of terrorism, hostilities or war; |
| • | management communication and integration problems resulting from cultural differences and geographic dispersion; and |
| • | multiple and possibly overlapping tax structures. |
Our product and service sales may be subject to foreign governmental regulations, which vary substantially from country to country and change from time to time. Failure to comply with these regulations could adversely affect our business. Further, in many foreign countries it is common for others to engage in business practices that are prohibited by our internal policies and procedures or U.S. regulations applicable to us. Although we implemented policies and procedures designed to ensure compliance with these laws and policies, there can be no assurance that all of our employees, contractors, channel partners and agents will comply with these laws and policies. Violations of laws or key control policies by our employees, contractors, channel partners or agents could result in delays in revenue recognition, financial reporting misstatements, fines, penalties or the prohibition of the importation or exportation of our products and services and could have a material adverse effect on our business and results of operations.
Our business in countries with a history of corruption and transactions with foreign governments increase the risks associated with our international activities.
As we operate and sell internationally, we are subject to the U.S. Foreign Corrupt Practices Act, or the FCPA, and other laws that prohibit improper payments or offers of payments to foreign governments and their officials and political parties by U.S. and other business entities for the purpose of obtaining or retaining business. We have operations, deal with and make sales to governmental customers in countries known to experience corruption, particularly certain emerging countries in Africa, East Asia, Eastern Europe and the Middle East, and further expansion of our international selling efforts may involve additional regions, including South
18
Table of Contents
America. Our activities in these countries create the risk of unauthorized payments or offers of payments by one of our employees, consultants, sales agents or channel partners that could be in violation of various laws including the FCPA, even though these parties are not always subject to our control. We have implemented safeguards to discourage these practices by our employees, consultants, sales agents and channel partners. However, our existing safeguards and any future improvements may prove to be less than effective, and our employees, consultants, sales agents or channel partners may engage in conduct for which we might be held responsible. Violations of the FCPA may result in severe criminal or civil sanctions, including suspension or debarment from U.S. government contracting, and we may be subject to other liabilities, which could negatively affect our business, operating results and financial condition.
We rely significantly on revenue from services which may decline and, because we recognize revenue from services over the term of the relevant service period, downturns or upturns in sales are not immediately reflected in full in our operating results.
Our services revenue accounted for 39.2% of our total revenue for 2011, 37.7% of our total revenue for 2010 and 34.6% of our total revenue for 2009. Sales of new or renewal services contracts may decline or fluctuate as a result of a number of factors, including customers’ level of satisfaction with our products and services, the prices of our products and services, the prices of products and services offered by our competitors or reductions in our customers’ spending levels. If our sales of new or renewal services contracts decline, our revenue or revenue growth may decline and our business will suffer. In addition, we recognize service revenue ratably over the term of the relevant service period, which is typically one to three years but has been as long as five years. As a result, much of the revenue we report each quarter is the recognition of deferred revenue from services contracts entered into during previous quarters. Consequently, a decline in new or renewal services contracts in any one quarter will not be fully reflected in revenue in that quarter, but will negatively affect our revenue in future quarters. Accordingly, the effect of significant downturns in new or renewed sales of our services would not be reflected in full in our results of operations until future periods.
If we are unable to increase sales to larger customers, our results of operations may suffer.
We continuously seek to increase sales of our products to large enterprises, managed security service providers and government entities. Sales to enterprises, service providers and government entities involve risks that may not be present, or are present to a lesser extent, with sales to small to mid-sized entities. These risks include:
| • | preexisting relationships with larger, entrenched providers of security solutions who have access to key decision makers within the organization and who also have the ability to bundle competing products with a broader product offering; |
| • | increased purchasing power and leverage held by large customers in negotiating contractual arrangements with us; |
| • | more stringent requirements in our support service contracts, including stricter support response times, and increased penalties for any failure to meet support requirements; and |
| • | longer sales cycles and the associated risk that substantial time and resources may be spent on a potential customer who elects not to purchase our products and services. |
In addition, product purchases by enterprises, managed security service providers, cloud hosting providers and government entities are frequently subject to budget constraints, multiple approvals, and unplanned administrative, processing and other delays. Large enterprises, managed security service providers, cloud hosting providers and government entities typically have longer implementation cycles; require greater product functionality and scalability and a broader range of services; demand that vendors take on a larger share of risks; sometimes require acceptance provisions that can lead to a delay in revenue recognition; and expect greater payment flexibility from vendors. All these factors can add risk to doing business with these customers. If our sales expectations for a large customer do not materialize in a particular quarter or at all, then our business, financial condition and results of operations could be materially and adversely affected.
We are exposed to fluctuations in currency exchange rates, which could negatively affect our financial condition and results of operations.
Our functional and reporting currency is the U.S. dollar and we generate a majority of our revenue in U.S. dollars. However, in 2011, we incurred approximately 38% of our expenses outside of the United States in foreign currencies, primarily Israeli shekels, principally with respect to salaries and related personnel expenses associated with our Israeli operations. The exchange rate between the U.S. dollar and foreign currencies has fluctuated substantially in recent years and may continue to fluctuate substantially in the future. We expect that a majority of our revenues will continue to be generated in U.S. dollars for the foreseeable future and that a significant portion of our expenses, including personnel costs, as well as capital and operating expenditures, will continue to be denominated in Israeli shekels. The results of our operations may be adversely affected by foreign exchange fluctuations.
We use forward foreign exchange contracts to hedge or mitigate the effect of changes in foreign exchange rates on our operating expenses denominated in certain foreign currencies. However, we may not be able to purchase derivative instruments that are adequate to insulate ourselves from foreign currency exchange risks. Additionally, our hedging activities may contribute to increased losses as a result of volatility in foreign currency markets.
19
Table of Contents
If our existing and potential customers migrate to hosted, cloud-based data centers that do not deploy our products, our revenues could suffer.
The majority of our current sales are made through a model in which our channel partners sell our data security solutions to large enterprise customers that operate their own data centers and have the ability to choose the data security solutions and configurations to fit their environment. If our large enterprise customers and potential customers choose to outsource the hosting of their data centers to large, multi-tenancy hosting providers like Rackspace Hosting, Inc. and Amazon.com, Inc., they may not be able to choose what data security solutions are deployed in these hosted environments, and our current sales model may not be effective. Although we work with large hosting services providers, like Rackspace Hosting, Inc. and Savvis, Inc., to integrate our data security solutions into their hosting environments so our solutions may be offered to their hosting customers, we cannot guarantee that all such hosting service providers will adopt our solutions, offer them as a choice to their customers or promote our solutions over those of our competitors. Even if these large hosting services providers integrate our data security solutions into their hosting environments and promote our solutions, they may be able to negotiate larger discounts than individual enterprise customers and, consequently, the average selling price of our products may decrease and our revenue would suffer.
Our business and operations have experienced rapid growth, and if we do not appropriately manage any future growth, or are unable to improve our systems and processes, our operating results will be negatively affected.
We have experienced rapid growth over the last several years. We rely heavily on information technology systems to help manage critical functions, such as order processing, revenue recognition, financial forecasts and inventory and supply chain management. To manage any future growth effectively, we must continue to improve and expand our information technology and financial infrastructure, operating and administrative systems and controls, and continue to manage headcount, capital and processes in an efficient manner. We may not be able to successfully implement improvements to these systems and processes in a timely or efficient manner. For instance, over the last several years we have used and relied heavily on Priority, an enterprise resource planning (“ERP”) system, made by Eshibel Technologies Ltd., an Israeli software company. In the third quarter of 2011, we replaced Priority and completed the implementation of NetSuite, an on-demand ERP system. We have a limited operating history using NetSuite and may encounter difficulties using NetSuite to manage critical functions of our business.
In addition, we rely heavily on hosted, Software-as-a-Service (“SaaS”) technologies from third parties in order to operate critical functions of our business, including ERP services from NetSuite and customer relationship management (“CRM”) services from salesforce.com, Inc. If these services become unavailable due to extended outages or interruptions or because they are no longer available on commercially reasonable terms or prices, our expenses could increase, our ability to manage our finances could be interrupted and our processes for managing sales of our products and services and supporting our customers could be impaired until equivalent services, if available, are identified, obtained and integrated; all of which could harm our business.
Also, our systems and processes may not prevent or detect all errors, omissions or fraud. Our failure to improve our systems and processes, or their failure to operate in the intended manner, may result in our inability to manage the growth of our business and to accurately forecast our revenue, expenses and earnings, or to prevent certain losses. Our productivity and the quality of our products and services may also be adversely affected if we do not integrate and train our new employees quickly and effectively. Any future growth would add complexity to our organization and require effective coordination across our organization. Failure to manage any future growth effectively could result in increased costs, harm our results of operations and lead to investors losing confidence in our internal systems and processes, any of which could result in a decline in our stock price.
Assertions by third parties of infringement or other violations by us of their intellectual property rights could result in significant costs and substantially harm our business and operating results.
Patent and other intellectual property disputes are common in the IT security industry. Some companies in the IT security industry, including some of our competitors, own large numbers of patents, copyrights, trademarks and trade secrets, which they may use to assert claims against us. Third parties have asserted and may in the future assert claims of infringement, misappropriation or other violations of intellectual property rights against us. They may also assert such claims against our customers or channel partners whom we typically indemnify against claims that our products infringe, misappropriate or otherwise violate the intellectual property rights of third parties. As the numbers of products and competitors in our market increase and overlaps occur, claims of infringement, misappropriation and other violations of intellectual property rights may increase. Any claim of infringement, misappropriation or other violation of intellectual property rights by a third party, even those without merit, could cause us to incur substantial costs defending against the claim and could distract our management from our business.
The patent portfolios of our most significant competitors are larger than ours. This disparity between our patent portfolio and the patent portfolios of our most significant competitors may increase the risk that they may sue us for patent infringement and may limit our ability to counterclaim for patent infringement or settle through patent cross-licenses. In addition, future assertions of patent rights by third parties, and any resulting litigation, may involve patent holding companies or other adverse patent owners who have no relevant product revenue and against whom our own patents may therefore provide little or no deterrence or protection. We cannot assure you that we are not infringing or otherwise violating any third-party intellectual property rights.
20
Table of Contents
An adverse outcome of a dispute may require us to pay substantial damages including treble damages if we are found to have willfully infringed a third party’s patents or copyrights; cease making, licensing or using solutions that are alleged to infringe or misappropriate the intellectual property of others; expend additional development resources to attempt to redesign our products or services or otherwise to develop non-infringing technology, which may not be successful; enter into potentially unfavorable royalty or license agreements in order to obtain the right to use necessary technologies or intellectual property rights; and indemnify our partners and other third parties. Royalty or licensing agreements, if required or desirable, may be unavailable on terms acceptable to us, or at all, and may require significant royalty payments and other expenditures. In addition, some licenses may be non-exclusive, and therefore our competitors may have access to the same technology licensed to us. Any of these events could seriously harm our business, financial condition and results of operations.
We have in the past been sued for patent infringement, and we expect that we will be sued for patent infringement in the future, regardless of the merits of any such lawsuits. The cost to defend such lawsuits and any adverse result in such lawsuits could have a material adverse effect on our business, financial condition and results of operations.
We rely on the availability of licenses to third-party software and other intellectual property.
Many of our products and services include software or other intellectual property licensed from third parties, and we otherwise use software and other intellectual property licensed from third parties in our business. This exposes us to risks over which we may have little or no control. For example, a licensor may have difficulties keeping up with technological changes or may stop supporting the software or other intellectual property that it licenses to us. Also, it will be necessary in the future to renew licenses, expand the scope of existing licenses or seek new licenses, relating to various aspects of these products and services, or otherwise relating to our business, which may result in increased license fees. There can be no assurance that the necessary licenses will be available on acceptable terms, if at all. In addition, a third party may assert that we or our customers are in breach of the terms of a license, which could, among other things, give such third party the right to terminate a license or seek damages from us, or both. The inability to obtain or maintain certain licenses or other rights or to obtain or maintain such licenses or rights on favorable terms, or the need to engage in litigation regarding these matters, could result in delays in releases of products and services, and could otherwise disrupt our business, until equivalent technology can be identified, licensed or developed, if at all, and integrated into our products and services or otherwise in the conduct of our business. Any of these events could have a material adverse effect on our business, financial condition and results of operations. Moreover, the inclusion in our products and services of software or other intellectual property licensed from third parties on a nonexclusive basis could limit our ability to differentiate our products from those of our competitors.
Our products contain third-party open source software components, and our failure to comply with the terms of the underlying open source software licenses could negatively affect our business.
Certain of our products are distributed with software licensed by its authors or other third parties under “open source” licenses, including the GNU Public License, the GNU Lesser Public License, the BSD License, the Apache License and others. Some of these licenses contain requirements that we make available source code for modifications or derivative works we create based upon the open source software, and that we license these modifications or derivative works under the terms of a particular open source license or other license granting third parties certain rights of further use. If we combine our proprietary software with open source software in a certain manner, we could, under certain of the open source licenses, be required to release the source code of our proprietary software. Open source license terms may be ambiguous and many of the risks associated with usage of open source cannot be eliminated, and could, if not properly addressed, negatively affect our business. In addition to risks related to license requirements, usage of open source software can lead to greater risks than use of third-party commercial software, as open source licensors generally do not provide warranties or controls on origin of the software.
If we were found to have inappropriately used open source software, we may be required to re-engineer our products, to release proprietary source code, to discontinue the sale of our products in the event re-engineering could not be accomplished on a timely basis or to take other remedial action that may divert resources away from our development efforts. Disclosing the source code of our proprietary software could make it easier for hackers and other third parties to discover vulnerabilities in or to defeat the protections of our data security products, which could result in our data security products failing to protect our customers’ business data. Disclosing our proprietary source code also could allow our competitors to create similar products with lower development effort and time and ultimately could result in a loss of product sales for us. Any of these events could have a material adverse effect on our reputation, business, financial condition and results of operations.
Failure to protect our proprietary technology and intellectual property rights could substantially harm our business and operating results.
The success of our business depends on our ability to protect and enforce our trade secrets, trademarks, copyrights, patents and other intellectual property rights. We attempt to protect our intellectual property under patent, trademark, copyright and trade secret laws, and through a combination of confidentiality procedures, contractual provisions and other methods, all of which offer only limited protection.
21
Table of Contents
We had six issued patents in the United States as of December 31, 2011, but this number is relatively small in comparison to our competitors. As of December 31, 2011, we had nine pending U.S. patent applications, and may file additional patent applications in the future. The process of obtaining patent protection is expensive and time-consuming, and we may not be able to prosecute all necessary or desirable patent applications at a reasonable cost or in a timely manner. We may choose not to seek patent protection for certain innovations and may choose not to pursue patent protection in certain jurisdictions. Furthermore, it is possible that our patent applications may not issue as granted patents, that the scope of our issued patents will be insufficient or not have the coverage originally sought, that our issued patents will not provide us with any competitive advantages, and that our patents and other intellectual property rights may be challenged by others or invalidated through administrative process or litigation. In addition, issuance of a patent does not guarantee that we have an absolute right to practice the patented invention. As a result, we may not be able to obtain adequate patent protection or to enforce our issued patents effectively.
In addition to patented technology, we rely on our unpatented proprietary technology and trade secrets. Despite our efforts to protect our proprietary technology and trade secrets, unauthorized parties may attempt to misappropriate, reverse engineer or otherwise obtain and use them. The contractual provisions that we enter into with employees, consultants, partners, vendors and customers may not prevent unauthorized use or disclosure of our proprietary technology or intellectual property rights and may not provide an adequate remedy in the event of unauthorized use or disclosure of our proprietary technology or intellectual property rights. Moreover, policing unauthorized use of our technologies, products and intellectual property is difficult, expensive and time-consuming, particularly in foreign countries where the laws may not be as protective of intellectual property rights as those in the United States and where mechanisms for enforcement of intellectual property rights may be weak. We may be unable to determine the extent of any unauthorized use or infringement of our products, technologies or intellectual property rights.
From time to time, legal action by us may be necessary to enforce our patents and other intellectual property rights, to protect our trade secrets, to determine the validity and scope of the intellectual property rights of others or to defend against claims of infringement or invalidity. Such litigation could result in substantial costs and diversion of resources and could negatively affect our business, financial condition and results of operations. If we are unable to protect our intellectual property rights, we may find ourselves at a competitive disadvantage to others who need not incur the additional expense, time and effort required to create the innovative products that have enabled us to be successful to date.
If we are unable to hire, retain and motivate qualified personnel, our business would suffer.
Our future success depends, in part, on our ability to continue to attract and retain highly skilled personnel. The loss of the services of any of our key personnel, the inability to attract or retain qualified personnel or delays in hiring required personnel, particularly in engineering and sales, may seriously harm our business, financial condition and results of operations. Any of our employees may terminate their employment at any time. Our ability to continue to attract and retain highly skilled personnel will be critical to our future success. Competition for highly skilled personnel is frequently intense, especially in the San Francisco Bay Area and in Tel Aviv, Israel, the locations in which we have a substantial presence and need for highly-skilled personnel. In addition, a large portion of our employee base is substantially vested in significant stock option grants, and the ability to exercise those options and sell their stock in a public market may result in a larger than normal turn-over rate. Also, to the extent we hire personnel from competitors, we may be subject to allegations that they have been improperly solicited or divulged proprietary or other confidential information.
We are dependent on the continued services and performance of our senior management and other key employees, the loss of any of whom could adversely affect our business, financial condition and results of operations.
Our future performance depends on the continued services and continuing contributions of our senior management and other key employees to execute on our business plan, and to identify and pursue new opportunities and product innovations. The loss of services of senior management or other key employees, particularly Shlomo Kramer, one of our founders and our President and Chief Executive Officer; Amichai Shulman, one of our founders and our Chief Technology Officer; and Terrence J. Schmid, our Chief Financial Officer and Treasurer, could significantly delay or prevent the achievement of our development and strategic objectives. The loss of the services of our senior management or other key employees for any reason could adversely affect our business, financial condition and results of operations.
Conditions in Israel may limit our ability to develop and sell our products. This could result in a decrease of our revenues.
Our principal research and development facilities are located in Israel. Since the establishment of the State of Israel in 1948, a number of armed conflicts have taken place between Israel and its neighboring countries, as well as incidents of civil unrest. Political, economic and military conditions in Israel could directly affect our operations. We could be adversely affected by any major hostilities involving Israel, including acts of terrorism or any other hostilities involving or threatening Israel, the interruption or curtailment of trade between Israel and its trading partners, a significant increase in inflation or a significant downturn in the economic or financial condition of Israel. Any on-going or future violence between Israel and the Palestinians, armed conflicts, terrorist activities, tension along the Israeli borders or with other countries in the region, including Iran, or political instability in the region could disrupt international trading activities in Israel and may materially and negatively affect our business and could harm our results of operations.
22
Table of Contents
Certain countries, as well as certain companies and organizations, continue to participate in a boycott of Israeli firms, firms with large Israeli operations and others doing business with Israel and Israeli companies. We are also precluded from marketing our products to certain of these countries due to United States and Israeli regulatory restrictions. In addition, such boycott, restrictive laws, policies or practices may change over time and we cannot predict which countries, as well as whether certain companies and organizations, will be subject thereto. The boycott, restrictive laws, policies or practices directed towards Israel, Israeli businesses or Israeli citizens could, individually or in the aggregate, have a material adverse affect on our business in the future.
Some of our executive officers and employees in Israel are obligated to perform annual military reserve duty in the Israel Defense Forces, depending on their age and position in the armed forces. Furthermore, they may be called to active reserve duty at any time under emergency circumstances for extended periods of time. Our operations could be disrupted by the absence, for a significant period, of one or more of our executive officers or key employees due to military service, and any significant disruption in our operations could harm our business.
Outages, interruptions or delays in hosting services could impair the delivery of our cloud-based security services and harm our business.
The cloud-based security services that we provide through our majority owned subsidiary, Incapsula, are operated from a network of third party facilities that host the software and systems that operate these security services. We currently serve our customers from third-party hosting facilities located in the United States and Europe. We have a limited operating history for our cloud-based security services in these third party hosting facilities. In addition, we operate the infrastructure that supports our ThreatRadar and Security Operations Center (“SOC”) services. Despite precautions taken within our own internal network and at these third party facilities, the occurrence of a natural disaster or an act of terrorism or other unanticipated problems could result in lengthy interruptions in our services.
In addition, any damage to, or failure of, our internal systems or systems at third party hosting facilities could result in outages or interruptions in our cloud-based services. Outages or interruptions in our cloud-based security services may reduce our revenue, cause us to issue credits or pay penalties, cause customers to terminate their subscriptions and adversely affect our renewal rates and our ability to attract new customers. Our business will also be harmed if our customers and potential customers believe our cloud-based security services are unreliable.
Adverse economic conditions or reduced information technology spending may adversely impact our business.
Our business depends on the overall demand for information technology and on the economic health of our current and prospective customers. In addition, the purchase of our products is often discretionary and may involve a significant commitment of capital and other resources. Weak global economic conditions, or a reduction in information technology spending even if economic conditions improve, could adversely impact our business, financial condition and results of operations in a number of ways, including longer sales cycles, lower prices for our products and services, higher default rates among our distributors, reduced unit sales and lower or no growth.
A failure to prevent excess inventories or inventory shortages could result in decreased revenue and gross margins and harm our business.
We purchase products from our manufacturing partner outside of and in advance of reseller or customer orders, which we hold in inventory and resell. There is a risk we may be unable to sell excess products ordered from our manufacturing partner. Inventory levels in excess of customer demand may result in inventory write-downs, and the sale of excess inventory at discounted prices could significantly impair our brand image and have an adverse effect on our financial condition and results of operations. Conversely, if we underestimate demand for our products or if our manufacturing partner fails to supply products we require at the time we need them, we may experience inventory shortages. Inventory shortages might delay shipments to resellers, distributors and customers or cause us to lose sales. These shortages may diminish the loyalty of our channel partners or customers.
The difficulty in forecasting demand also makes it difficult to estimate our future financial condition and results of operations from period to period. A failure to accurately predict the level of demand for our products could adversely affect our net revenues and net income, and we are unlikely to forecast such effects with any certainty in advance.
A portion of our revenue is generated by sales to government entities, which are subject to a number of challenges and risks.
Sales to U.S. and foreign federal, state and local governmental agency customers have accounted for approximately 12% of our bookings in the years ended December 31, 2011 and 2010, and we may in the future increase sales to government entities. Sales into government entities are subject to a number of risks. Selling to government entities can be highly competitive, expensive and time consuming, often requiring significant upfront time and expense without any assurance that we will complete a sale. Government demand and payment for our products and services may be impacted by public sector budgetary cycles and funding authorizations, with funding reductions or delays adversely affecting public sector demand for our products. Most of our sales to government entities have been made indirectly through our channel partners. Government entities may have contractual or other legal rights to terminate contracts with our distributors and resellers for convenience or due to a default, and any such termination may adversely impact our results of operations.
23
Table of Contents
In addition, for purchases by the U.S. federal government, we must comply with laws and regulations relating to the formation, administration and performance of U.S. federal government contracts, which affect how we and our channel partners do business in connection with U.S. federal agencies. These laws and regulations may impose added costs on our business, and failure to comply with these or other applicable regulations and requirements, including non-compliance in the past, could lead to claims for damages from our channel partners, penalties, termination of contracts and suspension or debarment from government contracting for a period of time. Any such damages, penalties, disruption or limitation in our ability to do business with the U.S. federal government may adversely impact our results of operations.
We are subject to governmental export and import controls that could subject us to liability or impair our ability to compete in international markets.
We incorporate encryption technology into our products, and certain of our products are subject to U.S. export controls and may be exported outside the United States only with the required export license through an export license exception or other appropriate government authorizations. If we were to fail to comply with U.S. export control regulations, U.S. Customs regulations, U.S. economic sanctions and other laws, we could be subject to substantial civil and criminal penalties, including fines for our company and incarceration for responsible employees and managers, and the possible loss of export or import privileges. In addition, if our channel partners fail to obtain appropriate import, export or re-export licenses or permits, we may also be adversely affected, through reputational harm and penalties. Complying with export control regulations for a particular sale may be time-consuming and may result in the delay or loss of sales opportunities.
Furthermore, U.S. export control laws and economic sanctions prohibit the shipment of certain products to U.S. embargoed or sanctioned countries, governments and persons. Even though we take precautions to prevent our product from being shipped to U.S. sanctions targets, our products could be shipped to those targets by our channel partners despite such precautions. Any such shipment could have negative consequences including government investigations, penalties and reputational harm. In addition, various countries regulate the import of certain encryption technology, including import permitting and licensing requirements, and have enacted laws that could limit our ability to distribute our products or could limit our customers’ ability to implement our products in those countries. Changes in our products or changes in export and import regulations may create delays in the introduction of our products in international markets, prevent our customers with international operations from deploying our products globally or, in some cases, prevent the export or import of our products to certain countries, governments or persons altogether. Any change in export or import regulations, economic sanctions or related legislation, shift in the enforcement or scope of existing regulations, or change in the countries, governments, persons or technologies targeted by such regulations, could result in decreased use of our products by, or in our decreased ability to export or sell our products to, existing or potential customers with international operations. Any decreased use of our products or limitation on our ability to export or sell our products would likely adversely affect our business, financial condition and results of operations.
If our estimates or judgments relating to our critical accounting policies are based on assumptions that change or prove to be incorrect, our operating results could fall below expectations of securities analysts and investors, resulting in a decline in our stock price.
The preparation of financial statements in conformity with GAAP requires management to make estimates and assumptions that affect the amounts reported in the consolidated financial statements and accompanying notes. We base our estimates on historical experience and on various other assumptions that we believe to be reasonable under the circumstances, as provided in the section entitled “Management’s Discussion and Analysis of Financial Condition and Results of Operations,” the results of which form the basis for making judgments about the carrying values of assets, liabilities equity, revenue and expenses that are not readily apparent from other sources. Our operating results may be adversely affected if our assumptions change or if actual circumstances differ from those in our assumptions, which could cause our operating results to fall below the expectations of securities analysts and investors, resulting in a decline in our stock price. Significant assumptions and estimates used in preparing our consolidated financial statements include those related to revenue recognition, stock-based compensation, long-lived assets and accounting for income taxes.
If we are unable to establish vendor specific objective evidence of fair value for any undelivered element of a software order from a customer, our revenue relating to the entire software order will be deferred and recognized over future periods, which would prevent us from recognizing revenue on a significant portion of our sales in a particular quarter, which could cause our stock price to decline.
In the course of our selling efforts, we typically enter into arrangements that require us to deliver a combination of products and services. We refer to each individual product or service as an “element” of the overall arrangement. These arrangements typically require us to deliver particular elements in a future period. Arrangements that are considered software arrangements, such as when there is no hardware component to the arrangement as is the case when we sell virtual products, follow different, more restrictive accounting requirements than non-software arrangements. As we discuss further in the section entitled “Management’s Discussion and Analysis of Financial Condition and Results of Operations—Critical Accounting Policies and Estimates—Revenue Recognition,”
24
Table of Contents
if we are unable to determine the vendor specific objective evidence of fair value of any undelivered elements in a software arrangement, then we are required by GAAP to defer revenue from the entire software arrangement rather than just the undelivered elements. If we are required to defer revenue from the entire software arrangement for a significant portion of our sales, our revenue for that quarter could fall below our expectations or those of securities analysts and investors, resulting in a decline in our stock price.
If we fail to comply with environmental requirements, our business, financial condition, results of operations and reputation could be adversely affected.
We are subject to various environmental laws and regulations including laws governing the hazardous material content of our products and laws relating to the collection of and recycling of electrical and electronic equipment. Examples of these laws and regulations include the European Union (“EU”) Restrictions of Hazardous Substances Directive (“RoHS”) and the EU Waste Electrical and Electronic Equipment Directive, as well as the implementing legislation of the EU member states. Similar laws and regulations have been passed or may be enacted in other regions, including in the United States, and we are, or may in the future be, subject to these laws and regulations. To date, our expenditures for environmental compliance have not had a material impact on our results of operations or cash flows and, although we cannot predict the future impact of such laws or regulations, they may result in additional costs or require us to change the content of our products or how they are manufactured, which could have a material adverse affect on our business, financial condition and results of operations.
Our success in acquiring and integrating other businesses, products or technologies could impact our financial position.
In order to remain competitive, we may seek to acquire additional businesses, products or technologies. The environment for acquisitions in the markets in which we operate is very competitive and acquisition candidate purchase prices will likely exceed what we would prefer to pay, but may choose to pay in order to make an acquisition. Achieving the anticipated benefits of future acquisitions will depend in part upon whether we can integrate acquired operations, products and technology in a timely and cost-effective manner. The acquisition and integration process is complex, expensive and time consuming, and may cause an interruption of, or loss of momentum in, product development and sales activities and operations of both companies. We may not find suitable acquisition candidates, and acquisitions we complete may be unsuccessful. If we consummate a transaction, we may be unable to integrate and manage acquired products and businesses effectively. If we are unable to effectively execute acquisitions, our business, financial condition and results of operations could be adversely affected.
If our customers are not satisfied with our technical support or professional services, they may choose not to purchase our products and services or to renew maintenance contracts, either of which would adversely impact our business and results of operations.
Our business relies on our customers’ satisfaction with the technical support and professional consulting services we provide to support our products. If we fail to provide technical support services that are responsive, satisfy our customers’ expectations and resolve issues that they encounter with our products and services, then they may elect not to purchase or renew annual maintenance and support contracts and they may choose not to purchase additional products and services from us. Accordingly, our failure to provide satisfactory technical support or professional services could have a material and adverse effect on our business and results of operations.
Changes in our provision for income taxes or adverse outcomes resulting from examination of our income tax returns could adversely affect our results.
We are subject to income taxation in the United States and numerous foreign jurisdictions. Determining our provision for income taxes requires significant management judgment. In addition, our provision for income taxes is subject to volatility and could be adversely affected by many factors, including, among other things, changes to our operating or holding structure, changes in the amounts of earnings in jurisdictions with differing statutory tax rates, changes in the valuation of deferred tax assets and liabilities and changes in tax laws. We are subject to ongoing tax examinations in various jurisdictions. Tax authorities may disagree with our intercompany charges, cross-jurisdictional transfer pricing or other matters and assess additional taxes. While we regularly assess the likely outcomes of these examinations to determine the adequacy of our provision for income taxes, there can be no assurance that the outcomes of such examinations will not have a material impact on our operating results and cash flows.
Significant judgment is required to determine the recognition and measurement attributes prescribed in Accounting Standards Codification (“ASC”) 740-25 (formerly referred to as Financial Interpretation No. 48, “Accounting for Uncertainty in Income Taxes-an interpretation of FASB Statement No. 109”). In addition, ASC 740-25 applies to all income tax positions, including the potential recovery of previously paid taxes, which if settled unfavorably could adversely impact our provision for income taxes or additional paid-in capital. Further, as a result of certain of our ongoing employment and capital investment actions and commitments, our income in certain countries is subject to reduced tax rates and in some cases is wholly exempt from tax. Our failure to meet these commitments could adversely impact our provision for income taxes. In addition, we are subject to the continuous examination of our income tax returns by the U.S. Internal Revenue Service and other tax authorities. We regularly assess the likelihood of adverse outcomes resulting from these examinations to determine the adequacy of our provision for income taxes. There can be no assurance that the outcomes from these continuous examinations will not have an adverse effect on our results of operations.
25
Table of Contents
Our business is subject to the risks of earthquakes, fire, power outages, floods and other catastrophic events, and to interruption by manmade problems such as terrorism.
A significant natural disaster, such as an earthquake, fire or a flood, or a significant power outage could have a material adverse impact on our business, financial condition and results of operations. Our corporate headquarters are located in the San Francisco Bay Area, a region known for seismic activity. In addition, natural disasters could affect our manufacturing vendors or logistics providers’ ability to perform services such as manufacturing products on a timely basis and assisting with shipments on a timely basis. In the event our service providers’ information technology systems or manufacturing or logistics abilities are hindered by any of the events discussed above, shipments could be delayed, resulting in missing financial targets, such as revenue and shipment targets, for a particular quarter. Further, if a natural disaster occurs in a region from which we derive a significant portion of our revenue, customers in that region may delay or forego purchases of our products, which may materially and adversely impact our results of operations for a particular period. In addition, acts of terrorism could cause disruptions in our business or the business of our manufacturer, logistics providers, partners, customers or the economy as a whole. Given our typical concentration of sales at each quarter end, any disruption in the business of our manufacturer, logistics providers, partners or customers that impacts sales at the end of our quarter could have a significant adverse impact on our quarterly results. All of the aforementioned risks may be augmented if the disaster recovery plans for us and our suppliers prove to be inadequate. To the extent that any of the above results in delays or cancellations of customer orders, or the delay in the manufacture, deployment or shipment of our products, our business, financial condition and results of operations would be adversely affected.
Risks Related to Ownership of our Common Stock
Market volatility may affect our stock price and the value of your investment
The trading prices of the securities of technology companies have been highly volatile. The market price of our common stock may fluctuate significantly in response to a number of factors, most of which we cannot predict or control, including:
| • | announcements of new products, services or technologies, commercial relationships, acquisitions or other events by us or our competitors; |
| • | fluctuations in stock market prices and trading volumes of securities of similar companies; |
| • | general market conditions and overall fluctuations in U.S. equity markets; |
| • | variations in our operating results, or the operating results of our competitors; |
| • | changes in our financial guidance or securities analysts’ estimates of our financial performance; |
| • | changes in accounting principles; |
| • | sales of large blocks of our common stock, including sales by our executive officers, directors and significant stockholders; |
| • | additions or departures of any of our key personnel; |
| • | announcements related to litigation; |
| • | changing legal or regulatory developments in the United States and other countries; and |
| • | discussion of us or our stock price by the financial press and in online investor communities. |
In addition, the stock market in general, and the New York Stock Exchange in particular, have experienced substantial price and volume volatility that is often seemingly unrelated to the operating performance of particular companies. These broad market fluctuations may cause the trading price of our common stock to decline. In the past, securities class action litigation has often been brought against a company after a period of volatility in the market price of its common stock. We may become involved in this type of litigation in the future. Any securities litigation claims brought against us could result in substantial expenses and the diversion of our management’s attention from our business.
If we fail to maintain an effective system of disclosure controls and procedures and internal controls, our ability to produce accurate financial statements or comply with applicable regulations could be impaired.
As a public company, we are subject to the reporting requirements of the Exchange Act, the Sarbanes-Oxley Act of 2002 (the “Sarbanes-Oxley Act”), and the rules and regulations of the New York Stock Exchange. We expect that the requirements of these rules and regulations will continue to increase our legal, accounting and financial compliance costs, make some activities more difficult, time-consuming and costly and place strain on our personnel, systems and resources.
The Sarbanes-Oxley Act requires, among other things, that we maintain effective disclosure controls and procedures and internal control over financial reporting. We are continuing to develop and refine our disclosure controls and other procedures that are designed to ensure that information required to be disclosed by us in the reports that we file with the SEC is recorded, processed, summarized and reported within the time periods specified in SEC’s rules and forms. Our current controls and any new controls that we develop may become inadequate because of changes in conditions, and the degree of compliance with the policies or procedures
26
Table of Contents
may deteriorate. Further, weaknesses in our internal controls may be discovered in the future. Any failure to develop or maintain effective controls, or any difficulties encountered in their implementation or improvement, could harm our operating results or cause us to fail to meet our reporting obligations and may result in a restatement of our prior period financial statements. Any failure to implement and maintain effective internal controls also could adversely affect the results of periodic management evaluations and annual auditor attestation reports regarding the effectiveness of our internal control over financial reporting that we will be required to include in our periodic reports filed with the SEC beginning for our fiscal year ending December 31, 2012 under Section 404 of the Sarbanes-Oxley Act. Ineffective disclosure controls and procedures and internal control over financial reporting could also cause investors to lose confidence in our reported financial and other information, which would likely have a negative effect on the trading price of our common stock.
In the event that we are not able to demonstrate compliance with Section 404 of the Sarbanes-Oxley Act in a timely manner, that our internal controls are perceived as inadequate or that we are unable to produce timely or accurate financial statements, investors may lose confidence in our operating results and our stock price could decline.
We also have not yet implemented a complete disaster recovery plan or business continuity plan for our accounting and related information technology systems. Any disaster could therefore materially impair our ability to maintain timely accounting and reporting.
Our failure to raise additional capital or generate the significant capital necessary to expand our operations and invest in new products could reduce our ability to compete and could harm our business.
We expect that our existing cash and cash equivalents will be sufficient to meet our anticipated cash needs for at least the next twelve months. After that, we may need to raise additional funds, and we may not be able to obtain additional debt or equity financing on favorable terms, if at all. If we raise additional equity financing, our stockholders may experience significant dilution of their ownership interests and the per share value of our common stock could decline. Furthermore, if we engage in debt financing, the holders of debt would have priority over the holders of common stock and we may be required to accept terms that restrict our ability to incur additional indebtedness, make capital expenditures and take other actions that would otherwise be in the interests of the stockholders and force us to maintain specified liquidity or other ratios, any of which could harm our business, financial condition and results of operations. Similarly, if we raise additional funds through collaboration, strategic alliance and licensing arrangements with third parties, we may have to relinquish valuable rights to our technologies or grant licenses on terms that are not favorable to us. If we need additional capital and cannot raise it on acceptable terms, we may not be able to, among other things:
| • | develop or enhance our products and services; |
| • | continue to expand our sales and marketing and research and development organizations; |
| • | acquire complementary technologies, products or businesses; |
| • | expand operations, in the United States or internationally; |
| • | hire, train and retain employees; or |
| • | respond to competitive pressures or unanticipated working capital requirements. |
Our failure to do any of these things could seriously harm our business, financial condition and results of operations.
Concentration of ownership among our existing executive officers, directors and their affiliates may delay or prevent new investors from influencing significant corporate decisions.
Our executive officers, directors and 5% or greater stockholders beneficially own, in the aggregate, approximately 67.8% of our outstanding common stock as of March 1, 2012. As a result, such persons, acting together, have the ability to control our management and affairs and substantially all matters submitted to our stockholders for approval, including the election and removal of directors and approval of any significant transaction. These persons will also have the ability to control our management and business affairs. This concentration of ownership may have the effect of delaying, deferring or preventing a change in control, impeding a merger, consolidation, takeover or other business combination involving us, or discouraging a potential acquirer from making a tender offer or otherwise attempting to obtain control of our business, even if such a transaction would benefit other stockholders.
A significant portion of our total outstanding shares may be sold into the market in the near future. If there are substantial sales of shares of our common stock, the price of our common stock could decline.
The price of our common stock could decline if there are substantial sales of our common stock, particularly sales by our directors, executive officers and significant stockholders, or if there is a large number of shares of our common stock available for sale. As of March 1, 2012, we had outstanding 23,021,259 shares of our common stock, 17,269,295 shares, or 75%, of which are currently restricted as a result of market standoff and/or lock-up agreements, but will be able to be sold in the near future as set forth below.
27
Table of Contents
| Date Available for Sale into Public Market |
Number of Shares and % of Total Outstanding | |
| Immediately after the date of this Annual Report on Form 10-K | No shares, or 0% | |
| May 7, 2012, or 181 days after the date of the prospectus relating to our initial public offering of common stock, or IPO, subject to deferral in some circumstances | 17,269,295 shares, or 100%, of which 13,313,592 shares, or 77.1%, will be subject to limitations under Rules 144 and 701 | |
Some holders of shares of our common stock have rights, subject to some conditions, to require us to file registration statements covering their shares or to include their shares in registration statements that we may file for ourselves or our stockholders. All of these shares are subject to market standoff and/or lock-up agreements restricting their sale for 180 days after the date of the prospectus relating to our IPO. We also registered shares of common stock that we have issued and may issue under our employee equity incentive plans, and such shares may be sold freely in the public market upon issuance, subject to existing market standoff and/or lock-up agreements. J.P. Morgan Securities LLC and Deutsche Bank Securities Inc. may, in their sole discretion, permit our officers, directors, employees and current stockholders who are subject to the 180-day contractual lock-up to sell shares prior to the expiration of the lock-up agreements. The 180-day lock-up period is subject to extension in some circumstances.
The market price of the shares of our common stock could decline as a result of sales of a substantial number of our shares in the public market or the perception in the market that the holders of a large number of shares intend to sell their shares.
If securities or industry analysts do not publish research or publish inaccurate or unfavorable research about our business, our stock price and trading volume could decline.
The trading market for our common stock will depend in part on the research and reports that securities or industry analysts publish about us or our business. If we do not establish and maintain adequate research coverage or if one or more of the analysts who covers us downgrades our stock or publishes inaccurate or unfavorable research about our business, our stock price would likely decline. If one or more of these analysts ceases coverage of our company or fails to publish reports on us regularly, demand for our stock could decrease, which could cause our stock price and trading volume to decline.
We do not intend to pay dividends on our common stock so any returns will be limited to the value of our stock.
We have never declared or paid any cash dividend on our common stock. We currently anticipate that we will retain future earnings for the development, operation and expansion of our business and do not anticipate declaring or paying any cash dividends for the foreseeable future. Any return to stockholders will therefore be limited to the value of their stock.
Anti-takeover provisions in our charter documents and under Delaware law could make an acquisition of us, which may be beneficial to our stockholders, more difficult and may prevent attempts by our stockholders to replace or remove our current management.
Provisions in our restated certificate of incorporation and amended and restated bylaws may delay or prevent an acquisition of us or a change in our management. These provisions include:
| • | authorizing “blank check” preferred stock, which could be issued by the board without stockholder approval and may contain voting, liquidation, dividend and other rights superior to our common stock, which would increase the number of outstanding shares and could thwart a takeover attempt; |
| • | a classified board of directors whose members can be dismissed for only cause; |
| • | the prohibition on actions by written consent of our stockholders; |
| • | the limitation on who may call a special meeting of stockholders; |
| • | the establishment of advance notice requirements for nominations for election to our board of directors or for proposing matters that can be acted upon at stockholder meetings; and |
| • | the requirement of at least 75% of the outstanding capital stock to amend any of the foregoing second through fifth provisions. |
In addition, because we are incorporated in Delaware, we are governed by the provisions of the anti-takeover provisions of the Delaware General Corporation Law, which may discourage, delay or prevent a change in control by prohibiting us from engaging in a business combination with an interested stockholder for a period of three years after the person becomes an interested stockholder, even if a change of control would be beneficial to our existing stockholders. Although we believe these provisions collectively
28
Table of Contents
provide for an opportunity to obtain greater value for stockholders by requiring potential acquirers to negotiate with our board of directors, they would apply even if an offer rejected by our board were considered beneficial by some stockholders. In addition, these provisions may frustrate or prevent any attempts by our stockholders to replace or remove our current management by making it more difficult for stockholders to replace members of our board of directors, which is responsible for appointing the members of our management.
Our ability to use our net operating loss carryforwards may be subject to limitation and may result in increased future tax liability to us.
Generally, a change of more than 50% in the ownership of a corporation’s stock, by value, over a three-year period constitutes an ownership change for U.S. federal income tax purposes. An ownership change may limit a company’s ability to use its net operating loss carryforwards attributable to the period prior to such change. We have not performed a detailed analysis to determine whether an ownership change under Section 382 of the Internal Revenue Code has occurred after each of our previous private placements of preferred stock or after the issuance of shares of common stock in connection with our initial public offering. In the event we have undergone an ownership change under Section 382, if we earn net taxable income, our ability to use our pre-change net operating loss carryforwards to offset U.S. federal taxable income may become subject to limitations, which could potentially result in increased future tax liability to us.
Item 1B. Unresolved Staff Comments
Not applicable.
Our corporate headquarters are located in Redwood Shores, California in an office consisting of approximately 26,000 sq. ft. The lease for this office expires in March 2014. Our office in Tel Aviv, Israel, where we employ our research and development team, consists of approximately 5,100 sq. meters (approximately 55,000 sq. ft.) and the lease for this office begins to expire for portions of this office in December 2013. We also lease sales offices in Japan, New York and Singapore. We believe that our facilities are suitable to meet our needs for the foreseeable future; however, we will continue to seek additional space as needed to accommodate our growth.
From time to time, we may be subject to legal proceedings and claims in the ordinary course of business. We do not believe we are currently a party to any currently pending legal proceedings the outcome of which will have a material adverse effect on our operations or financial position. However, we have received, and may in the future continue to receive, claims from third parties asserting, among other things, infringement of their intellectual property rights. In May 2010, F5 Networks, Inc., an IT infrastructure company that competes with us in the web application firewall market, filed a lawsuit against us alleging patent infringement. In June 2010, we filed a counterclaim alleging patent infringement by F5 Networks, Inc. In February 2011, we entered into a settlement and license agreement with F5 Networks, Inc., which dismissed the litigation. Future litigation may be necessary to defend ourselves, our channel partners and our customers by determining the scope, enforceability and validity of third-party proprietary rights or to establish our proprietary rights. Further, the ultimate outcome of any litigation is uncertain and, regardless of outcome, litigation can have an adverse impact on us because of defense costs, potential negative publicity, diversion of management resources and other factors. Accordingly, there can be no assurance that existing or future legal proceedings arising in the ordinary course of business or otherwise will not have a material adverse effect on our business, consolidated financial position, results of operations or cash flows.
Item 4. Mine Safety Disclosures
Not applicable.
PART II
Item 5. Market for Registrant’s Common Equity, Related Stockholder Matters and Issuer Purchases of Equity Securities
Market Information for Common Stock
Our common stock has been listed on the New York Stock Exchange under the symbol “IMPV” since our IPO in November 2011. The following table sets forth, for the periods indicated, the high and low intra-day prices for our common stock as reported on the New York Stock Exchange.
| Fiscal 2011 |
High | Low | ||||||
| Fourth Quarter (commencing November 9, 2011) |
$ | 34.85 | $ | 22.00 | ||||
| Fiscal 2012 |
High | Low | ||||||
| First Quarter (through March 1, 2012) |
$ | 37.89 | $ | 29.78 | ||||
29
Table of Contents
Stockholders
As of March 1, 2012, we had approximately 289 record holders of our common stock.
Stock Price Performance Graph
The following graph shows a comparison from November 9, 2011 (the date our common stock commenced trading on the New York Stock Exchange) through December 31, 2011 of the cumulative total return for an investment of $100 (and the reinvestment of dividends) in our common stock, the NYSE Composite Index and the NYSE Computer and Data Processing Index. Such returns are based on historical results and are not intended to suggest future performance.
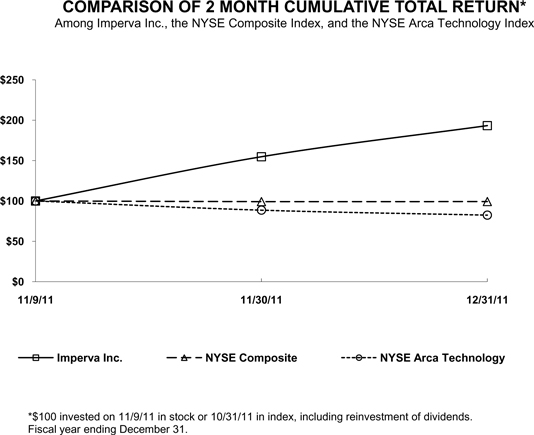
The above information under the heading “Stock Price Performance Graph” shall not be deemed to be “filed” for purposes of Section 18 of the Securities Exchange Act of 1934, as amended, or otherwise subject to the liabilities of that section or Sections 11 and 12(a)(2) of the Securities Act of 1933, as amended, and shall not be incorporated by reference into any registration statement or other document filed by us with the Securities and Exchange Commission, whether made before or after the date of this Annual Report on Form 10-K, regardless of any general incorporation language in such filing, except as shall be expressly set forth by specific reference in such filing.
Dividend Policy
We have never declared or paid cash dividends on our common stock. We currently intend to retain any future earnings and do not expect to pay any dividends in the foreseeable future. Any determination to pay dividends in the future will be at the discretion of our board of directors and will be dependent on a number of factors, including our earnings, capital requirements and overall financial conditions. The loan agreement for our credit facility contains a prohibition on the payment of cash dividends.
30
Table of Contents
Equity Compensation Plan Information
The following table summarizes information about our equity compensation plans as of December 31, 2011. All outstanding awards relate to our common stock.
| Plan Category |
(a) Number of Securities to be Issued Upon Exercise of Outstanding Options, Warrants and Rights |
(b)
Weighted-Average Exercise Price of Outstanding Options, Warrants and Rights |
(c) Number of
Securities Remaining Available for Future Issuance Under Equity Compensation Plans (Excluding Securities Reflected in Column (a)) |
|||||||||
| Equity compensation plans approved by security holders1 |
2,961,005 | $ | 4.35 | 2,386,296 | ||||||||
| Equity compensation plans not approved by security holders2 |
— | — | — | |||||||||
| Total |
2,961,005 | $ | 4.35 | 2,386,296 | ||||||||
| 1 | Prior to our IPO, we issued securities under our 2003 Stock Plan, as amended. Following our IPO, we issued securities under our 2011 Stock Option and Incentive Plan (“2011 Plan”). We have adopted the 2011 Employee Stock Purchase Plan (“ESPP”), but did not issue securities under the ESPP in 2011. |
| 2 | Excludes 606,495 shares issued to Mr. Kramer at a purchase price of $3.30 per share that are subject to a lapsing right of repurchase. See information provided in the third paragraph below regarding the restricted stock grants to Mr. Kramer. |
Under the 2011 Plan, we may issue stock awards, including but not limited to restricted stock awards, restricted stock units, stock bonus awards, stock appreciation rights and performance share awards. The 2011 Plan contains a provision that the number of shares available for grant and issuance will be increased on January 1 of each year from 2012 through 2015 by an amount equal to 4% of our shares outstanding on the immediately preceding December 31, unless our board of directors, in its discretion, determines to make a smaller increase. It is the policy of our board of directors that non-employee directors are granted options to purchase shares of common stock under the 2011 Plan with a Black-Scholes value of $200,000 based on the date of grant upon initial election or appointment to the board. Similarly, on or about the date of the first board meeting following each annual stockholder meeting each non-employee director will automatically be granted options to purchase shares of common stock under the 2011 Plan with a Black-Scholes value of $100,000 based on the date of grant pursuant to that policy. The board may also make discretionary grants to purchase common stock to any non-employee director.
Under the 2011 ESPP, we may grant options for the purchase of our common stock. The 2011 ESPP contains a provision that the number of shares available for grant and issuance will be increased on January 1 of each of 2012 through 2019, by an amount equal to 1% of our shares outstanding on the immediately preceding December 31, unless our board of directors, in its discretion determines to make a smaller increase.
In September 2010, consistent with our practice in prior years, we sold Mr. Kramer shares of our common stock at its then-current fair market value in two separate restricted stock purchase transactions to secure his continued services as our President and Chief Executive Officer and to meet our retention objectives. In the first transaction, our board of directors agreed to sell and issue to Mr. Kramer 632,865 shares of our common stock at a purchase price of $3.30 per share, subject to a right of repurchase in favor of the company that expires periodically over four years. In the second transaction, our board of directors agreed to sell and issue to Mr. Kramer 210,954 shares of our common stock at a purchase price of $3.30 per share, subject to a right of repurchase in favor of the company that expires after five years. The shares of common stock sold in the restricted stock purchase transactions are subject to the Change in Control Plan, which is described in Current Report on Form 8-K filed by us with the SEC on February 9, 2012 and will be described in the Proxy Statement for our 2012 Annual Meeting of Stockholders to be filed with the SEC within 120 days after the end of the fiscal year ended December 31, 2011.
Recent Sales of Unregistered Securities
During the three months ended December 31, 2011, we issued and sold an aggregate of 90,864 shares of our common stock to employees and former employees at a weighted-average exercise price of approximately $1.60 per share pursuant to exercises of options granted under our 2003 Stock Plan. During such period, holders of warrants elected to net exercise warrants to purchase 9,721 shares of Series B preferred stock. The shares of Series B preferred stock issued upon warrant exercise, as with all other outstanding shares of preferred stock, were converted to common stock upon completion of our IPO.
None of the foregoing transactions involved any underwriters, underwriting discounts or commissions, or any public offering. The sales of the above securities were deemed to be exempt from registration under the Securities Act in reliance on Section 4(2) of the Securities Act, Regulation D of the Securities Act, or Rule 701 promulgated under Section 3(b) of the Securities Act, as transactions by an issuer not involving a public offering or transactions pursuant to compensatory benefit plans and contracts relating to compensation as provided under Rule 701. The recipients of securities in each of these transactions represented their intention to acquire the securities for investment only and not with view to or for sale in connection with any distribution thereof and instruments issued in such transactions. All recipients had adequate access, through their relationship with us, to information about us.
31
Table of Contents
Use of Proceeds from Public Offering of Common Stock
The Form S-1 Registration Statement (Registration No. 333-175008) relating to our IPO was declared effective by the SEC on November 8, 2011, and the offering commenced on November 9, 2011. J.P. Morgan Securities LLC and Deutsche Bank Securities Inc. acted as joint book-running managers for the offering, and RBC Capital Markets, LLC, Lazard Capital Markets LLC and Pacific Crest Securities, Inc. acted as co-managers of the offering. The offering has been completed.
The net proceeds to us of our IPO after deducting $6.9 million of underwriters’ discounts and $5.8 million of offering expenses were $86.2 million. Through December 31, 2011, we did not use any of the net proceeds. We expect to use the net proceeds for working capital and general corporate purposes, including acquisitions. Although we may also use a portion of the net proceeds for acquisition of complementary businesses, technologies or other assets, we have no present understandings, commitments or agreements to enter into any acquisitions. In addition, in January 2012, we invested $3.5 million of the net proceeds to us of our IPO in Incapsula, our majority owned subsidiary, and received in exchange an additional 4,375,000 shares of Incapsula’s Series A-1 Preferred Stock.
Our management will retain broad discretion in the allocation and use of the net proceeds of our IPO, and investors will be relying on the judgment of our management regarding the application of the net proceeds. Pending specific utilization of the net proceeds as described above, we have invested the net proceeds of the offering in short-term, interest-bearing obligations. The goal with respect to the investment of the net proceeds will be capital preservation and liquidity so that such funds are readily available to fund our operations.
Purchases of Equity Securities by the Issuer and Affiliated Purchasers
For the fiscal year ended December 31, 2011, we did not repurchase any equity securities.
Item 6. Selected Financial Data
The following selected consolidated financial data should be read in conjunction with “Item 7. Management’s Discussion and Analysis of Financial Condition and Results of Operations” and our consolidated financial statements and related notes included elsewhere in this Annual Report on Form 10-K. The selected financial data in this section is not intended to replace the financial statements and is qualified in its entirety by the consolidated financial statements and related notes thereto included elsewhere in this Annual Report on Form 10-K. Our historical results of operations are not necessarily indicative of results to be expected for any future period.
| Years Ended December 31, | ||||||||||||||||||||
| 2011 | 2010 | 2009 | 2008 | 2007 | ||||||||||||||||
| (dollars in thousands, except per share amounts) | ||||||||||||||||||||
| Consolidated Statement of Operations Data: |
||||||||||||||||||||
| Net revenue: |
||||||||||||||||||||
| Products and license |
$ | 47,600 | $ | 34,479 | $ | 25,727 | $ | 24,298 | $ | 13,995 | ||||||||||
| Services |
30,702 | 20,903 | 13,614 | 7,848 | 3,713 | |||||||||||||||
|
|
|
|
|
|
|
|
|
|
|
|||||||||||
| Total net revenue |
78,302 | 55,382 | 39,341 | 32,146 | 17,708 | |||||||||||||||
| Cost of revenue: |
||||||||||||||||||||
| Products and license |
6,711 | 5,905 | 4,795 | 3,661 | 2,379 | |||||||||||||||
| Services |
9,510 | 6,428 | 4,576 | 3,455 | 1,659 | |||||||||||||||
|
|
|
|
|
|
|
|
|
|
|
|||||||||||
| Total cost of revenue1 |
16,221 | 12,333 | 9,371 | 7,116 | 4,038 | |||||||||||||||
|
|
|
|
|
|
|
|
|
|
|
|||||||||||
| Gross profit |
62,081 | 43,049 | 29,970 | 25,030 | 13,670 | |||||||||||||||
| Operating expenses: |
||||||||||||||||||||
| Research and development1 |
17,598 | 13,214 | 10,538 | 8,591 | 4,899 | |||||||||||||||
| Sales and marketing1 |
42,682 | 34,168 | 26,920 | 20,447 | 14,505 | |||||||||||||||
| General and administrative1 |
11,807 | 7,982 | 4,669 | 3,608 | 1,811 | |||||||||||||||
|
|
|
|
|
|
|
|
|
|
|
|||||||||||
| Total operating expenses |
72,087 | 55,364 | 42,127 | 32,646 | 21,215 | |||||||||||||||
|
|
|
|
|
|
|
|
|
|
|
|||||||||||
| Loss from operations |
(10,006 | ) | (12,315 | ) | (12,157 | ) | (7,616 | ) | (7,545 | ) | ||||||||||
| Other income (expense), net |
(190 | ) | 474 | 178 | 190 | 522 | ||||||||||||||
|
|
|
|
|
|
|
|
|
|
|
|||||||||||
| Loss before provision for income taxes |
(10,196 | ) | (11,841 | ) | (11,979 | ) | (7,426 | ) | (7,023 | ) | ||||||||||
| Provision for income taxes |
662 | 527 | 360 | 229 | 106 | |||||||||||||||
|
|
|
|
|
|
|
|
|
|
|
|||||||||||
| Net loss |
(10,858 | ) | (12,368 | ) | (12,339 | ) | (7,655 | ) | (7,129 | ) | ||||||||||
| Loss attributable to noncontrolling interest |
589 | 355 | 43 | — | — | |||||||||||||||
|
|
|
|
|
|
|
|
|
|
|
|||||||||||
| Net loss attributable to Imperva, Inc. stockholders |
$ | (10,269 | ) | $ | (12,013 | ) | $ | (12,296 | ) | $ | (7,655 | ) | $ | (7,129 | ) | |||||
|
|
|
|
|
|
|
|
|
|
|
|||||||||||
| Net loss per share of common stock attributable to Imperva, Inc. stockholders, basic and diluted2 |
$ | (1.34 | ) | $ | (2.46 | ) | $ | (2.82 | ) | $ | (1.98 | ) | $ | (1.94 | ) | |||||
|
|
|
|
|
|
|
|
|
|
|
|||||||||||
| Shares used in computing net loss per share of common stock, basic and diluted2 |
7,674,554 | 4,884,665 | 4,365,359 | 3,860,033 | 3,678,378 | |||||||||||||||
|
|
|
|
|
|
|
|
|
|
|
|||||||||||
32
Table of Contents
| 1 | Includes stock-based compensation as follows (in thousands): |
| Years Ended December 31, | ||||||||||||||||||||
| 2011 | 2010 | 2009 | 2008 | 2007 | ||||||||||||||||
| Cost of revenue |
$ | 118 | $ | 44 | $ | 37 | $ | 22 | $ | 8 | ||||||||||
| Research and development |
130 | 66 | 57 | 41 | 33 | |||||||||||||||
| Sales and marketing |
412 | 257 | 218 | 163 | 153 | |||||||||||||||
| General and administrative |
1,067 | 273 | 109 | 48 | 25 | |||||||||||||||
|
|
|
|
|
|
|
|
|
|
|
|||||||||||
| Total stock-based compensation |
$ | 1,727 | $ | 640 | $ | 421 | $ | 274 | $ | 219 | ||||||||||
|
|
|
|
|
|
|
|
|
|
|
|||||||||||
| 2 | Please see Note 13 to our audited consolidated financial statements for an explanation of the calculations of our basic and diluted net loss per share of common stock. |
| Years Ended December 31, | ||||||||||||||||||||
| 2011 | 2010 | 2009 | 2008 | 2007 | ||||||||||||||||
| (in thousands) | ||||||||||||||||||||
| Consolidated Balance Sheet Data: |
||||||||||||||||||||
| Cash, cash equivalents and short term investments |
$ | 97,612 | $ | 17,655 | $ | 19,050 | $ | 24,949 | $ | 11,628 | ||||||||||
| Working capital |
88,660 | 6,841 | 11,317 | 22,892 | 10,528 | |||||||||||||||
| Total assets |
133,542 | 40,977 | 37,546 | 38,535 | 20,343 | |||||||||||||||
| Deferred revenue, current and long-term |
32,925 | 21,218 | 13,377 | 8,060 | 5,046 | |||||||||||||||
| Long-term debt, including current portion |
— | — | 600 | — | 38 | |||||||||||||||
| Convertible preferred stock warrant liability |
— | 69 | 55 | 55 | 55 | |||||||||||||||
| Convertible preferred stock |
— | 53,442 | 53,442 | 53,442 | 33,464 | |||||||||||||||
| Noncontrolling interest |
(773 | ) | (351 | ) | (43 | ) | — | — | ||||||||||||
| Total stockholders’ equity (deficit) |
79,568 | (52,419 | ) | (41,528 | ) | (30,072 | ) | (23,027 | ) | |||||||||||
33
Table of Contents
Item 7. MANAGEMENT’S DISCUSSION AND ANALYSIS OF FINANCIAL CONDITION AND RESULTS OF OPERATIONS
The following discussion and analysis should be read in conjunction with our “Selected Consolidated Financial Data” and consolidated financial statements and notes thereto included elsewhere in this Annual Report on Form 10-K. This Annual Report on Form 10-K contains “forward-looking statements” within the meaning of Section 27A of the Securities Act of 1933, as amended (the “Securities Act”), and Section 21E of the Securities Exchange Act of 1934, as amended (the “Exchange Act”). These statements are often identified by the use of words such as “may,” “will,” “expect,” “believe,” “anticipate,” “intend,” “could,” “estimate,” or “continue,” and similar expressions or variations. These statements are based on the beliefs and assumptions of our management based on information currently available to management. Such forward-looking statements are subject to risks, uncertainties and other factors that could cause actual results and the timing of certain events to differ materially from future results expressed or implied by such forward-looking statements. Factors that could cause or contribute to such differences include, but are not limited to, those identified herein, and those discussed in the section titled “Risk Factors,” set forth in Item 1A of this Annual Report on Form 10-K and in our other SEC filings, including our final prospectus dated as of November 8, 2011. You should review these risk factors for a more complete understanding of the risks associated with an investment in our securities. We disclaim any obligation to update any forward-looking statements to reflect events or circumstances after the date of such statements.
Overview
We are a pioneer and leader of a new category of data security solutions focused on providing visibility and control over high-value business data across critical business systems within the data center. Our SecureSphere Data Security Suite is a broad solution designed to prioritize and mitigate risks to high-value business data, protect against hackers and malicious insiders, and address and streamline regulatory compliance. SecureSphere is an integrated, modular suite, which provides database, file and web application security, and secures all business data across various systems in data centers, including traditional on-premise data centers as well as private, public and hybrid cloud computing environments. We also offer cloud-based security services that deliver on-demand and cost effective web application security.
We were founded in 2002 with the vision of protecting high-value business data within the enterprise. Since that time we have been investing in our data security products to meet the rapidly evolving demands of customers. We shipped our initial web application security and data security products in 2002; in 2006, we expanded our database security product to include compliance features; and in 2010, we launched our file security offering. In addition, in 2010, we launched our cloud-based initiatives with ThreatRadar and, in 2011, we introduced our cloud-based offering for mid-market enterprises and small and medium-sized businesses (“SMB”) that we provide through Incapsula, Inc., our majority owned subsidiary.
Our research and development efforts are focused primarily on improving and enhancing our existing data security products and services, as well as developing new products and services and conducting advanced security research. We conduct our research and development activities in Israel, and we believe this provides us with access to some of the best engineering talent in the security industry. As of December 31, 2011, we had 135 employees dedicated to research and development, including our advanced security research group, the Application Defense Center (“ADC”). Our research and development expense was $17.6 million, $13.2 million and $10.5 million for the years ended December 31, 2011, 2010 and 2009, respectively.
We derive our revenue from sales and licenses of our products and sales of our services. Products and license revenue is generated primarily from sales of perpetual software licenses installed on hardware appliances or virtual appliances for our SecureSphere Data Security Suite. Services revenue consists of maintenance and support, professional services and training and subscriptions. A majority of our revenue is derived from customers in the Americas region. In 2011, 61% of our total revenue was generated from the Americas, 24% from Europe, Middle East and Africa (“EMEA”) and 15% from Asia Pacific.
We market and sell our products through a hybrid sales model, which combines a direct touch sales organization and an overlay channel sales team that actively assist our extensive network of channel partners throughout the sales process. We also provide our channel partners with marketing assistance, technical training and support. We primarily sell our products and services through our channel partners, including distributors and resellers, which sell to end-user customers, who we refer to in this Annual Report on Form 10-K as our customers. We have a network of over 550 channel partners worldwide, including both resellers and distributors. In 2011, our channel partners originated over 55%, and fulfilled almost 90%, of our sales. We work with many of the world’s leading security value-added resellers, and our partners include some of the largest hosting companies for cloud-based deployments.
As of December 31, 2011, we had over 1,700 customers in more than 50 countries. In addition, our solutions are used to protect thousands of organizations through cloud-based deployments with our Software-as-a-Service (“SaaS”) customers and our managed security service provider (“MSSP”) and hosting partners. Our customers include top telecommunications companies, commercial banks in the United States, financial data service firms, computer hardware companies and food and drug store companies in the United States, as well as over 150 government agencies around the world and more than 100 Fortune 1000 companies
34
Table of Contents
Our net revenue has increased in each of the last three years, growing from $39.3 million in 2009 to $78.3 million in 2011. We have incurred net losses attributable to our stockholders of $10.3 million, $12.0 million and $12.3 million in 2011, 2010 and 2009, respectively. As of December 31, 2011, we had an accumulated deficit of $66.1 million.
Opportunities, Challenges and Risks
We believe that the growth of our business and our future success are dependent upon many factors, including our ability to maintain our technology leadership, improve our sales and marketing, address the needs of smaller enterprises and compete effectively in the marketplace for data security solutions. While each of these areas presents significant opportunities for us, they also pose important challenges and risks that we must successfully address in order to sustain the growth of our business and improve our results of operations.
Maintain Technology Leadership. As a result of the rise in sophisticated attacks by hackers and malicious insiders, the difficulty in complying with regulations governing business data and the growing complexity of, and open access to, data centers, we believe that enterprises are struggling to provide visibility and control over business data that they need to protect. We believe these challenges are driving the need for a new protection layer positioned closely around business data and systems in the data center. We expect that as enterprises recognize the growing risk to high-value business data and the need to comply with increasing regulatory compliance mandates, their spending will increase on solutions designed to control and protect such data. We believe that traditional security and compliance products do not address the evolving needs of enterprises or do not do so adequately, and that this presents us with a large market opportunity. To capitalize on this opportunity, we have introduced and expect that in the future we will need to continue to introduce innovations to our broad data security solutions. We cannot assure you that our products will achieve widespread market acceptance or that we will properly anticipate future customer needs. Moreover, if our products do not satisfy evolving customer requirements, we will not capture the increase in spending that we expect will result from enterprises seeking to secure business data and systems.
Invest in Sales and Marketing. In order to capitalize on the anticipated increase in spending in the data security market, we will need to continue to invest significant resources to further strengthen our existing relationships with channel partners, extend our global network by adding new channel partners and grow our sales and marketing team. Any investments that we make in our sales and marketing will occur in advance of our experiencing any benefits from such investments, and so it may be difficult for us to determine if we are efficiently allocating our resources in this area. We cannot assure you that the investments that we intend to make to strengthen our sales and marketing efforts will enable us to capitalize on the expected increase in spending in the data security market or result in an increase in revenue or an improvement in our results of operations.
Address Needs of Smaller Enterprises. As market awareness of the benefits of a broad data security solution increases, we believe there is a significant opportunity to provide data security solutions to smaller enterprises as they confront increasing security threats and compliance mandates. To capitalize on this opportunity, we intend to increase our business with mid-market enterprises and SMBs by expanding our cloud-based service offerings and our distribution channel. We have made, and may in the future continue to make, significant investments in our cloud-based security products to address the data security needs of mid-market enterprises and SMBs. If our cloud-based security products, which are relatively new, fail to gain broad acceptance with mid-market enterprises and SMBs, our revenue growth, results of operations and competitive position in our industry could suffer.
Compete Effectively. We operate in an intensely competitive market that has witnessed significant consolidation in recent years with large companies acquiring many of our competitors. We track our success rate in competitive sales opportunities against certain competitors, some of which generate higher revenues and have greater market capitalizations than we do, and many of which are more established or have greater name recognition within our industry. Based upon our internal tracking of the results of such competitive sales opportunities, we believe that we have historically competed favorably against our larger competitors, and that we have a proven track record of successfully competing against such larger competitors. Nonetheless, some of our larger competitors have numerous advantages, including, but not limited to, greater financial resources, broader product offerings and more established relationships with channel partners and customers. If we are unable to compete effectively for a share of the data security market, our business, results of operations and financial condition could be materially and adversely affected.
To date, we have incurred, and continue to incur, losses from operations and net losses. However, we believe that our existing cash, cash equivalents and short-term investments will be sufficient to meet our working capital and capital expenditure needs for at least the next 12 months. Further, we expect that, if we successfully execute our business plan and strategy, our loss from operations and our net losses will continue to decline, and that we will reach profitability. Should we need additional cash in the future, we may utilize existing lines of credit, enter into additional lines of credit or raise funds through the sale of equity securities.
Key Metrics of Our Business
We monitor the key financial metrics discussed below to help us evaluate growth trends, establish budgets, measure the effectiveness of our sales and marketing efforts and assess operational efficiencies.
35
Table of Contents
Net Revenue. We measure our net revenue to assess the acceptance of our products from our customers, our growth in the markets we serve and to help us establish our strategic and operating plans for future periods. We discuss the components of our net revenue in “—Financial Overview— Net Revenue” below.
Gross Margin. We monitor our gross margin to assess the impact on our current and forecasted financial results from any changes to the pricing and mix of products we are selling to our customers.
Loss from Operations. We track our loss from operations to assess how effectively we are planning and monitoring our operations as well as controlling our operational costs, which are primarily driven by headcount.
Cash, Cash Equivalents and Short-term Investments. We evaluate the level of our cash, cash equivalents and short-term investments to ensure we have sufficient liquidity to fund our operations, including the development of future products and product enhancements and the expansion into new sales channels and territories.
Number of Customers. We believe our customer count is a key indicator of our market penetration, the productivity of our sales organization and the value that our products bring to our customer base. We also believe our existing customers represent significant future revenue opportunities for us.
We discuss for the periods presented revenue, gross margin, the components of loss from operations and number of customers further below under “—Segments” and “—Results of Operations”, as applicable, and we discuss our cash and cash equivalents under “—Liquidity and Capital Resources.”
We also believe that deferred revenue and cash flow from operations are key financial metrics for our business. The components of deferred revenue and cash flow from operations, as well as our rationale for monitoring these metrics, are discussed immediately below this table:
| Years Ended (or as
of) December 31, |
||||||||||||
| 2011 | 2010 | 2009 | ||||||||||
| Net revenue |
$ | 78,302 | $ | 55,382 | $ | 39,341 | ||||||
| Gross margin |
79.3 | % | 77.7 | % | 76.2 | % | ||||||
| Loss from operations |
(10,006 | ) | (12,315 | ) | (12,157 | ) | ||||||
| Total deferred revenue |
32,925 | 21,218 | 13,377 | |||||||||
| Cash, cash equivalents and short-term investments |
97,612 | 17,655 | 19,050 | |||||||||
| Net cash used in operations |
(6,537 | ) | (1,049 | ) | (5,511 | ) | ||||||
| Number of customers |
1,740 | 1,309 | 926 | |||||||||
Deferred Revenue
Our deferred revenue consists of amounts that have been invoiced but that have not yet been recognized as revenue. The majority of our deferred revenue balance consists of the unamortized portion of services revenue from maintenance and support contracts. We monitor our deferred revenue balance because it represents a significant portion of revenue to be recognized in future periods. We also assess the increase in our deferred revenue balance plus revenue we recognized in a particular period as a measure of our sales activity for that period. While the change in our deferred revenue and revenue recognized in a given period comprise the majority of our sales activity during that period, they do not constitute the entire sales activity during the period. Our total sales activity also includes sales of products and services for which we have not yet met the criteria to recognize revenue or add such amounts to our deferred revenue balance. Revenue and deferred revenue from these transactions is recognized or recorded in future periods when we have met the required criteria. We discuss for the periods presented deferred revenue further below under “—Results of Operations.”
Net Cash Used in Operations
We monitor cash flow from operations as a measure of our overall business performance. Our cash flow from operations is driven primarily by sales of our products and licenses and, to a lesser extent, from up-front payments from customers under maintenance and support contracts. Our primary uses of cash in operating activities are for personnel-related expenditures, costs of acquiring the hardware used for our appliances, marketing and promotional expenses and costs related to our facilities. Monitoring cash flow from operations enables us to analyze our financial performance without the non-cash effects of certain items such as depreciation and amortization and stock-based compensation expenses, thereby allowing us to better understand and manage the cash needs of our business.
Segments
For financial reporting purposes, we operate as two reportable business segments: (i) Imperva, which is comprised of our financial position and results of operations and those of our wholly-owned subsidiaries; and (ii) Incapsula, which is comprised entirely
36
Table of Contents
of the financial position and results of operations of our majority-owned subsidiary. Our Incapsula segment commenced operations in November 2009 and has not generated any significant revenue since inception. In discussing our results of operations, we have provided a consolidated discussion and analysis of the revenues from our two segments and, where significant, provided a separate discussion and analysis of the operating expenses of our two segments. See Note 12 of “Notes to Consolidated Financial Statements” for a discussion of our financial information by segment.
Financial Overview
Net Revenue
We derive our revenue from sales and licenses of our products and sales of our services. As discussed further in “—Critical Accounting Policies and Estimates—Revenue Recognition” below, revenue is recognized when persuasive evidence of an arrangement exists, delivery has occurred, the price is fixed or determinable and collection is probable.
Our net revenue is comprised of the following:
| • | Products and License Revenue—Product and license revenue is generated from sales of perpetual software licenses installed on hardware appliances or virtual appliances for our SecureSphere Data Security Suite. Our SecureSphere Data Security Suite consists of database security, file security and web application security. We offer multiple hardware appliance versions that accompany our software, each with different throughput capacities. Perpetual software license revenue is generated from sales of our appliances, licenses for additional users and add-on software modules. We also generate a small amount of hardware revenue from sales of spares or replacement appliances, demonstration units and accessories. |
| • | Services Revenue—Services revenue consists of maintenance and support, professional services and training and subscriptions. Maintenance and support revenue is generated from support services that are bundled with appliances and add-on software modules. There are three levels of maintenance and support—Standard, Enhanced and Premium—and these are offered through agreements for one to five-year terms. Maintenance and support includes major and minor when-and-if available software updates; customer care, which includes our designated support engineer program; content updates from our advanced security research group, the ADC, and hardware replacement. Subscription revenue is generated from sales of our cloud-based services. Professional services revenue consists of fees we earn related to implementation and consulting services we provide our customers. Training services revenue consists of fees we earn related to training customers and partners on the use of our products. We expect that the services revenue from maintenance and support contracts will continue to grow along with the increase in the size of our installed base. |
37
Table of Contents
Most of our products and services are sold to customers in the Americas, primarily in the U.S., however, a significant portion of our revenue is generated from international sales. See Note 12 of “Notes to Consolidated Financial Statements” for a discussion of our financial information by geographic region. Our revenue by geographic region is as follows:
| Years Ended December 31, | ||||||||||||
| (dollars in thousands) | ||||||||||||
| 2011 | 2010 | 2009 | ||||||||||
| Americas |
$ | 47,851 | $ | 36,586 | $ | 24,869 | ||||||
| EMEA |
18,464 | 13,492 | 9,929 | |||||||||
| Asia Pacific |
11,987 | 5,304 | 4,543 | |||||||||
|
|
|
|
|
|
|
|||||||
| Total |
$ | 78,302 | $ | 55,382 | $ | 39,341 | ||||||
|
|
|
|
|
|
|
|||||||
Cost of Revenue
Our total cost of revenue is comprised of the following:
| • | Cost of Products and License Revenue—Cost of products and license revenue is comprised primarily of third-party hardware costs and royalty fees. Our cost of products and license revenue also includes personnel costs related to our operations team, shipping costs and write-offs for excess and obsolete inventory. |
| • | Cost of Services Revenue—Cost of services revenue is primarily comprised of personnel costs of our technical support team, our professional consulting services and training teams and our Security Operations Center (“SOC”) team. Cost of services revenue also includes facilities costs, subscription fees and depreciation. We expect that our cost of services revenue will increase in absolute dollars as we increase our headcount. |
Operating Expenses
Our operating expenses consist of research and development, sales and marketing and general and administrative expenses. Personnel costs are the most significant component of our operating expenses and consist of wages, benefits and bonuses and, with regard to the sales and marketing expense, sales commissions. Personnel costs also include stock-based compensation. We expect personnel costs to continue to increase in absolute dollars as we hire new employees to continue to grow our business. While our operating expenses have grown on an absolute basis each year, they have decreased as a percentage of revenue. As a result, our operating margins have improved.
Research and Development
Our research and development is focused on maintaining and improving our existing products and on new product development. A majority of our research and development expenses are comprised of personnel costs and, to a lesser extent, facility costs, hardware prototype costs, laboratory expenses and depreciation. We expense research and development costs as incurred. We expect our research and development expenses to increase in absolute dollars as we continue to enhance our existing products and develop new products and services that address the emerging market for data security and regulatory compliance.
Sales and Marketing
Sales and marketing expense is the largest component of our operating expenses and consists primarily of personnel costs, including commissions and travel expenses. Sales and marketing expenses also include costs related to marketing and promotional activities, third-party referral fees and, to a lesser extent, facilities costs and depreciation. We expect our sales and marketing expenses to increase in absolute dollars as we expand our sales and marketing efforts worldwide.
General and Administrative
General and administrative expense consists primarily of personnel costs as well as professional fees, facilities costs and depreciation. General and administrative personnel costs include our executive, finance, purchasing, order entry, human resources, information technology and legal functions. Our professional fees consist primarily of accounting, external legal, information technology and other consulting costs. We expect that general and administrative expense will increase in absolute dollars to support our growth, as we expect to incur significant additional legal and accounting costs related to compliance with rules and regulations of the Securities and Exchange Commission, including the additional costs of achieving and maintaining compliance with Section 404 of the Sarbanes-Oxley Act of 2002 and compliance with the rules of the New York Stock Exchange, as well as additional insurance, investor relations and other costs associated with being a public company.
38
Table of Contents
Other Income (Expense), net
Other income (expense), net is comprised of the following items:
| • | Interest Income—Interest income consists of interest earned on our cash, cash equivalents and short-term investments. We expect interest income will vary each reporting period depending on our average investment balances during the period and market interest rates. |
| • | Interest Expense—Interest expense consists of interest accrued or paid on debt obligations. |
| • | Foreign Currency Forward Contract Gains (Losses)—Foreign currency forward contract gains and losses pertain to the ineffective portion of derivative instruments that we have entered into primarily to manage our exposure to the variability in expected future expenses resulting from changes in foreign currency exchange rates. We do not use derivative financial instruments for speculative or trading purposes. We expect our foreign currency forward contract gains (losses) to continue to fluctuate in the future due to changes in foreign currency exchange rates. |
| • | Foreign Currency Exchange Gains (Losses)—Foreign currency exchange gains and losses relate to transactions denominated in currencies other than the U.S. Dollar. |
| • | Warrant Liability Gain (Losses)—Our outstanding convertible preferred stock warrants were classified as a liability on our consolidated balance sheets and, as such, were remeasured to fair value at each balance sheet date with the corresponding gain or loss from the adjustment recorded as other income (expense), net. Following the completion of our initial public offering in November 2011, outstanding warrants were automatically converted into warrants to purchase common stock and, upon such conversion, are no longer classified as a liability on our consolidated balance sheet. |
Provision for Income Taxes
We operate in several tax jurisdictions and are subject to taxes in each country or jurisdiction in which we conduct business including the United States and Israel. Earnings from our non-U.S. activities are subject to local country income tax and may be subject to U.S. income tax. To date, we have incurred net losses and have not recorded any U.S. federal or state income tax provisions. Our tax expense to date relates to foreign income taxes, mainly from our Israeli activities.
Results of Operations
The following table is a summary of our consolidated statements of operations in dollars and as a percentage of our total revenue. We have derived the data for the years ended December 31, 2011, 2010 and 2009 from our audited consolidated financial statements included elsewhere in this Annual Report on Form 10-K.
| Years Ended December 31, | ||||||||||||||||||||||||
| 2011 | 2010 | 2009 | ||||||||||||||||||||||
| (dollars in thousands) | ||||||||||||||||||||||||
| Amount | % of Net Revenue |
Amount | % of Net Revenue |
Amount | % of Net Revenue |
|||||||||||||||||||
| Statement of Operations Data: |
||||||||||||||||||||||||
| Net revenue: |
||||||||||||||||||||||||
| Products and license |
$ | 47,600 | 60.8 | $ | 34,479 | 62.3 | $ | 25,727 | 65.4 | |||||||||||||||
|
|
|
|
|
|
|
|
|
|
|
|
|
|||||||||||||
| Services: |
||||||||||||||||||||||||
| Maintenance and support |
24,497 | 31.3 | 18,064 | 32.5 | 11,840 | 30.1 | ||||||||||||||||||
| Professional services and training |
4,730 | 6.0 | 2,465 | 4.5 | 1,763 | 4.5 | ||||||||||||||||||
| Subscriptions |
1,475 | 1.9 | 374 | 0.7 | 11 | 0.0 | ||||||||||||||||||
|
|
|
|
|
|
|
|
|
|
|
|
|
|||||||||||||
| Total services |
30,702 | 39.2 | 20,903 | 37.7 | 13,614 | 34.6 | ||||||||||||||||||
|
|
|
|
|
|
|
|
|
|
|
|
|
|||||||||||||
| Total net revenue |
78,302 | 100.0 | 55,382 | 100.0 | 39,341 | 100.0 | ||||||||||||||||||
|
|
|
|
|
|
|
|
|
|
|
|
|
|||||||||||||
| Cost of revenue: |
||||||||||||||||||||||||
| Products and license |
6,711 | 8.6 | 5,905 | 10.7 | 4,795 | 12.2 | ||||||||||||||||||
| Services |
9,510 | 12.1 | 6,428 | 11.6 | 4,576 | 11.6 | ||||||||||||||||||
|
|
|
|
|
|
|
|
|
|
|
|
|
|||||||||||||
| Total cost of revenue |
16,221 | 20.7 | 12,333 | 22.3 | 9,371 | 23.8 | ||||||||||||||||||
|
|
|
|
|
|
|
|
|
|
|
|
|
|||||||||||||
| Gross profit |
62,081 | 79.3 | 43,049 | 77.7 | 29,970 | 76.2 | ||||||||||||||||||
| Operating expenses: |
||||||||||||||||||||||||
| Research and development |
17,598 | 22.5 | 13,214 | 23.9 | 10,538 | 26.8 | ||||||||||||||||||
| Sales and marketing |
42,682 | 54.5 | 34,168 | 61.7 | 26,920 | 68.4 | ||||||||||||||||||
| General and administrative |
11,807 | 15.1 | 7,982 | 14.4 | 4,669 | 11.9 | ||||||||||||||||||
|
|
|
|
|
|
|
|
|
|
|
|
|
|||||||||||||
| Total operating expenses |
72,087 | 92.1 | 55,364 | 100.0 | 42,127 | 107.1 | ||||||||||||||||||
|
|
|
|
|
|
|
|
|
|
|
|
|
|||||||||||||
| Loss from operations |
(10,006 | ) | (12.8 | ) | (12,315 | ) | (22.3 | ) | (12,157 | ) | (30.9 | ) | ||||||||||||
| Other income (expense), net |
(190 | ) | (0.2 | ) | 474 | 0.8 | 178 | 0.5 | ||||||||||||||||
|
|
|
|
|
|
|
|
|
|
|
|
|
|||||||||||||
| Loss before provision for income taxes |
(10,196 | ) | (13.0 | ) | (11,841 | ) | (21.5 | ) | (11,979 | ) | (30.4 | ) | ||||||||||||
| Provision for income taxes |
662 | 0.8 | 527 | 0.8 | 360 | 0.9 | ||||||||||||||||||
|
|
|
|
|
|
|
|
|
|
|
|
|
|||||||||||||
| Net loss |
(10,858 | ) | (13.8 | ) | (12,368 | ) | (22.3 | ) | (12,339 | ) | (31.3 | ) | ||||||||||||
39
Table of Contents
| Years Ended December 31, | ||||||||||||||||||||||||
| 2011 | 2010 | 2009 | ||||||||||||||||||||||
| (dollars in thousands) | ||||||||||||||||||||||||
| Amount | % of Net Revenue |
Amount | % of Net Revenue |
Amount | % of Net Revenue |
|||||||||||||||||||
| Loss attributable to noncontrolling interest |
$ | 589 | 0.7 | $ | 355 | 0.6 | $ | 43 | 0.1 | |||||||||||||||
|
|
|
|
|
|
|
|
|
|
|
|
|
|||||||||||||
| Net loss attributable to Imperva, Inc. stockholders |
$ | (10,269 | ) | (13.1 | ) | $ | (12,013 | ) | (21.7 | ) | $ | (12,296 | ) | (31.2 | ) | |||||||||
|
|
|
|
|
|
|
|
|
|
|
|
|
|||||||||||||
Comparison of the Years Ended December 31, 2011 and 2010
Net Revenue
| Years Ended December 31, | Change | |||||||||||||||||||||||
| 2011 | 2010 | |||||||||||||||||||||||
| Amount | % of Net Revenue |
Amount | % of Net Revenue |
Amount | % | |||||||||||||||||||
| (dollars in thousands) | ||||||||||||||||||||||||
| Net revenue by type: |
||||||||||||||||||||||||
| Products and license |
$ | 47,600 | 60.8 | $ | 34,479 | 62.3 | $ | 13,121 | 38.1 | |||||||||||||||
|
|
|
|
|
|
|
|
|
|
|
|||||||||||||||
| Services: |
||||||||||||||||||||||||
| Maintenance and support |
24,497 | 31.3 | 18,064 | 32.5 | 6,433 | 35.6 | ||||||||||||||||||
| Professional services and training |
4,730 | 6.0 | 2,465 | 4.5 | 2,265 | 91.9 | ||||||||||||||||||
| Subscriptions |
1,475 | 1.9 | 374 | 0.7 | 1,101 | 294.4 | ||||||||||||||||||
|
|
|
|
|
|
|
|
|
|
|
|||||||||||||||
| Total services |
30,702 | 39.2 | 20,903 | 37.7 | 9,799 | 46.9 | ||||||||||||||||||
|
|
|
|
|
|
|
|
|
|
|
|||||||||||||||
| Total net revenue |
$ | 78,302 | 100.0 | $ | 55,382 | 100.0 | $ | 22,920 | 41.4 | |||||||||||||||
|
|
|
|
|
|
|
|
|
|
|
|||||||||||||||
| Net revenue by geographic region: |
||||||||||||||||||||||||
| Americas |
$ | 47,851 | 61.1 | $ | 36,586 | 66.0 | $ | 11,265 | 30.8 | |||||||||||||||
| EMEA |
18,464 | 23.6 | 13,492 | 24.4 | 4,972 | 36.9 | ||||||||||||||||||
| Asia Pacific |
11,987 | 15.3 | 5,304 | 9.6 | 6,683 | 126.0 | ||||||||||||||||||
|
|
|
|
|
|
|
|
|
|
|
|||||||||||||||
| Total net revenue |
$ | 78,302 | 100.0 | $ | 55,382 | 100.0 | $ | 22,920 | 41.4 | |||||||||||||||
|
|
|
|
|
|
|
|
|
|
|
|||||||||||||||
Our net revenue increased by $22.9 million, or 41.4%, to $78.3 million during the year ended December 31, 2011 from $55.4 million during the year ended December 31, 2010 due to growth in products and license revenue and services revenue. This revenue growth reflects the increasing demand for our product and service offerings consistent with our business plan and expectations for growth. The Americas region contributed the largest portion of this growth with an $11.3 million increase, or approximately a 30.8% change over the same period in 2010. In addition, increases in our sales personnel focused on the Asia Pacific region resulted in an increase in revenue in Asia Pacific of $6.7 million, or approximately a 126.0% change over the same period in 2010.
Products and license revenue increased by $13.1 million, or 38.1%, to $47.6 million during the year ended December 31, 2011 from $34.5 million during the year ended December 31, 2010. The change in product and license revenue was driven by a significant increase in product sales, primarily in the Americas region in the year ended December 31, 2011 compared to the year ended December 31, 2010. This increase was due to increased sales volume of our products.
Services revenue increased by $9.8 million, or 46.9%, to $30.7 million during the year ended December 31, 2011 from $20.9 million during the year ended December 31, 2010. During the year ended December 31, 2011, our services revenue was comprised of $24.5 million in maintenance and support, $4.7 million in professional services and training and $1.5 million in subscriptions. The change in services revenue in the year ended December 31, 2011 from the year ended December 31, 2010 was primarily due to an increase of $6.4 million in maintenance and support revenue resulting from our larger installed base, $2.3 million in professional services and training revenues due primarily to an increase in the number of implementation projects and $1.1 million in subscriptions revenue from our ThreatRadar product, which was launched in the first quarter of 2010.
40
Table of Contents
Gross Profit
| Years Ended December 31, | ||||||||||||||||||||
| 2011 | 2010 | % Change |
||||||||||||||||||
| Amount | Gross Margin |
Amount | Gross Margin |
|||||||||||||||||
| (dollars in thousands) | ||||||||||||||||||||
| Products and license gross profit |
$ | 40,889 | 85.9 | % | $ | 28,574 | 82.9 | % | 3.0 | |||||||||||
| Services gross profit |
21,192 | 69.0 | % | 14,475 | 69.2 | % | (0.2 | ) | ||||||||||||
|
|
|
|
|
|||||||||||||||||
| Total gross profit |
$ | 62,081 | 79.3 | % | $ | 43,049 | 77.7 | % | 1.6 | |||||||||||
|
|
|
|
|
|||||||||||||||||
Total gross margin increased 1.6 percentage points from 77.7% during the year ended December 31, 2010 to 79.3% during the year ended December 31, 2011 primarily due to an increase in products and license gross margin of 3.0 percentage points in the year ended December 31, 2011 compared to the same period in 2010. The change was primarily due to a continued shift in product mix towards higher throughput appliances, which generally have higher gross margins. The 0.2 percentage point decrease in services gross margin was mostly due to higher use of outside contractors, which tend to be more costly than our internal service personnel, in order to support the growth of our services revenue.
Operating Expenses
| Years Ended December 31, | ||||||||||||||||||||||||
| 2011 | 2010 | Change | ||||||||||||||||||||||
| Amount | % of Net Revenue |
Amount | % of Net Revenue |
Amount | % | |||||||||||||||||||
| (dollars in thousands) | ||||||||||||||||||||||||
| Operating expenses: |
||||||||||||||||||||||||
| Research and development |
$ | 17,598 | 22.5 | $ | 13,214 | 23.9 | $ | 4,384 | 33.2 | |||||||||||||||
| Sales and marketing |
42,682 | 54.5 | 34,168 | 61.7 | 8,514 | 24.9 | ||||||||||||||||||
| General and administrative |
11,807 | 15.1 | 7,982 | 14.4 | 3,825 | 47.9 | ||||||||||||||||||
|
|
|
|
|
|
|
|
|
|
|
|||||||||||||||
| Total operating expenses |
$ | 72,087 | 92.1 | $ | 55,364 | 100.0 | $ | 16,723 | 30.2 | |||||||||||||||
|
|
|
|
|
|
|
|
|
|
|
|||||||||||||||
Results above include stock-based compensation expense of:
| Years Ended December 31, |
Change | |||||||||||
| 2011 | 2010 | |||||||||||
| (dollars in thousands) | ||||||||||||
| Research and development |
$ | 130 | $ | 66 | $ | 64 | ||||||
| Sales and marketing |
412 | 257 | 155 | |||||||||
| General and administrative |
1,067 | 273 | 794 | |||||||||
|
|
|
|
|
|
|
|||||||
| $ | 1,609 | $ | 596 | $ | 1,013 | |||||||
|
|
|
|
|
|
|
|||||||
Research and development expenses increased by $4.4 million, or 33.2%, to $17.6 million during the year ended December 31, 2011 from $13.2 million during the year ended December 31, 2010. The change was primarily attributable to an increase of $2.6 million in personnel costs due to additional research and development personnel being hired to support our ongoing product development efforts. The change was also partly due to an increase of $0.7 million in Incapsula costs mainly due to it increasing its headcount during the year ended December 31, 2011. In addition, facility and depreciation expenses increased by $0.9 million.
Sales and marketing expenses increased by $8.5 million, or 24.9%, to $42.7 million during the year ended December 31, 2011 from $34.2 million during the year ended December 31, 2010. The change was due to an increase of $6.2 million in personnel costs due to increased headcount in all regions in an effort to help drive our overall revenue growth, $1.4 million in promotional and other marketing related expenses, $0.3 million in travel expenses, and $0.2 million in Incapsula marketing expenses. In addition, facility and depreciation expenses increased by $0.3 million.
41
Table of Contents
General and administrative expenses increased by $3.8 million, or 47.9%, to $11.8 million during the year ended December 31, 2011 from $8.0 million during the year ended December 31, 2010. The change was primarily due to an increase of $3.3 million in personnel costs, including stock-based compensation, related to increased headcount to support the growth and operations of our business and to support our planned initial public offering, and $0.3 million in increased facility and depreciation expenses.
Loss from Operations
| Years Ended December 31, |
Change | |||||||||||||
| 2011 | 2010 | Amount | % | |||||||||||
| (dollars in thousands) | ||||||||||||||
| $(10,006) | $ | (12,315 | ) | $ | (2,309 | ) | (18.7 | )% | ||||||
Our loss from operations decreased by $2.3 million, or 18.7%, from $12.3 million during the year ended December 31, 2010 to $10.0 million during the year ended December 31, 2011. Our gross profit increased by $19.0 million during the year ended December 31, 2011 due to higher net revenues. This gross profit increase was partially offset by increased sales and marketing costs of $8.5 million to expand our global sales efforts, increased research and development personnel costs of $4.4 million from planned hiring to support our ongoing product development efforts, and an increase of $3.8 million of general and administrative costs primarily related to personnel costs related to the increased global scope and operations of our business. The increase in operating expenses during the year ended December 31, 2011 was consistent with our planned headcount increases to support the increase in scope and global reach of our business.
Other Income (Expense), Net
Other (expense), net, was $(0.2) million during the year ended December 31, 2011 compared to other income, net, of $0.5 million during the year ended December 31, 2010. The change was primarily due to a decrease of $0.3 million in forward foreign exchange contract gains, net, a decrease of $0.1 million in interest income and an increase in convertible preferred stock warrant losses of $0.2 million in the year ended December 31, 2011.
Provision for Income Taxes
| Years Ended December 31, |
Change | |||||||||||||||
| 2011 | 2010 | Amount | % | |||||||||||||
| (dollars in thousands) | ||||||||||||||||
| Provision for income taxes |
$ | 662 | $ | 527 | $ | 135 | 25.6 | |||||||||
| Effective tax rate |
(6.5 | )% | (4.5 | )% | ||||||||||||
The provisions for income taxes for the year ended December 31, 2010 and 2011 are comprised primarily of foreign income taxes. The increase in the provision for income taxes in the year ended December 31, 2011 compared with the year ended December 31, 2010 was primarily attributable to an increase in income in our foreign operations.
Deferred Revenue
| As of December 31, | Change | |||||||||||||||
| 2011 | 2010 | Amount | % | |||||||||||||
| (dollars in thousands) | ||||||||||||||||
| Total deferred revenue |
$ | 32,925 | $ | 21,218 | $ | 11,707 | 55.2 | |||||||||
Deferred revenue increased by $11.7 million, or 55.2%, to $32.9 million as of December 31, 2011 from $21.2 million as of December 31, 2010. The growth in our deferred revenue was primarily attributable to an increase in our installed base of products and licenses worldwide and new sales, as well as renewals, of maintenance and support agreements for our installed base of products and licenses.
42
Table of Contents
Number of Customers
| As of December 31, | Change | |||||||||||||||
| 2011 | 2010 | Amount | % | |||||||||||||
| Number of customers |
1,740 | 1,309 | 431 | 32.9 | ||||||||||||
Our number of customers increased by 431, or 32.9%, to 1,704 as of December 31, 2011 from 1,309 as of December 31, 2010. Our growth in customer count was driven by increasing market acceptance of our products as well as an increase in our global sales organization from 120 people as of December 31, 2010 to 131 as of December 31, 2011. The growth in our sales organization was consistent with our plans to continue expanding our global sales coverage, in particular our channel partner sales and support teams. This increase allowed us to target additional customers across all of our geographies, particularly in the Asia Pacific region.
Comparison of the Years Ended December 31, 2010 and 2009
Net Revenue
| Years Ended December 31, | ||||||||||||||||||||||||
| 2010 | 2009 | Change | ||||||||||||||||||||||
| Amount | % of Net Revenue |
Amount | % of Net Revenue |
Amount | % | |||||||||||||||||||
| (dollars in thousands) | ||||||||||||||||||||||||
| Net revenue by type: |
||||||||||||||||||||||||
| Products and license |
$ | 34,479 | 62.3 | $ | 25,727 | 65.4 | $ | 8,752 | 34.0 | |||||||||||||||
|
|
|
|
|
|
|
|
|
|
|
|||||||||||||||
| Services: |
||||||||||||||||||||||||
| Maintenance and support |
18,064 | 32.5 | 11,840 | 30.1 | 6,224 | 52.6 | ||||||||||||||||||
| Professional services and training |
2,465 | 4.5 | 1,763 | 4.5 | 702 | 39.8 | ||||||||||||||||||
| Subscriptions |
374 | 0.7 | 11 | 0.0 | 363 | * | ||||||||||||||||||
|
|
|
|
|
|
|
|
|
|
|
|||||||||||||||
| Total services |
20,903 | 37.7 | 13,614 | 34.6 | 7,289 | 53.5 | ||||||||||||||||||
|
|
|
|
|
|
|
|
|
|
|
|||||||||||||||
| Total net revenue |
$ | 55,382 | 100.0 | $ | 39,341 | 100.0 | $ | 16,041 | 40.8 | |||||||||||||||
|
|
|
|
|
|
|
|
|
|
|
|||||||||||||||
| Net revenue by geographic region: |
||||||||||||||||||||||||
| Americas |
$ | 36,586 | 66.0 | $ | 24,869 | 63.3 | $ | 11,717 | 47.1 | |||||||||||||||
| EMEA |
13,492 | 24.4 | 9,929 | 25.2 | 3,563 | 35.9 | ||||||||||||||||||
| Asia Pacific |
5,304 | 9.6 | 4,543 | 11.5 | 761 | 16.8 | ||||||||||||||||||
|
|
|
|
|
|
|
|
|
|
|
|||||||||||||||
| Total net revenue |
$ | 55,382 | 100.0 | $ | 39,341 | 100.0 | $ | 16,041 | 40.8 | |||||||||||||||
|
|
|
|
|
|
|
|
|
|
|
|||||||||||||||
| * | Not meaningful |
Our net revenue increased by $16.1 million, or 40.8%, to $55.4 million in 2010 from $39.3 million in 2009 primarily due to growth in products and license revenue and services revenue. This increase reflects the increased demand for our product and service offerings consistent with our business plan and expectations for growth when compared to 2009 net revenues, which were somewhat impacted by challenging economic conditions. The Americas region contributed the largest portion of this growth with an $11.7 million increase, or 47.1% change over 2009, and the EMEA region contributed an increase of $3.6 million, or 35.9% growth over 2009.
Products and license revenue increased by $8.8 million, or 34.0%, to $34.5 million in 2010 from $25.7 million in 2009. The change was primarily due to increased sales volume of our products in the Americas and EMEA regions.
Services revenue increased by $7.3 million, or 53.5%, to $20.9 million in 2010 from $13.6 million in 2009. During 2010, our services revenue was comprised of $18.0 million in maintenance and support, $2.5 million in professional services and training and $0.4 million in subscriptions. The change in services revenue in 2010 compared to 2009 was primarily due to an increase of $6.2 million in maintenance and support revenue resulting from our larger installed base, a $0.7 million increase in professional services and training due to increased demand for our products and a $0.4 million increase in subscriptions revenue from our ThreatRadar service, which launched during the first quarter of 2010, and our SOC service, which launched in late 2009.
43
Table of Contents
Gross Profit
| Years Ended December 31, | ||||||||||||||||||||
| 2010 | 2009 | |||||||||||||||||||
| Amount | Gross Margin |
Amount | Gross Margin |
% Change |
||||||||||||||||
| (dollars in thousands) | ||||||||||||||||||||
| Products and license gross profit |
$ | 28,574 | 82.9 | % | $ | 20,932 | 81.4 | % | 1.5 | |||||||||||
| Services gross profit |
14,475 | 69.2 | % | 9,038 | 66.4 | % | 2.8 | |||||||||||||
|
|
|
|
|
|||||||||||||||||
| Total gross profit |
$ | 43,049 | 77.7 | % | $ | 29,970 | 76.2 | % | 1.5 | |||||||||||
|
|
|
|
|
|||||||||||||||||
The 1.5 percentage point increase in products and license gross margin in 2010 was primarily due to margin improvement on all appliance platforms due to cost improvements in our hardware appliances and a shift in our product mix towards our higher throughput appliances, which generally have higher gross margins. The 2.8 percentage point increase in services gross margin was due to higher utilization of our support teams in addition to the continued maturation of our products, which results in lower support costs.
Operating Expenses
| Years Ended December 31, | ||||||||||||||||||||||||
| 2010 | 2009 | Change | ||||||||||||||||||||||
| Amount | % of Net Revenue |
Amount | % of Net Revenue |
Amount | % | |||||||||||||||||||
| (dollars in thousands) | ||||||||||||||||||||||||
| Operating expenses: |
||||||||||||||||||||||||
| Research and development |
$ | 13,214 | 23.9 | $ | 10,538 | 26.8 | $ | 2,676 | 25.4 | |||||||||||||||
| Sales and marketing |
34,168 | 61.7 | 26,920 | 68.4 | 7,248 | 26.9 | ||||||||||||||||||
| General and administrative |
7,982 | 14.4 | 4,669 | 11.9 | 3,313 | 71.0 | ||||||||||||||||||
|
|
|
|
|
|
|
|
|
|
|
|||||||||||||||
| Total operating expenses |
$ | 55,364 | 100.0 | $ | 42,127 | 107.1 | $ | 13,237 | 31.4 | |||||||||||||||
|
|
|
|
|
|
|
|
|
|
|
|||||||||||||||
Results above include stock-based compensation of:
| Years Ended December 31, |
Change | |||||||||||
| 2010 | 2009 | |||||||||||
| (dollars in thousands) | ||||||||||||
| Research and development |
$ | 66 | $ | 57 | $ | 9 | ||||||
| Sales and marketing |
257 | 218 | 39 | |||||||||
| General and administrative |
273 | 109 | 164 | |||||||||
|
|
|
|
|
|
|
|||||||
| $ | 596 | $ | 384 | $ | 212 | |||||||
|
|
|
|
|
|
|
|||||||
Research and development expenses increased by $2.7 million, or 25.4%, to $13.2 million in 2010 from $10.5 million in 2009. The change was primarily due to an increase of $1.6 million in personnel costs, due primarily to the hiring of additional research and development personnel to support our product development efforts. The change was also partly due to an increase of $0.9 million in research and development costs from Incapsula, which commenced operations in November 2009 and increased hiring throughout 2010.
Sales and marketing expenses increased by $7.3 million, or 26.9%, to $34.2 million in 2010 from $26.9 million in 2009. The change was primarily due to an increase of $5.4 million in personnel costs, including stock-based compensation, primarily related to increased headcount in the Americas region and, to a lesser extent, sales commissions, an increase of $1.1 million in marketing expenses primarily related to marketing promotions and initiatives aimed at promoting our brand and creating market awareness of our technology and our products and an increase of $0.5 million in travel expenses. The change was also partly due to an increase of $0.2 million primarily in Incapsula’s personnel costs.
General and administrative expenses increased by $3.3 million, or 71.0%, to $8.0 million in 2010 from $4.7 million in 2009. The change was primarily related to an increase of $1.8 million in personnel costs, including stock-based compensation, due to increased headcount in our accounting and legal departments, $1.0 million in professional services expense related primarily to patent litigation and $0.3 million in rent and occupancy-related expenses. The change was also partly due to an increase of $0.2 million primarily in Incapsula’s personnel costs.
44
Table of Contents
Loss from Operations
| Years Ended December 31, |
Change | |||||||||||||
| 2010 | 2009 | Amount | % | |||||||||||
| (dollars in thousands) | ||||||||||||||
| $(12,315) | $ | (12,157 | ) | $(158 | ) | (1.3 | )% | |||||||
Our loss from operations increased by $0.2 million, or 1.3%, to $12.3 million in 2010 from $12.1 million in 2009. Our gross profit increased in 2010 by $13.1 million as a result of higher revenue. However, this gross profit increase was more than offset by increased operating expenses of $13.3 million. The higher operating expenses were attributable to sales and marketing spending of $7.3 million primarily related to increased sales headcount in the Americas region, higher research and development costs of $2.7 million as we expanded our product development efforts, including work on our Incapsula product offering which began in November 2009, and increased general and administrative costs of $3.3 million from additional legal and accounting personnel costs, and to a lesser extent, higher outside professional service expenses related primarily to patent litigation. The increase in operating expenses and resulting loss from operations in 2010 was consistent with our planned headcount increases to support the increase in scope and global reach of our business, in addition to the inclusion of Incapsula results for the full year ended December 31, 2010 as compared to only a portion of the year ended December 31, 2009.
Other Income (Expense), Net
Other income (expense), net increased $0.3 million, or 166.3%, to $0.5 million in 2010 primarily due to increased foreign exchange gains of $0.3 million. The gains were primarily due to the weakening of the U.S. dollar against the Israeli shekel.
Provision for Income Taxes
| Years Ended December 31, |
Change | |||||||||||||||
| 2010 | 2009 | Amount | % | |||||||||||||
| (dollars in thousands) | ||||||||||||||||
| Provision for income taxes |
$ | 527 | $ | 360 | $ | 167 | 46.4 | |||||||||
| Effective tax rate |
(4.5 | )% | (3.0 | )% | ||||||||||||
The provision for income taxes in 2010 and 2009 are comprised primarily of foreign income taxes. The increase in the provision for income taxes in 2010 compared with 2009 was primarily attributable to an increase in income in our foreign operations.
Deferred Revenue
| As of December 31, | Change | |||||||||||||||
| 2010 | 2009 | Amount | % | |||||||||||||
| (dollars in thousands) | ||||||||||||||||
| Total deferred revenue |
$ | 21,218 | $ | 13,377 | 7,841 | 58.6 | ||||||||||
Deferred revenue increased by $7.8 million, or 58.6%, to $21.2 million as of December 31, 2010 from $13.4 million as of December 31, 2009. The growth in our deferred revenue was primarily attributable to an increase in our installed base of products and licenses worldwide and new sales, as well as renewals, of maintenance and support agreements for our installed base of products and licenses. The balance of deferred revenue as of December 31, 2010 also included an increase in multi-year maintenance and support agreements, which resulted in the higher non-current deferred revenue balance of $7.5 million as of December 31, 2010 as compared to $2.1 million as of December 31, 2009.
Number of Customers
| As of December 31, | Change | |||||||||||||||
| 2010 | 2009 | Amount | % | |||||||||||||
| Number of customers |
1,309 | 926 | 383 | 41.4 | ||||||||||||
Our number of customers increased by 383, or 41.4%, to 1,309 as of December 31, 2010 from 926 as of December 31, 2009. During this period, we increased our sales organization from 101 employees as of December 31, 2009 to 120 as of December 31, 2010 as part of our strategy to continue to expand our global sales coverage, in particular our channel partner sales and support teams. This allowed us to increase the number of new accounts we could reach across all of our geographies.
45
Table of Contents
Liquidity and Capital Resources
To date, we have satisfied our capital and liquidity needs through sales of our products and services and private placements of convertible preferred stock. We have incurred significant losses as we continue to expand our business. Our cash flow from operating activities will continue to be affected principally by the extent to which our revenue exceeds or does not exceed any increase in spending on personnel to support the growth of our business. Our largest source of operating cash flow is cash collections from our customers.
Capital Resources
As of December 31, 2011, we had $97.6 million of cash, cash equivalents and short-term investments, $3.5 million of which is currently held outside of the United States and not presently available to fund domestic operations and obligations. If we were to repatriate cash held outside of the United States, we could be subject to U.S. income taxes on such amounts, less any previously paid foreign income taxes. Our cash, cash equivalents and short-term investments have increased from $19.1 million as of December 31, 2009 to $97.6 million as of December 31, 2011. This increase is primarily the result of our initial public offering of common stock in November 2011 in which we raised $86.2 million, after deducting underwriters’ discounts and offering expenses. This amount was partially offset by our losses from operations as we continued to fund our investments in growth, including the development of future products and product enhancements, and expanded into new sales channels and geographies. We believe our existing cash, cash equivalents and short-term investments will be sufficient to meet our working capital and capital expenditure needs for at least the next 12 months. Our future capital requirements may vary materially from those currently planned and will depend on many factors, including, among other things, market acceptance of our products, the cost of our research and development activities, the acquisition of other businesses and overall economic conditions.
As of December 31, 2011, we had no amounts outstanding under our credit facility agreement with a financial institution. The credit facility agreement, as amended, provides for borrowing capacity up to $6.0 million and contains a minimum cash and cash equivalents balance covenant of $3.0 million. The credit facility expires on October 15, 2012. As of December 31, 2011, we were compliant with the covenant of the credit facility.
Cash Flows
The following summary of our cash flows for the periods indicated has been derived from our consolidated financial statements which are included elsewhere in this Annual Report on Form 10-K:
| 2011 | 2010 | 2009 | ||||||||||
| (dollars in thousands) | ||||||||||||
| Net cash used in operating activities |
$ | (6,537 | ) | $ | (1,049 | ) | $ | (5,511 | ) | |||
| Net cash provided by (used in) investing activities |
(1,642 | ) | (4,573 | ) | (1,942 | ) | ||||||
| Net cash provided by financing activities |
87,856 | 3,274 | 831 | |||||||||
Our cash, cash equivalents and short-term investments have increased from $19.1 million as of December 31, 2009 to $97.6 million as of December 31, 2011. This increase is the result of our initial public offering of common stock in November 2011 in which we raised $86.2 million, net of underwriters’ discounts and offering expenses. This amount was partially offset by our losses from operations as we funded our operations, including the development of future products and product enhancements, and expanded into new sales channels and geographies.
Cash Flows from Operating Activities
We have historically experienced negative cash flow from operations as we continue to expand our business. Our largest uses of cash from operating activities are for employee related expenditures. Our primary source of cash flow from operating activities is cash receipts from customers. Our cash flow from operations will continue to be affected principally by the extent to which we grow our revenues and increase our headcount, primarily in our sales and marketing and research and development functions, in order to grow our business.
Net cash used in operating activities of $6.5 million for the year ended December 31, 2011 reflected a net loss of $10.9 million, partially offset by non-cash charges of $3.5 million, as well as a net change of $0.8 million in our net operating assets and liabilities. The net change in our operating assets and liabilities was the result of an increase in accounts receivable of $12.6 million partially offset by an $11.7 million increase in our deferred revenue, which represents unearned amounts billed to our customers, resulting from our larger installed base combined with strong maintenance and support renewal rates from our existing customers.
46
Table of Contents
Net cash used in operating activities of $1.0 million for 2010 reflected a net loss of $12.4 million, partially offset by a net change of $9.5 million in our net operating assets and liabilities and aggregate non-cash charges of $1.8 million. The net change in our operating assets and liabilities was primarily a result of an $7.8 million increase in our deferred revenue, a $1.5 million increase in accrued compensation and benefits, a $2.0 million increase in accrued and other current liabilities, partially offset by an increase in accounts receivable of $0.7 million, an increase in prepaid expenses and other current assets of $0.7 million, and a decrease in accounts payable of $0.6 million. Non-cash charges included $1.2 million of depreciation and amortization and $0.6 million of stock-based compensation.
Net cash used in operating activities of $5.5 million for 2009 reflected a net loss of $12.3 million, partially offset by a net change of $5.7 million in our net operating assets and liabilities and aggregate non-cash charges of $1.1 million. The net change in our operating assets and liabilities was primarily a result of a $5.3 million increase in our deferred revenue. Non-cash charges included $0.7 million of depreciation and amortization and $0.4 million of stock-based compensation.
Cash Flows from Investing Activities
Our investing activities consist primarily of capital expenditures to purchase property and equipment and purchases and sales of investments. During the year ended December 31, 2011, cash used in investing activities was $1.6 million, primarily as a result of $1.5 million in capital expenditures.
In 2010, cash used in investing activities of $4.6 million was primarily attributable to $2.9 million in capital expenditures, a $0.9 million increase in restricted cash relating to our purchase commitments and $0.8 million in net purchases of short-term investments.
In 2009, cash used in investing activities of $1.9 million was primarily attributable to $1.3 million in capital expenditures and $0.5 million in net purchases of short-term investments.
Cash Flows from Financing Activities
Net cash provided by financing activities was $87.9 million for the year ended December 31, 2011 which primarily resulted from the $86.2 million of net proceeds of our November 2011 initial public offering of common stock, after deducting underwriters’ discounts and offering expenses, issuance of shares of restricted common stock of $1.0 million, proceeds from the exercise of stock options of $0.7 million and proceeds from the sale of common stock of $0.5 million. These amounts were partially offset by net repayments on our revolving credit facility of $0.5 million.
In 2010, cash provided by financing activities was $3.3 million, which consisted of $2.8 million in proceeds from the issuance of restricted stock, $0.6 million in proceeds from the exercise of stock options, and $0.5 million in borrowings on our revolving credit facility, partially offset by $0.6 million in repayments on the convertible promissory note that Incapsula entered into in November 2009 with our Chief Executive Officer.
In 2009, cash provided by financing activities was $0.8 million due primarily to the $0.6 million in proceeds we received from the convertible promissory note Incapsula entered into in November 2009 with our Chief Executive Officer, as well as $0.2 million in proceeds from the exercise of stock options.
For a description of our issuance of restricted stock and transactions with Incapsula, see “Certain Relationships and Related Person Transactions.”
Critical Accounting Policies and Estimates
Our consolidated financial statements have been prepared in conformity with U.S. generally accepted accounting principles (“GAAP”) and include our accounts and the accounts of our wholly-owned subsidiaries and Incapsula, our majority owned subsidiary. The preparation of our consolidated financial statements requires our management to make estimates, assumptions and judgments that affect the reported amounts of assets and liabilities and disclosure of contingent assets and liabilities at the date of the financial statements, and the reported amounts of revenue and expenses during the applicable periods. Management bases its estimates, assumptions and judgments on historical experience and on various other factors that they believe to be reasonable under the circumstances. Different assumptions and judgments would change the estimates used in the preparation of our consolidated financial statements, which, in turn, could change the results from those reported. Our management evaluates its estimates, assumptions and judgments on an ongoing basis.
The critical accounting policies requiring estimates, assumptions, and judgments that we believe have the most significant impact on our consolidated financial statements are described below.
47
Table of Contents
Revenue Recognition
Our management must make significant judgments and estimates to determine revenue to be recognized in any accounting period. Material differences may result in the amount and timing of our revenue for any period if our management makes different judgments or utilizes different estimates.
We derive revenue from two sources: (i) products and license revenue, which includes hardware and perpetual software license revenue and (ii) services revenue, which includes maintenance, professional services, training and subscription arrangements. Substantially all of product and license sales have been sold in combination with maintenance services. Revenue is recognized when all of the following criteria are met: persuasive evidence of an arrangement exists; delivery or performance has occurred; the sales price is fixed or determinable; and collection is reasonably assured.
We define each of the four criteria above as follows:
| • | Persuasive evidence of an arrangement exists. Evidence of an arrangement consists of a purchase order issued pursuant to the terms and conditions of a distributor or value-added reseller agreement and, in limited cases, an end user agreement and/or purchase order. |
| • | Delivery or performance has occurred. We use shipping and related documents, or written evidence of customer acceptance, when applicable, to verify delivery or performance. We recognize product revenue upon transfer of title and risk of loss, which primarily is upon shipment to value-added resellers, distributors or end users. We do not have significant obligations for future performance, such as customer acceptance provisions, rights of return or pricing credits, associated with our sales. |
| • | The sales price is fixed or determinable. We assess whether the sales price is fixed or determinable based on payment terms and whether the sales price is subject to refund or adjustment. Standard payment terms to customers range from 30 to 90 days. In the event payment terms are provided that differ from our standard business practices, the fees are deemed to not be fixed or determinable and revenue is recognized when the payments become due, provided the remaining criteria for revenue recognition have been met. |
| • | Collection is reasonably assured. We assess probability of collection on a customer-by-customer basis. Our customers are subjected to a credit review process that evaluates their financial condition and ability to pay for products and services. If we conclude that collection is not reasonably assured based upon an initial review, we do not recognize revenue until payment is received. |
Maintenance and subscription revenue includes arrangements for software maintenance and technical support for our products and subscription services revenue primarily related to our cloud-based services. The terms of our subscription service arrangements do not provide customers the right to take possession of the related software. Maintenance is offered under renewable, fee-based contracts, which include technical support, hardware repair and replacement parts, bug fixes, patches and unspecified upgrades on a when-and-if-available basis. Maintenance and subscription revenue is initially deferred and recognized ratably over the life of the contract, with the related expenses recognized as incurred. Maintenance and subscription contracts usually have a term of one to three years. Unearned maintenance and subscription revenue is included in deferred revenue.
Professional service revenue primarily consists of the fees we earn related to installation and consulting services. We recognize revenue from professional services upon delivery or completion of performance. Professional service arrangements are typically short term in nature and are largely completed within 90 days from the start of service.
Training services are recognized upon delivery of the training.
Multiple Element Arrangements
In October 2009, the Financial Accounting Standards Board (“FASB”) amended the accounting standards for revenue recognition to remove from the scope of industry-specific software revenue recognition guidance any tangible products containing software components and non-software components that operate together to deliver the product’s essential functionality. In addition, the FASB amended the accounting standards for multiple element revenue arrangements not within the scope of industry-specific software revenue recognition guidance to:
| • | Provide updated guidance on whether multiple elements exist, how the elements in an arrangement should be separated, and how the arrangement consideration should be allocated to the separate elements; |
| • | Implement a price hierarchy, where the selling price for an element is based on vendor-specific objective evidence (“VSOE”), if available; third-party evidence (“TPE”), if available and VSOE is not available; or the best estimate of selling price (“BESP”), if neither VSOE or TPE is available; and |
| • | Eliminate the use of the residual method and require an entity to allocate arrangement consideration using the relative selling price method. |
48
Table of Contents
We adopted this accounting guidance at the beginning of the first quarter of 2010 on a prospective basis for applicable transactions originating or materially modified after December 31, 2009. As a result of the adoption, net revenue for the year ended December 31, 2010, was approximately $1.5 million higher than the net revenue that would have been recorded under the previous accounting rules. Net loss and net loss per share of common stock for the year ended December 31, 2010, were approximately $1.3 million and $0.28 lower than the net loss and net loss per share of common stock that would have been recorded under the previous accounting rules.
This guidance does not change the units of accounting for our revenue transactions. Our non-software products and services qualify as separate units of accounting because they have value to the customer on a stand-alone basis and our revenue arrangements do not include a general right of return for delivered products. Most of our products are hardware appliances containing software components that function together to provide the essential functionality of the product. Therefore, our hardware appliances are considered non-software deliverables and have been removed from the industry-specific software revenue recognition guidance.
Our product revenue also includes revenue from the sale of stand-alone software products. Stand-alone software may operate on our hardware appliance, but is not considered essential to the functionality of the hardware and continues to be subject to the industry-specific software revenue recognition guidance, which remains unchanged.
Certain of our stand-alone software when sold with hardware appliances is considered essential to the functionality and as a result is no longer accounted for under industry-specific software revenue recognition guidance; however, this same software when sold separately is accounted for under the industry-specific software revenue recognition guidance. Additionally, we provide unspecified software upgrades for our products, on a when-and-if available basis, through maintenance and support contracts. To the extent that the software being supported is not considered essential to the functionality of the hardware, these support arrangements would continue to be subject to the industry specific software revenue recognition guidance.
For stand-alone software sales after December 31, 2009 and for all transactions entered into prior to January 1, 2010, we recognize revenue based on software revenue recognition guidance. Under the software revenue recognition guidance, we use the residual method to recognize revenue when a product agreement includes one or more elements to be delivered at a future date and VSOE of the fair value of all undelivered elements exists. In the majority of our contracts, the only element that remains undelivered at the time of delivery of the product is maintenance and support services. Under the residual method, VSOE of the fair value of the undelivered elements is deferred and the remaining portion of the contract fee is recognized as product revenue. If evidence of VSOE of the fair value of one or more undelivered elements does not exist, all revenue is generally deferred and recognized when delivery of those elements occurs or when fair value can be established.
For all other transactions originating or materially modified after December 31, 2009, we recognize revenue in accordance with the amended accounting guidance. For certain arrangements with multiple deliverables, we allocate the arrangement fee to the non-software element based upon the relative selling price of such element and, if software and software-related (e.g., maintenance and support for the software element) elements are also included in the arrangement, we allocate the arrangement fee to each of those software and software-related elements as a group. After such allocations are made, the amount of the arrangement fee allocated to the software and software-related elements is accounted for using the residual method. When applying the relative selling price method, we determine the selling price for each element using VSOE of selling price, if it exists, or if not, TPE of selling price, if it exists. If neither VSOE nor TPE of selling price exist for an element, we use our BESP for that element. The revenue allocated to each element is then recognized when the basic revenue recognition criteria are met for that element. We limit the amount of revenue recognized for delivered elements to the amount that is not contingent on the future delivery of products or services, or subject to our future performance obligation.
Consistent with our methodology under previous accounting guidance, VSOE of fair value for elements of an arrangement is based upon the normal pricing and discounting practices for those services when sold separately. In determining VSOE, we require that a substantial majority of the selling prices for a service fall within a reasonably narrow pricing range, evidenced by a substantial majority of such historical stand-alone transactions falling within a reasonably narrow range of the median rates. In addition, we consider major service groups and geographies in determining VSOE.
We are typically not able to determine TPE for our products or services. TPE is determined based on competitor prices for similar deliverables when sold separately. Generally, our go-to-market strategy differs from that of our peers and our offerings contain a significant level of differentiation such that the comparable pricing of products with similar functionality cannot be obtained. Furthermore, we are unable to reliably determine what similar competitor products’ selling prices are on a stand-alone basis.
When we are unable to establish the selling price of our non-software deliverables using VSOE or TPE, we use BESP in our allocation of arrangement consideration. The objective of BESP is to determine the price at which we would transact a sale if the product or service were sold on a stand-alone basis. We determine BESP for the purposes of allocating the arrangement by reviewing external and internal market factors including, but not limited to, pricing practices including discounting, the geographies in which we offer our products and services, the type of customer (i.e., distributor, value added reseller or direct end user) and competition. Additionally, we consider historical transactions, including transactions whereby the deliverable was sold on a stand-alone basis. The determination of BESP is made through consultation with and approval by our management. Selling prices are analyzed on a quarterly basis to identify if we have experienced significant changes in our selling prices.
49
Table of Contents
For our non-software deliverables we allocate the arrangement consideration based on the relative selling price of the deliverables. For our hardware appliances we use BESP as the selling price as we have no history of selling our hardware appliances separately. For our maintenance and support and professional services and training, we primarily use VSOE as the selling price and when we are unable to establish selling price using VSOE, we used BESP.
Stock-Based Compensation
We recognize compensation costs related to stock options and shares of restricted stock granted to employees based on the estimated fair value of the awards on the date of grant, net of estimated forfeitures. For stock options, we estimate the grant date fair value, and the resulting stock-based compensation expense, using the Black-Scholes option-pricing model. The grant date fair value of the stock-based awards is generally recognized on a straight-line basis over the requisite service period, which is generally the vesting period of the respective awards.
The fair value of the option awards during 2011, 2010 and 2009 was calculated using the Black-Scholes option pricing model with the following weighted-average assumptions:
| Years Ended December 31, | ||||||||||||
| 2011 | 2010 | 2009 | ||||||||||
| Expected dividend rate |
0 | % | 0 | % | 0 | % | ||||||
| Risk-free interest rate |
1.7 | % | 2.2 | % | 2.5 | % | ||||||
| Expected term (in years) |
5.4 | 6.1 | 6.0 | |||||||||
| Expected volatility |
49 | % | 51 | % | 55 | % | ||||||
The Black-Scholes options pricing model requires the use of highly subjective and complex assumptions which determine the fair value of share-based awards, including the option’s expected term and the price volatility of the underlying stock. These assumptions include:
Expected Term. The expected term represents the period over which the stock-based awards are expected to be outstanding. For option grants that are considered to be “plain vanilla,” we used the simplified method to determine the expected term as set forth in the guidance provided by the Securities and Exchange Commission. The simplified method calculates the expected term as the average of the time-to-vesting and the contractual life of the options. For option grants that are not considered “plain vanilla,” the expected term is based on historical option exercise behavior and post-vesting cancellations of options by employees.
Risk-Free Interest Rate. The risk-free interest rate is based on the U.S. Treasury yield in effect at the time of grant for zero coupon U.S. Treasury notes with maturities approximately equal to each award’s expected term.
Expected Volatility. Since we do not have a sufficient trading history of our common stock, the expected volatility was derived from the average historic volatilities of several unrelated public companies within our industry that we considered to be comparable to our business over a period equivalent to the expected term of the stock option grants.
Expected Dividend. The expected dividend was assumed to be zero as we have never paid dividends and have no current plans to do so.
In addition to assumptions used in the Black-Scholes option pricing model, we must also estimate a forfeiture rate to calculate the stock-based compensation for expense related to our awards. Our forfeiture rate is based on an analysis of our actual forfeitures. We will continue to evaluate the appropriateness of the forfeiture rate based on actual forfeiture experience, analysis of employee turnover and other factors. Quarterly changes in the estimated forfeiture rate can have a significant impact on our stock-based compensation expense as the cumulative effect of adjusting the rate is recognized in the period the forfeiture estimate is changed. If a revised forfeiture rate is higher than the previously estimated forfeiture rate, an adjustment is made that will result in a decrease to the stock-based compensation expense recognized in the financial statements. If a revised forfeiture rate is lower than the previously estimated forfeiture rate, an adjustment is made that will result in an increase to the stock-based compensation expense recognized in the financial statements.
We will continue to use judgment in evaluating the expected term, expected volatility and forfeiture rate related to our own stock-based compensation on a prospective basis. As we continue to accumulate additional data related to our common stock, we may have refinements to the estimates of our expected volatility, expected terms and forfeiture rates, which could materially impact our future stock-based compensation expense.
50
Table of Contents
Pre-IPO Common Stock Valuations
For all option grants prior to our initial public offering of common stock, the fair value of the common stock underlying the option grants was determined by our board of directors, with the assistance of management, which intended all options granted to be exercisable at a price per share not less than the per share fair value of our common stock underlying those options on the date of grant.
Post-IPO Common Stock Valuations
Following our IPO, we established a policy of using the closing sale price per share of our common stock as quoted on the New York Stock Exchange on the date of grant for purposes of determining the exercise price per share of our options to purchase common stock.
Long-Lived Assets
Property and equipment are stated at cost less accumulated depreciation on our consolidated balance sheets. Depreciation on property and equipment is calculated using the straight-line method over the estimated useful lives of the assets. We make estimates of the useful life of our property and equipment in order to determine depreciation expense to be recorded each reporting period based on similar assets purchased in the past and our historical experience with such similar assets, or asset group, as well as anticipated technological or market changes. The estimated useful life of our property and equipment directly impacts the timing of when our depreciation expense is recognized. There is significant judgment involved with estimating the useful lives of our property and equipment, and a change in the estimates of such useful lives could cause our depreciation expense in future periods to increase significantly.
We assess impairment of our property and equipment whenever events or changes in circumstances indicate that the carrying amount of the asset is impaired or the estimated useful lives are no longer appropriate. Circumstances such as changes in technology or in the way an asset is being used may trigger an impairment review. If indicators of impairment exist and the undiscounted projected cash flow associated with such assets are less than the carrying amount of the asset, an impairment loss is recorded to write the asset down to their estimated fair values. Fair value is estimated based on discounted future cash flow. We have not recognized an impairment charge on our property and equipment in our consolidated statement of operations during 2011, 2010 and 2009.
Income Taxes
We make certain estimates and judgments in determining income tax expense for financial statement purposes. These estimates and judgments occur in the calculation of tax credits, tax benefits and deductions and in the calculation of certain tax assets and liabilities, which arise from differences in the timing of recognition of revenue and expense for tax and financial statement purposes. Significant changes to these estimates may result in an increase or decrease to our tax provision in the subsequent period when such a change in estimate occurs.
We use the liability method for accounting of deferred income taxes, which requires recognition of deferred income tax assets and liabilities for the expected future tax consequences of events that have been recognized in our financial statements, but have not been reflected in our taxable income. Estimates and judgments occur in the calculation of certain tax liabilities and in the determination of the recoverability of certain deferred income tax assets, which arise from temporary differences and carry-forwards. Deferred income tax assets and liabilities are measured using the currently enacted tax rates that apply to taxable income in effect for the years in which those tax assets are expected to be realized or settled. We regularly assess the likelihood that our deferred income tax assets will be realized. To the extent that we believe any amounts are not more likely than not to be realized, we record a valuation allowance to reduce our deferred income tax assets. In the event we determine that all or part of the net deferred tax assets are not realizable in the future, an adjustment to the valuation allowance would be charged to earnings in the period such determination is made. Similarly, if we subsequently realize deferred income tax assets that were previously determined to be unrealizable, the respective valuation allowance would be reversed, resulting in an adjustment to earnings in the period such determination is made. In addition, the calculation of our tax liabilities involves dealing with uncertainties in the application of complex tax regulations. We recognize and measure potential liabilities based upon a more likely than not criteria. Based upon these criteria, we estimate whether, and the extent to which, additional taxes will be due. If payment of these amounts ultimately proves to be unnecessary, the reversal of the liabilities may result in tax benefits being recognized in the period when we determine the liabilities are no longer necessary. If our estimate of tax liabilities is less than the amount ultimately assessed, a further charge to expense would result.
Significant judgment is required in determining any valuation allowance recorded against deferred income tax assets. In assessing the need for a valuation allowance, we consider all available evidence, including past operating results, estimates of future taxable income, and the feasibility of tax planning strategies. In the event that we change our determination as to the amount of deferred income tax assets that could be realized, we will adjust our valuation allowance with a corresponding effect to the provision for income taxes in the period in which such determination is made.
51
Table of Contents
Significant judgment is also required in evaluating our uncertain tax positions and determining our provision for income taxes. Although we believe our reserves for uncertain tax positions are reasonable, no assurance can be given that the final tax outcome of these matters will not be different from that which is reflected in our historical income tax provisions and accruals. We adjust these reserves in light of changing facts and circumstances, such as the closing of a tax audit or the refinement of an estimate. To the extent that the final tax outcome of these matters is different from the amounts recorded, such differences will affect the provision for income taxes in the period in which such determination is made. The provision for income taxes includes the effect of reserves for uncertain tax positions and any changes to the reserves that are considered appropriate, as well as the related net interest and penalties, if applicable.
Contractual Obligations
The following summarizes our contractual obligations as of December 31, 2011:
| Payments Due by Period | ||||||||||||||||||||||||
| Contractual Obligations: |
2012 | 2013 | 2014 | 2015 | 2016 | Total | ||||||||||||||||||
| (in thousands) | ||||||||||||||||||||||||
| Operating lease obligations1 |
$ | 2,220 | $ | 2,329 | $ | 1,164 | $ | 575 | $ | 403 | $ | 6,691 | ||||||||||||
| Cancelable lease obligations2 |
— | — | — | — | — | — | ||||||||||||||||||
| Severance Pay Fund3 |
— | — | — | — | — | 2,760 | ||||||||||||||||||
| Purchase commitments4 |
2,961 | — | — | — | — | 2,961 | ||||||||||||||||||
|
|
|
|
|
|
|
|
|
|
|
|
|
|||||||||||||
| Total |
$ | 5,181 | $ | 2,329 | $ | 1,164 | $ | 575 | $ | 403 | $ | 12,412 | ||||||||||||
|
|
|
|
|
|
|
|
|
|
|
|
|
|||||||||||||
| 1 | Operating lease agreements represent our obligations to make payments under our non-cancelable lease agreements for our facilities. During the year ended December 31, 2011, we made regular lease payments of $2.0 million under the operating lease agreements. |
| 2 | Cancelable lease obligations represent our obligations under our motor vehicle lease agreement. We have the option to cancel the lease at any time which may result in penalties in a maximum amount of $56,000 as of December 31, 2011. During the year ended December 31, 2011, we made regular lease payments of $0.6 million under the cancelable lease obligations. |
| 3 | Our consolidated balance sheet as of December 31, 2011 includes $2.8 million of non-current liabilities for our Israeli severance pay fund. The specific timing of any cash payments relating to this obligation cannot be projected with reasonable certainty and, therefore, no amounts for this obligation are included in the annual columns of the table set forth above. |
| 4 | Purchase commitments are contractual obligations to purchase hardware appliances and related component parts from our vendors in advance of anticipated sales. |
Under the terms of our Series A and Series A-1 Preferred Stock Purchase Agreement with Incapsula, we entered into a forward contract with Incapsula to purchase 8,750,000 shares of Incapsula’s Series A-1 Convertible Preferred Stock in exchange for $7.0 million in cash consideration if certain milestones were achieved. In July 2011, Incapsula achieved the respective performance milestones. As a result, we purchased 4,375,000 shares of Incapsula’s Series A-1 Preferred Stock for $3.5 million thereby increasing our ownership interest to 82%. In January 2012, we purchased the remaining 4,375,000 shares of Incapsula’s Series A-1 Preferred Stock for $3.5 million thereby increasing our ownership interest in Incapsula to 85% at the date of issuance.
Off-Balance Sheet Arrangements
Through December 31, 2011, we did not have any relationships with unconsolidated entities or financial partnerships, such as entities often referred to as structured finance or special purpose entities, which would have been established for the purpose of facilitating off-balance sheet arrangements or other contractually narrow or limited purposes.
Recent Accounting Pronouncements
From time to time, new accounting pronouncements are issued by the Financial Accounting Standards Board (“FASB”) or other standard setting bodies that are adopted by us as of the specified effective date. Unless otherwise discussed, we believe that the impact of recently issued standards that are not yet effective will not have a material impact on our financial position or results of operations upon adoption.
In January 2010, the FASB issued ASU 2010-06. Fair Value Measurements and Disclosures. ASU 2010-06 requires disclosures about inputs and valuation techniques used to measure fair value as well as disclosures about significant transfers, beginning in the first quarter of 2010. Additionally, these amended standards require presentation of disaggregated activity within the reconciliation for fair value measurements using significant unobservable inputs (Level 3), beginning in the first quarter of 2011. The adoption of this new standard did not have a significant impact on our consolidated financial statements.
52
Table of Contents
In May 2011, the FASB issued ASU 2011-04, Fair Value Measurement: Amendments to Achieve Common Fair Value Measurement and Disclosure Requirements in U.S. GAAP and IFRS. ASU 2011-04 amends the fair value measurement guidance and includes some enhanced disclosure requirements. The most significant change in disclosures is an expansion of the information required for Level 3 measurements based on unobservable inputs. The standard is effective for fiscal years beginning after December 15, 2011. We are currently evaluating the impact of adopting the guidance on our consolidated financial statements.
In June 2011, the FASB issued an ASU No. 2011-5, Comprehensive Income. ASU No. 2011-5 requires companies to present comprehensive income in a single statement below net income or in a separate statement of comprehensive income immediately following the income statement. This update does not change which items are reported in other comprehensive income or the requirement to report reclassifications of items from other comprehensive income to net income. This requirement will become effective for us beginning with the Quarterly Report on Form 10-Q for the quarter ended March 31, 2012 and will require retrospective application for all periods presented.
In September 2011, the FASB issued an ASU No. 2011-08, Intangibles —Goodwill and Other. Under ASU 2011-08, an entity has the option to first assess qualitative factors to determine whether the existence of events or circumstances leads to a determination that it is more likely than not that the fair value of a reporting unit is less than its carrying amount. If the entity determines that this threshold is not met, then performing the two-step impairment is unnecessary. ASU 2011-08 is effective for fiscal years beginning after December 15, 2011. The adoption of this guidance is not expected to have a material impact on our consolidated financial statements.
Item 7A. Quantitative and Qualitative Disclosures about Market Risk
We are exposed to market risks in the ordinary course of our business. Market risk represents the risk of loss that may impact our financial position due to adverse changes in financial market prices and rates. Our market risk exposure is primarily a result of fluctuations in interest rates and foreign currency exchange rates. We do not hold or issue financial instruments for trading purposes.
Interest Rate Sensitivity
Our exposure to market risk for changes in interest rates relates primarily to our investment portfolio and our outstanding debt obligations. Our cash, cash equivalents and short-term investment accounts as of December 31, 2011 and 2010 totaled $97.6 million and $17.7 million, respectively, and consist primarily of cash, cash equivalents and short-term investments with maturities of less than one year from the date of purchase. Our primary exposure to market risk is interest income sensitivity, which is affected by changes in the general level of the interest rates in the United States. However, because of the short-term nature of the instruments in our portfolio, a sudden change in market interest rates would not be expected to have a material impact on our financial condition or our results of operation.
As of December 31, 2011, we have no amounts outstanding under our credit facility agreement. To the extent in the future we enter into other long-term debt arrangements, we would be subject to fluctuations in interest rates which could have a material impact on our future financial condition and results of operation.
Foreign Currency Exchange Risk
Our consolidated results of operations and cash flow are subject to fluctuations due to changes in foreign currency exchange rates. Substantially all of our revenue is generated in U.S. dollars. Our expenses are generally denominated in the currencies in which our operations are located, which is primarily in the U.S. and Israel and to a lesser extent in EMEA and Asia Pacific. Our consolidated results of operations and cash flow are, therefore, subject to fluctuations due to changes in foreign currency exchange rates and may be adversely affected in the future due to changes in foreign exchange rates. The effect of a hypothetical 10% change in foreign currency exchanges rates applicable to our business would not have a material impact on our historical consolidated financial statements.
To date, we have used derivative financial instruments, specifically foreign currency forward contracts, to manage exposure to foreign currency risks, by hedging a portion of our forecasted expenses denominated in Israeli shekels expected to occur within a year. The effect of exchange rate changes on foreign currency forward contracts is expected to offset the effect of exchange rate changes on the underlying hedged item. We do not use derivative financial instruments for speculative or trading purposes.
Item 8. Financial Statements and Supplementary Data
Quarterly Results of Operations
The following table sets forth unaudited quarterly consolidated statements of operations data for each of the years in the two-year period ended December 31, 2011 (in thousands, except per share data). We derived this information from our unaudited consolidated financial statements, which we prepared on the same basis as our audited consolidated financial statements contained in this Annual Report on Form 10-K. In our opinion, these unaudited statements include all adjustments, consisting only of normal recurring adjustments that we consider necessary for a fair statement of that information when read in conjunction with the consolidated financial statements and related notes included elsewhere in this Annual Report on Form 10-K. The operating results for any quarter should not be considered indicative of results for any future period.
53
Table of Contents
| Three Months Ended | ||||||||||||||||||||||||||||||||
| Dec. 31, 2011 |
Sept. 30, 2011 |
June 30, 2011 |
March 31, 2011 |
Dec. 31, 2010 |
Sept. 30, 2010 |
June 30, 2010 |
March 31, 2010 |
|||||||||||||||||||||||||
| (in thousands, except percentage and per share amounts) | ||||||||||||||||||||||||||||||||
| Net revenue: |
||||||||||||||||||||||||||||||||
| Products and license |
$ | 14,779 | $ | 11,464 | $ | 11,379 | $ | 9,978 | $ | 10,947 | $ | 8,247 | $ | 8,319 | $ | 6,966 | ||||||||||||||||
| Services: |
||||||||||||||||||||||||||||||||
| Maintenance and support |
6,731 | 6,452 | 5,907 | 5,407 | 5,148 | 4,704 | 4,402 | 3,810 | ||||||||||||||||||||||||
| Professional services and training |
1,252 | 1,418 | 1,243 | 817 | 749 | 584 | 667 | 465 | ||||||||||||||||||||||||
| Subscriptions |
553 | 404 | 297 | 221 | 140 | 111 | 48 | 75 | ||||||||||||||||||||||||
|
|
|
|
|
|
|
|
|
|
|
|
|
|
|
|
|
|||||||||||||||||
| Total services |
8,536 | 8,274 | 7,447 | 6,445 | 6,037 | 5,399 | 5,117 | 4,350 | ||||||||||||||||||||||||
|
|
|
|
|
|
|
|
|
|
|
|
|
|
|
|
|
|||||||||||||||||
| Total net revenue |
23,315 | 19,738 | 18,826 | 16,423 | 16,984 | 13,646 | 13,436 | 11,316 | ||||||||||||||||||||||||
| Cost of revenue: |
||||||||||||||||||||||||||||||||
| Products and license |
2,278 | 1,357 | 1,705 | 1,371 | 1,782 | 1,432 | 1,537 | 1,154 | ||||||||||||||||||||||||
| Services |
2,448 | 2,893 | 2,206 | 1,963 | 1,789 | 1,623 | 1,564 | 1,452 | ||||||||||||||||||||||||
|
|
|
|
|
|
|
|
|
|
|
|
|
|
|
|
|
|||||||||||||||||
| Total cost of revenue |
4,726 | 4,250 | 3,911 | 3,334 | 3,571 | 3,055 | 3,101 | 2,606 | ||||||||||||||||||||||||
|
|
|
|
|
|
|
|
|
|
|
|
|
|
|
|
|
|||||||||||||||||
| Gross profit |
18,589 | 15,488 | 14,915 | 13,089 | 13,413 | 10,591 | 10,335 | 8,710 | ||||||||||||||||||||||||
| Gross margin |
80 | % | 78 | % | 79 | % | 80 | % | 79 | % | 78 | % | 77 | % | 77 | % | ||||||||||||||||
| Operating expenses: |
||||||||||||||||||||||||||||||||
| Research and development |
4,740 | 4,615 | 4,316 | 3,927 | 3,746 | 3,470 | 3,042 | 2,956 | ||||||||||||||||||||||||
| Sales and marketing |
11,712 | 10,411 | 10,559 | 10,000 | 10,073 | 8,430 | 8,072 | 7,593 | ||||||||||||||||||||||||
| General and administrative |
3,612 | 3,063 | 2,829 | 2,294 | 2,690 | 2,111 | 1,662 | 1,519 | ||||||||||||||||||||||||
|
|
|
|
|
|
|
|
|
|
|
|
|
|
|
|
|
|||||||||||||||||
| Total operating expenses |
20,073 | 18,089 | 17,704 | 16,221 | 16,509 | 14,011 | 12,776 | 12,068 | ||||||||||||||||||||||||
|
|
|
|
|
|
|
|
|
|
|
|
|
|
|
|
|
|||||||||||||||||
| Loss from operations |
(1,484 | ) | (2,601 | ) | (2,789 | ) | (3,132 | ) | (3,096 | ) | (3,420 | ) | (2,441 | ) | (3,358 | ) | ||||||||||||||||
| Other income (expense), net |
48 | (63 | ) | (86 | ) | (89 | ) | 117 | 805 | (471 | ) | 23 | ||||||||||||||||||||
|
|
|
|
|
|
|
|
|
|
|
|
|
|
|
|
|
|||||||||||||||||
| Loss before provision from income taxes |
(1,436 | ) | (2,664 | ) | (2,875 | ) | (3,221 | ) | (2,979 | ) | (2,615 | ) | (2,912 | ) | (3,335 | ) | ||||||||||||||||
| Provision for income taxes |
191 | 205 | 150 | 116 | 196 | 243 | 26 | 62 | ||||||||||||||||||||||||
|
|
|
|
|
|
|
|
|
|
|
|
|
|
|
|
|
|||||||||||||||||
| Net loss |
(1,627 | ) | (2,869 | ) | (3,025 | ) | (3,337 | ) | (3,175 | ) | (2,858 | ) | (2,938 | ) | (3,397 | ) | ||||||||||||||||
| Loss attributable to noncontrolling interest |
131 | 178 | 149 | 131 | 99 | 63 | 104 | 89 | ||||||||||||||||||||||||
|
|
|
|
|
|
|
|
|
|
|
|
|
|
|
|
|
|||||||||||||||||
| Net loss attributable to Imperva, Inc. stockholders |
$ | (1,496 | ) | $ | (2,691 | ) | $ | (2,876 | ) | $ | (3,206 | ) | $ | (3,076 | ) | $ | (2,795 | ) | $ | (2,834 | ) | $ | (3,308 | ) | ||||||||
|
|
|
|
|
|
|
|
|
|
|
|
|
|
|
|
|
|||||||||||||||||
| Net loss per share attributable to Imperva, Inc. stockholders, basic and diluted |
$ | 0.10 | $ | 0.48 | $ | 0.53 | $ | 0.63 | $ | 0.63 | $ | 0.57 | $ | 0.58 | $ | 0.71 | ||||||||||||||||
| Weighted-average shares used to compute net loss per share attributable to Imperva, Inc. stockholders, basic and diluted: |
14,618 | 5,554 | 5,392 | 5,075 | 4,920 | 4,891 | 4,857 | 4,679 | ||||||||||||||||||||||||
54
Table of Contents
INDEX TO CONSOLIDATED FINANCIAL STATEMENTS
IMPERVA, INC. AND SUBSIDIARIES
| Page | ||||
| 56 | ||||
| 58 | ||||
| 59 | ||||
| Consolidated Statements of Convertible Preferred Stock and Stockholders’ Equity (Deficit) |
60 | |||
| 62 | ||||
| 63 | ||||
55
Table of Contents
REPORT OF INDEPENDENT REGISTERED PUBLIC ACCOUNTING FIRM
The Board of Directors and Stockholders of
Imperva, Inc.
We have audited the accompanying consolidated balance sheets of Imperva, Inc. and subsidiaries as of December 31, 2011 and 2010, and the related consolidated statements of operations, convertible preferred stock and stockholders’ equity (deficit), and cash flows for the years then ended. These financial statements are the responsibility of the Company’s management. Our responsibility is to express an opinion on these financial statements based on our audits.
We conducted our audits in accordance with the standards of the Public Company Accounting Oversight Board (United States). Those standards require that we plan and perform the audit to obtain reasonable assurance about whether the financial statements are free of material misstatement. We were not engaged to perform an audit of the Company’s internal control over financial reporting. Our audits included consideration of internal control over financial reporting as a basis for designing audit procedures that are appropriate in the circumstances, but not for the purpose of expressing an opinion on the effectiveness of the Company’s internal control over financial reporting. Accordingly, we express no such opinion. An audit also includes examining, on a test basis, evidence supporting the amounts and disclosures in the financial statements, assessing the accounting principles used and significant estimates made by management, and evaluating the overall financial statement presentation. We believe that our audits provide a reasonable basis for our opinion.
In our opinion, the financial statements referred to above present fairly, in all material respects, the consolidated financial position of Imperva, Inc. and subsidiaries at December 31, 2011 and 2010, and the consolidated results of their operations and their cash flows for the years then ended, in conformity with U.S. generally accepted accounting principles.
As discussed in Note 1 to consolidated financial statements, the Company changed its method of accounting for revenue recognition effective January 1, 2010.
| /s/ Ernst & Young LLP |
Redwood City, California
March 27, 2012
56
Table of Contents
REPORT OF INDEPENDENT REGISTERED PUBLIC ACCOUNTING FIRM
The Board of Directors and Stockholders of
Imperva, Inc.
We have audited the accompanying consolidated statements of operations, convertible preferred stock and stockholders’ equity (deficit), and cash flows of Imperva, Inc. and subsidiaries for the year ended December 31, 2009. These financial statements are the responsibility of the Company’s management. Our responsibility is to express an opinion on these financial statements based on our audit.
We conducted our audit in accordance with the standards of the Public Company Accounting Oversight Board (United States). Those standards require that we plan and perform the audit to obtain reasonable assurance about whether the financial statements are free of material misstatement. We were not engaged to perform an audit of the Company’s internal control over financial reporting. Our audit included consideration of internal control over financial reporting as a basis for designing audit procedures that are appropriate in the circumstances, but not for the purpose of expressing an opinion on the effectiveness of the Company’s internal control over financial reporting. Accordingly, we express no such opinion. An audit also includes examining, on a test basis, evidence supporting the amounts and disclosures in the financial statements, assessing the accounting principles used and significant estimates made by management, and evaluating the overall financial statement presentation. We believe that our audit provides a reasonable basis for our opinion.
In our opinion, the financial statements referred to above present fairly, in all material respects, the consolidated results of operations and cash flows of Imperva, Inc. and subsidiaries for the year ended December 31, 2009, in conformity with U.S. generally accepted accounting principles.
| /s/ Kost Forer Gabbay & Kasierer | ||
| A Member of Ernst & Young Global | ||
Tel-Aviv, Israel
June 17, 2011,
except for the last paragraph of Note 1,
as to which the date is
November 7, 2011
57
Table of Contents
IMPERVA, INC. AND SUBSIDIARIES
Consolidated Balance Sheets
(In thousands, except share and per share data)
| December 31, | ||||||||
| 2011 | 2010 | |||||||
| ASSETS |
||||||||
| CURRENT ASSETS: |
||||||||
| Cash and cash equivalents |
$ | 96,025 | $ | 16,410 | ||||
| Short-term investments |
1,587 | 1,245 | ||||||
| Restricted cash |
687 | 996 | ||||||
| Accounts receivable, net of allowance for doubtful accounts of $225 and $407 as of December 31, 2011 and 2010 |
25,736 | 13,164 | ||||||
| Inventory |
442 | 387 | ||||||
| Deferred tax assets |
246 | 141 | ||||||
| Prepaid expenses and other current assets |
1,352 | 1,709 | ||||||
|
|
|
|
|
|||||
| Total current assets |
126,075 | 34,052 | ||||||
| Property and equipment, net |
4,026 | 4,101 | ||||||
| Severance pay fund |
2,652 | 2,204 | ||||||
| Restricted cash |
666 | 518 | ||||||
| Deferred tax assets |
46 | 30 | ||||||
| Other assets |
77 | 72 | ||||||
|
|
|
|
|
|||||
| TOTAL ASSETS |
$ | 133,542 | $ | 40,977 | ||||
|
|
|
|
|
|||||
| LIABILITIES, CONVERTIBLE PREFERRED STOCK AND STOCKHOLDERS’ EQUITY (DEFICIT) |
||||||||
| CURRENT LIABILITIES: |
||||||||
| Accounts payable |
$ | 3,534 | $ | 2,516 | ||||
| Accrued compensation and benefits |
7,491 | 5,868 | ||||||
| Accrued and other current liabilities |
4,408 | 4,519 | ||||||
| Deferred revenue |
21,982 | 13,738 | ||||||
| Convertible preferred stock warrant liability |
— | 69 | ||||||
| Revolving credit facility |
— | 501 | ||||||
|
|
|
|
|
|||||
| Total current liabilities |
37,415 | 27,211 | ||||||
| Other liabilities |
2,856 | 2,891 | ||||||
| Deferred revenue |
10,943 | 7,480 | ||||||
| Accrued severance pay |
2,760 | 2,372 | ||||||
|
|
|
|
|
|||||
| TOTAL LIABILITIES |
53,974 | 39,954 | ||||||
|
|
|
|
|
|||||
| Commitments and Contingencies (Note 9) |
||||||||
| Convertible preferred stock, $0.0001 par value—no shares authorized, issued and outstanding as of December 31, 2011 and 21,566,101 shares authorized, 10,761,511 shares issued and outstanding as of December 31, 2010 and aggregate liquidation preference of $0 and $83,982 as of December 31, 2011 and 2010 |
— | 53,442 | ||||||
|
|
|
|
|
|||||
| STOCKHOLDERS’ EQUITY (DEFICIT): |
||||||||
| Preferred stock, $.0001 par value—5,000,000 shares authorized, no shares issued and outstanding as of December 31, 2011; no shares authorized, issued and outstanding as of December 31, 2010 |
— | — | ||||||
| Common stock, $0.0001 par value—145,000,000 shares authorized; 22,978,166 shares issued and outstanding as of December 31, 2011; 50,000,000 shares authorized; 6,143,018 shares issued and outstanding as of December 31, 2010 |
2 | 1 | ||||||
| Additional paid-in capital |
147,085 | 3,340 | ||||||
| Accumulated deficit |
(66,130 | ) | (55,861 | ) | ||||
| Accumulated other comprehensive income (loss) |
(616 | ) | 452 | |||||
|
|
|
|
|
|||||
| TOTAL IMPERVA, INC. STOCKHOLDERS’ EQUITY (DEFICIT) |
80,341 | (52,068 | ) | |||||
| Noncontrolling interest |
(773 | ) | (351 | ) | ||||
|
|
|
|
|
|||||
| TOTAL STOCKHOLDERS’ EQUITY (DEFICIT) |
79,568 | (52,419 | ) | |||||
|
|
|
|
|
|||||
| TOTAL LIABILITIES, CONVERTIBLE PREFERRED STOCK AND STOCKHOLDERS’ EQUITY (DEFICIT) |
$ | 133,542 | $ | 40,977 | ||||
|
|
|
|
|
|||||
The accompanying notes are an integral part of these consolidated financial statements.
58
Table of Contents
IMPERVA, INC. AND SUBSIDIARIES
Consolidated Statements of Operations
(In thousands, except share and per share data)
| Years Ended December 31, | ||||||||||||
| 2011 | 2010 | 2009 | ||||||||||
| Net revenue: |
||||||||||||
| Products and license |
$ | 47,600 | $ | 34,479 | $ | 25,727 | ||||||
| Services |
30,702 | 20,903 | 13,614 | |||||||||
|
|
|
|
|
|
|
|||||||
| Total net revenue |
78,302 | 55,382 | 39,341 | |||||||||
| Cost of revenue: |
||||||||||||
| Products and license |
6,711 | 5,905 | 4,795 | |||||||||
| Services |
9,510 | 6,428 | 4,576 | |||||||||
|
|
|
|
|
|
|
|||||||
| Total cost of revenue |
16,221 | 12,333 | 9,371 | |||||||||
|
|
|
|
|
|
|
|||||||
| Gross profit |
62,081 | 43,049 | 29,970 | |||||||||
| Operating expenses: |
||||||||||||
| Research and development |
17,598 | 13,214 | 10,538 | |||||||||
| Sales and marketing |
42,682 | 34,168 | 26,920 | |||||||||
| General and administrative |
11,807 | 7,982 | 4,669 | |||||||||
|
|
|
|
|
|
|
|||||||
| Total operating expenses |
72,087 | 55,364 | 42,127 | |||||||||
|
|
|
|
|
|
|
|||||||
| Loss from operations |
(10,006 | ) | (12,315 | ) | (12,157 | ) | ||||||
| Other income (expense), net |
(190 | ) | 474 | 178 | ||||||||
|
|
|
|
|
|
|
|||||||
| Loss before provision for income taxes |
(10,196 | ) | (11,841 | ) | (11,979 | ) | ||||||
| Provision for income taxes |
662 | 527 | 360 | |||||||||
|
|
|
|
|
|
|
|||||||
| Net loss |
(10,858 | ) | (12,368 | ) | (12,339 | ) | ||||||
| Loss attributable to noncontrolling interest |
589 | 355 | 43 | |||||||||
|
|
|
|
|
|
|
|||||||
| Net loss attributable to Imperva, Inc. stockholders |
$ | (10,269 | ) | $ | (12,013 | ) | (12,296 | ) | ||||
|
|
|
|
|
|
|
|||||||
| Net loss per share of common stock attributable to Imperva, Inc. stockholders, basic and diluted |
$ | (1.34 | ) | $ | (2.46 | ) | $ | (2.82 | ) | |||
|
|
|
|
|
|
|
|||||||
| Shares used in computing net loss per share of common stock, basic and diluted |
7,674,554 | 4,884,665 | 4,365,359 | |||||||||
|
|
|
|
|
|
|
|||||||
The accompanying notes are an integral part of these consolidated financial statements.
59
Table of Contents
IMPERVA, INC. AND SUBSIDIARIES
Consolidated Statements of Convertible Preferred Stock and Stockholders’ Equity (Deficit)
(In thousands, except share data)
| Convertible Preferred Stock |
Common Stock | Additional Paid-in Capital |
Accumulated Deficit |
Accumulated Other Comprehensive Income (Loss) |
Noncontrolling Interest |
Total Stockholders’ Equity (Deficit) |
||||||||||||||||||||||||||||||||
| Shares | Amount | Shares | Amount | |||||||||||||||||||||||||||||||||||
| Balance as of December 31, 2008 |
10,761,511 | 53,442 | 4,592,218 | — | 1,480 | (31,552 | ) | — | — | (30,072 | ) | |||||||||||||||||||||||||||
| Issuance of common stock upon exercise of stock options |
— | — | 274,458 | — | 231 | — | — | — | 231 | |||||||||||||||||||||||||||||
| Vesting of restricted stock |
— | — | — | — | 118 | — | — | — | 118 | |||||||||||||||||||||||||||||
| Stock-based compensation |
— | — | — | — | 421 | — | — | — | 421 | |||||||||||||||||||||||||||||
| Component of other comprehensive income (loss), net of tax: |
||||||||||||||||||||||||||||||||||||||
| Change in unrealized gain (loss) on derivatives |
— | — | — | — | — | — | 113 | — | 113 | |||||||||||||||||||||||||||||
| Net loss |
— | — | — | — | — | (12,296 | ) | — | (43 | ) | (12,339 | ) | ||||||||||||||||||||||||||
|
|
|
|||||||||||||||||||||||||||||||||||||
| Comprehensive loss |
(12,226 | ) | ||||||||||||||||||||||||||||||||||||
|
|
|
|
|
|
|
|
|
|
|
|
|
|
|
|
|
|
|
|||||||||||||||||||||
| Balance as of December 31, 2009 |
10,761,511 | 53,442 | 4,866,676 | — | 2,250 | (43,848 | ) | 113 | (43 | ) | (41,528 | ) | ||||||||||||||||||||||||||
| Issuance of common stock upon exercise of stock options |
— | — | 372,523 | 1 | 436 | — | — | — | 437 | |||||||||||||||||||||||||||||
| Issuance of common stock upon early exercise of stock options |
— | — | 60,000 | — | — | — | — | — | — | |||||||||||||||||||||||||||||
| Issuance of restricted stock |
— | — | 843,819 | — | — | — | — | — | ||||||||||||||||||||||||||||||
| Vesting of restricted stock |
— | — | — | — | 61 | — | — | — | 61 | |||||||||||||||||||||||||||||
| Stock-based compensation |
— | — | — | — | 640 | — | — | — | 640 | |||||||||||||||||||||||||||||
| Purchase of additional ownership interest in Incapsula, Inc. |
— | — | — | — | (47 | ) | — | — | 47 | — | ||||||||||||||||||||||||||||
| Components of other comprehensive income (loss), net of tax: |
||||||||||||||||||||||||||||||||||||||
| Change in unrealized gain (loss) on investments |
— | — | — | — | — | — | 2 | — | 2 | |||||||||||||||||||||||||||||
| Change in unrealized gain (loss) on derivatives |
— | — | — | — | — | — | 337 | — | 337 | |||||||||||||||||||||||||||||
| Net loss |
— | — | — | — | — | (12,013 | ) | — | (355 | ) | (12,368 | ) | ||||||||||||||||||||||||||
|
|
|
|||||||||||||||||||||||||||||||||||||
| Comprehensive loss |
(12,029 | ) | ||||||||||||||||||||||||||||||||||||
|
|
|
|
|
|
|
|
|
|
|
|
|
|
|
|
|
|
|
|||||||||||||||||||||
| Balance as of December 31, 2010 |
10,761,511 | 53,442 | 6,143,018 | 1 | 3,340 | (55,861 | ) | 452 | (351 | ) | (52,419 | ) | ||||||||||||||||||||||||||
|
|
|
|
|
|
|
|
|
|
|
|
|
|
|
|
|
|
|
|||||||||||||||||||||
60
Table of Contents
IMPERVA, INC. AND SUBSIDIARIES
Consolidated Statements of Convertible Preferred Stock and Stockholders’ Equity (Deficit)—(Continued)
(In thousands, except share data)
| Convertible Preferred Stock |
Common Stock | Additional Paid-in Capital |
Accumulated Deficit |
Accumulated Other Comprehensive Income (Loss) |
Noncontrolling Interest |
Total Stockholders’ Equity (Deficit) |
||||||||||||||||||||||||||||||||
| Shares | Amount | Shares | Amount | |||||||||||||||||||||||||||||||||||
| Balance as of December 31, 2010 |
10,761,511 | $ | 53,442 | 6,143,018 | $ | 1 | $ | 3,340 | $ | (55,861 | ) | $ | 452 | $ | (351 | ) | $ | (52,419 | ) | |||||||||||||||||||
| Initial public offering shares issued, net of issuance costs |
— | — | 5,500,000 | 86,245 | — | — | — | 86,245 | ||||||||||||||||||||||||||||||
| Exercise of warrant on preferred shares |
9,721 | 178 | — | — | — | — | — | — | — | |||||||||||||||||||||||||||||
| Conversion of preferred shares |
(10,771,232 | ) | (53,620 | ) | 10,771,232 | 1 | 53,620 | — | — | — | 53,621 | |||||||||||||||||||||||||||
| Conversion of preferred stock warrant to common stock warrant |
— | — | — | — | 129 | — | — | — | 129 | |||||||||||||||||||||||||||||
| Issuance of common stock upon exercise of stock options |
— | — | 473,916 | — | 1,145 | — | — | — | 1,145 | |||||||||||||||||||||||||||||
| Issuance of common stock upon early exercise of stock awards |
— | — | 90,000 | — | — | — | — | — | — | |||||||||||||||||||||||||||||
| Vesting of restricted stock |
— | — | — | — | 1,046 | — | — | — | 1,046 | |||||||||||||||||||||||||||||
| Stock-based compensation |
— | — | — | — | 1,727 | — | — | — | 1,727 | |||||||||||||||||||||||||||||
| Purchase of additional ownership interest in Incapsula, Inc. |
— | — | — | — | (167 | ) | — | — | 167 | — | ||||||||||||||||||||||||||||
| Components of other comprehensive income (loss), net of tax: |
||||||||||||||||||||||||||||||||||||||
| Change in unrealized gain (loss) on investments |
— | — | — | — | — | — | (57 | ) | — | (57 | ) | |||||||||||||||||||||||||||
| Change in unrealized gain (loss) on derivatives |
— | — | — | — | — | — | (1,011 | ) | — | (1,011 | ) | |||||||||||||||||||||||||||
| Net loss |
— | — | — | — | — | (10,269 | ) | — | (589 | ) | (10,858 | ) | ||||||||||||||||||||||||||
|
|
|
|||||||||||||||||||||||||||||||||||||
| Comprehensive loss |
— | — | (11,926 | ) | ||||||||||||||||||||||||||||||||||
|
|
|
|
|
|
|
|
|
|
|
|
|
|
|
|
|
|
|
|||||||||||||||||||||
| Balance as of December 31, 2011 |
— | $ | — | 22,978,166 | $ | 2 | $ | 147,085 | $ | (66,130 | ) | $ | (616 | ) | $ | (773 | ) | $ | 79,568 | |||||||||||||||||||
|
|
|
|
|
|
|
|
|
|
|
|
|
|
|
|
|
|
|
|||||||||||||||||||||
61
Table of Contents
IMPERVA, INC. AND SUBSIDIARIES
Consolidated Statements of Cash Flows
(In thousands)
| Years Ended December 31, | ||||||||||||
| 2011 | 2010 | 2009 | ||||||||||
| CASH FLOWS FROM OPERATING ACTIVITIES: |
||||||||||||
| Net loss |
$ | (10,858 | ) | $ | (12,368 | ) | $ | (12,339 | ) | |||
| Adjustments to reconcile net loss to net cash used in operating activities: |
||||||||||||
| Depreciation and amortization |
1,540 | 1,170 | 672 | |||||||||
| Stock-based compensation |
1,727 | 640 | 421 | |||||||||
| Revaluation of convertible preferred stock warrant liability |
238 | 14 | — | |||||||||
| Changes in operating assets and liabilities: |
||||||||||||
| Accounts receivable, net |
(12,572 | ) | (710 | ) | (2,805 | ) | ||||||
| Inventory |
(55 | ) | 204 | (60 | ) | |||||||
| Prepaid expenses and other assets |
(95 | ) | (668 | ) | 624 | |||||||
| Accounts payable |
1,019 | (568 | ) | 854 | ||||||||
| Accrued compensation and benefits |
1,623 | 1,548 | 1,290 | |||||||||
| Accrued and other liabilities |
(622 | ) | 2,021 | 1,032 | ||||||||
| Severance pay (net) |
(60 | ) | 59 | (81 | ) | |||||||
| Deferred revenue |
11,707 | 7,841 | 5,317 | |||||||||
| Deferred tax assets |
(121 | ) | (28 | ) | (181 | ) | ||||||
| Other |
(8 | ) | (204 | ) | (255 | ) | ||||||
|
|
|
|
|
|
|
|||||||
| Net cash used in operating activities |
(6,537 | ) | (1,049 | ) | (5,511 | ) | ||||||
|
|
|
|
|
|
|
|||||||
| CASH FLOWS FROM INVESTING ACTIVITIES: |
||||||||||||
| Purchase of short-term investments |
(2,948 | ) | (2,249 | ) | (463 | ) | ||||||
| Proceeds from sales/maturities of short-term investments |
2,611 | 1,467 | — | |||||||||
| Purchase of property and equipment |
(1,465 | ) | (2,889 | ) | (1,329 | ) | ||||||
| Change in restricted cash |
160 | (902 | ) | (150 | ) | |||||||
|
|
|
|
|
|
|
|||||||
| Net cash used in investing activities |
(1,642 | ) | (4,573 | ) | (1,942 | ) | ||||||
|
|
|
|
|
|
|
|||||||
| CASH FLOWS FROM FINANCING ACTIVITIES: |
||||||||||||
| Proceeds from exercise of stock options |
1,149 | 588 | 231 | |||||||||
| Proceeds from initial public offering, net of offering costs |
86,245 | — | — | |||||||||
| Borrowings on revolving credit facility |
4,000 | 501 | — | |||||||||
| Repayments of revolving credit facility |
(4,501 | ) | — | — | ||||||||
| Proceeds from issuance of convertible promissory note from related party |
— | — | 600 | |||||||||
| Repayment of convertible promissory note from related party |
— | (600 | ) | — | ||||||||
| Proceeds from issuance of restricted stock |
963 | 2,785 | — | |||||||||
|
|
|
|
|
|
|
|||||||
| Net cash provided by financing activities |
87,856 | 3,274 | 831 | |||||||||
|
|
|
|
|
|
|
|||||||
| Effect of exchange rate changes on cash and cash equivalents |
(62 | ) | 171 | 260 | ||||||||
|
|
|
|
|
|
|
|||||||
| NET INCREASE (DECREASE) IN CASH AND CASH EQUIVALENTS |
79,615 | (2,177 | ) | (6,362 | ) | |||||||
| CASH AND CASH EQUIVALENTS—Beginning of year |
16,410 | 18,587 | 24,949 | |||||||||
|
|
|
|
|
|
|
|||||||
| CASH AND CASH EQUIVALENTS—End of year |
$ | 96,025 | $ | 16,410 | $ | 18,587 | ||||||
|
|
|
|
|
|
|
|||||||
| SUPPLEMENTAL DISCLOSURES OF CASH FLOW INFORMATION: |
||||||||||||
| Cash paid for interest |
$ | 25 | $ | 12 | $ | — | ||||||
|
|
|
|
|
|
|
|||||||
| Cash paid for income taxes |
$ | 369 | $ | 192 | $ | 276 | ||||||
|
|
|
|
|
|
|
|||||||
| NONCASH INVESTING AND FINANCING ACTIVITIES: |
||||||||||||
| Vesting of restricted stock and early exercised stock options |
$ | 1,046 | $ | 61 | $ | 118 | ||||||
|
|
|
|
|
|
|
|||||||
| Conversion of convertible preferred stock to common stock |
$ | 53,620 | $ | — | $ | — | ||||||
|
|
|
|
|
|
|
|||||||
The accompanying notes are an integral part of these consolidated financial statements.
62
Table of Contents
IMPERVA, INC. AND SUBSIDIARIES
NOTES TO CONSOLIDATED FINANCIAL STATEMENTS
1. The Company and Summary of Significant Accounting Policies
Business
Imperva, Inc. (together with its subsidiaries, the “Company”) was incorporated in April 2002 in Delaware. The Company is headquartered in Redwood Shores, California and has subsidiaries located throughout the world including Israel, Asia and Europe. The Company is engaged in the development, marketing, sales, service and support of data security solutions that provide visibility and control over high value business data across critical systems within the data center.
Basis of Presentation
The accompanying consolidated financial statements have been prepared in accordance with U.S. generally accepted accounting principles (“GAAP”) and include all adjustments necessary for the fair presentation of the Company’s consolidated financial position, results of operations and cash flows for the periods presented. The consolidated financial statements include the accounts of Imperva Inc., its wholly-owned subsidiaries and one majority owned subsidiary, Incapsula, Inc. (“Incapsula”). All intercompany accounts and transactions have been eliminated in consolidation.
Initial Public Offering
In November 2011, the Company completed its initial public offering (“IPO”) of 5,500,000 shares of common stock at an offering price of $18.00 per share, resulting in net proceeds to the Company of approximately $86.2 million, after deducting underwriting discounts of $6.9 million and offering costs of $5.8 million that have been recorded as a reduction of the proceed. In connection with the IPO, the Company’s then outstanding shares of convertible preferred stock were automatically converted into an aggregate of 10,771,232 shares of common stock, and all then outstanding warrants to purchase convertible preferred stock were converted into warrants to purchase an aggregate of 8,333 shares of common stock.
Noncontrolling Interest
The Company has recorded a noncontrolling interest in its consolidated balance sheets, consolidated statements of operations and consolidated statements of convertible preferred stock and stockholders’ equity (deficit) for the 18%, 24%, and 42% ownership interest of the minority owners of Incapsula as of December 31, 2011, 2010 and 2009, respectively. Changes to the ownership interest in Incapsula held by the minority owners are accounted for as equity transactions in the consolidated statements of convertible preferred stock and stockholders’ equity (deficit) as the Company obtained control of Incapsula on November 5, 2009.
Use of Estimates
The preparation of the accompanying consolidated financial statements in conformity with GAAP requires management to make estimates and assumptions that affect the amounts reported in the consolidated financial statements and accompanying notes. Such management estimates include the fair value of accounts receivable, inventory, derivative instruments, common stock and convertible preferred stock warrants and assumptions used in the calculation of income taxes and stock-based compensation, among others. These estimates and assumptions are based on management’s best estimates and judgment. Management evaluates its estimates and assumptions on an ongoing basis using historical experience and other factors and adjusts such estimates and assumptions when facts and circumstances dictate. As future events and their effects cannot be determined with precision, actual results could differ significantly from these estimates.
Concentration of Supply Risk
The Company relies on a third party to manufacture its hardware appliances, and purchases its hardware appliances through such third party’s value-added resellers. Quality or performance failures of the Company’s products or changes in the Company’s suppliers’ financial or business condition could disrupt the Company’s ability to supply quality products to its customers and thereby have a material adverse effect on its business and consolidated financial statements.
Concentration of Credit Risk
Financial instruments that potentially subject the Company to a concentration of credit risk consist primarily of cash, cash equivalents, short-term investments, restricted cash and derivative financial instruments. The Company’s cash, cash equivalents, short-term investments and restricted cash are invested in high-quality instruments with banks and financial institutions located in the United States and Israel. Such deposits may be in excess of insured limits provided on such deposits.
63
Table of Contents
The Company uses derivative financial instruments to manage exposures to foreign currency risks. The Company’s derivatives expose it to credit risk to the extent that the counterparty may be unable to meet the terms of the agreement. The Company seeks to mitigate such risk by limiting its counterparties to those with high or investment-grade credit ratings. The Company does not require collateral under these agreements and has not historically experienced any losses due to credit risk or lack of performance by counterparties.
Derivative Financial Instruments
The Company uses forward foreign exchange contracts to reduce its exposure to foreign currency rate changes for operating expenses that are forecasted to be incurred in currencies other than U.S. dollars. The Company records all of its derivative instruments at their gross fair value on the consolidated balance sheet at each balance sheet date. The Company classifies its cash flows from derivative financial instruments as operating activities.
The accounting for changes in the fair value of a derivative instrument depends on whether the instrument has been designated and qualifies as a cash flow hedge for accounting purposes. For forward foreign exchange contracts that are designated and qualify as cash flow hedges, the effective portion of the gain or loss resulting from changes in the fair value of the derivative instruments is accounted for in accumulated other comprehensive income (loss) (“AOCI”) in the consolidated statements of convertible preferred stock and stockholders’ equity (deficit) and reclassified into operating expenses in the consolidated statements of operations in the period or periods during which the hedged transaction affects earnings. As of December 31, 2011, the Company estimated that $559,000 of net derivative losses included in accumulated other comprehensive income (loss) will be reclassified into earnings within the next 12 months. The ineffective portion of the gain or loss resulting from the change in fair value is recognized in other income (expense), net in the consolidated statements of operations.
Cash, Cash Equivalents and Short-Term Investments
The Company considers all highly liquid investments with a maturity of three months or less when purchased to be cash equivalents. Cash and cash equivalents consist of cash on hand, highly liquid investments in money market funds and various deposit accounts.
The Company considers all high quality investments purchased with original maturities at the date of purchase greater than three months and remaining maturities of less than one year from the balance sheet date to be short-term investments. Cash equivalents and short-term investments are classified as available-for-sale and are, therefore, recorded at fair value on the consolidated balance sheets, with any unrealized gains and losses reported in the consolidated statements of convertible preferred stock and stockholders’ equity (deficit) as a component of accumulated other comprehensive income (loss) until realized. The Company uses the specific-identification method to compute gains and losses on the investments. The amortized cost of securities is adjusted for amortization of premiums and accretion of discounts to maturity. Such amortization and accretion is included as a component of other income (expense), net in the consolidated statements of operations. Realized gains and losses and declines in value that are considered to be other than temporary are also recognized as a component of other income (expense), net in the consolidated statements of operations
Restricted Cash
The Company has restricted cash pledged as collateral representing a security deposit required for a facility lease, collateral for the Company’s contract manufacturer in regards to the Company’s obligation to purchase inventory, collateral for the Company’s subsidiary’s forward foreign exchange contracts and a corporate credit card facility. As of December 31, 2011 and 2010, the Company has classified $687,000 and $996,000, respectively, of restricted cash as a current asset relating to inventory purchase commitments, collateral for the Company’s subsidiary’s forward foreign exchange contracts and the corporate credit card facility. In addition, as of December 31, 2011 and 2010, the Company has classified $666,000 and $518,000, respectively, of security deposit as non-current assets relating to its facility lease arrangement.
Inventory
Inventory consists of finished goods hardware appliances and related component parts and is stated at the lower of cost or market value determined on an average cost basis. Inventory that is obsolete or in excess of forecasted demand is written down to its estimated realizable value. Inventory write-downs, once established, are not reversed as they establish a new cost basis for the inventory. The Company incurred an inventory write down of $396,000 and $59,000 for the years ended December 31, 2010 and 2009, respectively. For the year ended December 31, 2011, there was no inventory write-down incurred by the Company.
64
Table of Contents
Property and Equipment
Property and equipment, including leasehold improvements, are stated at cost less accumulated depreciation and amortization. Depreciation is computed using the straight-line method over the estimated useful lives of the related assets, generally two to seven years.
Leasehold improvements are amortized using the straight-line method over the shorter of the remaining lease term or the estimated useful lives of the assets. Upon the retirement or disposition of property and equipment, the related costs and accumulated depreciation is removed and any related gain or loss is recorded in the consolidated statements of operations. Repairs and maintenance that do not extend the life or improve an asset are expensed in the periods incurred.
Impairment of Long-Lived Assets
The Company evaluates its long-lived assets, which consist of property and equipment, for indicators of possible impairment when events or changes in circumstances indicate the carrying amount of an asset may not be recoverable. Impairment exists if the carrying amounts of such assets exceed the estimates of future net undiscounted cash flows expected to be generated by such assets. Should impairment exist, the impairment loss would be measured based on the excess carrying value of the asset over the asset’s estimated fair value. As of December 31, 2011, 2010 and 2009, the Company has not written down any of its long-lived assets as a result of impairment.
Revenue Recognition
The Company derives revenue from two sources: (i) products and license revenue, which includes hardware and perpetual software license revenue and (ii) services revenue, which includes maintenance and support, professional services, training and subscription arrangements. Substantially all of product and license sales have been sold in combination with maintenance and support services. Revenue is recognized when all of the following criteria are met: persuasive evidence of an arrangement exists; delivery or performance has occurred; the sales price is fixed or determinable; and collection is reasonably assured.
The Company defines each of the four criteria above as follows:
| • | Persuasive evidence of an arrangement exists. Evidence of an arrangement consists of a purchase order issued pursuant to the terms and conditions of a distributor or value-added reseller agreement and, in limited cases, an end user agreement and/or purchase order. |
| • | Delivery or performance has occurred. The Company uses shipping and related documents, or written evidence of customer acceptance, when applicable, to verify delivery or performance. The Company recognizes product revenue upon transfer of title and risk of loss, which primarily is upon shipment to value-added resellers, distributors or end users. The Company does not have significant obligations for future performance, such as customer acceptance provisions, rights of return or pricing credits, associated with its sales. |
| • | The sales price is fixed or determinable. The Company assesses whether the sales price is fixed or determinable based on payment terms and whether the sales price is subject to refund or adjustment. Standard payment terms to customers range from 30 to 90 days. In the event payment terms are provided that differ from the Company’s standard business practices, the fees are deemed to not be fixed or determinable and revenue is recognized when the payments become due, provided the remaining criteria for revenue recognition have been met. |
| • | Collection is reasonably assured. The Company assesses probability of collection on a customer-by-customer basis. The Company’s customers are subjected to a credit review process that evaluates their financial condition and ability to pay for products and services. If the Company concludes that collection is not reasonably assured based upon an initial review, the Company does not recognize revenue until payment is received. |
Maintenance and support and subscription revenue includes arrangements for software maintenance and technical support for the Company’s products and subscription services revenue primarily related to the Company’s cloud-based services. The terms of the Company’s subscription service arrangements do not provide customers the right to take possession of the related software. Maintenance and support is offered under renewable, fee-based contracts, which include technical support, hardware repair and replacement parts, bug fixes, patches and unspecified upgrades on a when-and-if-available basis. Maintenance and support and subscription revenue is initially deferred and recognized ratably over the life of the contract, with the related expenses recognized as incurred. Maintenance and support and subscription contracts usually have a term of one to three years. Unearned maintenance and support and subscription revenue is included in deferred revenue.
65
Table of Contents
Professional service revenue primarily consists of the fees the Company earns related to installation and consulting services. The Company recognizes revenue from professional services upon delivery or completion of performance. Professional service arrangements are typically short term in nature and are largely completed within 90 days from the start of service.
Training services are recognized upon delivery of the training.
Multiple Element Arrangements
In October 2009, the Financial Accounting Standards Board (“FASB”) amended the accounting standards for revenue recognition to remove from the scope of industry-specific software revenue recognition guidance any tangible products containing software components and non-software components that operate together to deliver the product’s essential functionality. In addition, the FASB amended the accounting standards for multiple element revenue arrangements not within the scope of industry-specific software revenue recognition guidance to:
| • | Provide updated guidance on whether multiple elements exist, how the elements in an arrangement should be separated, and how the arrangement consideration should be allocated to the separate elements; |
| • | Implement a price hierarchy, where the selling price for an element is based on vendor-specific objective evidence (“VSOE”), if available; third-party evidence (“TPE”), if available and VSOE is not available; or the best estimate of selling price (“BESP”), if neither VSOE or TPE is available; and |
| • | Eliminate the use of the residual method and require an entity to allocate arrangement consideration using the relative selling price method. |
The Company adopted this accounting guidance at the beginning of the first quarter of 2010 on a prospective basis for applicable transactions originating or materially modified after December 31, 2009. As a result of the adoption, net revenue for the year ended December 31, 2010, was approximately $1.5 million higher than the net revenue that would have been recorded under the previous accounting rules. Net loss and net loss per share of common stock for the year ended December 31, 2010, were approximately $1.3 million and $0.28 lower than the net loss and net loss per share of common stock that would have been recorded under the previous accounting rules. In terms of the timing and pattern of revenue recognition, the amended accounting guidance is not expected to have a significant effect on net revenue in periods after the initial adoption.
This guidance does not change the units of accounting for the Company’s revenue transactions. The Company’s non-software products and services qualify as separate units of accounting because they have value to the customer on a stand-alone basis and the Company’s revenue arrangements do not include a general right of return for delivered products.
Most of the Company’s products are hardware appliances containing software components that function together to provide the essential functionality of the product. Therefore, the Company’s hardware appliances are considered non-software deliverables and have been removed from the industry-specific software revenue recognition guidance.
The Company’s product revenue also includes revenue from the sale of stand-alone software products. Stand-alone software may operate on the Company’s hardware appliance, but is not considered essential to the functionality of the hardware and continues to be subject to the industry-specific software revenue recognition guidance, which remains unchanged.
Certain of the Company’s stand-alone software when sold with hardware appliances is considered essential to its functionality and as a result is no longer accounted for under industry-specific software revenue recognition guidance; however, this same software when sold separately is accounted for under the industry-specific software revenue recognition guidance. Additionally, the Company provides unspecified software upgrades for its products, on a when-and-if available basis, and hardware replacements through maintenance and support contracts. These support arrangements when sold on a stand-alone basis would continue to be subject to the industry specific software revenue recognition guidance.
For stand-alone software sales after December 31, 2009 and for all transactions entered into prior to the first quarter of 2010, the Company recognizes revenue based on software revenue recognition guidance. Under the software revenue recognition guidance, the Company uses the residual method to recognize revenue when a product agreement includes one or more elements to be delivered at a future date and VSOE of the fair value of all undelivered elements exists. In the majority of the Company’s contracts, the only element that remains undelivered at the time of delivery of the product is maintenance and support services. Under the residual method, the VSOE of fair value of the undelivered elements is deferred and the remaining portion of the contract fee is recognized as product revenue. If evidence of the VSOE of fair value of one or more undelivered elements does not exist, all revenue is generally deferred and recognized when delivery of those elements occurs or when fair value can be established.
66
Table of Contents
For all other transactions originating or materially modified after December 31, 2009, the Company recognizes revenue in accordance with the amended accounting guidance. For certain arrangements with multiple deliverables, the Company allocates the arrangement fee to the non-software element based upon the relative selling price of such element and, if software and software-related elements (e.g., maintenance and support for the software element) are also included in the arrangement, the Company allocates the arrangement fee to each of those software and software-related elements as a group. After such allocations are made, the amount of the arrangement fee allocated to the software and software-related elements is accounted for using the residual method. When applying the relative selling price method, the Company determines the selling price for each element using VSOE of selling price, if it exists, or if not, TPE of selling price, if it exists. If neither VSOE nor TPE of selling price exist for an element, the Company uses its BESP for that element. The revenue allocated to each element is then recognized when the basic revenue recognition criteria are met for that element. The Company limits the amount of revenue recognized for delivered elements to the amount that is not contingent on the future delivery of products or services, or subject to our future performance obligation.
Consistent with the Company’s methodology under previous accounting guidance, VSOE of fair value for elements of an arrangement is based upon the normal pricing and discounting practices for those services when sold separately. In determining VSOE, the Company requires that a substantial majority of the selling prices for a service fall within a reasonably narrow pricing range, evidenced by a substantial majority of such historical stand-alone transactions falling within a reasonably narrow range of the median rates. In addition, the Company considers major service groups and geographies in determining VSOE.
The Company is typically not able to determine TPE for its products or services. TPE is determined based on competitor prices for similar deliverables when sold separately. Generally, the Company’s go-to-market strategy differs from that of its peers and its offerings contain a significant level of differentiation such that the comparable pricing of products with similar functionality cannot be obtained. Furthermore, the Company is unable to reliably determine what similar competitor products’ selling prices are on a stand-alone basis.
When the Company is unable to establish the selling price of its non-software deliverables using VSOE or TPE, the Company uses BESP in its allocation of arrangement consideration. The objective of BESP is to determine the price at which the Company would transact a sale if the product or service were sold on a stand-alone basis. The Company determines BESP for the purposes of allocating the arrangement by reviewing external and internal market factors including, but not limited to, pricing practices including discounting, the geographies in which the Company offers its products and services, the type of customer (i.e., distributor, value added reseller or direct end user) and competition. Additionally, the Company considers historical transactions, including transactions whereby the deliverable was sold on a stand-alone basis. The determination of BESP is made through consultation with and approval by the Company’s management. Selling prices are analyzed on a quarterly basis to identify if the Company has experienced significant changes in its selling prices.
For its non-software deliverables the Company allocates the arrangement consideration based on the relative selling price of the deliverables. For its hardware appliances the Company uses BESP as its selling price. For its maintenance and support, professional services and training, the Company primarily uses VSOE as the selling price and when the Company is unable to establish a selling price using VSOE, it uses BESP.
Deferred Revenue
Deferred revenue represents amounts invoiced to customers for which the related revenue has not been recognized because one or more of the revenue recognition criteria have not been met. The current portion of the deferred revenues represents the amount that is expected to be recognized as revenue within one year of the consolidated balance sheet date.
Accounts Receivable and Allowance for Doubtful Accounts
Accounts receivable are recorded at invoiced amounts, net of allowances for doubtful accounts if applicable, and do not bear interest.
The Company generally does not require collateral from its customers; however, in certain circumstances, may require letters of credit, other collateral, additional guarantees or advance payments. The allowance for doubtful accounts is based on the Company’s assessment of the collectability of its customer accounts. The Company regularly reviews its accounts receivable that remain outstanding past their applicable payment terms and establishes allowance and potential write-offs by considering certain factors such as historical experience, industry data, credit quality, age of balances and current economic conditions that may affect a customers’ ability to pay.
67
Table of Contents
Concentration of Revenue and Accounts Receivable
Significant customers are those which represent more than 10% of the Company’s total revenue or gross accounts receivable balance at each respective balance sheet date. For the years ended December 31, 2011, 2010 and 2009, the Company did not have any customers that represented more than 10% of the Company’s total revenue. There were no customers who represented greater than 10% of gross accounts receivable as of December 31, 2011. As of December 31, 2010, one customer represented 15% of gross accounts receivable.
Shipping and Handling Costs
Costs related to shipping and handling are included in cost of revenue.
Research and Development Costs
Research and development costs, including direct and allocated expenses, are expensed as incurred.
Software Development Costs
The costs to develop software have not been capitalized as the Company believes that the technological feasibility of the related software is not established until substantially all product development is complete.
Warranty Costs
The Company generally provides a 60-day warranty on hardware appliance products and software from the date of shipment to customers. To date, cost to repair or replace items sold to customers has been insignificant.
Advertising Costs
The Company expenses advertising costs as incurred. Advertising expense is included within sales and marketing expense in the consolidated statements of operations. For the years ended December 31, 2011, 2010 and 2009, advertising expenses were insignificant.
Retirement Savings Plan
The Company maintains a defined contribution 401(k) retirement savings plan for its U.S. employees. Each participant in the 401(k) retirement savings plan may elect to contribute a percentage of his or her annual compensation up to a specified maximum amount allowed under U.S. Internal Revenue Service regulations. There were no employer contributions to the 401(k) retirement savings plan for the years ended December 31, 2011, 2010 and 2009.
Severance Pay Asset and Liability
The Company has recorded a severance pay asset and liability on its consolidated balance sheets related to its employees located in Israel. The Company’s liability for severance pay is calculated pursuant to Israeli severance pay law based on the most recent salary for the employees multiplied by the number of years of employment, as of the respective balance sheet date. Employees are entitled to one month salary for each year of employment or a portion thereof. The Company’s liability at each respective balance sheet date for all of its Israeli employees is fully accrued in the accompanying consolidated financial statements and is mainly funded through monthly deposits to the employee’s pension and management insurance policies. The carrying value of these policies is recorded as a severance fund asset in the Company’s consolidated balance sheets.
The deposited funds may be withdrawn only upon the fulfillment of the obligation pursuant to Israeli severance pay law. The carrying value of the deposited funds is based on the cash surrender value of these policies and includes profits accumulated through the respective balance sheet date. The Company recognized severance expense related to the Israeli severance pay law during the years ended December 31, 2011, 2010 and 2009 of $990,000, $794,000, and $550,000, respectively.
Income Taxes
The Company accounts for income taxes in accordance with the Financial Accounting Standards Board (“FASB”) Accounting Standards Codification No. 740 (“ASC 740”), Accounting for Income Taxes. The Company makes certain estimates and judgments in determining income tax expense for financial statement purposes. These estimates and judgments occur in the calculation of tax credits, tax benefits and deductions and in the calculation of certain tax assets and liabilities, which arise from differences in the timing of recognition of revenue and expense for tax and financial statement purposes. Significant changes to these estimates may result in an increase or decrease to our tax provision in the subsequent period when such a change in estimate occurs.
68
Table of Contents
The Company uses the liability method for accounting for deferred income taxes, which requires recognition of deferred income tax assets and liabilities for the expected future tax consequences of events that have been recognized in its financial statements, but have not been reflected in its taxable income. Estimates and judgments occur in the calculation of certain tax liabilities and in the determination of the recoverability of certain deferred income tax assets, which arise from temporary differences and carryforwards. Deferred income tax assets and liabilities are measured using the currently enacted tax rates that apply to taxable income in effect for the years in which those tax assets and liabilities are expected to be realized or settled. The Company regularly assesses the likelihood that its deferred income tax assets will be realized from recoverable income taxes or recovered from future taxable income based on the realization criteria set forth in ASC 740. To the extent that the Company believes any amounts are more likely not to be realized, the Company records a valuation allowance to reduce the deferred income tax assets. In the event the Company determines that all or part of the net deferred tax assets are not realizable in the future, an adjustment to the valuation allowance would be charged to earnings in the period such determination is made. Similarly, if the Company subsequently realizes deferred income tax assets that were previously determined to be unrealizable, the respective valuation allowance would be reversed, resulting in an adjustment to earnings in the period such determination is made.
In addition, the calculation of the Company’s tax liabilities involves addressing uncertainties in the application of complex tax regulations. The Company recognizes and measures potential liabilities based upon criteria set forth in ASC 740. Based upon these criteria, the Company estimates whether, and the extent to which, additional taxes will be due. If payment of these amounts ultimately proves to be unnecessary, the reversal of the liabilities may result in tax benefits being recognized in the period when the Company determines the liabilities are no longer necessary. If the Company’s estimate of tax liabilities is less than the amount ultimately assessed, a further charge to expense would result.
Significant judgment is required in determining any valuation allowance recorded against deferred income tax assets. In assessing the need for a valuation allowance, the Company considers all available evidence, including past operating results, estimates of future taxable income, and the feasibility of tax planning strategies. In the event that the Company changes its determination as to the amount of deferred income tax assets that could be realized, it will adjust its valuation allowance with a corresponding effect to the provision for income taxes in the period in which such determination is made.
Significant judgment is also required in evaluating the Company’s uncertain tax positions under ASC 740 and determining its provision for income taxes. Although the Company believes its reserves for uncertain tax positions are reasonable, no assurance can be given that the final tax outcome of these matters will not be different from that which is reflected in the Company’s historical income tax provisions and accruals. The Company adjusts these reserves in light of changing facts and circumstances, such as the closing of a tax audit or the refinement of an estimate. To the extent that the final tax outcome of these matters is different from the amounts recorded, such differences will affect the provision for income taxes in the period in which such determination is made. The provision for income taxes includes the effect of reserves for uncertain tax positions and any changes to the reserves that are considered appropriate, as well as the related net interest and penalties, if applicable.
Liability Associated with Warrants to Purchase Convertible Preferred Stock
The Company accounts for freestanding warrants to purchase shares of convertible preferred stock that are contingently redeemable as liabilities on the consolidated balance sheet at their estimated fair value because the warrants may obligate the Company to redeem these warrants at some point in the future. At the end of each reporting period, changes in the estimated fair value of the warrants to purchase shares of the convertible preferred stock are recorded through other income (expense), net in the consolidated statements of operations. In connection with our IPO, the warrants to purchase convertible preferred stock were converted into warrants to purchase common stock. Accordingly, as of December 31, 2011, there were no outstanding warrants to purchase shares of convertible preferred stock.
Stock-Based Compensation
Compensation costs related to employee stock option grants are based on the fair value of the options on the date of grant, net of estimated forfeitures. The Company determines the grant date fair value of the options using the Black-Scholes option-pricing model and the related stock-based compensation expense is generally recognized on a straight-line basis over the period in which an employee is required to provide service in exchange for the options, or the vesting period of the respective options.
69
Table of Contents
Foreign Currency
The functional currency of the Company’s foreign subsidiaries is the U.S. dollar. Transactions denominated in currencies other than the functional currency are remeasured to the functional currency at the average exchange rate in effect during the period. At the end of each reporting period, monetary assets and liabilities are re-measured to the functional currency using exchange rates in effect at the balance sheet date. Non-monetary assets and liabilities are re-measured at historical exchange rates. Gains and losses related to remeasurement are recorded in other income (expense) in the consolidated statements of operations.
Comprehensive Income (Loss)
Comprehensive income (loss) is presented in the consolidated statements of convertible preferred stock and stockholders’ equity (deficit). Comprehensive income (loss) is comprised of net loss and other comprehensive income (loss). For the Company, other comprehensive income (loss) consists of changes in unrealized gains and losses on the Company’s available-for-sale securities and the effective portion of unrealized gains and losses on the Company’s derivative instruments designated as hedges for accounting purposes.
Fair Value of Financial Instruments
The Company measures and reports its cash equivalents, short-term investments, derivative instruments, the Israeli severance pay fund assets, and the liability associated with the warrants to purchase convertible preferred stock at fair value. Fair value is defined as the exchange price that would be received for an asset or an exit price paid to transfer a liability in the principal or most advantageous market for the asset or liability in an orderly transaction between market participants on the measurement date. Valuation techniques used to measure fair value must maximize the use of observable inputs and minimize the use of unobservable inputs. The fair value hierarchy defines a three-level valuation hierarchy for disclosure of fair value measurements as follows:
Level I—Unadjusted quoted prices in active markets for identical assets or liabilities;
Level II—Inputs other than quoted prices included within Level I that are observable, unadjusted quoted prices in markets that are not active, or other inputs that are observable or can be corroborated by observable market data for substantially the full term of the related assets or liabilities; and
Level III—Unobservable inputs that are supported by little or no market activity for the related assets or liabilities.
The categorization of a financial instrument within the valuation hierarchy is based upon the lowest level of input that is significant to the fair value measurement.
The Company’s financial instruments consist of Level I and Level II assets and Level III liabilities. Level I securities include highly liquid money market funds. Level II instruments include deposits maintained with financial institutions and derivative instruments. Level III liabilities that are measured at fair value on a recurring basis consist of preferred stock warrant liabilities. The fair values of the outstanding convertible preferred stock warrants are measured using the Black-Scholes option-pricing model. Inputs used to determine estimated fair value include the estimated fair value of the underlying stock at the valuation measurement date, the remaining contractual term of the warrants, risk-free interest rates, expected dividends and the expected volatility of the underlying stock.
Net Loss per Share of Common Stock
The Company’s basic net loss per share of common stock is calculated by dividing the net loss attributable to common stockholders by the weighted-average number of shares of common stock outstanding for the period. The weighted-average number of shares of common stock used to calculate the Company’s basic net loss per share of common stock excludes those shares subject to repurchase as these shares are not deemed to be issued for accounting purposes until they vest. The diluted net loss per share of common stock is computed by giving effect to all potential common stock equivalents outstanding for the period determined using the treasury-stock method. For purposes of this calculation, convertible preferred stock, stock options to purchase common stock, common stock subject to repurchase, warrants to purchase convertible preferred stock and warrants to purchase common stock are considered to be common stock equivalents. Basic and diluted net loss per share of common stock was the same for each period presented as the inclusion of all potential common shares outstanding was anti-dilutive.
70
Table of Contents
Segment Information
Operating segments are components of an enterprise for which separate financial information is available and is evaluated regularly by the Company’s chief operating decision maker in deciding how to allocate resources and in assessing performance. The Company’s chief operating decision maker is the Chief Executive Officer.
The Company has two operating segments which are both reportable business segments: (i) Imperva, which is comprised of Imperva’s and its wholly-owned subsidiaries’ financial position and results of operations; and (ii) Incapsula, which is comprised of Incapsula’s financial position and results from operations. The Company operated as one reporting segment until its investment in Incapsula in November 2009.
Recent Accounting Pronouncements
From time to time, new accounting pronouncements are issued by the Financial Accounting Standards Board (“FASB”) or other standard setting bodies that are adopted by us as of the specified effective date. Unless otherwise discussed, we believe that the impact of recently issued standards that are not yet effective will not have a material impact on its financial position or results of operations upon adoption,
In January 2010, the FASB issued ASU 2010-06, Fair Value Measurements and Disclosures. ASU 2010-06 requires disclosures about inputs and valuation techniques used to measure fair value as well as disclosures about significant transfers, beginning in the first quarter of 2010. Additionally, these amended standards require presentation of disaggregated activity within the reconciliation for fair value measurements using significant unobservable inputs (Level 3), beginning in the first quarter of 2011. The adoption of this new standard did not have a significant impact on the Company’s consolidated financial statements.
In May 2011, the FASB issued ASU 2011-04, Fair Value Measurement: Amendments to Achieve Common Fair Value Measurement and Disclosure Requirements in U.S. GAAP and IFRS. ASU 2011-04 amends the fair value measurement guidance and includes some enhanced disclosure requirements. The most significant change in disclosures is an expansion of the information required for Level 3 measurements based on unobservable inputs. The standard is effective for fiscal years beginning after December 15, 2011. The Company is currently evaluating the impact of adopting the guidance on its consolidated financial statements.
In June 2011, the FASB issued an ASU No. 2011-5, Comprehensive Income. ASU No. 2011-5 requires companies to present comprehensive income in a single statement below net income or in a separate statement of comprehensive income immediately following the income statement. This update does not change which items are reported in other comprehensive income or the requirement to report reclassifications of items from other comprehensive income to net income. This requirement will become effective for us beginning with the Quarterly Report on Form 10-Q for the quarter ended March 31, 2012 and will require retrospective application for all periods presented.
In September 2011, the FASB issued an ASU No. 2011-08, Intangibles —Goodwill and Other. Under ASU 2011-08, an entity has the option to first assess qualitative factors to determine whether the existence of events or circumstances leads to a determination that it is more likely than not that the fair value of a reporting unit is less than its carrying amount. If the entity determines that this threshold is not met, then performing the two-step impairment is unnecessary. ASU 2011-08 is effective for fiscal years beginning after December 15, 2011. The adoption of this guidance is not expected to have a material impact on our consolidated financial statements.
Reverse Stock Split
In September 2011, the Company’s board of directors approved an amended and restated certificate of incorporation effecting a 1-for-2 reverse stock split of the Company’s issued and outstanding shares of common stock and convertible preferred stock. An amendment to the amended and restated certificate of incorporation was filed on November 7, 2011 effecting the 1-for-2 reverse stock split. The par value of the common and convertible preferred stock was not adjusted as a result of the reverse stock split. All issued and outstanding common stock, convertible preferred stock, warrants for preferred stock, and per share amounts contained in the Company’s consolidated financial statements have been retroactively adjusted to reflect this reverse stock split for all periods presented.
2. Incapsula
On November 5, 2009, the Company entered into a license agreement for Incapsula to use certain developed technology of the Company. In lieu of any other fee or royalty under the license agreement, Incapsula issued to the Company 5,000,000 shares of its Series A Convertible Preferred Stock representing a 58% ownership interest at the date of issuance. The transaction was accounted for as a business combination. No value was assigned to the license on the acquisition date as the use of the license will stay within the control of the Company. Therefore, the Company’s historical carrying value of the developed technology immediately prior to the acquisition was used to determine the value of the purchase consideration exchanged in the transaction. As Incapsula was a newly-formed entity with no net assets on the acquisition date and the value of the license was determined to be zero, no goodwill was recorded by the Company on the acquisition.
71
Table of Contents
Under the terms of the agreements between the Company and Incapsula, the Company has the right, but not the obligation, to purchase the remaining ownership interest in Incapsula commencing on November 5, 2013 and ending on November 5, 2018 (the “Purchase Right”). Exercise of the Purchase Right is solely within the Company’s control and the price for the remaining ownership interest will be based on an Incapsula enterprise valuation calculated as the greater of (i) eight times Incapsula’s prior 12 months trailing revenues or (ii) seven times the aggregate amount Incapsula has raised in connection with its Series A Convertible Preferred Stock financings. On the acquisition date, no value was assigned to this Purchase Right as the option does not meet the definition of a derivative instrument as it does not contain a net settlement feature. Specifically, the Purchase Right can only be gross physically settled as Incapsula is a non-publicly traded company whose stock is not readily convertible to cash.
On March 9, 2010, the Company entered into a Series A and Series A-1 Purchase Agreement whereby Incapsula issued 6,666,666 shares of its Series A Convertible Preferred Stock to the Company in exchange for cash consideration of $3.0 million. As a result of this transaction, the Company increased its ownership interest in Incapsula to 76% at the date of issuance. The purchase of the additional ownership interest in Incapsula was treated as an equity transaction.
Under the terms of the Series A and Series A-1 Purchase Agreement, the Company entered into a forward contract with Incapsula to purchase 8,750,000 shares of Incapsula’s Series A-1 Convertible Preferred Stock in exchange for $7.0 million in cash consideration if certain milestones were achieved no later than September 2011. On the transaction date, no value was assigned to the forward contract as the option did not meet the definition of a derivative instrument as it did not contain a net settlement feature. Specifically, the forward contract could only be gross physically settled as Incapsula is a non-publicly traded company whose stock was not readily convertible to cash.
In July 2011, Incapsula achieved the respective performance milestones. As a result, the Company purchased 4,375,000 shares of Incapsula’s Series A-1 Preferred Stock for $3.5 million thereby increasing its ownership interest to 82%. In January 2012, the Company purchased the remaining 4,375,000 shares of Incapsula’s Series A-1 Preferred Stock for $3.5 million thereby increasing its ownership interest in Incapsula to 85% at the date of issuance.
As of December 31, 2011 and 2010, all of the outstanding shares of Incapsula’s Series A and A-1 Convertible Preferred Stock are held by the Company.
In March 2010, the board of directors of Incapsula adopted the Incapsula 2010 Share Incentive Plan pursuant to which Incapsula may grant to its employees options to purchase shares of Incapsula’s common stock or restricted shares. If the Company exercises the Purchase Right option discussed above, awards under the Incapsula 2010 Share Incentive Plan would be assumed by the Company, substituted with Company stock options or cashed out, and all outstanding awards and the Incapsula 2010 Share Plan would terminate.
3. Cash, Cash Equivalents and Short-Term Investments
Cash, cash equivalents and short-term investments consist of the following (in thousands):
| As of December 31, 2011 | ||||||||||||||||
| Amortized Cost |
Gross Unrealized Gains |
Gross Unrealized Losses |
Fair Value |
|||||||||||||
| Cash and cash equivalents: |
||||||||||||||||
| Bank deposits |
$ | 46,023 | $ | — | $ | — | $ | 46,023 | ||||||||
| Money market funds |
50,002 | — | — | 50,002 | ||||||||||||
|
|
|
|
|
|
|
|
|
|||||||||
| Total |
$ | 96,025 | $ | — | $ | — | $ | 96,025 | ||||||||
|
|
|
|
|
|
|
|
|
|||||||||
| Short-term investments-Mutual funds |
$ | 1,644 | $ | — | $ | 57 | $ | 1,587 | ||||||||
|
|
|
|
|
|
|
|
|
|||||||||
72
Table of Contents
| As of December 31, 2010 | ||||||||||||||||
| Amortized Cost |
Gross Unrealized Gains |
Gross Unrealized Losses |
Fair Value |
|||||||||||||
| Cash and cash equivalents—Bank deposits |
$ | 16,410 | $ | — | $ | — | $ | 16,410 | ||||||||
|
|
|
|
|
|
|
|
|
|||||||||
| Short-term investments: |
||||||||||||||||
| Mutual funds |
$ | 354 | $ | 2 | $ | — | $ | 356 | ||||||||
| Time deposits |
889 | — | — | 889 | ||||||||||||
|
|
|
|
|
|
|
|
|
|||||||||
| Total |
$ | 1,243 | $ | 2 | $ | — | $ | 1,245 | ||||||||
|
|
|
|
|
|
|
|
|
|||||||||
4. Fair Value of Financial Instruments
The Company evaluates assets and liabilities subject to fair value measurements on a recurring basis to determine the appropriate level to classify them for each reporting period. The following table sets forth the Company’s assets and liabilities that were measured at fair value as of December 31, 2011 and 2010, by level within the fair value hierarchy (in thousands):
| As of December 31, 2011 | ||||||||||||||||
| Level I | Level II | Level III | Fair Value | |||||||||||||
| Financial Assets |
||||||||||||||||
| Cash and cash equivalents: |
||||||||||||||||
| Bank deposits |
$ | 46,023 | $ | — | $ | — | $ | 46,023 | ||||||||
| Money market funds |
50,002 | — | — | 50,002 | ||||||||||||
| Short-term investments—Mutual funds |
1,587 | — | — | 1,587 | ||||||||||||
|
|
|
|
|
|
|
|
|
|||||||||
| Total financial assets |
$ | 97,612 | $ | — | $ | — | $ | 97,612 | ||||||||
|
|
|
|
|
|
|
|
|
|||||||||
| Financial Liability |
||||||||||||||||
| Accrued and other current liabilities—Forward foreign exchange contracts |
$ | — | $ | 631 | $ | — | $ | 631 | ||||||||
|
|
|
|
|
|
|
|
|
|||||||||
| As of December 31, 2010 | ||||||||||||||||
| Level I | Level II | Level III | Fair Value | |||||||||||||
| Financial Assets |
||||||||||||||||
| Cash and cash equivalents—Bank deposits |
$ | 16,410 | $ | — | $ | — | $ | 16,410 | ||||||||
| Short-term investments: |
||||||||||||||||
| Mutual funds |
356 | — | — | 356 | ||||||||||||
| Time deposits |
— | 889 | — | 889 | ||||||||||||
| Prepaid expenses and other current assets—Forward foreign exchange contracts |
— | 729 | — | 729 | ||||||||||||
|
|
|
|
|
|
|
|
|
|||||||||
| Total financial assets |
$ | 16,766 | $ | 1,618 | $ | — | $ | 18,384 | ||||||||
|
|
|
|
|
|
|
|
|
|||||||||
| Financial Liability |
||||||||||||||||
| Convertible preferred stock warrant liability |
$ | — | $ | — | $ | 69 | $ | 69 | ||||||||
|
|
|
|
|
|
|
|
|
|||||||||
73
Table of Contents
In addition to the amounts disclosed in the above table, the fair value of the Company’s Israeli severance pay assets, which were comprised of Level II assets, was $2.7 million and $2.2 million as of December 31, 2011 and 2010, respectively.
The following table sets forth a summary of the changes in the fair value of the Company’s Level III financial liabilities (in thousands):
| Year ended December 31, | ||||||||
| 2011 | 2010 | |||||||
| Fair value—beginning of year |
$ | 69 | $ | 55 | ||||
| Change in fair value of convertible preferred stock warrant liability |
238 | 14 | ||||||
| Reclassification to additional paid-in capital upon conversion to common stock warrants |
(129 | ) | — | |||||
| Reclassification to preferred stock upon exercise of warrants |
(178 | ) | — | |||||
|
|
|
|
|
|||||
| Fair value—end of year |
$ | — | $ | 69 | ||||
|
|
|
|
|
|||||
At December 31, 2010, the Company re-measured the convertible preferred stock warrant liability to fair value using the Black-Scholes option-pricing model with the following assumptions:
| Dividend rate |
0 | % | ||
| Risk-free interest rate |
2.0 | % | ||
| Remaining contractual life (in years) |
5.0 | |||
| Expected volatility |
54 | % |
5. Derivative Instruments
The Company’s primary objective for holding derivative instruments is to reduce its exposure to foreign currency rate changes. The Company reduces its exposure by entering into forward foreign exchange contracts with respect to operating expenses that are forecast to be incurred in currencies other than U.S. dollars. Substantially all of the Company’s revenue and capital purchasing activities and a majority of its operating expenditures are transacted in U.S. dollars. However, certain operating expenditures are incurred in or exposed to other currencies, primarily the Israeli shekel.
The Company has established forecasted transaction currency risk management programs to protect against fluctuations in fair value and the volatility of future cash flows caused by changes in exchange rates. The Company’s currency risk management program includes forward foreign exchange contracts designated as cash flow hedges. These forward foreign exchange contracts generally mature within 12 months.
Derivative instruments measured at fair value and their classification on the consolidated balance sheets are presented in the following tables (in thousands):
| Asset/(Liability) as
of December 31, |
||||||||||||||||
| 2011 | 2010 | |||||||||||||||
| Notional Amount |
Fair Value |
Notional Amount |
Fair Value |
|||||||||||||
| Forward foreign exchange contracts included in prepaid expenses and other current assets/(accrued and other current liabilities) |
$ | 20,135 | $ | (631 | ) | $ | 8,355 | $ | 729 | |||||||
74
Table of Contents
Gains (losses) on derivative instruments accounted for as hedges and their classification on the consolidated statement of operations, are presented in the following tables (in thousands):
| Gains/(Losses) Recognized in OCI - Effective Portion |
Gains/(Losses) Reclassified from AOCI into Net Loss - Effective Portion |
Gains/(Losses) Recognized – Ineffective Portion and Amount Excluded from Effectiveness Testing |
||||||||||||||||||||||||||||||||||||||
| Year Ended Dec. 31, 2011 |
Year Ended Dec. 31, 2010 |
Year Ended Dec. 31, 2009 |
Year Ended Dec. 31, 2011(a) |
Year Ended Dec. 31, 2010(b) |
Year Ended Dec. 31, 2009 |
Location | Year Ended Dec. 31, 2011 |
Year Ended Dec. 31, 2010 |
Year Ended Dec. 31, 2009 |
|||||||||||||||||||||||||||||||
| Cash flow hedges: |
||||||||||||||||||||||||||||||||||||||||
| Forward foreign exchange contracts |
$ | (1,231 | ) | $ | 518 | $ | 151 | $ | 220 | $ | 105 | $ | — | |
Other income and expense |
|
$ | (38 | ) | $ | 315 | $ | 24 | |||||||||||||||||
| (a) | Includes gains/(losses) reclassified from accumulated other comprehensive income (loss) into net loss for the effective portion of cash flow hedges, of which $16 and $204 were recognized within cost of sales and operating expenses, respectively, within the consolidated statement of operations for the year ended December 31, 2011. |
| (b) | Includes gains/(losses) reclassified from accumulated other comprehensive income (loss) into net loss for the effective portion of cash flow hedges, of which $10 and $95 were recognized within cost of sales and operating expenses, respectively, within the consolidated statement of operations for the year ended December 31, 2010. |
6. Consolidated Balance Sheet Components
Accounts Receivable Allowance for Doubtful Accounts
The allowance for doubtful accounts is comprised of the following activity (in thousands):
| Years Ended December 31, | ||||||||||||
| 2011 | 2010 | 2009 | ||||||||||
| Allowance for doubtful accounts, beginning balance |
$ | 407 | $ | 368 | $ | 398 | ||||||
| Charged to costs and expenses |
202 | 58 | — | |||||||||
| Recoveries |
(37 | ) | — | (30 | ) | |||||||
| Deductions (write-offs) |
(347 | ) | (19 | ) | — | |||||||
|
|
|
|
|
|
|
|||||||
| Allowance for doubtful accounts, ending balance |
$ | 225 | $ | 407 | $ | 368 | ||||||
|
|
|
|
|
|
|
|||||||
Prepaid and Other Current Assets
Prepaid and other current assets consist of the following (in thousands):
| As of December 31, | ||||||||
| 2011 | 2010 | |||||||
| Prepaid expenses |
$ | 1,189 | $ | 714 | ||||
| Derivative asset |
— | 729 | ||||||
| Deferred cost of revenue |
84 | 126 | ||||||
| Other |
79 | 140 | ||||||
|
|
|
|
|
|||||
| Total prepaid and other current assets |
$ | 1,352 | $ | 1,709 | ||||
|
|
|
|
|
|||||
Property and Equipment
Property and equipment consist of the following (in thousands):
| As of December 31, | ||||||||
| 2011 | 2010 | |||||||
| Computers and related equipment |
$ | 5,435 | $ | 5,185 | ||||
| Office furniture and equipment |
1,156 | 983 | ||||||
| Leasehold improvements |
1,822 | 1,659 | ||||||
|
|
|
|
|
|||||
| Total property and equipment |
$ | 8,413 | $ | 7,827 | ||||
| Less accumulated depreciation and amortization |
(4,387 | ) | (3,726 | ) | ||||
|
|
|
|
|
|||||
| Total property and equipment, net |
$ | 4,026 | $ | 4,101 | ||||
|
|
|
|
|
|||||
75
Table of Contents
Depreciation and amortization expense totaled $1.5 million, $1.2 million and $0.7 million, and for the years ended December 31, 2011, 2010 and 2009, respectively.
Accrued Compensation and Benefits
Accrued compensation and benefits consist of the following (in thousands):
| As of December 31, | ||||||||
| 2011 | 2010 | |||||||
| Salary and related benefits |
$ | 1,895 | $ | 2,167 | ||||
| Accrued vacation |
2,839 | 2,190 | ||||||
| Accrued incentive payments |
2,757 | 1,511 | ||||||
|
|
|
|
|
|||||
| Total accrued compensation and benefits |
$ | 7,491 | $ | 5,868 | ||||
|
|
|
|
|
|||||
Accrued and Other Current Liabilities
Accrued and other current liabilities consist of the following (in thousands):
| As of December 31, | ||||||||
| 2011 | 2010 | |||||||
| Accrued expenses |
$ | 2,182 | $ | 2,074 | ||||
| Income tax payable |
500 | 662 | ||||||
| Advances from customers |
— | 658 | ||||||
| Short-term deferred rent |
235 | 161 | ||||||
| Short-term stock repurchase liability |
860 | 783 | ||||||
| Derivative liability |
631 | — | ||||||
| Other |
— | 181 | ||||||
|
|
|
|
|
|||||
| Total accrued and other current liabilities |
$ | 4,408 | $ | 4,519 | ||||
|
|
|
|
|
|||||
Other Long-term Liabilities
Other long-term liabilities consist of the following (in thousands):
| As of December 31, | ||||||||
| 2011 | 2010 | |||||||
| Stock repurchase liability |
$ | 2,198 | $ | 2,296 | ||||
| Other |
658 | 595 | ||||||
|
|
|
|
|
|||||
| Total other long-term liabilities |
$ | 2,856 | $ | 2,891 | ||||
|
|
|
|
|
|||||
76
Table of Contents
7. Other Income (Expense), net
Other income (expense), net is comprised of the following (in thousands):
| Years Ended December 31, | ||||||||||||
| 2011 | 2010 | 2009 | ||||||||||
| Other Income: |
||||||||||||
| Interest income |
$ | 28 | $ | 162 | $ | 202 | ||||||
| Forward foreign exchange contract gains, net |
— | 417 | 24 | |||||||||
| Foreign currency exchange gains, net |
203 | 41 | 10 | |||||||||
|
|
|
|
|
|
|
|||||||
| Total |
231 | 620 | 236 | |||||||||
| Other Expense: |
||||||||||||
| Convertible preferred stock warrant liability losses |
(238 | ) | (14 | ) | — | |||||||
| Forward foreign exchange contract losses, net |
(39 | ) | — | — | ||||||||
| Other |
(144 | ) | (132 | ) | (58 | ) | ||||||
|
|
|
|
|
|
|
|||||||
| Total |
(421 | ) | (146 | ) | (58 | ) | ||||||
|
|
|
|
|
|
|
|||||||
| Total other income (expense), net |
$ | (190 | ) | $ | 474 | $ | 178 | |||||
|
|
|
|
|
|
|
|||||||
8. Debt
Revolving Credit Facility
In September 2010, the Company entered into a revolving credit facility with a financial institution. The agreement, as amended, provides for maximum borrowing capacity of $3.0 million as of December 31, 2010 and up to $6.0 million as of December 31, 2011. As of December 31, 2011, there was no balance outstanding on the credit facility. The Company had $0.5 million outstanding on the credit facility at December 31, 2010.
The credit facility expires on October 15, 2012, is secured by the assets of the Company, and contains a restrictive covenant that requires the Company to maintain a minimum cash and cash equivalents balance of $3.0 million. The terms of this agreement requires payment of an unused line fee of 0.25% per quarter of the unused portion and bears interest at LIBOR plus 2.75% as of December 31, 2011 and LIBOR plus 2.29% as of December 31, 2010. As of December 31, 2011, the Company was compliant with the amended covenant of the credit facility.
Convertible Promissory Note from Related Party
In November 2009, the Company’s Chief Executive Officer entered into a promissory note agreement with Incapsula for the principal amount of $600,000. Under the terms of the promissory note agreement, interest accrues at a rate of 6% per annum. The outstanding principal amount and unpaid accrued interest under the convertible promissory note was due and payable by Incapsula on the earlier of (i) March 31, 2010, and (ii) the closing of Incapsula’s next equity financing.
The principal and unpaid accrued interest under the convertible promissory note were convertible into Incapsula’s common stock or convertible preferred stock or any other securities issued at a price per share equal to such price per share paid in such round of financing for the same securities. In connection with the convertible promissory note, the Company recorded interest expense of $8,000 and $4,000 for the years ended December 31, 2010 and 2009, respectively. There was no interest expense recorded for the year ended December 31, 2011.
On March 9, 2010, Incapsula repaid the convertible promissory note and the accrued interest to the Company’s Chief Executive Officer.
77
Table of Contents
9. Commitments and Contingencies
Operating Leases
The Company rents its facilities under operating leases with lease periods expiring from 2013 to 2016. Future minimum payments under these facility operating leases are as follows as of December 31, 2011 (in thousands):
| Year Ending December 31: | ||||
| 2012 |
$ | 2,220 | ||
| 2013 |
2,329 | |||
| 2014 |
1,164 | |||
| 2015 |
575 | |||
| 2016 |
403 | |||
|
|
|
|||
| Total |
$ | 6,691 | ||
|
|
|
|||
Rent expense for the Company’s operating leases is recognized on a straight-line basis over the lease term. Rent expense for the years ended December 31, 2011, 2010 and 2009 was $1.9 million, $2.1 million and $1.6 million, respectively.
In connection with a lease for office space, the Company received a tenant improvement allowance of $639,000 during the year ended December 31, 2010 from the lessor for certain improvements made to the leased property. The Company has recorded the tenant improvement allowance as a leasehold improvement within property and equipment, net and a deferred rent within other liabilities on the consolidated balance sheets. The deferred rent liability is amortized to rent expense over the term of the lease on a straight-line basis. The leasehold improvements are being amortized to expense over the period from when the improvements were placed into service until the end of their useful life, which is the end of the lease term.
In addition, certain of the Company’s operating lease agreements for office space also include rent holidays and scheduled rent escalations during the initial lease term. The Company has recorded the rent holidays as a deferred rent within other liabilities on the consolidated balance sheets. The Company recognizes the deferred rent liability and scheduled rent increase on a straight-line basis into rent expense over the lease term commencing on the date the Company takes possession of the lease space.
As of December 31, 2011, 2010 and 2009 the Company has $666,000, $781,000 and $500,000, respectively, in restricted deposits to secure bank guarantees provided to the lessor.
Cancelable Lease Agreement
The Company leases motor vehicles under a cancelable operating lease agreement. The Company has an option to cancel the lease agreement, which may result in penalties in a maximum amount of $56,000 and $84,000 as of December 31, 2011 and 2010, respectively. Motor vehicle lease expenses for the years ended December 31, 2011, 2010 and 2009 were $2.1 million, $1.6 million and $1.3 million, respectively.
Purchase Commitments
As of December 31, 2011 and 2010, the Company had purchase commitments of $3.0 million and $1.9 million, respectively, to purchase inventory, trial units, and research and development equipment from its vendors. The purchase commitments result from the Company’s contractual obligation to order or build inventory in advance of anticipated sales. According to the Company’s agreements with its vendors, the Company committed to purchase inventory within six months from the date the inventory arrived at the vendor’s warehouse.
The Company also provided stand-by letters of credit to its vendors to secure its obligation to purchase the inventory. As of December 31, 2011 and 2010 the Company had $560,000, and $498,000, respectively, of restricted deposits to secure the stand-by letters of credit provided.
Litigation
In May 2010, F5 Networks, Inc., an IT infrastructure company that competes with the Company in the web application firewall market, filed a lawsuit alleging patent infringement by the Company. In June 2010, the Company filed a counterclaim alleging patent
78
Table of Contents
infringement by F5 Networks, Inc. As of December 31, 2010, the Company accrued a liability in the amount of $200,000 relating to this complaint. In February 2011, the Company entered into a settlement and license agreement with F5 Networks, Inc., under which the litigation was dismissed.
From time to time, the Company may be subject to other legal proceedings and claims in the ordinary course of business. The Company is not currently a party to any other material litigation; however, the Company has received, and may in the future continue to receive, claims from third parties asserting, among other things, infringement of intellectual property rights. While the outcome of these matters is remote, the Company does not expect that the ultimate costs to resolve these matters will have a material effect on our consolidated financial position, results of operations, or cash flows. The Company will record a liability when it believes that it is both probable that a loss has been incurred and the amount can be reasonably estimated.
Indemnification
Under the indemnification provisions of its standard sales contracts, the Company agrees to defend its channel partners and end customers against third-party claims asserting infringement of certain intellectual property rights, which may include patents, copyrights, trademarks, or trade secrets, and to pay judgments and settlements entered on such claims. The Company’s exposure under these indemnification provisions is generally limited to the total amount paid under the agreement. However, certain agreements include indemnification provisions that could potentially expose the Company to losses in excess of the amount received under the agreement. To date, there have been no claims under such indemnification provisions. Accordingly, the Company has not recorded a liability on its consolidated balance sheets for these indemnification provisions.
10. Capital Stock
Common Stock Reserved for Issuance
The Company had reserved shares of common stock, on an as if converted basis, for issuance as follows:
| As of December 31, | ||||||||
| 2011 | 2010 | |||||||
| Conversion of convertible preferred stock |
— | 10,761,511 | ||||||
| Issuance upon exercise of convertible preferred stock warrant |
— | 19,999 | ||||||
| Issuance upon exercise of common stock warrant |
8,333 | — | ||||||
| Reserved for future issuance under the stock option plan |
1,886,296 | 1,557,309 | ||||||
| Reserved for future issuance under the Employee Stock Purchase Plan |
500,000 | — | ||||||
| Issuance in connection with outstanding stock options |
2,871,005 | 2,763,908 | ||||||
|
|
|
|
|
|||||
| 5,355,634 | 15,102,727 | |||||||
|
|
|
|
|
|||||
Preferred Stock
Our board of directors is authorized, subject to any limitations prescribed by law, without stockholder approval, to issue from time to time up to an aggregate of 5,000,000 shares of preferred stock, in one or more series, each series to have such rights and preferences, including voting rights, dividend rights, conversion rights, redemption privileges and liquidation preferences as our board of directors determines. The rights of the holders of common stock will be subject to, and may be adversely affected by, the rights of holders of any preferred stock that may be issued in the future. We currently have no shares of preferred stock outstanding and we have no present plans to issue any shares of preferred stock.
Stock Option Plans
The Company recognized stock-based compensation expense under the 2011 Stock Option and Incentive Plan, 2003 Stock Plan, the Incapsula 2010 Share Incentive Plan and restricted stock in the consolidated statements of operations as follows (in thousands):
| Years Ended December 31, | ||||||||||||
| 2011 | 2010 | 2009 | ||||||||||
| Cost of revenues |
$ | 118 | $ | 44 | $ | 37 | ||||||
| Research and development |
130 | 66 | 57 | |||||||||
| Sales and marketing |
412 | 257 | 218 | |||||||||
| General and administrative |
1,067 | 273 | 109 | |||||||||
|
|
|
|
|
|
|
|||||||
| Total stock-based compensation expense |
$ | 1,727 | $ | 640 | $ | 421 | ||||||
|
|
|
|
|
|
|
|||||||
79
Table of Contents
2003 Stock Plan
During 2003, the Board of Directors adopted the 2003 Stock Plan (the “2003 Plan”), which allows for the granting of both incentive stock options and non-qualified stock options and the direct award or sale of shares of our common stock (including restricted common stock) to officers, employees, directors, consultants and other key persons. Incentive stock options may be granted to employees with exercise prices of no less than the fair value of the common stock on the grant date, and non-statutory options may be granted to employees, directors, or consultants at exercise prices of no less than 85% of the fair value of the common stock on the grant date, as determined by the Board of Directors. If, at the time the Company grants an option, the optionee directly or by attribution owns stock possessing more than 10% of the total combined voting power of all classes of stock of the Company, the option price shall be at least 110% of the fair value. Options granted under the Plan generally expire no later than ten years and in general vest four years from the date of grant.
2011 Stock Option and Incentive Plan
On September 9, 2011, the Board of Directors adopted the 2011 Stock Option and Incentive Plan (the “2011 Plan”) which was subsequently approved by the Company’s stockholders. The 2011 Plan replaces the 2003 Plan as the Board has decided not to grant any additional awards under that plan. The Company has reserved a total of 1,000,000 shares of common stock for issuance under the 2011 Plan. In addition, any reserved but unissued shares under the 2003 Stock Plan will be added to the number of shares reserved for issuance under the 2011 Plan. The 2011 Plan also provides that the number of shares reserved and available for issuance under the plan will automatically increase each January 1, beginning in 2012 and ending in 2015, by 4% of the outstanding number of shares of common stock on the immediately preceding December 31. The Board of Directors or compensation committee may reduce the amount of the increase in any particular year. As of December 31, 2011, there were 1,886,296 shares available for grant under the 2011 Plan. On January 1, 2012, the share reserve under the 2011 Plan was automatically increased by 919,127 shares.
The 2011 Plan permits the granting of incentive stock options, non-qualified stock options, restricted stock units, stock appreciation rights, restricted shares of common stock and performance share awards. The exercise price of stock options may not be less than the 100% of the fair market value of the common stock on the date of grant. Options granted pursuant to the 2011 Plan generally expire no later than ten years.
The following table summarizes option activity under the 2003 Plan and the 2011 Plan and related information:
| Shares Available for Grant |
Number of Stock Options Outstanding |
Weighted-Average Exercise Price |
Weighted- Average Remaining Contractual Life (Years) |
Aggregate Intrinsic Value (in thousands) |
||||||||||||||||
| Outstanding—January 1, 2009 |
535,184 | 2,043,565 | $ | 1.10 | 7.61 | $ | 1,120 | |||||||||||||
| Additional options authorized |
470,991 | — | ||||||||||||||||||
| Granted |
(1,330,675 | ) | 1,330,675 | 1.64 | ||||||||||||||||
| Exercised |
— | (274,458 | ) | 0.82 | ||||||||||||||||
| Forfeited |
547,268 | (547,268 | ) | 1.32 | ||||||||||||||||
|
|
|
|
|
|
|
|
|
|
|
|||||||||||
| Outstanding—December 31, 2009 |
222,768 | 2,552,514 | $ | 1.36 | 8.29 | 700 | ||||||||||||||
| Additional options authorized |
1,978,458 | — | ||||||||||||||||||
| Granted |
(1,243,111 | ) | 1,243,111 | 2.64 | ||||||||||||||||
| Exercised |
— | (432,523 | ) | 1.36 | ||||||||||||||||
| Forfeited |
599,194 | (599,194 | ) | 1.58 | ||||||||||||||||
|
|
|
|
|
|
|
|
|
|
|
|||||||||||
| Outstanding—December 31, 2010 |
1,557,309 | 2,763,908 | $ | 1.90 | 8.09 | 4,999 | ||||||||||||||
| Additional options authorized |
1,000,000 | — | ||||||||||||||||||
| Granted |
(1,067,050 | ) | 1,067,050 | 9.74 | ||||||||||||||||
| Exercised |
— | (563,916 | ) | 3.73 | ||||||||||||||||
| Forfeited |
396,037 | (396,037 | ) | 4.02 | ||||||||||||||||
|
|
|
|
|
|
|
|
|
|
|
|||||||||||
| Outstanding—December 31, 2011 |
1,886,296 | 2,871,005 | $ | 4.15 | 7.86 | $ | 88,012 | |||||||||||||
|
|
|
|
|
|
|
|
|
|
|
|||||||||||
| Vested and expected to vest— December 31, 2011 |
2,603,456 | $ | 4.06 | 7.62 | $ | 80,068 | ||||||||||||||
|
|
|
|
|
|
|
|
|
|||||||||||||
| Exercisable—December 31, 2011 |
1,225,576 | $ | 1.64 | 6.58 | $ | 40,657 | ||||||||||||||
|
|
|
|
|
|
|
|
|
|||||||||||||
80
Table of Contents
Additional information regarding the Company’s stock options outstanding and exercisable as of December 31, 2011 is summarized below:
| Options Outstanding | Options Exercisable | |||||||||||||||||||
| Exercise Prices |
Number of Stock Options Outstanding |
Weighted- Average Remaining Contractual Life (Years) |
Weighted- Average Exercise Price per Share |
Shares Subject to Stock Options |
Weighted- Average Exercise Price per Share |
|||||||||||||||
| $0.40 - $1.06 |
467,013 | 4.77 | $ | 0.82 | 461,188 | $ | 0.82 | |||||||||||||
| $1.07 - $2.04 |
991,491 | 7.48 | $ | 1.66 | 573,385 | $ | 1.66 | |||||||||||||
| $2.05 - $3.70 |
542,651 | 8.72 | $ | 3.32 | 176,340 | $ | 3.27 | |||||||||||||
| $3.71 - $10.45 |
529,925 | 9.22 | $ | 5.99 | 14,663 | $ | 7.00 | |||||||||||||
| $10.46 - $25.64 |
339,925 | 9.71 | $ | 14.48 | — | $ | — | |||||||||||||
|
|
|
|
|
|||||||||||||||||
| 2,871,005 | 7.86 | $ | 4.15 | 1,225,576 | $ | 1.64 | ||||||||||||||
|
|
|
|
|
|||||||||||||||||
Determining the Fair Value of Stock Options
The fair value of each grant of stock options was determined by the Company and its board of directors using the Black-Scholes option-pricing model and assumptions discussed below. Each of these inputs is subjective and generally requires significant judgment to determine.
Expected Term—The expected term represents the period that the Company’s stock-based awards are expected to be outstanding. For option grants that are considered to be “plain vanilla,” the Company used the simplified method to determine the expected term as provided by the Securities and Exchange Commission. The simplified method is calculated as the average of the time-to-vesting and the contractual life of the options. For other option grants, the expected term is derived from historical data on employee exercises and post-vesting employment termination behavior taking into account the contractual life of the award.
Expected Volatility—The expected volatility was based on the historical stock volatilities of several of the Company’s publicly listed peers over a period equal to the expected terms of the options as the Company did not have a sufficient trading history to use the volatility of its own common stock.
Fair Value of Common Stock—Prior to listing of the Company’s common stock on the New York Stock Exchange, the fair value of the shares of common stock underlying the stock options has historically been determined by the board of directors. Because there had been no public market for the Company’s common stock, the board of directors has determined fair value of the common stock at the time of grant of the option by considering a number of objective and subjective factors including valuation of comparable companies, sales of convertible preferred stock to unrelated third parties, operating and financial performance, the lack of liquidity of capital stock and general and industry specific economic outlook, amongst other factors. The Company has not granted stock options with an exercise price that is less than the fair value of the underlying common stock as determined at the time of grant by the Company’s board of directors, with input from management. The Company’s board of directors determined the fair value of common stock based on valuations performed using the option pricing method (OPM) in periods prior to February 1, 2011. Subsequent to February 1, 2011, the common stock valuation was determined using the probability weighted expected return method (PWERM) as the Company began to consider initial public offering (IPO) activities.
Risk-Free Interest Rate—The risk-free interest rate is based on the U.S. Treasury yield curve in effect at the time of grant for zero coupon U.S. Treasury notes with maturities approximately equal to the option’s expected term.
Expected Dividend—The Company has never paid dividends and does not expect to pay dividends.
Forfeiture Rate—The Company estimates its forfeiture rate based on an analysis of its actual forfeitures and will continue to evaluate the adequacy of the forfeiture rate based on actual forfeiture experience, analysis of employee turnover behavior, and other factors. The impact from a forfeiture rate adjustment will be recognized in full in the period of adjustment, and if the actual number of future forfeitures differs from that estimated by the Company, the Company may be required to record adjustments to stock-based compensation expense in future periods.
81
Table of Contents
A summary of the weighted-average assumptions is as follows:
| Years Ended December 31, | ||||||||||||
| 2011 | 2010 | 2009 | ||||||||||
| Dividend rate |
0 | % | 0 | % | 0 | % | ||||||
| Risk-free interest rate |
1.7 | % | 2.2 | % | 2.5 | % | ||||||
| Expected term (in years) |
5.4 | 6.1 | 6.0 | |||||||||
| Expected volatility |
49 | % | 51 | % | 55 | % | ||||||
The weighted-average grant date fair value of the Company’s stock options granted during the years ended December 31, 2011, 2010 and 2009 was $5.03, $1.36 and $0.64 per share, respectively. The aggregate grant date fair value of the Company’s stock options granted to employees during the years ended December 31, 2011, 2010 and 2009 was $5.4 million, $1.7 million and $847,000, respectively. The aggregate grant date fair value of the Company’s stock options vested during the years ended December 31, 2011, 2010, and 2009 was $1.5 million, $460,000, and $288,000, respectively.
The aggregate intrinsic value of options exercised under the Plan was $5.8 million, $430,000 and $194,000 for the years ended December 31, 2011, 2010 and 2009, respectively. The aggregate intrinsic value is calculated as the difference between the per-share exercise price and the deemed fair value of the Company’s common stock for each share subject to an option multiplied by the number of shares subject to options at the date of exercise. The Board of Directors deemed the fair value of the Company’s common stock to be $3.70 per share as of December 31, 2010.
As of December 31, 2011, total compensation cost related to unvested stock-based awards granted to employees under the Plan, but not yet recognized, was $4.2 million, net of estimated forfeitures. As of December 31, 2011, this cost will be amortized to expense over a weighted-average remaining period of 2.7 years, and will be adjusted for subsequent changes in estimated forfeitures. Future option grants will increase the amount of compensation expense to be recorded in these periods.
Net cash proceeds from the exercise of stock options were $2.1 million, $588,000 and $231,000 for the years ended December 31, 2011, 2010 and 2009, respectively. There was no capitalized stock-based compensation cost and there were no recognized stock-based compensation tax benefits during the years ended December 31, 2011, 2010 and 2009.
2011 Employee Stock Purchase Plan
On September 9, 2011, the Board of Directors adopted the 2011 Employee Stock Purchase Plan (the “ESPP”) which was subsequently approved by the Company’s stockholders. The ESPP took effect on the effective date of the registration statement for the Company’s IPO. The ESPP permits eligible employees to acquire shares of the Company’s common stock by accumulating funds through periodic payroll deductions of up to 15% of base salary. Each offering period may run for no more than 24 months and consist of no more than five purchase periods. The purchase price for shares of our common stock purchased under the ESPP will be 85% of the lesser of the fair market value of our common stock on the first day of the offering period or the last trading day of the applicable purchase period within that offering period.
The Company has initially reserved a total of 500,000 shares of common stock for future issuance under the ESPP. The number of shares reserved for issuance under the ESPP will increase automatically on January 1 of each of the first eight years commencing in 2012 by the number of shares equal to 1% of the Company’s total outstanding shares as of the immediately preceding December 31. The Board of Directors or compensation committee may reduce the amount of the increase in any particular year. No more than 20,000,000 shares of common stock may be issued under the ESPP and no other shares may be added to the ESPP without the approval of our stockholders. On January 1, 2012, the share reserve under the 2011 Employee Stock Purchase Plan was automatically increased by 229,782 shares.
Incapsula 2010 Share Incentive Plan
In March 2010, Incapsula’s board of directors adopted the Incapsula 2010 Share Incentive Plan (the “Incapsula Plan”), pursuant to which Incapsula may grant to its employees and service providers options to purchase shares of its common stock, restricted shares, or restricted share units. The total number of shares of common stock that may be granted under the Incapsula Plan shall not exceed 4,733,333 in the aggregate, subject to certain adjustments.
82
Table of Contents
The following table summarizes option activity under the Incapsula Plan and related information:
| Shares Available for Grant |
Number of Stock Options Outstanding |
Weighted- Average Exercise Price |
||||||||||
| Outstanding—December 31, 2009 |
— | — | $ | — | ||||||||
| Options authorized |
4,733,333 | — | — | |||||||||
| Granted |
(1,244,000 | ) | 1,244,000 | 0.02 | ||||||||
| Exercised |
— | — | — | |||||||||
| Forfeited |
100,000 | (100,000 | ) | 0.09 | ||||||||
|
|
|
|
|
|
|
|||||||
| Outstanding—December 31, 2010 |
3,589,333 | 1,144,000 | 0.01 | |||||||||
| Granted |
(1,050,000 | ) | 1,050,000 | 0.18 | ||||||||
| Exercised |
— | (37,500 | ) | 0.11 | ||||||||
| Forfeited |
382,500 | (382,500 | ) | 0.16 | ||||||||
|
|
|
|
|
|
|
|||||||
| Outstanding—December 31, 2011 |
2,921,833 | 1,774,000 | $ | 0.08 | ||||||||
|
|
|
|
|
|
|
|||||||
Common Stock Subject to Repurchase
Pursuant to restricted stock agreements with the Company’s CEO, the Company has the right, but not the obligation, to repurchase the unvested shares of common stock upon termination of employment at the original purchase price per share. The repurchase rights with respect to the common stock lapse over the vesting period, which ranges from 48 months to 60 months. The amounts received in exchange for these shares have been included in other liabilities in the accompanying consolidated balance sheet and are reclassified to equity as the shares vest. The Company granted 843,819 shares of restricted common stock with a weighted-average grant date fair value per share of $1.94 during the year ended December 31, 2010. There were no grants of shares of restricted common stock during the years ended December 31, 2011 and 2009. As of December 31, 2011 and 2010, 606,496 and 1,078,398 shares of restricted common stock, respectively, held by the Company’s CEO were unvested and subject to repurchase by the Company.
Early Exercise of Stock Options
In 2010 and 2011, the Company’s board of directors allowed for the early exercise of stock options granted to certain members of the Company’s board of directors. The amounts received in exchange for these shares have been included in other liabilities in the accompanying consolidated balance sheet and are reclassified to equity as the shares vest. As of December 31, 2011 and 2010, 127,500 and 60,000 shares were unvested, respectively.
11. Income Taxes
The Company’s geographical breakdown of its loss before provision for income taxes is as follows (in thousands):
| Years Ended December 31, | ||||||||||||
| 2011 | 2010 | 2009 | ||||||||||
| Domestic |
$ | (12,747 | ) | $ | (14,153 | ) | $ | (13,551 | ) | |||
| Foreign |
2,551 | 2,312 | 1,572 | |||||||||
|
|
|
|
|
|
|
|||||||
| Loss before provision for taxes |
$ | (10,196 | ) | $ | (11,841 | ) | $ | (11,979 | ) | |||
|
|
|
|
|
|
|
|||||||
The components of the provision for income taxes are as follows (in thousands):
| Years Ended December 31, | ||||||||||||
| 2011 | 2010 | 2009 | ||||||||||
| Current |
||||||||||||
| Federal |
$ | — | $ | — | $ | — | ||||||
| State |
63 | 12 | 18 | |||||||||
| Foreign |
618 | 568 | 354 | |||||||||
|
|
|
|
|
|
|
|||||||
| Total current provision |
681 | 580 | 372 | |||||||||
| Deferred |
||||||||||||
| Federal |
— | — | — | |||||||||
83
Table of Contents
| Years Ended December 31, | ||||||||||||
| 2011 | 2010 | 2009 | ||||||||||
| State |
— | — | — | |||||||||
| Foreign |
(19 | ) | (53 | ) | (12 | ) | ||||||
|
|
|
|
|
|
|
|||||||
| Total deferred provision |
(19 | ) | (53 | ) | (12 | ) | ||||||
|
|
|
|
|
|
|
|||||||
| Total |
$ | 662 | $ | 527 | $ | 360 | ||||||
|
|
|
|
|
|
|
|||||||
Reconciliation of the provision for income taxes at the statutory rate to the Company’s provision for income tax are as follows (in thousands):
| Years Ended December 31, | ||||||||||||
| 2011 | 2010 | 2009 | ||||||||||
| Tax benefit at federal statutory tax rate |
$ | (3,465 | ) | $ | (4,026 | ) | $ | (4,073 | ) | |||
| Tax benefit at state statutory tax rate |
(390 | ) | (482 | ) | (481 | ) | ||||||
| Tax benefit resulting from “Beneficiary Enterprise” |
(191 | ) | (37 | ) | (133 | ) | ||||||
| Foreign tax rate differential |
(302 | ) | (207 | ) | (151 | ) | ||||||
| Unbenefited loss of consolidated investment |
1,026 | 513 | 39 | |||||||||
| Change in valuation allowance |
3,072 | 4,081 | 4,162 | |||||||||
| Meals and entertainment |
145 | 124 | 411 | |||||||||
| Sale of license |
— | — | 515 | |||||||||
| Warrants fair value adjustment |
95 | — | — | |||||||||
| Stock compensation |
543 | 627 | 82 | |||||||||
| Nondeductible expenses and other |
129 | (66 | ) | (11 | ) | |||||||
|
|
|
|
|
|
|
|||||||
| Provision for income taxes |
$ | 662 | $ | 527 | $ | 360 | ||||||
|
|
|
|
|
|
|
|||||||
| Basic net loss per share amounts of benefits resulting from Beneficiary Enterprise Status |
$ | 0.02 | $ | 0.01 | $ | 0.03 | ||||||
Significant components of the Company’s net deferred tax assets are as follows (in thousands):
| As of December 31, | ||||||||
| 2011 | 2010 | |||||||
| Deferred tax assets: |
||||||||
| Reserves and accruals |
$ | 809 | $ | 645 | ||||
| Deferred revenue |
2,844 | 7,902 | ||||||
| Net operating loss carryforwards |
19,874 | 11,628 | ||||||
|
|
|
|
|
|||||
| Gross deferred tax assets |
23,527 | 20,175 | ||||||
| Valuation allowance |
(22,512 | ) | (19,440 | ) | ||||
|
|
|
|
|
|||||
| Deferred tax assets |
1,015 | 735 | ||||||
| Deferred tax liabilities: |
||||||||
| Stock based compensation |
(352 | ) | (392 | ) | ||||
| Depreciation and amortization |
(372 | ) | (172 | ) | ||||
|
|
|
|
|
|||||
| Total deferred tax liabilities |
(724 | ) | (564 | ) | ||||
|
|
|
|
|
|||||
| Net deferred tax assets |
$ | 291 | $ | 171 | ||||
|
|
|
|
|
|||||
Recognition of deferred tax assets is appropriate when realization of these assets is more likely than not. Based upon the weight of available evidence, which includes the Company’s historical operating performance and the recorded cumulative net losses in all prior fiscal periods, the Company has provided a full valuation allowance against its U.S. deferred tax assets. The Company’s valuation allowance increased by $3.1 million, $4.1 million and $4.2 million in the years ended December 31, 2011, 2010 and 2009, respectively.
84
Table of Contents
As of December 31, 2011, the Company had U.S. federal and state net operating loss carryforwards of approximately $53.0 million. The U.S. federal net operating loss carryforwards will expire at various dates beginning in 2023 through 2032 if not utilized. Most state net operating loss carryforwards will expire at various dates beginning in 2018 through 2032.
The Company uses the “with-and-without” approach to determine the recognition and measurement of excess tax benefits. Accordingly, the Company has elected to recognize excess income tax benefits from stock option exercises in additional paid in capital only if an incremental income tax benefit would be realized after considering all other tax attributes presently available to the Company. As of December 31, 2011, the amount of such excess tax benefits from stock options included in net operating losses was insignificant. In addition, the Company has elected to account for the indirect effects of stock-based awards on other tax attributes, such as the research and alternative minimum tax credits, through the statement of operations.
Net operating loss carryforwards reflected above are subject to limitations due to ownership changes as provided in the Internal Revenue Code and similar state provisions.
The Company has not provided U.S. income tax on certain foreign earnings that are deemed to be indefinitely invested outside the U.S. For 2011, 2010, and 2009 the amount of accumulated unremitted earnings from the Company’s foreign subsidiaries is approximately $5.6 million, $3.9 million and $1.7 million. Determination of the amount of unrecognized deferred U.S. income tax liability is not practical due to the complexities associated with the hypothetical calculation.
As of December 31, 2011 and 2010, the Company had gross unrecognized tax benefits of approximately $267,000 and $171,000, respectively, all of which would impact the effective tax rate if recognized. While it is often difficult to predict the final outcome of any particular uncertain tax position, the Company does not believe that the amount of unrecognized tax benefits will change significantly in the next twelve months.
The Company recognizes interest accrued and penalties related to unrecognized tax benefits in its income tax provision. For the years ended December 31, 2011 and 2010, the Company accrued interest of $22,000 and $13,000 in income tax expense, respectively.
A reconciliation of the beginning and ending amount of unrecognized tax benefits is as follows (in thousands):
| 2011 | 2010 | 2009 | ||||||||||
| Balance at January 1 |
$ | 171 | $ | 112 | $ | 65 | ||||||
| Additions based on tax positions taken during the current period |
96 | 59 | 47 | |||||||||
|
|
|
|
|
|
|
|||||||
| Balance at December 31 |
$ | 267 | $ | 171 | $ | 112 | ||||||
|
|
|
|
|
|
|
|||||||
The Company’s material tax jurisdictions are the United States federal, California and Israel. The Israeli Tax Authorities are currently examining income tax returns of the Israeli subsidiary for the tax years 2006 through 2010. As a result of net operating loss carryforwards, the Company is subject to audit for tax years 2002 and forward for federal purposes and 2003 and forward for California purposes. There are tax years which remain subject to examination in various other jurisdictions that are not material to the Company’s financial statements.
The Company’s Israeli subsidiary’s research and development intercompany services have a “Beneficiary Enterprise” status for a separate investment program that was elected by the Israel subsidiary under the Law for Encouragement of Capital Investments, 1959 (the “Investments Law”), which was amended on April 1, 2005.
Undistributed Israeli income derived from its “Beneficiary Enterprise” program entitles the Israeli subsidiary to a tax exemption for a period of two years and to a reduced tax rate of 10% - 25% for an additional period of five to eight years (depending on the level of non-Israeli investment in the Company). These tax benefits are subject to a limitation of 12 years from activation of the program.
The entitlement to the above benefits is conditional upon the Israeli subsidiary fulfilling the conditions stipulated by the Investments Law and regulations published there under.
Should the Israeli subsidiary fail to meet such requirements in the future, income attributable to its Beneficiary Enterprise programs could be subject to the statutory Israeli corporate tax rate, and the Israeli subsidiary could be required to refund the tax benefits already received with respect to such program, in whole or in part, including interest.
85
Table of Contents
Through December 31, 2011 and 2010, the Israeli subsidiary had $2.0 million and $1.5 million, respectively, of tax exempt income attributed to its Beneficiary Enterprise program. If such tax-exempt income is distributed in a merger or a regular distribution or upon complete liquidation of the Israeli subsidiary, it would be taxed at the corporate tax rate applicable to such profits and an income tax liability of up to $0.5 million and $0.4 million, respectively, would be incurred as of December 31, 2011 and 2010.
The Company has determined that it will not distribute any amounts of its undistributed tax-exempt income as dividend and it intends to reinvest its tax-exempt income. Accordingly, no deferred income taxes have been provided on income attributable to the Israeli subsidiary’s Beneficiary Enterprise programs as the undistributed tax-exempt income is essentially permanent in duration.
12. Segment Information
The Company has two operating segments which are also both reportable business segments: (i) Imperva, which is comprised of Imperva’s and its wholly-owned subsidiaries’ financial position and results of operations; and (ii) Incapsula, which is comprised entirely of the financial position and results from operations of the Company’s majority owned subsidiary, which commenced operations in late 2009.
The following table presents a summary of our operating segments (in thousands):
| Years Ended December 31, | ||||||||||||
| 2011 | 2010 | 2009 | ||||||||||
| Imperva: |
||||||||||||
| Net revenue |
$ | 78,214 | $ | 55,382 | $ | 39,341 | ||||||
| Operating loss |
(7,436 | ) | (10,889 | ) | (12,061 | ) | ||||||
| Provision for income taxes |
646 | 489 | 359 | |||||||||
| Net loss |
(8,144 | ) | (10,982 | ) | (12,236 | ) | ||||||
| Depreciation and amortization |
1,529 | 1,159 | 672 | |||||||||
| Stock-based compensation |
1,706 | 583 | 421 | |||||||||
| Total assets |
$ | 130,742 | $ | 39,245 | $ | 36,987 | ||||||
| Incapsula: |
||||||||||||
| Net revenue |
$ | 88 | $ | — | $ | — | ||||||
| Operating loss |
(2,570 | ) | (1,426 | ) | (96 | ) | ||||||
| Provision for income taxes |
16 | 38 | 1 | |||||||||
| Net loss |
(2,714 | ) | (1,386 | ) | (103 | ) | ||||||
| Depreciation and amortization |
11 | 11 | — | |||||||||
| Stock-based compensation |
21 | 57 | — | |||||||||
| Total assets |
$ | 2,800 | $ | 1,732 | $ | 559 | ||||||
The Company’s services revenue comprised of the following (in thousands):
| Years Ended December 31, | ||||||||||||
| 2011 | 2010 | 2009 | ||||||||||
| Maintenance and support |
$ | 24,497 | $ | 18,064 | $ | 11,840 | ||||||
| Professional services and training |
4,730 | 2,465 | 1,763 | |||||||||
| Subscriptions |
1,475 | 374 | 11 | |||||||||
|
|
|
|
|
|
|
|||||||
| Total services revenue |
$ | 30,702 | $ | 20,903 | $ | 13,614 | ||||||
|
|
|
|
|
|
|
|||||||
The Company’s revenue by geographic region, based on the customer’s location, is summarized as follows (in thousands):
| Years Ended December 31, | ||||||||||||
| 2011 | 2010 | 2009 | ||||||||||
| Americas |
$ | 47,851 | $ | 36,586 | $ | 24,869 | ||||||
| EMEA |
18,464 | 13,492 | 9,929 | |||||||||
| Asia Pacific |
11,987 | 5,304 | 4,543 | |||||||||
|
|
|
|
|
|
|
|||||||
| Total net revenue |
$ | 78,302 | $ | 55,382 | $ | 39,341 | ||||||
|
|
|
|
|
|
|
|||||||
86
Table of Contents
The following table presents long-lived assets by location (in thousands):
| As of December 31, | ||||||||||||
| 2011 | 2010 | 2009 | ||||||||||
| United States |
$ | 1,815 | $ | 2,066 | $ | 1,004 | ||||||
| Israel |
2,196 | 2,010 | 1,340 | |||||||||
| Other |
15 | 25 | 34 | |||||||||
|
|
|
|
|
|
|
|||||||
| Total long-lived assets |
$ | 4,026 | $ | 4,101 | $ | 2,378 | ||||||
|
|
|
|
|
|
|
|||||||
13. Net Loss per Share
The following table sets forth the computation of the Company’s basic and diluted net loss per share of common stock (in thousands, except for share and per share amounts):
| Years Ended December 31, | ||||||||||||
| 2011 | 2010 | 2009 | ||||||||||
| Net loss attributable to Imperva, Inc. stockholders |
$ | (10,269 | ) | $ | (12,013 | ) | $ | (12,296 | ) | |||
|
|
|
|
|
|
|
|||||||
| Shares used in computing net loss per share of common stock, basic and diluted |
7,674,554 | 4,884,665 | 4,365,359 | |||||||||
|
|
|
|
|
|
|
|||||||
| Net loss per share of common stock, basic and diluted |
$ | (1.34 | ) | $ | (2.46 | ) | $ | (2.82 | ) | |||
|
|
|
|
|
|
|
|||||||
The following outstanding shares of common stock equivalents were excluded from the computation of diluted net loss per share of common stock for the periods presented because including them would have been antidilutive:
| Years Ended December 31, | ||||||||||||
| 2011 | 2010 | 2009 | ||||||||||
| Convertible preferred stock |
— | 10,761,511 | 10,761,511 | |||||||||
| Stock options to purchase common stock |
2,871,005 | 2,763,908 | 2,552,514 | |||||||||
| Restricted shares of common stock subject to repurchase |
733,995 | 1,138,488 | 302,997 | |||||||||
| Common stock warrants |
8,333 | — | — | |||||||||
| Convertible preferred stock warrants |
— | 19,999 | 19,999 | |||||||||
87
Table of Contents
Item 9. Changes in and Disagreements with Accountants on Accounting and Financial Disclosure
None
Item 9A. Controls and Procedures
Evaluation of Disclosure Controls and Procedures
Our management, with the participation and supervision of our chief executive officer and chief financial officer, evaluated the effectiveness of our disclosure controls and procedures pursuant to Rule 13a-15 under the Exchange Act. In designing and evaluating the disclosure controls and procedures, management recognizes that any controls and procedures, no matter how well designed and operated, can provide only reasonable assurance of achieving the desired control objectives. In addition, the design of disclosure controls and procedures must reflect the fact that there are resource constraints and that management is required to apply its judgment in evaluating the benefits of possible controls and procedures relative to their costs.
Based on the aforementioned evaluation, our chief executive officer and chief financial officer have concluded that as of December 31, 2011, our disclosure controls and procedures are designed at a reasonable assurance level and are effective to provide reasonable assurance that information we are required to disclose in reports that we file or submit under the Exchange Act is recorded, processed, summarized and reported within the time periods specified in SEC rules and forms, and that such information is accumulated and communicated to our management, including our chief executive officer and chief financial officer, as appropriate, to allow timely decisions regarding required disclosure.
Internal Control over Financial Reporting
This Annual Report on Form 10-K does not include a report of management’s assessment regarding internal control over financial reporting or an attestation report of our independent registered public accounting firm due to a transition period established by rules of the SEC for newly public companies. At December 31, 2012, Section 404 of the Sarbanes-Oxley Act will require our management to provide an assessment of the effectiveness of our internal control over financial reporting, and our independent registered public accounting firm will be required to provide its attestation report regarding such assessment. We are in the process of performing the system and process documentation, evaluation and testing required for management to make this assessment and for its independent auditors to provide its attestation report. We have not completed this process or its assessment, and this process will require significant amounts of management time and resources. In the course of evaluation and testing, management may identify deficiencies that will need to be addressed and remediated.
Changes in Internal Control over Financial Reporting
Regulations under the Exchange Act require public companies, including our company, to evaluate any change in our “internal control over financial reporting” as such term is defined in Rule 13a-15(f) and Rule 15d-15(f) of the Exchange Act. In connection with their evaluation of our disclosure controls and procedures as of the end of the period covered by this Annual Report on Form 10-K, our chief executive officer and chief financial officer did not identify any changes in our internal control over financial reporting during our fiscal fourth quarter ended December 31, 2011 that materially affected, or are reasonably likely to materially affect, our internal control over financial reporting.
None.
PART III
Item 10. Directors, Executive Officers and Corporate Governance
Except as set forth below, the information required by this item is incorporated by reference to our Proxy Statement for our 2012 Annual Meeting of Stockholders to be filed with the SEC within 120 days after the end of the fiscal year ended December 31, 2011.
We maintain a Code of Business Conduct and Ethics that incorporates our code of ethics applicable to all employees, including all officers. Our Code of Business Conduct and Ethics is published on the Investor Relations section of our website at www.imperva.com. We intend to disclose future amendments to certain provisions of our Code of Business Conduct and Ethics, or waivers of such provisions granted to executive officers and directors, on this website within four business days following the date of such amendment or waiver.
88
Table of Contents
Item 11. Executive Compensation
The information required by this item is incorporated by reference to our Proxy Statement for our 2012 Annual Meeting of Stockholders to be filed with the SEC within 120 days after the end of the fiscal year ended December 31, 2011.
Item 12. Security Ownership of Certain Beneficial Owners and Management and Related Stockholder Matters
The information required by this item with respect to Item 403 of Regulation S-K regarding security ownership of certain beneficial owners and management is incorporated by reference to our Proxy Statement for our 2012 Annual Meeting of Stockholders to be filed with the SEC within 120 days after the end of the fiscal year ended December 31, 2011. For the information required by this item with respect to Item 201(d) of Regulation S-K regarding securities authorized for issuance under equity compensation plans, see “Item 5: Market for Registrant’s Common Equity, Related Stockholder Matters and Issuer Purchases of Equity Securities—Equity Compensation Plan Information.”
Item 13. Certain Relationships and Related Transactions, and Director Independence
The information required by this item is incorporated by reference to our Proxy Statement for our 2012 Annual Meeting of Stockholders to be filed with the SEC within 120 days after the end of the fiscal year ended December 31, 2011.
Item 14. Principal Accounting Fees and Services
The information required by this item is incorporated by reference to our Proxy Statement for our 2012 Annual Meeting of Stockholders to be filed with the SEC within 120 days after the end of the fiscal year ended December 31, 2011.
PART IV
Item 15. Exhibits and Financial Statement Schedules
(a)(1) Financial Statements: The financial statements filed as part of this Annual Report on Form 10-K are listed on the index to financial statements on page 55.
(2) No Financial Statement Schedules were required to be filed as part of this report because the required information is not present or is not present in amounts sufficient to require submission of the schedules or because the information required is included in the Consolidated Financial Statements or Notes thereto.
(b) Exhibits. The exhibits listed on the Exhibit Index (following the Signatures section of this report) are included, or incorporated by reference, in this Annual Report on Form 10-K.
89
Table of Contents
Pursuant to the requirements of Section 13 or 15(d) of the Securities Exchange Act of 1934, on March 27, 2012, the Registrant has duly caused this Annual Report on Form 10-K to be signed on its behalf by the undersigned, thereunto duly authorized.
| IMPERVA, INC. | ||||||||
| By: | /s/ Shlomo Kramer |
By: | /s/ Terrence J. Schmid | |||||
| Shlomo Kramer | Terrence J. Schmid | |||||||
| President and Chief Executive Officer | Chief Financial Officer | |||||||
POWER OF ATTORNEY
KNOW ALL PERSONS BY THESE PRESENTS, that each person whose signature appears below constitutes and appoints Shlomo Kramer and Terrence J. Schmid as his attorneys-in-fact, with the power of substitution, for him in any and all capacities, to sign any amendments to this Annual Report on Form 10-K, and to file the same, with exhibits thereto and other documents in connection therewith with the Securities and Exchange Commission, hereby ratifying and confirming all that each said attorney-in-fact, or his substitute or substitutes, may do or cause to be done by virtue hereof.
Pursuant to the requirements of the Securities Exchange Act of 1934, this Report has been signed below by the following persons in the capacities and on the dates indicated.
| Signature |
Title |
Date | ||
| /s/ Shlomo Kramer |
President, Chief Executive Officer and Director (Principal Executive Officer) |
March 27, 2012 | ||
| Shlomo Kramer | ||||
| /s/ Terrence J. Schmid |
Chief Financial Officer (Principal Accounting and Financial Officer) |
March 27, 2012 | ||
| Terrence J. Schmid | ||||
| /s/ Michael Boodaei |
Director | March 27, 2012 | ||
| Michael Boodaei | ||||
| /s/ Asheem Chandna |
Director | March 27, 2012 | ||
| Asheem Chandna | ||||
| /s/ Theresia Gouw Ranzetta |
Director | March 27, 2012 | ||
| Theresia Gouw Ranzetta | ||||
| /s/ Steven Krausz |
Director | March 27, 2012 | ||
| Steven Krausz | ||||
90
Table of Contents
| /s/ Albert A. Pimentel |
Director | March 27, 2012 | ||
| Albert A. Pimentel | ||||
| /s/ Frank Slootman |
Director | March 27, 2012 | ||
| Frank Slootman | ||||
| /s/ David N. Strohm |
Director | March 27, 2012 | ||
| David N. Strohm | ||||
91
Table of Contents
EXHIBIT INDEX
| Incorporated by Reference | ||||||||||||||||
| Exhibit Number |
Exhibit Description |
Form | File No. | Exhibit | Filing Date |
Provided Herewith | ||||||||||
| 3.1 |
Restated Certificate of Incorporation of Imperva, Inc., as currently in effect. |
S-1/A | 333-175008 | 3.3 | 10/28/11 | |||||||||||
| 3.2 |
Amended and Restated Bylaws of Imperva, Inc., as currently in effect. | S-1/A | 333-175008 | 3.6 | 10/28/11 | |||||||||||
| 4.1 |
Specimen Certificate Evidencing Shares of Imperva, Inc. common stock. | S-1/A | 333-175008 | 4.1 | 10/28/11 | |||||||||||
| 4.2 |
Warrant to Purchase Stock issued December 22, 2005 to Silicon Valley Bank. | S-1 | 333-175008 | 4.2 | 6/17/11 | |||||||||||
| 4.3 |
Amended and Restated Investor Rights Agreement, dated November 1, 2011, by and among Imperva, Inc. and the investors party thereto. | S-1/A | 333-175008 | 4.4 | 11/7/11 | |||||||||||
| 10.1# |
2003 Stock Plan, as amended, including addendums and sub-plans. | S-1 | 333-175008 | 10.1 | 6/17/11 | |||||||||||
| 10.2# |
Forms of agreements under the 2003 Stock Plan, as amended. | S-1 | 333-175008 | 10.2 | 6/17/11 | |||||||||||
| 10.3# |
2011 Stock Option and Incentive Plan and subplan and form agreements thereunder. | S-8 | 333-179552 | 99.1 | 2/16/12 | |||||||||||
| 10.4# |
Form of Amended and Restated Indemnification Agreement. | S-1/A | 333-175008 | 10.4 | 10/28/11 | |||||||||||
| 10.5# |
Offer Letter, dated August 16, 2010, between Imperva, Inc. and Shlomo Kramer. | S-1/A | 333-175008 | 10.5 | 9/6/11 | |||||||||||
| 10.6# |
Offer Letter, dated September 29, 2010, between Imperva, Inc. and Terrence J. Schmid. | S-1/A | 333-175008 | 10.6 | 9/6/11 | |||||||||||
| 10.7# |
Offer Letter, dated December 19, 2007, between Imperva, Inc. and Ralph Pisani. | S-1/A | 333-175008 | 10.7 | 9/6/11 | |||||||||||
| 10.8# |
Offer Letter, dated May 9, 2006, between Imperva, Inc. and Jason Forget. | S-1/A | 333-175008 | 10.8 | 9/6/11 | |||||||||||
| 10.9# |
Stock Purchase Agreement, dated September 30, 2010, between Imperva, Inc. and Shlomo Kramer (1,265,730 shares of common stock purchased). | S-1 | 333-175008 | 10.9 | 6/17/11 | |||||||||||
| 10.10# |
Stock Purchase Agreement, dated September 30, 2010, between Imperva, Inc. and Shlomo Kramer (421,909 shares of common stock purchased). | S-1 | 333-175008 | 10.10 | 6/17/11 | |||||||||||
| 10.11† |
OEM Agreement, dated September 9, 2009, between Imperva, Inc., Imperva, Ltd. and American Portwell Technology Inc. | S-1 | 333-175008 | 10.11 | 6/17/11 | |||||||||||
| 10.12† |
OEM Agreement, dated September 9, 2009, between Imperva, Inc., Imperva, Ltd. and Dan-El Technologies, Ltd. | S-1 | 333-175008 | 10.12 | 6/17/11 | |||||||||||
| 10.13 |
Lease Agreement, dated February 6, 2008, between Imperva, Inc. and Westport Office Park, LLC. | S-1 | 333-175008 | 10.13 | 6/17/11 | |||||||||||
| 10.14 |
First Amendment to Lease, dated February 12, 2010, between Imperva, Inc. and Westport Office Park, LLC. | S-1 | 333-175008 | 10.14 | 6/17/11 | |||||||||||
| 10.15 |
Series A Preferred Stock Purchase Agreement, dated November 5, 2009, between Incapsula, Inc. and Imperva, Inc. | S-1/A | 333-175008 | 10.15 | 7/28/11 | |||||||||||
| 10.16 |
Series A and Series A-1 Preferred Stock Purchase Agreement, dated March 9, 2010, by and among Incapsula, Inc. and the investors party thereto. | S-1/A | 333-175008 | 10.16 | 7/28/11 | |||||||||||
| 10.17 |
Amended and Restated Investors’ Rights Agreement, dated March 9, 2010, by and among Incapsula, Inc. and the investors party thereto. | S-1/A | 333-175008 | 10.17 | 7/28/11 | |||||||||||
| 10.18 |
Amendment No. 1 to the Series A and Series A-1 Preferred Stock Purchase Agreement, dated December 31, 2010, by and among Incapsula, Inc. and the investors party thereto. | S-1/A | 333-175008 | 10.18 | 7/28/11 | |||||||||||
| 10.19# |
2011 Employee Stock Purchase Plan. | S-1/A | 333-175008 | 10.19 | 10/28/11 | |||||||||||
| 10.20 |
Offer Letter, dated July 14, 2011, between Imperva, Inc. and David N. Strohm. | S-1/A | 333-175008 | 10.20 | 10/28/11 | |||||||||||
| 10.21 |
Offer Letter, dated July 20, 2011, between Imperva, Inc. and Frank Slootman. | S-1/A | 333-175008 | 10.21 | 10/28/11 | |||||||||||
| 10.22 |
Amendment No. 2 to the Series A and Series A-1 Preferred Stock Purchase Agreement, dated October 24, 2011, by and among Incapsula, Inc. and the investors party thereto. | S-1/A | 333-175008 | 10.22 | 10/28/11 | |||||||||||
| 10.23# |
2012 Imperva Compensation Plan for Ralph Pisani. | X | ||||||||||||||
| 10.24# |
2012 Imperva Compensation Plan for Jason Forget. | X | ||||||||||||||
| 10.25# |
Imperva, Inc. 2012 Senior Management Bonus Plan. | X | ||||||||||||||
| 10.26# |
Imperva, Inc. Change in Control Plan and Form Notice of Participation. | X | ||||||||||||||
| 21.1 |
Subsidiaries of Imperva, Inc. | X | ||||||||||||||
| 23.1 |
Consent of Ernst & Young LLP, Independent Registered Public Accounting Firm. | X | ||||||||||||||
92
Table of Contents
| 23.2 |
Consent of Kost Forer Gabbay & Kasierer, a member of Ernst & Young Global, Independent Registered Public Accounting Firm. | X | ||||||||||
| 31.1 |
Certification of Principal Executive Officer Pursuant to Securities Exchange Act Rule 13a-14(a). | X | ||||||||||
| 31.2 |
Certification of Principal Financial Officer Pursuant to Securities Exchange Act Rule 13a-14(a). | X | ||||||||||
| 32.1 |
Certification of Principal Executive Officer Pursuant to 18 U.S.C. Section 1350 and Securities Exchange Act Rule 13a-14(b).* | X | ||||||||||
| 32.2 |
Certification of Principal Financial Officer Pursuant to 18 U.S.C. Section 1350 and Securities Exchange Act Rule 13a-14(b).* | X | ||||||||||
| † | Certain portions of this exhibit have been omitted and have been filed separately with the SEC pursuant to a request for confidential treatment under Rule 24b-2 as promulgated under the Securities Exchange Act of 1934, as amended. |
| # | Indicates management contract or compensatory plan or arrangement. |
| * | This certification is not deemed “filed” for purposes of Section 18 of the Securities Exchange Act, or otherwise subject to the liability of that section. Such certification will not be deemed to be incorporated by reference into any filing under the Securities Act of 1933 or the Securities Exchange Act of 1934, except to the extent that Imperva, Inc. specifically incorporates it by reference. |
93