Attached files
| file | filename |
|---|---|
| 8-K - CURRENT REPORT - TAIWAN FUND INC | v306852_8k.htm |
| THE TAIWAN FUND, INC. (THE ‘FUND’) |
MONTHLY INSIGHT
FEBRUARY 29, 2012
IN BRIEF
| Net asset value per share | US$18.51 |
| Market price | US$17.18 |
| Premium/(discount) | (7.19%) |
| Fund size | US$343.8m |
Source: State Street Bank and Trust Company.
| At January 31, 2012 | US$ return | |
| Fund* | TAIEX Index† | |
| % | % | |
| One month | 7.4 | 8.7 |
| Three months | 18.9 | 21.4 |
| One year | (1.9) | (0.6) |
| Three years % pa | 26.9 | 32.9 |
Past performance is not a guide to future returns.
Returns are annualized, except for periods of less than one year.
*Source: State Street Bank and Trust Company.
NAV performance.
†Source: TWSE. The index shown is the TAIEX Total Return Index.
At the Fund’s Annual Stockholders Meeting held on February 23, 2012, the stockholders of the Fund voted to approve the proposed Investment Advisory and Management Agreement between the Fund and Martin Currie, Inc. (“Martin Currie”) and the proposed Sub-Advisory Agreement between Martin Currie and APS Asset Management Pte Ltd. (“APS”). APS is a Singapore based investment management firm that specializes in Asia Pacific equity investments with a particular focus on China and Greater China. APS has a team of ten analysts based across Beijing, Shanghai and Shenzhen.
FUND MANAGERS
 |
 |
||
| Wong Kok Hoi | James Liu |
MANAGER’S COMMENTARY
Having started the year well with a strong January, the Taiwanese equity market gathered more steam in February. The ‘risk-on’ trading continued, with the Greek sovereign-debt issue drawing closer to a near-term solution and the ECB’s announcement of a second round of long-term refinancing operations (LTRO). The Taiwanese market, which is inherently more cyclical given the high concentration of export-oriented electronics companies, experienced a strong inflow of liquidity after being sold down last year. The Taiwan Stock Exchange Index ended the month up 8.7%.
A major focus for the market’s attention during the month was the Mobile World Congress (MWC), held in Barcelona in the week of 27 February. Apple and Samsung had a limited presence at this year’s MWC, so HTC took center stage and unveiled the ‘One’ series of smartphones with competitive hardware specifications. Also drawing a lot of attention were Chinese brands ZTE and Huawei. Having started out as manufacturers of low-end smartphones for the domestic market, both of them ambitiously announced several high-end models apparently poised to compete in developed markets. Consumers may be pleased to note that the CPUs and displays are being rapidly upgraded. But it might be a worrying trend for manufacturers, as other than hardware specs, there seems to be little to obviously differentiate one phone model from another. It seems that all smartphones will shortly boast similar ‘big capacitive touch screens’, powerful quad-core CPUs, and a slim body. This makes smartphones more and more like PCs: aside from cost reduction, there doesn’t seem to be much that manufacturers can do to really make their phones stand out from all the rest. Smartphone shipments will continue to grow strongly, but because of competition, manufacturers’ profitability may not follow accordingly. This trend warrants close follow-up of the industry – and careful stock-picking.
The liquidity that has been flooding in has lifted all stocks, especially those that had experienced the most severe corrections towards the end of last year. In addition, fund managers with high cash positions are feeling compelled to pick high-beta stocks in an attempt to catch up after underperforming in the earlier leg of the rally. Retail investors are becoming more risk-tolerant again as share prices escalate. In this environment, fundamentals have, to some extent, taken a back seat in share-price movements. However, with the results season coming, fundamentals should start to reassert themselves. If the market takes a breather after a strong two months, this would represent a favorable opportunity for stock-picking investors like ourselves.
MONTHLY INSIGHT
INVESTMENT STRATEGY
During the month we made no new purchases, but sold the holdings in three stocks: Clevo, which manufactures and sells laptops and notebook computers as well as operating IT malls in China; Jih Sun Financial Holding (“Jun Sun”); and Wah Lee Industrial (“Wah Lee”), a provider of industrial materials.
Clevo is now overvalued, in our opinion. Its notebook PC ODM business is just about breaking even, and the IT-mall business, although growing fast, is unable to justify the current valuation.
Jih Sun’s business is heavily skewed towards brokerage, which generates around 60% of its revenue, while the remaining 40% comes from net interest income. In Taiwan’s crowded brokerage market, Jih Sun’s share is only 3.9%. Given the lack of scale, the company is facing an uphill battle to gain market share. Yuanta Financials and KGI, which are the two largest brokers in Taiwan, are better proxies to harness the potential upside from a rebound in stock-market transaction volume; both Yuanta and KGI are currently held in the portfolio.
Finally, after talking to Wah Lee’s management, we believe that the company will very likely experience a drop in fourth-quarter revenue as well as in 2012 earnings. Top-line growth should be moderate in 2012, but margins are likely to be squeezed.
Source: Martin Currie Inc. and APS Asset Management Pte Ltd.
For further information please go to www.thetaiwanfund.com.
Martin Currie Inc. took over management of the Fund on May 9, 2010.
FUND DETAILS
| February 29, 2012 | |
| Market cap | US$319.1m |
| Shares outstanding | 18,576,090 |
| Exchange listed | NYSE |
| Listing date | 1986 |
| Investment manager | Martin Currie Inc |
Source: State Street Bank and Trust Company.
| PERFORMANCE | (US$ RETURNS) | |
| (US$ returns) | NAV % | Market price % |
| One month | 7.4 | 11.7 |
| Three months | 18.9 | 20.9 |
| Three years % pa | 26.9 | 29.2 |
Past performance is not a guide to future returns. Returns are annualized, except for periods of less than one year.
Source: State Street Bank and Trust Company.
| SECTOR ALLOCATION | ||
| Fund %* | Benchmark %† | |
| Finance | 18.2 | 12.3 |
| Electronics | 17.5 | 50.7 |
| Wholesale and retail | 16.1 | 5.9 |
| Construction | 9.8 | 1.7 |
| Healthcare | 7.9 | — |
| Transportation | 5.8 | 2.3 |
| Foods | 3.1 | 1.7 |
| Steel and iron | 3.0 | 3.0 |
| Textiles | 3.0 | 1.9 |
| Electric and machinery | 2.2 | 1.4 |
| Plastics | 1.6 | 8.6 |
| Cement | 1.1 | 1.3 |
| Chemicals | — | 2.2 |
| Others | — | 2.3 |
| Rubber | — | 1.6 |
| Automobile | — | 1.5 |
| Tourism | — | 0.5 |
| Glass and ceramics | — | 0.4 |
| Electrical appliance and cable | — | 0.4 |
| Paper and pulp | — | 0.3 |
| Other assets and liabilities, net | 10.7 | — |
*Source: State Street Bank and Trust Company.
†Source: TWSE.
| 15 LARGEST HOLDINGS* | ||
| 49.7% of holdings | Sector | % of net |
| assets | ||
| WT Microelectronics | Electronics | 4.7 |
| President Chain Store | Wholesale and retail | 4.4 |
| Ruentex Development | Construction | 3.7 |
| Mercuries & Associates | Wholesale and retail | 3.6 |
| KGI Securities | Finance | 3.5 |
| Chinatrust Financial Holding | Finance | 3.4 |
| Yuanta Financial Holding | Finance | 3.3 |
| Uni-President Enterprises | Foods | 3.1 |
| First Steamship | Transportation | 3.1 |
| YungShin Global Holding | Healthcare | 3.1 |
| SinoPac Financial Holdings | Finance | 3.0 |
| Tung Ho Steel Enterprise | Steel and iron | 3.0 |
| Far Eastern Department Stores | Wholesale and retail | 2.8 |
| Fubon Financial Holding | Finance | 2.6 |
| Advantech | Electronics | 2.4 |
*Source: State Street Bank and Trust Company.
| PERFORMANCE | (US$ returns at February 29, 2012) | ||||||||
| One month | Three months | Calendar year | One year | Three years | Five years | Ten years | Since launch | ||
| % | % | to date | % | % pa | % pa | % pa | % pa | ||
| % | |||||||||
| The Taiwan Fund, Inc.* | 7.4 | 18.9 | 16.1 | (1.9 | ) | 26.9 | 3.8 | 5.6 | 9.1 |
| TAIEX Index† | 8.7 | 21.4 | 18.3 | (4.4 | ) | 28.4 | 2.9 | 5.5 | 9.0 |
| TAIEX Total Return Index† | 8.7 | 21.4 | 18.3 | (0.6 | ) | 32.9 | 6.9 | na | na |
| MSCI Taiwan Index† | 7.4 | 20.6 | 17.1 | (0.7 | ) | 30.3 | 4.3 | 6.5 | na |
Past performance is not a guide to future returns. Returns are annualized, except for periods of less than one year.
*Source: State Street Bank and Trust Company. Launch date December 23, 1986. Returns for the Fund are historical total returns that reflect changes in net asset value per share during each period and assume that dividends and capital gains, if any, were reinvested.
†Source: MSCI for the MSCI Taiwan Index and TWSE for the TAIEX Total Return Index and the TAIEX Index. For a full description of each index please see the index descriptions section.
Returns for the TAIEX Index are not total returns and reflect only changes in the share price but do not assume that cash dividends, if any, were reinvested, and thus are not strictly comparable to the Fund returns.
The TAIEX Total Return Index commenced January 1, 2003.
MONTHLY INSIGHT
| PORTFOLIO IN FULL | |||||||
| Company | % of | ||||||
| Sector | (BGB ticker) | Price | Holding | Value US$ | net assets | ||
| FINANCE | 18.2 | ||||||
| KGI Securities | 6008 | TT | NT$13.2 | 26,527,658 | $11,911,998 | 3.5 | |
| Chinatrust Financial Holding | 2891 | TT | NT$20.0 | 17,223,268 | $11,718,103 | 3.4 | |
| Yuanta Financial Holding | 2885 | TT | NT$17.4 | 19,238,900 | $11,355,113 | 3.3 | |
| SinoPac Financial Holdings | 2890 | TT | NT$11.0 | 28,093,205 | $10,512,493 | 3.0 | |
| Fubon Financial Holding | 2881 | TT | NT$34.6 | 7,716,706 | $9,082,801 | 2.6 | |
| China Life Insurance | 2823 | TT | NT$30.6 | 5,193,784 | $5,397,677 | 1.6 | |
| Union Bank of Taiwan | 2838 | TT | NT$10.7 | 7,507,000 | $2,719,743 | 0.8 | |
| ELECTRONICS | 17.5 | ||||||
| WT Microelectronics | 3036 | TT | NT$43.7 | 10,908,556 | $16,198,070 | 4.7 | |
| Advantech | 2395 | TT | NT$99.0 | 2,426,100 | $$8,170,632 | 2.4 | |
| Aurora | 2373 | TT | NT$52.7 | 4,060,000 | $7,278,610 | 2.1 | |
| Wistron NeWeb | 6285 | TT | NT$66.7 | 3,117,000 | $7,072,523 | 2.1 | |
| HTC | 2498 | TT | NT$661.0 | 298,000 | $6,700,844 | 1.9 | |
| Taiflex Scientific | 8039 | TT | NT$42.3 | 3,452,821 | $4,968,510 | 1.5 | |
| GeoVision | 3356 | TT | NT$124.5 | 989,000 | $4,188,682 | 1.2 | |
| MPI | 6223 | TT | NT$79.7 | 1,448,000 | $3,925,895 | 1.1 | |
| Tatung | 2371 | TT | NT$9.9 | 4,770,897 | $1,609,991 | 0.5 | |
| WHOLESALE AND RETAIL | 16.1 | ||||||
| President Chain Store | 2912 | TT | NT$155.5 | 2,840,000 | $15,023,132 | 4.4 | |
| Mercuries & Associates | 2905 | TT | NT$34.0 | 10,576,169 | $12,232,608 | 3.6 | |
| Far Eastern Department Stores | 2903 | TT | NT$40.6 | 6,953,070 | $9,591,339 | 2.8 | |
| Test-Rite International | 2908 | TT | NT$20.8 | 10,622,000 | $7,497,840 | 2.2 | |
| PC Home Online | 8044 | TT | NT$175.0 | 1,071,588 | $6,379,368 | 1.8 | |
| Taiwan Tea | 2913 | TT | NT$15.9 | 8,231,000 | $4,452,065 | 1.3 | |
| CONSTRUCTION | 9.8 | ||||||
| Ruentex Development | 9945 | TT | NT$39.2 | 9,598,082 | $12,782,858 | 3.7 | |
| Hung Poo Real Estate Development | 2536 | TT | NT$29.3 | 4,929,873 | $4,913,773 | 1.5 | |
| Goldsun Development & Construction | 2504 | TT | NT$12.7 | 11,314,980 | $4,888,429 | 1.4 | |
| Acter | 5536 | TT | NT$118.0 | 941,179 | $3,778,035 | 1.1 | |
| King’s Town Construction | 2524 | TT | NT$25.4 | 4,261,680 | $3,682,361 | 1.1 | |
| Taiwan Land Development | 2841 | TT | NT$12.7 | 8,177,799 | $3,533,067 | 1.0 | |
| HEALTHCARE | 7.9 | ||||||
| YungShin Global Holding | 3705 | TT | NT$43.2 | 7,239,000 | $10,638,345 | 3.1 | |
| Excelsior Medical | 4104 | TT | NT$71.6 | 3,133,729 | $7,632,841 | 2.2 | |
| St.Shine Optical | 1565 | TT | NT$371.0 | 392,000 | $4,947,340 | 1.5 | |
| Pacific Hospital Supply | 4126 | TT | NT$91.9 | 1,223,142 | $3,823,879 | 1.1 | |
| TRANSPORTATION | 5.8 | ||||||
| First Steamship | 2601 | TT | NT$46.4 | 6,775,000 | $10,682,448 | 3.1 | |
| Farglory F T Z Investment Holding | 5607 | TT | NT$20.9 | 9,624,000 | $6,842,482 | 2.0 | |
| Taiwan High Speed Rail | 2633 | TT | NT$5.8 | 12,597,600 | $2,464,152 | 0.7 | |
| FOODS | 3.1 | ||||||
| Uni-President Enterprises | 1216 | TT | NT$45.1 | 6,996,000 | $10,721,520 | 3.1 | |
| STEEL AND IRON | 3.0 | ||||||
| Tung Ho Steel Enterprise | 2006 | TT | NT$30.4 | 10,099,000 | $10,443,924 | 3.0 |
| Company | % of | ||||||
| Sector | (BGB ticker) | Price | Holding | Value US$ | net assets | ||
| TEXTILES | 3.0 | ||||||
| Far Eastern New Century | 1402 | TT | NT$37.8 | 4,216,836 | $5,415,212 | 1.6 | |
| Makalot Industrial | 1477 | TT | NT$77.9 | 1,828,000 | $4,844,237 | 1.4 | |
| ELECTRIC AND MACHINERY | 2.2 | ||||||
| Yungtay Engineering | 1507 | TT | NT$46.5 | 3,274,000 | $5,173,401 | 1.5 | |
| Good Friend International Holdings | 2398 | TT | NT$17.9 | 4,145,000 | $2,516,950 | 0.7 | |
| PLASTICS | 1.6 | ||||||
| Yem Chio | 4306 | TT | NT$26.9 | 5,979,833 | $5,461,917 | 1.6 | |
| CEMENT | 1.1 | ||||||
| Wei Mon Industry | 8925 | TT | NT$17.0 | 6,433,854 | $3,720,762 | 1.1 | |
| OTHER ASSETS AND LIABILITIES, NET | $36,939,007 | 10.7 |
MONTHLY INSIGHT
THE TAIWAN FUND, INC. PREMIUM/DISCOUNT
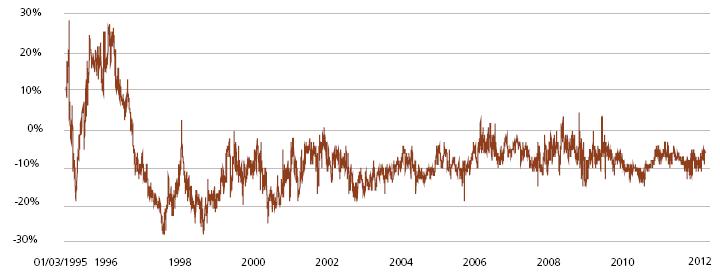
Source: State Street Bank and Trust Company as of January 31, 2012.
INDEX DESCRIPTIONS
TAIEX Index
The TWSE, or TAIEX Index is a capitalization-weighted index of all listed common shares traded on the Taiwan Stock Exchange. The index was based in 1966 and does not include re-invested dividends.
TAIEX Total Return Index
The TAIEX Total Return Index is a capitalization-weighted index of all listed common shares traded on the Taiwan Stock Exchange, based in 1966, which includes re-invested dividends.
MSCI Taiwan Index
The MSCI Total Return Taiwan Index is a free-float adjusted market capitalization index. The index represents Taiwanese companies that are available to investors worldwide. The Index has a base date of December 31, 1987. As of October 31, 2011, it contained 122 constituents.
OBJECTIVE
The Fund was launched on December 23, 1986 to allow US and other investors to access and participate in the growth of the economy and the stock market in Taiwan, the Republic of China. The Fund’s investment objective is to seek long-term capital appreciation primarily through investments in equity securities listed in Taiwan. The Fund is a diversified, closed-end management investment company listed on the New York Stock Exchange (NYSE) under the symbol ‘TWN’.
Taiwan, with its global market leadership in high technology goods and its significant investments throughout mainland China and Southeast Asian economies, is now an integral economic player in the Asia Pacific Region as well as around the world. Investing in Taiwan not only allows investors to capitalize on Taiwan’s dynamic economy, but also allows investors to reap the growth and investment potential of the mainland China and other emerging economies of the region.
| CONTACTS |
The Taiwan Fund, Inc.
c/o State Street Bank and Trust Company
2 Avenue de Lafayette
PO Box 5049
Boston, MA 02111
Tel: (1) 877-864-5056
| www.thetaiwanfund.com |
IMPORTANT INFORMATION
This document is issued and approved by Martin Currie Inc (‘MC Inc’), as investment adviser of The Taiwan Fund, Inc. (the ‘Fund’). MC Inc is authorised and regulated by the Financial Services Authority (‘FSA’) and incorporated under limited liability in New York, USA. Registered in Scotland (No BR2575), registered address Saltire Court, 20 Castle Terrace, Edinburgh, EH1 2ES. Information herein is believed to be reliable but has not been verified by MC Inc. MC Inc makes no representation or warranty and does not accept any responsibility in relation to such information or for opinion or conclusion which the reader may draw from this newsletter.
The Fund is classified as a diversified investment company under the US Investment Company Act of 1940 as amended. It meets the criteria of a closed ended US fund and its shares are listed on the New York Stock Exchange. MC Inc has been appointed investment adviser to the Fund.
Investors are advised that they will not generally benefit from the rules and regulations of the United Kingdom Financial Services and Markets Act 2000 and the FSA for the protection of investors, nor benefit from the United Kingdom Financial Services Compensation Scheme, nor have access to the Financial Services Ombudsman in the event of a dispute. Investors will also have no rights of cancellation under the FSA’s Conduct of Business Sourcebook of the United Kingdom.
This newsletter does not constitute an offer of shares. MC Inc, its ultimate and intermediate holding companies, subsidiaries, affiliates, clients, directors or staff may, at any time, have a position in the market referred to herein, and may buy or sell securities, currencies, or any other financial instruments in such markets. The information or opinion expressed in this newsletter should not be construed to be a recommendation to buy or sell the securities, commodities, currencies or financial instruments referred to herein.
The information provided in this report should not be considered a recommendation to purchase or sell any particular security. There is no assurance that any securities discussed herein will remain in an account’s portfolio at the time you receive this report or that securities sold have not been repurchased.
It should not be assumed that any of the securities transactions or holdings discussed here were or will prove to be profitable, or that the investment recommendations or decisions we make in the future will be profitable or will equal the investment performance of the securities discussed herein.
Investing in the Fund involves certain considerations in addition to the risks normally associated with making investments in securities. The value of the shares issued by the Fund, and the income from them, may go down as well as up and there can be no assurance that upon sale, or otherwise, investors will receive back the amount originally invested. There can be no assurance that you will receive comparable performance returns, or that investments will reflect the performance of the stock examples contained in this document. Movements in foreign exchange rates may have a separate effect, unfavorable as well as favorable, on the gain or loss otherwise experienced on an investment. Past performance is not a guide to future returns. Accordingly, the Fund is only suitable for investment by investors who are able and willing to withstand the total loss of their investment. In particular, prospective investors should consider the following risks:
 |
It should be noted that investment in the Fund is only suitable for sophisticated investors who are aware of the risk of investing in Taiwan and should be regarded as long term. Funds which invest in one country carry a higher degree of risk than those with portfolios diversified across a number of markets. |
|
Investment in the securities of smaller and unquoted companies can involve greater risk than is customarily associated with investment in larger, more established, companies. In particular, smaller companies often have limited product lines, markets or financial resources and their management may be dependent on a smaller number of key individuals. In addition, the market for stock in smaller companies is often less liquid than that for stock in larger companies, bringing with it potential difficulties in acquiring, valuing and disposing of such stock. Proper information for determining their value, or the risks to which they are exposed, may not be available. |
|
Investments within emerging markets such as Taiwan can be of higher risk. Many emerging markets, and the companies quoted on their stock exchanges, are exposed to the risks of political, social and religious instability, expropriation of assets or nationalization, rapid rates of inflation, high interest rates, currency depreciation and fluctuations and changes in taxation which may affect the Fund’s income and the value of its investments. |
|
The marketability of quoted shares may be limited due to foreign investment restrictions, wide dealing spreads, exchange controls, foreign ownership restrictions, the restricted opening of stock exchanges and a narrow range of investors. Trading volume may be lower than on more developed stockmarkets, and equities are less liquid. Volatility of prices can also be greater than in more developed stockmarkets. The infrastructure for clearing, settlement and registration on the primary and secondary markets may be undeveloped. Under certain circumstances, there may be delays in settling transactions in some of the markets. |


Martin Currie Inc registered in Scotland (no BR2575)
Registered office: Saltire Court, 20 Castle Terrace, Edinburgh EH1 2ES
Tel: 44 (0) 131 229 5252 Fax: 44 (0) 131 228 5959 www.martincurrie.com
North American office: 1350 Avenue of the Americas, Suite 3010, New York, NY
10019, USA Tel: (1) 212 258 1900 Fax: (1) 212 258 1919
Authorised and regulated by the Financial Services Authority and incorporated with
limited liability in New York, USA. Registered with the SEC as an investment adviser.
Please note: calls to the above numbers may be recorded.