Attached files
| file | filename |
|---|---|
| 8-K - FORM 8-K - ONVIA INC | d323120d8k.htm |
 |
 TABLE
OF CONTENTS
Safe Harbor
Proxy Communication Statement
Investment Case for Turnaround Plan
Appendix: Business Summary
*
*
* |
| This
presentation may contain, in addition to historical information, forward-looking statements as defined in the Private Securities Litigation Reform Act
of 1995. Words such as "believe," "demonstrate,"
"expect," "estimate," "anticipate," "should" and "likely" and similar expressions identify forward-
looking statements. In addition, statements that are not historical should
also be considered forward-looking statements. Forward-looking statements
contained in this presentation may relate to, but are not limited to, statements
regarding Onvia’s future results of operations, the progress to be made by
Onvia’s
turnaround
plan,
the
future
financial
impact
of
Onvia’s
new
business
model,
future
options
for
Onvia
to
maximize
value
for
stockholders,
Onvia’s
future
product
offerings,
and
Onvia’s
ability
to
use
its
net
operating
losses
to
offset
future
taxable
net
income.
Such
forward-looking
statements
are
based on current expectations that involve a number of known and
unknown risks, uncertainties and other factors, which may cause
actual events to be
materially different from those expressed or implied by such forward-looking
statements. The following factors, among others, could cause actual
results to differ materially from those described in the forward-looking
statements: Onvia's "targeted accounts" strategy may fail to increase contract
value of new customers; identifying partners to distribute Onvia's content may be
slower than expected; client adoption of Onvia's enterprise solutions may be
slower than expected; Onvia's market driven product development process may fail to improve sales penetration and client retention rates; and
Onvia's technology may fail to handle the increased demands on its infrastructure
caused by increasing network traffic and the volume of aggregated
data.
Additional
information
on
factors
that
may
impact
these
forward-looking
statements
can
be
found
in
the
"Business,"
"Management's
Discussion
and Analysis of Financial Condition and Results of Operations" and "Risk
Factors" sections, as applicable, in Onvia's Annual Report on Form 10-K for
the year December 31, 2010 and Quarterly Report on Form 10-Q for the quarter
ended September 30, 2011. Although Onvia believes that the
expectations reflected in the forward-looking statements are reasonable, you should not rely upon forward-looking
statements as predictions of future events.
Onvia cannot guarantee that future results, levels of activity,
performance or events and circumstances
reflected in the forward-looking statement will be achieved or occur.
The
information
contained
in
this
presentation
is
as
of
the
date
indicated.
Onvia
assumes
no
obligation
(and
expressly
disclaims
any
such
obligation)
to
update
any
forward-looking
statements
contained
in
this
presentation
as
a
result
of
new
information,
future
events
or
developments,
or
otherwise.
SAFE HARBOR
3
*
* |
| PROXY
COMMUNICATIONS STATEMENT This presentation may be deemed to be solicitation
material in respect of the solicitation of proxies from stockholders in
connection with the 2012 annual meeting of stockholders. Onvia, Inc.
(“Onvia”) and its directors and certain executive officers are deemed
participants
in
the
solicitation
of
proxies
from
stockholders
in
connection
with
the
2012
Annual Meeting of Stockholders (the “2012 Annual Meeting”). Onvia plans
to file a preliminary proxy statement with the Securities and Exchange
Commission (the “SEC”) relating to the 2012 Annual Meeting.
Information regarding the interests of such participants will be included in
the Preliminary Proxy Statement. WE URGE INVESTORS TO READ THE PRELIMINARY
PROXY STATEMENT (INCLUDING ANY SUPPLEMENTS THERETO) AND ANY OTHER RELEVANT
DOCUMENTS THAT ONVIA WILL FILE WITH THE SEC WHEN THEY BECOME AVAILABLE
BECAUSE THEY WILL CONTAIN IMPORTANT
INFORMATION.
Stockholders
will
be
able
to
obtain,
free
of
charge,
copies
of
the
Preliminary
Proxy
Statement
and
any
other
documents
filed
by
Onvia
with
the
SEC
in
connection with the 2012 Annual Meeting at the SEC’s website at
http://www.sec.gov and Onvia’s website at http://www.onvia.com.
*
* |
 INVESTMENT CASE FOR TURNAROUND PLAN
*
*
*
*
*
*
*
*
*
*
*
*
*
*
*
*
* |
 KEY
POINTS Developing a high value added, proprietary database
Significant progress made against turnaround plan, operating risks mitigated
Continual value creation for clients and stockholders
Risks are manageable
Execution of turnaround plan will maximize stockholder value
Onvia Board and stockholder interests are aligned
*
*
* |
 DEVELOPING A HIGH VALUE ADDED PROPRIETARY
DATABASE
•
Database and decision
analytics company
•
Proprietary content
•
Significant barriers to
entry
•
“Must have”
solutions
•
Pricing power based on
value delivered
•
Strong customer loyalty/
retention
•
Best in class consultative
selling organization
•
Exceptional domain
knowledge
•
Profitable, sustainable growth
•
Highly predictable financial
performance
•
Strong operating leverage
•
Potential for 30%
EBITDA margins
•
95% of EBITDA
converts to net income
•
Generates free cash flow
•
Significant investment
in infrastructure in
2008-2010
•
No federal income taxes
•
Compelling options to
maximize stockholder value in
the next few years:
•
Sale: go private with
strategic or financial
buyer
•
Sale: public buyer
•
Stay public: build scale
with acquisitions and
organic growth
* |
 SIGNIFICANT PROGRESS MADE, OPERATING
RISKS MITIGATED
Onvia Attributes
January 2011
March 2012
Culture
Insular
Customer-Centric
Target Market
Poorly Defined
Low Lifetime Value
New
client
ACVC
-
$3,900
Targeted Accounts
High Lifetime Value
New
Client
ACVC
–
nearly
doubled
to
$6,800
Business Model
Transactional
Growth without Profit
Solution-Based
Monetize Added Value
Sales Process
Lack of Repeatable Process
SMB is Disciplined and Effective
Imposing Same Process on Enterprise
Database Platform
Difficult to Use
Onvia 5 Launched 2/12
Database Strategy
No Value-Add
Data Not Normalized
Low Barrier to Entry
Adding Enhanced, Differentiated Content
Data Normalization Initiated
Increasing Barriers
Value Proposition
Sales Leads Only
Commodity Vendor
Product Roadmap Expands Client Value
Becoming a High Value Business Partner
Financial Results
EBITDA -
$1.8MM
Net Loss –
($805k)
EBTIDA -
$3.8MM
Net Income –
$1.6MM
8 |
 CONTINUAL VALUE CREATION FOR CLIENTS
AND STOCKHOLDERS
9
* |
 RISKS
ARE MANAGEABLE Execution Risk
Magnitude
Mitigation Strategy
Content Expansion
Low
Core Competency
Taxonomy
Low
Hired Skillset in 2011
Data Normalization
Medium
Using Third Party Tools
Develop Decision Analytics
Medium
Content Capture 2012
Third Party Applications
Sell Analytics
Low
Market Validation Complete
Solution Selling Successful in H2 2011
Delay in Execution of
Strategy
Medium
Leverage Third Party Tools
**
** |
 EXECUTION OF TURNAROUND PLAN WILL
MAXIMIZE STOCKHOLDER VALUE
Moving to a Business Model with Higher Stockholder Value
—
Higher valuations for Database vs. Lead Generation companies
—
Scalable business model with significant operating leverage
Value Creation at Each Stage of Turnaround Plan
—
Continued increases in EBITDA, Cash and Net Income in each year of
turnaround
Leverage Significant Technology Investment from 2008-2010 with Right
Strategy, Leadership, Organization and Culture
* |
 EXECUTION OF TURNAROUND PLAN WILL
MAXIMIZE STOCKHOLDER VALUE
Market Validation for Product Roadmap
—
Doubled ACVC in 2011
Management Team Has Proven It Can Execute Successfully in 18 Months
—
Defined Strategy and Product Roadmap
—
Aligned Organization to Execute Strategy
—
Institutionalized Customer-Centric Culture
—
Redefined Market
—
Moved from Transactional to Solutions Selling
—
Executed Phase One of Roadmap (Onvia 5)
—
Began to Normalize Data (Public Sector Agencies)
Board of Directors In Alignment with Stockholders
* |
 ONVIA
BOARD AND STOCKHOLDER INTERESTS ARE ALIGNED
Our Board, consistent with its fiduciary duties, remains receptive to
any option that would maximize value for ALL our stockholders but
believes
that
any
sale
of
Onvia
now
would
likely
be
a
“fire
sale”
that
would deprive our stockholders of the opportunity to share in the
future growth and profitability of Onvia
* |
 BUSINESS SUMMARY
*
*
*
*
*
*
*
* |
 TABLE
OF CONTENTS
Business Overview
Products
Financial Results
Tax Benefit Preservation Plan
Board of Directors
Corporate Governance
*
* |
 $23 million revenue provider of solutions that connects businesses to
government agency buyers, primarily within the highly decentralized state and
local government marketplace
Focused on a very targeted market of companies with a strategic,
long-term
interest in the public sector
Strong business intelligence for actionable sales and marketing activities,
expanding into data and analytics for enterprise-wide strategic planning
Solutions are organized around targeted industries
—
Architecture, Engineering, Construction
—
IT Telecom
—
Operations and Transportation
Business Information Services
ONVIA OVERVIEW |
 Onvia
Database Annual subscription
Categorized 89,000 government agencies, 275,000
company profiles, & 700,000 government personnel
Applications within the Onvia Database
Project Center
Included in core database subscription
Identify and qualify projects for specific goods and
services
Refine target markets and identify new
markets/buyers
Identify and monitor potential competitors
Evaluate awards for pricing information
CURRENT PRODUCTS
17 |
 Applications within the Onvia Database (cont)
Agency Center
Included in core database subscription
Provides insight into buying patterns, projects and
competition at the government agency level
Spending Forecast Center
Annual subscription (additional to base price)
Database of capital improvement plans, budget
documents
Used for strategic planning, such as demand
forecasting, resource allocation
CURRENT PRODUCTS
18 |
 Onvia
Guide Annual subscription
Daily sales leads from “real time”
market events
Custom Management Reports
Target upcoming contract renewals, identify
agency buyers, and inform the proposal
development process
Term contracts, contact lists, winning proposals
CURRENT PRODUCTS (CONT)
19 |
 2011
RESULTS HIGHLIGHTS Revenue: Decreased 14% to $23.2MM
Annual Contract Value (ACV): Decreased 16% to $18.5MM
Gross margin: Stable at 85%
Adjusted EBITDA: Increased 105% to $3.8MM vs. adjusted EBITDA
of $1.8MM
Net Income: Increased to $1.6MM vs. net loss of ($806k) in 2010
Cash: $11.5MM or $1.36 per share
Year ended December 31, 2011 vs. 2010
20 |
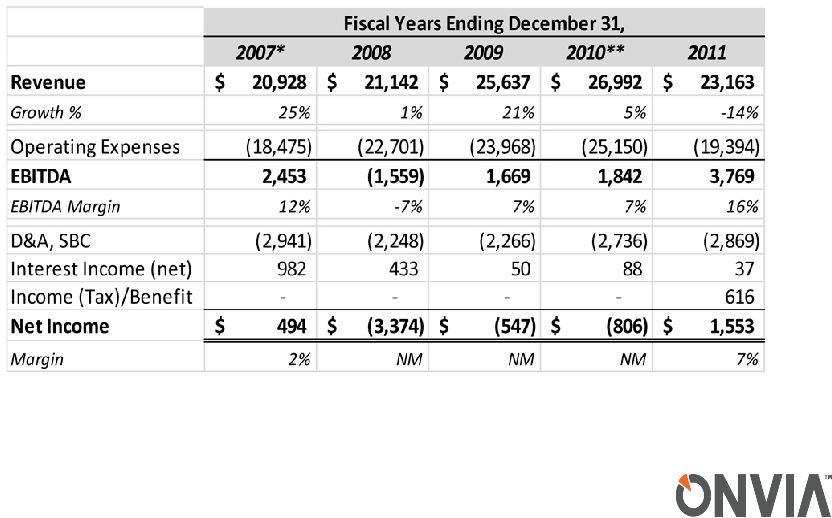 21
INCOME STATEMENTS
(IN THOUSANDS)
*2007 results include $2.7MM gain on impaired office lease
**2010 results include $967k loss on impaired capitalized software costs
|
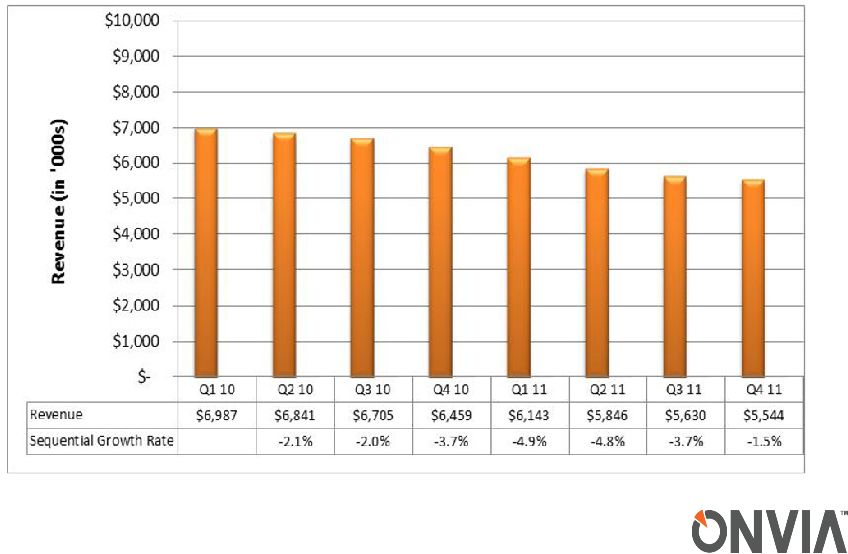 REVENUES
Growth Rates are Down but Improving Sequentially
0.9% |
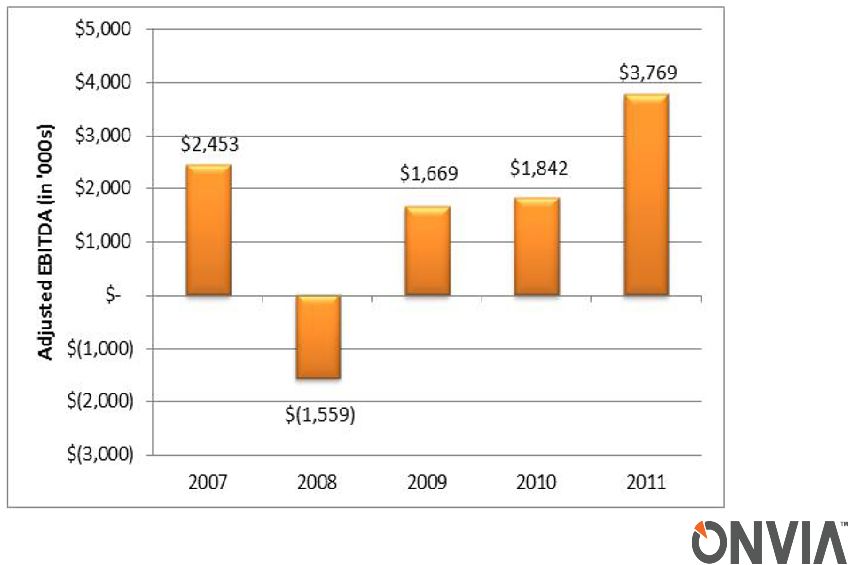 ADJUSTED EBITDA
Record Adjusted EBITDA in 2011 despite declining revenues
|
 ANNUAL
CONTRACT VALUE PER CLIENT We are acquiring and retaining our best clients
|
  25
BALANCE SHEETS
(IN THOUSANDS)
Assets
2009A
2010A
2011A
Cash and Equivalents
14,279
$
10,883
$
11,527
$
Current Assets
2,974
2,765
2,355
Fixed Assets
1,226
1,419
1,275
Internal Use Software
6,615
6,587
6,175
Total Assets
25,094
$
21,654
$
21,332
$
Liabilities
Current Liabilities
2,859
$
2,164
$
1,461
$
Unearned Revenue
11,545
10,010
8,488
Deferred Rent
920
832
714
Total Liabilities
15,324
13,005
10,663
Stockholders Equity
9,770
8,649
10,669
Total Liab and SE
25,094
$
21,654
$
21,332
$
As of December 31, |
 26
PRESERVATION OF NOLS IS IN BEST
INTERESTS OF ALL STOCKHOLDERS
Company has $73MM in net operating losses (“NOLs”) to offset future
taxable net income
—
NOLS expire beginning 2021 through 2031 –
a long-term asset
IRS rules limit the use of NOLs if there is an ownership change (greater than
50% increase involving 5% shareholders) over a three-year rolling
period. This is different than a change-in-control for other
legal purposes. Tax Benefit Preservation Plan enacted in March 2011 to
protect this long-term, significant asset from being impaired due to
such ownership changes Board of Directors retains sole discretion to exempt
any stockholder from the penalties imposed by the Rights Plan
—
All new 5% positions and >1% changes for existing 5%
shareholders |
 BOARD
OF DIRECTORS Insiders own ~8% of the Company (more with stock options)
—
Directors have been buying stock in the market
Board is paid primarily in stock options (total cash compensation $20-$30k
annually depending on responsibility).
—
Focus is realizing value not collecting fees
Independent Board with significant, relevant experience
—
Two Directors recommended by large stockholders
—
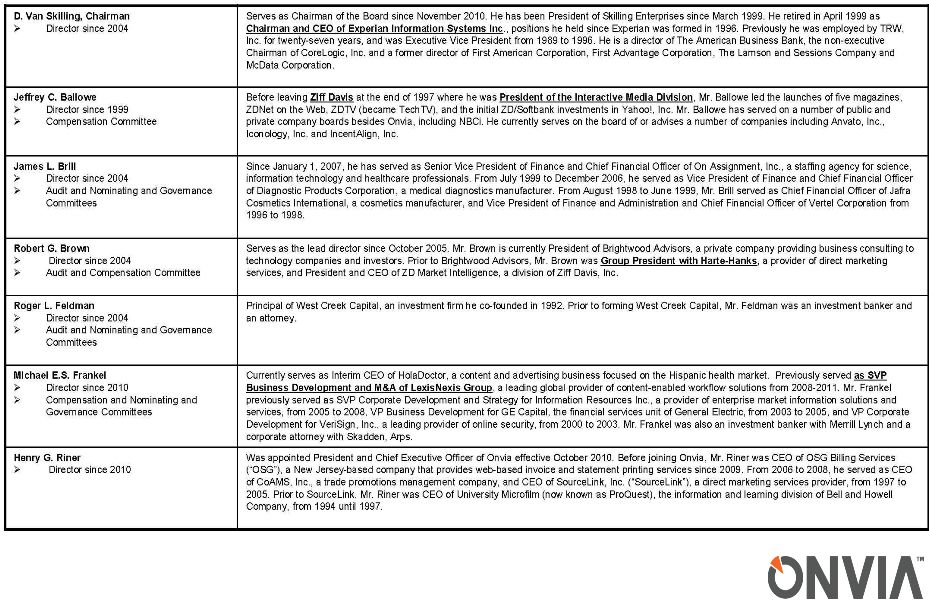
Former senior executives at major information companies (Lexis,
Experian, Harte Hanks, Ziff Davis) |
 28
BOARD OF DIRECTORS |
 CORPORATE GOVERNANCE
Six of seven current directors are independent
Separate Chairman and CEO positions with independent Chairman
Audit, Compensation, Governance and Nominating Committees comprised
solely of independent directors and meet regularly in executive sessions
without management
No related-party transactions
* |
| Hank
Riner,
President
&
CEO
Cameron
Way,
Chief
Financial
Officer
CONTACTS
Onvia Headquarters
509 Olive Way, Suite 400
Seattle, WA 98101
Tel 206.282.5170 •
Fax 206.373.8961
www.Onvia.com
30 |
 Adjusted
EBITDA:
Adjusted
EBITDA
is
not
a
financial
measure
calculated
and
presented
in
accordance with U.S. generally accepted accounting principles (“GAAP”)
and should not be considered as an alternative to net income, operating
income or any other financial measures so calculated and presented, nor as
an alternative to cash flow from operating activities as a measure of
the
company’s
liquidity.
Onvia
defines
Adjusted
EBITDA
as
net
income
before
interest
expense
and
other non-cash financing costs; taxes; depreciation; amortization; and
non-cash stock-based compensation. Other companies (including
the company’s competitors) may define adjusted EBITDA
differently. The company presents Adjusted EBITDA because it believes Adjusted EBITDA
to be an important supplemental measure of performance that is commonly used by
securities analysts, investors and other interested parties in the
evaluation of companies in similar industries and size. Management also uses
this information internally for forecasting and budgeting. It may not
be indicative of the historical operating results of Onvia nor is it intended to be
predictive of potential future results. Investors should not consider
Adjusted EBITDA in isolation or as a substitute for analysis of results as
reported under GAAP. GLOSSARY
31 |
| Annual
Contract
Value
(ACV):
ACV
represents
the
annualized
aggregate
revenue
value
of
all
subscription contracts as of the end of the quarter.
ACV
is
driven
by
Annual
Contract
Value
per
Client
(ACVC)
and
the
growth
in
the
number
of
clients. Most of the company’s revenues are generated from subscription
contracts, which are typically prepaid and have a minimum term of one year,
with revenues recognized ratably over the term of the subscription.
The company also receives revenues from multi-year content reseller licenses,
management reports, document download services, and list rental services,
which are not included in the calculation of ACV.
ACV is not a financial measure calculated and presented in accordance with U.S.
generally accepted accounting principles (“GAAP”) and should not
be considered as an alternative to revenue or any other financial measures
so calculated. Management uses this information as a basis for planning and
forecasting core business activity for future periods and believes it is useful
in understanding the results of its operations.
GLOSSARY
32
* |
 END
PRESENTATION *
*
*
*
*
*
*
* |