Attached files
| file | filename |
|---|---|
| 8-K - FORM 8-K - OCCIDENTAL PETROLEUM CORP /DE/ | form8k-20120326.htm |
EXHIBIT 99.1

Occidental Petroleum Corporation
Howard Weil
40th Annual Energy Conference
Howard Weil
40th Annual Energy Conference
Stephen I. Chazen
President and Chief Executive Officer
President and Chief Executive Officer
March 27, 2012
1

2
Full Year 2011 Results - Summary
Full Year 2011 Results - Summary
|
|
FY 2011
|
FY 2010
|
|
• Core Results
|
$6,828
|
$4,664
|
|
• Core EPS (diluted)
|
$8.39
|
$5.72
|
|
|
|
|
|
• Net Income
|
$6,771
|
$4,530
|
|
• Reported EPS (diluted)
|
$8.32
|
$5.56
|
|
|
|
|
|
• Oil and Gas production volumes
(mboe/d) +4% |
733
|
706
|
|
|
|
|
|
• Capital Spending
|
$7,518
|
$3,940
|
|
• Cash Flow from Operations
|
$12,281
|
$9,566
|
|
|
|
|
|
• Return on Equity
|
19.3%
|
14.7%
|
|
• Return on Capital Employed
|
17.2%
|
13.2%
|
|
|
|
|
($ in millions, except EPS data)
See attached for GAAP reconciliation
2

3
Overriding Goal is to Maximize Total Shareholder Return
• We believe this can be achieved through a combination of:
• Growing our oil and gas production by 5 to 8% per year on
average over the long term;
average over the long term;
• Allocating and deploying capital with a focus on achieving
well above cost-of-capital returns (ROE and ROCE);
well above cost-of-capital returns (ROE and ROCE);
– Return Targets*
• Domestic - 15+%
• International - 20+%
• Consistent dividend growth, that is superior to that of our
peers.
peers.
*Assumes Moderate Product Prices
What Is Our Philosophy & Strategy?
What Is Our Philosophy & Strategy?
3

4
Oxy’s Three Main Performance Criteria -
Production Growth, Returns & Dividend Growth
Production Growth, Returns & Dividend Growth
• We finished a strong year in terms of the three main
performance criteria outlined last quarter.
performance criteria outlined last quarter.
• Our domestic oil and gas production grew by about 12%
for 2011 to 428 mboe/d.
for 2011 to 428 mboe/d.
– 4Q11 domestic production of 449 mboe/d was the highest U.S. total
production volume in Oxy’s history, reflecting the highest ever
quarterly volume for liquids of 310 mb/d and the second highest
quarterly volume for gas.
production volume in Oxy’s history, reflecting the highest ever
quarterly volume for liquids of 310 mb/d and the second highest
quarterly volume for gas.
– Total company production increased about 4% for the year.
• Our chemical business delivered exceptional results
for the year, achieving one of their highest earnings
levels ever.
for the year, achieving one of their highest earnings
levels ever.
• Our ROE was 19% for the year and ROCE was 17%.
4

5
Net Income Return on Assets
U.S. 14%
International 37%
Total E&P 20%
Cash Flow* Return on Assets
U.S. 21%
International 54%
Total E&P 29%
* Net Income + DD&A
5 Year Average
5 Year Average
Return on Assets
See attached for GAAP reconciliation
(2007 - 2011)
5

6
• Our ability to pay dividends is indicated by our free cash
flow generation.
flow generation.
• Free cash flow after interest, taxes and capital spending,
but before dividends, acquisitions and debt activity for
2011 was about $4.8 billion.
but before dividends, acquisitions and debt activity for
2011 was about $4.8 billion.
• Last month the Board of Directors increased the
company’s dividend 17% to an annualized rate of $2.16
per share, compared to the previous annual rate of $1.84.
company’s dividend 17% to an annualized rate of $2.16
per share, compared to the previous annual rate of $1.84.
• We have now increased our dividend every year for 10
consecutive years, and a total of 11 times during that
period.
consecutive years, and a total of 11 times during that
period.
• This increase brings the company’s compound annual
dividend growth rate over the last 10 years to 15.8%.
dividend growth rate over the last 10 years to 15.8%.
Consistent Dividend Growth
See attached for GAAP reconciliation
6

7
Consistent Dividend Growth
Note: Dividends paid as per the Record Date
($/share)
7
8
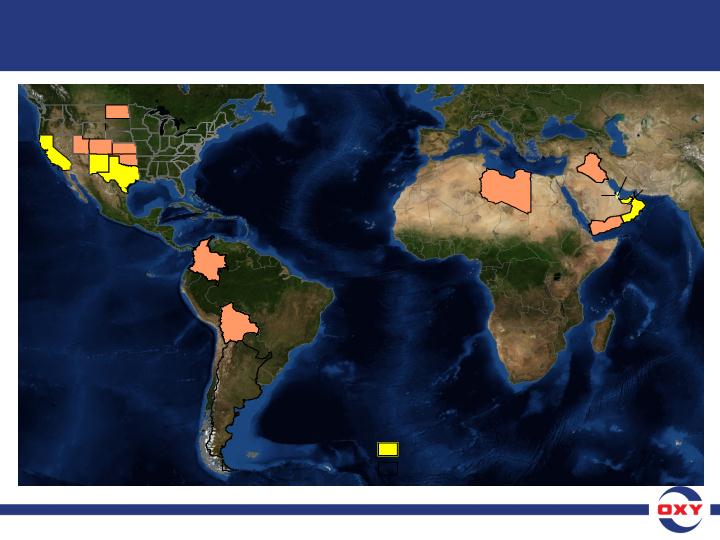
Worldwide Oil & Gas Producing Areas
Colombia
Colombia
Libya
Libya
Oman
Oman
UAE
UAE
Yemen
Yemen
Bolivia
Bolivia
Qatar
Qatar
Iraq
Iraq
Bahrain
Bahrain
Focus Areas
United States
United States
Permian
Permian
Basin
Basin
California
California
8

9
Oil & Gas Production - 1Q12 Outlook
Oil & Gas Production - 1Q12 Outlook
• During our 4Q11 earnings conference call held in late
January, we indicated:
January, we indicated:
– “At current prices, total 1Q12 sales volumes to be comparable
to 4Q11 volumes of 749 mboe/d, depending on the scheduling
of liftings.
to 4Q11 volumes of 749 mboe/d, depending on the scheduling
of liftings.
– Our 4Q11 Colombia production was 28 mb/d, up slightly
from 3Q11 levels, although both periods included pipeline
interruptions caused by insurgent activity.
from 3Q11 levels, although both periods included pipeline
interruptions caused by insurgent activity.
– In 1Q12, Colombia volumes should be about 3 mboe/d higher
than 4Q11, although insurgent activity has picked up recently.”
than 4Q11, although insurgent activity has picked up recently.”
• As a result of repeated pipeline interruptions caused
by insurgent activity, we now expect our 1Q12
Colombia production volumes to be about 23 mb/d,
roughly 9 mb/d below capacity.
by insurgent activity, we now expect our 1Q12
Colombia production volumes to be about 23 mb/d,
roughly 9 mb/d below capacity.
9

10
Oil & Gas Production *
Full Year 2011
(Million barrels of oil equivalent)
Full Year 2011
(Million barrels of oil equivalent)
*Excludes Argentina
Oxy Is Primarily An Oil Company
Oxy Is Primarily An Oil Company
156
58%
193
72%
111
42%
74
28%
10

11
• About 60% of Oxy’s oil production tracks world oil prices
and 40% is indexed to WTI. For example:
and 40% is indexed to WTI. For example:
– In California our realized price was 109% of WTI and 94% of
Brent in 2011.
Brent in 2011.
– In Oman our average price was 104% of WTI and 89% of Brent.
• Our overall differentials for 2011, resulted in realized oil
prices representing 103% of the average WTI and 88% of
the average Brent price.
prices representing 103% of the average WTI and 88% of
the average Brent price.
Realized Oil Prices & Differentials
Realized Oil Prices & Differentials
11

12
• We have ample legitimate opportunities in our domestic
oil and gas business where we could deploy capital.
oil and gas business where we could deploy capital.
• We try to manage the program to a level that is realistic at
current price levels, and as a result, have deferred some
projects that otherwise would have met our hurdle rates.
current price levels, and as a result, have deferred some
projects that otherwise would have met our hurdle rates.
• We continue to have substantial inventory of high return
projects going forward to fulfill our growth objectives.
projects going forward to fulfill our growth objectives.
Capital Spending - 2012 Outlook
12
13
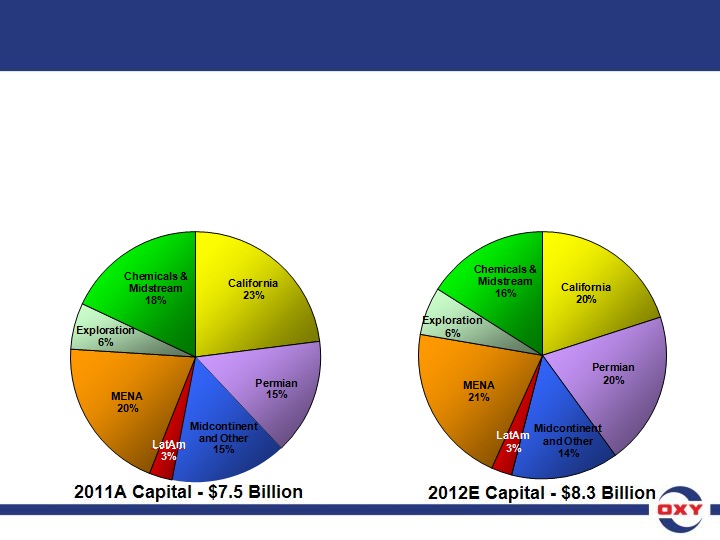
Capital Spending - 2012E vs. 2011 Actual
• We increased our capital program approximately 10% in 2012 to
$8.3 billion from the $7.5 billion spent in 2011.
$8.3 billion from the $7.5 billion spent in 2011.
• About $500 million of this increase will be in the US, mainly in the
Permian basin, and the rest in international projects including the
Al Hosn gas project and Iraq.
Permian basin, and the rest in international projects including the
Al Hosn gas project and Iraq.
• We will review our capital program around mid-year and adjust as
conditions dictate.
conditions dictate.
13

14
• Base 5 - 8% Compounded Average Annual Growth
– Current California risked prospects
– Non-CO2 & CO2 in the Permian
– Williston Basin
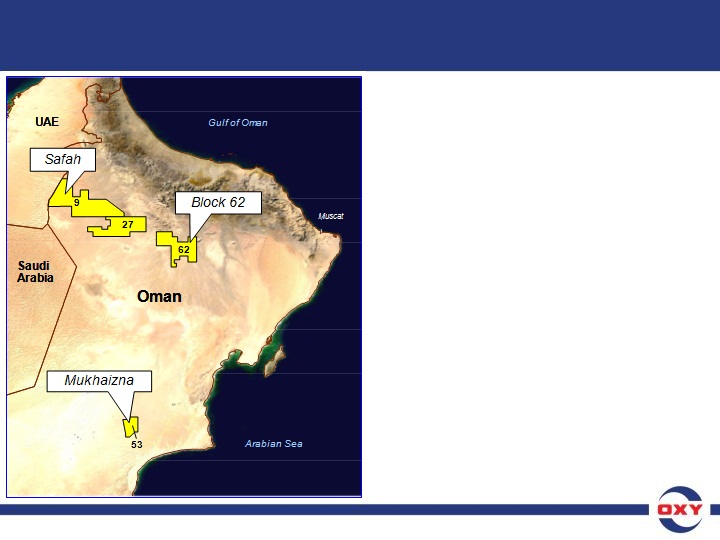
– Oman
– Iraq
• Upside from Existing Holdings
– New California conventional and unconventional prospects
– Permian exploration
– Rockies
– Oman exploration
• Additional opportunities from balance sheet and cash
generation
generation
– Domestic properties acquisitions
– New Middle East projects
Oil & Gas Volume Growth Drivers
14

15
• US oil and gas production -
– In 1H12, we expect our domestic production to grow 3 to 4 mboe/d
each month from the current quarterly average of 449 mboe/d,
which would correspond to a 6 to 8 mboe/d increase per quarter.
each month from the current quarterly average of 449 mboe/d,
which would correspond to a 6 to 8 mboe/d increase per quarter.
– 4Q11 was relatively free of significant operational disruptions
resulting in better than expected domestic production. A more
typical experience with respect to such issues could moderate the
growth somewhat in 1Q12.
resulting in better than expected domestic production. A more
typical experience with respect to such issues could moderate the
growth somewhat in 1Q12.
– If the production growth rate continued at a comparable pace in
2H12, our year-over-year average domestic production growth
would be between 8% and 10% in 2012.
2H12, our year-over-year average domestic production growth
would be between 8% and 10% in 2012.
US Oil & Gas Production - 1H12 Outlook
US Oil & Gas Production - 1H12 Outlook
15
16
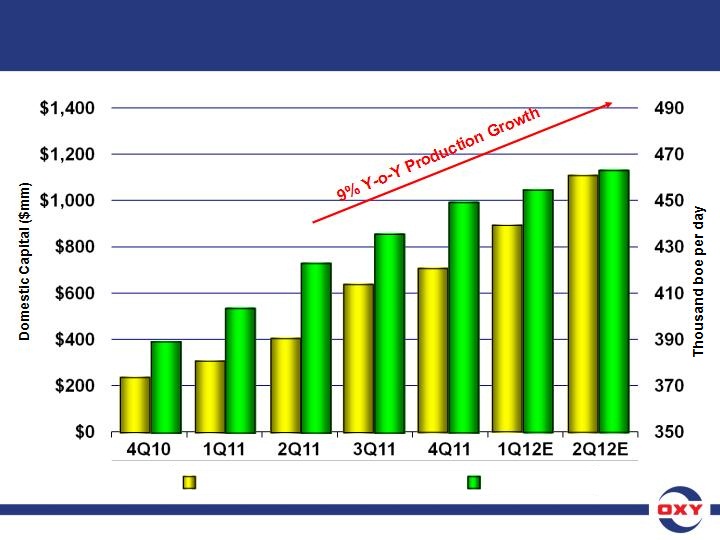
US Oil & Gas Capital and Production
$310
389
$403
403
$640
424
$704
436
$884
449
$1,100
456
463
Note: 1Q12E and 2Q12E production based on midpoint of guidance range of 6 to 8 mboe/d of production growth.
Capital (3 quarters earlier)
Production
$259
16

17
US Oil & Gas Capital and Production
4Q10
1Q11
2Q11
3Q11
4Q11
1Q12E
2Q12E
CapEx as % of US Capital Employed (3 quarters earlier)
Production
0.0%
2.0%
4.0%
6.0%
8.0%
350
375
400
425
450
475
389
403
424
436
449
456
463
4.0%
Note: 1Q12E and 2Q12E production based on midpoint of guidance range of 6 to 8 mboe/d of production growth.
1.4%
1.7%
2.1%
3.0%
2.8%
3.3%
17

38
72
70
Oxy’s US Operated Rig Activity
Oxy’s US operated rigs represent approximately 6% of the total Liquids directed rigs operating in the Lower 48.
18
19
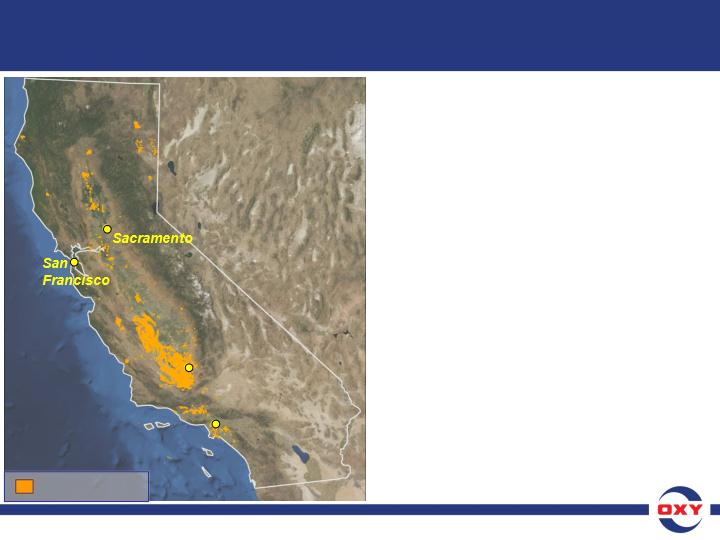
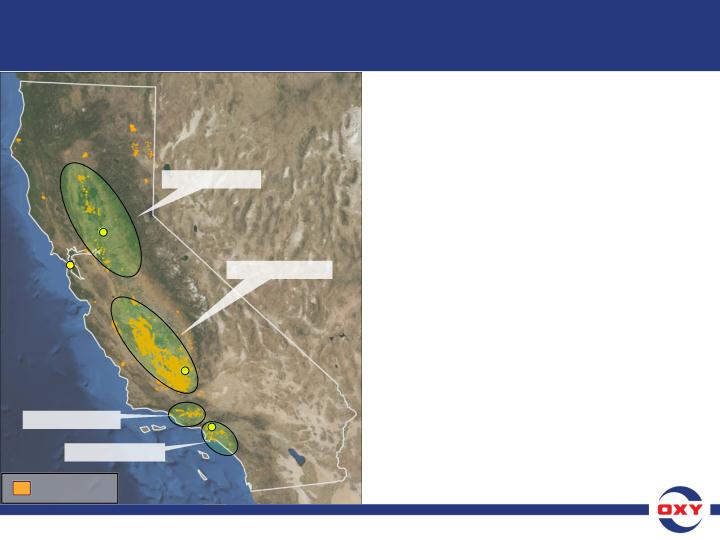
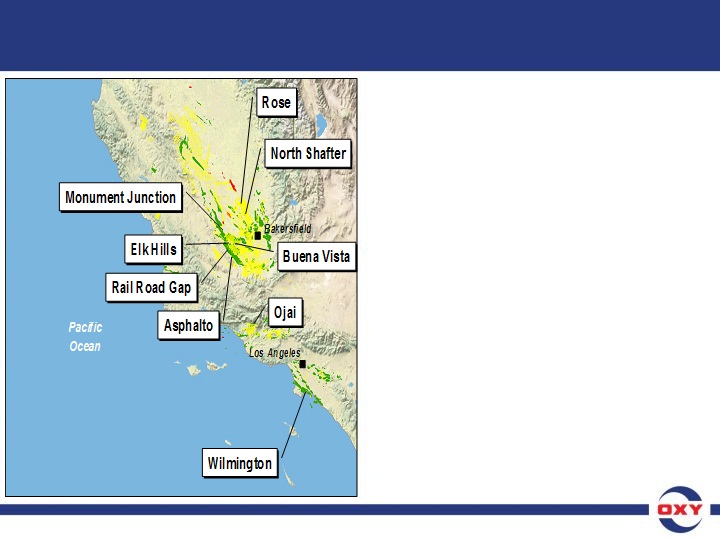
California Overview
California Overview
Los Angeles
Los Angeles
Bakersfield
Bakersfield
Oxy Acreage
• Largest acreage holder in CA
with ~1.7 mm acres, majority of
which are net mineral interests.
with ~1.7 mm acres, majority of
which are net mineral interests.
• 2011 production of 138 mboe/d.
• 78% interest in the Elk Hills
Field — the largest producer of
gas and NGLs in CA.
Field — the largest producer of
gas and NGLs in CA.
• Currently operating ~30 drilling
rigs in the state.
rigs in the state.
• Drilled ~675 wells and
performed ~500 workovers in
2011
performed ~500 workovers in
2011
• Construction of first new gas
processing plant to be brought
on line in 2012; building a
second plant in the next 2 yrs.
processing plant to be brought
on line in 2012; building a
second plant in the next 2 yrs.
19

2012E Total Capital - $8.3 Billion
• We currently expect the rig count to
remain at ~30 in 1H12, roughly the same
as what we were running at YE-2011;
remain at ~30 in 1H12, roughly the same
as what we were running at YE-2011;
• We are seeing improvement with
respect to permitting issues in the state;
respect to permitting issues in the state;
• We have received approved field rules
and new permits for both injection wells
and drilling locations;
and new permits for both injection wells
and drilling locations;
• The regulatory agency is responsive
and committed to working through the
backlog of permits;
and committed to working through the
backlog of permits;
• We expect to maintain our capital
program at current levels for about
1H12, which will enable us to continue
to grow our production volumes;
program at current levels for about
1H12, which will enable us to continue
to grow our production volumes;
• We will reassess our capital program
when the number of permits in hand
allows it.
when the number of permits in hand
allows it.
• In CA, we expect to spend about
21% of our total capital program.
21% of our total capital program.
*Includes both oil & gas development and midstream capital.
California Capital Program
California Capital Program
20
20
21
California Conventional Exploration
• World Class Province
– 35+ Billion BOE discovered
– 5 of top 12 U.S. oil fields
• Significant Remaining Potential
– Large undiscovered resources
– Multiple play and trap types
• Underexplored
• Oxy
– Major producer
– Largest acreage holder
– Successful explorer
– Multi-year prospect inventory
Sources:
California Division of Oil, Gas & Geothermal Resources
Gibson Consulting
Oxy Fee/Lease
2 Billion BOE
20 Billion BOE
3 Billion BOE
10 Billion BOE
Major Producing
Basins
Sacramento
Sacramento
San
Francisco
Francisco
San
Francisco
Francisco
Los Angeles
Los Angeles
Bakersfield
Bakersfield
21

22
Field Size (MMBOE)
<0.1
0.1
1
10
100
1 Billion
10 Billion
Discovery Play
Oxy Play Type and Prospect Exposure
Sources:
California Division of Oil, Gas & Geothermal Resources
Occidental Estimates
California Division of Oil, Gas & Geothermal Resources
Occidental Estimates
California Field Sizes
22
23
• Multi-year inventory of drill sites in
CA, many of which are both outside
of Elk Hills proper & the Kern County
Discovery Area
CA, many of which are both outside
of Elk Hills proper & the Kern County
Discovery Area
• Expect to drill 80+ shale wells outside
Elk Hills proper, and ~140 total shale
wells including Elk Hills in 1H12
Elk Hills proper, and ~140 total shale
wells including Elk Hills in 1H12
• 30-day initial production rate for
these wells is between 300 and 400
BOE per day
these wells is between 300 and 400
BOE per day
• For the shale wells outside Elk Hills,
~80% of the BOE production is a
combination of black oil and high-
value condensate
~80% of the BOE production is a
combination of black oil and high-
value condensate
• Cost of drilling and completing the
wells has run ~$3.5 million per well,
which we expect to decline over time;
largely vertical wells
wells has run ~$3.5 million per well,
which we expect to decline over time;
largely vertical wells
California Unconventional “Shale” Program
23
24
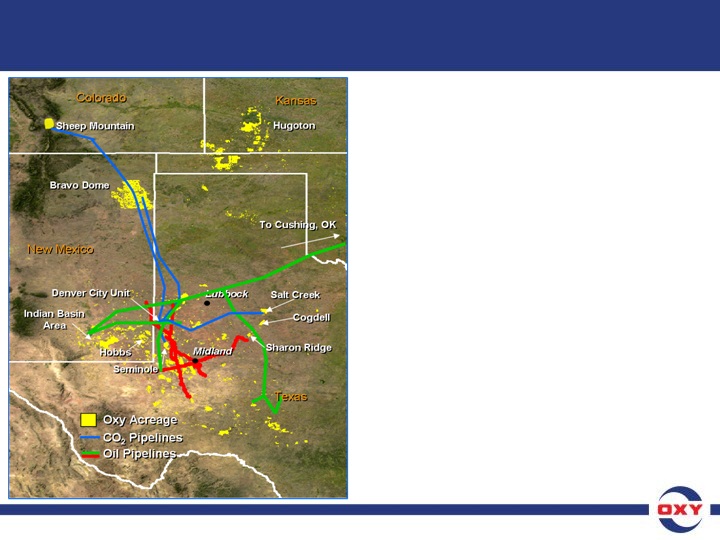
Permian Basin Overview
• 2011 production of 198,000 boe/d
• Largest oil producer in Permian
(~15% net share of total)
(~15% net share of total)
• Largest operator in Permian
(of 1,500+ operators)
(of 1,500+ operators)
• Drilled ~409 wells on operated
properties in 2011
properties in 2011
• ~64% of Oxy’s Permian oil
production is from CO2 related
EOR projects
production is from CO2 related
EOR projects
• Have another 2.5 BBOE of likely
recoverable resource
recoverable resource
• 1.7 bcf/d (0.5 tcf/year) of CO2
• Ample supply of CO2 accelerates
project implementations
project implementations
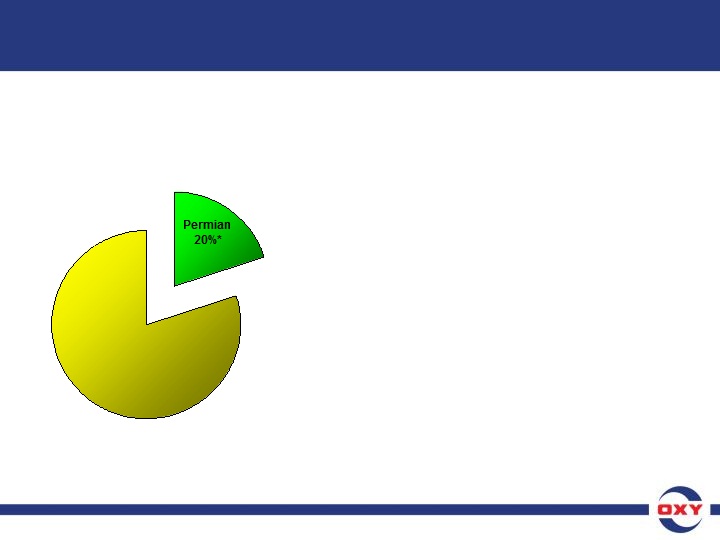
24
2012E Total Capital - $8.3 Billion
• Our rig count at year-end 2011
was 23;
was 23;
• We expect our rig count to ramp up
during the year to around 27 rigs by
year end;
during the year to around 27 rigs by
year end;
• Our CO2 flood capital should remain
comparable to the 2011 levels;
comparable to the 2011 levels;
• In our non-CO2 operations we are
seeing additional opportunities for
good return projects;
seeing additional opportunities for
good return projects;
• This includes an extensive Wolfberry
drilling program, as well as
Delaware/Bone Springs sands
and Avalon Shale;
drilling program, as well as
Delaware/Bone Springs sands
and Avalon Shale;
• As a result, we have stepped up
their development program and 2012
capital will be about 75% higher than
the 2011 level.
their development program and 2012
capital will be about 75% higher than
the 2011 level.
• In the Permian operations, we
expect to spend about 20% of
our total capital.
expect to spend about 20% of
our total capital.
*Includes both oil & gas development and midstream capital.
Permian Basin Capital Program
25
25
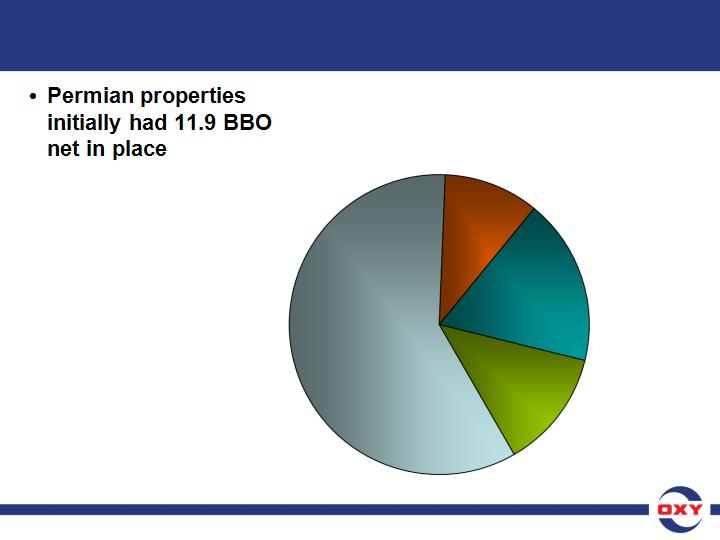
26
• 4.1 BBO have been
produced,
produced,
• leaving 7.8 BBO net
remaining
remaining
4.6 BBO
3P Reserves
EOR Likely
EOR Potential
0.8 BBO
1.4 BBO
1.0 BBO
Residual
7.8 BBO Net Remaining
Permian EOR Opportunities
26
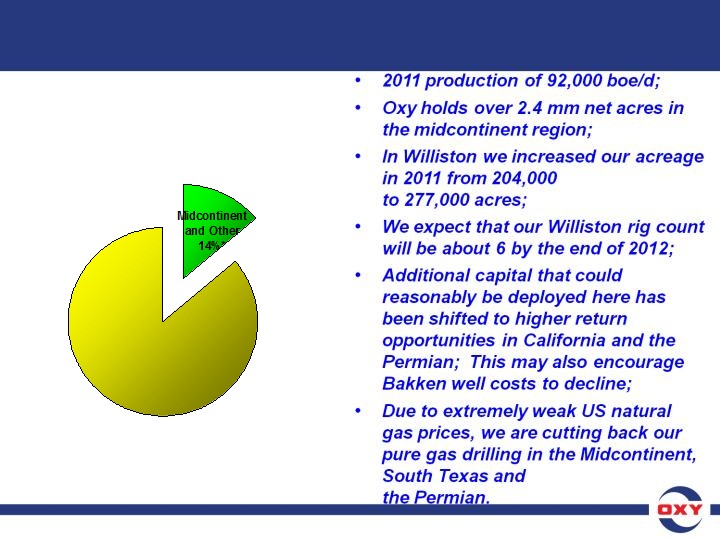
2012E Total Capital - $8.3 Billion
• In the Midcontinent and Other
operations, we plan to spend about
14% of our total capital program.
operations, we plan to spend about
14% of our total capital program.
Midcontinent and Other Capital Program
*Includes both oil & gas development and midstream capital.
27
27
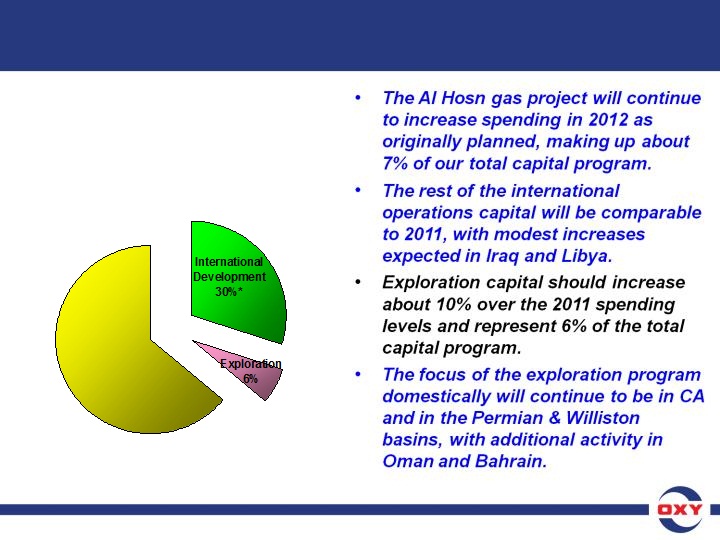
2012E Total Capital - $8.3 Billion
International Development and, Exploration
Capital Program
Capital Program
International Development and, Exploration
Capital Program
Capital Program
• Total international development
capital will be about 30% of the
total company capital program.
capital will be about 30% of the
total company capital program.
*Includes both oil & gas development and midstream capital.
28
28

29
Abu Dhabi - Al Hosn Gas Project (Shah Field)
29
• Shah Gas Field one of the largest in
the Middle East;
the Middle East;
• Oxy holds a 40% participating
interest under a 30-year contract;
interest under a 30-year contract;
• The project involves development of
high-sulfur content reservoirs within
the Shah field, located onshore
~180 km so. west of Abu Dhabi;
high-sulfur content reservoirs within
the Shah field, located onshore
~180 km so. west of Abu Dhabi;
• Production start-up is scheduled in
late 2014;
late 2014;
• Anticipated to produce over 500
mmcf/d of sales gas and 50 mboe/d
of NGLs and condensate - of which
Oxy’s net share would be over 200
mmcf/d of gas and over 20 mboed of
NGLs and condensate;
mmcf/d of sales gas and 50 mboe/d
of NGLs and condensate - of which
Oxy’s net share would be over 200
mmcf/d of gas and over 20 mboed of
NGLs and condensate;
• Spending for the project will rise in
2012 as planned, making up ~7% of
our total capital program.
2012 as planned, making up ~7% of
our total capital program.
29
30
• World Class Steam flood project;
• 2 B bo ROIP;
• Discovered in 1975 in South
Central Oman;
Central Oman;
• Oxy assumed operation
September 1, 2005 at 8,500 b/d;
September 1, 2005 at 8,500 b/d;
• Steam flood commenced May
2007, and had drilled 1,400+ new
wells through 2011;
2007, and had drilled 1,400+ new
wells through 2011;
• Gross Production: ~124,000 b/d at
year-end 2011;
year-end 2011;
• Oxy plans to steadily increase
production through continued
expansion of the steam flood
project.
production through continued
expansion of the steam flood
project.
!
Oxy Oman - Mukhaizna Project
30

31
Oxy Oman Gross Production Growth
31

32
1. Base/Maintenance Capital
2. Dividends
3. Growth Capital
4. Acquisitions
5. Share Repurchase
Cash Flow Priorities
32
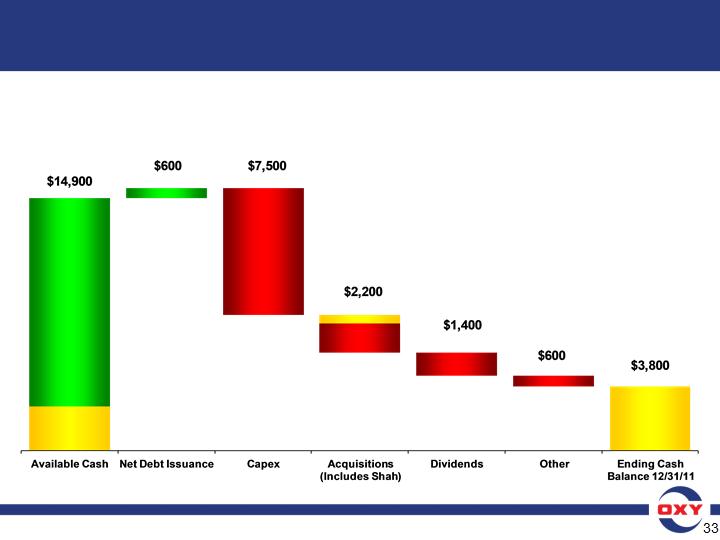
Summary - 2011 Cash Flow
Summary - 2011 Cash Flow
– Free cash flow from continuing operations after capex and dividends,
but before acquisition and debt activity, was about $3.4 billion.
but before acquisition and debt activity, was about $3.4 billion.
Note: See attached GAAP reconciliation.
($ in millions)
Cash Flow
From
Operations
$12,300
From
Operations
$12,300
Shah - $500
Beginning
Cash $2,600
12/31/10
Cash $2,600
12/31/10
33

34
• Company’s core business is acquiring assets that can
provide future growth through improved recovery.
provide future growth through improved recovery.
– Foreign contracts
– Domestic add-ons
– Small incremental additions to production in short term
• Generate returns of at least 15% in the US and 20% overseas.
• Overall average finding & development costs of less than
25% of selling price.
25% of selling price.
• Even with the additional capital shown, program will
generate a significant amount of free cash flow.
generate a significant amount of free cash flow.
• Acquisitions are measured against reinvesting in the existing
business with the goal of enhancing company value.
business with the goal of enhancing company value.
• Large number of opportunities over 5-year period.
Acquisition Strategy
34

35
• 5 - 8% base annual production growth over the long term
• Opportunity for additional volume growth
• Returns on invested capital significantly in excess of
Company’s cost of capital
Company’s cost of capital
• Consistent, annual increases in dividends
• Significant financial flexibility for opportunities in distressed
periods
periods
• Conservative financial statements
• Committed to generating stock market value which is greater
than earnings retained
than earnings retained
• We believe this will generate top quartile returns for our
shareholders
shareholders
Oxy - Investment Attributes
35

36
Oxy’s Shareholder Equity versus Equity Market Value
3 - Year
5 - Year
10 - Year
Change in Equity
Market Value
Market Value
($ in millions)
A History of Generating Shareholder Value
Creating Shareholder Value
Market Value per $ of Equity Retained
Change in
Shareholder Equity
Shareholder Equity
Financial Data for period ended December 31, 2011.
$27,385
$10,303
$34,978
$18,092
$66,066
$31,994
2.7
1.9
2.1
36

Portions of this presentation contain forward-looking statements and involve risks and uncertainties that could materially affect
expected results of operations, liquidity, cash flows and business prospects. Factors that could cause results to differ
materially include, but are not limited to: global commodity pricing fluctuations; supply and demand considerations for
Occidental’s products; general domestic political and regulatory approval conditions; political events; not successfully
completing, or any material delay of, any development of new fields, expansion projects, capital expenditures, efficiency-
improvement projects, acquisitions or dispositions; potential failure to achieve expected production from existing and future oil
and gas development projects; exploration risks such as drilling unsuccessful wells; any general economic recession or
slowdown domestically or internationally; higher-than-expected costs; potential liability for remedial actions under existing or
future environmental regulations and litigation; potential liability resulting from pending or future litigation; general domestic and
international political conditions; potential disruption or interruption of Occidental’s production or manufacturing or damage to
facilities due to accidents, chemical releases, labor unrest, weather, natural disasters or insurgent activity; failure of risk
management; changes in law or regulations; or changes in tax rates. The United States Securities and Exchange Commission
(SEC) permits oil and natural gas companies, in their SEC filings, to disclose only reserves anticipated to be economically
producible, as of a given date, by application of development projects to known accumulations. We use certain terms in this
presentation, such as net-in-place, net risked reserves, de-risked, EUR (expected ultimate recovery), likely recoverable
resources, net remaining and oil in place, that the SEC’s guidelines strictly prohibit us from using in our SEC filings. These
terms represent our internal estimates of volumes of oil and gas that are not proved reserves but are potentially recoverable
through exploratory drilling or additional drilling or recovery techniques and are not intended to correspond to probable or
possible reserves as defined by SEC regulations. By their nature these estimates are more speculative than proved, probable
or possible reserves and subject to greater risk they will not be realized. You should not place undue reliance on these forward
-looking statements, which speak only as of the date of this presentation. Unless legally required, Occidental does not
undertake any obligation to update any forward-looking statements, as a result of new information, future events or otherwise.
U.S. investors are urged to consider carefully the disclosures in our 2010 Form 10-K, available through the following toll-free
number 1-888-OXYPETE (1-888-699-7383) or on the internet at http://www.oxy.com. You also can obtain a copy form the
SEC by calling 1-800-SEC-0330. We post or provide links to important information on our website including investor and
analyst presentations, certain board committee charters and information that SEC requires companies and certain of its officers
and directors to file or furnish. Such information may be found in the “Investor Relations” and “Social Responsibility” portions of
the website.
Cautionary Statement
37
37
Occidental Petroleum Corporation
38
38
|
Occidental Petroleum Corporation
|
|||||||||||||
|
Reconciliation to Generally Accepted Accounting Principles (GAAP)
|
|||||||||||||
|
For the Twelve Months Ended December 31,
|
|||||||||||||
|
($ Millions)
|
|||||||||||||
|
2011
|
2010
|
||||||||||||
|
Diluted
|
Diluted
|
||||||||||||
|
EPS
|
EPS
|
||||||||||||
|
Reported Income
|
$
|
6,771
|
$
|
5.56
|
$
|
4,530
|
$
|
5.56
|
|||||
|
Add: significant items affecting earnings
|
|||||||||||||
|
Asset impairments
|
-
|
275
|
|||||||||||
|
Libya exploration write-off
|
35
|
-
|
|||||||||||
|
Gain on sale of Colombia pipeline interest
|
(22
|
)
|
-
|
||||||||||
|
Foreign tax
|
29
|
-
|
|||||||||||
|
Premiuim on debt extinguishments
|
163
|
-
|
|||||||||||
|
Tax effect of pre-tax adjustments
|
(50
|
)
|
(100
|
)
|
|||||||||
|
State income tax charge
|
33
|
-
|
|||||||||||
|
Benefit from foreign tax credit carry-forwards
|
-
|
(80
|
)
|
||||||||||
|
Discontinued operations, net *
|
(131
|
)
|
39
|
||||||||||
|
Core Results
|
$
|
6,828
|
$
|
8.39
|
$
|
4,664
|
$
|
5.72
|
|||||
|
* Amount shown after-tax
|
|||||||||||||
|
Average Diluted Common Shares Outstanding
|
812.9
|
813.8
|
|||||||||||
|
Occidental Petroleum Corporation
|
|||||
|
Return on Capital Employed (ROCE)
|
|||||
|
Reconciliation to Generally Accepted Accounting Principles (GAAP)
|
|||||
|
2010
|
2011
|
||||
|
RETURN ON CAPITAL EMPLOYED (%)
|
13.2
|
17.2
|
|||
|
GAAP measure - net income attributable
|
4,530
|
6,771
|
|||
|
to common stock
|
|||||
|
Interest expense
|
93
|
284
|
|||
|
Tax effect of interest expense
|
(33
|
)
|
(99
|
)
|
|
|
Earnings before tax-effected interest expense
|
4,590
|
6,956
|
|||
|
GAAP stockholders' equity
|
32,484
|
37,620
|
|||
|
Debt
|
5,111
|
5,871
|
|||
|
Total capital employed
|
37,595
|
43,491
|
|||
|
ROCE
|
13.2
|
17.2
|
|||
|
Occidental Petroleum Corporation
|
|||||||||||||
|
Oil & Gas
|
|||||||||||||
|
Return on Assets
|
|||||||||||||
|
Reconciliation to Generally Accepted Accounting Principles (GAAP)
|
|||||||||||||
|
($ Millions)
|
|||||||||||||
|
5-Year
|
|||||||||||||
|
2007
|
2008
|
2009
|
2010
|
2011
|
Average
|
||||||||
|
Revenues
|
12,583
|
17,378
|
10,984
|
14,245
|
18,419
|
14,722
|
|||||||
|
Production costs
|
2,011
|
2,428
|
2,214
|
2,622
|
3,428
|
2,541
|
|||||||
|
Other operating expense
|
516
|
536
|
628
|
655
|
838
|
635
|
|||||||
|
Depreciation, depletion and amortization
|
1,754
|
1,993
|
2,258
|
2,668
|
3,064
|
2,347
|
|||||||
|
Taxes other than income
|
401
|
569
|
413
|
472
|
590
|
489
|
|||||||
|
Charges for impairments
|
58
|
81
|
-
|
275
|
-
|
83
|
|||||||
|
Exploration expenses
|
361
|
308
|
254
|
262
|
258
|
289
|
|||||||
|
Pretax income
|
7,482
|
11,463
|
5,217
|
7,291
|
10,241
|
8,339
|
|||||||
|
Income tax expense
|
3,121
|
4,426
|
1,972
|
2,845
|
3,834
|
3,240
|
|||||||
|
Results of operations
|
4,361
|
7,037
|
3,245
|
4,446
|
6,407
|
5,099
|
|||||||
|
Depreciation, depletion and amortization
|
1,754
|
1,993
|
2,258
|
2,668
|
3,064
|
2,347
|
|||||||
|
Charges for impairments
|
58
|
81
|
-
|
275
|
-
|
83
|
|||||||
|
Gross Cash
|
6,173
|
9,111
|
5,503
|
7,389
|
9,471
|
7,529
|
|||||||
|
Capitalized costs
|
|||||||||||||
|
Current year
|
19,137
|
24,216
|
25,228
|
29,901
|
37,490
|
||||||||
|
Prior year
|
17,375
|
19,137
|
24,216
|
25,228
|
29,901
|
||||||||
|
Average capitalized costs
|
18,256
|
21,677
|
24,722
|
27,565
|
33,696
|
25,558
|
|||||||
|
5-Year Average
|
U.S.
|
International
|
Total
|
||||||||||
|
Results of operations
|
2,705
|
2,394
|
5,099
|
(a)
|
|||||||||
|
Depreciation, depletion and amortization
|
1,307
|
1,040
|
2,347
|
||||||||||
|
Charges for impairments
|
67
|
16
|
83
|
||||||||||
|
Gross Cash
|
4,079
|
3,450
|
7,529
|
(b)
|
|||||||||
|
Average capitalized costs
|
19,151
|
6,407
|
25,558
|
(c)
|
|||||||||
|
Net income return on assets (a) / (c)
|
14%
|
37%
|
20%
|
||||||||||
|
Cash flow return on assets (b) / (c)
|
21%
|
54%
|
29%
|
||||||||||
|
Occidental Petroleum Corporation
|
||
|
Free Cash Flow
|
||
|
Reconciliation to Generally Accepted Accounting Principles (GAAP)
|
||
|
($ Millions)
|
||
|
Twelve Months
|
||
|
2011
|
||
|
Consolidated Statement of Cash Flows
|
||
|
Cash flow from operating activities
|
12,281
|
|
|
Cash flow from investing activities
|
(9,903
|
)
|
|
Cash flow from financing activities
|
(1,175
|
)
|
|
Change in cash
|
1,203
|
|
|
Free Cash Flow
|
||
|
Cash flow from operating activities - continuing operations
|
12,306
|
|
|
Capital spending
|
(7,518
|
)
|
|
Free cash flow before dividends
|
4,788
|
|
|
Dividends
|
(1,436
|
)
|
|
Free cash flow after dividends
|
3,352
|
|