Attached files
| file | filename |
|---|---|
| 8-K - 8-K - Cloud Peak Energy Resources LLC | a12-7719_18k.htm |
Exhibit 99.1
|
|
Howard Weil 40th Annual Energy Conference March 26, 2012 |

|
|
1 Cloud Peak Energy Inc. Financial Data Cloud Peak Energy Inc. is the sole owner of Cloud Peak Energy Resources LLC. Unless expressly stated otherwise in this presentation, all financial data included herein is consolidated financial data of Cloud Peak Energy Inc. Cautionary Note Regarding Forward-Looking Statements This presentation contains “forward-looking statements” within the meaning of the safe harbor provisions of Section 27A of the Securities Act of 1933 and Section 21E of the Securities Exchange Act of 1934. Forward-looking statements are not statements of historical facts, and often contain words such as “may,” “will,” “expect,” “believe,” “anticipate,” “plan,” “estimate,” “seek,” “could,” “should,” “intend,” “potential,” or words of similar meaning. Forward-looking statements are based on management’s current expectations, beliefs, assumptions and estimates regarding our company, industry, economic conditions, government regulations, energy policies and other factors. These statements are subject to significant risks, uncertainties and assumptions that are difficult to predict and could cause actual results to differ materially and adversely from those expressed or implied in the forward-looking statements. For a description of some of the risks and uncertainties that may adversely affect our future results, refer to the risk factors described from time to time in the reports and registration statements we file with the Securities and Exchange Commission, including those in Item 1A "Risk Factors" of our most recent Form 10-K and any updates thereto in our Forms 10-Q and current reports on Forms 8-K. There may be other risks and uncertainties that are not currently known to us or that we currently believe are not material. We make forward-looking statements based on currently available information, and we assume no obligation to, and expressly disclaim any obligation to, update or revise publicly any forward-looking statements made in our presentation, whether as a result of new information, future events or otherwise, except as required by law. Non-GAAP Financial Measures This presentation includes the non-GAAP financial measures of (1) Adjusted EBITDA and (2) Adjusted Earnings Per Share (“Adjusted EPS”). Adjusted EBITDA and Adjusted EPS are intended to provide additional information only and do not have any standard meaning prescribed by generally accepted accounting principles in the U.S., or GAAP. A quantitative reconciliation of historical net income or net income from continuing operations (as applicable) to Adjusted EBITDA and EPS (as defined below) to Adjusted EPS is found in the tables accompanying this presentation. EBITDA represents net income or net income from continuing operations (as applicable) before (1) interest income (expense) net, (2) income tax provision, (3) depreciation and depletion, (4) amortization, and (5) accretion. Adjusted EBITDA represents EBITDA as further adjusted to exclude specifically identified items that management believes do not directly reflect our core operations. The specifically identified items are the income statement impacts, as applicable, of: (1) the Tax Receivable Agreement including tax impacts of our 2009 initial public offering and 2010 secondary offering, (2) our significant broker contract that expired in the first quarter of 2010, and (3) marked-to-market adjustments for derivative financial instruments. Because of the inherent uncertainty related to the items identified above, management does not believe it is able to provide a meaningful forecast of the comparable GAAP measures or a reconciliation to any forecasted GAAP measures. Adjusted EPS represents diluted earnings (loss) per share attributable to controlling interest or diluted earnings (loss) per share attributable to controlling interest from continuing operations (as applicable) (“EPS”), adjusted to exclude the estimated per share impact of the same specifically identified items used to calculate Adjusted EBITDA and described above. Adjusted EBITDA is an additional tool intended to assist our management in comparing our performance on a consistent basis for purposes of business decision-making by removing the impact of certain items that management believes do not directly reflect our core operations. Adjusted EBITDA is a metric intended to assist management in evaluating operating performance, comparing performance across periods, planning and forecasting future business operations and helping determine levels of operating and capital investments. Period-to-period comparisons of Adjusted EBITDA are intended to help our management identify and assess additional trends potentially impacting our company that may not be shown solely by period-to-period comparisons of net income, income from continuing operations, or other GAAP financial measures. Adjusted EBITDA is also used as part of our incentive compensation program for our executive officers and others. We believe Adjusted EBITDA and Adjusted EPS are also useful to investors, analysts and other external users of our consolidated financial statements in evaluating our operating performance from period to period and comparing our performance to similar operating results of other relevant companies. Adjusted EBITDA allows investors to measure a company's operating performance without regard to items such as interest expense, taxes, depreciation and depletion, amortization and accretion and other specifically identified items that are not considered to directly reflect our core operations. Similarly, we believe our use of Adjusted EPS provides an appropriate measure to use in assessing our performance across periods given that this measure provides an adjustment for certain specifically identified significant items that are not considered to directly reflect our core operations, the magnitude of which may vary drastically from period to period and, thereby, have a disproportionate effect on the earnings per share reported for a given period. Our management recognizes that using Adjusted EBITDA and Adjusted EPS as performance measures has inherent limitations as compared to net income, income from continuing operations, EPS or other GAAP financial measures, as these non-GAAP measures exclude certain items, including items that are recurring in nature, which may be meaningful to investors. Adjusted EBITDA and Adjusted EPS should not be considered in isolation and do not purport to be alternatives to net income, income from continuing operations, EPS or other GAAP financial measures as a measure of our operating performance. Because not all companies use identical calculations, our presentations of Adjusted EBITDA and Adjusted EPS may not be comparable to other similarly titled measures of other companies. Moreover, our presentation of Adjusted EBITDA is different than EBITDA as defined in our debt financing agreements. |
|
|
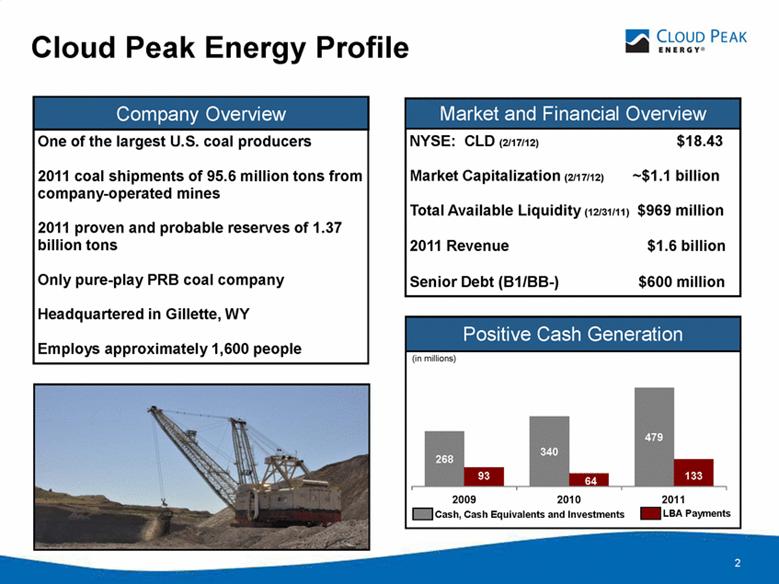
2 Cloud Peak Energy Profile One of the largest U.S. coal producers 2011 coal shipments of 95.6 million tons from company-operated mines 2011 proven and probable reserves of 1.37 billion tons Only pure-play PRB coal company Headquartered in Gillette, WY Employs approximately 1,600 people Cash, Cash Equivalents and Investments LBA Payments (in millions) NYSE: CLD (2/17/12) $18.43 Market Capitalization (2/17/12) ~$1.1 billion Total Available Liquidity (12/31/11) $969 million 2011 Revenue $1.6 billion Senior Debt (B1/BB-) $600 million Market and Financial Overview Company Overview Positive Cash Generation 268 93 340 64 479 133 2009 2010 2011 |
|
|
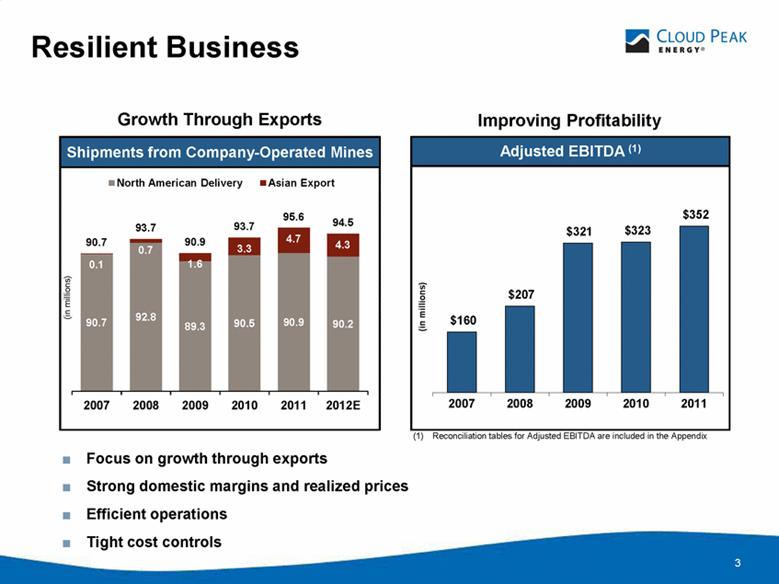
3 Resilient Business 3 3 (1) Reconciliation tables for Adjusted EBITDA are included in the Appendix Adjusted EBITDA (1) Improving Profitability Shipments from Company-Operated Mines Growth Through Exports Focus on growth through exports Strong domestic margins and realized prices Efficient operations Tight cost controls Total Asian Export (in millions) 9.07 93.7 90.9 93.7 95.6 94.5 0.1 0.7 1.6 3.3 4.7 4.3 90.7 92.8 89.3 90.5 90.9 90.2 2007 2008 2009 2010 2011 2012E (in millions) $160 $207 $321 $323 $352 2007 2008 2009 2010 2011 |
|
|
2011 Highlights 4 (1) Reconciliation tables for Adjusted EBITDA are included in the Appendix. Record Adjusted EBITDA(1) of $352 million up from $323 million in 2010 Record annual shipments of 95.6 million tons from our three operated mines Asian exports of 4.7 million tons, up 42 percent from 3.3 million tons in 2010 Unrestricted cash and investments increased to $479 million Generated nearly $300 million in cash from operations Increased proven and probable reserves 40% to 1.37 billion tons |
|
|
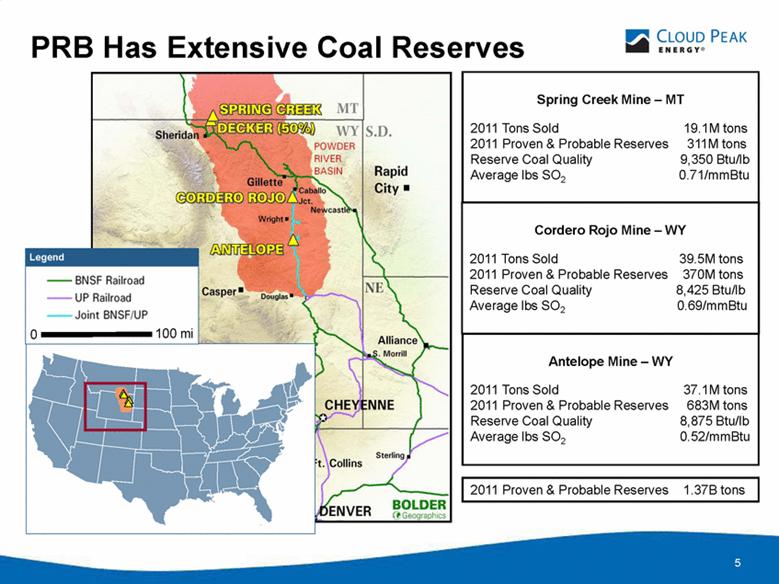
PRB Has Extensive Coal Reserves 5 Spring Creek Mine – MT 2011 Tons Sold 19.1M tons 2011 Proven & Probable Reserves 311M tons Reserve Coal Quality 9,350 Btu/lb Average lbs SO2 0.71/mmBtu Antelope Mine – WY 2011 Tons Sold 37.1M tons 2011 Proven & Probable Reserves 683M tons Reserve Coal Quality 8,875 Btu/lb Average lbs SO2 0.52/mmBtu Cordero Rojo Mine – WY 2011 Tons Sold 39.5M tons 2011 Proven & Probable Reserves 370M tons Reserve Coal Quality 8,425 Btu/lb Average lbs SO2 0.69/mmBtu 0 100 mi Legend 2011 Proven & Probable Reserves 1.37B tons |
|
|
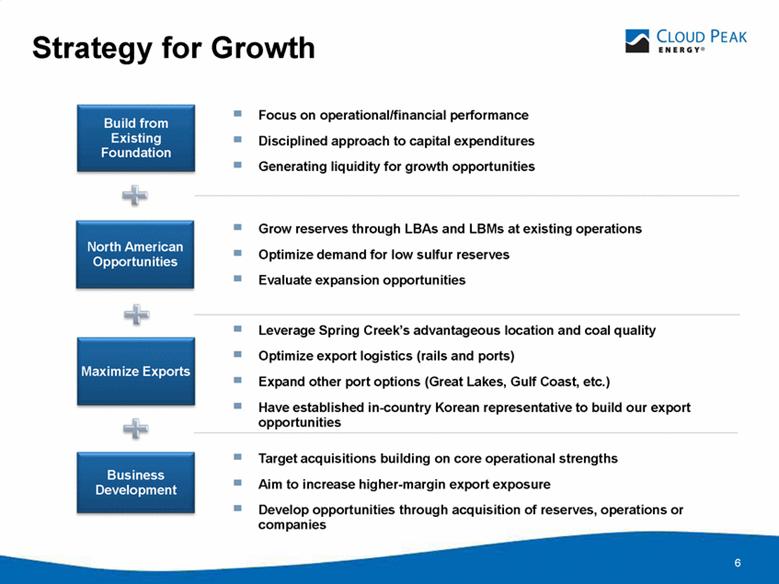
6 Strategy for Growth Focus on operational/financial performance Disciplined approach to capital expenditures Generating liquidity for growth opportunities Build from Existing Foundation North American Opportunities Business Development Grow reserves through LBAs and LBMs at existing operations Optimize demand for low sulfur reserves Evaluate expansion opportunities Target acquisitions building on core operational strengths Aim to increase higher-margin export exposure Develop opportunities through acquisition of reserves, operations or companies Maximize Exports Leverage Spring Creek’s advantageous location and coal quality Optimize export logistics (rails and ports) Expand other port options (Great Lakes, Gulf Coast, etc.) Have established in-country Korean representative to build our export opportunities |
|
|
7 Low-Risk Surface Operations Highly productive, nonunionized workforce at all company-operated mines Proportionately low, long-term operational liabilities Surface mining reduces liabilities and allows for high-quality reclamation Strong environmental compliance programs and ISO-14001 certified |

|
|
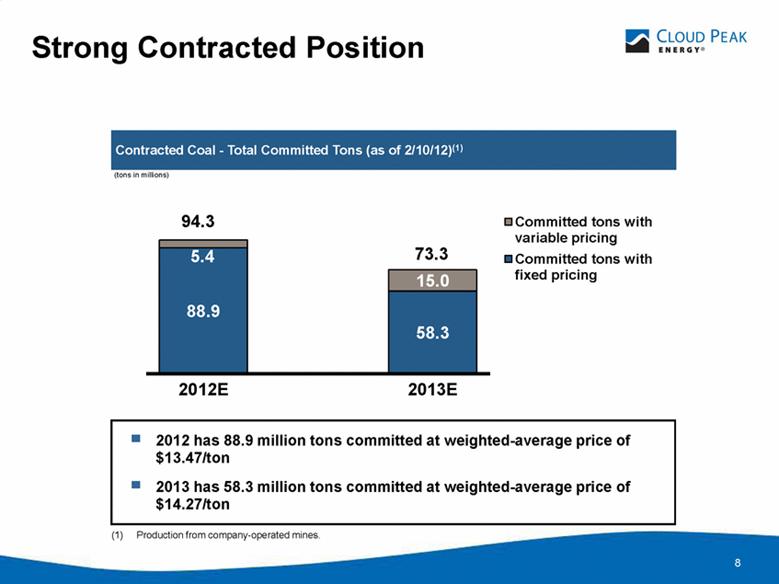
8 Strong Contracted Position (tons in millions) (1) Production from company-operated mines. 2012 has 88.9 million tons committed at weighted-average price of $13.47/ton 2013 has 58.3 million tons committed at weighted-average price of $14.27/ton Contracted Coal - Total Committed Tons (as of 2/10/12)(1) 94.3 73.3 5.4 88.9 15.0 58.3 2012E 2013E |
|
|
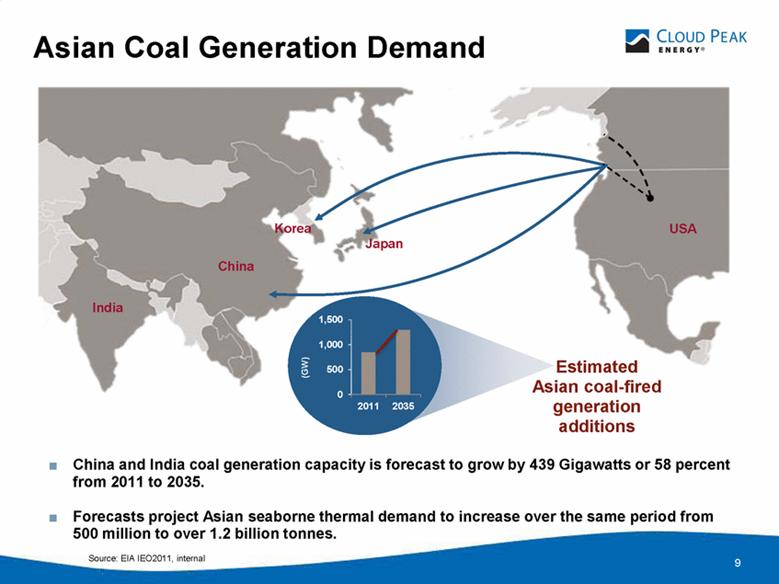
Asian Coal Generation Demand China and India coal generation capacity is forecast to grow by 439 Gigawatts or 58 percent from 2011 to 2035. Forecasts project Asian seaborne thermal demand to increase over the same period from 500 million to over 1.2 billion tonnes. 9 USA China Korea Japan India Source: EIA IEO2011, internal Estimated Asian coal-fired generation additions 1,500 1,000 5000 0 2011 2035 (GW) |
|
|
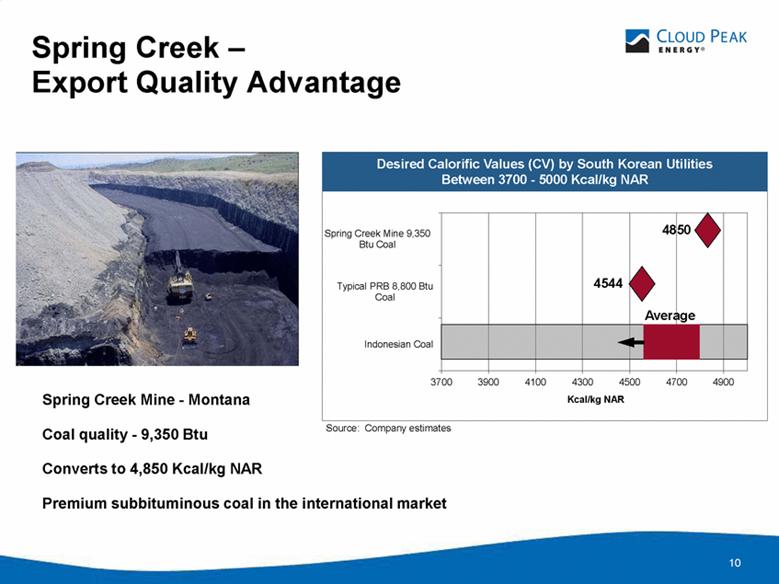
Spring Creek – Export Quality Advantage 10 Spring Creek Mine - Montana Coal quality - 9,350 Btu Converts to 4,850 Kcal/kg NAR Premium subbituminous coal in the international market 4850 4544 Average Source: Company estimates |
|
|
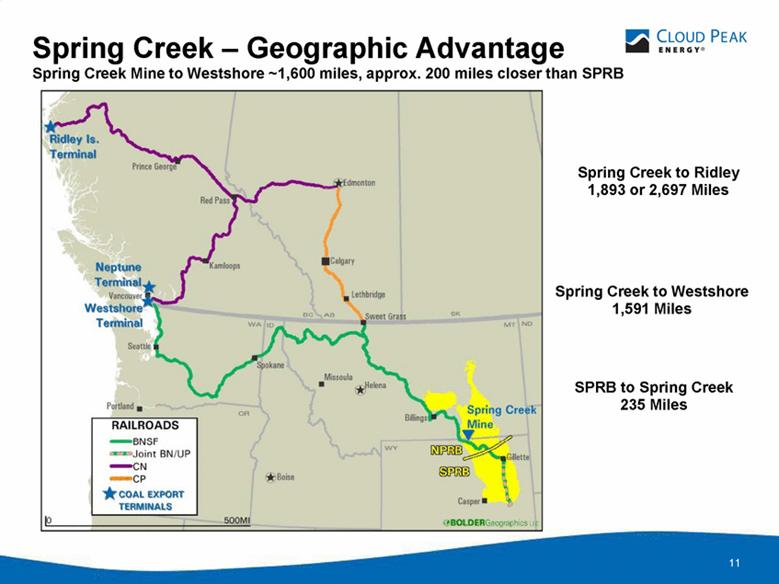
11 Spring Creek to Ridley 1,893 or 2,697 Miles Spring Creek to Westshore 1,591 Miles SPRB to Spring Creek 235 Miles Spring Creek – Geographic Advantage Spring Creek Mine to Westshore ~1,600 miles, approx. 200 miles closer than SPRB |
|
|
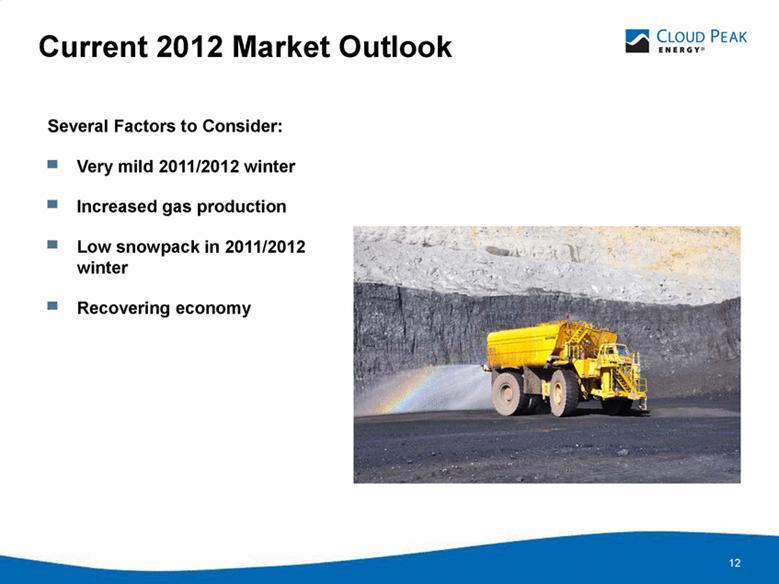
Current 2012 Market Outlook 12 Several Factors to Consider: Very mild 2011/2012 winter Increased gas production Low snowpack in 2011/2012 winter Recovering economy |
|
|
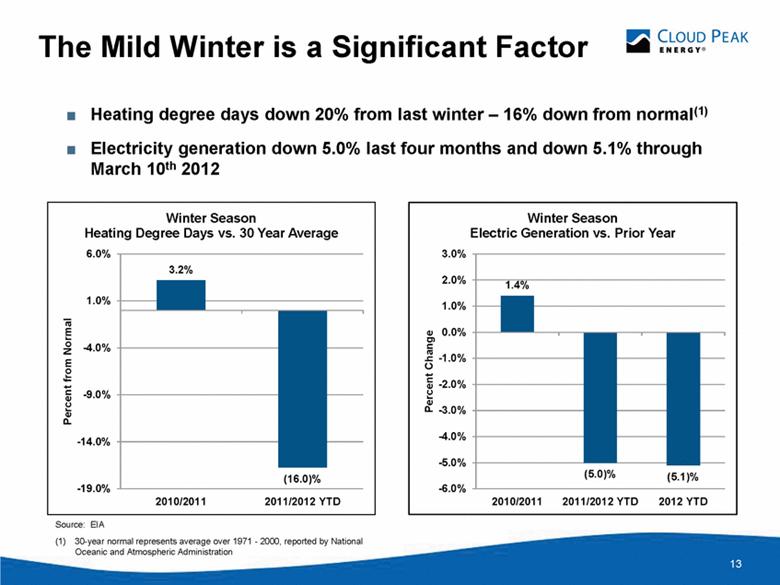
The Mild Winter is a Significant Factor ¦ Heating degree days down 20% from last winter – 16% down from normal(1) ¦ Electricity generation down 5.0% last four months and down 5.1% through March 10th 2012 3.2% (16.0)% -19.0% -14.0% -9.0% -4.0% 1.0% 6.0% 2010/2011 2011/2012 YTD Percent from Normal Winter Season Heating Degree Days vs. 30 Year Average Source: EIA (1) 30-year normal represents average over 1971 - 2000, reported by National Oceanic and Atmospheric Administration 1.4% (5.0)% (5.1)% -6.0% -5.0% -4.0% -3.0% -2.0% -1.0% 0.0% 1.0% 2.0% 3.0% 2010/2011 2011/2012 YTD 2012 YTD Percent Change Winter Season Electric Generation vs. Prior Year |
|
|
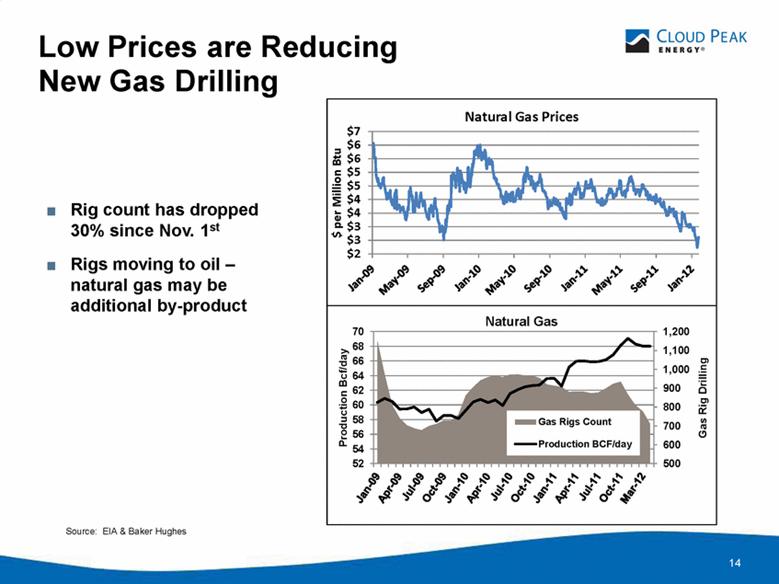
Low Prices are Reducing New Gas Drilling 14 Rig count has dropped 30% since Nov. 1st Rigs moving to oil – natural gas may be additional by-product Source: EIA & Baker Hughes |
|
|
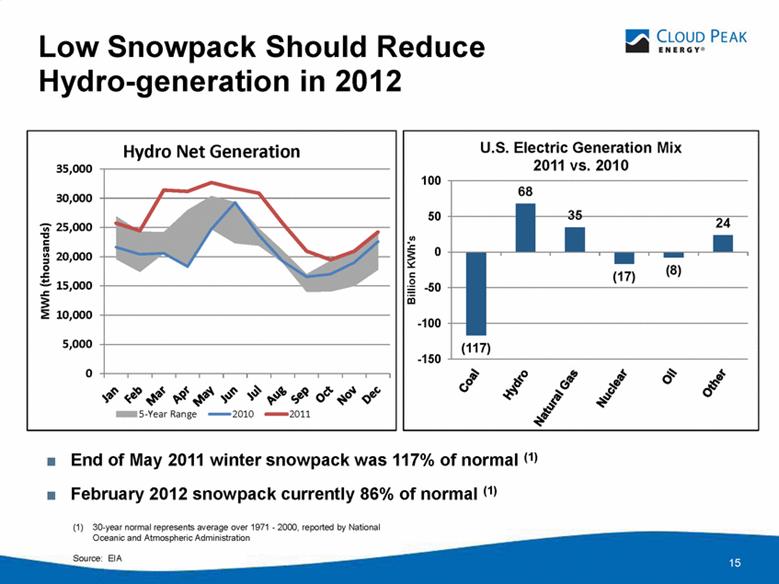
Low Snowpack Should Reduce Hydro-generation in 2012 15 End of May 2011 winter snowpack was 117% of normal (1) February 2012 snowpack currently 86% of normal (1) 30-year normal represents average over 1971 - 2000, reported by National Oceanic and Atmospheric Administration Source: EIA |
|
|
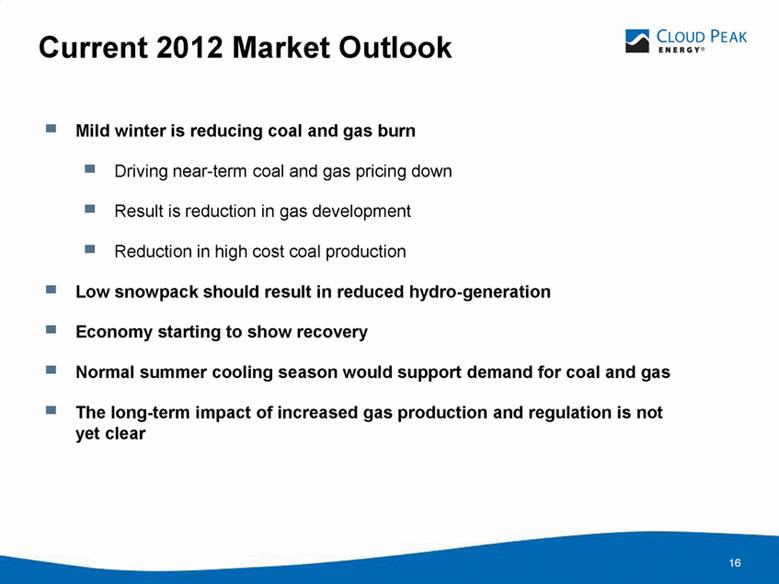
Current 2012 Market Outlook 16 Mild winter is reducing coal and gas burn Driving near-term coal and gas pricing down Result is reduction in gas development Reduction in high cost coal production Low snowpack should result in reduced hydro-generation Economy starting to show recovery Normal summer cooling season would support demand for coal and gas The long-term impact of increased gas production and regulation is not yet clear |
|
|
17 Looking Forward (1) Strong, low-sulfur reserve holdings in best positioned U.S. basin Efficient operations Effectively sold out of 2012 coal production Continued strong contribution from export sales Strong balance sheet provides financial flexibility Significant cash generation Proportionally low, long-term operational liabilities |

|
|
Appendices (Cloud Peak Energy Inc.) 18 |

|
|
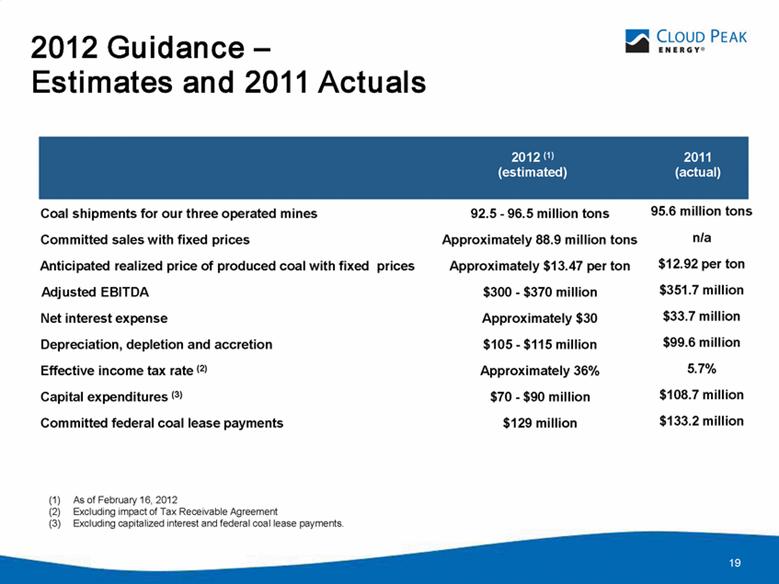
19 2012 Guidance – Estimates and 2011 Actuals 2012 (1) (estimated) 2011 (actual) As of February 16, 2012 Excluding impact of Tax Receivable Agreement (3) Excluding capitalized interest and federal coal lease payments. Coal shipments for our three operated mines 92.5 - 96.5 million tons 95.6 million tons Committed sales with fixed prices Approximately 88.9 million tons n/a Anticipated realized price of produced coal with fixed prices Approximately $13.47 per ton $12.92 per ton Adjusted EBITDA $300 - $370 million $351.7 million Net interest expense Approximately $30 $33.7 million Depreciation, depletion and accretion $105 - $115 million $99.6 million Effective income tax rate (2) Approximately 36% 5.7% Capital expenditures (3) $70 - $90 million $108.7 million Committed federal coal lease payments $129 million $133.2 million |
|
|
20 Average Cost of Produced Coal (1) Represents average cost of product sold for produced coal for our three company-operated mines. $8.57/ton for company-operated mines(1) $9.12/ton for company-operated mines(1) 2010 2011 |

|
|
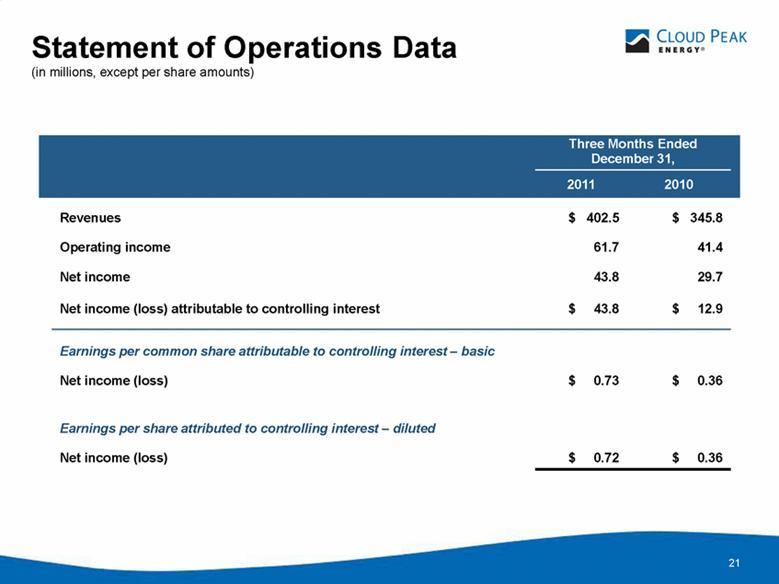
21 Statement of Operations Data (in millions, except per share amounts) Three Months Ended December 31, 2011 2010 Revenues $ 402.5 $ 345.8 Operating income 61.7 41.4 Net income 43.8 29.7 Net income (loss) attributable to controlling interest $ 43.8 $ 12.9 Earnings per common share attributable to controlling interest – basic Net income (loss) $ 0.73 $ 0.36 Earnings per share attributed to controlling interest – diluted Net income (loss) $ 0.72 $ 0.36 |
|
|
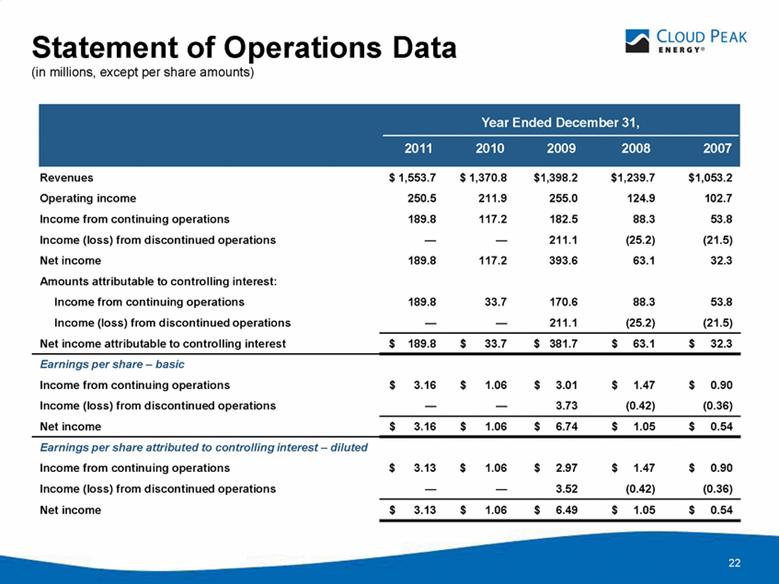
22 Statement of Operations Data (in millions, except per share amounts) Revenues $ 1,553.7 $ 1,370.8 $1,398.2 $1,239.7 $1,053.2 Operating income 250.5 211.9 255.0 124.9 102.7 Income from continuing operations 189.8 117.2 182.5 88.3 53.8 Income (loss) from discontinued operations — — 211.1 (25.2) (21.5) Net income 189.8 117.2 393.6 63.1 32.3 Amounts attributable to controlling interest: Income from continuing operations 189.8 33.7 170.6 88.3 53.8 Income (loss) from discontinued operations — — 211.1 (25.2) (21.5) Net income attributable to controlling interest $ 189.8 $ 33.7 $ 381.7 $ 63.1 $ 32.3 Earnings per share – basic Income from continuing operations $ 3.16 $ 1.06 $ 3.01 $ 1.47 $ 0.90 Income (loss) from discontinued operations — — 3.73 (0.42) (0.36) Net income $ 3.16 $ 1.06 $ 6.74 $ 1.05 $ 0.54 Earnings per share attributed to controlling interest – diluted Income from continuing operations $ 3.13 $ 1.06 $ 2.97 $ 1.47 $ 0.90 Income (loss) from discontinued operations — — 3.52 (0.42) (0.36) Net income $ 3.13 $ 1.06 $ 6.49 $ 1.05 $ 0.54 Year Ended December 31, 2011 2010 2009 2008 2007 |
|
|
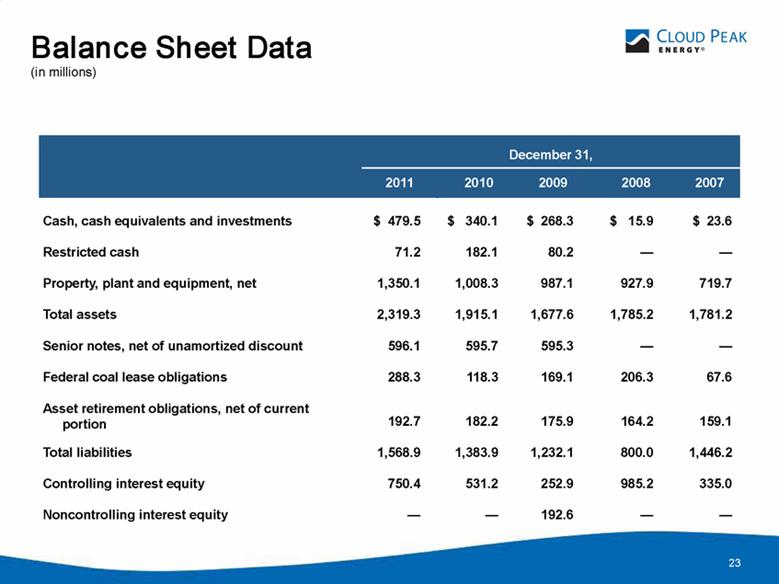
23 Balance Sheet Data (in millions) Cash, cash equivalents and investments $ 479.5 $ 340.1 $ 268.3 $ 15.9 $ 23.6 Restricted cash 71.2 182.1 80.2 — — Property, plant and equipment, net 1,350.1 1,008.3 987.1 927.9 719.7 Total assets 2,319.3 1,915.1 1,677.6 1,785.2 1,781.2 Senior notes, net of unamortized discount 596.1 595.7 595.3 — — Federal coal lease obligations 288.3 118.3 169.1 206.3 67.6 Asset retirement obligations, net of current portion 192.7 182.2 175.9 164.2 159.1 Total liabilities 1,568.9 1,383.9 1,232.1 800.0 1,446.2 Controlling interest equity 750.4 531.2 252.9 985.2 335.0 Noncontrolling interest equity — — 192.6 — — December 31, 2011 2010 2009 2008 2007 |
|
|
24 Reconciliation of Non-GAAP Measures – Adjusted EBITDA (in millions) Net income $ 43.8 $ 29.7 Interest income (0.1) (0.2) Interest expense 6.3 10.8 Income tax (benefit) provision 13.5 1.8 Depreciation and depletion 28.6 24.8 Amortization (1) — — Accretion 3.0 2.6 EBITDA 95.1 69.5 Expired significant broker contract (1) — 0.1 Marked-to-market adjustments (2.3) — Tax Receivable Agreement expense — — Adjusted EBITDA $ 92.8 $ 69.6 Three Months Ended December 31, 2011 2010 (1) The impact of the expired significant broker contract on the Statement of Operations is a combination of net income and the amortization expense related to the contract. All amortization expense for the periods presented was attributable to the significant broker contract. |

|
|
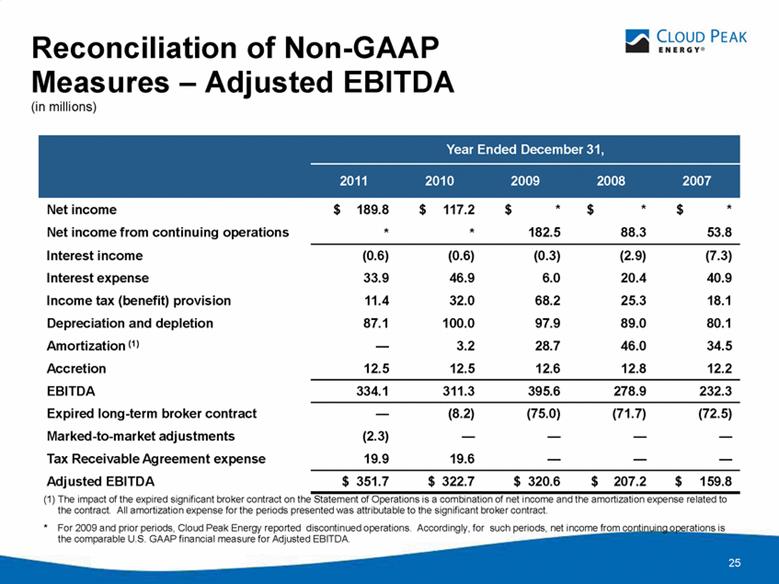
25 Reconciliation of Non-GAAP Measures – Adjusted EBITDA (in millions) Year Ended December 31, 2011 2010 2009 2008 2007 Net income $ 189.8 $ 117.2 $ * $ * $ * Net income from continuing operations * * 182.5 88.3 53.8 Interest income (0.6) (0.6) (0.3) (2.9) (7.3) Interest expense 33.9 46.9 6.0 20.4 40.9 Income tax (benefit) provision 11.4 32.0 68.2 25.3 18.1 Depreciation and depletion 87.1 100.0 97.9 89.0 80.1 Amortization (1) — 3.2 28.7 46.0 34.5 Accretion 12.5 12.5 12.6 12.8 12.2 EBITDA 334.1 311.3 395.6 278.9 232.3 Expired long-term broker contract — (8.2) (75.0) (71.7) (72.5) Marked-to-market adjustments (2.3) — — — — Tax Receivable Agreement expense 19.9 19.6 — — — Adjusted EBITDA $ 351.7 $ 322.7 $ 320.6 $ 207.2 $ 159.8 (1) The impact of the expired significant broker contract on the Statement of Operations is a combination of net income and the amortization expense related to the contract. All amortization expense for the periods presented was attributable to the significant broker contract. * For 2009 and prior periods, Cloud Peak Energy reported discontinued operations. Accordingly, for such periods, net income from continuing operations is the comparable U.S. GAAP financial measure for Adjusted EBITDA. |
|
|
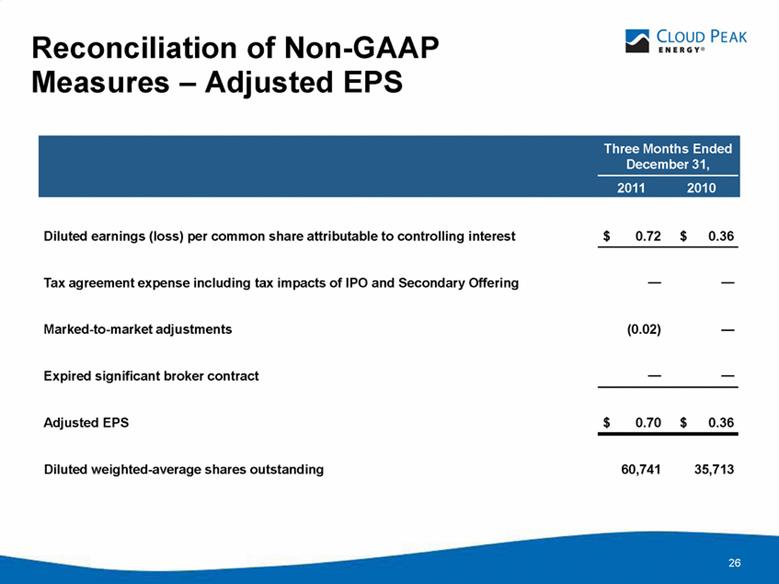
26 Reconciliation of Non-GAAP Measures – Adjusted EPS Three Months Ended December 31, 2011 2010 Diluted earnings (loss) per common share attributable to controlling interest $ 0.72 $ 0.36 Tax agreement expense including tax impacts of IPO and Secondary Offering — — Marked-to-market adjustments (0.02) — Expired significant broker contract — — Adjusted EPS $ 0.70 $ 0.36 Diluted weighted-average shares outstanding 60,741 35,713 |
|
|
27 Diluted earnings (loss) per common share attributable to controlling interest $ 3.13 $ 1.06 $ * $ * $ * Diluted earnings (loss) per common share attributable to controlling interest from continuing operations * * 2.97 1.47 0.90 Tax agreement expense including tax impacts of IPO and Secondary Offering (0.63) 0.78 — — — Marked-to-market adjustments (0.02) — — — — Expired significant broker contract — (0.10) (0.49) (0.41) (0.44) Adjusted EPS $ 2.47 $ 1.74 $ 2.48 $ 1.06 $ 0.46 Weighted-average shares outstanding 60,637 31,889 60,000 60,000 60,000 Reconciliation of Non-GAAP Measures – Adjusted EPS Year Ended December 31, 2011 2010 2009 2008 2007 * For 2009 and prior periods, Cloud Peak Energy reported discontinued operations. Accordingly, for such periods, diluted earnings (loss) per share attributable to controlling interest from continuing operations is the comparable U.S. GAAP financial measure for Adjusted EPS. |

|
|
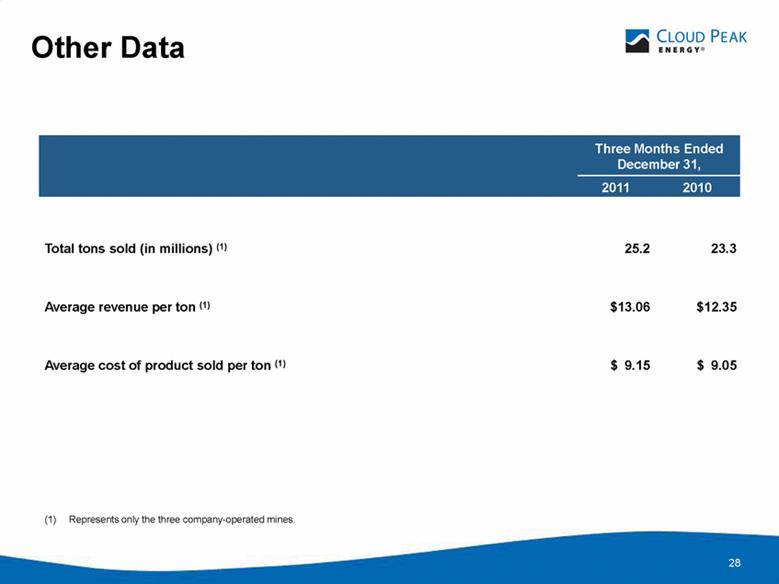
28 Other Data Three Months Ended December 31, 2011 2010 Total tons sold (in millions) (1) 25.2 23.3 Average revenue per ton (1) $13.06 $12.35 Average cost of product sold per ton (1) $ 9.15 $ 9.05 (1) Represents only the three company-operated mines. |
|
|
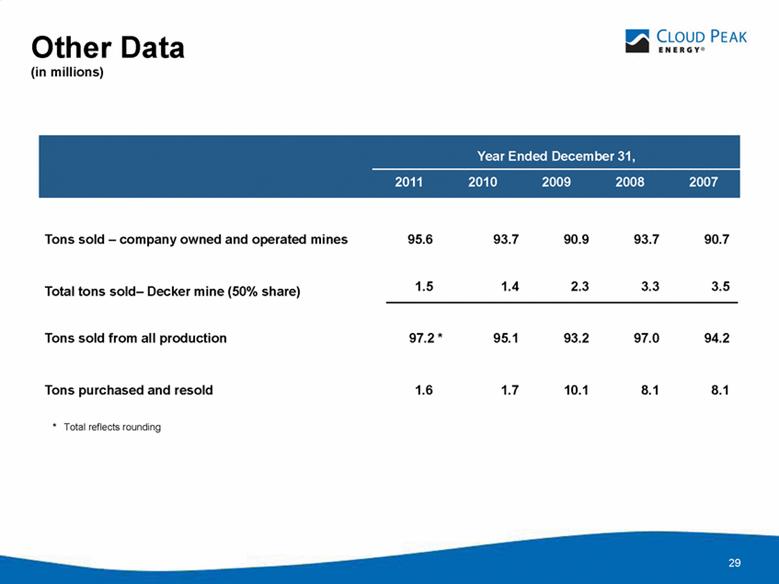
29 Other Data (in millions) Tons sold – company owned and operated mines 95.6 93.7 90.9 93.7 90.7 Total tons sold– Decker mine (50% share) 1.5 1.4 2.3 3.3 3.5 Tons sold from all production 97.2 * 95.1 93.2 97.0 94.2 Tons purchased and resold 1.6 1.7 10.1 8.1 8.1 Year Ended December 31, 2011 2010 2009 2008 2007 * Total reflects rounding |
|
|
30 Lease Acquisition Strategy Source: Cloud Peak Energy management. Note: Acquired tonnage is not classified as reserve until verified with sufficient technical and economic analysis. Maps not to scale. Cordero Rojo Mine (8425 Btu) Maysdorf II (Tract shown as applied for) Expected bid date 2012 – 2013 Tonnage estimate to be determined by the BLM (1) (1) The Maysdorf II tract, as applied for, is estimated to contain approximately 434 million recoverable tons. The BLM determined that certain surface owners met the criteria for being a “qualified surface owner” and set a deadline to obtain surface owner consent, which was not obtained. Accordingly, the BLM is expected to reconfigure the nominated tract to exclude such lands along with other adjustments, that CPE believes would result in a significant reduction of the applied for tonnage. WAII North and South Tracts – 383 million recoverable tons (1) Ridgerunner lease previously acquired – 81 million recoverable tons Extends mine life by approximately 12 years at current production rates (1) North and South tract leases are currently subject to pending legal challenges against the BLM and Secretary of the Interior by environmental organizations, which could impact our ability to mine the coal subject to those leases and/or delay our access to mine the coal. Antelope Mine (8875 Btu) Ridgerunner Lease South Tract Acquired 2011 North Tract Acquired 2011 AWARDED Spring Creek Mine (9350 Btu) AWARDED 48 million recoverable tons Lease modification completed in 2010 Extends mine life by 2 to 3 years at current production rates Lease Modification LBA Mined Area (2009/1010) Leased Coal |

|
|
31 Top Coal Producing Companies - 2011 Incident Rates (MSHA) Source: MSHA. Note: Total Incident Rate = (total number of employee incidents x 200,000) / total man-hours. Good Safety Record Indicates Well-Run Operations A portion of all employees’ bonuses is tied to safety Western Fuels Association Black Hills Corp Peter Kiewit Sons’ Inc Cloud Peak Energy Resources LLC NACCO Industries Inc Westmoreland Coal Company Charles C Ungurean Peabody Energy Energy Future Holdings Corporation Arch Coal Inc Armstrong Energy Corp. LLC Consol Energy Inc BHP Billition Patriot Coal Corporation James River Coal Company Chevron Corporation Alpha Natural Resources LLC James O Bunn et al J Clifford Forrest III Walter Energy Incorporated Massey Energy Company Alliance Resources Partners LP Robert E Murray Coalfield Transport Inc 0.00 1.12 1.15 1.18 1.25 1.33 1.48 1.52 1.61 1.88 1.97 1.99 2.97 3.00 3.16 3.79 4.58 4.98 5.22 5.31 5.79 5.96 6.00 6.67 |