Attached files
| file | filename |
|---|---|
| 8-K - FORM 8-K - CTS CORP | d320216d8k.htm |
 Investor Presentation
March 2012
Exhibit 99.1 |
 2
Safe Harbor Statement
This
presentation
contains
statements
that
are,
or
may
be
deemed
to
be,
forward-looking
statements
within the meaning of the Private Securities Litigation Reform Act of 1995. These
forward-looking statements include, but are not limited to, any
financial or other guidance, statements that reflect our current
expectations concerning future results and events and any other statements that are not based
solely on historical fact. Readers are cautioned not to place undue reliance on
these forward-looking statements,
which
speak
only
as
of
the
date
hereof
and
are
based
on
various
assumptions
as
to
future
events, the occurrence of which necessarily are subject to uncertainties. These
forward-looking statements are made subject to risks, uncertainties and
other factors, which could cause our actual results, performance or
achievements to differ materially from those presented in the forward-looking
statements, including, without limitation: changes in the economy generally and in
respect to the businesses in which CTS operates; rapid technological change;
general market conditions in the automotive, communications, and computer
industries, as well as conditions in the industrial, defense and aerospace,
and medical markets; reliance on key customers; unanticipated natural or other events such
as the Japan earthquake and the Thailand flood; the ability to protect our
intellectual property; pricing pressures
and
demand
for
our
products;
and
risks
associated
with
our
international
operations,
including
trade and tariff barriers, exchange rates and political and geographical
risks. For more detailed information
on
the
risks
and
uncertainties
associated
with
CTS’
business,
see
the
reports
CTS
files
with
the
SEC
available
at
http://www.ctscorp.com/investor_relations/investor.htm.
CTS
undertakes
no
obligation to publicly update its forward-looking statements to reflect new
information or events or circumstances
that
arise
after
the
date
hereof,
including
market
or
industry
changes. |
 3
CTS Corporation -
Profile
Sensors &
Actuators
Electronic
Components
49%
A global designer and manufacturer of highly engineered:
•
Sensors & Actuators,
•
Electronic Components,
•
and a provider of Electronics Manufacturing Services
Established in 1896 with 4,200 employees worldwide
Projected
Sales
Segments
Components &
Sensors
EMS
19%
32% |
 4
Global Operations
San Jose
Moorpark
Matamoros, Mexico
Nogales, Mexico
Elkhart
Lisle
Londonderry
Toronto, Canada
Albuquerque
Tucson
Scotland
Czech Republic
Thailand
Singapore
Taiwan
China
India
Auburn Hills
Japan
Sales Office
Manufacturing
Headquarters
Switzerland
Boston
Global footprint and diversified customer base. |
 5
Sales By Market and Geographic Regions
6%
6%
29%
22%
18%
19%
Other
Communications
Automotive
Industrial
Defense/
Aerospace
Medical
Sales by Market
5%
12%
58%
12%
30%
North
America
Asia
Europe
Sales By Region
Low Cost Manufacturing 47%
Diversified markets and a global (lower cost)
manufacturing footprint |
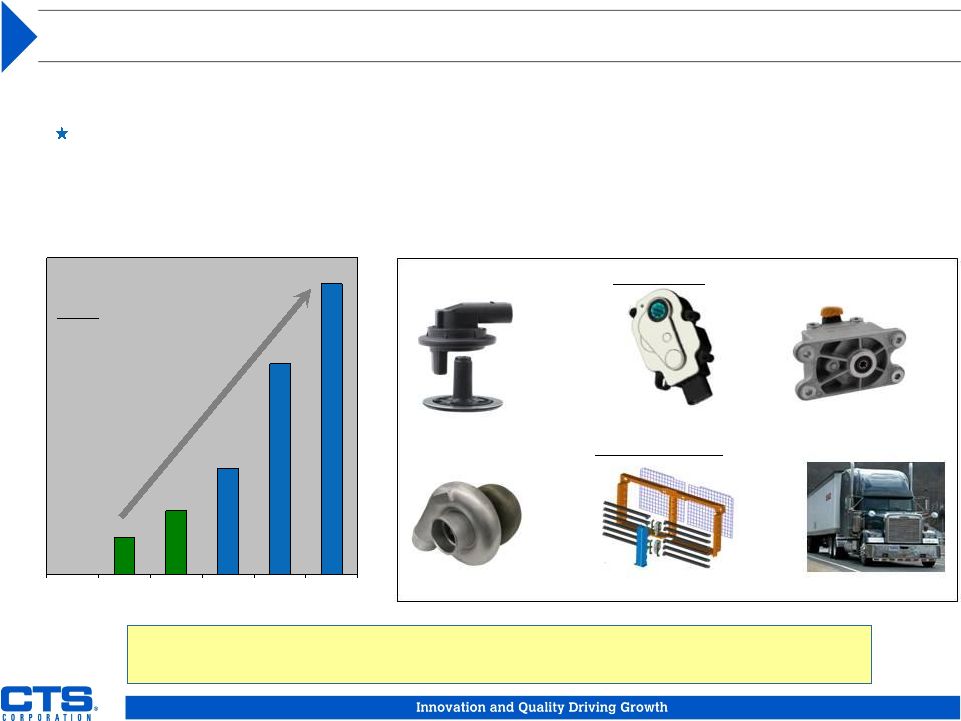
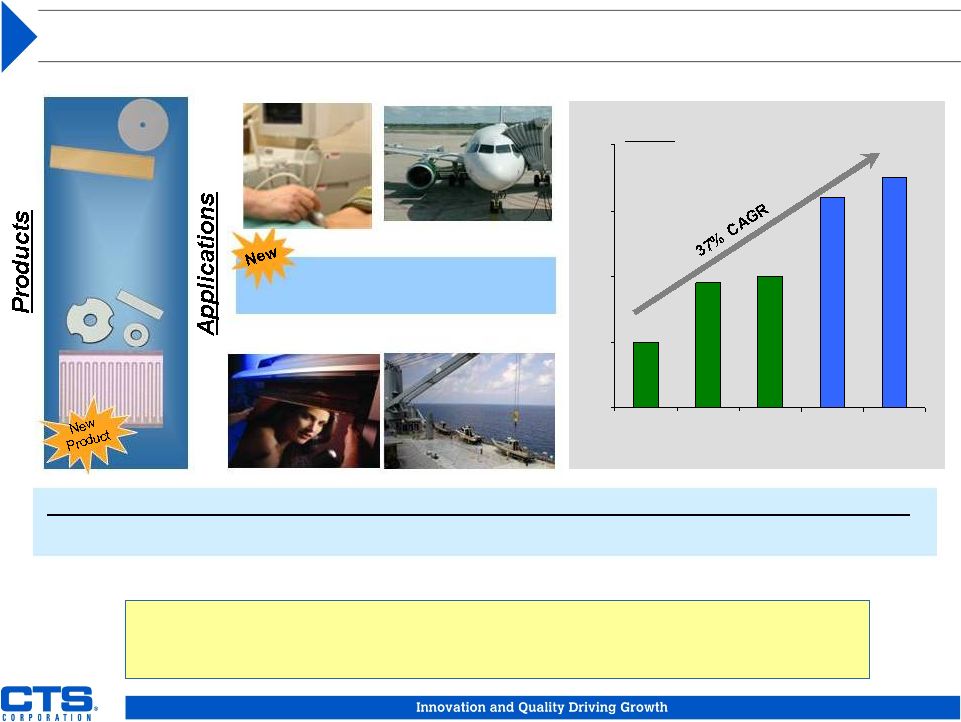
 6
Sensors and Actuators
•
Macro Trend Driving Growth
–
Tougher emissions standards
–
Need for increased fuel economy
•
New Products and New Customers
–
On and off highway diesel engine applications
–
Small turbocharger applications / Active grill
shutter actuators
Growth through new technology, customers and
penetration of new markets
32%
Sensors/
Actuators
Actuator
Sales
Rotary & Linear
Position Sensors
BLDC High Torque
Actuators
Heavy Duty
Hall-effect Sensors
Pedal
Modules
Miniature Rotary
Resistive Sensors
Integrated Sensor
Sub-assemblies
Turbocharger
Sensor
Expect double-digit sales growth over the next 3-5 years
|
 7
Total
Available
Market
(Including Pedal Sensors)
Growth Drivers -
Pedal Modules
130
142
120
49
72
67
98
91
30
2006
2007
2008
2009
2010
2011
2012
2013
2014
Target
Captured
CTS Pedal Modules offer performance, quality and cost advantages
CTS Pedal Sales $M
M
a
j
o
r
c
u
s
t
o
m
e
r
s
i
n
N
o
r
t
h
A
m
e
r
i
c
a,
E
u
r
o
p
e
a
nd
A
s
i
a.
$339
$385
$369
$325
$411
$438
$479
$511
$541 |
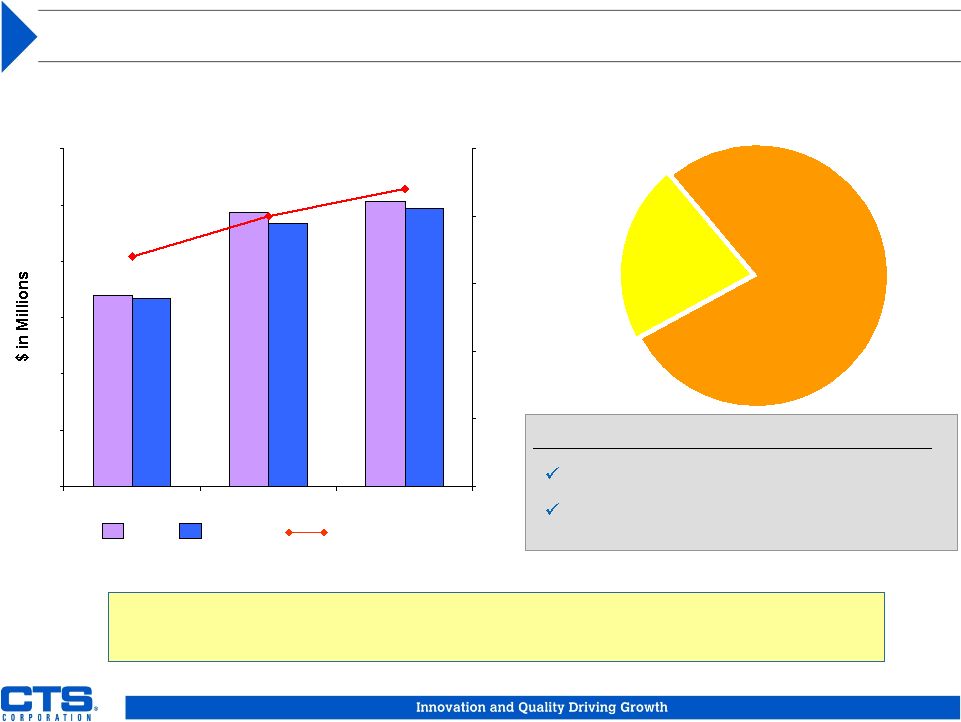
 8
Diversifying into new markets with new technologies
New Growth Drivers –
Sensors and Actuators
•
Organic growth driven by strong research and development
R&D 7.1% of Components and Sensors sales –
7 year high
•
Highly engineered products improve fuel economy and reduce emissions
•
Serves light vehicles and commercial markets
Applications
Turbocharger Sensor
Diesel Engines for
European Vehicles
$0
$20
$40
$60
2009
2010
2011
2012
2013
2014
Sales
$ in Millions
Actuator
Smart Actuator
Diesel Engines for
Commercial Vehicles
Products
Grill Shutter System
For N.A. Vehicles |
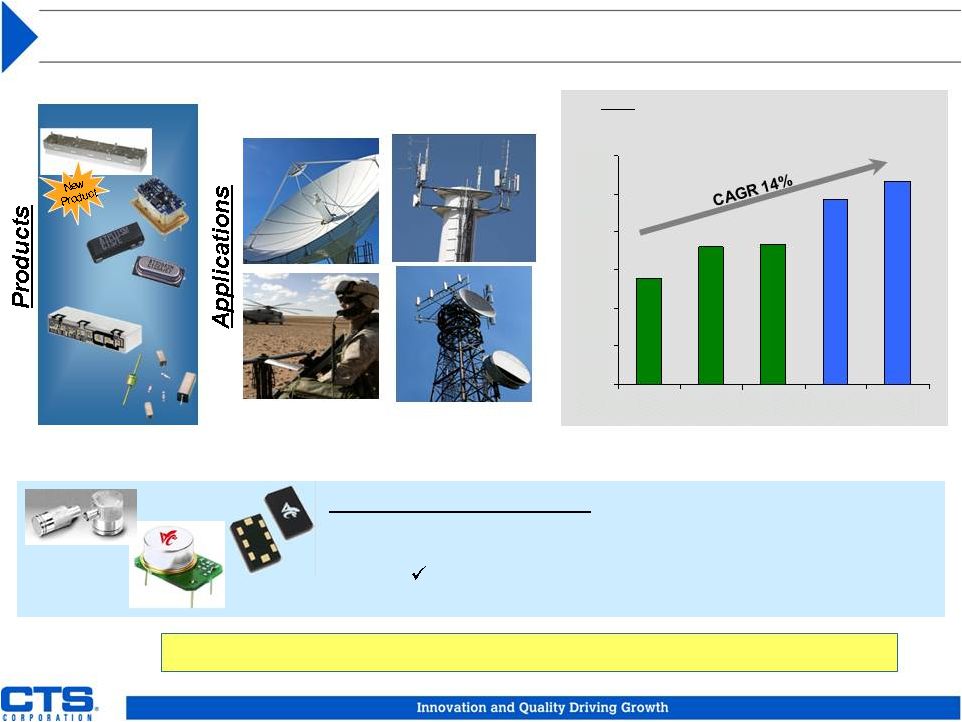
 9
Electronic Components
Double-digit sales growth over the next 3-5 years
•
Macro Trends Driving Growth
–
Strong wireless communication growth in emerging markets
–
Global markets driving higher data traffic
Smart phones, Social networking; YouTube, Facebook
EC
19%
Launching innovative new products
Expanding into new customers and applications
Sales
New Piezo Application for Hard Disk Drives
New Electrocomponent –
Product Applications
–
Mobility scooters, portable medical devices, industrial joysticks
•
New Growth Drivers:
Acquisitions –
Precision Frequency Products (Fordahl / Valpey Fisher)
|
 10
Electronic Components –
Communications Infrastructure
OCXO
Ceramic
Duplexer
Wireless
Base Station
Sales
$ in Millions
Key Customers: Alcatel–Lucent, Cisco, Nokia Siemens Networks, Juniper, Tellabs,
Emerson, Ciena, Rockwell Collins Increasing market share and winning new
customers Satellite
Communications
WiMAX
EMI
Filters
Clock
Oscillators
ActiPlex
®
Filters
Defense
Communications
ACQUISITION UPDATE
•
Valpey Fisher –
($15M annual sales)
Specializes in low-noise solutions for portable
military equipment / guidance systems
$0
$15
$30
$45
$60
$75
$90
2009
2010
2011
2012
2013 |
 11
Electronic Components –
Piezoceramic Products
0
10
20
30
40
2009
2010
2011
2012
2013
Sales
$ in Millions
Medical Ultrasound
Wide Format
Inkjet Printer Head
Undersea Energy
Exploration
Aerospace
Soft
And
Hard
Piezo
Ceramic
Materials
Hard Disk Drive Actuation
-
New generation of HDD actuation for computer market
New
Products
•
Class 1K cleanroom capability now operational in China
New applications are emerging for piezoceramic devices
spurring innovation and profitable growth
Piezo ceramic components for hard disk drive application launched – New Product / New
Customer |
 12
Electronics Manufacturing Solutions
EMS
49%
Sales
•
Strategic Focus
–
Target customers with complex needs
–
Target niche sectors –
defense & aerospace, medical, industrial
–
Provide turnkey services, design to direct ship
•
Specialized Tier 2 Global EMS Provider
Mid single-digit sales growth business over the next 3-5 years
Diversified business, improved cost structure and global
capabilities are improving EMS performance |
 13
Electronics Manufacturing Solutions
Communications
Industrial
Medical
Computer/
Other
2011
Defense/
Aerospace
•
Diversified business
•
Focus on segments requiring design
capabilities and special certification
Improved customer / market mix
Computer
Communications
Other
68%
29%
3%
2004
Targeted Area > 65%
•
Improving capacity utilization
•
Repositioning capacity
•
Thailand / Mexico expansion
Improving Performance
Operating Margin Before Corporate Charges
Target
Market Diversification
2.2%
5.2%
2.5%
7.0%
5.0%
2007-2009
2010
2011
Short-
Term
Long-
Term
4%
31%
9%
24%
32% |
 Financial Summary
Definitions and reconciliation of non-GAAP financial terms are included on
CTS’
Web site at www.ctscorp.com |
 15
Financial Performance Trend
Sales ($M)
Adjusted EPS
•
2011
growth
tempered
by
impact
of
Japan
earthquake
/
tsunami
and
Thailand
floods
•
2012 growth driven by new products, new programs, and new customers
$665
$647
$0.80
$0.75
$499
$553
$589
2009
2010
2011
2012
Guidance
$0.36
$0.66
$0.67
2009
2010
2011
2012
Guidance |
 16
Balance Sheet Trends
Capital Expenditures
Controllable Working Capital*
*
Controllable
Working
Capital
Defined
as
Accounts
Receivable
+
Inventories
-
Accounts
Payable.
2% -
3%
13%-14%
•
Higher working capital in 2010-2011 due to product launch and transfer
•
Capital expenditure remains on target despite new products and growth
initiative 0%
2%
2009
2010
2011
Target
8%
10%
12%
14%
16%
18%
20%
2009
2010
2011
Target |
 17
Free Cash Flow
$ in Millions
Recession/
Recovery
Average
$18M
Normal
Approx. $20M
Guidance
•
Free cash flow returns to pre-recession levels in 2012
•
Cash flow utilized for organic growth, acquisitions, stock buyback & dividend
increases Pre-Recession
Average
$20-25M
Note: Free Cash Flow defined as net cash provided by operations, less capital
expenditures $40
$6
$9
$21
$23
$0
$10
$20
$30
$40
2006-2008
2009
2010
2011
2012
$16 |
 18
Capital Structure
Strong balance sheet and conservative capital structure
Current Capital Structure
Total Debt to Capitalization
$51
$50
$73
$76
$74
$70
20%
22%
17%
$0
$15
$30
$45
$60
$75
$90
2009
2010
2011
0%
5%
10%
15%
20%
25%
Total Debt
Cash
Debt to Capitalization
Bank
Debt
$74
Equity
Amended
Bank
Agreement
in January
2012
Increased
our
facility
from
$150M
to
$200M
Lowered pricing by 25 bps |
 19
Target Adjusted Return on Invested Capital (ROIC)
OPERATING
MARGIN
AFTER-TAX
(NOPAT
Margin)
INVESTED CAPITAL TURNOVER
Overall ROIC improvement on track
4%
2%
6%
8%
0.5
1.0
1.5
2.0
2.5
3.0
3.5
ROIC
10%
12%
4.0
EMS
Components
& Sensors
2009
5.0%
2010
8.9%
09
10
2011
8.5%
11
2012
12
10% -
11%
Target Range
2011 ROIC impacted by Japan earthquake / tsunami and Thailand floods
2012 ROIC benefiting from new product launches, new programs, acquisitions
|
 20
Positioned For Profitable Growth
•
Winning new business and new customers with innovative
products and technology
Smart actuators, turbocharger sensors, grill shutter actuators, electromagnetic
filters, hard piezo micro actuators, digital encoders, industrial joysticks,
precision TCXOs
Penetrated new global customers: Honda, Honeywell, Western Digital,
Caterpillar, etc.
•
Effectively managing costs and reinvesting for future growth
•
Research and development focus and strong intellectual property
portfolio
•
Global footprint and diversified business model
•
Conservative balance sheet and positive cash flow
Announced dividend increase and continued stock buyback
•
Pursuing accretive, bolt-on acquisitions
Completed Valpey Fisher acquisition
Focused on enhancing shareholder value |
 21 |
 22
2011 Governance Enhancements
•
Change in Control Severance Agreement
–
Revised change in control
severance agreements for named executive officers to eliminate all excise
tax gross-ups
and reduce change in control benefits.
•
Officer and Director Stock Ownership
–
Increased the stock ownership
guidelines for the CEO to 5.5 times base salary, directors to 5.5 times the
annual board retainer (and other officers to 3.0 times base salary).
•
Lead Director Role
–
Expanded the role of lead director to enhance
effectiveness of that position, including increasing the lead director’s
involvement in key strategic initiatives and communication with major
shareholders when needed.
•
Director Resignation Policy
–
Adopted a director resignation policy so that
directors who receive a majority of withhold and/or against votes in a
director election will immediately tender their resignation. The Board of
Directors will then evaluate whether to accept the resignation.
For many years, CTS has maintained robust corporate governance policies.
During 2011, CTS’
Board of Directors took the following actions to further
strengthen CTS’
corporate governance. |
 23
Sample Applications:
Products:
Sensors and Actuators
Technologies:
•
Thick Film Resistive Ink Systems
•
Hall-effect Non-contacting Systems
•
BLDC High-Torque Electromagnetics
Capabilities:
•
Research, Design & Engineering
•
Custom Molding
•
Highly Automated Manufacturing
•
Global Footprint: N. America, Asia, Europe
Pedal
Modules
Miniature Rotary
Resistive Sensors
BLDC High Torque
Actuators
Rotary & Linear
Position Sensors
Integrated Sensor
Sub-assemblies
Heavy Duty Hall-effect Sensors
Passenger Vehicles
Light-Duty Delivery
Vehicles
On-Road Commercial
Vehicles
Off-Road Commercial Vehicles &
Industrial Equipment
Small Engine
Vehicles & Machinery |
 24
Sample Applications:
Products:
Technologies:
•
Thick Film Resistive Ink Systems
•
Quartz, Hard & Soft Piezoceramics
•
Electronic-grade Ceramics
•
Precision Coatings
Capabilities:
•
Research, Design & Engineering
•
Custom Packaging
•
ISO 13485, 9001, 14001 Certifications
•
North America and Asia Footprint
Wireless Broadband and
HDD Actuation
Industrial
Instrumentation
Defense and Aerospace
Communication & Guidance Systems
Medical Diagnostics &
Instrumentation
Electronic Components
Thermal
Management
Components
Ceramic RF
Filters
Piezoceramic
Components
EMI/RFI Filter
Components
Resistive/
Capacitive
Networks
Frequency
Modules
Switches &
Variable
Resistors |
 25
Sample Applications:
Major Markets:
Quality /
Regulatory:
•
ISO 13485, 9001
•
CFR 820
•
FDA Class I to III
•
IPC Class III
Capabilities:
•
Complex PCB’s and Boxbuilds
•
Custom Design & Engineering
•
Secure Manufacturing
•
Turnkey Services –
Design thru Direct Ship
•
High Technology Environment
•
Global Footprint: N. America, Asia, Europe
Communication
Infrastructure
Industrial Equipment
Defense and Aerospace
Medical Devices and
Equipment
Electronic Manufacturing Solutions
•
AS9100
•
ITAR / NISP
•
Mil Spec
•
List X
WiFi Arrays
Building & HVAC
Control Systems
Identity Recognition
Systems
Insulin Pumps &
Glucose Monitoring
Enterprise IP Video
on Demand
Aircraft Collision
Avoidance Systems
Products:
BoxBuilds
Complex PCB’s
Backplanes |
 26
Major CTS Competitors
PRODUCTS
Sensors and Actuators
COMPETITION
AB Electronics, Alps, Bosch, Bourns, Delphi, Denso,
Continental, CST, Hella, Mikuni
Electronic Components
Electronics Manufacturing Services
Axiom, Celestica, DuCommun, Flextronics, Jabil,
Keytronic, Plexus, Sanmina-SCI, Sparton, STI Ltd.,
Sypris Solutions, TT EMS
Frequency Products -
Infrastructure
Mini-circuits, Mtron, Morion, NDK, Rakon, RFMD, Vectron
Piezo electronics
APC, Edo, Morgan ElectroCeramics, Sumitomo, TRS
Ceramic Filters
Murata, Partron, TDK, UBE
EMI / RFI Filters
AVX, Corrymicro, Ferroperm, API Technologies, Stelco
BI Tech, Bourns, Grayhill, KOA
Resistor Networks |
 27
Supplying the ‘Green’
Energy Market
Sensors
And
Actuators
EMS
Battery -
Electric
All-Electric Vehicles
Electric Vehicle
Charging Systems
& Power Systems
‘Green’
Energy Sales
$ in Millions
New Electric Vehicle Market
Strengthening;
Providing Opportunities in
Fast Growing Market
Hybrid Gas/Electric
Vehicles
8
Program
Wins
2
Program
Wins
Zero-
Emissions
$1
$5
$9
$15
$18
2009
2010
2011
2012
2013 |
 28
Financial Summary
Note: Adjusted data excludes restructuring and related charges,
asset impairments and income tax adjustments.
2011
2010
2009
2008
2007
Net Sales
$588.5
$552.6
$499.0
$691.7
$685.9
Adjusted Operating Earnings
$28.7
$29.5
$17.6
$37.0
$34.9
Adjusted Operating Earnings % of Sales
4.9%
5.3%
3.5%
5.3%
5.1%
Adjusted Net Earnings
$23.4
$23.1
$12.0
$26.5
$26.0
Adjusted Net Earnings % of Sales
4.0%
4.2%
2.4%
3.8%
3.8%
Adjusted EPS, Diluted
$0.67
$0.66
$0.36
$0.77
$0.71
Free Cash Flow
$8.7
$6.1
$40.1
$16.5
$32.5
Total Debt / Capitalization
22.0%
20.3%
16.9%
22.4%
17.5%
Depreciation and Amortization
$17.5
$17.6
$19.5
$24.2
$22.8
Adjusted EBITDA
$49.5
$48.4
$36.4
$62.8
$60.9
Adjusted EBITDA % of Sales
8.4%
8.8%
7.3%
9.1%
8.9%
Controllable Working Capital - % of Sales
17.4%
16.8%
13.8%
14.4%
12.7%
Capex
$15.6
$13.3
$6.5
$17.6
$16.1
Capex - % of Sales
2.6%
2.4%
1.3%
2.6%
2.3%
$ in Millions |
 29
Other Financial Data –
Income Statement
Note: Adjusted data excludes restructuring and related charges,
asset impairments and income tax adjustments.
$ in Millions
Q4
Q3
Q2
Q1
Q4
Q3
Q2
Q1
Net Sales
$144.0
$146.1
$146.9
$151.5
$145.0
$139.4
$138.9
$129.4
Adjusted Gross Margin Percentage
19.6%
19.4%
19.4%
19.2%
20.3%
21.5%
21.9%
23.6%
Adjusted Operating Earnings
$9.6
$7.8
$5.5
$5.8
$7.7
$7.8
$7.7
$6.3
Adjusted Operating Earnings % of Sales
6.7%
5.3%
3.8%
3.8%
5.3%
5.6%
5.6%
4.9%
Adjusted Net Earnings
$7.7
$5.9
$4.8
$5.1
$5.9
$6.9
$5.9
$4.4
Adjusted Net Earnings % of Sales
5.3%
4.0%
3.3%
3.4%
4.1%
4.9%
4.2%
3.4%
Adjusted EPS, Diluted
$0.22
$0.17
$0.14
$0.15
$0.17
$0.20
$0.17
$0.13
Depreciation and Amortization
$4.4
$4.4
$4.4
$4.4
$4.3
$4.4
$4.5
$4.4
Adjusted EBITDA
$14.6
$12.5
$10.9
$11.5
$12.1
$13.9
$12.0
$10.3
Adjusted EBITDA % of Sales
10.1%
8.5%
7.4%
7.6%
8.3%
10.0%
8.6%
8.0%
2010
2011 |
 30
Other
Financial
Data
–
Balance
Sheet
Metrics
$ in Millions
Q4
Q3
Q2
Q1
Q4
Q3
Q2
Q1
Accounts Receivable, net
$88.3
$90.3
$87.8
$96.4
$95.9
$90.1
$84.6
$74.1
Inventories, net
$92.5
$91.4
$88.6
$87.9
$76.9
$76.6
$68.8
$60.0
Accounts Payable
$80.5
$78.9
$77.1
$79.4
$75.4
$70.5
$68.2
$59.5
Free Cash Flow
$5.4
$1.0
$8.0
($5.7)
$8.5
($2.5)
($3.7)
$3.8
Total Debt
$74.4
$89.7
$74.7
$80.3
$70.0
$77.1
$65.9
$56.0
Equity
$263.3
$291.1
$285.7
$281.5
$274.3
$265.1
$256.9
$251.2
Total Debt / Capitalization
22%
24%
21%
22%
20%
23%
20%
18%
2011
2010 |
CTS CORPORATION
APPENDIX 1
REGULATION G
CTS Corporation
Reconciliation of Gross Margin to Adjusted Gross Margin
($ in millions)
| 2011 | 2011 | 2010 | 2010 | 2009 | ||||||||||||||||||||||||||||||||||||||||||||||||||||
| Full year | Q4 | Q3 | Q2 | Q1 | Full year | Q4 | Q3 | Q2 | Q1 | Q4 | Q3 | Q2 | Q1 | |||||||||||||||||||||||||||||||||||||||||||
| Gross Margin |
$ | 109.8 | $ | 25.8 | $ | 27.5 | $ | 27.4 | $ | 29.2 | $ | 119.9 | $ | 29.1 | $ | 30.0 | $ | 30.3 | $ | 30.5 | $ | 30.9 | $ | 26.2 | $ | 21.9 | $ | 19.8 | ||||||||||||||||||||||||||||
| Charges (credits) to reported Gross Margin : |
||||||||||||||||||||||||||||||||||||||||||||||||||||||||
| Restructuring-related costs included in cost of goods sold |
0.3 | 0.3 | — | — | — | 0.3 | 0.3 | — | — | — | — | — | — | — | ||||||||||||||||||||||||||||||||||||||||||
| Insurance recovery for business interruption |
4.1 | 2.2 | 0.8 | 1.1 | — | |||||||||||||||||||||||||||||||||||||||||||||||||||
|
|
|
|
|
|
|
|
|
|
|
|
|
|
|
|
|
|
|
|
|
|
|
|
|
|
|
|
|
|||||||||||||||||||||||||||||
| Total adjustments to reported Gross Margin |
4.3 | 2.5 | 0.8 | 1.1 | — | 0.3 | 0.3 | — | — | — | — | — | — | — | ||||||||||||||||||||||||||||||||||||||||||
|
|
|
|
|
|
|
|
|
|
|
|
|
|
|
|
|
|
|
|
|
|
|
|
|
|
|
|
|
|||||||||||||||||||||||||||||
| Adjusted Gross Margin |
$ | 114.2 | $ | 28.3 | $ | 28.3 | $ | 28.5 | $ | 29.2 | $ | 120.2 | $ | 29.4 | $ | 30.0 | $ | 30.3 | $ | 30.5 | $ | 30.9 | $ | 26.2 | $ | 21.9 | $ | 19.8 | ||||||||||||||||||||||||||||
| Total Sales |
$ | 588.5 | $ | 144.0 | $ | 146.1 | $ | 146.9 | $ | 151.5 | $ | 552.6 | $ | 145.0 | $ | 139.4 | $ | 138.9 | $ | 129.4 | $ | 133.9 | $ | 126.6 | $ | 120.4 | $ | 118.1 | ||||||||||||||||||||||||||||
|
|
|
|
|
|
|
|
|
|
|
|
|
|
|
|
|
|
|
|
|
|
|
|
|
|
|
|
|
|||||||||||||||||||||||||||||
| Adjusted Gross Margin as a percentage of total sales |
19.4 | % | 19.6 | % | 19.4 | % | 19.4 | % | 19.2 | % | 21.7 | % | 20.3 | % | 21.5 | % | 21.9 | % | 23.6 | % | 23.1 | % | 20.7 | % | 18.2 | % | 16.8 | % | ||||||||||||||||||||||||||||
|
|
|
|
|
|
|
|
|
|
|
|
|
|
|
|
|
|
|
|
|
|
|
|
|
|
|
|
|
|||||||||||||||||||||||||||||
Note: Q2 2011 reclass to conform with current period reclassification.
CTS Corporation
Reconciliation of Operating Earnings (Loss) to Adjusted Operating Earnings (Loss)
($ in millions)
| 2011 | 2010 | 2009 | Full year | |||||||||||||||||||||||||||||||||||||||||||||||||||||||||||||||||
| Q4 | Q3 | Q2 | Q1 | Q4 | Q3 | Q2 | Q1 | Q4 | Q3 | Q2 | Q1 | 2011 | 2010 | 2009 | 2008 | 2007 | ||||||||||||||||||||||||||||||||||||||||||||||||||||
| Operating earnings / (loss) |
$ | 7.2 | $ | 7.8 | $ | 4.5 | $ | 5.8 | $ | 6.0 | $ | 7.8 | $ | 7.7 | $ | 6.3 | $ | 8.3 | $ | 6.3 | $ | 3.2 | $ | (35.5 | ) | $ | 25.2 | $ | 27.8 | $ | (17.8 | ) | $ | 30.9 | $ | 32.3 | ||||||||||||||||||||||||||||||||
| Charges (credits) to reported operating earnings (loss): |
||||||||||||||||||||||||||||||||||||||||||||||||||||||||||||||||||||
| Restructuring, restructuring-related, and asset impairment charges |
2.4 | — | 0.7 | — | 1.7 | — | — | — | — | — | — | 2.2 | 3.1 | 1.7 | 2.2 | 6.1 | 2.6 | |||||||||||||||||||||||||||||||||||||||||||||||||||
| Goodwill impairment |
— | — | — | — | — | — | — | — | — | — | 33.2 | — | 33.2 | |||||||||||||||||||||||||||||||||||||||||||||||||||||||
| Gain on sale of excess equipment less LTCC severance |
— | |||||||||||||||||||||||||||||||||||||||||||||||||||||||||||||||||||
| Additional legal costs |
— | 0.3 | 0.3 | — | — | — | — | |||||||||||||||||||||||||||||||||||||||||||||||||||||||||||||
|
|
|
|
|
|
|
|
|
|
|
|
|
|
|
|
|
|
|
|
|
|
|
|
|
|
|
|
|
|
|
|
|
|
|
|||||||||||||||||||||||||||||||||||
| Total adjustments to reported operating (loss) / earnings |
2.4 | — | 1.0 | — | 1.7 | — | — | — | — | — | — | 35.4 | 3.5 | 1.7 | 35.4 | 6.1 | 2.6 | |||||||||||||||||||||||||||||||||||||||||||||||||||
|
|
|
|
|
|
|
|
|
|
|
|
|
|
|
|
|
|
|
|
|
|
|
|
|
|
|
|
|
|
|
|
|
|
|
|||||||||||||||||||||||||||||||||||
| Adjusted operating earnings / (loss), excluding above referenced items |
$ | 9.6 | $ | 7.8 | $ | 5.5 | $ | 5.8 | $ | 7.7 | $ | 7.8 | $ | 7.7 | $ | 6.3 | $ | 8.3 | $ | 6.3 | $ | 3.2 | $ | (0.1 | ) | $ | 28.7 | $ | 29.5 | $ | 17.6 | $ | 37.0 | $ | 34.9 | |||||||||||||||||||||||||||||||||
| Total Sales |
$ | 144.0 | $ | 146.1 | $ | 146.9 | $ | 151.5 | $ | 145.0 | $ | 139.4 | $ | 138.9 | $ | 129.4 | $ | 133.9 | $ | 126.6 | $ | 120.4 | $ | 118.1 | $ | 588.5 | $ | 552.6 | $ | 499.0 | $ | 691.7 | $ | 685.9 | ||||||||||||||||||||||||||||||||||
|
|
|
|
|
|
|
|
|
|
|
|
|
|
|
|
|
|
|
|
|
|
|
|
|
|
|
|
|
|
|
|
|
|
|
|||||||||||||||||||||||||||||||||||
| Adjusted operating earnings / (loss), excluding above referenced items, as a percentage of total sales |
6.7 | % | 5.3 | % | 3.8 | % | 3.8 | % | 5.3 | % | 5.6 | % | 5.6 | % | 4.9 | % | 6.2 | % | 5.0 | % | 2.7 | % | -0.1 | % | 4.9 | % | 5.3 | % | 3.5 | % | 5.3 | % | 5.1 | % | ||||||||||||||||||||||||||||||||||
|
|
|
|
|
|
|
|
|
|
|
|
|
|
|
|
|
|
|
|
|
|
|
|
|
|
|
|
|
|
|
|
|
|
|
|||||||||||||||||||||||||||||||||||
CTS Corporation
Reconciliation of Net (Loss) Earnings to Adjusted Net Earnings (Loss)
($ in millions)
| 2011 | 2010 | 2009 | Full Year | |||||||||||||||||||||||||||||||||||||||||||||||||||||||||||||||||
| Q4 | Q3 | Q2 | Q1 | Q4 | Q3 | Q2 | Q1 | Q4 | Q3 | Q2 | Q1 | 2011 | 2010 | 2009 | 2008 | 2007 | ||||||||||||||||||||||||||||||||||||||||||||||||||||
| Net earnings / (loss) (A) |
5.9 | 5.9 | 4.1 | 5.1 | 4.8 | 6.9 | 5.9 | 4.4 | 4.1 | 4.5 | (7.0 | ) | (35.6 | ) | 21.0 | 22.0 | (34.1 | ) | 28.1 | $ | 24.0 | |||||||||||||||||||||||||||||||||||||||||||||||
|
|
|
|
|
|
|
|
|
|
|
|
|
|
|
|
|
|
|
|
|
|
|
|
|
|
|
|
|
|
|
|
|
|
|
|||||||||||||||||||||||||||||||||||
| Charges (credits) to reported net earnings (loss): |
||||||||||||||||||||||||||||||||||||||||||||||||||||||||||||||||||||
| Restructuring, restructuring-related, and asset impairment charges |
2.4 | — | 0.7 | — | 1.7 | — | — | — | — | — | 2.2 | 3.1 | 1.7 | 2.2 | 6.1 | 2.6 | ||||||||||||||||||||||||||||||||||||||||||||||||||||
| Goodwill impairment |
— | — | — | — | — | — | — | — | — | — | 33.2 | 33.2 | ||||||||||||||||||||||||||||||||||||||||||||||||||||||||
| Gain on sale of excess equipment less LTCC severance |
||||||||||||||||||||||||||||||||||||||||||||||||||||||||||||||||||||
| Additional legal costs |
— | — | 0.3 | 0.3 | ||||||||||||||||||||||||||||||||||||||||||||||||||||||||||||||||
|
|
|
|
|
|
|
|
|
|
|
|
|
|
|
|
|
|
|
|
|
|
|
|
|
|
|
|
|
|
|
|
|
|
|
|||||||||||||||||||||||||||||||||||
| Total adjustments to reported net earnings |
2.4 | — | 1.0 | — | 1.7 | — | — | — | — | — | — | 35.4 | 3.5 | 1.7 | 35.4 | 6.1 | 2.6 | |||||||||||||||||||||||||||||||||||||||||||||||||||
| Total adjustments, tax affected (B) |
1.8 | — | 0.7 | 1.1 | 34.5 | 2.5 | 1.1 | 34.5 | 3.9 | 2.0 | ||||||||||||||||||||||||||||||||||||||||||||||||||||||||||
| Impact of tax repatriation (C) |
— | — | 9.1 | 9.1 | ||||||||||||||||||||||||||||||||||||||||||||||||||||||||||||||||
| Impact of tax treaty (D) |
(1.4 | ) | ||||||||||||||||||||||||||||||||||||||||||||||||||||||||||||||||||
| Impact of reversal of tax reserves (E) |
2.5 | 2.5 | (4.1 | ) | ||||||||||||||||||||||||||||||||||||||||||||||||||||||||||||||||
|
|
|
|
|
|
|
|
|
|
|
|
|
|
|
|
|
|
|
|
|
|
|
|
|
|
|
|
|
|
|
|
|
|
|
|||||||||||||||||||||||||||||||||||
| Adjusted net earnings / (loss) (A+B+C+D+E) |
$ | 7.7 | $ | 5.9 | $ | 4.8 | $ | 5.1 | $ | 5.9 | $ | 6.9 | $ | 5.9 | $ | 4.4 | $ | 6.6 | $ | 4.5 | $ | 2.1 | $ | (1.1 | ) | $ | 23.4 | $ | 23.1 | $ | 12.0 | $ | 26.5 | $ | 26.0 | |||||||||||||||||||||||||||||||||
| Total Sales |
$ | 144.0 | $ | 146.1 | $ | 146.9 | $ | 151.5 | $ | 145.0 | $ | 139.4 | $ | 138.9 | $ | 129.4 | $ | 133.9 | $ | 126.6 | $ | 120.4 | $ | 118.1 | $ | 588.5 | $ | 552.6 | $ | 499.0 | $ | 691.7 | $ | 685.9 | ||||||||||||||||||||||||||||||||||
|
|
|
|
|
|
|
|
|
|
|
|
|
|
|
|
|
|
|
|
|
|
|
|
|
|
|
|
|
|
|
|
|
|
|
|||||||||||||||||||||||||||||||||||
| Adjusted net earnings / (loss) as a percentage of total sales. |
5.3 | % | 4.0 | % | 3.3 | % | 3.4 | % | 4.1 | % | 4.9 | % | 4.2 | % | 3.4 | % | 4.9 | % | 3.6 | % | 1.7 | % | -0.9 | % | 4.0 | % | 4.2 | % | 2.4 | % | 3.8 | % | 3.8 | % | ||||||||||||||||||||||||||||||||||
|
|
|
|
|
|
|
|
|
|
|
|
|
|
|
|
|
|
|
|
|
|
|
|
|
|
|
|
|
|
|
|
|
|
|
|||||||||||||||||||||||||||||||||||
| 2010 | 2009 | 2009 | ||||||||||
| 1st Half | 2nd Half | 1st Half | ||||||||||
| Net earnings / (loss) (A) |
10.3 | 8.6 | (42.6 | ) | ||||||||
|
|
|
|
|
|
|
|||||||
| Charges (credits) to reported net earnings (loss): |
||||||||||||
| Restructuring, restructuring-related, and asset impairment charges |
— | 2.2 | ||||||||||
| Goodwill impairment |
— | 33.2 | ||||||||||
| Gain on sale of excess equipment less LTCC severance |
||||||||||||
| Gain on sale of excess Canadian land |
||||||||||||
|
|
|
|
|
|
|
|||||||
| Total adjustments to reported net (loss) / earnings |
— | — | 35.4 | |||||||||
| Total adjustments, tax affected (B) |
34.5 | |||||||||||
| Impact of tax repatriation (C) |
||||||||||||
| Impact of tax treaty (D) |
9.1 | |||||||||||
| Impact of reversal of tax reserves (E) |
2.5 | |||||||||||
|
|
|
|
|
|
|
|||||||
| Adjusted net earnings / (loss) (A+B+C+D+E) |
$ | 10.3 | $ | 11.1 | $ | 1.0 | ||||||
| Total Sales |
$ | 268.3 | $ | 260.5 | $ | 238.5 | ||||||
|
|
|
|
|
|
|
|||||||
| Adjusted net earnings / (loss) as a percentage of total sales. |
3.8 | % | 4.3 | % | 0.4 | % | ||||||
|
|
|
|
|
|
|
|||||||
CTS Corporation
Reconciliation of Diluted (Loss) Earnings Per Share to Adjusted Diluted Earnings (Loss) Per Share
| 2011 | 2010 | 2009 | Full Year | |||||||||||||||||||||||||||||||||||||||||||||||||||||||||||||||||
| Q4 | Q3 | Q2 | Q1 | Q4 | Q3 | Q2 | Q1 | Q4 | Q3 | Q2 | Q1 | 2011 | 2010 | 2009 | 2008 | 2007 | ||||||||||||||||||||||||||||||||||||||||||||||||||||
| Diluted earnings/(loss) per share |
$ | 0.17 | $ | 0.17 | $ | 0.12 | $ | 0.15 | $ | 0.14 | $ | 0.20 | $ | 0.17 | $ | 0.13 | $ | 0.12 | $ | 0.13 | $ | (0.21 | ) | $ | (1.06 | ) | $ | 0.60 | $ | 0.63 | $ | (1.01 | ) | $ | 0.81 | $ | 0.66 | |||||||||||||||||||||||||||||||
| Tax affected charges (credits) to reported (loss) / earnings per share: |
||||||||||||||||||||||||||||||||||||||||||||||||||||||||||||||||||||
| Restructuring, restructuring-related, and asset impairment charges |
0.05 | — | 0.01 | — | 0.03 | — | — | — | — | — | 0.05 | 0.06 | 0.03 | 0.05 | 0.10 | 0.05 | ||||||||||||||||||||||||||||||||||||||||||||||||||||
| Goodwill impairment |
— | — | — | — | — | — | — | — | — | — | 0.98 | 0.98 | ||||||||||||||||||||||||||||||||||||||||||||||||||||||||
| Gain on sale of excess equipment less LTCC severance |
||||||||||||||||||||||||||||||||||||||||||||||||||||||||||||||||||||
| Additional legal costs |
— | — | 0.01 | 0.01 | ||||||||||||||||||||||||||||||||||||||||||||||||||||||||||||||||
|
|
|
|
|
|
|
|
|
|
|
|
|
|
|
|
|
|
|
|
|
|
|
|
|
|
|
|
|
|
|
|
|
|
|
|||||||||||||||||||||||||||||||||||
| Total tax affected adjustments to reported (loss) / earnings per share |
0.05 | — | 0.02 | — | 0.03 | — | — | — | — | — | — | 1.03 | 0.07 | 0.03 | 1.03 | 0.10 | 0.05 | |||||||||||||||||||||||||||||||||||||||||||||||||||
| Tax impact of cash repatriation |
— | — | 0.27 | 0.27 | ||||||||||||||||||||||||||||||||||||||||||||||||||||||||||||||||
| Impact of reversal of tax reserves and change in tax treaty |
0.07 | 0.07 | (0.14 | ) | ||||||||||||||||||||||||||||||||||||||||||||||||||||||||||||||||
|
|
|
|
|
|
|
|
|
|
|
|
|
|
|
|
|
|
|
|
|
|
|
|
|
|
|
|
|
|
|
|
|
|
|
|||||||||||||||||||||||||||||||||||
| Adjusted diluted earnings / (loss) per share |
$ | 0.22 | $ | 0.17 | $ | 0.14 | $ | 0.15 | $ | 0.17 | $ | 0.20 | $ | 0.17 | $ | 0.13 | $ | 0.19 | $ | 0.13 | $ | 0.06 | $ | (0.03 | ) | $ | 0.67 | $ | 0.66 | $ | 0.36 | $ | 0.77 | $ | 0.71 | |||||||||||||||||||||||||||||||||
|
|
|
|
|
|
|
|
|
|
|
|
|
|
|
|
|
|
|
|
|
|
|
|
|
|
|
|
|
|
|
|
|
|
|
|||||||||||||||||||||||||||||||||||
CTS Corporation
ADJUSTED EBITDA YEAR-TO-DATE
($ in millions)
| Full Year | ||||||||||||||||||||
| 2011 | 2010 | 2009 | 2008 | 2007 | ||||||||||||||||
| Net (loss) / earnings |
$ | 21.0 | $ | 22.0 | $ | (34.1 | ) | $ | 28.1 | $ | 23.9 | |||||||||
| Depreciation and amortization expense |
17.5 | 17.6 | 19.5 | 24.2 | 22.8 | |||||||||||||||
| Interest expense |
2.1 | 1.1 | 1.9 | 6.2 | 5.5 | |||||||||||||||
| Tax expense / (benefit) |
5.4 | 6.0 | 13.6 | (1.8 | ) | 6.1 | ||||||||||||||
|
|
|
|
|
|
|
|
|
|
|
|||||||||||
| EBITDA |
$ | 46.0 | $ | 46.7 | $ | 1.0 | $ | 56.7 | $ | 58.3 | ||||||||||
|
|
|
|
|
|
|
|
|
|
|
|||||||||||
| Charges (credits) to reported EBITDA: |
||||||||||||||||||||
| Restructuring and asset impairment charges |
$ | 3.1 | $ | 1.7 | 2.2 | 6.1 | 2.6 | |||||||||||||
| Additional legal costs |
$ | 0.3 | ||||||||||||||||||
| Goodwill impairment |
33.2 | |||||||||||||||||||
| Gain on sale of excess equipment less LTCC severance |
||||||||||||||||||||
|
|
|
|
|
|
|
|
|
|
|
|||||||||||
| Total adjustments to reported EBITDA |
3.5 | 1.7 | 35.4 | 6.1 | 2.6 | |||||||||||||||
|
|
|
|
|
|
|
|
|
|
|
|||||||||||
| Adjusted EBITDA |
$ | 49.5 | $ | 48.4 | $ | 36.4 | $ | 62.8 | $ | 60.9 | ||||||||||
| Total Sales |
$ | 588.5 | $ | 552.6 | $ | 499.0 | $ | 691.7 | $ | 685.9 | ||||||||||
|
|
|
|
|
|
|
|
|
|
|
|||||||||||
| Adjusted EBITDA as a percentage of total sales. |
8.4 | % | 8.8 | % | 7.3 | % | 9.1 | % | 8.9 | % | ||||||||||
|
|
|
|
|
|
|
|
|
|
|
|||||||||||
CTS Corporation
ADJUSTED EBITDA QUARTER-TO-DATE
($ in millions)
| 2011 | 2010 | 2009 | ||||||||||||||||||||||||||||||||||||||||||||||
| Q4 | Q3 | Q2 | Q1 | Q4 | Q3 | Q2 | Q1 | Q4 | Q3 | Q2 | Q1 | |||||||||||||||||||||||||||||||||||||
| Net earnings / (loss) |
$ | 5.9 | $ | 5.9 | $ | 4.1 | $ | 5.1 | $ | 4.8 | $ | 6.9 | $ | 5.9 | $ | 4.4 | $ | 4.1 | $ | 4.5 | $ | (7.0 | ) | $ | (35.6 | ) | ||||||||||||||||||||||
| Depreciation and amortization expense |
4.4 | 4.4 | 4.4 | 4.4 | 4.3 | 4.3 | 4.5 | 4.4 | 4.6 | 4.4 | 5.2 | 5.3 | ||||||||||||||||||||||||||||||||||||
| Interest expense |
0.6 | 0.5 | 0.5 | 0.5 | 0.4 | 0.3 | 0.2 | 0.2 | 0.2 | 0.3 | 0.5 | 0.9 | ||||||||||||||||||||||||||||||||||||
| Tax expense / (benefit) |
1.4 | 1.6 | 0.9 | 1.5 | 0.9 | 2.4 | 1.4 | 1.3 | 3.8 | 1.2 | 9.7 | (1.0 | ) | |||||||||||||||||||||||||||||||||||
|
|
|
|
|
|
|
|
|
|
|
|
|
|
|
|
|
|
|
|
|
|
|
|
|
|||||||||||||||||||||||||
| EBITDA |
$ | 12.1 | $ | 12.5 | $ | 9.9 | $ | 11.5 | $ | 10.4 | $ | 13.9 | $ | 12.0 | $ | 10.3 | $ | 12.7 | $ | 10.4 | $ | 8.4 | $ | (30.4 | ) | |||||||||||||||||||||||
|
|
|
|
|
|
|
|
|
|
|
|
|
|
|
|
|
|
|
|
|
|
|
|
|
|||||||||||||||||||||||||
| Charges (credits) to reported EBITDA: |
||||||||||||||||||||||||||||||||||||||||||||||||
| Restructuring, restructuring-related, and asset impairment charges |
2.4 | — | 0.7 | — | 1.7 | — | — | — | — | — | — | 2.2 | ||||||||||||||||||||||||||||||||||||
| Additional legal costs |
— | — | 0.3 | — | — | — | — | — | — | — | — | — | ||||||||||||||||||||||||||||||||||||
| Goodwill impairment |
— | — | — | — | — | — | — | — | — | — | — | 33.2 | ||||||||||||||||||||||||||||||||||||
|
|
|
|
|
|
|
|
|
|
|
|
|
|
|
|
|
|
|
|
|
|
|
|
|
|||||||||||||||||||||||||
| Total adjustments to reported EBITDA |
2.4 | — | 1.0 | — | 1.7 | — | — | — | — | — | — | 35.4 | ||||||||||||||||||||||||||||||||||||
|
|
|
|
|
|
|
|
|
|
|
|
|
|
|
|
|
|
|
|
|
|
|
|
|
|||||||||||||||||||||||||
| Adjusted EBITDA |
14.6 | 12.5 | 10.9 | 11.5 | 12.1 | $ | 13.9 | $ | 12.0 | $ | 10.3 | $ | 12.7 | $ | 10.4 | $ | 8.4 | $ | 5.0 | |||||||||||||||||||||||||||||
| Total Sales |
$ | 144.0 | $ | 146.1 | $ | 146.9 | $ | 151.5 | $ | 145.0 | $ | 139.4 | $ | 138.9 | $ | 129.4 | $ | 133.9 | $ | 126.6 | $ | 120.4 | $ | 118.1 | ||||||||||||||||||||||||
|
|
|
|
|
|
|
|
|
|
|
|
|
|
|
|
|
|
|
|
|
|
|
|
|
|||||||||||||||||||||||||
| Adjusted EBITDA as a percentage of total sales |
10.1 | % | 8.5 | % | 7.4 | % | 7.6 | % | 8.3 | % | 9.9 | % | 8.6 | % | 8.0 | % | 9.5 | % | 8.2 | % | 7.0 | % | 4.2 | % | ||||||||||||||||||||||||
|
|
|
|
|
|
|
|
|
|
|
|
|
|
|
|
|
|
|
|
|
|
|
|
|
|||||||||||||||||||||||||
CTS Corporation
Free Cash Flow
($ in millions)
| 2011 | 2010 | 2009 | Full Year | |||||||||||||||||||||||||||||||||||||||||||||||||||||||||||||||||||||
| Q4 | Q3-YTD | Q3 | Q2 | Q1 | Q4 | Q3 | Q2 | Q1 | Q4 | Q3 | Q2 | Q1 | 2011 | 2010 | 2009 | 2008 | 2007 | |||||||||||||||||||||||||||||||||||||||||||||||||||||||
| Cash flows provided from (used by) operations |
$ | 8.9 | $ | 13.4 | $ | 4.5 | $ | 11.3 | $ | (2.5 | ) | $ | 11.2 | $ | 1.7 | $ | 1.0 | $ | 5.3 | $ | 12.5 | $ | 18.4 | $ | 19.7 | $ | (4.0 | ) | $ | 22.2 | $ | 19.3 | $ | 46.6 | $ | 34.1 | $ | 48.6 | ||||||||||||||||||||||||||||||||||
| Capital expenditures |
(5.4 | ) | (10.2 | ) | (3.7 | ) | (3.4 | ) | (3.2 | ) | (2.8 | ) | (4.3 | ) | (4.7 | ) | (1.5 | ) | (1.9 | ) | (1.8 | ) | (1.4 | ) | (1.4 | ) | (15.6 | ) | (13.3 | ) | (6.5 | ) | (17.6 | ) | (16.1 | ) | ||||||||||||||||||||||||||||||||||||
| Capital expenditures to replace property damaged by casualty |
(1.8 | ) | (2.9 | ) | (2.9 | ) | — | — | — | — | — | — | — | — | — | — | (4.7 | ) | — | — | — | — | ||||||||||||||||||||||||||||||||||||||||||||||||||
| Insurance proceeds for property damage due to casualty |
3.7 | 3.1 | 3.1 | — | — | — | — | — | — | — | — | — | — | 6.8 | — | — | — | — | ||||||||||||||||||||||||||||||||||||||||||||||||||||||
|
|
|
|
|
|
|
|
|
|
|
|
|
|
|
|
|
|
|
|
|
|
|
|
|
|
|
|
|
|
|
|
|
|
|
|
|
|||||||||||||||||||||||||||||||||||||
| Net capital expenditures |
(3.5 | ) | (10.1 | ) | (3.5 | ) | (3.4 | ) | (3.2 | ) | (2.8 | ) | (4.3 | ) | (4.7 | ) | (1.5 | ) | (1.9 | ) | (1.8 | ) | (1.4 | ) | (1.4 | ) | (13.5 | ) | (13.3 | ) | (6.5 | ) | (17.6 | ) | (16.1 | ) | ||||||||||||||||||||||||||||||||||||
|
|
|
|
|
|
|
|
|
|
|
|
|
|
|
|
|
|
|
|
|
|
|
|
|
|
|
|
|
|
|
|
|
|
|
|
|
|||||||||||||||||||||||||||||||||||||
| Free cash flow |
$ | 5.4 | $ | 3.3 | $ | 1.0 | $ | 8.0 | $ | (5.7 | ) | $ | 8.5 | $ | (2.5 | ) | $ | (3.7 | ) | $ | 3.8 | $ | 10.7 | $ | 16.6 | $ | 18.3 | $ | (5.4 | ) | $ | 8.7 | $ | 6.1 | $ | 40.1 | $ | 16.5 | $ | 32.5 | ||||||||||||||||||||||||||||||||
|
|
|
|
|
|
|
|
|
|
|
|
|
|
|
|
|
|
|
|
|
|
|
|
|
|
|
|
|
|
|
|
|
|
|
|
|
|||||||||||||||||||||||||||||||||||||
CTS Corporation
Definition of Financial Term—“Total Debt to Capitalization”
($ in millions)
| 2011 | 2010 | 2009 | 2008 | 2007 | ||||||||||||||||||||||||||||||||||||||||||||||||||||||||||||||||||||||||||||
| Q4 | Q3 | Q2 | Q1 | Q4 | Q3 | Q2 | Q1 | Q4 | Q3 | Q2 | Q1 | Q4 | Q3 | Q2 | Q1 | Q4 | Q3 | Q2 | Q1 | |||||||||||||||||||||||||||||||||||||||||||||||||||||||||||||
| Notes payable |
$ | — | $ | — | $ | 0.2 | $ | — | $ | — | $ | — | $ | — | $ | — | $ | — | $ | — | $ | — | $ | 0.2 | $ | — | $ | — | $ | — | $ | — | $ | 1.0 | $ | 1.9 | $ | 1.5 | $ | 3.5 | ||||||||||||||||||||||||||||||||||||||||
| Current portion of long-term debt |
— | — | — | — | — | — | — | — | — | — | — | — | — | — | — | — | — | — | — | — | ||||||||||||||||||||||||||||||||||||||||||||||||||||||||||||
| Long-term debt |
74.4 | 89.7 | 74.5 | 80.3 | 70.0 | 77.1 | 65.9 | 56.0 | 50.4 | 49.5 | 51.0 | 85.9 | 80.0 | 98.4 | 90.0 | 113.7 | 68.3 | 55.7 | 55.1 | 54.4 | ||||||||||||||||||||||||||||||||||||||||||||||||||||||||||||
|
|
|
|
|
|
|
|
|
|
|
|
|
|
|
|
|
|
|
|
|
|
|
|
|
|
|
|
|
|
|
|
|
|
|
|
|
|
|
|
|
|||||||||||||||||||||||||||||||||||||||||
| Total debt |
74.4 | 89.7 | 74.7 | 80.3 | 70.0 | 77.1 | 65.9 | 56.0 | 50.4 | 49.5 | 51.0 | 86.1 | 80.0 | 98.4 | 90.0 | 113.7 | 69.3 | 57.6 | 56.6 | 57.9 | ||||||||||||||||||||||||||||||||||||||||||||||||||||||||||||
| Total shareholders’ equity |
263.3 | 291.1 | 285.7 | 281.5 | 274.3 | 265.1 | 256.9 | 251.2 | 247.5 | 241.9 | 237.1 | 242.6 | 277.5 | 340.0 | 335.2 | 326.1 | 326.4 | 332.1 | 328.4 | 326.8 | ||||||||||||||||||||||||||||||||||||||||||||||||||||||||||||
|
|
|
|
|
|
|
|
|
|
|
|
|
|
|
|
|
|
|
|
|
|
|
|
|
|
|
|
|
|
|
|
|
|
|
|
|
|
|
|
|
|||||||||||||||||||||||||||||||||||||||||
| Total capitalization |
$ | 337.7 | $ | 380.8 | $ | 360.5 | $ | 361.8 | $ | 344.3 | $ | 342.2 | $ | 322.8 | $ | 307.2 | $ | 297.9 | $ | 291.4 | $ | 288.1 | $ | 328.7 | $ | 357.5 | $ | 438.4 | $ | 425.2 | $ | 439.8 | $ | 395.7 | $ | 389.7 | $ | 385.0 | $ | 384.7 | ||||||||||||||||||||||||||||||||||||||||
|
|
|
|
|
|
|
|
|
|
|
|
|
|
|
|
|
|
|
|
|
|
|
|
|
|
|
|
|
|
|
|
|
|
|
|
|
|
|
|
|
|||||||||||||||||||||||||||||||||||||||||
| Total debt to capitalization |
22.0 | % | 23.6 | % | 20.7 | % | 22.2 | % | 20.3 | % | 22.5 | % | 20.4 | % | 18.2 | % | 16.9 | % | 17.0 | % | 17.7 | % | 26.2 | % | 22.4 | % | 22.4 | % | 21.2 | % | 25.9 | % | 17.5 | % | 14.8 | % | 14.7 | % | 15.1 | % | ||||||||||||||||||||||||||||||||||||||||
|
|
|
|
|
|
|
|
|
|
|
|
|
|
|
|
|
|
|
|
|
|
|
|
|
|
|
|
|
|
|
|
|
|
|
|
|
|
|
|
|
|||||||||||||||||||||||||||||||||||||||||
CTS Corporation
Definition of Financial Term—“Controllable Working Capital as a Percentage of Annualized Sales”
($ in millions)
Controllable working capital is defined as accounts receivable plus inventories less accounts payable
| Full Year | October 2, | July 3, | April 3, | Full Year | October 3, | July 4 | April 4, | Full Year | September 27, | June 28, | March 29, | Full Year | Full Year | |||||||||||||||||||||||||||||||||||||||||||
| 2011 | 2011 | 2011 | 2011 | 2010 | 2010 | 2010 | 2010 | 2009 | 2009 | 2009 | 2009 | 2008 | 2007 | |||||||||||||||||||||||||||||||||||||||||||
| Net Accounts Receivables |
$ | 88.3 | $ | 90.3 | $ | 87.8 | $ | 96.4 | $ | 95.9 | $ | 90.1 | $ | 84.6 | $ | 74.1 | $ | 71.7 | $ | 75.9 | $ | 73.6 | $ | 76.7 | $ | 94.2 | $ | 100.7 | ||||||||||||||||||||||||||||
| Net Inventory |
92.5 | 91.4 | 88.6 | 87.9 | 76.9 | 76.6 | 68.8 | 60.0 | 54.3 | 60.5 | 61.7 | 70.2 | 70.9 | 73.8 | ||||||||||||||||||||||||||||||||||||||||||
| Accounts Payable |
(80.5 | ) | (78.9 | ) | (77.1 | ) | (79.4 | ) | (75.4 | ) | (70.5 | ) | (68.2 | ) | (59.5 | ) | (52.3 | ) | (62.2 | ) | (53.0 | ) | (53.4 | ) | (71.3 | ) | (84.2 | ) | ||||||||||||||||||||||||||||
| Controllable Working Capital |
100.4 | 102.8 | 99.3 | 104.9 | 97.4 | 96.2 | 85.2 | 74.5 | 73.7 | 74.2 | 82.3 | 93.5 | 93.8 | 90.3 | ||||||||||||||||||||||||||||||||||||||||||
|
|
|
|
|
|
|
|
|
|
|
|
|
|
|
|
|
|
|
|
|
|
|
|
|
|
|
|
|
|||||||||||||||||||||||||||||
| Quarterly sales |
$ | 144.0 | $ | 146.1 | $ | 146.9 | $ | 151.5 | $ | 145.0 | $ | 139.4 | $ | 138.9 | $ | 129.4 | $ | 133.9 | $ | 126.6 | $ | 120.4 | $ | 118.1 | $ | 162.8 | $ | 178.3 | ||||||||||||||||||||||||||||
|
|
|
|
|
|
|
|
|
|
|
|
|
|
|
|
|
|
|
|
|
|
|
|
|
|
|
|
|
|||||||||||||||||||||||||||||
| Acquisition Adjustments |
||||||||||||||||||||||||||||||||||||||||||||||||||||||||
| Adjusted quarterly sales |
$ | 144.0 | $ | 146.1 | $ | 146.9 | $ | 151.5 | $ | 145.0 | $ | 139.4 | $ | 139.4 | $ | 129.4 | $ | 133.9 | $ | 126.6 | $ | 120.4 | $ | 118.1 | $ | 162.8 | $ | 178.3 | ||||||||||||||||||||||||||||
| Multiplied by 4 |
4 | 4 | 4 | 4 | 4 | 4 | 4 | 4 | 4 | 4 | 4 | 4 | 4 | 4 | ||||||||||||||||||||||||||||||||||||||||||
| Annualized sales |
576.00 | 584.28 | 587.68 | 606.00 | 580.10 | 557.45 | 557.45 | 517.61 | 535.55 | 506.40 | 481.60 | 472.40 | 651.20 | 713.20 | ||||||||||||||||||||||||||||||||||||||||||
|
|
|
|
|
|
|
|
|
|
|
|
|
|
|
|
|
|
|
|
|
|
|
|
|
|
|
|
|
|||||||||||||||||||||||||||||
| Controllable Working Capital %—Annual |
17.4 | % | 17.6 | % | 16.9 | % | 17.3 | % | 16.8 | % | 17.3 | % | 15.3 | % | 14.4 | % | 13.8 | % | 14.7 | % | 17.1 | % | 19.8 | % | 14.4 | % | 12.7 | % | ||||||||||||||||||||||||||||
|
|
|
|
|
|
|
|
|
|
|
|
|
|
|
|
|
|
|
|
|
|
|
|
|
|
|
|
|
|||||||||||||||||||||||||||||
CTS Corporation
Definition of Financial Term—“Capex as Percentage of Sales”
($ in millions)
| Full Year | Q3 | Q2 | Q1 | Full Year | Full Year | Full Year | Full Year | |||||||||||||||||||||||||
| 2011 | 2011 | 2011 | 2011 | 2010 | 2009 | 2008 | 2007 | |||||||||||||||||||||||||
| Capex |
$ | 15.6 | $ | 3.7 | $ | 3.4 | $ | 3.2 | $ | 13.3 | $ | 6.5 | $ | 17.6 | $ | 16.1 | ||||||||||||||||
| Total Sales |
588.5 | 146.1 | 146.9 | 151.5 | 552.6 | 499.0 | 691.7 | 685.9 | ||||||||||||||||||||||||
|
|
|
|
|
|
|
|
|
|
|
|
|
|
|
|
|
|||||||||||||||||
| Capex as % of Sales |
2.6 | % | 2.5 | % | 2.3 | % | 2.1 | % | 2.4 | % | 1.3 | % | 2.6 | % | 2.3 | % | ||||||||||||||||
|
|
|
|
|
|
|
|
|
|
|
|
|
|
|
|
|
|||||||||||||||||
CTS Corporation
Definition of Financial Term—
Adjusted Return on Invested Capital
| Full Year | ||||||||||||
| 2011 | 2010 | 2009 | ||||||||||
| Operating earnings |
$ | 25.2 | $ | 27.8 | $ | (17.8 | ) | |||||
| Charges (credits) to reported operating earnings: |
||||||||||||
| Restructuring and asset impairment charges |
3.1 | 1.7 | 2.2 | |||||||||
| Additional Legal Costs |
0.3 | |||||||||||
| Gain on sale of excess equipment less LTCC severance |
||||||||||||
| Goodwill Impairment |
33.2 | |||||||||||
|
|
|
|
|
|
|
|||||||
| Total adjustments to reported operating earnings |
3.5 | 1.7 | 35.4 | |||||||||
|
|
|
|
|
|
|
|||||||
| Adjusted operating earnings |
$ | 28.7 | $ | 29.5 | $ | 17.6 | ||||||
| *Tax rate |
21 | % | 22 | %* | 20 | % | ||||||
|
|
|
|
|
|
|
|||||||
| Tax effected adjusted operating earnings |
$ | 22.6 | $ | 23.0 | $ | 14.1 | ||||||
|
|
|
|
|
|
|
|||||||
| Invested Capital: |
||||||||||||
| Current Year: |
||||||||||||
| Shareholders’ equity |
$ | 263.3 | $ | 274.3 | $ | 247.5 | ||||||
| Long-term debt |
74.4 | 70.0 | 50.4 | |||||||||
| Less: Cash |
(76.4 | ) | (73.3 | ) | (51.2 | ) | ||||||
|
|
|
|
|
|
|
|||||||
| Invested capital |
261.3 | 270.9 | 246.7 | |||||||||
| Prior Year: |
||||||||||||
| Shareholders’ equity |
$ | 274.3 | $ | 247.5 | $ | 277.5 | ||||||
| Long-term debt |
70.0 | 50.4 | 80.0 | |||||||||
| Less: Cash |
(73.3 | ) | (51.2 | ) | (44.6 | ) | ||||||
|
|
|
|
|
|
|
|||||||
| Invested capital |
270.9 | 246.7 | 312.9 | |||||||||
|
|
|
|
|
|
|
|||||||
| Adjusted invested capital |
$ | 266.1 | $ | 258.8 | $ | 279.8 | ||||||
|
|
|
|
|
|
|
|||||||
| Adjusted return on invested capital |
8.5 | % | 8.9 | % | 5.0 | % | ||||||
|
|
|
|
|
|
|
|||||||
| Sales |
$ | 588.5 | $ | 552.6 | $ | 499.0 | ||||||
| Tax effected adjusted operating earnings |
22.6 | 23.0 | 14.1 | |||||||||
|
|
|
|
|
|
|
|||||||
| Tax effected adjusted operating margin as a percentage of sales (a) |
3.8 | % | 4.2 | % | 2.8 | % | ||||||
|
|
|
|
|
|
|
|||||||
| Sales |
$ | 588.5 | $ | 552.6 | $ | 499.0 | ||||||
| Adjusted invested capital |
266.1 | 258.8 | 279.8 | |||||||||
|
|
|
|
|
|
|
|||||||
| Invested capital turns (b) |
2.21 | 2.14 | 1.78 | |||||||||
|
|
|
|
|
|
|
|||||||
| Adjusted return on invested capital (a) x (b) |
8.5 | % | 8.9 | % | 5.0 | % | ||||||
|
|
|
|
|
|
|
|||||||
| * | For 2011, 2010 & 2009, Tax rates are Adjusted Effective Tax Rates |