Attached files
| file | filename |
|---|---|
| 8-K - FORM 8-K - ConnectOne Bancorp, Inc. | v306668_8k.htm |

Overview and Scope Corporate Headquarters 2455 Morris Avenue Union, NJ 07083 Investor Presentation February 2012

2 Forward - Looking Statements This presentation contains forward - looking statements with respect to the financial condition, results of operation, and business of Center Bancorp, Inc . and its subsidiaries . These statements include, but are not limited to, statements that relate to, or are dependent on, estimates or assumptions relating to the prospects of loan growth, credit quality and certain operating efficiencies resulting from operations . These forward looking statements involve certain risks and uncertainties . Factors that may cause actual results to differ materially from those contemplated by such forward - looking statements include, among others, the following possibilities : ( 1 ) competitive pressure among financial services companies may increase significantly ; ( 2 ) changes in the interest rate environment may reduce interest margins ; ( 3 ) general economic conditions, internationally, nationally or in the State of New Jersey, may be less favorable than expected ; ( 4 ) legislation or regulatory requirements or changes may adversely affect the business in which our combined organization will be engaged ; and ( 5 ) other risks detailed in our filing with the SEC may adversely impact our business . Center Bancorp undertakes no obligation to release revisions to these forward - looking statements or reflect events or circumstances after the date of this presentation .

3 Franchise Overview □ $ 1 . 4 billion franchise with $ 934 million of core deposits in Northern New Jersey wealth markets □ 14 banking locations 1 □ New management team and directors brought on board in 2007 □ Focus on preserving balance sheet strength while increasing shareholder value □ High insider ownership ( 29 . 3 % ) (1) 14 banking locations includes the announced acquisition of Saddle River Valley Bancorp Median Household Income by Zip Code >$85k $55k - $85k $40k - $55k <$40K CNBC Saddle

4 Stock Overview: CNBC Price : $ 10 . 14 Dividend : $ 0 . 12 Current Dividend Yield : 1 . 18 % Market Capitalization : $ 166 million 52 Week High / Low : $ 10 . 98 / $ 8 . 40 Avg . Daily Volume : 26 , 110 shares 2012 Consensus EPS Estimate : $ 0 . 93 Price / 2012 Est . EPS : 10 . 9 x Price/ Book : 132 . 8 % Price / Tangible Book : 153 . 7 % Market data as of February 8, 2012; Source: SNL Financial

5 Acquisition of Saddle River Valley Bancorp Pro Forma Branch Map Transaction Highlights CNBC Saddle Transaction Information Historical Financial Data Acquiror: Center Bancorp, Inc. Assets: 1,432,738 ($000s) Loans: 756,010 Deposits: 1,121,415 TCE/TA: 7.61% NPAs/A: 1.04% Target: Saddle River Valley Bancorp Assets: 118,510 ($000s) Loans: 55,284 Deposits: 103,167 TCE/TA: 11.86% NPAs/A: 1.68% Date Announced: 2/1/2012 Expected Close: Q2 2012 Total Deal Value: $ 11.0 million Mixture: 100% cash Pricing Information DV / Tg . Book: 78.2% DV / Adj. Tg . Book: 90.0% DV / Earnings: NM Core Deposit Premium: (3.1%) Median Household Income by Zip Code >$85k $55k - $85k $40k - $55k <$40K □ Immediately accretive to EPS □ Day one synergies and cross - selling opportunities □ Natural extension in Bergen County, New Jersey □ The acquisition compliments the strategic business plan of the bank to move into Northern New Jersey

6 0 20,000 40,000 60,000 80,000 100,000 120,000 United States New Jersey Bergen County* Union County Morris County 54,442 72,519 84,344 73,602 104,165 ($) 10.0 11.0 12.0 13.0 14.0 15.0 16.0 United States New Jersey Bergen County* Union County Morris County 12.39 14.71 15.08 15.34 15.47 Percentage (%) Market Opportunity We are well positioned for growth in some of the wealthiest markets in the country Median Household Income 2010 – 2015 Projected HH Income Change Source: SNL Financial *CNBC will enter Bergen County with the acquisition of Saddle River Valley Bancorp

7 Financial Highlights Source: SNL Financial 2007 2008 2009 2010 2011 Balance Sheet ($000) Total Assets 1,017,645 1,023,293 1,195,488 1,207,385 1,432,738 Total Net Loans 546,506 669,949 710,895 699,577 746,408 Total Deposits 699,070 659,537 813,705 860,332 1,121,415 Total Equity 85,278 81,713 101,749 120,957 135,916 Profitability (%) Net Income ($000) 3,856 5,842 3,771 7,004 13,926 ROAA 0.38 0.58 0.31 0.59 1.05 ROAE 4.09 7.03 4.02 6.30 10.73 Net Interest Margin 2.52 2.96 2.85 3.30 3.52 Efficiency Ratio 88.81 63.13 64.82 61.60 51.73 Balance Sheet Ratios (%) Loans/ Deposits 78.91 102.53 88.44 82.35 67.42 TCE/ TA 6.80 6.42 6.37 7.92 7.61 Tier 1 Ratio 11.65 10.20 11.43 13.28 12.00 Risk-based Capital Ratio 12.41 11.02 12.44 14.29 12.89 Asset Quality (%) NPAs/ Assets 0.43 0.45 1.02 1.51 1.04 NCOs/ Avg Loans 0.03 0.08 0.31 0.69 0.24 Reserves/ Gross Loans 0.94 0.92 1.21 1.25 1.27 Per Share Information ($) Tangible Book Value 5.17 4.97 5.15 5.79 6.60 Dividends 0.3557 0.3600 0.1800 0.1200 0.1200 EPS 0.28 0.45 0.24 0.43 0.80 At or for the 12 months ending:

8 Short Term Initiatives □ Continue migration of balance sheet to more commercial mix » Increase loan to deposit ratio to 80 % range □ Build fee income » Enhance insurance services offered » Increase fees from loans □ Continue cutting costs and decrease efficiency ratio further » Cut operational expenses via outsourcing » Focus on profitability of each branch □ Maintain net interest margin in excess of 3 . 50 % □ Close transaction with Saddle River Valley Bancorp in the second quarter of 2012 and begin integration
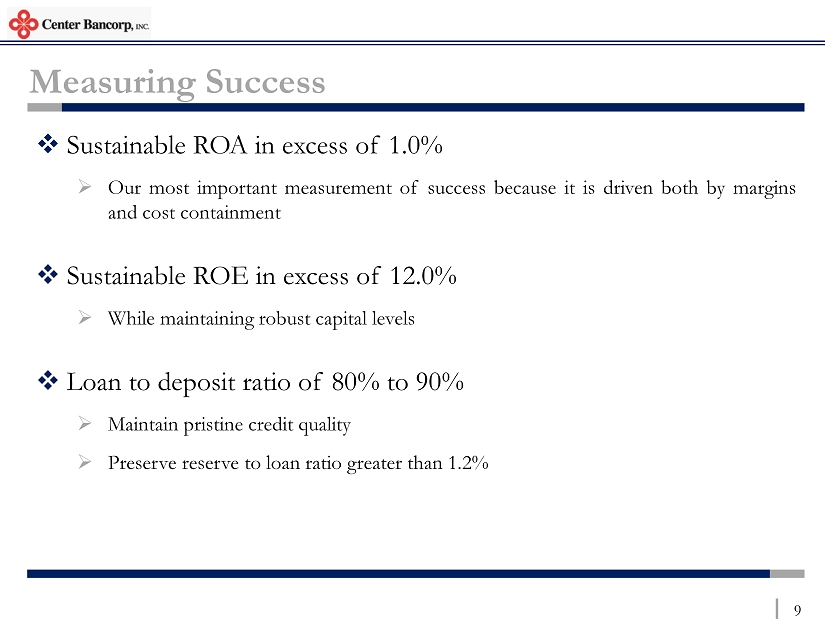
9 Measuring Success □ Sustainable ROA in excess of 1 . 0 % » Our most important measurement of success because it is driven both by margins and cost containment □ Sustainable ROE in excess of 12 . 0 % » While maintaining robust capital levels □ Loan to deposit ratio of 80 % to 90 % » Maintain pristine credit quality » Preserve reserve to loan ratio greater than 1 . 2 %

10 Roadmap to Success □ Continued focus on commercial lending – OUR CORE BUSINESS □ Focus on core deposit growth □ Expand market share □ Hire the right people in the right markets

11 Union, NJ Rank Institution (ST) Branches Deposits in Market ($000) Market Share (%) 1 Wells Fargo & Co. (CA) 28 4,751,084 27.58 2 Bank of America Corp. (NC) 26 1,767,627 10.26 3 Toronto-Dominion Bank 15 1,403,208 8.15 4 Investors Bancorp Inc. (MHC) (NJ) 15 1,313,264 7.62 5 Union County Savings Bank (NJ) 4 1,205,413 7.00 6 Santander 13 813,508 4.72 7 Center Bancorp Inc. (NJ) 9 771,540 4.48 8 Hudson City Bancorp Inc. (NJ) 3 754,007 4.38 9 PNC Financial Services Group (PA) 15 638,446 3.71 10 JPMorgan Chase & Co. (NY) 12 558,348 3.24 11 RSI Bancorp MHC (NJ) 2 354,067 2.06 12 New York Community Bancorp (NY) 13 303,573 1.76 13 Northfield Bancorp Inc. (MHC) (NJ) 5 295,404 1.71 14 Valley National Bancorp (NJ) 11 294,796 1.71 15 Capital One Financial Corp. (VA) 3 277,214 1.61 16 Roselle Savings Bank (NJ) 2 204,705 1.19 17 Spencer Savings Bank SLA (NJ) 5 197,168 1.14 18 Community Partners Bncp (NJ) 4 173,449 1.01 19 Columbia Bank MHC (NJ) 2 166,274 0.97 20 Provident Financial Services (NJ) 2 131,607 0.76 Total For Institutions In Market 211 17,226,925 Morris, NJ Rank Institution (ST) Branches Deposits in Market ($000) Market Share (%) 1 JPMorgan Chase & Co. (NY) 30 2,733,483 13.46 2 Hudson City Bancorp Inc. (NJ) 10 2,572,263 12.67 3 Bank of America Corp. (NC) 27 2,513,232 12.38 4 Wells Fargo & Co. (CA) 17 2,320,482 11.43 5 Toronto-Dominion Bank 17 1,558,951 7.68 6 HSBC 4 1,503,360 7.40 7 PNC Financial Services Group (PA) 23 1,191,235 5.87 8 Valley National Bancorp (NJ) 19 889,562 4.38 9 Provident Financial Services (NJ) 10 777,042 3.83 10 Investors Bancorp Inc. (MHC) (NJ) 7 550,606 2.71 11 Lakeland Bancorp (NJ) 10 549,339 2.71 12 Santander 11 511,863 2.52 13 Peapack-Gladstone Financial (NJ) 6 364,239 1.79 14 Fulton Financial Corp. (PA) 7 339,905 1.67 15 Capital One Financial Corp. (VA) 6 324,518 1.60 16 Center Bancorp Inc. (NJ) 3 196,883 0.97 17 Columbia Bank MHC (NJ) 2 178,963 0.88 18 Citigroup Inc. (NY) 3 172,965 0.85 19 MSB Financial Corp. (MHC) (NJ) 1 153,091 0.75 20 Kearny Financial Corp. (MHC) (NJ) 3 141,981 0.70 Total For Institutions In Market 238 20,305,026 Positioned for Success Our deep ties in Union and Morris Counties have made us the local community bank of choice for many Source: SNL Financial; Deposit data as of June 30, 2011
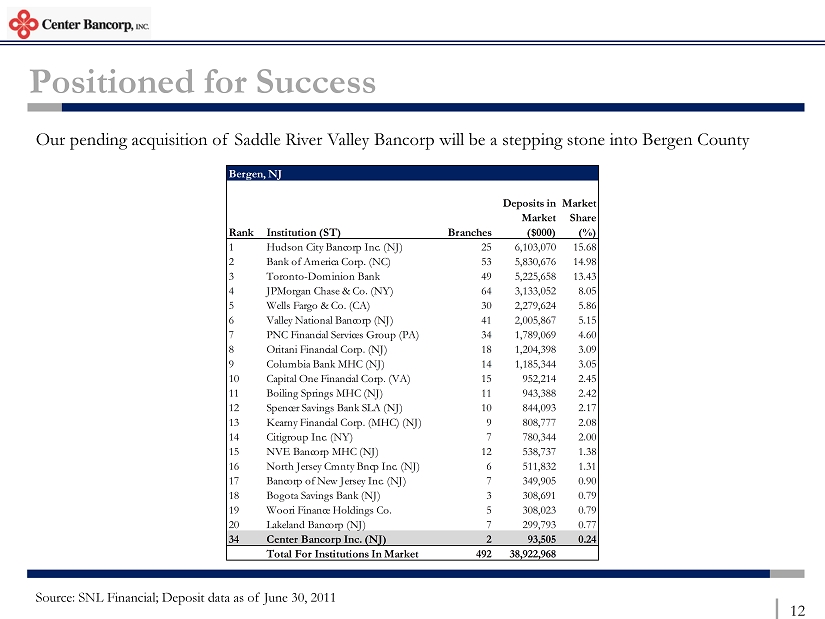
12 Positioned for Success Our pending acquisition of Saddle River Valley Bancorp will be a stepping stone into Bergen County Bergen, NJ Rank Institution (ST) Branches Deposits in Market ($000) Market Share (%) 1 Hudson City Bancorp Inc. (NJ) 25 6,103,070 15.68 2 Bank of America Corp. (NC) 53 5,830,676 14.98 3 Toronto-Dominion Bank 49 5,225,658 13.43 4 JPMorgan Chase & Co. (NY) 64 3,133,052 8.05 5 Wells Fargo & Co. (CA) 30 2,279,624 5.86 6 Valley National Bancorp (NJ) 41 2,005,867 5.15 7 PNC Financial Services Group (PA) 34 1,789,069 4.60 8 Oritani Financial Corp. (NJ) 18 1,204,398 3.09 9 Columbia Bank MHC (NJ) 14 1,185,344 3.05 10 Capital One Financial Corp. (VA) 15 952,214 2.45 11 Boiling Springs MHC (NJ) 11 943,388 2.42 12 Spencer Savings Bank SLA (NJ) 10 844,093 2.17 13 Kearny Financial Corp. (MHC) (NJ) 9 808,777 2.08 14 Citigroup Inc. (NY) 7 780,344 2.00 15 NVE Bancorp MHC (NJ) 12 538,737 1.38 16 North Jersey Cmnty Bncp Inc. (NJ) 6 511,832 1.31 17 Bancorp of New Jersey Inc. (NJ) 7 349,905 0.90 18 Bogota Savings Bank (NJ) 3 308,691 0.79 19 Woori Finance Holdings Co. 5 308,023 0.79 20 Lakeland Bancorp (NJ) 7 299,793 0.77 34 Center Bancorp Inc. (NJ) 2 93,505 0.24 Total For Institutions In Market 492 38,922,968 Source: SNL Financial; Deposit data as of June 30, 2011
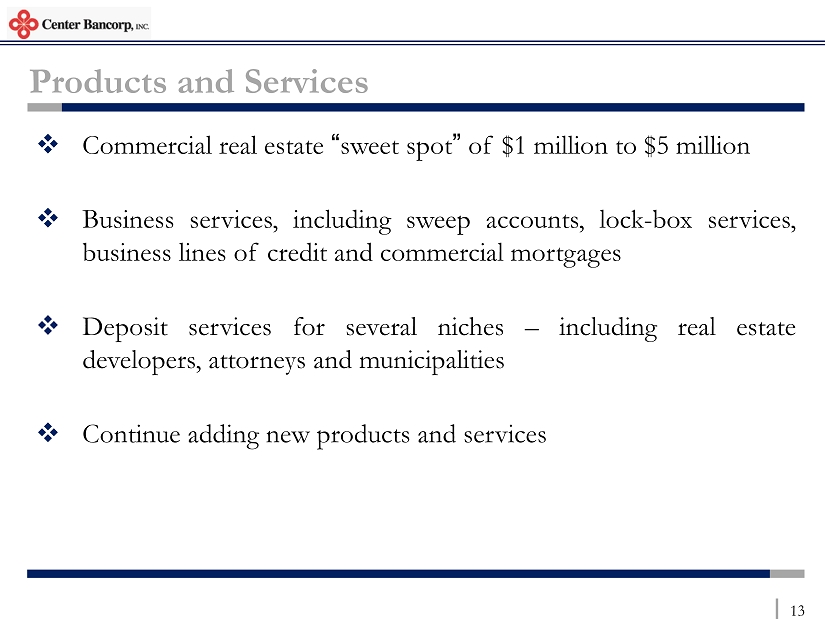
13 Products and Services □ Commercial real estate “ sweet spot ” of $ 1 million to $ 5 million □ Business services, including sweep accounts, lock - box services, business lines of credit and commercial mortgages □ Deposit services for several niches – including real estate developers, attorneys and municipalities □ Continue adding new products and services
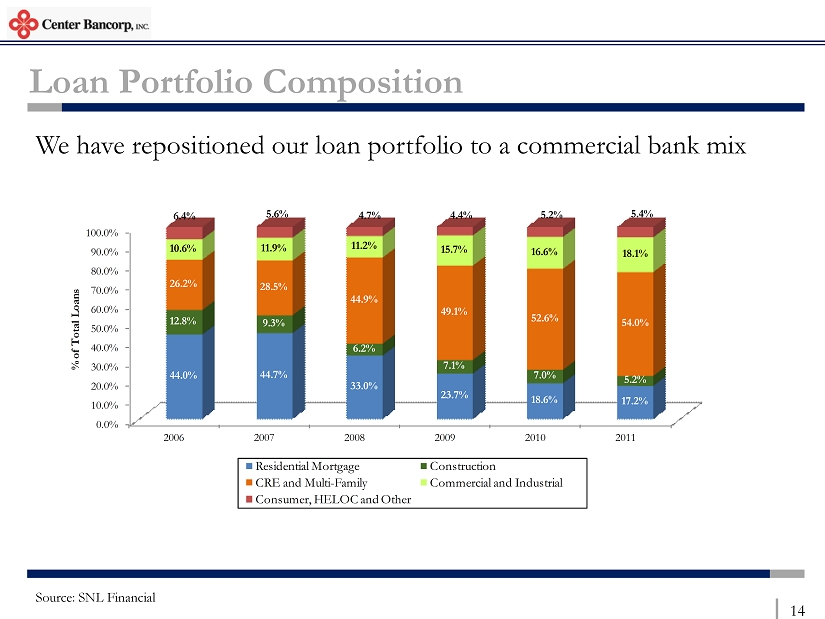
14 Loan Portfolio Composition We have repositioned our loan portfolio to a commercial bank mix Source: SNL Financial 0.0% 10.0% 20.0% 30.0% 40.0% 50.0% 60.0% 70.0% 80.0% 90.0% 100.0% 2006 2007 2008 2009 2010 2011 44.0% 44.7% 33.0% 23.7% 18.6% 17.2% 12.8% 9.3% 6.2% 7.1% 7.0% 5.2% 26.2% 28.5% 44.9% 49.1% 52.6% 54.0% 10.6% 11.9% 11.2% 15.7% 16.6% 18.1% 6.4% 5.6% 4.7% 4.4% 5.2% 5.4% % of Total Loans Residential Mortgage Construction CRE and Multi - Family Commercial and Industrial Consumer, HELOC and Other

15 Commercial Real Estate Loans Continued focus on commercial real estate lending » Compound annual growth rate of 20 . 4 % since 2006 Commercial Real Estate Loans Source: SNL Financial 0 50,000 100,000 150,000 200,000 250,000 300,000 350,000 2006 2007 2008 2009 2010 2011 136,334 147,049 262,690 299,685 324,704 345,305 ($000s)
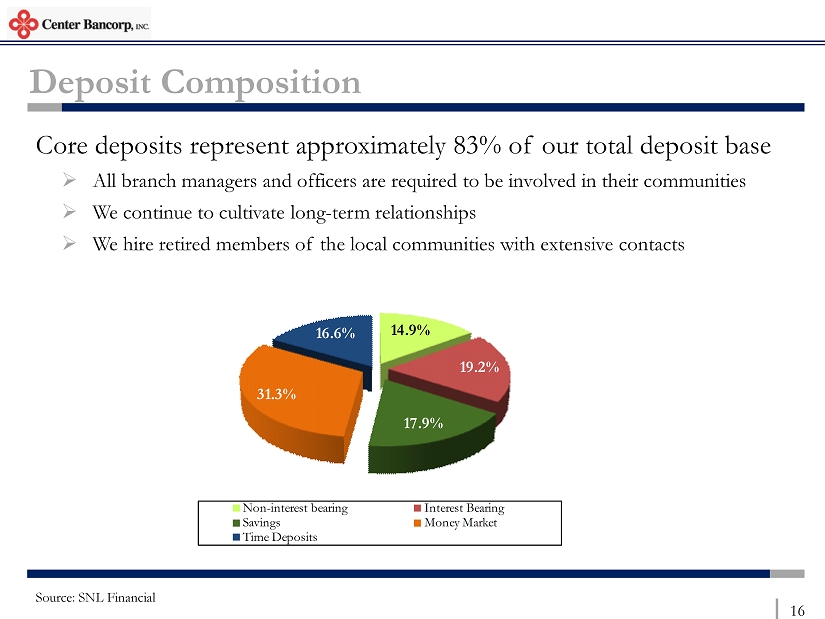
16 Deposit Composition Core deposits represent approximately 83 % of our total deposit base » All branch managers and officers are required to be involved in their communities » We continue to cultivate long - term relationships » We hire retired members of the local communities with extensive contacts Source: SNL Financial 14.9% 19.2% 17.9% 31.3% 16.6% Non - interest bearing Interest Bearing Savings Money Market Time Deposits

17 Asset Quality Source: SNL Financial; Note: Renegotiated loans excluded from nonperforming loans Our strong underwriting standards have enabled us to maintain clean asset quality through this economic cycle 0.00 0.20 0.40 0.60 0.80 1.00 1.20 1.40 2006 2007 2008 2009 2010 2011 0.01 0.03 0.08 0.31 0.69 0.24 0.07 0.43 0.45 0.94 0.98 0.59 (%) NCOs / Avg. Loans (NPAs + 90 days) / Assets
18 Results Driven Business Model New management team has successfully repositioned the bank to build shareholder value : » Migration of loan portfolio to commercial mix » Growth of core deposits » Expense reductions throughout the organization » Increased net interest margin

19 Management Team Board of DirectorsAlexander A. Bol Chairman of the Board Owner of Alexander A. Bol A.I.A Raymond J. Vanaria Vice Chairmain of the Board Partner, Malesardi, Quackenbush, Swift & Co. LLC James Joseph Kennedy Managing Partner, KV1 Asset Management, LLC Howard Kent Member of Real Estate Equities Group, LLC Nicholas Minoia Member of Diversified Properities, LLC Harold Schechter Former CFO of Global Design Concepts, Inc. Alan H. Straus Portfolio Manager for Omega Advisors, Inc. William A. Thompson General Manager, Uniselect USA Anthony C. Weagley President and CEO of Center Bancorp, Inc. Lawrence B. Seidman Manager at Select Investment Funds Anthony Weagley, President and Chief Executive Officer ▪ Over 27 years of banking experience at CNBC ▪ Prior to being named President and CEO, served as CFO of CNBC ▪ Has served in several capacities at CNBC over his career Arthur Wein, SVP & Chief Operating Officer ▪ SVP & COO of CNBC since 2009 ▪ Former VP & Business Development Officer of the Summit Region of the Bank Vincent Tozzi, SVP & Chief Financial Officer ▪ Nearly 30 years of banking experience ▪ Former CFO of Crown Bank, NA Mark Cardone, SVP & Branch Administrator ▪ Responsible for entire branch network ▪ Former Vice President and District Manager at Fleet Bank Vincent Bagarozza, SVP & Chief Loan Officer ▪ SVP & CLO of CNBC since October 2011 ▪ Over 35 years of commercial banking experience Joseph Gangemi, VP, Investment Portfolio Manager & Investor Relations Officer ▪ Additionally serves as Corporate Secretary for both the Corporation and the Bank ▪ Started with CNBC in 2004

20 Center Bancorp, Inc. Thank you for your interest in: Corporate Headquarters 2455 Morris Avenue Union, NJ 07083