Attached files
| file | filename |
|---|---|
| 8-K - 8-K - OGLETHORPE POWER CORP | a2208308z8-k.htm |
Exhibit 99.1
|
|
Fourth Quarter and Year End 2011 Investor Briefing Confidential |
|
|
2 Participants 2 Tom Smith President and Chief Executive Officer Mike Price Executive Vice President and Chief Operating Officer Betsy Higgins Executive Vice President and Chief Financial Officer |

|
|
Certain of the statements made by representatives of Oglethorpe Power Corporation (An Electric Membership Corporation) (“Oglethorpe”) during the course of this presentation that are not historical facts are forward-looking statements. Although Oglethorpe believes that the assumptions underlying these statements are reasonable, you are cautioned that such forward-looking statements are inherently uncertain and involve necessary risks that may affect Oglethorpe’s business prospects and performance, causing actual results to differ from those discussed during this presentation. When considering forward-looking statements, you should keep in mind risk factors and other cautionary statements included in Oglethorpe’s SEC filings. Any forward-looking statements made are subject to all the risks and uncertainties, many of which are beyond management’s control, as described in Oglethorpe’s SEC filings. Should one or more of these risks or uncertainties occur, or should underlying assumptions prove incorrect, Oglethorpe’s actual results and plans could differ materially from those expressed in any forward-looking statements. Oglethorpe undertakes no obligation to publicly update any forward-looking statements, whether as a result of new information or future events. This electronic presentation is provided as of March 20, 2012. If you are viewing this presentation after that date, there may have been events that occurred subsequent to such date that would have a material adverse effect on the financial information that was presented, and Oglethorpe has not undertaken any obligation to update this electronic presentation. 3 Risk Factors and Forward-Looking Statements |
|
|
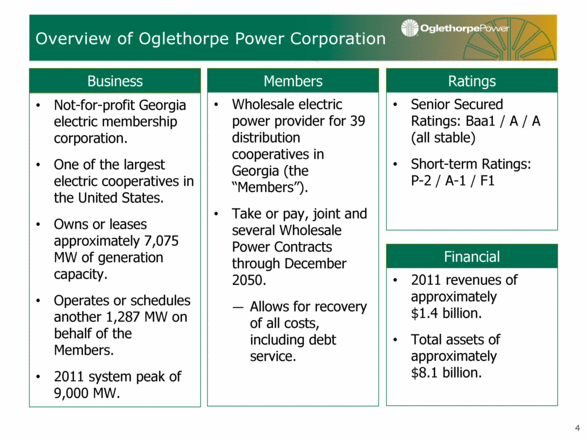
4 Overview of Oglethorpe Power Corporation Business Members Ratings Not-for-profit Georgia electric membership corporation. One of the largest electric cooperatives in the United States. Owns or leases approximately 7,075 MW of generation capacity. Operates or schedules another 1,287 MW on behalf of the Members. 2011 system peak of 9,000 MW. Wholesale electric power provider for 39 distribution cooperatives in Georgia (the “Members”). Take or pay, joint and several Wholesale Power Contracts through December 2050. Allows for recovery of all costs, including debt service. Senior Secured Ratings: Baa1 / A / A (all stable) Short-term Ratings: P-2 / A-1 / F1 Financial 2011 revenues of approximately $1.4 billion. Total assets of approximately $8.1 billion. |
|
|
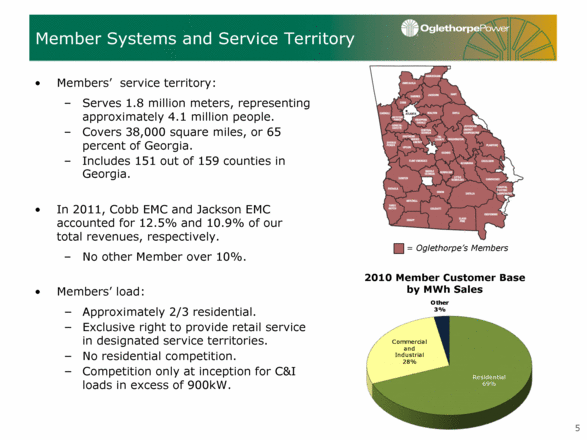
5 Member Systems and Service Territory Members’ service territory: Serves 1.8 million meters, representing approximately 4.1 million people. Covers 38,000 square miles, or 65 percent of Georgia. Includes 151 out of 159 counties in Georgia. In 2011, Cobb EMC and Jackson EMC accounted for 12.5% and 10.9% of our total revenues, respectively. No other Member over 10%. Members’ load: Approximately 2/3 residential. Exclusive right to provide retail service in designated service territories. No residential competition. Competition only at inception for C&I loads in excess of 900kW. = Oglethorpe’s Members 2010 Member Customer Base by MWh Sales Residential 69% Commercial and Industrial 28% Other 3% |
|
|
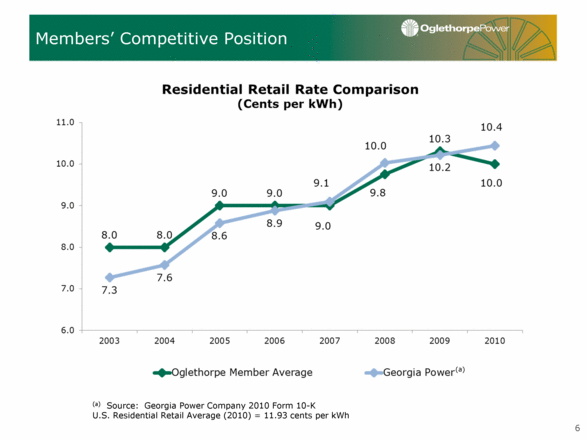
6 Members’ Competitive Position (a) Source: Georgia Power Company 2010 Form 10-K U.S. Residential Retail Average (2010) = 11.93 cents per kWh (a) |
|
|
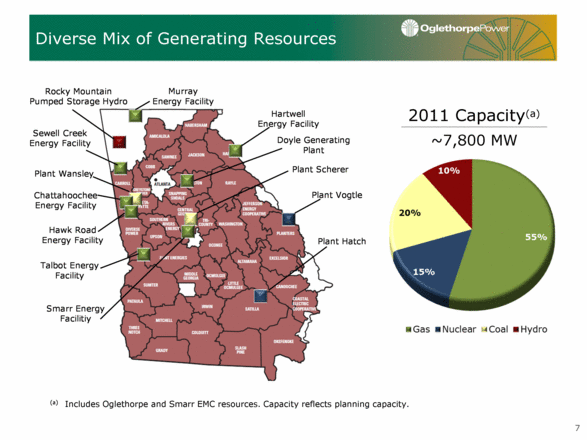
7 Diverse Mix of Generating Resources (a) Includes Oglethorpe and Smarr EMC resources. Capacity reflects planning capacity. 2011 Capacity(a) ~7,800 MW Rocky Mountain Pumped Storage Hydro Sewell Creek Energy Facility Chattahoochee Energy Facility Hawk Road Energy Facility Plant Wansley Talbot Energy Facility Hartwell Energy Facility Plant Vogtle Plant Hatch Doyle Generating Plant Smarr Energy Facilitiy Plant Scherer Murray Energy Facility |
|
|
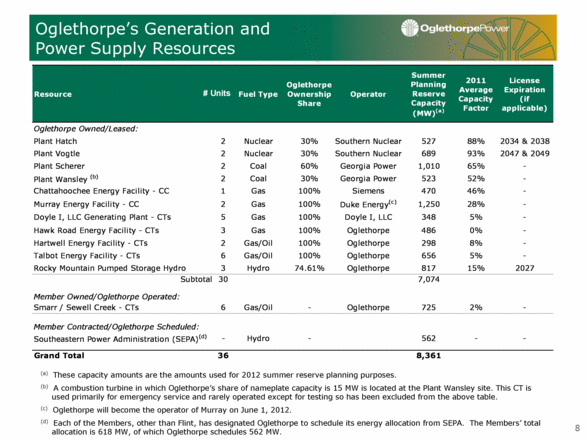
8 Oglethorpe’s Generation and Power Supply Resources (a) These capacity amounts are the amounts used for 2012 summer reserve planning purposes. (b) A combustion turbine in which Oglethorpe’s share of nameplate capacity is 15 MW is located at the Plant Wansley site. This CT is used primarily for emergency service and rarely operated except for testing so has been excluded from the above table. (c) Oglethorpe will become the operator of Murray on June 1, 2012. (d) Each of the Members, other than Flint, has designated Oglethorpe to schedule its energy allocation from SEPA. The Members’ total allocation is 618 MW, of which Oglethorpe schedules 562 MW. Resource Fuel Type Oglethorpe Ownership Share Operator Summer Planning Reserve Capacity (MW) (a) 2011 Average Capacity Factor License Expiration (if applicable) Oglethorpe Owned/Leased: Plant Hatch 2 Nuclear 30% Southern Nuclear 527 88% 2034 & 2038 Plant Vogtle 2 Nuclear 30% Southern Nuclear 689 93% 2047 & 2049 Plant Scherer 2 Coal 60% Georgia Power 1,010 65% - Plant Wansley (b) 2 Coal 30% Georgia Power 523 52% - Chattahoochee Energy Facility - CC 1 Gas 100% Siemens 470 46% - Murray Energy Facility - CC 2 Gas 100% Duke Energy (c) 1,250 28% - Doyle I, LLC Generating Plant - CTs 5 Gas 100% Doyle I, LLC 348 5% - Hawk Road Energy Facility - CTs 3 Gas 100% Oglethorpe 486 0% - Hartwell Energy Facility - CTs 2 Gas/Oil 100% Oglethorpe 298 8% - Talbot Energy Facility - CTs 6 Gas/Oil 100% Oglethorpe 656 5% - Rocky Mountain Pumped Storage Hydro 3 Hydro 74.61% Oglethorpe 817 15% 2027 Subtotal 30 7,074 Member Owned/Oglethorpe Operated: Smarr / Sewell Creek - CTs 6 Gas/Oil - Oglethorpe 725 2% - Member Contracted/Oglethorpe Scheduled: Southeastern Power Administration (SEPA) (d) - Hydro - 562 - - Grand Total 36 8,361 # Units |
|
|
9 Operations Highlights 9 Mike Price Executive Vice President and Chief Operating Officer |

|
|
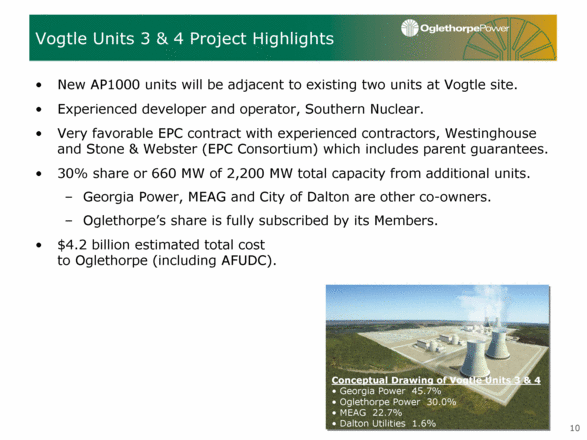
New AP1000 units will be adjacent to existing two units at Vogtle site. Experienced developer and operator, Southern Nuclear. Very favorable EPC contract with experienced contractors, Westinghouse and Stone & Webster (EPC Consortium) which includes parent guarantees. 30% share or 660 MW of 2,200 MW total capacity from additional units. Georgia Power, MEAG and City of Dalton are other co-owners. Oglethorpe’s share is fully subscribed by its Members. $4.2 billion estimated total cost to Oglethorpe (including AFUDC). 10 Vogtle Units 3 & 4 Project Highlights Conceptual Drawing of Vogtle Units 3 & 4 Georgia Power 45.7% Oglethorpe Power 30.0% MEAG 22.7% Dalton Utilities 1.6% |
|
|
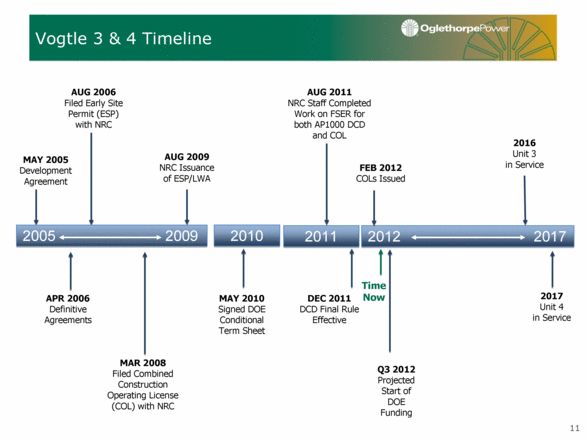
11 Vogtle 3 & 4 Timeline MAY 2005 Development Agreement MAR 2008 Filed Combined Construction Operating License (COL) with NRC DEC 2011 DCD Final Rule Effective APR 2006 Definitive Agreements Time Now 2010 2011 2012 2017 MAY 2010 Signed DOE Conditional Term Sheet Q3 2012 Projected Start of DOE Funding 2017 Unit 4 in Service AUG 2006 Filed Early Site Permit (ESP) with NRC AUG 2009 NRC Issuance of ESP/LWA 2016 Unit 3 in Service 2005 2009 AUG 2011 NRC Staff Completed Work on FSER for both AP1000 DCD and COL FEB 2012 COLs Issued |
|
|
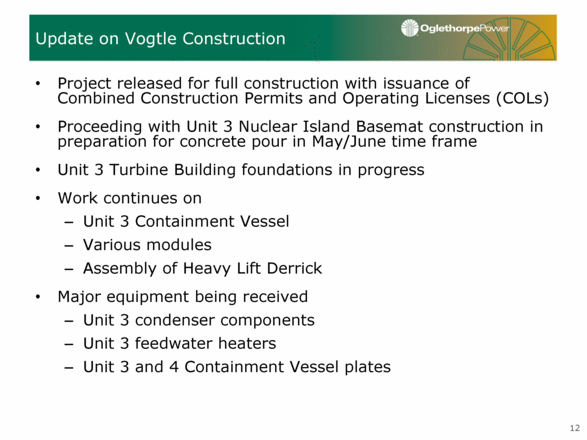
Project released for full construction with issuance of Combined Construction Permits and Operating Licenses (COLs) Proceeding with Unit 3 Nuclear Island Basemat construction in preparation for concrete pour in May/June time frame Unit 3 Turbine Building foundations in progress Work continues on Unit 3 Containment Vessel Various modules Assembly of Heavy Lift Derrick Major equipment being received Unit 3 condenser components Unit 3 feedwater heaters Unit 3 and 4 Containment Vessel plates 12 Update on Vogtle Construction |
|
|
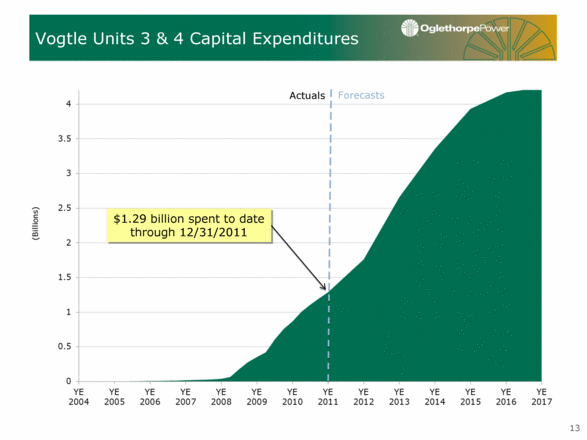
13 Vogtle Units 3 & 4 Capital Expenditures $1.29 billion spent to date through 12/31/2011 Actuals Forecasts |
|
|
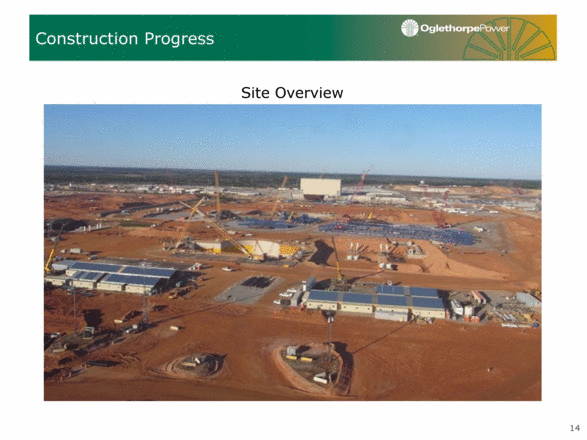
Construction Progress Site Overview 14 |
|
|
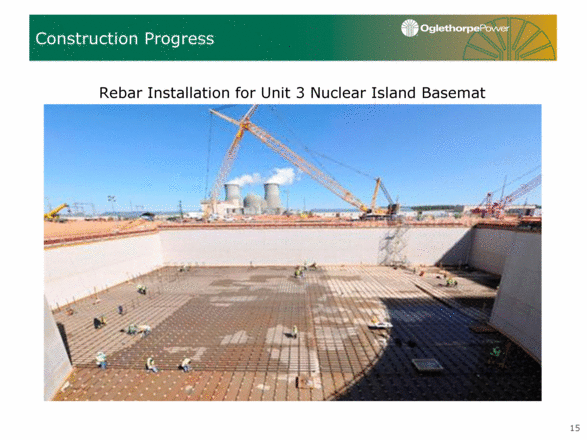
Construction Progress Rebar Installation for Unit 3 Nuclear Island Basemat 15 |
|
|
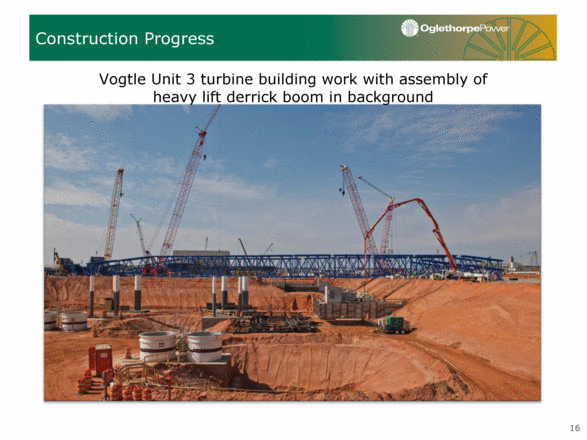
Construction Progress Vogtle Unit 3 turbine building work with assembly of heavy lift derrick boom in background 16 |
|
|
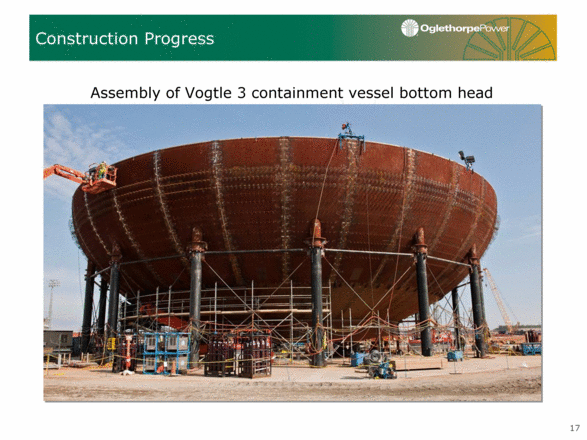
Construction Progress Assembly of Vogtle 3 containment vessel bottom head 17 |
|
|
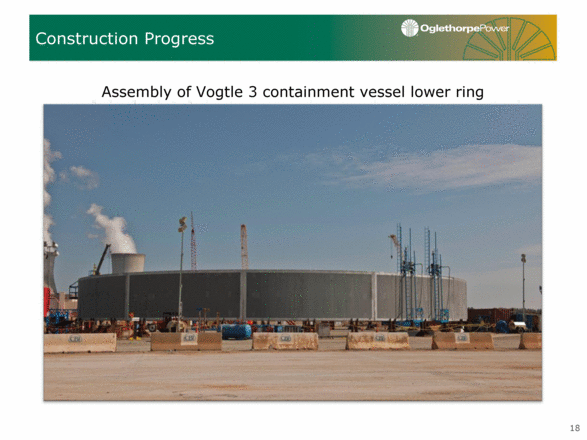
Construction Progress Assembly of Vogtle 3 containment vessel lower ring 18 |
|
|
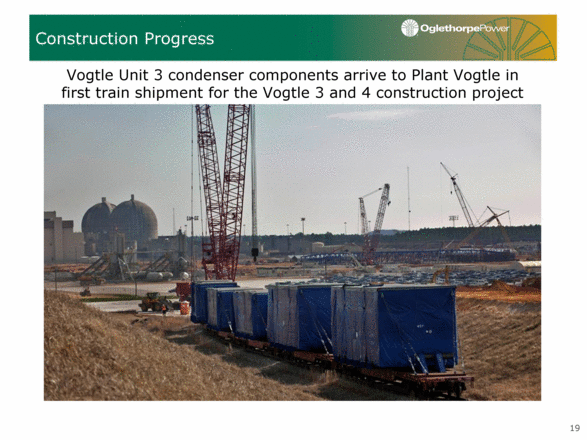
Vogtle Unit 3 condenser components arrive to Plant Vogtle in first train shipment for the Vogtle 3 and 4 construction project Construction Progress 19 |
|
|
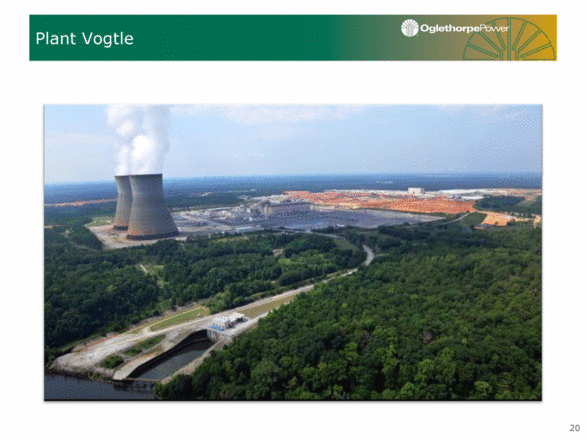
Plant Vogtle 20 |
|
|
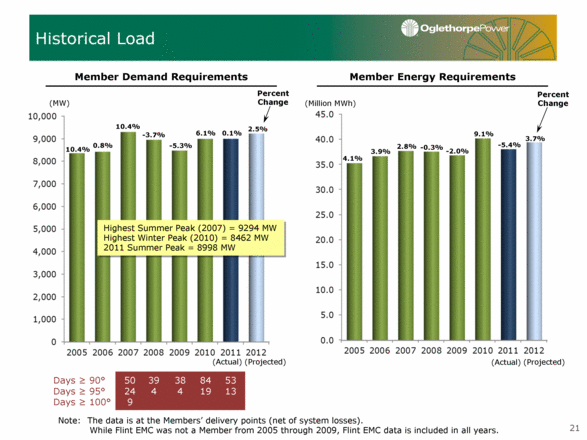
21 Historical Load Member Demand Requirements Member Energy Requirements (MW) Percent Change (Million MWh) Percent Change 6.1% 10.4% 0.8% 10.4% 4.1% 3.9% 2.8% -0.3% -3.7% -5.3% Note: The data is at the Members’ delivery points (net of system losses). While Flint EMC was not a Member from 2005 through 2009, Flint EMC data is included in all years. Highest Summer Peak (2007) = 9294 MW Highest Winter Peak (2010) = 8462 MW 2011 Summer Peak = 8998 MW -2.0% 9.1% 0.1% -5.4% Days > 90° Days > 95° Days > 100° 50 24 9 39 4 38 4 84 19 53 13 2.5% (Actual) (Projected) 3.7% (Actual) (Projected) |
|
|
22 Financial Highlights 22 Betsy Higgins Executive Vice President and Chief Financial Officer |

|
|
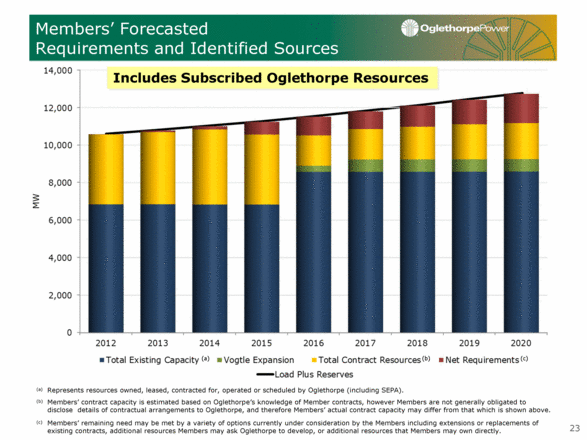
23 Members’ Forecasted Requirements and Identified Sources (a) Represents resources owned, leased, contracted for, operated or scheduled by Oglethorpe (including SEPA). (b) Members’ contract capacity is estimated based on Oglethorpe’s knowledge of Member contracts, however Members are not generally obligated to disclose details of contractual arrangements to Oglethorpe, and therefore Members’ actual contract capacity may differ from that which is shown above. (c) Members’ remaining need may be met by a variety of options currently under consideration by the Members including extensions or replacements of existing contracts, additional resources Members may ask Oglethorpe to develop, or additional resources that Members may own directly. Includes Subscribed Oglethorpe Resources (a) (b) (c) |
|
|
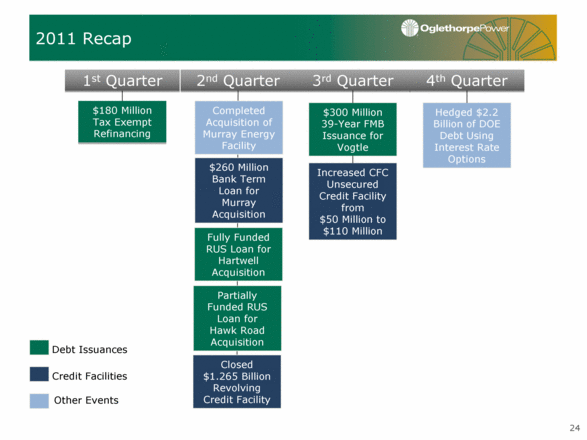
24 2011 Recap $180 Million Tax Exempt Refinancing Increased CFC Unsecured Credit Facility from $50 Million to $110 Million Credit Facilities Debt Issuances Partially Funded RUS Loan for Hawk Road Acquisition Hedged $2.2 Billion of DOE Debt Using Interest Rate Options $300 Million 39-Year FMB Issuance for Vogtle $260 Million Bank Term Loan for Murray Acquisition Closed $1.265 Billion Revolving Credit Facility 1st Quarter 2nd Quarter 3rd Quarter 4th Quarter Other Events Completed Acquisition of Murray Energy Facility Fully Funded RUS Loan for Hartwell Acquisition |
|
|
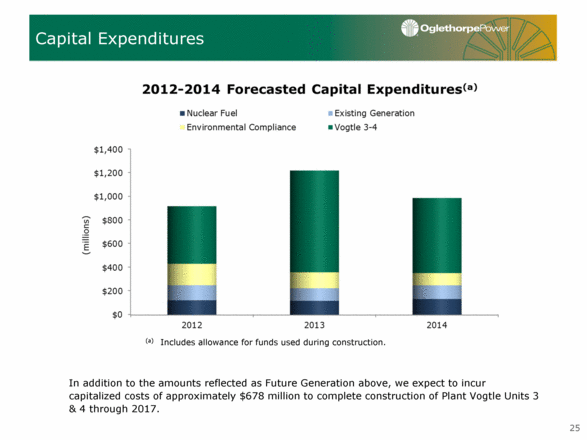
25 Capital Expenditures (a) Includes allowance for funds used during construction. In addition to the amounts reflected as Future Generation above, we expect to incur capitalized costs of approximately $678 million to complete construction of Plant Vogtle Units 3 & 4 through 2017. |
|
|
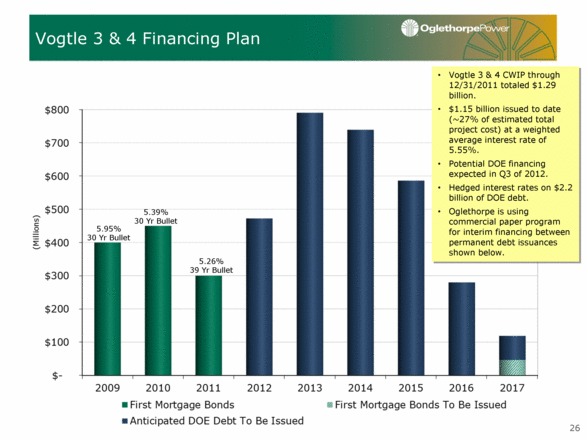
26 Vogtle 3 & 4 Financing Plan 5.95% 30 Yr Bullet 5.39% 30 Yr Bullet 5.26% 39 Yr Bullet Vogtle 3 & 4 CWIP through 12/31/2011 totaled $1.29 billion. $1.15 billion issued to date (~27% of estimated total project cost) at a weighted average interest rate of 5.55%. Potential DOE financing expected in Q3 of 2012. Hedged interest rates on $2.2 billion of DOE debt. Oglethorpe is using commercial paper program for interim financing between permanent debt issuances shown below. |
|
|
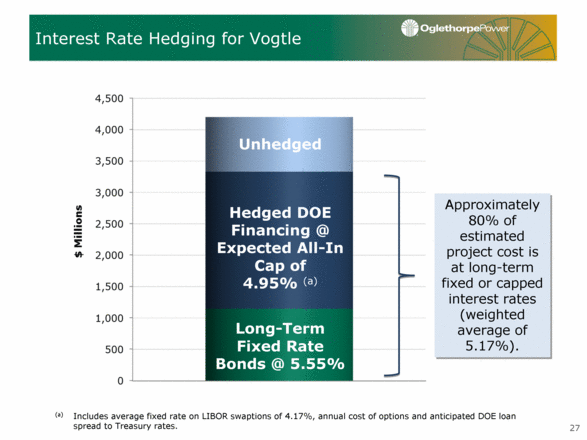
27 Interest Rate Hedging for Vogtle Unhedged Hedged DOE Financing @ Expected All-In Cap of 4.95% (a) Long-Term Fixed Rate Bonds @ 5.55% Approximately 80% of estimated project cost is at long-term fixed or capped interest rates (weighted average of 5.17%). (a) Includes average fixed rate on LIBOR swaptions of 4.17%, annual cost of options and anticipated DOE loan spread to Treasury rates. |
|
|
Submitted Part I and Part II loan applications in 2008. Signed conditional term sheet with DOE in May 2010. Final loan approval is not expected until third quarter 2012. DOE loan guarantee targets 70% of eligible project costs, not to exceed $3.057 billion. All-in pricing expected to be favorable relative to taxable capital markets. Will be secured under Oglethorpe’s First Mortgage Indenture on parity with other secured debt. 28 DOE Loan Guarantees for Vogtle 3 & 4 |
|
|
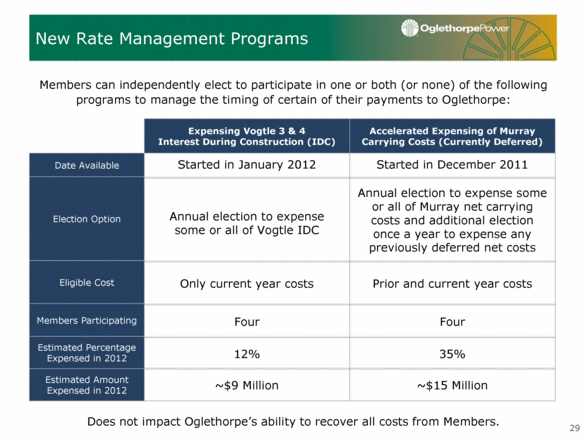
Members can independently elect to participate in one or both (or none) of the following programs to manage the timing of certain of their payments to Oglethorpe: Does not impact Oglethorpe’s ability to recover all costs from Members. 29 New Rate Management Programs Started in January 2012 Annual election to expense some or all of Vogtle IDC Only current year costs Four 12% ~$9 Million Started in December 2011 Annual election to expense some or all of Murray net carrying costs and additional election once a year to expense any previously deferred net costs Prior and current year costs Four 35% ~$15 Million Estimated Percentage Expensed in 2012 Date Available Election Option Eligible Cost Members Participating Estimated Amount Expensed in 2012 Expensing Vogtle 3 & 4 Interest During Construction (IDC) Accelerated Expensing of Murray Carrying Costs (Currently Deferred) |
|
|
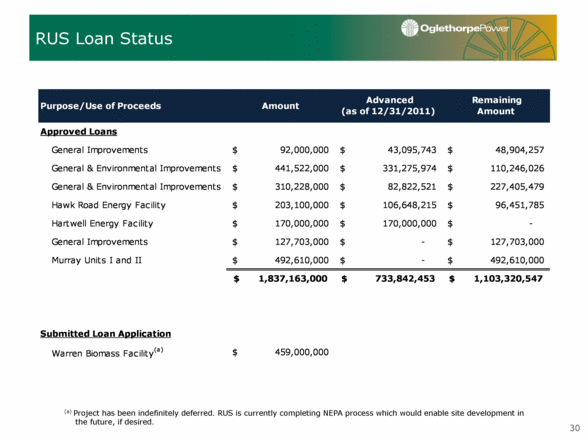
30 RUS Loan Status (a) Project has been indefinitely deferred. RUS is currently completing NEPA process which would enable site development in the future, if desired. Purpose/Use of Proceeds Amount Advanced (as of 12/31/2011) Remaining Amount Approved Loans General Improvements 92,000,000 $ 43,095,743 $ 48,904,257 $ General & Environmental Improvements 441,522,000 $ 331,275,974 $ 110,246,026 $ General & Environmental Improvements 310,228,000 $ 82,822,521 $ 227,405,479 $ Hawk Road Energy Facility 203,100,000 $ 106,648,215 $ 96,451,785 $ Hartwell Energy Facility 170,000,000 $ 170,000,000 $ - $ General Improvements 127,703,000 $ - $ 127,703,000 $ Murray Units I and II 492,610,000 $ - $ 492,610,000 $ 1,837,163,000 $ 733,842,453 $ 1,103,320,547 $ Submitted Loan Application Warren Biomass Facility (a) 459,000,000 $ |
|
|
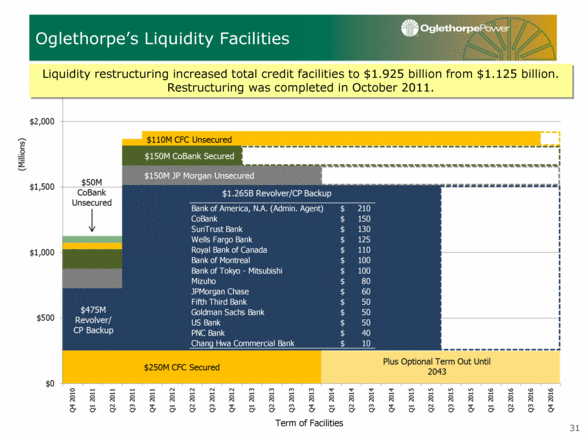
31 Oglethorpe’s Liquidity Facilities Term of Facilities Liquidity restructuring increased total credit facilities to $1.925 billion from $1.125 billion. Restructuring was completed in October 2011. Bank of America, N.A. (Admin. Agent) $210 CoBank $150 SunTrust Bank $130 Wells Fargo Bank $125 Royal Bank of Canada $110 Bank of Montreal $100 Bank of Tokyo - Mitsubishi $100 Mizuho $80 JPMorgan Chase $60 Fifth Third Bank $50 Goldman Sachs Bank $50 US Bank $50 RBC Bank (USA) $40 Chang Hwa Commercial Bank $10 Bank of America, N.A. (Admin. Agent) 210 $ CoBank 150 $ SunTrust Bank 130 $ Wells Fargo Bank 125 $ Royal Bank of Canada 110 $ Bank of Montreal 100 $ Bank of Tokyo - Mitsubishi 100 $ Mizuho 80 $ JPMorgan Chase 60 $ Fifth Third Bank 50 $ Goldman Sachs Bank 50 $ US Bank 50 $ PNC Bank 40 $ Chang Hwa Commercial Bank 10 $ |
|
|
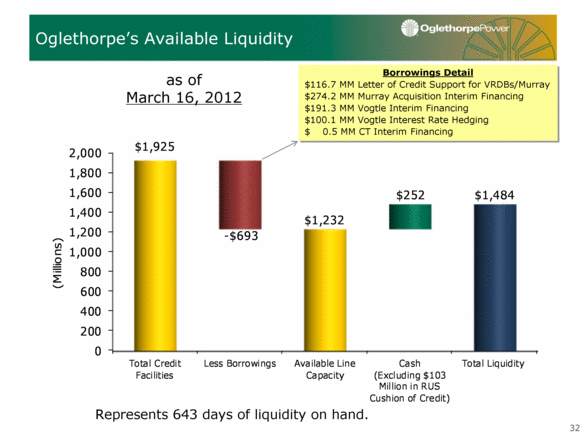
32 Oglethorpe’s Available Liquidity as of March 16, 2012 Borrowings Detail $116.7 MM Letter of Credit Support for VRDBs/Murray $274.2 MM Murray Acquisition Interim Financing $191.3 MM Vogtle Interim Financing $100.1 MM Vogtle Interest Rate Hedging $ 0.5 MM CT Interim Financing Represents 643 days of liquidity on hand. 0 200 400 600 800 1,000 1,200 1,400 1,600 1,800 2,000 Total Credit Facilities Less Borrowings Available Line Capacity Cash (Excluding $103 Million in RUS Cushion of Credit) Total Liquidity $1,925 - $693 $1,232 $252 $1,484 (Millions) |
|
|
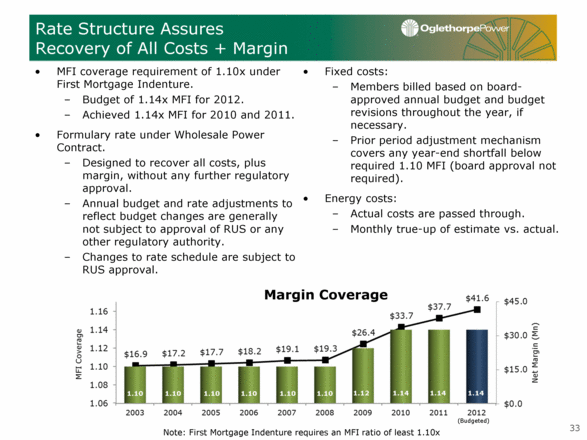
Rate Structure Assures Recovery of All Costs + Margin Fixed costs: Members billed based on board-approved annual budget and budget revisions throughout the year, if necessary. Prior period adjustment mechanism covers any year-end shortfall below required 1.10 MFI (board approval not required). Energy costs: Actual costs are passed through. Monthly true-up of estimate vs. actual. Note: First Mortgage Indenture requires an MFI ratio of least 1.10x MFI coverage requirement of 1.10x under First Mortgage Indenture. Budget of 1.14x MFI for 2012. Achieved 1.14x MFI for 2010 and 2011. Formulary rate under Wholesale Power Contract. Designed to recover all costs, plus margin, without any further regulatory approval. Annual budget and rate adjustments to reflect budget changes are generally not subject to approval of RUS or any other regulatory authority. Changes to rate schedule are subject to RUS approval. (Budgeted) Margin Coverage 33 |
|
|
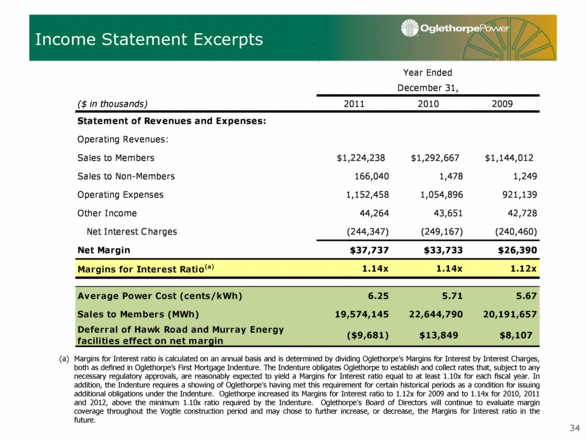
Income Statement Excerpts Margins for Interest ratio is calculated on an annual basis and is determined by dividing Oglethorpe’s Margins for Interest by Interest Charges, both as defined in Oglethorpe’s First Mortgage Indenture. The Indenture obligates Oglethorpe to establish and collect rates that, subject to any necessary regulatory approvals, are reasonably expected to yield a Margins for Interest ratio equal to at least 1.10x for each fiscal year. In addition, the Indenture requires a showing of Oglethorpe’s having met this requirement for certain historical periods as a condition for issuing additional obligations under the Indenture. Oglethorpe increased its Margins for Interest ratio to 1.12x for 2009 and to 1.14x for 2010, 2011 and 2012, above the minimum 1.10x ratio required by the Indenture. Oglethorpe’s Board of Directors will continue to evaluate margin coverage throughout the Vogtle construction period and may chose to further increase, or decrease, the Margins for Interest ratio in the future. 34 December 31, ($ in thousands) 2011 2010 2009 Statement of Revenues and Expenses: Operating Revenues: Sales to Members $1,224,238 $1,292,667 $1,144,012 Sales to Non-Members 166,040 1,478 1,249 Operating Expenses 1,152,458 1,054,896 921,139 Other Income 44,264 43,651 42,728 Net Interest Charges (244,347) (249,167) (240,460) Net Margin $37,737 $33,733 $26,390 Margins for Interest Ratio (a) 1.14x 1.14x 1.12x Average Power Cost (cents/kWh) 6.25 5.71 5.67 Sales to Members (MWh) 19,574,145 22,644,790 20,191,657 Deferral of Hawk Road and Murray Energy facilities effect on net margin ($9,681) $13,849 $8,107 Year Ended |
|
|
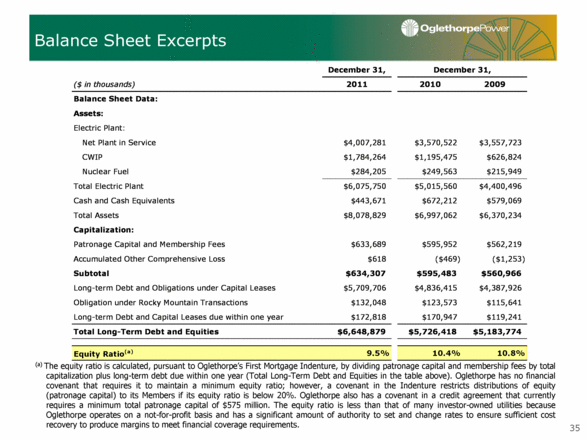
Balance Sheet Excerpts (a) The equity ratio is calculated, pursuant to Oglethorpe’s First Mortgage Indenture, by dividing patronage capital and membership fees by total capitalization plus long-term debt due within one year (Total Long-Term Debt and Equities in the table above). Oglethorpe has no financial covenant that requires it to maintain a minimum equity ratio; however, a covenant in the Indenture restricts distributions of equity (patronage capital) to its Members if its equity ratio is below 20%. Oglethorpe also has a covenant in a credit agreement that currently requires a minimum total patronage capital of $575 million. The equity ratio is less than that of many investor-owned utilities because Oglethorpe operates on a not-for-profit basis and has a significant amount of authority to set and change rates to ensure sufficient cost recovery to produce margins to meet financial coverage requirements. 35 December 31, ($ in thousands) 2011 2010 2009 Balance Sheet Data: Assets: Electric Plant: Net Plant in Service $4,007,281 $3,570,522 $3,557,723 CWIP $1,784,264 $1,195,475 $626,824 Nuclear Fuel $284,205 $249,563 $215,949 Total Electric Plant $6,075,750 $5,015,560 $4,400,496 Cash and Cash Equivalents $443,671 $672,212 $579,069 Total Assets $8,078,829 $6,997,062 $6,370,234 Capitalization: Patronage Capital and Membership Fees $633,689 $595,952 $562,219 Accumulated Other Comprehensive Loss $618 ($469) ($1,253) Subtotal $634,307 $595,483 $560,966 Long-term Debt and Obligations under Capital Leases $5,709,706 $4,836,415 $4,387,926 Obligation under Rocky Mountain Transactions $132,048 $123,573 $115,641 Long-term Debt and Capital Leases due within one year $172,818 $170,947 $119,241 Total Long-Term Debt and Equities $6,648,879 $5,726,418 $5,183,774 Equity Ratio (a) 9.5% 10.4% 10.8% December 31, |
|
|
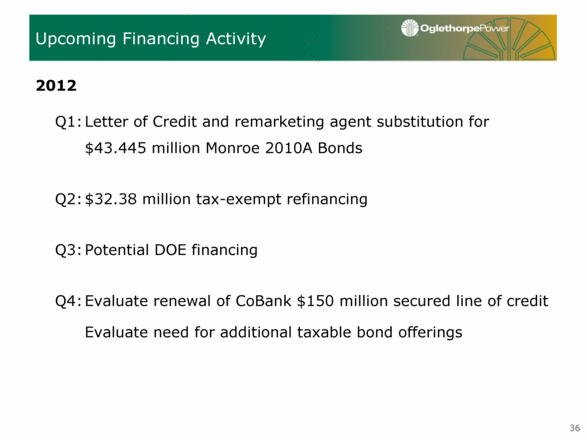
Q1: Letter of Credit and remarketing agent substitution for $43.445 million Monroe 2010A Bonds Q2: $32.38 million tax-exempt refinancing Q3: Potential DOE financing Q4: Evaluate renewal of CoBank $150 million secured line of credit Evaluate need for additional taxable bond offerings 36 Upcoming Financing Activity 2012 |
|
|
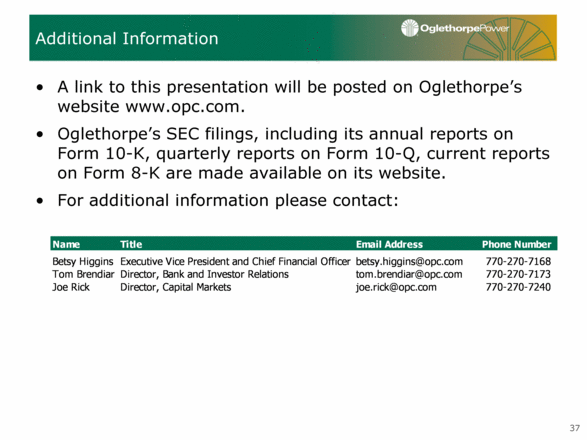
A link to this presentation will be posted on Oglethorpe’s website www.opc.com. Oglethorpe’s SEC filings, including its annual reports on Form 10-K, quarterly reports on Form 10-Q, current reports on Form 8-K are made available on its website. For additional information please contact: 37 Additional Information Name Title Email Address Phone Number Betsy Higgins Executive Vice President and Chief Financial Officer betsy.higgins@opc.com 770-270-7168 Tom Brendiar Director, Bank and Investor Relations tom.brendiar@opc.com 770-270-7173 Joe Rick Director, Capital Markets joe.rick@opc.com 770-270-7240 |