Attached files
| file | filename |
|---|---|
| 8-K - FORM 8-K - MModal Inc. | d318800d8k.htm |
 Investor Meetings
March 2012
Exhibit 99.1 |
 Information provided and statements contained in this presentation that are not
purely historical, such as statements regarding our 2012 performance goals,
our business strategy and proposed investments, are forward-looking
statements within the meaning of Section 27A of the Securities Act of 1933, Section 21E
of the Securities Exchange Act of 1934 and the Private Securities Litigation Reform
Act of 1995. Such forward-looking statements only speak as of the date
of this presentation and MModal Inc. assumes no obligation to update the
information included in this presentation. Statements made in this
presentation that are forward-looking in nature may involve risks and
uncertainties. Accordingly, readers are cautioned that any such forward-looking
statements are not guarantees of future performance and are subject to
certain risks, uncertainties and assumptions that are difficult to predict,
including, without limitation, specific factors discussed herein and in other disclosures
and public filings made by MModal Inc., including filings with the SEC. Although
M*Modal believes that the expectations reflected in such forward-looking
statements are reasonable as of the date made, expectations may prove to
have been materially different from the results expressed or implied by such
forward-looking statements.
In addition to the US GAAP results, M*Modal has provided certain
non-GAAP financial measures in this
presentation such as Adjusted EBITDA and Adjusted Net Income. The tables in the
appendix to this presentation include a reconciliation of the historical and
forward-looking non-GAAP financial measures to the most directly
comparable GAAP financial measures. safe harbor language and
reconciliation of non-GAAP measures |
 investment
highlights 3
•
1 of 2 key players offering FESR and NLU technology
•
Healthcare focused
•
Large diversified base of provider clients & MTSOs
•
Proven HCIT additions to leadership team
•
Brand investments
•
Leverage of scalable global services capability
•
Rise of Speech + NLU in clinical documentation
•
Growth in mobility solution for healthcare
•
Healthcare reform driving new growth opportunities
•
Value of Big Data in healthcare on horizon
•
Modern architecture
•
Highly differentiated NLU approach
•
Validation from new strategic partnerships
Market Leader
Focused Direction
Favorable Trends
Technology
Innovator
Collaborative Intelligence for Health – © 2012 MModal IP LLC, All rights reserved. – Confidential
Information |
 4
M*Modal delivers innovative solutions
that capture the complete patient story by
facilitating clinical workflows, enabling
collaboration and providing insight for
improved delivery of care.
M*Modal is a leading provider of:
•
•
collaborative intelligence
Medical dictation & transcription
Narrative to meaningful clinical
documentation transformation
•
Speech and Language
Understanding technology
Collaborative Intelligence for Health – © 2012 MModal IP LLC, All rights reserved. – Confidential Information |
 new additions
5
Brand
Strategic
Partnerships
Leadership
Team
Collaborative Intelligence for Health – © 2012 MModal IP LLC, All rights reserved. – Confidential
Information |
 about M*Modal
6
our solutions
our clients
•
MTSOs
•
Radiology systems
•
EHR Vendors
•
HCIT Firms
our company
•
140+ patents and
licenses in speech
recognition and
understanding
•
Cloud Based Speech
Recognition
•
Language
Understanding
•
Coding Technology
•
EHR Integration
•
Clinical
Documentation
•
Partners:
•
850 physicians
practices
•
3,000 hospitals,
clinics, and
practices
•
200,000 physicians
Collaborative Intelligence for Health – © 2012 MModal IP LLC, All rights reserved. – Confidential
Information •
Traded on NASDAQ
(MODL)
•
14,000+ employees
worldwide |
 differentiation:
technology + market footprint 7
Clinical
Documentation
1 of 3
scale players
Speech & Language
Understanding
1 of 2
healthcare players
Computer
Assisted
Coding
3 of 6 major players
use our NLU
Collaborative Intelligence for Health – © 2012 MModal IP LLC, All rights reserved. – Confidential
Information |
 drivers for growth: healthcare reform
8
Meaningful
Use
Physician HCIT adoption
Completeness of POC clinical documentation
Back office transition cost & complexity
Lack of clinical data integration & availability
Need for data driven medical evidence
Accountable
Care
ICD-10
Shift
from
Encounter
Value
Based
Healthcare
Collaborative Intelligence for Health – © 2012 MModal IP LLC, All rights reserved. – Confidential
Information |
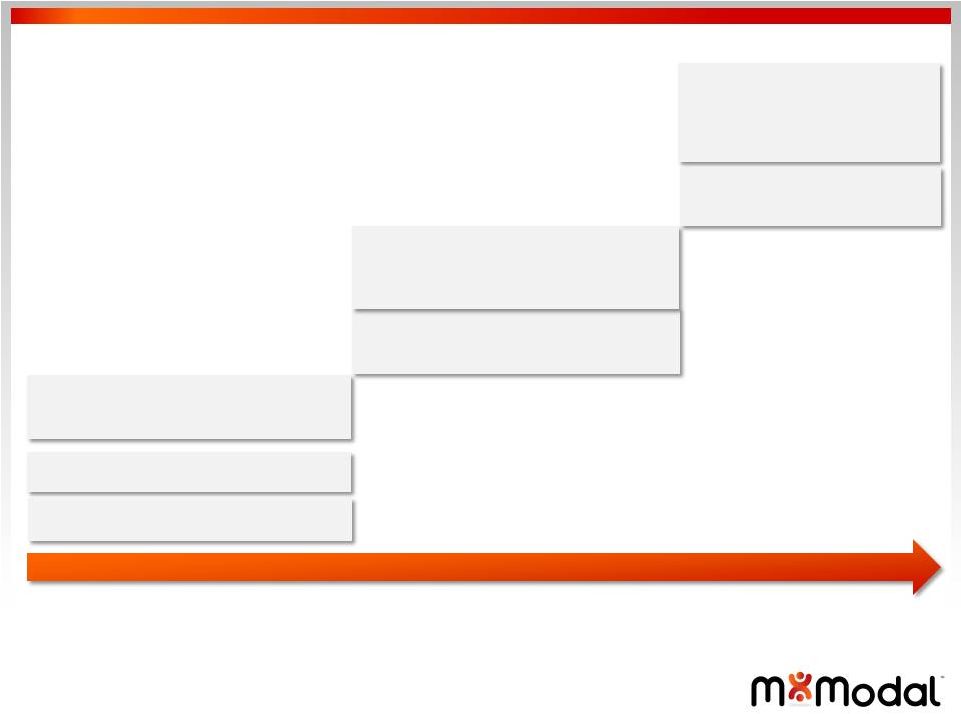 longer term trends
9
2011
2012
2013
2014
2015
2016+
Evidence based
feedback at POC with
patient context
Big Data for population
health management
Blending of Big Data +
structured data for clinical &
billing workflow
“Mobile”
becomes healthcare
interface standard
Rise of 2
nd
gen Speech & NLU
for clinical documentation
Meaningful Use investments
ICD-10 preparation
Collaborative Intelligence for Health – © 2012 MModal IP LLC, All rights reserved. – Confidential
Information |
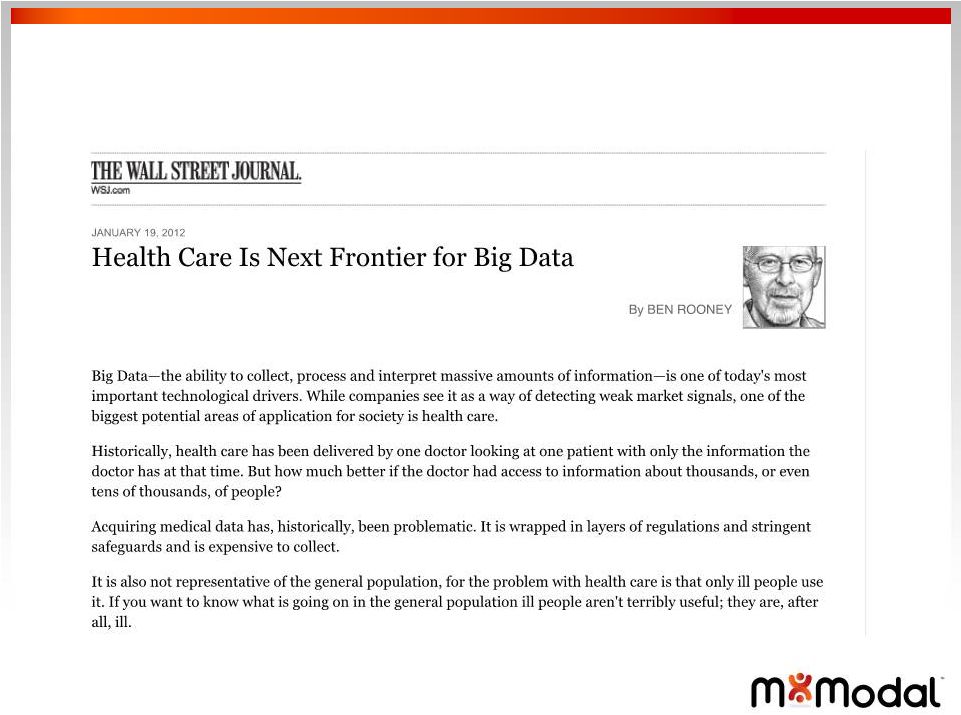 era of Big Data
10
Collaborative Intelligence for Health – © 2012 MModal IP LLC, All rights reserved. – Confidential
Information |
 Big Data key to
enabling healthcare reform 11
Today's challenge is primarily a data
challenge…..
•
Often derived from Claims data
•
Timeliness issues
•
May not reflect actual clinical
care process
•
Most clinical data in free text
reports
Need for structured discrete data ….
•
Run algorithms / data mine
•
Reporting
•
Cost vs. quality
80%+ of
clinical data
“trapped”
in
unstructured
text
Collaborative Intelligence for Health – © 2012 MModal IP LLC, All rights reserved. – Confidential
Information |
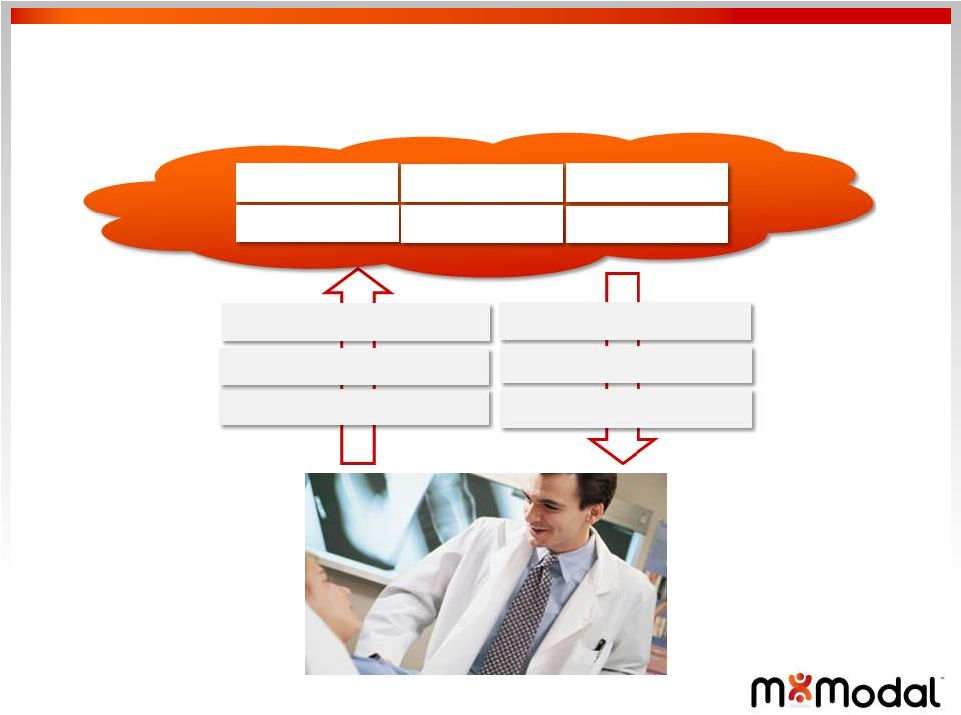 Speech Recognition
Language Understanding
Discrete Data
Documentation Feedback
Medical Evidence
Insight
EHR Integration
Coding / Billing
Quality Reporting
Research
Disease Registry
ACO
12
conversational documentation
Collaborative Intelligence for Health – © 2012 MModal IP LLC, All rights reserved. – Confidential
Information |
 M*Modal
differentiation 13
Speech Recognition
“What you say”
True Language Understanding
“What you mean”
Clinically Relevant
Cloud Based Adaptive AI
Anywhere from any device
Collaborative Intelligence for Health – © 2012 MModal IP LLC, All rights reserved. – Confidential
Information |
 differentiation:
clinical specialty focus 14
Specialty
# Physicians
% of All
Physicians
Internal Medicine
98,327
15%
Family Practice
82,347
12%
Pediatrics
51,113
8%
Psychiatry
39,015
6%
OBGYN
35,137
5%
Anesthesiology
34,630
5%
Surgery General
30,675
5%
Radiology
27,169
4%
Emergency Medicine
26,236
4%
Cardiology
21,013
3%
Orthopaedic Surgery
20,075
3%
Pathology
16,648
3%
Oncology
15,589
2%
Ophthalmology
15,335
2%
Neurology
12,368
2%
Gastroenterology
9,755
1%
Dermatology
9,309
1%
Urology
8,664
1%
Pulmonology
8,616
1%
Otorhinolaryngology
8,371
1%
Other
91,009
14%
All Physicians
661,400
100%
•
M*Modal technology is
“tuned”
to clinical
specialties
•
Integrated solutions &
partnerships with HCIT
vendors
•
Large client footprint
enables technology update
potential
Collaborative Intelligence for Health – © 2012 MModal IP LLC, All rights reserved. – Confidential
Information |
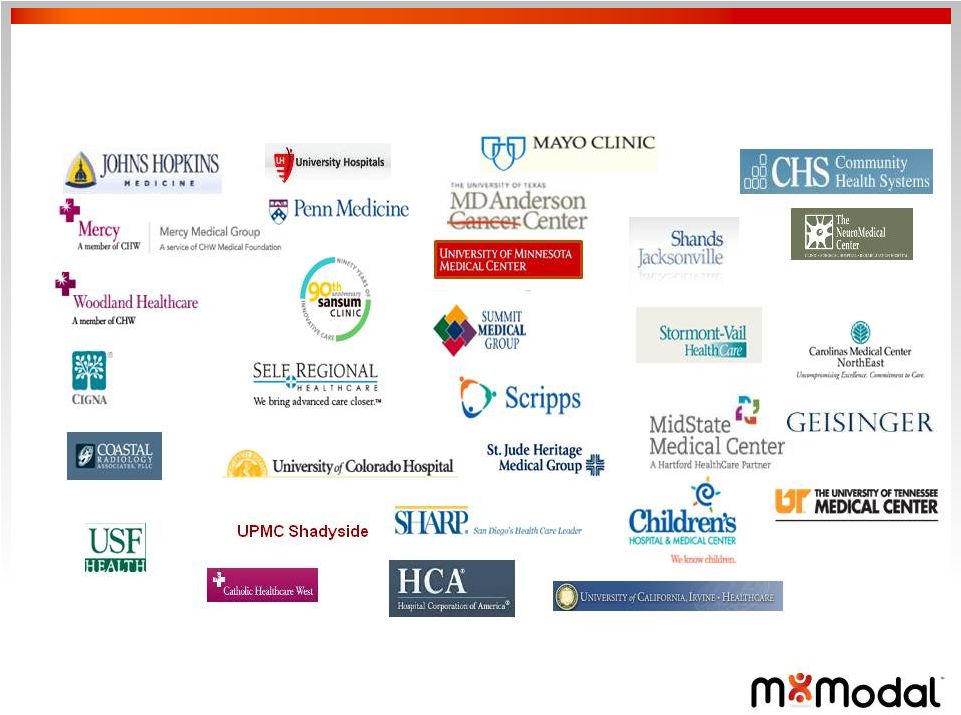
 M*Modal is the partner of choice
15
Collaborative Intelligence for Health – © 2012 MModal IP LLC, All rights reserved. – Confidential
Information |
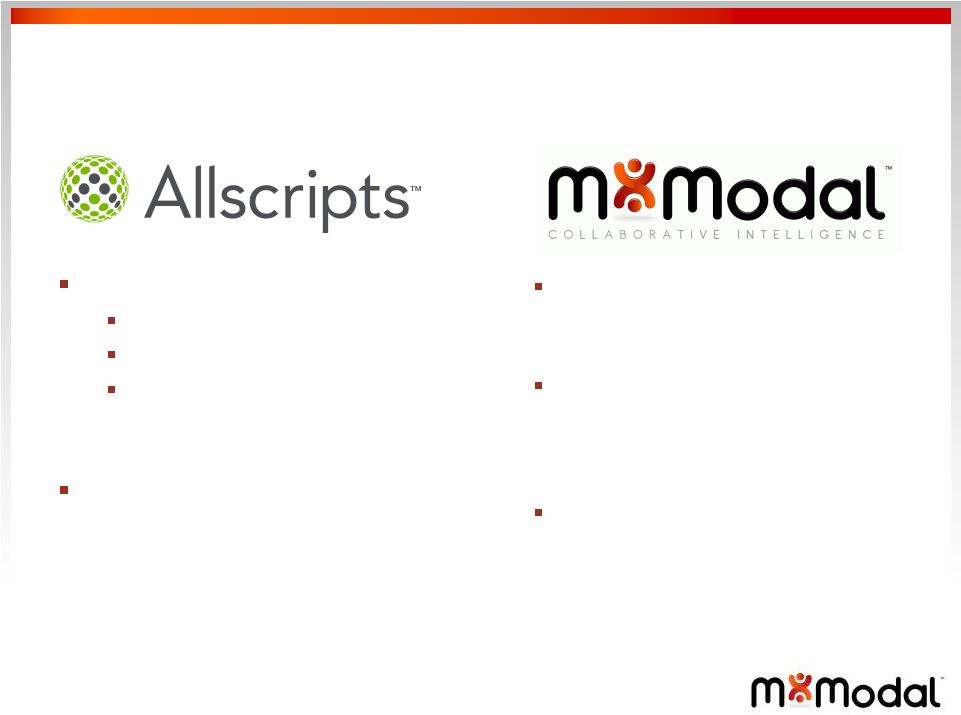 strategic innovation & distribution
ambulatory
16
+
Footprint
180,000 physician users
1,500 hospitals
10,000 post acute care
organizations
EHR portfolio covers all
ambulatory segments
Embed FESR & NLU into
EHR portfolio
Enables Allscripts' clients
use of natural speech in
conjunction with their EHR
Improves clinical quality,
enhances revenue cycle
(coding); increased
Physicians satisfaction
with EHR
Collaborative Intelligence for Health – © 2012 MModal IP LLC, All rights reserved. – Confidential
Information |
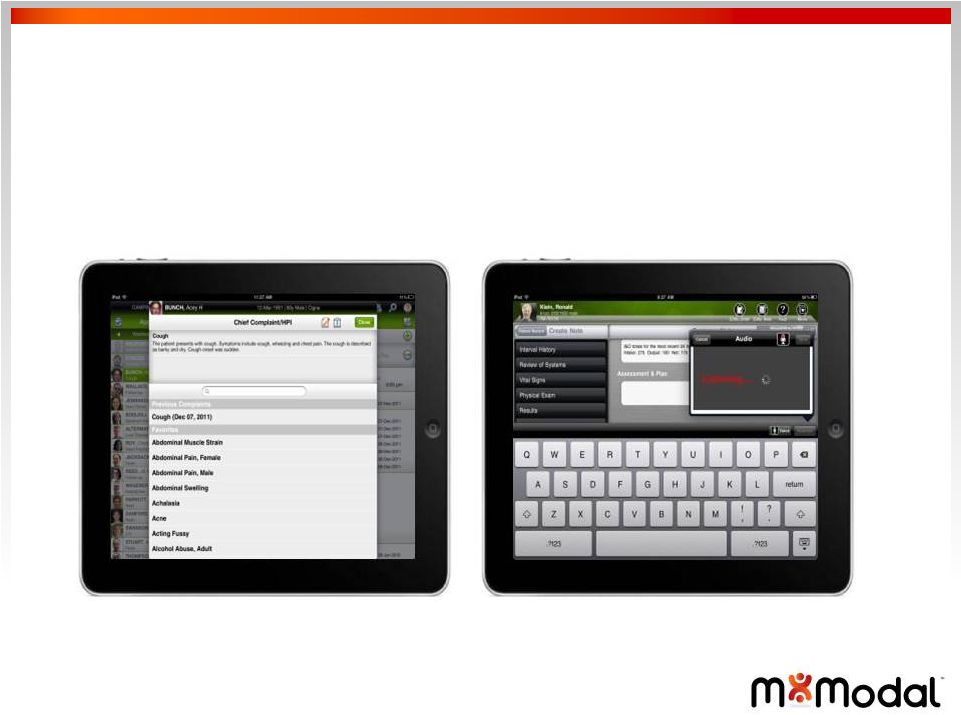 mobility solutions
M*Modal advanced speech understanding technology
17
Collaborative Intelligence for Health – © 2012 MModal IP LLC, All rights reserved. – Confidential
Information |
 strategic innovation & distribution
radiology & imaging
18
+
Footprint
1,500 Hospitals
6,000 Clinics and Labs
(1/3 of all US imaging centers)
7 of 10 top Pharma
Solutions
Radiology
Cardiology
Specialty EMR
Orthopedics
Embed FESR & NLU into
entire portfolio
Enables Merge clients to
have a single integrated
solution for clinical
documentation in high
value modalities
Improves both clinical
quality and productivity of
the “ologist”
Ophthalmology
Lab
Perioperative
Clinical Trials
Collaborative Intelligence for Health – © 2012 MModal IP LLC, All rights reserved. – Confidential
Information |
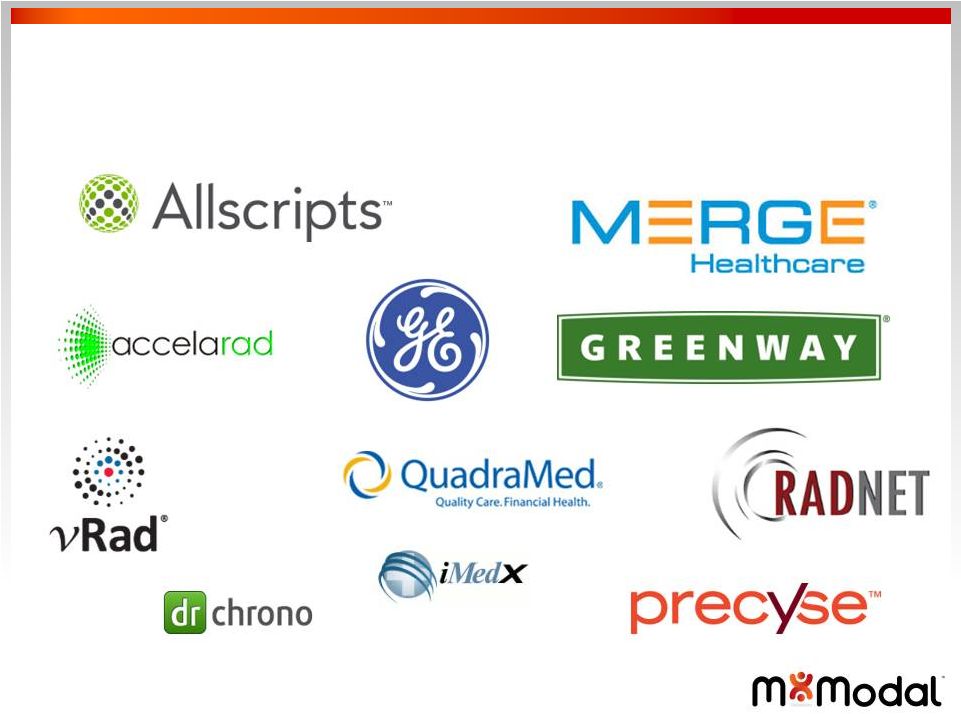
 * Representative
Sample strategic relationships
19
Collaborative Intelligence for Health – © 2012 MModal IP LLC, All rights reserved. – Confidential
Information |
 Financial
Overview |
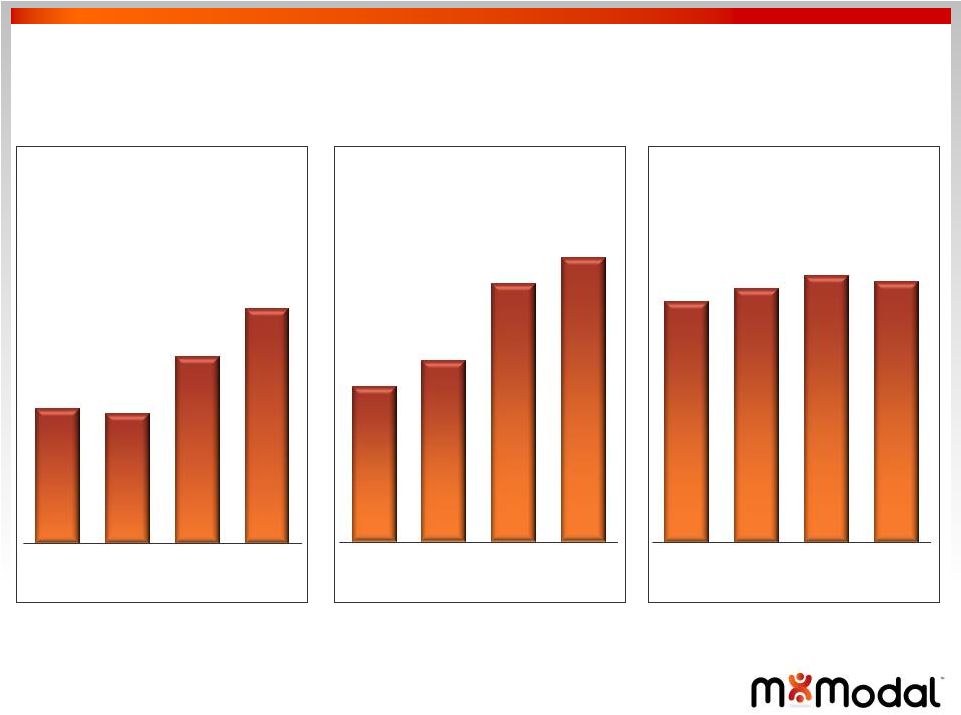 strong quarterly
results: operating metrics (1)
(1)
As defined in Appendix. Includes approximately 270 million and 150 million total billed equivalent
line counts associated with the acquisition of MultiModal Technologies, Inc., for the fourth
quarter and third quarter of 2011, respectively. (2)
Excluding acquisitions, transcription volumes processed
offshore
were
49%
in
December 2011.
(3)
Excluding acquisitions, transcription volumes edited
post
speech
recognition
were
78%
in
December 2011.
(3)
21
875
863
1,020
1,156
Q1 11
Q2 11
Q3 11
Q4 11
Total Billed Equivalent
Line Counts
(in millions)
41%
42%
45%
46%
Q1 11
Q2 11
Q3 11
Q4 11
Offshore Transcription
Volumes
(2)
72%
74%
76%
75%
Q1 11
Q2 11
Q3 11
Q4 11
Transcription Volumes
Edited Post Speech
Recognition
Collaborative Intelligence for Health – © 2012 MModal IP LLC, All rights reserved. – Confidential
Information |
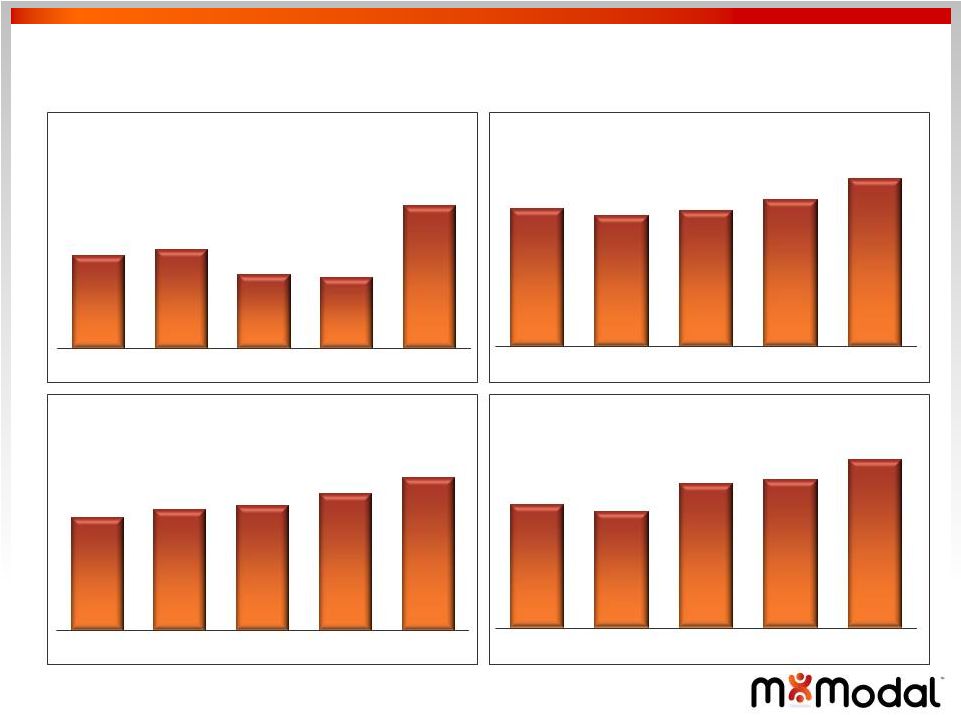 strong quarterly
results: financial metrics 25%
25%
28%
42%
40%
43%
(1)
(1)
(1) As defined in Appendix.
(1)
47%
29%
22
41%
24%
$28.0
$26.7
$27.6
$29.8
$34.1
Q4 10
Q1 11
Q2 11
Q3 11
Q4 11
Adjusted EBITDA
$110.5
$111.2
$108.4
$116.1
Q4 10
Q1 11
Q2 11
Q3 11
Q4 11
Net Revenue (in millions) & Gross
Margin Percentage
$0.28
$0.30
$0.31
$0.34
$0.38
Q4 10
Q1 11
Q2 11
Q3 11
Q4 11
Adjusted Net Income Per Fully
Diluted Share
$13.9
$13.2
$16.3
$16.8
$19.0
Q4 10
Q1 11
Q2 11
Q3 11
Q4 11
Free Cash Flow (in millions)
Collaborative Intelligence for Health – © 2012 MModal IP LLC, All rights reserved. – Confidential
Information $108.0 |
 2011 financial
metrics Financial Metrics
2011 Results
Net Revenues:
$444 million
Adjusted EBITDA
(1)
$118 million
Adjusted Net Income per fully
diluted share
(1)
$1.34
Free Cash Flow
(1)
$65 million
(1)
As defined in Appendix.
23
Collaborative Intelligence for Health – © 2012 MModal IP LLC, All rights reserved. – Confidential
Information |
 2012 performance
goals (1)
Financial Metrics
Range of Estimates
Net Revenues:
-
First half ending Jun. 30, 2012
-
Full year ending Dec. 31, 2012
$230 million to $240 million
$490 million to $505 million
Adjusted EBITDA
$123 million to $130 million
Adjusted Net Income per fully
diluted share
$1.24 to $1.35
(1)
Issued on March 8, 2012.
(2)
As defined in Appendix.
(2)
(2)
24
•
Restructuring and integration charges of $19 million to $23 million
•
Weighted average shares outstanding of 56.5 million for the full
year
•
Effective cash income tax rate of 6% to 8%
•
Capital expenditures of $26 million to $30 million
Collaborative Intelligence for Health – © 2012 MModal IP LLC, All rights reserved. – Confidential
Information |
 growth outlook context
for 2012 25
•
Growth in core business from new sales, integration
of acquisitions and MTSO roll up strategy
•
Full year benefit from acquisitions and
commercialization of technology
•
2H 2012 to reflect ramp up of new sales force
investments
Net Revenues
Adjusted EBITDA
•
Timing of sales force investments and
commercialization weighted in 1H 2012
•
Benefits from these investments begin to be realized
in 2H 2012
Free Cash Flow
•
Continue to generate significant positive FCF
•
Sufficient to fund our growth strategies
•
Timing of investments to create quarter-to-quarter
variability
Collaborative Intelligence for Health – © 2012 MModal IP LLC, All rights reserved. – Confidential
Information |
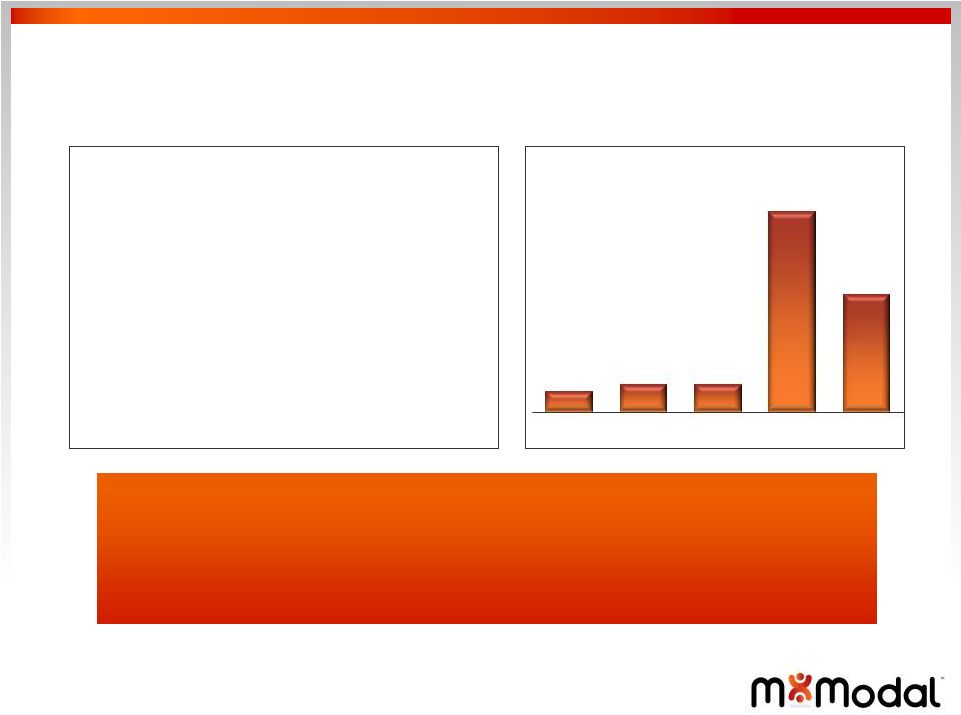 (1)
Includes short-term credit facilities, capital lease obligations and equipment loans.
(2)
Based on Trailing Twelve Month Adjusted EBITDA.
As of December 31, 2011
Scheduled Amortization and Maturity
(Dollars in millions)
Cash & Cash Equiv.
$30
Debt
(1)
$297
Net Debt
$267
Total Net Leverage
(2)
2.2 x
strong balance sheet
•
Principal amortization obligation begins in Q2 2012
•
Eight acquisitions funded with cash in 2011
•
$20 million available on revolver as of March 8
•
Strong balance sheet to execute on growth strategies
26
$15
$20
$20
$145
$85
2012
2013
2014
2015
2016
Collaborative Intelligence for Health – © 2012 MModal IP LLC, All rights reserved. – Confidential
Information |
 investment
highlights 27
•
1 of 2 key players offering FESR and NLU technology
•
Healthcare focused
•
Large diversified base of provider clients & MTSOs
Market Leader
Focused Direction
•
Proven HCIT additions to leadership team
•
Brand investments
•
Leverage of scalable global services capability
Favorable Trends
•
Rise of Speech + NLU in clinical documentation
•
Growth in mobility solution for healthcare
•
Healthcare reform driving new growth opportunities
•
Value of Big Data in healthcare on horizon
Technology
Innovator
•
Modern architecture
•
Highly differentiated NLU approach
•
Validation from new strategic partnerships
Collaborative Intelligence for Health – © 2012 MModal IP LLC, All rights reserved. – Confidential
Information |
 Appendix
|
 Three Months
Ended Dec. 31, 2011
Dec. 31, 2010
Net income attributable to MModal Inc.
$ 27,797
$ 2,083
Net income attributable to non-controlling interest
-
4,006
Discontinued operations
142
(218)
Income tax benefit
(26,202)
(2,159)
Interest expense, net
8,222
7,299
Other expense
2,845
100
Realized loss on settlement of foreign currencies
(991)
-
Loss on extinguishment of debt
-
13,525
Depreciation and amortization
11,310
8,872
Acquisition and restructuring charges
9,423
2,271
Cost of legal proceedings, settlements and accommodations
210
820
Share-based compensation and other non-cash awards
1,303
279
Gain on sale of investment
-
(8,870)
Equity in income of affiliated company
-
(77)
Adjusted EBITDA
$ 34,059
$ 28,021
Adjusted EBITDA as a percentage of net revenues
29.3%
25.4%
Non-GAAP Reconciliation
(Dollars in thousands)
Reconciliation of Net Income to Adjusted EBITDA (Unaudited) |
 Year Ended
Dec. 31, 2011
Net income attributable to MModal Inc.
$ 62,797
Net income attributable to non-controlling interest
2,138
Discontinued operations
142
Income tax benefit
(43,398)
Interest expense, net
29,301
Other expense
5,405
Realized loss on settlement of foreign currencies
(364)
Depreciation and amortization
37,826
Acquisition and restructuring charges
26,943
Benefit of legal proceedings, settlements and accommodations
(6,678)
Share-based compensation and other non-cash awards
3,984
Adjusted EBITDA
$ 118,096
Adjusted EBITDA as a percentage of net revenues
26.6%
Non-GAAP Reconciliation
(Dollars in thousands)
Reconciliation of Net Income to Adjusted EBITDA (Unaudited)
|
 Three Months Ended
Sep. 30, 2011
June 30, 2011
Mar. 31, 2011
Net income attributable to MModal Inc.
$ 20,553
$ 5,135
$ 9,312
Net income attributable to non-controlling interest
361
271
1,506
Income tax provision (benefit)
(19,226)
886
1,144
Interest expense, net
7,081
6,961
7,037
Other (income) expense
4,033
(530)
(943)
Realized gain on settlement of foreign currencies
93
377
157
Depreciation and amortization
9,219
8,879
8,418
Acquisition and restructuring charges
6,251
4,391
6,878
Cost (benefit) of legal proceedings, settlements and accommodations
44
581
(7,513)
Share-based compensation and other non-cash awards
1,360
611
710
Adjusted EBITDA
$ 29,769
$ 27,562
$ 26,706
Adjusted EBITDA as a percentage of net revenues
27.6%
25.4%
24.0%
Non-GAAP Reconciliation
(Dollars in thousands)
Reconciliation of Net Income to Adjusted EBITDA (Unaudited)
|
 Three Months Ended
Dec. 31, 2011
Dec. 31, 2010
Adjusted EBITDA
$ 34,059
$ 28,021
Consolidated interest expense
(8,222)
(7,299)
Non-cash interest
1,655
803
Capital expenditures
(7,045)
(4,687)
Tax benefit
26,202
2,159
Deferred tax benefit
(27,639)
(5,072)
Free Cash Flow
$ 19,010
$ 13,925
Adjusted Net Income (Unaudited)
Adjusted EBITDA
$ 34,059
$ 28,021
Less:
Amortization (excluding acquired intangibles)
4,879
3,869
Cash interest (total expenses less non-cash)
6,567
6,496
Current tax provision
1,437
2,913
Adjusted Net Income
$ 21,176
$ 14,743
Adjusted Net Income per share:
Basic
$0.39
$0.29
Diluted
$0.38
$0.28
Non-GAAP Reconciliation
(Dollars in thousands)
Free Cash Flow (Unaudited) |
 Three Months Ended
Sept. 30, 2011
June 30, 2011
March 31, 2011
Adjusted EBITDA
$ 29,769
$ 27,562
$ 26,706
Consolidated interest expense
(7,081)
(6,961)
(7,037)
Non-cash interest
774
831
858
Capital expenditures
(5,959)
(4,360)
(6,688)
Tax (provision) benefit
19,226
(886)
(1,144)
Deferred tax provision (benefit)
(19,933)
159
546
Free Cash Flow
$ 16,796
$ 16,345
$ 13,241
Adjusted Net Income (Unaudited)
Adjusted EBITDA
$ 29,769
$ 27,562
$ 26,706
Less:
Amortization (excluding acquired intangibles)
4,116
4,362
3,903
Cash interest (total expenses less non-cash)
6,307
6,130
6,179
Current tax provision
707
727
598
Adjusted Net Income
$ 18,639
$ 16,343
$ 16,026
Adjusted Net Income per share:
Basic
$0.35
$0.32
$0.31
Diluted
$0.34
$0.31
$0.30
(Dollars in thousands)
Free Cash Flow (Unaudited)
Non-GAAP Reconciliation |
 Year Ended
Dec. 31, 2011
Adjusted EBITDA
$ 118,096
Consolidated interest expense
(29,301)
Non-cash interest
4,188
Capital expenditures
(24,052)
Tax benefit
43,398
Deferred tax benefit
(46,867)
Free Cash Flow
$ 65,392
Adjusted Net Income (Unaudited)
Adjusted EBITDA
$ 118,096
Less:
Amortization (excluding acquired intangibles)
17,260
Cash interest (total expenses less non-cash)
25,183
Current tax provision
3,469
Adjusted Net Income
$ 72,184
Adjusted Net Income per share:
Basic
$1.37
Diluted
$1.34
(Dollars in thousands)
Free Cash Flow (Unaudited)
Non-GAAP Reconciliation |
 Three Months Ended
Dec. 31, 2011
Dec. 31, 2010
MModal Inc. Shares
Basic outstanding
54,418
35,158
Effect of dilutive options
1,034
1,212
Diluted shares
55,452
36,370
Proforma
impact
of
fully
dilutive
shares
(1)
Basic
172
15,775
Diluted
394
16,005
Proforma Shares
Basic
54,590
50,933
Diluted
55,846
52,375
(1)
Fully dilutive shares includes common stock equivalents which consists of stock
options, restricted stock issuable to certain key employees, shares issued to former
principal stockholders, shares issued to former principal stockholders and shares
issued in our initial public offering, our private exchange offer, our public exchange
offer and our short-form merger with MModal MQ Inc. (f/k/a MedQuist Inc.)
Non-GAAP Reconciliation |
 Three Months Ended
Sept. 30, 2011
June 30, 2011
March 31, 2011
MModal Inc. Shares
Basic outstanding
51,195
49,168
40,933
Effect of dilutive options
1,283
1,391
1,047
Diluted shares
52,478
50,559
41,980
Proforma impact of fully dilutive
shares
(1)
Basic
1,814
1,929
10,683
Diluted
2,023
2,176
10,913
Proforma Shares
Basic
53,009
51,097
51,616
Diluted
54,501
52,735
52,893
Non-GAAP Reconciliation
(1)
Fully dilutive shares includes common stock equivalents which consists of stock
options, restricted stock issuable to certain key employees, shares issued to former
principal stockholders, shares issued to former principal stockholders and shares
issued in our initial public offering, our private exchange offer, our public exchange
offer and our short-form merger with MModal MQ Inc. (f/k/a MedQuist Inc.)
|
 Performance Goals -
Twelve Months Ended
December 31, 2012
Low
High
Net income attributable to MModal Inc.
$ 18,000
$ 20,400
Income tax provision
7,000
5,800
Interest expense, net
29,000
28,500
Other income
(4,500)
(5,000)
Realized gain on settlement of foreign currencies
1,700
1,700
Depreciation and amortization
47,000
49,500
Acquisition and restructuring charges
19,000
23,000
Share-based compensation and other non-cash awards
5,800
6,100
Adjusted EBITDA
$ 123,000
$ 130,000
Non-GAAP Reconciliation
(Dollars in thousands)
Reconciliation of Net Income to Adjusted EBITDA (Unaudited)
|
 Performance Goals -
Twelve Months Ended
December 31, 2012
Low
High
Adjusted EBITDA
$ 123,000
$ 130,000
Less:
Amortization (excluding acquired intangibles)
21,000
23,500
Cash interest (total expenses less non-cash)
25,600
25,100
Current tax provision
6,100
4,900
Adjusted Net Income
$ 70,300
$ 76,500
Adjusted Net Income per share:
Basic
$1.28
$1.39
Diluted
$1.24
$1.35
MModal Inc. Shares
(1)
Basic outstanding
55,100
55,100
Effect of dilutive options
1,400
1,400
Diluted shares
56,500
56,500
(Dollars in thousands)
Adjusted Net Income (Unaudited)
Non-GAAP Reconciliation
(1)
MModal Inc. weighted average shares outstanding |
 Non-GAAP Financial Measures
In addition to the United States generally accepted accounting principles, or GAAP,
results provided throughout this document, M*Modal has provided certain non-
GAAP financial measures to help evaluate the results of our performance. The
Company believes that these non-GAAP financial measures, when presented in
conjunction with comparable GAAP financial measures, are useful to both management
and investors in analyzing the Company's ongoing business and operating
performance. The Company believes that providing the non-GAAP information to
investors, in addition to the GAAP presentation, allows investors to view the
Company's financial results in the way that management views financial results. The
tables attached to this press release include a reconciliation of these historical
non-GAAP financial measures to the most directly comparable GAAP financial
measures. We also present Adjusted EBITDA and Adjusted Net Income on a
forward-looking basis as part of our performance goals for fiscal 2012 and a reconciliation of
these non-GAAP financial measures to the most directly comparable GAAP
financial measures. These measures are subject to change because management
cannot predict, with sufficient reliability, potential changes in tax valuation
allowances, potential restructuring impacts, contingencies related to past and future
acquisitions, and changes in fair values of our derivative instruments, all of
which are difficult to estimate primarily due to dependencies on future events.
Adjusted Net Income
Adjusted Net Income, a non-GAAP financial measure, is defined by the Company as
Adjusted EBITDA less amortization expense for capitalized intangible assets
(excluding acquired intangibles), less interest expense (net of non-cash
interest), and less current tax provision. We measure Adjusted Net Income based on
Proforma Shares Outstanding (see below). Management believes that utilization of
Adjusted Net Income is an important non-GAAP financial measure of our
normalized operating results.
Proforma Shares Outstanding
For purposes of evaluating our results on per-share metrics, many of our
computations utilize proforma share computations. Our measure of proforma shares
includes our Basic and Diluted share computations utilized for GAAP purposes, plus
our estimate of the impacts of common stock equivalents which consist of
stock options, restrictive stock issuable to certain key employees, shares issued
to former principal stockholders, shares issued to former principal stockholders
and shares issued in our initial public offering, our private exchange offer, our
public exchange offer and our short-form merger with MModal MQ Inc. (f/k/a
MedQuist Inc.).
Free Cash Flow
Free Cash Flow, a non-GAAP financial measure, is defined by the Company as
Adjusted EBITDA less consolidated interest expense (net of non-cash interest),
less capital expenditures (including capitalized software development costs), and
less current tax provision (net of deferred tax provision). Management believes
that utilization of Free Cash Flow is an important non-GAAP measure of the
Company's ability to convert operating results into cash. Total Billed
Equivalent Line Counts Non-GAAP Financial Definitions
Total billed
equivalent
line
counts
is
defined
by
the
Company
as
the
number
of
lines
and
line
equivalents
billed
for
the
period,
as
defined
by
a
customer's
contract,
and
includes
volume
transcribed
or
edited
on
the
Company's
transcription
platforms,
as
well
as
technology
volume
(speech
recognition). |
 Non-GAAP Financial
Definitions Adjusted EBITDA
Adjusted EBITDA is a metric used by management to measure operating
performance. Adjusted EBITDA is defined as net income attributable to
MModal Inc., as applicable, plus net income attributable to
noncontrolling interests, income taxes, net interest expense, depreciation and
amortization, cost (benefit) of legal proceedings, settlements, and
accommodations, acquisition and restructuring charges, discontinued operations,
equity in income of affiliated company, share-based compensation
and other non-cash awards, realized gain on settlement of foreign currency
hedges, excluding other (income) expense. The realized gain on
settlement of foreign currency hedges is a component of other (income) expense,
as reported in the Consolidated Statements of Operations.
Share-based compensation and other non-cash awards represents only the portion of
such expense that is a component of selling, general and administrative
expense, as reported in the Consolidated Statements of Operations, as it
excludes such expense attributable to the Company's restructuring
actions. We present Adjusted EBITDA as a supplemental performance measure
because we believe it facilitates operating performance comparisons from
period to period and company to company by backing out the following: • potential differences
caused by variations in capital structures (affecting interest expense, net), tax positions (such as the impact on periods or
companies for changes in effective tax rates), the age and book
depreciation of fixed assets (affecting depreciation expense);
• the impact of non-cash charges;
and • the impact of
acquisition and integration related charges, restructuring charges, and certain unusual or nonrecurring items.
Because Adjusted EBITDA facilitates internal comparisons of operating
performance on a more consistent basis, we also use Adjusted EBITDA
in measuring our performance relative to that of our competitors.
Adjusted EBITDA is not a measurement of our financial performance under
GAAP and should not be considered as an alternative to net income,
operating income or any other performance measures derived in accordance
with GAAP or as an alternative to cash flow from operating activities
as measures of our profitability or liquidity. We understand that although
Adjusted EBITDA is frequently used by securities analysts, lenders and
others in their evaluation of companies, Adjusted EBITDA has limitations
as an analytical tool, and you should not consider it in isolation, or
as a substitute for analysis of our results as reported under GAAP. Some of
these limitations are:
• Adjusted EBITDA does not reflect our cash expenditures or
future requirements for capital expenditures or contractual commitments;
• Adjusted EBITDA does not reflect changes in, or cash
requirements for, our working capital needs;
• Although depreciation is a non-cash charge, the assets
being depreciated will often have to be replaced in the future, and Adjusted EBITDA
does not reflect any cash requirements for such replacements; and • Other companies in our
industry may calculate Adjusted EBITDA differently than we do, limiting its usefulness as a comparative measure.
|