Attached files
| file | filename |
|---|---|
| EXCEL - IDEA: XBRL DOCUMENT - MoSys, Inc. | Financial_Report.xls |
| EX-32 - EX-32 - MoSys, Inc. | a2207956zex-32.htm |
| EX-21.1 - EX-21.1 - MoSys, Inc. | a2207956zex-21_1.htm |
| EX-31.1 - EX-31.1 - MoSys, Inc. | a2207956zex-31_1.htm |
| EX-23.1 - EX-23.1 - MoSys, Inc. | a2207956zex-23_1.htm |
| EX-31.2 - EX-31.2 - MoSys, Inc. | a2207956zex-31_2.htm |
| EX-10.19 - EX-10.19 - MoSys, Inc. | a2207956zex-10_19.htm |
Use these links to rapidly review the document
TABLE OF CONTENTS
Part IV
MOSYS, INC. INDEX TO CONSOLIDATED FINANCIAL STATEMENTS
UNITED STATES
SECURITIES AND EXCHANGE COMMISSION
Washington, D.C. 20549
FORM 10-K
ý |
ANNUAL REPORT PURSUANT TO SECTION 13 OR 15(d) OF THE SECURITIES EXCHANGE ACT OF 1934 |
|
For the Fiscal Year December 31, 2011 or |
||
o |
TRANSITION REPORT PURSUANT TO SECTION 13 OR 15(d) OF THE SECURITIES EXCHANGE ACT OF 1934 |
|
Commission file number: 000-32929
MOSYS, INC.
(Exact name of registrant as specified in its charter)
| Delaware (State or other jurisdiction of incorporation or organization) |
77-0291941 (IRS Employer Identification Number) |
3301 Olcott Street
Santa Clara, California 95054
(Address of principal executive offices)
(408) 418-7500
(Registrant's telephone number, including area code)
Securities registered pursuant to Section 12(b) of the Act:
| |
|
|
|---|---|---|
| Title of each class Common Stock, par value $0.01 per share |
Name of each exchange on which registered Global Market of the NASDAQ Stock Market, LLC |
|
Securities registered pursuant to Section 12(g) of the Act: |
||
Title of each class Series AA Preferred Stock, par value $0.01 per share |
Name of each exchange on which registered None |
|
Indicate by check mark if the registrant is a well-known seasoned issuer, as defined in Rule 405 of the Securities Act. Yes o No ý
Indicate by check mark if the registrant is not required to file reports pursuant to Section 13 or Section 15(d) of the Act. Yes o No ý
Indicate by check mark whether the registrant (1) has filed all reports required to be filed by Section 13 or 15(d) of the Securities Exchange Act of 1934 during the preceding 12 months (or for such shorter period that the registrant was required to file such reports), and (2) has been subject to such filing requirements for the past 90 days. Yes ý No o
Indicate by check mark whether the registrant has submitted electronically and posted on its corporate Web site, if any, every Interactive Data File required to be submitted and posted pursuant to Rule 405 of Regulation S-T (§232.405 of this chapter) during the preceding 12 months (or for such shorter period that the registrant was required to submit and post such files). Yes ý No o
Indicate by check mark if disclosure of delinquent filers pursuant to Item 405 of Regulation S-K (§ 229.405 of this chapter) is not contained herein, and will not be contained, to the best of registrant's knowledge, in definitive proxy or information statements incorporated by reference in Part III of this Form 10-K or any amendment to this Form 10-K. ý
Indicate by check mark whether the registrant is a large accelerated filer, an accelerated filer, a non-accelerated filer, or a smaller reporting company. See definition of "large accelerated filer," "large accelerated filer" and "smaller reporting company" in Rule 12b-2 of the Exchange Act. (Check one):
| Large accelerated filer o | Accelerated filer ý | Non-accelerated filer o (Do not check if a smaller reporting company) |
Smaller reporting company o |
Indicate by check mark whether the registrant is a shell company (as defined in Rule 12b-2 of the Act). Yes o No ý
The aggregate market value of the common stock held by non-affiliates of the Registrant, as of June 30, 2011 was $202,178,631 based upon the last sale price reported for such date on the Global Market of the NASDAQ Stock Market. For purposes of this disclosure, shares of common stock held by persons who beneficially own more than 5% of the outstanding shares of common stock and shares held by officers and directors of the Registrant have been excluded because such persons may be deemed to be affiliates. This determination is not necessarily conclusive.
As of March 1, 2012, 38,697,019 shares of the registrant's common stock, $0.01 par value per share, were outstanding.
DOCUMENTS INCORPORATED BY REFERENCE
Portions of the registrant's proxy statement to be delivered to stockholders in connection with the registrant's 2012 Annual Meeting of Stockholders to be held on or about June 5, 2012 are incorporated by reference into Part III of this Form 10-K. The registrant intends to file its proxy statement within 120 days after its fiscal year end.
ANNUAL REPORT ON FORM 10-K
FOR THE YEAR ENDED DECEMBER 31, 2011
2
This Annual Report on Form 10-K and the documents incorporated herein by reference contain forward-looking statements within the meaning of Section 27A of the Securities Act of 1933 and Section 21E of the Securities Exchange Act of 1934, which include, without limitation, statements about the market for our products, technology, our strategy, competition, expected financial performance and other aspects of our business identified in this Annual Report, as well as other reports that we file from time to time with the Securities and Exchange Commission. Any statements about our business, financial results, financial condition and operations contained in this Annual Report that are not statements of historical fact may be deemed to be forward-looking statements. Without limiting the foregoing, the words "believes," "anticipates," "expects," "intends," "plans," "projects," or similar expressions are intended to identify forward-looking statements. Our actual results could differ materially from those expressed or implied by these forward-looking statements as a result of various factors, including the risk factors described in Part I., Item 1A, "Risk Factors," and elsewhere in this report. We undertake no obligation to update publicly any forward-looking statements for any reason, except as required by law, even as new information becomes available or other events occur in the future.
MoSys® and 1T-SRAM® and are registered trademarks of MoSys, Inc. Bandwidth Engine™ and GigaChip™ are trademarks of MoSys, Inc.
Company Overview
MoSys, Inc., together with its subsidiaries ("MoSys," the "Company," "we," "our" or "us"), is a fabless semiconductor company focused on the development and sale of integrated circuits, or ICs, and intellectual property, or IP, for the high-speed networking, communications, storage and computing markets. Our technology delivers time-to-market, performance, power and economic benefits for system original equipment manufacturers, or OEMs, and technology licensees. We have developed a family of ICs, called Bandwidth Engine, which combines our proprietary 1T-SRAM high-density embedded memory and high-speed 10 Gigabits per second, or Gbps, serial interface, or I/O, with our intelligent access technology and a highly efficient interface protocol. As the bandwidth requirements and amount of packet processing increase in high-speed networking systems, critical memory access bottlenecks occur. Our Bandwidth Engine IC with its combination of serial I/O, high-speed memory, and efficient, intelligent access drastically increases memory accesses per second, removing these bottlenecks. The first applications for our Bandwidth Engine IC are in networking and communications systems to enable next generation, high density 10 Gbps, 40 Gbps and 100 Gbps solutions. Historically, our primary business has been the design, development, marketing, sale and support of differentiated IP including embedded memory and high-speed parallel and serial I/O used in advanced systems-on-chips, or SoCs. We plan to focus on differentiated IP-rich IC products, such as the Bandwidth Engine, and are dedicating an increasing amount of our R&D, marketing and sales budget to these products.
Since the beginning of 2010, we have invested an increasing amount of our research and development resources towards development of our Bandwidth Engine family of ICs. Our future success and ability to achieve and maintain profitability will be dependent on the marketing and sales of our Bandwidth Engine IC products into networking, communications and other markets requiring high bandwidth memory access. As a result, during 2011, we began placing less emphasis on IP licensing and deploying more resources towards our IC product development and marketing efforts. In December 2011, we sold a number of patents in an arrangement that provided $35 million in cash with no equity dilution to the Company. We intend to use the proceeds from this sale to partially fund our investment in our Bandwidth Engine IC product line. The transaction did not include any of the patents that cover our Bandwidth Engine IC product line, and we retained a license to the sold patents in order to execute current business with our IP technology customers and partners. However, the
3
retained license limits, among other things, the number of future licenses of 1T-SRAM memory technology that we can grant to developers of SoCs, which, at one time, was a principal focus of our 1T-SRAM licensing activities. We still maintain a large patent portfolio with over 100 patents granted and more in process.
We expect revenue from IP licensing and royalties to continue to represent the majority of our revenues in 2012. Our expectation is that our revenue will transition from primarily licensing and royalty to predominately IC product sales over the next two years. Due to the shift in our engineering and research and development focus and the decline in major consumer electronics applications utilizing customized versions of our 1T-SRAM technology, our competitiveness and the demand for our IP have declined since the beginning of 2011. As a result of our reduced licensing activities, we expect our licensing and royalty revenue to decrease in future periods. We do not expect to generate significant revenue from our Bandwidth Engine ICs until the second half of 2012, or later, and believe that IC revenues are unlikely to match or exceed revenues generated from licensing and royalties in 2011 until at least 2013, if at all.
Industry Background
The amount of data being transferred by networking, storage and computing systems is increasing rapidly, primarily driven by the growth of the Internet and demand for real-time processing of bandwidth intensive applications, such as video-on-demand, Internet protocol TV, peer-to-peer and cloud computing, web2.0 applications, 3G and 4G wireless, voice-over-Internet protocol, and many others. In order to meet these demands, the network backbone, access, storage and data center infrastructure must scale in bandwidth and processing capability. In addition, system designers face the challenge of increasing the throughput of all subsystems for a variety of applications, including video games, medical record and imaging transfers, and file sharing. These increased demands strain communication between onboard IC devices, limiting the data throughput in network switches and routers and the network backbone. To support this trend, the next generations of networking systems must offer new levels of packet forwarding rates and bandwidth density. This in turn necessitates new generations of packet processors and improved memory subsystems to enable system performance in support of these increased demands.
Networking systems, such as routers and switches, contain network line cards. The type and number of semiconductors included on the line cards depend on the capacity, port type and target functionality of each card. Several types of semiconductors are included on each line card, including physical interface electronics, one or more packet processors and multiple memory chips. Packet processors are complex ICs developed using field programmable gate arrays, or FPGAs, application-specific integrated circuits, or ASICs, or network processing units, or NPUs, that perform high speed processing for functions, such as traffic shaping, metering, billing, statistics, detection and steering. Various types of memory ICs are used in order to facilitate the temporary storage of information embedded within each packet flowing through the processors. After a packet enters the line card through a physical interface, a packet or data processor helps separate the packet into smaller pieces for rapid analysis. Typically, the data is broken up into the packet header, which contains vital information on packet destination and type, such as the IP address, and the payload which contains the data being sent. The packet header is stripped from the packet, stored in memory ICs and processed separately by a packet processing engine on the line card. The analysis of the packet header must occur at full data rates and typically requires accessing the memory ICs multiple times. Simultaneously, the packet's payload, which may be substantially larger than the packet header, is also stored in memory ICs. The specific payload data may or may not be analyzed depending on the functionality of the line card. Once processing is complete, the packet is re-combined to be sent from the system. Within the line card, communication between the packet processor and memory ICs occurs through either a parallel or serial interface. Combinations of physical pins on each type of chip are grouped together in
4
a parallel or serial architecture to form a pathway, called a bus, through which information is transferred from one IC to the next. Today, the majority of physical buses use a parallel architecture to communicate between processors and memory ICs, which means information can travel only in one direction and in one instance at a time. As processing speeds increase, in a parallel architecture the number of pins required and the speed of the bus become a limitation on system performance and capability. In a serial architecture, high speed serial bus architectures and more advanced I/O protocols will need to be supported by the various ICs included on the line card in order to remove the bottleneck and meet next generation bandwidth requirements.
The majority of networking systems sold today include line cards that process data at speeds of 10 Gbps, but to accommodate the substantial and growing increase in demand for networking communications and applications, networking equipment companies are beginning to produce next-generation systems that run at aggregate speeds of 40 Gbps up to hundreds of Gbps. Another major challenge to system designers is what we call the "memory performance barrier." Processor performance in applications such as computing and networking have continued to nearly double every 18 months, or even faster, while the performance of memory technology has generally been able to double once every 10 years. Existing memory IC solutions based on parallel I/O architecture easily support speeds of 10 Gbps, but will struggle to meet speeds of 40 Gbps and beyond due to system-level limitations for pin counts, power and performance. Traditional memory solutions currently used on line cards include both dynamic random access memory, or DRAM, and static random access memory, or SRAM, IC solutions. Line cards in networking systems use both specialized, high-performance DRAM ICs, such as reduced-latency DRAM, or RLDRAM, low-latency DRAM, or LLDRAM, and commodity DRAM, such as double data rate, or DDR ICs. In addition, networking systems use higher-performance SRAM ICs such as quad data rate, or QDR SRAM. Substantially all of these DRAM and SRAM memory ICs use parallel interfaces, which are slower than serial interfaces and will be challenged to meet the performance requirements of networking systems greater than 40 Gbps. To meet the higher performance requirements being demanded by the industry, while using current components and architectural approaches, system designers must add more discrete memory ICs to the line cards. This results in higher cost and power consumption, the use of more space on the line cards and additional communication interference between the ICs, which results in additional bandwidth limitation problems.
To address the bandwidth limitations currently confronting networking system designers, we have developed our Bandwidth Engine family of ICs. We expect our Bandwidth Engine IC products to address the increasing demands placed on conventional memory technology used on the line cards in high-bandwidth networking systems. We believe that our product and technology is required as a replacement of existing memory IC solutions in order to meet the needs of the next-generation networking systems that require large number of packet lookups and run at speeds greater than 40 Gbps.
Bandwidth Engine IC Product
Our Bandwidth Engine IC combines: (1) our proprietary 1T-SRAM high-density, high-speed, low latency embedded memory, (2) our high-speed serial 10 Gbps serial interface technology, or SerDes, (3) an open-standard interface protocol and (4) intelligent access technology. We believe an IC combining our 1T-SRAM and serial I/O with logic and other functions provides a system-level solution and significantly improves overall system performance at lower cost and power consumption. Our Bandwidth Engine ICs can provide over two billion accesses per second, over twice the performance of current memory-based solutions, and enable system designers to significantly narrow the gap between processor and memory IC performance. Customers that design Bandwidth Engine ICs onto the line cards in their networking systems will re-architect their systems at the line card level and use our
5
product to replace traditional memory solutions. When compared with existing commercially available solutions, our Bandwidth Engine ICs may—
- •
- increase performance up to four times;
- •
- reduce power by approximately 50%;
- •
- reduce cost by greater than 50%; and
- •
- result in a dramatic reduction in IC pin counts on the line card.
The Bandwidth Engine is a memory-dominated IC that has been designed to be a high-performance companion IC to packet processors. While the Bandwidth Engine primarily functions as a memory device with a high-performance and high-efficiency interface, it also can accelerate certain processing operations by serving as a co-processor element.
Our first generation Bandwidth Engine IC contains 576 megabytes, or MB, of 1T-SRAM memory and uses 10.3 Gbps SerDes I/O technology. Variations of this IC can have up to two interface ports, with up to 8 serial receiver and 8 serial transmitter lanes per port for a total of 16 lanes of 10.3 Gbps SerDes interface. These ICs include an arithmetic logic unit, or ALU, that can perform read-modify-write operations. These ICs are tested to meet or exceed the standards for telecommunications carrier class and enterprise grade applications.
On-chip Functionality
A significant performance bottleneck in any network line card is the need to transfer data between discrete ICs. Many of these data-transfer operations are iterative in nature, requiring subsequent, back-to-back accesses of the memory IC by the processor IC. Our Bandwidth Engine ICs have an ALU, which enables the Bandwidth Engine IC to perform mathematical operations on data. By moving certain processing functions from the processor IC to the Bandwidth Engine IC through the use of this embedded ALU, the number of I/O transactions is reduced and the processor IC is freed up to perform other networking or micro-processing functions.
High-Performance Interface
High speed, efficient I/Os are critical building blocks to meet high data transfer rate requirements for communication between ICs on network line cards. We believe that current networking equipment system requirements necessitate an industry transition from parallel I/O to serial I/O. As a result, semiconductor companies are increasingly turning to serial I/O architectures to achieve needed system performance. For example, high-performance ICs that are sold into wide markets, such as FPGAs and NPUs, are using serial I/Os to ensure they can match the performance of, and compete with ASICs. Using serial I/O, IC developers also are able to reduce pin count (the wired electrical I/Os that connect an IC to the NIC) on the IC. With reducing geometries, the size of most high-performance ICs is dictated by the number of pins required, rather than the amount of logic and memory embedded in the chip. As a result, using serial I/O facilitates cost reduction and reduced system power consumption, while improving the performance of both the IC itself and the overall system.
GigaChip Interface Protocol
In addition to the physical characteristics of the serial I/O, the protocol used to transmit data is also an important element that impacts speed and performance. To address this and complement our Bandwidth Engine devices, we have developed the GigaChip Interface, or GCI, which is a transport protocol optimized for efficient chip-to-chip communications. GCI is an open interface protocol, compatible with the current industry standard (Common Electrical Interface, release #11 or CEI-11). GCI can enable highly efficient serial chip-to-chip communications, and its transport efficiency averages
6
90% for the data transfers it handles. GCI is included in our Bandwidth Engine ICs, and we are offering it to customers and prospective partners on terms intended to encourage widespread adoption.
High-Performance and High-Density Memory Architecture
The Bandwidth Engine uses our proprietary 1T-SRAM high density memory technology to provide the density of DRAM and the speed of SRAM. The internal multi-bank memory array architecture used in our Bandwidth Engine ICs enables concurrent access operations. We believe that this architecture is also optimized for small algorithmic operations and data transfers, such as packet header analysis.
Carrier and Enterprise Grade Quality and Reliability
Networking equipment providers focused on the carrier and enterprise market have rigid performance and reliability standards that they require their IC vendors to achieve. Our Bandwidth Engine architecture and interface is designed for data robustness and uses end-to-end error checking and correction codes. Although the Bandwidth Engine functions as more than a discrete memory device, the onboard memory array represents a significant portion of the total chip area. Memory-dominated devices require substantially different and more robust testing than non-memory ICs in order to achieve the quality and reliability requirements of advanced networking systems. We have considered these requirements for our target customers and market segments and have incorporated appropriate design and manufacturing performance margins into our Bandwidth Engine IC products.
Our Technology
Our historical business was focused on the licensing of our proprietary 1T-SRAM and SerDes I/O technologies. We have leveraged our proprietary IP to design our Bandwidth Engine IC. The following discussion explains these technologies in further detail, as well as our historical licensing activities, which we expect to continue to generate the majority of our revenues in 2012.
1T-SRAM
Our innovative 1T-SRAM technologies provide major advantages over a traditional SRAM in cell stability, memory density and power consumption, making it more economical for designers to incorporate large amounts of embedded memory in their designs. In addition, our 1T-SRAM technologies offer all the benefits of the traditional SRAM, such as low latency, high-speed and the opportunity to use a simple interface. Our 1T-SRAM technologies can achieve these advantages while utilizing standard logic manufacturing processes and providing the simple, standard SRAM interface that designers are accustomed to.
High Density
The high density of our 1T-SRAM technologies stems from the use of a single-transistor, or 1T, which is similar to DRAM, with a storage cell for each bit of information. Embedded memory utilizing our 1T-SRAM technologies is typically two to three times denser than the six-transistor storage cells used by traditional SRAM, i.e., 6T-SRAM. Increased density enables manufacturers of electronic products, such as cellular phones, video game consoles and digital cameras and camcorders, to incorporate additional functionality into a single IC, generally an SoC, resulting in overall cost savings.
Low-power Consumption
Embedded memory utilizing our 1T-SRAM technologies can consume as little as one-half the active power and generate less heat than traditional SRAM when operating at the same speed. This reduces system level heat dissipation and enables reliable operation using lower cost packaging.
7
High-speed
Embedded memory utilizing our 1T-SRAM technologies typically provides speeds essentially equal to or greater than the speeds of traditional SRAM and DRAM, particularly for larger memory sizes. Our 1T-SRAM memory designs can sustain random access cycle times of less than three nanoseconds, significantly faster than embedded 6T-SRAM technology.
SerDes (I/Os)
High-speed
To meet increasing system performance requirements, which in many cases are being driven by the growth in the Internet and the need to transmit data faster, systems are requiring both more memory and faster communication between ICs in a system. Our interface technology includes high-speed serial I/Os, called SerDes. Our SerDes technology allows for fast exchange of data between ICs in the system and can support data rates of 2.5 to 11 Gbps in a number of protocols, including XAUI, 10G KR, and PCI Express (generations 1 to 3). We are developing next generation SerDes solutions, which we are targeting to achieve data rates of 15 Gbps and support advanced geometry nodes, such as 28 nanometers, primarily for use in our IC products.
Interoperability
We make our I/O technologies compliant with industry standards so that they can interoperate with interfaces on existing ICs. In addition, we make them programmable to support multiple data rates, which allows for greater flexibility for the system designer, while lowering their development and validation costs. Interoperability reduces development time, thereby reducing the overall time to market of our licensees' ICs.
Low power
While SerDes I/Os provide significantly enhanced performance over parallel I/Os, SerDes I/Os have higher power consumption, which is a challenge for IC designers. Our customers' SerDes I/O designs have stringent power consumption requirements, which represent a significant challenge for our engineering team. If the power consumption of the SerDes I/O is too high, the SoC must be redesigned as the power consumption budget for the SoC will be exceeded.
Our Strategy
Our primary business objective is to become an IP-rich fabless semiconductor company offering serial chip-to-chip communication solutions that deliver unparalleled bandwidth performance for next generation networking systems. The key components of the expansion of our strategic plan to become an IC supplier include the following IC-focused strategies:
Target Large and Growing Markets
Our initial strategy is to target the networking equipment market, which is a multi-billion dollar market led by companies such as Cisco Systems, Inc., Juniper Networks, Inc., Huawei Technologies, ZTE Corporation, Alcatel-Lucent and several others. To date, we have secured two low-volume design wins, which means the customer has completed its prototype evaluation and has informed us that its next generation systems will use our Bandwidth Engine IC. We are engaged with multiple customers, where we are working to achieve design wins.
8
Leverage Technologies to Create New Products
Our strategy is to combine our proprietary IP and design expertise to address the needs of several upcoming generations of advanced networking equipment. We believe an IC combining our 1T-SRAM and serial I/O with logic, such as in an ALU, and other functions can provide a system-level solution and significantly improve overall system performance at lower cost and using less power. We intend to develop a Bandwidth Engine product portfolio that can serve a wide range of system performance requirements and provide cost reduction options. In addition, we can provide customized IC solutions to customers using their proprietary technology and architecture, which would allow for improved communication between our Bandwidth Engine IC and the customer's packet processor.
Another strategy is to leverage our high-speed serial I/O to create non-memory denominated ICs, which will work along side the Bandwidth Engine ICs on 100 Gbps and higher system solutions. This will provide our customers with a more complete solution, and possibly allow us to sell a chipset containing multiple MoSys ICs.
Build Long-Term Relationships with Suppliers of Packet Processors
A key consideration of network system designers is to demonstrate interoperability between our Bandwidth Engine IC and the packet processors utilized in their systems. To obtain design wins for our Bandwidth Engine IC, we must demonstrate this interoperability, and also show that our IC works optimally with the packet processor to achieve the performance requirements. To that end, we have been working closely with FPGA, ASIC and NPU providers, to demonstrate interoperability between our Bandwidth Engine IC products and their high-performance products. To facilitate the acceptance of our Bandwidth Engine ICs, we have made available development and characterization kits for system designers to evaluate and develop code for next-generation networking systems. Our characterization kits are fully-functional hardware platforms that allow FPGA and ASIC providers, and their customers, to demonstrate interoperability of the Bandwidth Engine IC with the ASIC or FPGA the designers use within their networking systems. As we engage with application-specific standard product and NPU providers, we will be developing characterization kits to support their products as well. We believe that having long-term relationships with packet processor providers is critical to our success, as such relationships may enable us to speed our time-to-market, provide us with a competitive advantage and expand our target markets.
Expand Adoption of the GigaChip Interface Protocol
Our goal is for GCI to become an open industry standard that is designed into other ICs in the system, as we believe this will further enable serial communication at the board level and encourage adoption of our Bandwidth Engine IC products. To this end, in July 2010, we launched the GigaChip Alliance, which we have been promoting to become a consortium of leading semiconductor and system companies collaborating with us to develop the industry-wide open interoperability standards and tools required to accelerate this advanced serial chip-to-chip interface. Currently, this consortium is comprised of an informal group of early adopters who have agreed to support the GCI by demonstrating interoperability of the Bandwidth Engine IC in their systems. Since 2010, we have publicly announced the following GCI supporters: Altera Corporation, Avago Technologies, Inc., LSI, Inc., NetLogic Microsystems, Inc. (recently acquired by Broadcom Corporation) and Xilinx, Inc. In addition, multiple network equipment companies, which are prospective customers, have adopted GCI.
Licensing and Distribution Strategy for our IP
Historically, we have offered our memory and I/O technologies on a worldwide basis to semiconductor companies, electronic product manufacturers, foundries, intellectual property companies and design companies through product development, technology licensing and joint marketing
9
relationships. We licensed our IP technology to semiconductor companies who incorporated our technology into ICs that they sold to their customers. As a result of the change in our corporate strategy, our IP licensing activities will be limited in 2012 and beyond. We intend to avoid future licensing projects that require significant use of our engineering resources, as the vast majority of our engineering personnel now work on the Bandwidth Engine ICs. However, during 2012, substantially all of our revenues will be generated from licensing and royalties related to our existing licensing arrangements, as we continue to perform and deliver under outstanding license agreements and collect royalties from 1T-SRAM licensees.
Customers in the United States accounted for 39%, 38% and 24% of our revenues in 2011, 2010 and 2009, respectively. Customers in Japan accounted for 33%, 43% and 64% of our revenues in 2011, 2010 and 2009, respectively. Customers in Taiwan accounted for 23%, 18% and 11% of our revenues in 2011, 2010 and 2009, respectively. Our remaining revenues were from customers in the rest of Asia and in Europe.
Project Licenses
Historically, we formed product development and IP licensing relationships directly with semiconductor companies. In these relationships, the prospective licensee's implementation of our technologies typically included customized development. Usually, these relationships involved both engineering work to implement our technology in the specified product and licensing the technology for manufacture and sale of the product. Although the precise terms contained in our license agreements vary, they generally include licensing fees, development fees for customizations based on the achievement of specified development milestones and royalties. The vast majority of our contracts allow for milestone billings based on work performed. If we perform the contracted services, usually the licensee is obligated to pay the license fees even if the licensee cancels the project prior to completion. The agreements often also provide for the payment of additional contract fees if we provide engineering or manufacturing support services related to the manufacture of the product. Provisions in our memory license agreements generally require the payment of royalties to us based on the future sale or manufacture of products utilizing our technologies. Generally, our project licenses grant rights on a non-exclusive, non-transferable basis, limited to the use of our technology as modified for the project covered by the license agreement. Our license agreements generally have a fixed term and are subject to renewal. Each new project requires a separate agreement or an addendum to modify an existing agreement. We are not expecting to enter into similar kinds of projects in the future, as such licenses generally require significant engineering effort and support.
Technology Licenses
We also offer our technology to semiconductor companies and foundries through 1T-SRAM and I/O technology license agreements, under which we grant the licensee the additional right to create and modify designs to offer to its own customers or use internally. The contract fees associated with these arrangements typically require the licensee to pay us to port our technology to the licensee's manufacturing process and develop a template design that the licensee will be able to use to generate future designs. These agreements also may obligate the licensee to pay contract fees upon the achievement of specified development milestones and may provide for the payment of additional contract fees for engineering or manufacturing support services. Our memory technology license agreements include royalty provisions based on the sale or manufacture of products utilizing our technologies. The technology licenses are non-transferable and authorize the licensee to modify designs for its customers or internal use from the template design that we provide under the agreement. Typically, the template design applies only to a specified manufacturing process generation or specific application. The licensee may add future process generations or uses to the license agreement for additional contract fees.
10
Research and Development
Our ability to compete in the future depends on improving our technology to meet the market's increasing demand for higher performance and lower cost requirements. We have assembled a team of highly skilled engineers whose activities are focused on developing even higher density, higher bandwidth, higher speed and lower cost next generation IC products. Development of our Bandwidth Engine IC products requires the hiring of specialized chip design and product engineers, as well as significant fabrication and testing costs, including mask costs, as we bring these products to market. Our significant future research and development activities will include:
- •
- designing next generation ICs with larger memory blocks and higher-speed SerDes;
- •
- developing versions of our initial Bandwidth Engine IC with alternative features, such as lower-speed SerDes or smaller
memory blocks to allow us to serve a broader range of applications and systems;
- •
- porting our 1T-SRAM and SerDes technology to more advanced foundry process nodes; and
- •
- developing new products that can leverage our proprietary IP portfolio and expand our market opportunity.
No development efforts are being dedicated to creating new or enhanced technology solely for use in licensing offerings.
As of December 31, 2011, we employed 120 individuals in engineering and research and development, of which 43 were employed in our facility in Hyderabad, India. For the years ended December 31, 2011, 2010 and 2009, research and development expenditures totaled approximately $26.2 million, $25.5 million and $19.3 million, respectively.
Sales and Marketing
As of December 31, 2011, we had 11 sales, marketing and application engineering personnel managing and supporting our IP licensing activities and securing design wins for our Bandwidth Engine product. Our application engineers actively engage with customers to introduce them to our Bandwidth Engine product capabilities and demonstrate its inter-operability within their systems. Our sales and marketing personnel are located in the United States, Japan and China. In addition to our direct sales team, we sell our technologies through sales representatives and distributors in the United States and Asia.
Our IP revenue has been highly concentrated, with a few customers accounting for a significant percentage of our total revenue. For the year ended December 31, 2011, Taiwan Semiconductor Manufacturing Co., Ltd., or TSMC, Renesas Electronics Corporation, or Renesas, and Broadcom represented 23%, 17% and 12% of total revenue, respectively. For the year ended December 31, 2010, Renesas, TSMC and Rohm Co., Ltd. represented 23%, 18% and 15% of total revenue, respectively. For the year ended December 31, 2009, Renesas, TSMC and Fujitsu Microelectronics, Ltd. represented 44%, 10% and 10% of total revenue, respectively.
Intellectual Property
We regard our patents, copyrights, trademarks, trade secrets and similar intellectual property as critical to our success, and rely on a combination of patent, trademark, copyright, and trade secret laws to protect our proprietary rights.
As of December 31, 2011, we held approximately 70 U.S. and 40 foreign patents on various aspects of our technology, with expiration dates ranging from 2012 to 2028. We currently have approximately 40 pending patent applications in the U.S. and abroad. There can be no assurance that others will not
11
independently develop similar or competing technology or design around any patents that may be issued to us, or that we will be able to enforce our patents against infringement.
In December 2011, we sold 43 U. S. and 30 related foreign memory technology patents for $35 million in cash pursuant to a patent purchase agreement. Under the agreement, we retained a license to all of the sold patents that is unlimited with respect to our development, manufacturing and distribution of our Bandwidth Engine IC product line and any other proprietary products that we develop as long as they are not DRAM ICs. We also retained the rights necessary to renew existing 1T-SRAM licenses and to grant licenses similar in scope to identified foundries. We also retained rights to grant licenses for our second source purposes, to enable certain kinds of technology development and to a limited extent, for certain ASIC products that incorporate one of our technology macros. However, the patent purchase agreement limits our rights to grant licenses under the sold patents outside the scope of our retained license and, in particular, limits the number of future licenses of 1T-SRAM memory technology that we can grant to developers of SoCs, which, at one time, was a principal focus of our historical 1T-SRAM licensing activities.
The semiconductor industry is characterized by frequent litigation regarding patent and other intellectual property rights. Our licensees or we might, from time to time, receive notice of claims that we have infringed patents or other intellectual property rights owned by others. Our successful protection of our patents and other intellectual property rights are subject to a number of factors, particularly those described in Part I, Item 1A, "Risk Factors."
Competition
The markets for our Bandwidth Engine IC products are highly competitive. We believe that the principal competitive factors are:
- •
- processing speed and performance;
- •
- density and cost;
- •
- low-power consumption;
- •
- reliability;
- •
- interface requirements;
- •
- ease with which technology can be customized for and incorporated into customers' products; and
- •
- level of technical support provided.
We believe that we compete favorably with respect to each of these criteria. Using our proprietary 1T-SRAM embedded memory and high-speed serial I/O IP provides our Bandwidth Engine ICs with a competitive advantage over alternative devices. Alternative solutions are either DRAM or SRAM-based and can support either the memory or speed requirements of high-performance networking systems, but generally not both. DRAM solutions provide a significant amount of memory at competitive cost, but DRAM solutions do not have the required fast access and cycle times to enable high-performance. The DRAM solutions currently used in networking systems include RLDRAM from Micron Technology, Inc. and Integrated Silicon Solutions, Inc., LLDRAM from Renesas and DDR from Elpida Memory, Inc., Micron Technology and others. SRAM solutions can meet high-speed performance requirements, but the memory size is often inadequate. The SRAM solutions currently used in networking systems primarily include QDR or similar SRAM products from Cypress Semiconductor Corporation, GSI Technology, Inc. and Samsung Electronics Co., Ltd. The majority of the currently available SRAM and DRAM solutions use a parallel rather than a serial I/O. To offset these drawbacks, system designers use more discrete memory ICs, resulting in higher power consumption and
12
greater utilization of space on the line card. Our competitors include established semiconductor companies with significantly longer operating histories, greater name recognition and reputation, large customer bases, dedicated manufacturing facilities and greater financial, technical, sales and marketing resources. This may allow them to respond more quickly than we are able to respond to new or emerging technologies or changes in customer requirements. Many of our competitors also have significant influence in the semiconductor industry. They may be able to introduce new technologies or devote greater resources to the development, marketing and sales of their products than we can. Furthermore, in the event of a manufacturing capacity shortage, these competitors may be able to manufacture products when we are unable to do so.
Our Bandwidth Engine ICs compete with embedded memory solutions, stand-alone memory ICs, including both DRAM and SRAM ICs, and ASICs designed by customers in-house to meet their system requirements. Our prospective customers may be unwilling to adopt and design-in our ICs due to the uncertainties and risks surrounding designing a new IC into their systems and relying on a supplier that has almost no history of manufacturing such ICs. In addition, Bandwidth Engine ICs require the customer and its other IC suppliers to implement our new chip-to-chip communication protocol, GCI. These parties may be unwilling to do this if they believe it could adversely impact their own future product developments or competitive advantages, or if they believe it might complicate their development process or increase their cost. In order to remain competitive, we believe we must provide unparalleled memory IC solutions with the highest bandwidth capability for our target markets, which solutions are engineered and built for high-reliability carrier class and enterprise applications.
Manufacturing
We depend on third-party vendors to manufacture, package, assemble and production test our Bandwidth Engine IC products, as we do not own or operate a semiconductor fabrication, packaging or production testing facility for boards and system assembly. By outsourcing manufacturing, we are able to avoid the high cost associated with owning and operating our own facilities, allowing us to focus our efforts on the design and marketing of our products.
Manufacturing and Testing. We use TSMC to manufacture and ASE, Inc. and Evans Analytical Group, LLC, to assemble, package and production test our IC products. We utilize eSilicon Corporation to manage and support our manufacturing and testing operations.
Quality Assurance. We maintain an ongoing review of product manufacturing and testing processes. Our IC products are subjected to extensive testing to assess whether their performance exceeds the design specifications. Our test vendors provide us with immediate test data and the ability to generate characterization reports that are made available to our customers.
Employees
As of December 31, 2011, we had 143 employees, consisting of 120 in research and development and engineering, 11 in sales, marketing and application engineering and 12 in finance and administration. By location, we had 97 employees in the United States, 43 in our development center in India and 3 sales and marketing employees in Asia. We believe our future success depends, in part, on our ability to continue to attract and retain qualified technical and management personnel, particularly highly skilled design engineers involved in new product development, for which competition is intense. We believe that our employee relations are good.
Available Information
We were founded in 1991 and reincorporated in Delaware in September 2000. Our website address is www.mosys.com. The information in our website is not incorporated by reference into this report. Through a link on the Investor section of our website, we make available our annual reports on
13
Form 10-K, quarterly reports on Form 10-Q, current reports on Form 8-K, and any amendments to those reports filed or furnished pursuant to Section 13(a) or 15(d) of the Securities Exchange Act of 1934 as soon as reasonably practicable after they are filed with, or furnished to, the Securities and Exchange Commission, or SEC. You can also read and copy any materials we file with the SEC, at the SEC's Public Reference Room at 450 Fifth Street, NW, Washington, DC 20549. You can obtain additional information about the operation of the Public Reference Room by calling the SEC at 1.800.SEC.0330. In addition, the SEC maintains a website (www.sec.gov) that contains reports, proxy and information statements, and other information regarding issuers that file electronically with the SEC, including us.
Executive Officers
The names of our executive officers and certain information about them are set forth below:
Name
|
Age | Position(s) with the Company | |||
|---|---|---|---|---|---|
Leonard Perham |
68 | President and Chief Executive Officer |
|||
James W. Sullivan |
43 | Vice President of Finance and Chief Financial Officer |
|||
Thomas Riordan |
55 | Chief Operating Officer and Executive Vice President |
|||
David DeMaria |
50 | Vice President of Business Operations |
|||
Leonard Perham, Mr. Perham was appointed President and Chief Executive Officer in November 2007. Mr. Perham was one of the original investors of MoSys and served on our Board of Directors from 1991 to 1997. Since 2000, Mr. Perham retired from Integrated Device Technology, Inc., or IDT, where he served as its Chief Executive Officer from 1991 and President and board member from 1986. From March 2000 to February 2012, Mr. Perham served as a member of or chairman of the board of directors of NetLogic Microsystems, a fabless semiconductor company. Mr. Perham also has been a venture partner with AsiaTech Management, a venture capital firm. Prior to joining IDT, Mr. Perham was President and CEO of Optical Information Systems, Inc., a division of Exxon Enterprises. He was also a member of the founding team at Zilog, Inc. and held management positions at Advanced Micro Devices and Western Digital. Mr. Perham received a Bachelor of Science degree in Electrical Engineering from Northeastern University.
James W. Sullivan, Mr. Sullivan became our Vice President of Finance and Chief Financial Officer in January 2008. From July 2006 until January 2008, Mr. Sullivan served as Vice President of Finance and Chief Financial Officer at Apptera, Inc., a venture-backed company providing software for mobile advertising, search and commerce. From July 2002 until June 2006, Mr. Sullivan was the Chief Financial Officer at 8x8, Inc., a provider of voice over internet protocol communication services. Mr. Sullivan's prior experience includes various positions at 8x8, Inc. and PricewaterhouseCoopers LLP. He received a Bachelor of Science degree in Accounting from New York University and is a Certified Public Accountant.
Thomas Riordan, Mr. Riordan became our Chief Operating Officer and Executive Vice President in May 2011. Prior to joining the Company, Mr. Riordan was President and Chief Executive Officer of Exclara, a fabless semiconductor supplier of ICs for solid-state lighting from 2006 until 2010. From 2000 to 2004, Mr. Riordan served as Vice President of PMC-Sierra's microprocessor division. Mr. Riordan joined PMC-Sierra in August 2000 when it purchased Quantum Effects Devices, which he had co-founded and served as President and Chief Executive Officer. Mr. Riordan serves on the board of directors of Mellanox Technologies and PLX Technology. Mr. Riordan holds Bachelor of Science and Master of Science degrees in Electrical Engineering as well as a Bachelor of Arts degree in Government from the University of Central Florida and has done post-graduate work in Electrical Engineering at Stanford University.
14
David DeMaria, Mr. DeMaria became our Vice President of Business Operations in August 2008. From November 2007 until August 2008, Mr. DeMaria served as Senior Vice President at Apache Design Solutions, an electronic design automation software company. From January 2006 until November 2007, Mr. DeMaria was Chief Executive Officer of Optimal Corporation, an electronic design automation software company that he helped grow and ultimately merge with Apache Design Solutions. From October 1999 to March 2004, Mr. DeMaria served in various positions, including Executive Vice President of the systems business unit and Senior Vice President of worldwide marketing and strategy, at Cadence Design Systems. Mr. DeMaria attended Boston University for a Bachelor of Science degree in Computer Engineering.
If any of the following risks actually occur, our business, results of operations and financial condition could suffer significantly.
Our success depends upon the semiconductor market's acceptance of our Bandwidth Engine ICs.
The future prospects of our business depend on the adoption and acceptance by our target markets of our Bandwidth Engine ICs. In 2011, we began focusing our engineering, marketing and sales efforts on our IC business and de-emphasizing our technology licensing business, which has been our primary revenue source. Our primary focus is on obtaining Bandwidth Engine design wins, or winning competitive bids, in which customers select our products to design into their systems. Our prospective customers may be unwilling to adopt and design-in our ICs due to the uncertainties and risks surrounding designing a new IC into their systems and relying on a supplier that has almost no history of manufacturing such ICs. In addition, Bandwidth Engine requires our customers and their other IC suppliers to implement our new and proprietary chip-to-chip communication protocol, GCI, which they may be unwilling to do. We have not yet determined or negotiated prices with customers for Bandwidth Engine ICs nor have we gained experience with the cost of making and selling these products. Thus, currently we do not know whether we will be able to profitably make and sell these products. We are investing significant resources to develop our next generation Bandwidth Engine products, but may not introduce these new products successfully or obtain significant revenue from them.
An important part of our strategy to gain market acceptance is to penetrate new markets by targeting market leaders to accept our IC solutions. This strategy is designed to encourage other participants in those markets to follow these leaders in adopting our solutions. If a high-profile industry participant adopts our ICs for one or more of its products but fails to achieve success with those products, or is unable to successfully implement our ICs, other industry participants' perception of our solutions could be harmed. Any such event could reduce the number of future sales of our IC products.
We may not achieve the anticipated benefits of becoming a fabless semiconductor company by developing and bringing to market the Bandwidth Engine IC product line.
In 2010, we expanded our business model to become a fabless semiconductor company through the development of a product line of ICs called the Bandwidth Engine. Our goal is to increase our total available market by creating high-performance ICs for networking systems, using our proprietary technology and design expertise. This development effort has required that we add significant headcount and design resources, such as expensive software tools, which has increased our losses from and cash used in operations. We may not be successful in our development efforts to bring Bandwidth Engine ICs to market successfully nor be successful in selling the Bandwidth Engine ICs due to various risks and uncertainties, including, but not limited to:
- •
- customer acceptance;
15
- •
- adoption of the GigaChip Interface;
- •
- difficulties and delays in our development, production, testing and marketing activities;
- •
- the anticipated costs and technological risks of developing and bringing ICs to market;
- •
- the willingness of our manufacturing partners to assist successfully with fabrication;
- •
- the availability of quantities of ICs supplied by our manufacturing partners at a competitive cost;
- •
- our ability to generate the desired gross margin percentages and return on our product development investment;
- •
- competition from established IC suppliers;
- •
- the adequacy of our intellectual property protection for our proprietary IC designs and technologies;
- •
- the vigor and growth of markets served by our current and prospective customers; and
- •
- our lack of recent experience as a fabless semiconductor company making and selling proprietary ICs.
If we experience significant delays in bringing the Bandwidth Engine product line to market or if customer adoption of the product is delayed, we may need to raise additional capital to support the product development efforts and fund our working capital needs.
Our main objective is the development and sale of our products to networking and communications systems providers and their subsystem and component vendors, and, if demand for these products does not grow, we may not achieve revenue growth and our strategic objectives.
We market and sell our Bandwidth Engine family of ICs to networking and communications systems providers and their subsystem and component vendors. We believe our future business and financial success depends on market acceptance and increasing sales of these products. In order to meet our growth and strategic objectives, networking infrastructure OEMs must incorporate our products into their systems, and the demand for their systems must grow as well. We cannot provide assurance that sales of products will increase substantially in the future or that the demand for our customers' systems will increase. Our future revenues from these products may not increase in accordance with our growth and strategic objectives if our OEM customers modify their product designs or select products sold by our competitors instead. Thus, the future success of this part of our business depends in large part on factors outside our control, and sales of our products may not meet our revenue growth and strategic objectives.
The Bandwidth Engine ICs have a lengthy sales cycle, which makes it difficult to predict success in this market and the timing of future revenue.
Bandwidth Engine ICs have a lengthy sales cycle, ranging from 6 to 24 months from the date of our initial proposal to a prospective customer until the date on which the customer confirms that it has designed our product into its system. As lengthy, or an even lengthier period, could ensue before we would know the volume of products that such customer will, or is likely to, order. A number of factors can contribute to the length of the sales cycle, including technical evaluations of our products by the customers, the design process required to integrate our products into the customers' products and the timing of the customers' new product announcements. In anticipation of product orders, we may incur substantial costs before the sales cycle is complete and before we receive any customer payments. As a result, in the event that a sale is not completed or is cancelled or delayed, we may have incurred substantial expenses, making it more difficult for us to become profitable or otherwise negatively impacting our financial results. Furthermore, because of this lengthy sales cycle, the recording of
16
revenue from our selling efforts may be substantially delayed, our ability to forecast our future revenue may be more limited and our revenue may fluctuate significantly from quarter to quarter. We cannot provide any assurances that our efforts to build a strong and profitable business based on the Bandwidth Engine ICs will succeed. If these efforts are not successful, in light of the substantial resources that we have invested, our future operating results and cash flows could be materially adversely affected.
We expect our licensing and royalty revenues to decrease compared with our historical results, and we do not expect revenues from our Bandwidth Engine IC products to replace these lost revenues in the near future.
In 2011, we began to place greater emphasis on our IC business and re-deploy engineering, marketing and sales resources from IP to IC activities. We are no longer actively pursuing new license arrangements, and, as a result, we expect that our license and royalty revenues will decline, when compared with prior years, starting in 2012. We do not expect to generate sufficient revenues from our Bandwidth Engine IC products to offset the reduction in our IP revenues until the second half of 2013 or later. As a result, our operating results, cash flows and financial condition in 2012 are likely to be adversely affected.
The semiconductor industry is cyclical in nature and subject to periodic downturns, which can negatively affect our revenue.
The semiconductor industry is cyclical and has experienced pronounced downturns for sustained periods of up to several years. To respond to any downturn, many semiconductor manufacturers and their customers will slow their research and development activities, cancel or delay new product developments, reduce their workforces and inventories and take a cautious approach to acquiring new equipment and technologies. As a result, our business has been in the past and could be adversely affected in the future by an industry downturn, which could negatively impact our future revenue and profitability. Also, the cyclical nature of the semiconductor industry may cause our operating results to fluctuate significantly from year-to-year, which may tend to increase the volatility of the price of our common stock.
We have a history of losses and are uncertain as to our future profitability.
We recorded an operating loss of $24.3 million, excluding the one-time gain on sale of patents of $35.6 million, for the year ended December 31, 2011 and ended the period with an accumulated deficit of $65.4 million. In addition, we recorded operating losses of $23.2 million and $20.0 million for the years ended December 31, 2010 and 2009, respectively. We expect to continue to incur operating losses for the foreseeable future as we secure customers for and invest in the productization of our Bandwidth Engine IC products. Due to our strong commitment of resources to research and development and expansion of our offerings to customers, we will need to increase revenues substantially beyond levels that we have attained in the past in order to generate sustainable operating profit. Given our history of fluctuating revenues and operating losses, the expected reduction in royalty and licensing revenues and challenges we face in securing customers for our Bandwidth Engine IC products, we cannot be certain that we will be able to achieve profitability on either a quarterly or annual basis in the future.
17
Royalties generated from the licensing of our memory technologies are currently a key component of revenues, and, if we fail to realize expected royalties, our operating results will suffer.
We are relying on the receipt of future royalties to provide working capital to partially fund our investment in our IC product line. Royalty payments owed to us are calculated based on factors such as our licensees' selling prices, wafer production and other variables as provided in each license agreement. The amount of royalties we will receive depends on our licensees' business success, production volumes and other factors beyond our control. This exposes our business model to risks that we cannot minimize directly and may result in significant fluctuations in our royalty revenue and operating results from quarter-to-quarter. We do not expect to enter into any new memory technology licensing activities, therefore the number of royalty-bearing agreements will not increase and contribute to our royalty stream. In addition, the production volumes of the current royalty-bearing products shipped by our licensees are expected to decrease; therefore we do not expect our royalty revenue to grow in future periods. If we are unable to generate as much royalty revenue in the future as we believe will be necessary to partially fund our investment in our IC product line, we may need to raise capital from other sources.
Our revenue has been highly concentrated among a small number of licensees and customers, and our results of operations could be harmed if we lose a key revenue source and fail to replace it.
Our overall revenue has been highly concentrated, with a few customers accounting for a significant percentage of our total revenue. For the year ended December 31, 2011, our three largest customers represented 23%, 17% and 12% of total revenue respectively. For the year ended December 31, 2010, our three largest customers represented 23%, 18% and 15% of total revenue, respectively. For the year ended December 31, 2009, our three largest customers represented 44%, 10%, and 10% of total revenue, respectively. We expect that a relatively small number of licensees will continue to account for a substantial portion of our revenue for the foreseeable future.
Our royalty revenue also has been highly concentrated among a few licensees, and we expect this trend to continue for the foreseeable future. In particular, a substantial portion of our licensing and royalty revenue in 2011, 2010 and 2009 has come from the license fees and royalties for integrated circuits supplied by one integrated device manufacturer, or IDM, for Nintendo® gaming devices that incorporate our 1T-SRAM technology. Royalties earned from this customer represented 16%, 22% and 39% of total revenue in 2011, 2010 and 2009, respectively. This manufacturer faces intense competitive pressure in the video game market, which is characterized by extreme volatility, costly new product introductions and rapidly shifting consumer preferences, and we cannot be certain whether their sales of products incorporating our technology will increase or decrease beyond prior or current levels. In addition, Nintendo is expected to introduce a new gaming system in 2012, which does not incorporate our technology, and will likely cause a reduction in royalties we receive related to the existing gaming devices.
As a result of this revenue concentration, our results of operations could be impaired by the decision of a single key licensee or customer to cease using our technology or products or by a decline in the number of products that incorporate our technology that are sold by a single licensee or customer or by a small group of licensees or customers.
Our revenue concentration may also pose credit risks, which could negatively affect our cash flow and financial condition.
We might also face credit risks associated with the concentration of our revenue among a small number of licensees and customers. As of December 31, 2011, four customers represented 96% of total trade receivables. Our failure to collect receivables from any customer that represents a large
18
percentage of receivables on a timely basis, or at all, could adversely affect our cash flow or results of operations and might cause our stock price to fall.
Our failure to continue to enhance our products on a timely basis could diminish our ability to attract and retain customers.
The existing and potential markets for our products are characterized by ever-increasing performance requirements, evolving industry standards, rapid technological change and product obsolescence. These characteristics lead to frequent new product introductions and enhancements, shorter product life cycles and changes in industry demands. In order to attain and maintain a significant position in the market, we will need to continue to enhance and evolve our products and the underlying proprietary technologies in anticipation of these market trends.
Our future performance depends on a number of factors, including our ability to—
- •
- identify target markets and relevant emerging technological trends;
- •
- develop and maintain competitive technology by improving performance and adding innovative features that differentiate our
products from alternative technologies;
- •
- enable the incorporation of our products into the customers' products on a timely basis and at competitive prices;
- •
- develop our products to be manufactured at smaller process geometries; and
- •
- respond effectively to new technological developments or new product introductions by others.
We plan to continually introduce enhancements to our products to meet market requirements. However, we cannot be assured that these introductions achieve market acceptance or that we will be able to sell the products on terms that are favorable to us. Our failure to develop future products that achieve market acceptance could harm our competitive position and impede our future growth.
Our products must meet exact specifications, and defects and failures may occur, which may cause customers to return or stop buying our products.
Our customers generally establish demanding specifications for quality, performance and reliability that our products must meet. However, our products are highly complex and may contain defects and failures when they are first introduced or as new versions are released. If defects and failures occur in our products during the design phase or after, we could experience lost revenues, increased costs, including warranty expense and costs associated with customer support, delays in or cancellations or rescheduling of orders or shipments, product returns or discounts, diversion of management resources or damage to our reputation and brand equity, and in some cases consequential damages, any of which would harm our operating results. In addition, delays in our ability to fill product orders as a result of quality control issues may negatively impact our relationship with our customers. We cannot assure you that we will have sufficient resources to satisfy any asserted claims. Furthermore, any such defects, failures or delays may be particularly damaging to us as we attempt to establish our reputation as a reliable provider of IC products.
Because we sell our products on a purchase order basis and rely on estimated forecasts of our customers' needs, inaccurate forecasts could adversely affect our business.
We expect to sell our Bandwidth Engine products pursuant to individual purchase orders rather than long-term purchase commitments. Therefore, we will rely on estimated demand forecasts, based upon input from our customers, to determine how much product to manufacture. Because our sales will be based primarily on purchase orders, our customers may cancel, delay or otherwise modify their purchase commitments with little or no notice to us. For these reasons, we will generally have limited
19
visibility regarding our customers' product needs. In addition, the product design cycle for networking OEMs is lengthy, and it may be difficult for us to accurately anticipate when they will commence commercial shipments of products that include our ICs. Furthermore, if we experience substantial warranty claims, our customers may cancel existing orders or cease to place future orders. Any cancellation, delay or other modification in our customers' orders could significantly reduce our revenue, cause our operating results to fluctuate from period to period and make it more difficult for us to predict our revenue. In the event of a cancellation or reduction of an order, we may not have enough time to reduce operating expenses to mitigate the effect of the lost revenue on our business.
If we overestimate customer demand for our products, we may purchase products from manufacturers that we cannot sell. Conversely, if we underestimate customer demand or if sufficient manufacturing capacity were unavailable, we would forego revenue opportunities and could lose market share in the markets served by our products. In addition, our inability to meet customer requirements for our products could lead to delays in product shipments, force customers to identify alternative sources and otherwise adversely affect our ongoing relationships with our customers.
We will depend on contract manufacturers for a significant portion of our revenue from the sale of our Bandwidth Engine products.
Many of our prospective OEM customers use third party contract manufacturers to manufacture their systems, and these contract manufacturers would purchase our products directly from us on behalf of the OEMs. Although we expect to work with our OEM customers in the design and development phases of their systems, these OEMs often give contract manufacturers some authority in product purchasing decisions. If we cannot compete effectively for the business of these contract manufacturers, or, if any of the contract manufacturers that work with our OEM customers experience financial or other difficulties in their businesses, our revenue and our business could be adversely affected. For example, if a contract manufacturer becomes subject to bankruptcy proceedings, we may not be able to obtain our products held by the contract manufacturer or recover payments owed to us by the contract manufacturer for products already delivered to the contract manufacturer. If we are unable to persuade contract manufacturers to purchase our products, or if the contract manufacturers are unable to deliver systems with our products to OEMs on a timely basis, our business would be adversely affected.
We rely on independent foundries and contractors for the manufacture, assembly, testing and packaging of our integrated circuits, and the failure of any of these third parties to deliver products or otherwise perform as requested could damage our relationships with our customers and harm our sales and financial results.
As a fabless semiconductor company, we rely on third parties for all of our manufacturing operations. We depend on these parties to supply us with material in a timely manner that meets our standards for yield, cost and quality. We do not have long-term supply contracts with any of our suppliers or manufacturing service providers, therefore they are not obligated to manufacture products for us for any specific period, in any specific quantity or at any specified price, except as may be provided in a particular purchase order. Any problems with our manufacturing supply chain could adversely impact our ability to ship our products to our customers on time and in the quantity required, which in turn could damage our customer relationships and impede market acceptance of our IC solutions.
Our costs may increase substantially if the wafer foundries and assembly and test vendors that supply and test our products do not achieve satisfactory product yields, reliability or quality.
The wafer fabrication process requires extreme precision, and the slightest changes in the design, specifications or materials can result in material decreases in manufacturing yields or even the suspension of production. From time to time, we and our wafer foundries may experience
20
manufacturing defects and reduced manufacturing yields related to errors or problems in our wafer foundries' manufacturing processes or the interrelationship of their processes with our designs. In some cases, our wafer foundries may not be able to detect these defects early in the fabrication process or determine the cause of such defects in a timely manner, which may affect the quality or reliability of our products. We may incur substantial research and development expense for prototype or development stage products as we qualify the products for production.
Our third party wafer foundries, testing and assembly vendors and sales offices are located in regions at high risk for earthquakes and other natural disasters. Any disruption to the operations of these foundries, vendors and offices resulting from earthquakes or other natural disasters could cause significant delays in the development, production, shipment and sales of our Bandwidth Engine IC products.
TSMC, which manufactures our products, is located in Asia, as are other foundries we may use in the future. EAG, which handles the testing of our products, is headquartered in California. Our primary engineering design center is located in Santa Clara, California and we have sales offices in Japan, Taiwan and China. The risk of an earthquake in the Pacific Rim region is significant due to the proximity of major earthquake fault lines. In September 1999, a major earthquake in Taiwan affected the facilities of several major foundries and other vendors. As a result of this earthquake, these vendors suffered power outages and disruptions that impaired their production capacity. In March 2002 and September 2003, additional earthquakes occurred in Taiwan. The occurrence of additional earthquakes or other natural disasters could result in the disruption of the wafer foundry or assembly and test capacity of the third parties that supply these services to us and may impede our research and development efforts, as well as our ability to market and sell our products. We may not be able to obtain alternate capacity on favorable terms, if at all.
Any claim that our products or technology infringe third-party intellectual property rights could increase our costs of operation and distract management and could result in expensive settlement costs or the discontinuance of our technology licensing or product offerings. In addition, we may incur substantial litigation expense, which would adversely affect our profitability.
The semiconductor industry is characterized by vigorous protection and pursuit of intellectual property rights or positions, which has resulted in often protracted and expensive litigation. Our licensees and IC customers, or we, might, from time to time, receive notice of claims that we have infringed patents or other intellectual property rights of others. Litigation against us can result in significant expense and divert the efforts of our technical and management personnel, whether or not the litigation has merit or results in a determination adverse to us.
Royalty amounts owed to us might be difficult to verify, and we might find it difficult, expensive and time-consuming to enforce our license agreements.
The standard terms of our 1T-SRAM license agreements require our licensees to document the manufacture and sale of products that incorporate our technology and generally report this data to us after the end of each quarter. We have the right to audit these royalty reports periodically. These audits can be expensive, time-consuming and potentially detrimental to the business relationship. A failure to fully enforce the royalty provisions of our license agreements could cause our revenue to decrease and impede our ability to achieve and maintain profitability.
We might not be able to protect and enforce our intellectual property rights, which could impair our ability to compete and reduce the value of our technology.
Our technology is complex and is intended for use in complex SoCs and networking systems. A very large number of our products utilize embedded memory and I/O technology, and a large number
21
of companies manufacture and market these products. Because of these factors, policing the unauthorized use of our intellectual property is difficult and expensive. We cannot be certain that we will be able to detect unauthorized use of our technology or prevent other parties from designing and marketing unauthorized products based on our technology. In the event we identify any past or present infringement of our patents, copyrights or trademarks, or any violation of our trade secrets, confidentiality procedures or licensing agreements, we cannot assure you that the steps taken by us to protect our proprietary information will be adequate to prevent misappropriation of our technology. Our inability to adequately protect our intellectual property would reduce significantly the barriers of entry for directly competing technologies and could reduce the value of our technology. Furthermore, we might initiate claims or litigation against third parties for infringement of our proprietary rights or to establish the validity of our proprietary rights. Litigation by us could result in significant expense and divert the efforts of our technical and management personnel, whether or not such litigation results in a determination favorable to us.
Our existing patents might not provide us with sufficient protection of our intellectual property, and our patent applications might not result in the issuance of patents, either of which could reduce the value of our core technology and harm our business.
We rely on a combination of patents, trademarks, copyrights, trade secret laws and confidentiality procedures to protect our intellectual property rights. As of December 31, 2011, we held approximately 70 patents in the United States, and approximately 40 corresponding foreign patents, which expire at various times from 2012 to 2028. In addition, as of December 31, 2011, we had approximately 40 patent applications pending worldwide. We cannot be sure that any patents will issue from any of our pending applications or that any claims allowed from pending applications will be of sufficient scope or strength, or issued in all countries where our products can be sold, to provide meaningful protection or any commercial advantage to us. In December 2011, we sold 43 United States and 30 related foreign patents, which reduced the size of our patent portfolio and diminishes our ability to assert counterclaims in the defense of actions against us that may arise. Also, competitors might be able to design around our patents. Failure of our patents or patent applications to provide meaningful protection might allow others to utilize our technology without any compensation to us and impair our ability to increase our licensing revenue.
The discovery of defects in our technology and products could expose us to liability for damages.
The discovery of a defect in our technologies and products could lead our customers to seek damages from us. Many of our license agreements include provisions waiving implied warranties regarding our technology and limiting our liability to our licensees. We cannot be certain, however, that the waivers or limitations of liability contained in our license contracts will be enforceable.
If we fail to retain key personnel, our business and growth could be negatively affected.
Our business has been dependent to a significant degree upon the services of a small number of executive officers and technical employees. The loss of any key personnel could negatively impact our technology development efforts, our ability to successfully transition our business model from IP licensing to IC sales, our ability to deliver under our existing agreements, maintain strategic relationships with our partners, and obtain new customers. We generally have not entered into employment or non-competition agreements with any of our employees and do not maintain key-man life insurance on the lives of any of our key personnel.
22
Our failure to successfully address the potential difficulties associated with our international operations could increase our costs of operation and negatively impact our revenue.
We are subject to many difficulties posed by doing business internationally, including:
- •
- foreign currency exchange fluctuations;
- •
- unanticipated changes in local regulation;
- •
- potentially adverse tax consequences, such as withholding taxes;
- •
- political and economic instability; and
- •
- reduced or limited protection of our intellectual property.
Because we anticipate that integrated circuit sales to companies that operate primarily outside the United States may account for a substantial portion of our revenue in future periods, the occurrence of any of these circumstances could significantly increase our costs of operation, delay the timing of our revenue and harm our profitability.
Any acquisitions we make could disrupt our business and harm our financial condition.
In the future, we may consider opportunities to acquire other businesses or technologies that would complement our current offerings, expand the breadth of our markets or enhance our technical capabilities. Acquisitions that we may do in the future will present a number of potential challenges that could, if not overcome, disrupt our business operations, substantially increase our operating expenses, negatively affect our operating results and cash flows and reduce the value to us of the acquired company or assets purchased, including:
- •
- uncertainty related to future revenues;
- •
- increased operating expenses and cost structure;
- •
- integration of the acquired employees, operations, technologies and products with our existing business and products;
- •
- focusing management's time and attention on our core business;
- •
- retention of business relationships with suppliers and customers of the acquired business;
- •
- entering markets in which we lack prior experience;
- •
- retention of key employees of the acquired business;
- •
- difficulties and delays in the further development, production, testing and marketing of the acquired technologies; and
- •
- amortization of intangible assets, write-offs, stock-based compensation and other charges relating to the acquired business and our acquisition costs.
Our failure to raise additional capital or generate the significant capital necessary to expand our operations and invest in new products could reduce our ability to compete and could harm our business.
We intend to continue spending substantial amounts to grow our business. In December 2011, we sold 43 United States patents and 30 related foreign patents in exchange for $35 million in cash. In December 2010, we completed an equity offering and issued approximately 5,000,000 shares of our common stock for approximately $20 million in net proceeds. Although we believe that we have access to capital sufficient to satisfy our working capital requirements for the foreseeable future, we may need to obtain additional financing to pursue our business strategy, develop new products, respond to
23
competition and market opportunities and acquire complementary businesses or technologies. We may not be able to obtain such financing on favorable terms or at all.
If we were to raise additional capital through sales of our equity securities, our stockholders would suffer dilution of their equity ownership. If we engage in debt financing, we may be required to accept terms that restrict our ability to incur additional indebtedness, prohibit us from paying dividends, repurchasing our stock or making investments, and force us to maintain specified liquidity or other ratios, any of which could harm our business, operating results and financial condition. If we need additional capital and cannot raise it on acceptable terms, we may not be able to, among other things:
- •
- develop or enhance our products;
- •
- continue to expand our product development and sales and marketing organizations;
- •
- acquire complementary technologies, products or businesses;
- •
- expand operations, in the United States or internationally;
- •
- hire, train and retain employees; or
- •
- respond to competitive pressures or unanticipated working capital requirements.
Our failure to do any of these things could seriously harm our ability to execute our business strategy and may force us to curtail our research and development plans or existing operations.
Provisions of our certificate of incorporation and bylaws or Delaware law might delay or prevent a change of control transaction and depress the market price of our stock.
Various provisions of our certificate of incorporation and bylaws might have the effect of making it more difficult for a third party to acquire, or discouraging a third party from attempting to acquire, control of our company. These provisions could limit the price that certain investors might be willing to pay in the future for shares of our common stock. Certain of these provisions eliminate cumulative voting in the election of directors, limit the right of stockholders to call special meetings and establish specific procedures for director nominations by stockholders and the submission of other proposals for consideration at stockholder meetings.
We are also subject to provisions of Delaware law which could delay or make more difficult a merger, tender offer or proxy contest involving our company. In particular, Section 203 of the Delaware General Corporation Law prohibits a Delaware corporation from engaging in any business combination with any interested stockholder for a period of three years unless specific conditions are met. Any of these provisions could have the effect of delaying, deferring or preventing a change in control, including without limitation, discouraging a proxy contest or making more difficult the acquisition of a substantial block of our common stock.
Under our certificate of incorporation, our board of directors may issue up to 20,000,000 shares of preferred stock without stockholder approval on such terms as the board might determine. The rights of the holders of common stock will be subject to, and might be adversely affected by, the rights of the holders of any preferred stock that might be issued in the future.
Our stockholder rights plan could prevent stockholders from receiving a premium over the market price for their shares from a potential acquirer.
We adopted a stockholder rights plan that generally entitles our stockholders to rights to acquire additional shares of our common stock when a third party acquires 15% of our common stock or commences or announces its intent to commence a tender offer for at least 15% of our common stock, other than for two stockholders and their affiliates as to whom this threshold is 20%. The plan also includes an exception to permit the acquisition of shares representing more than 15% of our common
24
stock by a brokerage firm that manages independent customer accounts and generally does not have any discretionary voting power with respect to such shares. This plan could delay, deter or prevent an investor from acquiring us in a transaction that could otherwise result in stockholders receiving a premium over the market price for their shares of common stock. Our intention is to maintain and enforce the terms of this plan, which could delay, deter or prevent an investor from acquiring us in a transaction that could otherwise result in stockholders receiving a premium over the market price for their shares of common stock.
Potential volatility of the price of our common stock could negatively affect your investment.
We cannot assure you that there will continue to be an active trading market for our common stock. Recently, the stock market, as well as our common stock, has experienced significant price and volume fluctuations. Market prices of securities of technology companies have been highly volatile and frequently reach levels that bear no relationship to the operating performance of such companies. These market prices generally are not sustainable and are subject to wide variations. If our common stock trades to unsustainably high levels, it is likely that the market price of our common stock will thereafter experience a material decline. In the past, our board of directors approved stock repurchase programs, and any future program could impact the price of our common stock and increase volatility.
In the past, securities class action litigation has often been brought against a company following periods of volatility in the market price of its securities. We could be the target of similar litigation in the future. Securities litigation could cause us to incur substantial costs, divert management's attention and resources, harm our reputation in the industry and the securities markets and negatively impact our operating results.
Item 1B. Unresolved Staff Comments
None.
Our principal administrative, sales, marketing, support and research and development functions are located in a leased facility in Santa Clara, California. We currently occupy approximately 47,000 square feet of space in the Santa Clara facility, the lease for which extends through August 2020. We have leased office space in Hyderabad, India for our engineering design center and in Tokyo, Japan, Hsinchu City, Taiwan and Shanghai, China for our sales and support offices. We believe that our existing facilities are adequate to meet our current needs.
We are not a party to any material legal proceeding which would have a material adverse effect on our consolidated financial position or results of operations. From time to time we may be subject to legal proceedings and claims in the ordinary course of business. These claims, even if not meritorious, could result in the expenditure of significant financial resources and diversion of management efforts.
Item 4. Mine Safety Disclosures
Not applicable.
25
Item 5. Market for Registrant's Common Equity, Related Stockholder Matters and Issuer Purchases of Equity Securities
Our common stock is listed on the Global Market of the NASDAQ Stock Market under the symbol MOSY. The following table sets forth the range of high and low sales prices of our common stock for each period indicated.
Quarter ended
|
High | Low | |||||
|---|---|---|---|---|---|---|---|
December 31, 2011 |
$ | 4.20 | $ | 2.77 | |||
September 30, 2011 |
$ | 5.83 | $ | 3.29 | |||
June 30, 2011 |
$ | 6.22 | $ | 5.07 | |||
March 31, 2011 |
$ | 6.58 | $ | 5.37 | |||
December 31, 2010 |
$ | 6.06 | $ | 4.01 | |||
September 30, 2010 |
$ | 5.23 | $ | 3.97 | |||
June 30, 2010 |
$ | 5.00 | $ | 3.63 | |||
March 31, 2010 |
$ | 5.09 | $ | 3.26 | |||
We had 31 stockholders of record as of March 1, 2012.
Dividend Policy
We have not declared or paid any cash dividends on our common stock and presently intend to retain future earnings, if any, to fund the development and growth of our business and, therefore, do not anticipate paying any cash dividends in the foreseeable future.
26
Stock Performance Graph
The following graph compares cumulative total stockholder return on our common stock with that of the S&P 500 Index and the S&P Technology Sector Index from 2006 through 2011. The comparison assumes that $100 was invested on December 31, 2006 in our common stock, the stocks included in the S&P 500 Index and the stocks included in the S&P Technology Sector Index. We have never paid any cash dividends to holders of our common stock.
The comparisons shown in the graph below are based upon historical data, and we caution that the stock price performance shown in the graph below is not indicative of, nor intended to forecast, the potential future performance of our common stock. Information used in the graph was obtained from Standard and Poor's website, a source believed to be reliable, but we are not responsible for any errors or omissions in such information.
Comparison of Five-Year Cumulative Return
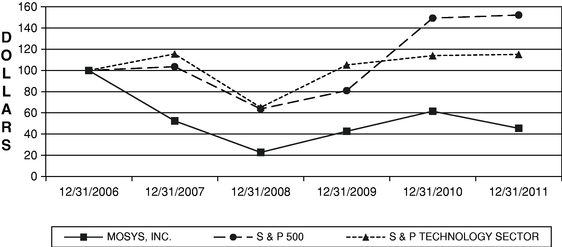
| |
12/31/2006 | 12/31/2007 | 12/31/2008 | 12/31/2009 | 12/31/2010 | 12/31/2011 | |||||||||||||
|---|---|---|---|---|---|---|---|---|---|---|---|---|---|---|---|---|---|---|---|
MOSYS, INC. |
$ | 100.00 | $ | 52.43 | $ | 22.70 | $ | 42.59 | $ | 61.51 | $ | 45.41 | |||||||
S & P 500 |
100.00 | 103.53 | 63.69 | 80.97 | 149.33 | 152.22 | |||||||||||||
S & P TECHNOLOGY SECTOR |
100.00 | 115.54 | 65.07 | 105.18 | 113.96 | 115.08 | |||||||||||||
Securities Authorized for Issuance under Equity Compensation Plan
For information regarding securities authorized for issuance under equity compensation plans, please refer to Item 12.—Security Ownership of Certain Beneficial Owners and Management and Related Stockholder Matters.
27
Item 6. Selected Financial Data
The selected financial data presented below is derived from our consolidated financial statements that are included under Item 8. The selected financial data should be read in conjunction with our consolidated financial statements and notes related to those statements and with "Management's Discussion and Analysis of Financial Condition and Results of Operations" included herein.
| |
Year Ended December 31, | |||||||||||||||
|---|---|---|---|---|---|---|---|---|---|---|---|---|---|---|---|---|
| |
2011(1) | 2010(2) | 2009(3) | 2008(4) | 2007(5) | |||||||||||
| |
(In thousands, except per share data) |
|||||||||||||||
Statement of Operations Data: |
||||||||||||||||
Total net revenue |
$ | 14,107 | $ | 15,563 | $ | 11,458 | $ | 14,026 | $ | 14,334 | ||||||
Cost of net revenue |
3,295 | 2,826 | 1,993 | 2,797 | 2,744 | |||||||||||
Gross profit |
10,812 | 12,737 | 9,465 | 11,229 | 11,590 | |||||||||||
Operating expenses |
(526 | ) | 35,925 | 29,468 | 31,925 | 25,180 | ||||||||||
Income (loss) from operations |
11,338 | (23,188 | ) | (20,003 | ) | (20,696 | ) | (13,590 | ) | |||||||
Other income and expense, net |
206 | 177 | 744 | 2,243 | 4,520 | |||||||||||
Income (loss) before income taxes |
11,544 | (23,011 | ) | (19,259 | ) | (18,453 | ) | (9,070 | ) | |||||||
Income tax provision (benefit) |
288 | 51 | (155 | ) | 132 | 25 | ||||||||||
Net income (loss) |
$ | 11,256 | $ | (23,062 | ) | $ | (19,104 | ) | $ | (18,585 | ) | $ | (9,095 | ) | ||
Net income (loss) per share: |
||||||||||||||||
Basic |
$ | 0.30 | $ | (0.72 | ) | $ | (0.61 | ) | $ | (0.59 | ) | $ | (0.28 | ) | ||
Diluted |
$ | 0.28 | $ | (0.72 | ) | $ | (0.61 | ) | $ | (0.59 | ) | $ | (0.28 | ) | ||
Shares used in computing net income (loss) per share: |
||||||||||||||||
Basic |
37,861 | 31,870 | 31,238 | 31,698 | 31,994 | |||||||||||
Diluted |
40,377 | 31,870 | 31,238 | 31,698 | 31,994 | |||||||||||
Allocation of stock-based compensation to cost of net revenue and operating expenses: |
||||||||||||||||
Cost of net revenue |
$ | 407 | $ | 309 | $ | 250 | $ | 405 | $ | 502 | ||||||
Research and development |
1,961 | 1,524 | 1,153 | 1,235 | 1,377 | |||||||||||
Selling, general and administrative |
1,398 | 1,465 | 1,651 | 3,103 | 2,461 | |||||||||||
|
$ | 3,766 | $ | 3,298 | $ | 3,054 | $ | 4,743 | $ | 4,340 | ||||||
| |
Year Ended December 31, | |||||||||||||||
|---|---|---|---|---|---|---|---|---|---|---|---|---|---|---|---|---|
| |
2011 | 2010 | 2009 | 2008 | 2007 | |||||||||||
| |
(In thousands) |
|||||||||||||||
Balance Sheet Data: |
||||||||||||||||
Cash, cash equivalents and investments |
$ | 57,975 | $ | 37,544 | $ | 40,436 | $ | 67,470 | $ | 78,654 | ||||||
Working capital |
47,968 | 27,246 | 25,628 | 43,304 | 66,262 | |||||||||||
Total assets |
89,637 | 73,966 | 75,543 | 85,933 | 98,797 | |||||||||||
Deferred revenue |
920 | 1,801 | 2,671 | 639 | 201 | |||||||||||
Long-term liabilities |
109 | 146 | 136 | — | — | |||||||||||
Stockholders' equity |
85,493 | 67,057 | 64,701 | 81,888 | 96,292 | |||||||||||
- (1)
- Operating
expenses include a gain on the sale of patents of $35.6 million and $2.6 million of amortization of acquired intangible assets.
- (2)
- Operating
expenses include $2.8 million of amortization of acquired intangible assets.
- (3)
- Operating
expenses include restructuring charges of $0.7 million and $1.5 million of amortization of acquired intangible assets.
- (4)
- Operating
expenses include restructuring charges of $1.3 million, impairment charges for acquired intangible assets of $1.4 million and
$0.7 million of amortization of acquired intangible assets.
- (5)
- Operating expenses include a $1.0 million charge for acquired in-process research and development and $0.4 million of amortization of acquired intangible assets.
28
Item 7. Management's Discussion and Analysis of Financial Condition and Results of Operations
This Management's Discussion and Analysis of Financial Condition and Results of Operations should be read in conjunction with the accompanying consolidated financial statements and notes included in this report.
Overview
Our strategy and primary business objective is to become a fabless semiconductor company focused on the development and sale of Bandwidth Engine integrated circuits (ICs) to networking equipment systems providers and their subsystem and component vendors. Our Bandwidth Engine family of ICs combines our 1T-SRAM high-density embedded memory and high-speed 10 Gigabits per second (Gbps) serial interface (I/O) technology with our intelligent access technology and a highly efficient interface protocol and is initially being marketed to networking systems companies. Bandwidth Engine ICs have been designed to increase system performance by using a serial I/O to increase the accesses per second between the processor and memory components in networking systems.
Since the beginning of 2010, we have invested an increasing amount of our financial and engineering resources towards the development of our Bandwidth Engine family of ICs. We shipped initial samples of our first Bandwidth Engine ICs to prospective customers in December 2010, and, in November 2011, we announced two design wins for low volume applications. Our future success and ability to achieve and maintain profitability will be dependent on our success in developing a market for our Bandwidth Engine ICs.
Historically, our primary business has been defining, designing, marketing and licensing differentiated embedded memory and high-speed parallel and serial interface intellectual property (IP) for advanced systems on chip (SoCs) designs. However, our competitiveness and the demand for our IP have declined since the beginning of 2011 as we have begun to dedicate more of our engineering and marketing resources to our IC efforts. We expect that this trend will continue as we place more emphasis on IC product sales as opposed to our IP transactions.
The 1T-SRAM is our high-density, high-performance patented memory solution that represents an alternative to traditional volatile embedded memory. Our I/O IP includes physical layer (PHY) circuitry that allows ICs to communicate with one another in the networking, storage, computer and consumer market segments. Our PHY IP supports serial interface technologies, such as 10 Gbps Base KR, XAUI, PCI Express and SATA, as well as parallel interfaces like DDR3. Our IP customers typically include fabless semiconductor companies, integrated device manufacturers (IDMs) and foundries.
As a result of our reduced licensing activities, we expect our licensing and royalty revenue to decrease in future periods. We do not expect to generate significant revenue from our Bandwidth Engine ICs until the second half of 2012 or later, and we believe that the growth in our IC revenues will not offset the decline in our IP revenues until at least 2013. Accordingly, we expect our losses from operations to increase in the near future.
Sources of Revenue
We currently generate two types of IP revenue: licensing and royalties.
Licensing. Licensing revenue consists of fees earned from license agreements, development services, prepaid pre-production royalties, and support and maintenance. Our license agreements involve long sales cycles, which make it difficult to predict when the agreements will be signed. In addition, our licensing revenue fluctuates from period to period, and it is difficult for us to predict the timing and magnitude of such revenue from quarter to quarter. Moreover, we believe that the amount of licensing revenue for any period is not necessarily indicative of results in any future period.
29
Our licensing revenue consists primarily of fees for providing circuit design, layout and design verification and granting licenses to customers that embed our technology into their products. License fees generally range from $100,000 to several million dollars per contract, depending on the scope and complexity of the development project, and the extent of the licensee's rights. The vast majority of our contracts allow for milestone billing based on work performed. Fees billed prior to revenue recognition are recorded as deferred revenue.
Royalty. Royalty revenue represents amounts earned under provisions in our memory licensing contracts that require our licensees to report royalties and make payments at a stated rate based on actual units manufactured or sold by licensees for products that include our memory IP. We recognize royalties in the quarter in which we receive the licensee's report.
Royalty-bearing license agreements provide for royalty payments at a stated rate. We negotiate royalty rates by taking into account such factors as the anticipated volume of the licensee's sales of products utilizing our technologies and the cost savings to be achieved by the licensee through the use of our technology. Our license agreements require the licensee to report the manufacture or sale of products that include our technology after the end of the quarter in which the sale or manufacture occurs.
As with our licensing revenue, the timing and level of royalties are difficult to predict. They depend on the licensee's ability to market, produce and sell products incorporating our technology. Many of the products of our licensees that are currently subject to licenses from us are used in consumer products, such as electronic game consoles, for which demand can be seasonal.
Critical Accounting Policies and Use of Estimates
Our consolidated financial statements are prepared in conformity with accounting principles generally accepted in the United States of America. Note 1 to the consolidated financial statements in Item 15 of this report describes the significant accounting policies and methods used in the preparation of our consolidated financial statements.
We have identified the accounting policies below as some of the more critical to our business and the understanding of our results of operations. These policies may involve estimates and judgments that affect the reported amounts of assets, liabilities, revenues and expenses. Although we believe our judgments and estimates are appropriate, actual future results may differ from our estimates, and if different assumptions or conditions were to prevail, the results could be materially different from our reported results.
Revenue Recognition
General
We generate revenue from the licensing of our IP, and customers pay fees for licensing, development services, royalties and maintenance and support. We recognize revenue when persuasive evidence of an arrangement exists, delivery or performance has occurred, the sales price is fixed or determinable, and collectibility is reasonably assured. Evidence of an arrangement generally consists of signed agreements. When sales arrangements contain multiple elements (e.g., license and services), we review each element to determine the separate units of accounting that exist within the agreement. If more than one unit of accounting exists, the consideration payable to us under the agreement is allocated to each unit of accounting using the relative fair value method. Revenue is recognized for each unit of accounting when the revenue recognition criteria have been met for that unit of accounting.
30
Licensing
Licensing revenue consists of fees earned from license agreements, development services and support and maintenance. For stand-alone license agreements or license deliverables in multi-deliverable arrangements that do not require significant development, modification or customization, revenue is recognized when all revenue recognition criteria have been met. Delivery of the licensed technology is typically the final revenue recognition criterion met, at which time revenue is recognized. If any of the criteria are not met, revenue recognition is deferred until such time as all criteria have been met.
For license agreements that include deliverables requiring significant production, modification or customization, and where we have significant experience in meeting the design specifications involved in the contract and the direct labor hours related to services under the contract can be reasonably estimated, we recognize revenue over the period in which the contract services are performed. For these arrangements, we recognize revenue using the percentage of completion method. Revenue recognized in any period is dependent on our progress toward completion of projects in progress. Significant management judgment and discretion are used to estimate total direct labor hours. These judgmental elements include determining that we have the experience to meet the design specifications and estimating the total direct labor hours. We follow this method because we can obtain reasonably dependable estimates of the direct labor hours to perform the contract services. The direct labor hours for the development of the licensee's design are estimated at the beginning of the contract. As these direct labor hours are incurred, they are used as a measure of progress towards completion. We have the ability to reasonably estimate the direct labor hours on a contract-by-contract basis based on our experience in developing prior licensees' designs. During the contract performance period, we review estimates of direct labor hours to complete the contracts as the contract progresses to completion and will revise our estimates of revenue and gross profit under the contract if we revise the estimations of the direct labor hours to complete. Our policy is to reflect any revision in the contract gross profit estimate in reported income or loss in the period in which the facts giving rise to the revision become known. Under the percentage of completion method, provisions for estimated losses on uncompleted contracts are recorded in the period in which such losses are determined to be likely. If the amount of revenue recognized under the percentage of completion accounting method exceeds the amount of billings to a customer, then the excess amount is recorded as an unbilled contracts receivable.
We provide support and maintenance under many of our license agreements. Under these arrangements, we provide unspecified upgrades, design rule changes and technical support. No other upgrades, products or other post-contract support are provided. Support and maintenance revenue is recognized at its fair value established by vendor-specific objective evidence, ratably over the period during which the obligation exists, typically 12 months. These arrangements are generally renewable annually by the customer.
Under limited circumstances, we also recognize prepaid pre-production royalties as license revenue. These are lump sum payments made when we enter into licensing agreements that cover future shipments of a product that is not commercially available from the licensee. We characterize such payments as license revenue because they are paid as part of the initial license fee and not with respect to products being produced by the licensee. These payments are non-cancelable and non-refundable.
Royalty
Our licensing contracts typically also provide for royalties based on licensees' use of our memory technology in their currently shipping commercial products. We recognize royalties in the quarter in which we receive the licensee's report. Under limited circumstances, we may also recognize prepaid post-production royalties as revenue upon execution of the contract, which are paid in a lump sum
31
after the licensee commences production of the royalty- bearing product and applied against future unit shipments regardless of the actual level of shipments by the licensee. The criteria for revenue recognition of prepaid royalties are that a formal agreement with the licensee is executed, no deliverables, development or support services related to prepaid royalties are required, the fees are non-refundable and not contingent upon future product shipments by the licensee, and the fees are payable by the licensee in a time period consistent with our normal billing terms. If any of these criteria are not met, we defer revenue recognition until such time as all criteria have been met.
Fair Value Measurements of Financial Instruments
We measure the fair value of financial instruments using a fair value hierarchy that prioritizes the inputs to valuation techniques used to measure fair value into three broad levels, as follows:
Level 1—Inputs used to measure fair value are unadjusted quoted prices that are available in active markets for the identical assets or liabilities as of the reporting date.
Level 2—Pricing is provided by third party sources of market information obtained from investment advisors rather than models. We do not adjust for or apply any additional assumptions or estimates to the pricing information we receive from advisors. Our Level 2 securities include cash equivalents and available-for-sale securities, which consisted primarily of corporate debt, and government agency and municipal debt securities from issuers with high quality credit ratings. Our investment advisors obtain pricing data from independent sources, such as Standard & Poor's, Bloomberg and Interactive Data Corporation, and rely on comparable pricing of other securities because the Level 2 securities we hold are not actively traded and have fewer observable transactions. We consider this the most reliable information available for the valuation of the securities.
Level 3—Unobservable inputs that are supported by little or no market activity and reflect the use of significant management judgment are used to measure fair value. These values are generally determined using pricing models for which the assumptions utilize management's estimates of market participant assumptions. The determination of fair value for Level 3 investments and other financial instruments involves the most management judgment and subjectivity.
Valuation of long-lived Assets
We evaluate our long-lived assets for impairment at least annually, or more frequently when a triggering event is deemed to have occurred. This assessment is subjective in nature and requires significant management judgment to forecast future operating results, projected cash flows and current period market capitalization levels. If our estimates and assumptions change in the future, it could result in a material write-down of long-lived assets. We amortize our finite-lived intangible assets, such as developed technology, patent license and workforce, on a straight-line basis over their estimated useful lives of one to seven years. We recognize an impairment charge as the difference between the net book value of such assets and the fair value of the assets on the measurement date.
Goodwill
We review goodwill for impairment on an annual basis or whenever events or changes in circumstances indicate the carrying value of an asset may not be recoverable. We use a two-step impairment test. In the first step, we compare the fair value of the reporting unit to its carrying value. The fair value of the reporting unit is determined using the market approach. If the fair value of the reporting unit exceeds the carrying value of the net assets of the reporting unit, goodwill is not impaired, and we are not required to perform further testing. If the carrying value of the net assets of the reporting unit exceeds the fair value of the reporting unit, then we must perform the second step in order to determine the implied fair value of the reporting unit's goodwill and compare it to the
32
carrying value of the reporting unit's goodwill. If the carrying value of a reporting unit's goodwill exceeds its implied fair value, then we must record an impairment charge equal to the difference. We have determined that we have a single reporting unit for purposes of performing our goodwill impairment test. As we use the market approach to assess impairment, the price of our common stock is an important component of the fair value calculation. If our stock price continues to experience significant price and volume fluctuations, this will impact the fair value of the reporting unit, which can lead to potential impairment in future periods. As of December 31, 2011, we had not identified any factors to indicate there was an impairment of our goodwill and determined that no additional impairment analysis was required.
Deferred tax valuation allowance
When we prepare our consolidated financial statements, we estimate our income tax liability for each of the various jurisdictions where we conduct business. This requires us to estimate our actual current tax exposure and to assess temporary differences that result from differing treatment of certain items for tax and accounting purposes. These differences result in deferred tax assets, which we show on our consolidated balance sheet under the category of other current assets. The net deferred tax assets are reduced by a valuation allowance if, based upon weighted available evidence, it is more likely than not that some or all of the deferred tax assets will not be realized. We must make significant judgments to determine our provision for income taxes, our deferred tax assets and liabilities and any valuation allowance to be recorded against our net deferred tax asset.
Stock-based compensation
We recognize stock-based compensation for equity awards on a straight-line basis over the requisite service period, usually the vesting period, based on the grant-date fair value. We estimate the value of employee stock options on the date of grant using the Black-Scholes model. The determination of fair value of share-based payment awards on the date of grant using an option- pricing model is affected by our stock price as well as assumptions regarding a number of highly complex and subjective variables. These variables include, but are not limited to, the expected stock price volatility over the term of the awards, and actual and projected employee stock option exercise behaviors. The expected term of options granted is derived from historical data on employee exercises and post-vesting employment termination behavior. The expected volatility is based on the historical volatility of our stock price.
Results of Operations
Net Revenue.
| |
Year ended December 31, | Year-Over-Year Change | ||||||||||||||||||||
|---|---|---|---|---|---|---|---|---|---|---|---|---|---|---|---|---|---|---|---|---|---|---|
| |
2011 | 2010 | 2009 | 2010 to 2011 | 2009 to 2010 | |||||||||||||||||
| |
(dollar amounts in thousands) |
|||||||||||||||||||||
Licensing |
$ | 5,987 | $ | 6,468 | $ | 3,476 | $ | (481 | ) | (7 | )% | $ | 2,992 | 86 | % | |||||||
Percentage of total net revenue |
42 | % | 42 | % | 30 | % | ||||||||||||||||
Licensing revenue decreased $0.5 million in 2011 due to a decline in the number and value of new license agreements. Licensing revenue in 2011 included revenue recognized from the achievement of final milestones for two 1T-SRAM technology license agreements executed in the fourth quarter of 2009. We expect our licensing revenue to decrease in 2012 as we will not be pursuing new IP licenses, and the Company's sales and marketing personnel will be focusing on selling Bandwidth Engine ICs.
The $3.0 million increase in licensing revenue in 2010 compared with 2009 resulted primarily from increased licensing activity in the fourth quarter of 2009 involving license agreements that required significant customization. Consequently, revenue under those agreements was recognized in 2010 in
33
accordance with our revenue recognition accounting policies. We also signed a technology agreement with a major Japanese IDM customer in the second quarter of 2010, which contributed to the revenue growth.
| |
Year ended December 31, | Year-Over-Year Change | ||||||||||||||||||||
|---|---|---|---|---|---|---|---|---|---|---|---|---|---|---|---|---|---|---|---|---|---|---|
| |
2011 | 2010 | 2009 | 2010 to 2011 | 2009 to 2010 | |||||||||||||||||
| |
(dollar amounts in thousands) |
|||||||||||||||||||||
Royalty |
$ | 8,120 | $ | 9,095 | $ | 7,982 | $ | (975 | ) | (11 | )% | $ | 1,113 | 14 | % | |||||||
Percentage of total net revenue |
58 | % | 58 | % | 70 | % | ||||||||||||||||
Royalty revenue decreased $1.0 million in 2011 primarily due to a decrease in shipments by an IDM licensee whose product is used in the Nintendo Wii® game console, although we did experience an increase in royalties received from TSMC, a major foundry partner, and from another licensee due to higher manufacturing volumes for their products. We expect royalty revenues to decrease in 2012, primarily due to reduced shipments by the IDM licensee, as the Nintendo Wii game console is expected to be replaced in 2012 by a new console that does not incorporate our technology.
Royalty revenue increased $1.1 million in 2010 primarily due to an increase in royalties received from TSMC, and a fabless semiconductor company resulting from higher manufacturing volumes for their products. These increases were partially offset by a decrease in shipments by an IDM licensee whose product is used in the Nintendo Wii game console, as well as decreased royalties received from licensees with products incorporating older generation technologies, such as 1.80 micron and 1.30 micron fabrication processes, which are approaching end of product life.
Cost of Net Revenue and Gross Profit.
| |
Year ended December 31, | Year-Over-Year Change | ||||||||||||||||||||
|---|---|---|---|---|---|---|---|---|---|---|---|---|---|---|---|---|---|---|---|---|---|---|
| |
2011 | 2010 | 2009 | 2010 to 2011 | 2009 to 2010 | |||||||||||||||||
| |
(dollar amounts in thousands) |
|||||||||||||||||||||
Cost of net revenue |
$ | 3,295 | $ | 2,826 | $ | 1,993 | $ | 469 | 17 | % | $ | 833 | 42 | % | ||||||||
Percentage of total net revenue |
23 | % | 18 | % | 17 | % | ||||||||||||||||
| |
Year ended December 31, | Year-Over-Year Change | ||||||||||||||||||||
|---|---|---|---|---|---|---|---|---|---|---|---|---|---|---|---|---|---|---|---|---|---|---|
| |
2011 | 2010 | 2009 | 2010 to 2011 | 2009 to 2010 | |||||||||||||||||
| |
(dollar amounts in thousands) |
|||||||||||||||||||||
Gross profit |
$ | 10,812 | $ | 12,737 | $ | 9,465 | $ | (1,925 | ) | (15 | )% | $ | 3,272 | 35 | % | |||||||
Percentage of total net revenue |
77 | % | 82 | % | 83 | % | ||||||||||||||||
Cost of net revenue consists of personnel costs for engineers assigned to revenue-generating licensing arrangements and related overhead allocation costs. Direct labor hours are tracked for each licensing arrangements and are used to measure the progress of completion.
Cost of net revenue increased in 2011 primarily due to two 1T-SRAM projects that were substantially completed in the fourth quarter of 2011 in which we expensed $1.2 million of previously capitalized deferred costs. Cost of net revenue in 2011 included stock-based compensation expense of $0.4 million, an increase of $0.1 million compared with 2010. Total gross profit decreased to $10.8 million in 2011 primarily due to the lower margin contribution from the two 1T-SRAM projects and the decrease in royalty revenues. We expect that the cost of licensing revenue will decrease in absolute dollars in the future because we anticipate entering into fewer license agreements. We expect cost as a percentage of total net revenue to increase as we begin to generate revenues more from the sale of ICs rather than the licensing of IP.
The increase in cost of net revenue for 2010 compared with 2009 resulted primarily from an increase in the number of licensing contracts requiring customization. Cost of net revenue in 2010 included stock-based compensation expense of $0.3 million, which was consistent with the prior year. Total gross profit increased to $12.7 million in 2010 primarily due to an increase in license and royalty revenues.
34
Research and Development.
| |
Year ended December 31, | Year-Over-Year Change | ||||||||||||||||||||
|---|---|---|---|---|---|---|---|---|---|---|---|---|---|---|---|---|---|---|---|---|---|---|
| |
2011 | 2010 | 2009 | 2010 to 2011 | 2009 to 2010 | |||||||||||||||||
| |
(dollar amounts in thousands) |
|||||||||||||||||||||
Research and development |
$ | 26,216 | $ | 25,534 | $ | 19,255 | $ | 682 | 3 | % | $ | 6,279 | 33 | % | ||||||||
Percentage of total net revenue |
186 | % | 164 | % | 168 | % | ||||||||||||||||
Our research and development expenses include development and design of variations of our 1T-SRAM and I/O technologies for use in different manufacturing processes used by licensees, costs related to the development of the Bandwidth Engine IC and amortization of technology-based intangible assets. In 2009, we incurred costs of $0.4 million, related to our former analog/mixed-signal product lines, which we exited in late 2008. We expense research and development costs as they are incurred.
The $0.7 million increase in 2011 was primarily due to increases in license costs for our CAD software tools, costs related to the development of our Bandwidth Engine IC and stock-based compensation charges, offset by a decrease in acquisition-related contingent compensation charges.
The $6.3 million increase in 2010 was primarily due to our expanded engineering team working on our I/O and Bandwidth Engine IC products, mask tooling and other fabrication costs, increased amortization costs related to acquired intangible assets and increased costs for our CAD software tools.
Research and development expenses included stock-based compensation expense of $2.0 million, $1.5 million and $1.2 million for the years ended December 31, 2011, 2010 and 2009, respectively. We expect that research and development expenses will remain flat or decrease slightly in absolute dollars, but will increase as a percentage of total revenue as our IP revenues decline faster than our IC revenues ramp. The primary driver of research and development expense will be our continued investment in our current and next generation Bandwidth Engine IC products.
Selling, General and Administrative.
| |
Year ended December 31, | Year-Over-Year Change | ||||||||||||||||||||
|---|---|---|---|---|---|---|---|---|---|---|---|---|---|---|---|---|---|---|---|---|---|---|
| |
2011 | 2010 | 2009 | 2010 to 2011 | 2009 to 2010 | |||||||||||||||||
| |
(dollar amounts in thousands) |
|||||||||||||||||||||
Selling, general and administrative |
$ | 8,869 | $ | 10,391 | $ | 9,507 | $ | (1,522 | ) | (15 | )% | $ | 884 | 9 | % | |||||||
Percentage of total net revenue |
63 | % | 67 | % | 83 | % | ||||||||||||||||
Selling, general and administrative expenses consist primarily of personnel and related overhead costs for sales, marketing, application engineering, finance, human resources and general management.
The $1.5 million decrease for 2011 was primarily due to a decrease in personnel-related, acquisition-related and consulting costs.
The $0.9 million increase for 2010 was primarily due to an increase in legal, marketing and personnel-related costs.
Selling, general and administrative expenses included stock-based compensation expense of $1.4 million, $1.5 million and $1.7 million for the years ended December 31, 2011, 2010 and 2009, respectively. We expect total selling, general and administrative expenses to remain flat or slightly decrease in absolute dollars, but increase as a percentage of revenues as our IP revenues decline faster than our IC revenues ramp.
35
Gain on Sale of Patents.
| |
Year ended December 31, | Year-Over-Year Change | ||||||||||||||||||||
|---|---|---|---|---|---|---|---|---|---|---|---|---|---|---|---|---|---|---|---|---|---|---|
| |
2011 | 2010 | 2009 | 2010 to 2011 | 2009 to 2010 | |||||||||||||||||
| |
(dollar amounts in thousands) |
|||||||||||||||||||||
Gain on sale of patents |
$ | 35,611 | $ | — | $ | — | $ | 35,611 | 100 | % | $ | — | — | |||||||||
Percentage of total net revenue |
252 | % | — | — | ||||||||||||||||||
In December 2011, we entered into a patent purchase agreement for the sale of 43 United States and 30 related foreign memory technology patents for $35.0 million in cash. We recognized a $35.6 million gain on this transaction, which has been recorded as a reduction of operating expenses in the consolidated statements of operations. The gain was comprised of the $35.0 million of proceeds, plus $0.8 million, which we determined to be the value of our retained license to these patents, net of transaction costs.
Other Income and Expense, net.
| |
Year ended December 31, | Year-Over-Year Change | ||||||||||||||||||||
|---|---|---|---|---|---|---|---|---|---|---|---|---|---|---|---|---|---|---|---|---|---|---|
| |
2011 | 2010 | 2009 | 2010 to 2011 | 2009 to 2010 | |||||||||||||||||
| |
(dollar amounts in thousands) |
|||||||||||||||||||||
Other income and expense, net |
$ | 206 | $ | 177 | $ | 744 | $ | 29 | 16 | % | $ | (567 | ) | (76 | )% | |||||||
Percentage of total net revenue |
1 | % | 1 | % | 6 | % | ||||||||||||||||
Other income and expense, net primarily consisted of interest income on our investments, which was $0.1 million, $0.3 million and $0.9 million for the years ended December 31, 2011, 2010 and 2009, respectively. Interest income declined by $0.2 million in 2011 and $0.6 million in 2010 primarily due to lower average investment balances and lower interest rates earned.
Income Tax Provision (Benefit).
| |
Year ended December 31, | Year-Over-Year Change | ||||||||||||||||||||
|---|---|---|---|---|---|---|---|---|---|---|---|---|---|---|---|---|---|---|---|---|---|---|
| |
2011 | 2010 | 2009 | 2010 to 2011 | 2009 to 2010 | |||||||||||||||||
| |
(dollar amounts in thousands) |
|||||||||||||||||||||
Income tax provision (benefit) |
$ | 288 | $ | 51 | $ | (155 | ) | $ | 237 | 465 | % | $ | 206 | 133 | % | |||||||
Percentage of total net revenue |
2 | % | — | 1 | % | |||||||||||||||||
Our 2011 income tax provision was attributable to the federal alternative minimum tax, as we were profitable in 2011, and foreign jurisdictions. Our 2010 income tax provision was primarily attributable to foreign jurisdictions. Our 2009 income tax benefit was primarily attributable to U.S. federal refundable tax credits.
As of December 31, 2011, we had net operating loss carryforwards of approximately $52.7 million for U.S. federal income tax purposes and approximately $62.0 million for state income tax purposes that are available to reduce future income tax liabilities to the extent permitted under federal and state income tax laws. The federal net operating loss carryforwards expire from 2027 to 2030, and state net operating loss carryforwards expire from 2017 to 2030. In 2012, we anticipate that our effective income tax rate will continue to be less than the federal statutory tax rate because of expected losses.
As of December 31, 2011 and 2010, we had net deferred tax assets of approximately $32.4 million and $35.0 million, respectively. Because of uncertainties regarding the realization of deferred tax assets, we had recorded a full valuation allowance as of December 31, 2011 and 2010.
36
Liquidity and Capital Resources
As of December 31, 2011, we had cash, cash equivalents and investments totaling $58 million compared with a combined balance of $37.5 million at December 31, 2010. Our principal source of cash in 2011 was the sale of patents for $35 million in December 2011. In December 2010, we sold approximately 5 million shares of common stock in a registered direct equity offering, raising approximately $20 million, net of transaction expenses of approximately $0.1 million. The offering was made under our existing $50 million shelf registration statement that became effective in November 2010. Our primary capital requirements are to fund working capital, including development of Bandwidth Engine ICs, and any acquisitions that we make that require cash consideration or expenditures.
In 2011, we used $15.7 million in operating activities, which primarily resulted from the net income of $11.3 million and $1.3 million generated from changes in operating assets and liabilities, reduced by the $35.6 million gain on the sale of patents and adjusted for non-cash charges consisting of stock-based compensation of $3.8 million and depreciation and amortization of $3.7 million. The changes in assets and liabilities primarily related to the timing of billing our customers, collection of receivables and payments to vendors.
In 2010, we used $15.6 million in operating activities, which primarily resulted from the net loss of $23.1 million, partially offset by non-cash charges consisting of stock-based compensation expense of $3.3 million, depreciation and amortization of $3.8 million and $0.4 million generated from changes in operating assets and liabilities. The changes in assets and liabilities primarily related to the timing of billing our customers, collection of receivables and payments to vendors.
In 2009, we used net cash of $11.7 million in operating activities. Primarily, that amount reflected the net effects of our net loss of $19.1 million, adjusted for $1.9 million generated from changes in operating assets and liabilities, net of the acquisition of Prism Circuits, non-cash charges, including stock-based compensation expense of $3.1 million, amortization of intangible assets of $1.5 million, depreciation and amortization of $0.9 million and a non-cash restructuring charge of $0.1 million. The changes in assets and liabilities primarily related to the timing of billing our customers, collection of receivables and payments to vendors.
Additional cash uses in 2011 included the payment of $1.5 million in deferred consideration for the MagnaLynx acquisition in 2010 and the purchase of $0.3 million of fixed assets.
Our investing activities in 2010 included business acquisition payments of $7.9 million, of which $4.6 million related to a contingent payment related to the acquisition of Prism Circuits and $3.3 million related to the acquisition of MagnaLynx in the first quarter of 2010. In 2010, we purchased $1.4 million of fixed assets. Remaining investing activities consisted of investing our cash in marketable securities.
Our investing activities in 2009 included a net payment of $13.6 million for the acquisition of Prism Circuits and $1.1 million for purchases of fixed assets during 2009.
Our financing activities in 2011 primarily consisted of proceeds from the exercise of stock options. Our cash from financing activities in 2010 consisted of the proceeds of our registered direct offering of common stock and proceeds from the exercise of stock options. Cash used in financing activities in 2009 consisted of $0.9 million used for stock repurchases under our repurchase program prior to its suspension in February 2009.
Our future liquidity and capital requirements are expected to vary from quarter to quarter, depending on numerous factors, including:
- •
- level and timing of licensing, royalty and IC product revenue;
37
- •
- cost, timing and success of technology development efforts, including meeting customer design specifications;
- •
- fabrication costs, including mask costs of our Bandwidth Engine ICs, currently under development;
- •
- variations in manufacturing yields, materials costs and other manufacturing risks;
- •
- costs of acquiring other businesses and integrating the acquired operations; and
- •
- profitability of our business.
We expect our cash expenditures to continue to exceed receipts in 2012 as we will generate minimal revenue from IC sales and expect reduced licensing and royalty revenues compared with 2011, and we will continue our research and development efforts for the expansion and fabrication of the Bandwidth Engine IC product line. We believe our existing cash, cash equivalents and investments, along with our existing capital and cash generated from operations, if any, to be sufficient to meet our capital requirements for the foreseeable future. Should our cash resources prove inadequate, we may seek additional funding through public or private equity or debt financing, and have a shelf registration allowing us to sell up to approximately $30 million of our securities from time to time until November 2013. We also might decide to raise additional capital at such times and upon such terms as management considers favorable and in our interests, including, but not limited to, from the sale of our debt and/or equity securities under our existing shelf registration statement. There can be no assurance that such additional funding will be available to us on favorable terms, if at all. The failure to raise capital when needed could have a material adverse effect on our business and financial condition.
Disclosures about Contractual Obligations and Commercial Commitments
The impact that our contractual obligations as of December 31, 2011 are expected to have on our liquidity and cash flow in future periods is as follows:
| |
Payment Due by Period | |||||||||||||||
|---|---|---|---|---|---|---|---|---|---|---|---|---|---|---|---|---|
| |
Total | Less than 1 year | 1-3 years | 3-5 years | More than 5 years | |||||||||||
Operating leases |
$ | 6,406 | $ | 837 | $ | 1,546 | $ | 1,366 | $ | 2,657 | ||||||
Purchase commitments |
3,349 | 3,299 | 50 | — | — | |||||||||||
Capital leases |
153 | 153 | — | — | — | |||||||||||
|
$ | 9,908 | $ | 4,289 | $ | 1,596 | $ | 1,366 | $ | 2,657 | ||||||
As of December 31, 2011, we had purchase commitments of $3.1 million for licenses related to computer-aided design tools payable through January 2013, $0.2 million in other purchase commitments and $0.2 million in capital lease obligations for testing equipment. In July 2010, we entered into a 10 year operating lease agreement for approximately 47,000 square feet with Mission West Properties, Inc. for our corporate headquarters in Santa Clara, California.
Off-Balance Sheet Arrangements
We do not maintain any off-balance sheet arrangements or obligations that are reasonably likely to have a material current or future effect on our financial condition, results of operations, liquidity or capital resources.
Indemnifications
In the ordinary course of business, we enter into contractual arrangements under which we may agree to indemnify the counter-party from losses relating to a breach of representations and warranties,
38
a failure to perform certain covenants, or claims and losses arising from certain external events as outlined within the particular contract, which may include, for example, losses arising from litigation or claims relating to past performance. Such indemnification clauses may not be subject to maximum loss clauses. We have also entered into indemnification agreements with our officers and directors. No material amounts are reflected in our consolidated financial statements for 2011, 2010 or 2009 related to these indemnifications.
Recent Accounting Pronouncements
See Note 1 to the Consolidated Financial Statements for a full description of recent accounting pronouncements including the respective expected dates of adoption and effects on results of operations and financial condition.
Item 7A. Quantitative and Qualitative Disclosures About Market Risk
Interest rate risk
We have exposure to interest rate risk due to our investment portfolio. Our investments are made in accordance with an investment policy approved by our board of directors. The primary objective of our investment activities is to preserve principal and meet liquidity needs. To achieve this objective, we maintain our portfolio of cash equivalents and short-term and long-term investments in a variety of securities, including U.S. government agency debt, municipal notes, corporate notes and bonds, and money market funds. We place our investments with high-credit quality issuers and, by policy, limit the amount of credit exposure with any one issuer or fund.
The investments, other than money market funds, are classified as available-for-sale and are recorded on the balance sheet at fair value with unrealized gains and losses reported as a separate component of accumulated other comprehensive income. Securities with an original maturity of three months or less are considered cash equivalents. Securities with original maturities greater than three months and remaining maturities less than one year are classified as short-term investments. Securities with remaining maturities greater than one year are classified as long-term investments. All investments have a maturity of less than two years. No single security should exceed 5% of the portfolio at the time of purchase. The portfolio's dollar-weighted average maturity of investments is within 12 months. These securities, which approximated $21.0 million as of December 31, 2011 and earned an average annual interest rate of approximately 0.5% in 2011, are subject to interest rate and credit risks. As of December 31, 2011, we performed a sensitivity analysis on our investment portfolio. According to our analysis, parallel shifts in the yield curve of both +/- 0.5% would result in changes in fair market values for these investments of approximately $0.1 million. We do not have any investments denominated in foreign currencies, and therefore are not subject to foreign currency risk on such investments.
Foreign currency exchange rate risk
Currently, all of our international sales are denominated in U.S. dollars and, as a result, we have not experienced significant foreign exchange gains or losses to date. However, the expenses of our foreign subsidiaries are denominated in their local currencies, therefore we have risk of foreign exchange gains and losses through the funding of those expenditures. We do not currently enter into forward exchange contracts to hedge exposures denominated in foreign currencies or any other derivative financial instruments for trading or speculative purposes. However, in the event our exposure to foreign currency risk increases, we may choose to hedge those exposures. For most currencies, we are a net payer of foreign currencies and, therefore, benefit from a stronger U.S. dollar and are adversely affected by a weaker U.S. dollar relative to those foreign currencies.
39
Item 8. Financial Statements and Supplementary Data
Reference is made to the financial statements listed under the heading (a) (1) Financial Statements and Reports of Burr Pilger Mayer, Inc. of Item 15, which financial statements are incorporated by reference in response to this Item 8.
Quarterly Results of Operations
The following tables set forth unaudited results of operations data for each of the eight quarters in the two year period ended December 31, 2011. This unaudited information has been prepared on a basis consistent with our audited financial statements appearing elsewhere in this report and, in the opinion of our management, includes all adjustments, consisting only of normal recurring adjustments, except as disclosed below, necessary for a fair presentation of the information for the periods presented. The unaudited quarterly information should be read in conjunction with the financial statements and notes included elsewhere in this report.
| |
Dec. 31, 2011 |
Sep. 30, 2011 |
Jun. 30, 2011 |
Mar. 31, 2011 |
Dec. 31, 2010 |
Sep. 30, 2010 |
Jun. 30, 2010 |
Mar. 31, 2010 |
|||||||||||||||||
|---|---|---|---|---|---|---|---|---|---|---|---|---|---|---|---|---|---|---|---|---|---|---|---|---|---|
| |
(In thousands, except per share data) |
||||||||||||||||||||||||
| |
(Unaudited—All periods) |
||||||||||||||||||||||||
Net revenue: |
|||||||||||||||||||||||||
Licensing |
$ | 2,668 | $ | 756 | $ | 1,216 | $ | 1,347 | $ | 1,408 | $ | 1,494 | $ | 2,019 | $ | 1,547 | |||||||||
Royalty |
2,501 | 1,351 | 2,076 | 2,192 | 2,560 | 2,282 | 2,250 | 2,003 | |||||||||||||||||
Total net revenue |
5,169 | 2,107 | 3,292 | 3,539 | 3,968 | 3,776 | 4,269 | 3,550 | |||||||||||||||||
Cost of net revenue: |
|||||||||||||||||||||||||
Licensing |
1,780 | 356 | 469 | 690 | 768 | 735 | 541 | 782 | |||||||||||||||||
Total cost of net revenue |
1,780 | 356 | 469 | 690 | 768 | 735 | 541 | 782 | |||||||||||||||||
Gross profit |
3,389 | 1,751 | 2,823 | 2,849 | 3,200 | 3,041 | 3,728 | 2,768 | |||||||||||||||||
Operating expenses: |
|||||||||||||||||||||||||
Research and development |
6,847 | 6,648 | 6,566 | 6,155 | 6,078 | 6,779 | 6,704 | 5,973 | |||||||||||||||||
Selling, general and administrative |
2,286 | 1,952 | 1,917 | 2,714 | 2,850 | 2,435 | 2,508 | 2,598 | |||||||||||||||||
Gain on sale of patents |
(35,611 | ) | — | — | — | — | — | — | — | ||||||||||||||||
Total operating expenses |
(26,478 | ) | 8,600 | 8,483 | 8,869 | 8,928 | 9,214 | 9,212 | 8,571 | ||||||||||||||||
Operating income (loss) |
29,867 | (6,849 | ) | (5,660 | ) | (6,020 | ) | (5,728 | ) | (6,173 | ) | (5,484 | ) | (5,803 | ) | ||||||||||
Other income and expense, net |
162 | 10 | 25 | 9 | (23 | ) | 8 | 83 | 109 | ||||||||||||||||
Income (loss) before income taxes |
30,029 | (6,839 | ) | (5,635 | ) | (6,011 | ) | (5,751 | ) | (6,165 | ) | (5,401 | ) | (5,694 | ) | ||||||||||
Income tax provision (benefit) |
229 | 24 | 17 | 18 | (40 | ) | 33 | 26 | 32 | ||||||||||||||||
Net income (loss) |
$ | 29,800 | $ | (6,863 | ) | $ | (5,652 | ) | $ | (6,029 | ) | $ | (5,711 | ) | $ | (6,198 | ) | $ | (5,427 | ) | $ | (5,726 | ) | ||
Net income (loss) per share: |
|||||||||||||||||||||||||
Basic |
$ | 0.78 | $ | (0.18 | ) | $ | (0.15 | ) | $ | (0.16 | ) | $ | (0.17 | ) | $ | (0.19 | ) | $ | (0.17 | ) | $ | (0.18 | ) | ||
Diluted |
$ | 0.75 | $ | (0.18 | ) | $ | (0.15 | ) | $ | (0.16 | ) | $ | (0.17 | ) | $ | (0.19 | ) | $ | (0.17 | ) | $ | (0.18 | ) | ||
Shares used in computing net income (loss) per share: |
|||||||||||||||||||||||||
Basic |
38,353 | 38,090 | 37,738 | 37,264 | 33,130 | 31,946 | 31,636 | 31,262 | |||||||||||||||||
Diluted |
39,765 | 38,090 | 37,738 | 37,264 | 33,130 | 31,946 | 31,636 | 31,262 | |||||||||||||||||
Item 9. Changes in and Disagreements with Accountants on Accounting and Financial Disclosure
None.
40
Item 9A. Controls and Procedures
Evaluation of Disclosure Controls and Procedures
Under the supervision and with the participation of our management, including our Chief Executive Officer and Chief Financial Officer, we conducted an evaluation of the effectiveness of the design and operation of our disclosure controls and procedures, as defined in Rules 13a-15(e) and 15d-15(e) under the Securities Exchange Act of 1934. Based on this evaluation, our management concluded that as of December 31, 2011, our disclosure controls and procedures were effective.
Management's Annual Report on Internal Control over Financial Reporting
Our management is responsible for establishing and maintaining adequate internal control over financial reporting, as such term is defined in Rules 13a-15(f) and 15d-15(f) under the Securities Exchange Act of 1934. In designing and evaluating the disclosure controls and procedures, management recognizes that any controls and procedures, no matter how well designed and operated, can provide only reasonable assurance of achieving the desired control objectives and management necessarily is required to apply its judgment in evaluating the cost-benefit relationship of possible controls. Under the supervision and with the participation of our management, including our Chief Executive Officer and Chief Financial Officer, we conducted an evaluation of the effectiveness of our internal control over financial reporting based on the framework in Internal Control—Integrated Framework issued by the Committee of Sponsoring Organizations of the Treadway Commission. Based on the evaluation, our management concluded that our internal control over financial reporting was effective as of December 31, 2011.
Burr Pilger Mayer, Inc., an independent registered public accounting firm, has issued an attestation report on our internal control over financial reporting as of December 31, 2011, as stated in their report, which is included under Item 15 below.
Changes in Internal Control over Financial Reporting
There were no changes in our internal control over financial reporting during the fourth fiscal quarter of 2011 that have materially affected, or are reasonably likely to materially affect, our internal control over financial reporting.
None.
41
Item 10. Directors, Executive Officers and Corporate Governance
Information regarding our directors and corporate governance will be presented in our definitive proxy statement for our 2012 Annual Meeting of Stockholders to be held on or about June 5, 2012, which information is incorporated into this report by reference. However, certain information regarding current executive officers found under the heading "Executive Officers" in Item 1 of Part I hereof is also incorporated by reference in response to this Item 10.
We have adopted a code of ethics that applies to all of our employees. The code of ethics is designed to deter wrongdoing and to promote, among other things, honest and ethical conduct, full, fair, accurate, timely, and understandable disclosures in reports and documents submitted to the SEC and other public communications, compliance with applicable governmental laws, rules and regulations, the prompt internal reporting of violations of the code to an appropriate person or persons identified in the code and accountability for adherence to such code.
The code of ethics is available on our website, www.mosys.com. If we make any substantive amendments to the code of ethics or grant any waiver, including any implicit waiver, from a provision of the code to our Chief Executive Officer or Chief Financial Officer, or persons performing similar functions, where such amendment or waiver is required to be disclosed under applicable SEC rules, we intend to disclose the nature of such amendment or waiver on our website.
Item 11. Executive Compensation
Information required to be provided in response to this item will be presented in our definitive proxy statement for our 2012 Annual Meeting of Stockholders to be held on or about June 5, 2012, which information is incorporated into this report by reference.
Item 12. Security Ownership of Certain Beneficial Owners and Management and Related Stockholder Matters
Information required to be provided in response to this item, including information relating to securities authorized for issuance under equity compensation plans, will be presented in our definitive proxy statement for our 2012 Annual Meeting of Stockholders to be held on or about June 5, 2012, which information is incorporated into this report by reference.
Item 13. Certain Relationships and Related Transactions, and Director Independence
Information required to be provided in response to this item will be presented in our definitive proxy statement for our 2012 Annual Meeting of Stockholders to be held on or about June 5, 2012, which information is incorporated into this report by reference.
Item 14. Principal Accountant Fees and Services
Information required to be provided in response to this item will be presented in our definitive proxy statement for our 2012 Annual Meeting of Stockholders to be held on or about June 5, 2012, which information is incorporated into this report by reference.
42
Item 15. Exhibits and Financial Statement Schedules
- (a)
- The
following documents are filed as part of this report:
- (1)
- Financial Statements and Reports of Independent Registered Public Accounting Firm, which are set forth in the Index to Consolidated Financial Statements on pages 38 through 66 of this report.
- (2)
- Financial
Statement Schedule—Schedule II—Valuation and Qualifying Accounts
- (3)
- Exhibits
| 2.1(1) | Agreement and Plan of Merger by and among MoSys, Inc., MLI Merger Corporation, MagnaLynx, Inc., and the Representative of the Shareholders of MagnaLynx, Inc. dated as of March 24, 2010 | |
| 3.1(2) | Restated Certificate of Incorporation of the Registrant | |
| 3.2(3) | Amended and Restated Bylaws of the Registrant | |
| 4.1(4) | Specimen common stock certificate | |
| 4.4(5) | Rights Agreement, dated November 10, 2010, by and between the Company and Wells Fargo Bank, N.A., as Rights Agent | |
| 4.4.1(5) | Form of Right Certificate | |
| 4.4.2(5) | Summary of Rights to Purchase Preferred Shares | |
| 4.4.3(6) | Amendment No. 1 to Rights Agreement, dated July 22, 2011, by and between the Registrant and Wells Fargo Bank, N.A., as Rights Agent | |
| 10.1(4) | Form of Indemnity Agreement between the Registrant and each of its directors and executive officers | |
| 10.2(7)* | Form of Restricted Stock Purchase Agreement | |
| 10.3(8)* | 2000 Stock Option Plan and form of Option Agreement thereunder | |
| 10.3.1(9)* | Amended and Restated 2000 Stock Option and Equity Incentive Plan | |
| 10.4(10)* | Form of Stock Option Agreement pursuant to Amended and Restated 2000 Stock Option and Equity Incentive Plan | |
| 10.5(11)* | Form of New Employee Inducement Grant Stock Option Agreement | |
| 10.6(12)* | Employment offer letter agreement and Mutual Agreement to Arbitrate between Registrant and Leonard Perham dated as of November 8, 2007 | |
| 10.7.1(13)* | New Employee Inducement Grant Stock Option Agreements between Registrant and Leonard Perham dated as of November 28, 2007 | |
| 10.7.2(14)* | New Employee Inducement Grant Stock Option Agreement between Registrant and Leonard Perham dated as of November 28, 2007 | |
| 10.7.3(15)* | New Employee Inducement Grant Stock Option Agreement between Registrant and Leonard Perham dated as of November 28, 2007 | |
| 10.8(16)* | Employment offer letter agreement between the Registrant and James Sullivan dated December 21, 2007 | |
| 10.9(17)* | Change-in-control Agreement between Registrant and James Sullivan dated January 18, 2008 |
43
| 10.10(18)* | Employment offer letter agreement between Registrant and David DeMaria dated as of July 31, 2008 | |
| 10.11(19)* | Change-in-control Agreement between Registrant and David DeMaria dated as of August 18, 2008 | |
| 10.12(20)* | Employment offer letter agreement between Registrant and Sundari Mitra dated as of June 4, 2009 | |
| 10.13(21)* | Non-Competition Agreement between Registrant and Sundari Mitra dated as of June 5, 2009 | |
| 10.14(22)* | Form of Notice of Restricted Stock Unit Award and Agreement | |
| 10.15(23) | Lease Agreement between Registrant and Mission West Properties, Inc. dated July 19, 2010 | |
| 10.16(24)* | Employment offer letter agreement between Registrant and Thomas Riordan dated May 6, 2011 | |
| 10.17(24)* | New employee inducement grant stock option agreement between Registrant and Thomas Riordan dated May 10, 2011 | |
| 10.18(24)* | Consultant agreement between Registrant and Sundari Mitra dated June 30, 2011 | |
| 10.19 | Form of New Employee Inducement Grant Stock Option Agreement (revised February 2012) | |
| 21.1 | List of subsidiaries | |
| 23.1 | Consent of Independent Registered Public Accounting Firm—Burr Pilger Mayer, Inc. | |
| 24.1 | Power of Attorney (see signature page) | |
| 31.1 | Rule 13a-14 certification | |
| 31.2 | Rule 13a-14 certification | |
| 32 | Section 1350 certification |
- (1)
- Incorporated
by reference to Exhibit 2.4 to Form 10-K filed by the Company on March 26, 2010 (Commission File
No. 000-32929).
- (2)
- Incorporated
by reference to Exhibit 3.6 to Form 8-K filed by the Company on November 12, 2010 (Commission File
No. 000-32929).
- (3)
- Incorporated
by reference to Exhibit 3.4 to Form 8-K filed by the Company on October 29, 2008 (Commission File
No. 000-32929).
- (4)
- Incorporated
by reference to the same-numbered exhibit to the Company's Registration Statement on Form S-1, as amended,
originally filed August 4, 2000, declared effective June 27, 2001 (Commission file No. 333-43122).
- (5)
- Incorporated
by reference to the same-numbered exhibit to Form 8-K filed by the Company on November 12, 2010
(Commission File No. 000-32929).
- (6)
- Incorporated
by reference to Exhibit 4.2.3 to the Current Report on Form 8-K, filed on July 27, 2011 (Commission File
No. 000-32929).
- (7)
- Incorporated
by reference to Exhibit 10.4 to the Company's Registration Statement on Form S-1, as amended, originally filed
August 4, 2000, declared effective June 17, 2001 (Commission File No. 333-43122).
- (8)
- Incorporated
by reference to Exhibit 10.5 to the Company's Registration Statement on Form S-1, as amended, originally filed
August 4, 2000, declared effective June 17, 2001 (Commission File No. 333-43122).
- (9)
- Incorporated by reference to Appendix B to the Company's proxy statement on Schedule 14A filed by the Company on October 7, 2004 (Commission File No. 000-32929).
44
- (10)
- Incorporated
by reference to Exhibit 10.15 to Form 10-Q filed by the Company on August 9, 2005 (Commission File
No. 000-32929).
- (11)
- Incorporated
by reference to Exhibit 10.25 to Form 10-K filed by the Company on March 17, 2008 (Commission File
No. 000-32929).
- (12)
- Incorporated
by reference to Exhibit 10.24 to Form 10-K filed by the Company on March 17, 2008 (Commission File
No. 000-32929).
- (13)
- Incorporated
by reference to Exhibit 10.25.1 to Form 10-Q filed by the Company on May 9, 2008 (Commission File
No. 000-32929).
- (14)
- Incorporated
by reference to Exhibit 10.25.2 to Form 10-Q filed by the Company on May 9, 2008 (Commission File
No. 000-32929).
- (15)
- Incorporated
by reference to Exhibit 10.25.3 to Form 10-Q filed by the Company on May 9, 2008 (Commission File
No. 000-32929).
- (16)
- Incorporated
by reference to Exhibit 10.26 to Form 10-K filed by the Company on March 17, 2008 (Commission File
No. 000-32929).
- (17)
- Incorporated
by reference to Exhibit 10.27 to Form 10-K filed by the Company on March 17, 2008 (Commission File
No. 000-32929).
- (18)
- Incorporated
by reference to Exhibit 10.30 to Form 10-Q filed by the Company on November 7, 2008 (Commission File
No. 000-32929).
- (19)
- Incorporated
by reference to Exhibit 10.31 to Form 10-Q filed by the Company on November 7, 2008 (Commission File
No. 000-32929).
- (20)
- Incorporated
by reference to Exhibit 10.32 to Form 8-K filed by the Company on June 12, 2009 (Commission File
No. 000-32929).
- (21)
- Incorporated
by reference to Exhibit 10.33 to Form 10-K filed by the Company on March 26, 2010 (Commission File
No. 000-32929).
- (22)
- Incorporated
by reference to Exhibit 4.8 to Form S-8 filed by the Company on June 5, 2009 (Commission File
No. 333-159753).
- (23)
- Incorporated
by reference to Exhibit 10.35 to Form 8-K filed by the Company on July 22, 2010 (Commission File
No. 000-32929).
- (24)
- Incorporated
by reference to the same-numbered exhibit to Form 10-Q filed by the Company on August 8, 2011
(Commission File No. 000-32929).
- *
- Management contract, compensatory plan or arrangement.
45
Pursuant to the requirements of Section 13 or 15(d) of the Securities Exchange Act of 1934, the Registrant has duly caused this report to be signed on its behalf by the undersigned, thereunto duly authorized, on the 15th day of March 2012.
| MOSYS, INC. | ||||
By: |
/s/ LEONARD PERHAM Leonard Perham President and Chief Executive Officer |
|||
KNOW ALL MEN BY THESE PRESENTS, that each person whose signature appears below constitutes and appoints Leonard Perham and James W. Sullivan as his true and lawful attorney-in-fact and agents, with full power of substitution and resubstitution, for him and in his name, place and stead, in any and all capacities, to sign any and all amendments to this Report on Form 10-K, and to file the same, with all exhibits thereto, and other documents in connection therewith, with the Securities and Exchange Commission, granting unto said attorney-in-fact and agents full power and authority to do and perform each and every act and thing requisite and necessary to be done in connection therewith, as fully to all intents and purposes as he might or could do in person, hereby ratifying and confirming all that said attorney-in-fact and agents, or his substitute or substitutes, may lawfully do or cause to be done by virtue hereof.
Pursuant to the requirements of the Securities Exchange Act of 1934, this report has been signed below by the following persons on behalf of the registrant and in the capacities and on the dates indicated.
Signature
|
Title | Date | ||
|---|---|---|---|---|
/s/ LEONARD PERHAM Leonard Perham |
President, Chief Executive Officer, and Director (Principal Executive Officer) |
March 15, 2012 |
||
/s/ JAMES W. SULLIVAN James W. Sullivan |
Vice President of Finance and Chief Financial Officer (Principal Financial Officer and Principal Accounting Officer) |
March 15, 2012 |
||
/s/ CARL E. BERG Carl E. Berg |
Director |
March 15, 2012 |
||
/s/ TOMMY ENG Tommy Eng |
Director |
March 15, 2012 |
||
/s/ CHI-PING HSU Chi-Ping Hsu |
Director |
March 15, 2012 |
||
/s/ JAMES D. KUPEC James D. Kupec |
Director |
March 15, 2012 |
46
MOSYS, INC.
INDEX TO CONSOLIDATED FINANCIAL STATEMENTS
47
Report of Independent Registered Public Accounting Firm
To
the Board of Directors and Stockholders
of MoSys, Inc.
We have audited the accompanying consolidated balance sheets of MoSys, Inc. and its subsidiaries (the "Company") as of December 31, 2011 and 2010, and the related consolidated statements of operations, stockholders' equity, and cash flows for each of the three years in the period ended December 31, 2011. Our audits also included the financial statement schedule listed in the Index to this Annual Report on Form 10-K at Part IV Item 15(a)(2). These consolidated financial statements and the financial statement schedule are the responsibility of the Company's management. Our responsibility is to express an opinion on these consolidated financial statements and financial statement schedule based on our audits.
We conducted our audits in accordance with the standards of the Public Company Accounting Oversight Board (United States). Those standards require that we plan and perform the audit to obtain reasonable assurance about whether the financial statements are free of material misstatement. An audit includes examining, on a test basis, evidence supporting the amounts and disclosures in the consolidated financial statements. An audit also includes assessing the accounting principles used and significant estimates made by management, as well as evaluating the overall financial statement presentation. We believe that our audits provide a reasonable basis for our opinion.
In our opinion, the consolidated financial statements referred to above present fairly, in all material respects, the financial position of MoSys, Inc. and its subsidiaries as of December 31, 2011 and 2010, and the results of their operations and their cash flows for each of the three years in the period ended December 31, 2011 in conformity with accounting principles generally accepted in the United States of America. Also, in our opinion, the related financial statement schedule, when considered in relation to the consolidated financial statements taken as a whole, presents fairly, in all material respects, the information set forth therein.
We also have audited, in accordance with the standards of the Public Company Accounting Oversight Board (United States), the Company's internal control over financial reporting as of December 31, 2011, based on criteria established in Internal Control—Integrated Framework issued by the Committee of Sponsoring Organizations of the Treadway Commission, and our report dated March 15, 2012 expressed an unqualified opinion thereon.
/s/ Burr Pilger Mayer, Inc.
San
Jose, California
March 15, 2012
48
Report of Independent Registered Public Accounting Firm
To
the Board of Directors and Stockholders
of MoSys, Inc
We have audited the internal control over financial reporting of MoSys, Inc. and its subsidiaries (the "Company") as of December 31, 2011, based on criteria established in Internal Control—Integrated Framework issued by the Committee of Sponsoring Organizations of the Treadway Commission (COSO). The Company's management is responsible for maintaining effective internal control over financial reporting and for its assessment of the effectiveness of internal control over financial reporting included in the accompanying Management's Annual Report on Internal Control over Financial Reporting, appearing in Item 9A. Our responsibility is to express an opinion on the Company's internal control over financial reporting based on our audit.
We conducted our audit in accordance with the standards of the Public Company Accounting Oversight Board (United States). Those standards require that we plan and perform the audit to obtain reasonable assurance about whether effective internal control over financial reporting was maintained in all material respects. Our audit included obtaining an understanding of internal control over financial reporting, assessing the risk that a material weakness exists, testing and evaluating the design and operating effectiveness of internal control based on the assessed risk, and performing such other procedures as we considered necessary in the circumstances. We believe that our audit provides a reasonable basis for our opinion.
A company's internal control over financial reporting is a process designed to provide reasonable assurance regarding the reliability of financial reporting and the preparation of financial statements for external purposes in accordance with generally accepted accounting principles. A company's internal control over financial reporting includes those policies and procedures that (1) pertain to the maintenance of records that, in reasonable detail, accurately and fairly reflect the transactions and dispositions of the assets of the company; (2) provide reasonable assurance that transactions are recorded as necessary to permit preparation of financial statements in accordance with generally accepted accounting principles, and that receipts and expenditures of the company are being made only in accordance with authorizations of management and directors of the company; and (3) provide reasonable assurance regarding prevention or timely detection of unauthorized acquisition, use, or disposition of the company's assets that could have a material effect on the financial statements.
Because of its inherent limitations, internal control over financial reporting may not prevent or detect misstatements. Also, projections of any evaluation of effectiveness to future periods are subject to the risk that controls may become inadequate because of changes in conditions, or that the degree of compliance with the policies or procedures may deteriorate.
In our opinion, MoSys, Inc. and its subsidiaries maintained, in all material respects, effective internal control over financial reporting as of December 31, 2011, based on the COSO criteria.
We have also audited, in accordance with the standards of the Public Company Accounting Oversight Board (United States), the consolidated balance sheets of MoSys, Inc. and its subsidiaries as of December 31, 2011 and 2010, and the related consolidated statements of operations, stockholders' equity, and cash flows for each of the three years in the period ended December 31, 2011, and the related financial statement schedule and our report dated March 15, 2012 expressed an unqualified opinion on those consolidated financial statements and the related financial statement schedule.
/s/ Burr Pilger Mayer, Inc.
San
Jose, California
March 15, 2012
49
MOSYS, INC.
CONSOLIDATED BALANCE SHEETS
(In thousands, except par value data)
| |
December 31, | ||||||
|---|---|---|---|---|---|---|---|
| |
2011 | 2010 | |||||
ASSETS |
|||||||
Current assets |
|||||||
Cash and cash equivalents |
$ | 40,025 | $ | 14,340 | |||
Short-term investments |
9,413 | 15,011 | |||||
Accounts receivable, net |
969 | 1,079 | |||||
Unbilled contracts receivable |
74 | 202 | |||||
Prepaid expenses and other current assets |
1,522 | 3,377 | |||||
Total current assets |
52,003 | 34,009 | |||||
Long-term investments |
8,537 | 8,193 | |||||
Property and equipment, net |
1,382 | 2,160 | |||||
Goodwill |
23,134 | 23,134 | |||||
Intangible assets, net |
4,400 | 6,238 | |||||
Other assets |
181 | 232 | |||||
Total assets |
$ | 89,637 | $ | 73,966 | |||
LIABILITIES AND STOCKHOLDERS' EQUITY |
|||||||
Current liabilities |
|||||||
Accounts payable |
$ | 336 | $ | 839 | |||
Accrued expenses and other liabilities |
2,779 | 2,623 | |||||
Accrued acquisition-related earn-out |
— | 1,500 | |||||
Deferred revenue |
920 | 1,801 | |||||
Total current liabilities |
4,035 | 6,763 | |||||
Long-term liabilities |
109 | 146 | |||||
Commitments and contingencies (Note 12) |
|||||||
Stockholders' equity |
|||||||
Preferred stock, $0.01 par value; 20,000 shares authorized; none issued and outstanding |
— | — | |||||
Common stock, $0.01 par value; 120,000 shares authorized; 38,423 shares and 37,225 shares issued and outstanding at December 31, 2011 and 2010, respectively |
384 | 372 | |||||
Additional paid-in capital |
150,507 | 143,336 | |||||
Accumulated other comprehensive income |
1 | 4 | |||||
Accumulated deficit |
(65,399 | ) | (76,655 | ) | |||
Total stockholders' equity |
85,493 | 67,057 | |||||
Total liabilities and stockholders' equity |
$ | 89,637 | $ | 73,966 | |||
The accompanying notes are an integral part of these consolidated financial statements.
50
MOSYS, INC.
CONSOLIDATED STATEMENTS OF OPERATIONS
(In thousands, except per share data)
| |
Year Ended December 31, | |||||||||
|---|---|---|---|---|---|---|---|---|---|---|
| |
2011 | 2010 | 2009 | |||||||
Net revenue |
||||||||||
Licensing |
$ | 5,987 | $ | 6,468 | $ | 3,476 | ||||
Royalty |
8,120 | 9,095 | 7,982 | |||||||
Total net revenue |
14,107 | 15,563 | 11,458 | |||||||
Cost of net revenue |
||||||||||
Licensing |
3,295 | 2,826 | 1,993 | |||||||
Total cost of net revenue |
3,295 | 2,826 | 1,993 | |||||||
Gross profit |
10,812 |
12,737 |
9,465 |
|||||||
Operating expenses |
||||||||||
Research and development |
26,216 | 25,534 | 19,255 | |||||||
Selling, general and administrative |
8,869 | 10,391 | 9,507 | |||||||
Gain on sale of patents |
(35,611 | ) | — | — | ||||||
Restructuring charges |
— | — | 706 | |||||||
Total operating expenses |
(526 | ) | 35,925 | 29,468 | ||||||
Income (loss) from operations |
11,338 |
(23,188 |
) |
(20,003 |
) |
|||||
Other income and expense, net |
206 | 177 | 744 | |||||||
Income (loss) before income taxes |
11,544 | (23,011 | ) | (19,259 | ) | |||||
Income tax provision (benefit) |
288 | 51 | (155 | ) | ||||||
Net income (loss) |
$ | 11,256 | $ | (23,062 | ) | $ | (19,104 | ) | ||
Net income (loss) per share |
||||||||||
Basic |
$ | 0.30 | $ | (0.72 | ) | $ | (0.61 | ) | ||
Diluted |
$ | 0.28 | $ | (0.72 | ) | $ | (0.61 | ) | ||
Shares used in computing net income (loss) per share |
||||||||||
Basic |
37,861 | 31,870 | 31,238 | |||||||
Diluted |
40,377 | 31,870 | 31,238 | |||||||
The accompanying notes are an integral part of these consolidated financial statements.
51
MOSYS, INC.
CONSOLIDATED STATEMENTS OF STOCKHOLDERS' EQUITY
(In thousands)
| |
Common Stock | |
Accumulated Other Comprehensive Income (Loss) |
|
|
||||||||||||||
|---|---|---|---|---|---|---|---|---|---|---|---|---|---|---|---|---|---|---|---|
| |
Additional Paid-In Capital |
Accumulated Deficit |
|
||||||||||||||||
| |
Shares | Amount | Total | ||||||||||||||||
Balance at January 1, 2009 |
31,630 | $ | 317 | $ | 115,780 | $ | 280 | $ | (34,489 | ) | $ | 81,888 | |||||||
Issuance of Common Stock for exercise of options |
26 | — | 40 | — | — | 40 | |||||||||||||
Repurchase of Restricted Common Stock |
(3 | ) | (1 | ) | (7 | ) | — | — | (8 | ) | |||||||||
Repurchase of Common Stock |
(429 | ) | (4 | ) | (926 | ) | — | — | (930 | ) | |||||||||
Stock-based compensation |
— | — | 3,054 | — | — | 3,054 | |||||||||||||
Other comprehensive loss—change in unrealized gain on available-for-sale investments |
— | — | — | (239 | ) | — | (239 | ) | |||||||||||
Net loss |
— | — | — | — | (19,104 | ) | (19,104 | ) | |||||||||||
Comprehensive loss |
(19,343 | ) | |||||||||||||||||
Balance at December 31, 2009 |
31,224 | 312 | 117,941 | 41 | (53,593 | ) | 64,701 | ||||||||||||
Issuance of Common Stock for exercise of options and release of awards |
1,046 | 10 | 2,181 | — | — | 2,191 | |||||||||||||
Issuance of Common Stock, net of costs of $46 |
4,955 | 50 | 19,916 | — | — | 19,966 | |||||||||||||
Stock-based compensation |
— | — | 3,298 | — | — | 3,298 | |||||||||||||
Other comprehensive loss—change in unrealized gain on available-for-sale investments |
— | — | — | (37 | ) | — | (37 | ) | |||||||||||
Net loss |
— | — | — | — | (23,062 | ) | (23,062 | ) | |||||||||||
Comprehensive loss |
(23,099 | ) | |||||||||||||||||
Balance at December 31, 2010 |
37,225 | 372 | 143,336 | 4 | (76,655 | ) | 67,057 | ||||||||||||
Issuance of Common Stock for exercise of options, employee stock purchase plan and release of awards |
1,198 | 12 | 3,391 | — | — | 3,403 | |||||||||||||
Stock-based compensation |
— | — | 3,780 | — | — | 3,780 | |||||||||||||
Other comprehensive loss—change in unrealized gain on available-for-sale investments |
— | — | — | (3 | ) | — | (3 | ) | |||||||||||
Net income |
— | — | — | — | 11,256 | 11,256 | |||||||||||||
Comprehensive income |
11,253 | ||||||||||||||||||
Balance at December 31, 2011 |
38,423 | $ | 384 | $ | 150,507 | $ | 1 | $ | (65,399 | ) | $ | 85,493 | |||||||
The accompanying notes are an integral part of these consolidated financial statements.
52
MOSYS, INC.
CONSOLIDATED STATEMENTS OF CASH FLOWS
(In thousands)
| |
Year Ended December 31, | |||||||||
|---|---|---|---|---|---|---|---|---|---|---|
| |
2011 | 2010 | 2009 | |||||||
Cash flows from operating activities: |
||||||||||
Net income (loss) |
$ | 11,256 | $ | (23,062 | ) | $ | (19,104 | ) | ||
Adjustments to reconcile net income (loss) to net cash used in operating activities: |
||||||||||
Depreciation and amortization |
1,110 | 1,000 | 857 | |||||||
Amortization of intangible assets |
2,618 | 2,818 | 1,464 | |||||||
Stock-based compensation |
3,766 | 3,298 | 3,054 | |||||||
Gain on sale of patents |
(35,611 | ) | — | — | ||||||
Non-cash restructuring charges |
— | — | 122 | |||||||
Provision for doubtful accounts |
(125 | ) | — | 47 | ||||||
Other non-cash items |
19 | 65 | (33 | ) | ||||||
Changes in assets and liabilities, net of effects of acquisitions: |
||||||||||
Accounts receivable |
235 | (326 | ) | 742 | ||||||
Unbilled contracts receivable |
128 | 1,055 | 1,921 | |||||||
Prepaid expenses and other assets |
2,247 | 1,204 | (307 | ) | ||||||
Deferred revenue |
(881 | ) | (1,027 | ) | (39 | ) | ||||
Accounts payable |
(763 | ) | (125 | ) | 34 | |||||
Accrued expenses and other liabilities |
324 | (365 | ) | 381 | ||||||
Accrued restructuring liabilities |
(19 | ) | (93 | ) | (878 | ) | ||||
Net cash used in operating activities |
(15,696 | ) | (15,558 | ) | (11,739 | ) | ||||
Cash flows from investing activities: |
||||||||||
Purchases of property and equipment |
(349 | ) | (1,412 | ) | (1,103 | ) | ||||
Net cash paid for purchase of businesses |
(1,500 | ) | (7,935 | ) | (13,563 | ) | ||||
Net proceeds from sale of patents |
34,831 | — | — | |||||||
Proceeds from sales and maturities of marketable securities |
36,836 | 57,734 | 48,804 | |||||||
Purchases of marketable securities |
(31,587 | ) | (47,687 | ) | (31,893 | ) | ||||
Net cash provided by investing activities |
38,231 | 700 | 2,245 | |||||||
Cash flows from financing activities: |
||||||||||
Proceeds from issuance of common stock |
3,336 | 2,191 | 40 | |||||||
Payments on capital lease obligations |
(186 | ) | (82 | ) | — | |||||
Proceeds from the sale of common stock, net of issuance costs |
— | 19,966 | — | |||||||
Repurchase of common stock |
— | — | (938 | ) | ||||||
Net cash provided by (used in) financing activities |
3,150 | 22,075 | (898 | ) | ||||||
Net increase (decrease) in cash and cash equivalents |
25,685 | 7,217 | (10,392 | ) | ||||||
Cash and cash equivalents at beginning of year |
14,340 | 7,123 | 17,515 | |||||||
Cash and cash equivalents at end of year |
$ | 40,025 | $ | 14,340 | $ | 7,123 | ||||
Supplemental disclosure: |
||||||||||
Cash paid for income taxes |
$ | 53 | $ | 56 | $ | 24 | ||||
Patent license recorded in connection with patent sale |
$ | 780 | $ | — | $ | — | ||||
Property and equipment acquired through capital lease |
$ | — | $ | 201 | $ | 212 | ||||
Transaction fees paid for repurchase of common stock |
$ | — | $ | — | $ | 13 | ||||
Intangible assets acquired for contingent consideration, in connection with acquisitions. |
$ | — | $ | 1,500 | $ | 4,550 | ||||
The accompanying notes are an integral part of these consolidated financial statements.
53
MOSYS, INC.
NOTES TO CONSOLIDATED FINANCIAL STATEMENTS
Note 1: The Company and Summary of Significant Accounting Policies
The Company
MoSys, Inc. (the Company) was incorporated in California in September 1991, and reincorporated in September 2000 in Delaware. The Company has been designing, developing, marketing and licensing high-performance semiconductor memory and high-speed parallel and serial interface intellectual property (IP) used by the semiconductor industry and communications, networking and storage equipment manufacturers. In February 2010, the Company announced the commencement of a new product initiative to develop a family of integrated circuit (IC) products under the "Bandwidth Engine" product name. Bandwidth Engine ICs combine the Company's high-density embedded memory with its high-speed 10 Gigabits per second interface (I/O) technology and are initially being marketed to networking systems companies and designers of advanced systems on chips designs. The Company's strategy and primary business objective is to become a fabless semiconductor company focused on development and sale of Bandwidth Engine ICs. The Company's future success and ability to achieve and maintain profitability will be dependent on its success in developing a market for the Bandwidth Engine ICs. During 2011, the Company began to dedicate more of its engineering resources and the engineering budget to IC efforts and this trend will continue as the Company places more emphasis on IC product sales as opposed to IP sales. As a result, the Company has begun placing less emphasis on IP licensing and deploying more resources for IC product development and marketing efforts, and the competitiveness and the demand for its IP have declined. To date, the Company has not generated any revenue from the sale of Bandwidth Engine ICs.
Basis of Presentation
The consolidated financial statements include the accounts of the Company and its wholly-owned subsidiaries. All significant intercompany transactions and balances have been eliminated in consolidation. The Company's fiscal year ends on December 31 of each calendar year.
Use of Estimates
The preparation of financial statements in accordance with accounting principles generally accepted in the United States requires management to make estimates and assumptions that affect the reported amounts of assets and liabilities, the disclosure of contingent assets and liabilities at the date of the financial statements and the reported amounts of revenues recognized under the percentage of completion method and expenses recognized during the reported period. Actual results could differ from those estimates.
Foreign Currency
The functional currency of the Company's foreign entities is the U.S. dollar. The financial statements of these entities are translated into U.S. dollars and the resulting gains or losses are included in other income and expense, net in the consolidated statements of operations. Such gains and losses were not material for any period presented. Foreign currency transaction gains and losses resulting from converting local currency to the U.S. dollar were not material for any period presented.
Cash Equivalents and Investments
The Company has invested its excess cash in money market accounts, corporate debt, government agency and municipal debt securities and considers all highly liquid debt instruments purchased with an original maturity of three months or less to be cash equivalents. Investments with original maturities
54
greater than three months and remaining maturities less than one year are classified as short-term investments. Investments with remaining maturities greater than one year are classified as long-term investments. Management generally determines the appropriate classification of securities at the time of purchase. All securities are classified as available-for-sale. The Company's available-for-sale short-term and long-term investments are carried at fair value, with the unrealized holding gains and losses reported in accumulated other comprehensive income (loss). Realized gains and losses and declines in the value judged to be other than temporary are included in the other income and expense, net line item in the consolidated statements of operations. The cost of securities sold is based on the specific identification method.
Fair Value Measurements
The Company measures the fair value of financial instruments using a fair value hierarchy that prioritizes the inputs to valuation techniques used to measure fair value into three broad levels, as follows:
Level 1—Inputs used to measure fair value are unadjusted quoted prices that are available in active markets for the identical assets or liabilities as of the reporting date.
Level 2—Pricing is provided by third party sources of market information obtained through the Company's investment advisors rather than models. The Company does not adjust for or apply any additional assumptions or estimates to the pricing information it receives from advisors. The Company's Level 2 securities include cash equivalents and available-for-sale securities, which consist primarily of corporate debt, and government agency and municipal debt securities from issuers with high quality credit ratings. The Company's investment advisors obtain pricing data from independent sources, such as Standard & Poor's, Bloomberg and Interactive Data Corporation, and rely on comparable pricing of other securities because the Level 2 securities it holds are not actively traded and have fewer observable transactions. The Company considers this the most reliable information available for the valuation of the securities.
Level 3—Unobservable inputs that are supported by little or no market activity and reflect the use of significant management judgment are used to measure fair value. These values are generally determined using pricing models for which the assumptions utilize management's estimates of market participant assumptions. The determination of fair value for Level 3 investments and other financial instruments involves the most management judgment and subjectivity.
Allowance for Doubtful Accounts
The Company establishes an allowance for doubtful accounts to ensure that its trade receivables balances are not overstated due to uncollectibility. The Company performs ongoing customer credit evaluations within the context of the industry in which it operates. A specific allowance of up to 100% of the invoice value is provided for any problematic customer balances. Delinquent account balances are written off after management has determined that the likelihood of collection is remote. The Company performs ongoing credit evaluations of its customers' financial condition and generally does not require collateral from its customers. The Company grants credit only to customers deemed creditworthy in the judgment of management. The Company maintains an allowance for doubtful accounts receivable based upon the expected collectibility of all accounts receivable. There was no allowance for doubtful accounts at December 31, 2011. The allowance for doubtful accounts receivable was $125,000 at December 31, 2010. For the years ended December 31, 2011 and 2009, no amounts were written off. For the year ended December 31, 2010, $78,000 was written off.
55
Unbilled Contracts Receivable
Under the percentage of completion method, if the amount of revenue recognized exceeds the amount of billings to a customer, the excess amount is carried as an unbilled contracts receivable.
Property and Equipment
Property and equipment are originally recorded at cost. Depreciation is computed using the straight-line method over the estimated useful lives of the assets, generally three to five years. Leasehold improvements and assets acquired through capital leases are amortized over the shorter of their estimated useful life or the lease term.
Valuation of Long-lived Assets
The Company evaluates the recoverability of long-lived assets with finite lives whenever events or changes in circumstances occur that indicate that the carrying value of the asset or asset group may not be recoverable. Finite-lived intangible assets are being amortized on a straight-line basis over their estimated useful lives of one to seven years. An impairment charge is recognized as the difference between the net book value of such assets and the fair value of such assets at the date of measurement. The measurement of impairment requires management to estimate future cash flows and the fair value of long-lived assets.
Intangible Assets
Intangible assets acquired in business combinations, referred to as purchased intangible assets, are accounted for based on the fair value of assets purchased and are amortized over the period in which economic benefit is estimated to be received. In December 2011, the Company sold 73 of its memory technology patents and received a license to those patents for use in its Bandwidth Engine ICs and other limited instances. The fair value of the patent rights received was recorded as a patent license (see Note 6). Identifiable intangible assets relating to business combinations and the patent license were as follows (dollar amounts in thousands):
| |
December 31, 2011 | ||||||||||||
|---|---|---|---|---|---|---|---|---|---|---|---|---|---|
| |
Life (years) |
Gross Carrying Amount |
Accumulated Amortization |
Net Carrying Amount |
|||||||||
Developed technology |
3-5 | $ | 9,240 | $ | 5,676 | $ | 3,564 | ||||||
Customer relationships |
3 | 390 | 334 | 56 | |||||||||
Contract backlog |
1 | 750 | 750 | — | |||||||||
Non-compete agreements |
1.5 | 140 | 140 | — | |||||||||
Subtotal purchased intangible assets |
10,520 | 6,900 | 3,620 | ||||||||||
Patent license |
7 | 780 | — | 780 | |||||||||
Total |
$ | 11,300 | $ | 6,900 | $ | 4,400 | |||||||
| |
December 31, 2010 | ||||||||||||
|---|---|---|---|---|---|---|---|---|---|---|---|---|---|
| |
Life (years) |
Gross Carrying Amount |
Accumulated Amortization |
Net Carrying Amount |
|||||||||
Developed technology |
3-5 | $ | 9,240 | $ | 3,188 | $ | 6,052 | ||||||
Customer relationships |
3 | 390 | 204 | 186 | |||||||||
Contract backlog |
1 | 750 | 750 | — | |||||||||
Non-compete agreements |
1.5 | 140 | 140 | — | |||||||||
Total |
$ | 10,520 | $ | 4,282 | $ | 6,238 | |||||||
56
For the years ended December 31, 2011, 2010 and 2009, amortization expense was $2.6 million, $2.8 million and $1.5 million, respectively. Amortization expense has been included in research and development expense in the consolidated statements of operations. The estimated aggregate amortization expense to be recognized in future years is approximately $1.8 million for 2012, $1.0 million for 2013, $1.0 million for 2014, $0.3 million for 2015, and $0.1 million annually for 2016 through 2018.
Goodwill
The Company reviews goodwill for impairment on an annual basis or whenever events or changes in circumstances indicate the carrying value of an asset may not be recoverable. The Company uses a two-step impairment test. In the first step, the Company compares the fair value of the reporting unit to its carrying value. The fair value of the reporting unit is determined using the market approach. If the fair value of the reporting unit exceeds the carrying value of net assets of the reporting unit, goodwill is not impaired, and the Company is not required to perform further testing. If the carrying value of the net assets of the reporting unit exceeds the fair value of the reporting unit, then the Company must perform the second step in order to determine the implied fair value of the reporting unit's goodwill and compare it to the carrying value of the reporting unit's goodwill. If the carrying value of a reporting unit's goodwill exceeds its implied fair value, then the Company must record an impairment charge equal to the difference. The Company has determined that it has a single reporting unit for purposes of performing its goodwill impairment test. The Company performed the annual impairment test in September 2011, and the test did not indicate impairment of goodwill, as the fair value exceeded the carrying value of the reporting unit by approximately 61%. As the Company used the market approach to assess impairment, the price of its common stock is an important component of the fair value calculation. If the Company's stock price continues to experience significant price and volume fluctuations, this will impact the fair value of the reporting unit, which can lead to potential impairment in future periods. As of December 31, 2011, the Company had not identified any factors to indicate there was an impairment of its goodwill and determined that no additional impairment analysis was required.
Revenue Recognition
General
The Company currently generates revenue from the licensing of its IP, and customers pay fees for licensing, development services, royalties and maintenance and support. The Company recognizes revenue when persuasive evidence of an arrangement exists, delivery or performance has occurred, the sales price is fixed or determinable, and collectibility is reasonably assured. Evidence of an arrangement generally consists of signed agreements. When sales arrangements contain multiple deliverables (e.g., license and services), the Company reviews each deliverable to determine the separate units of accounting that exist within the agreement. If more than one unit of accounting exists, the consideration payable to the Company under the agreement is allocated to each unit of accounting using the relative fair value method. Revenue is recognized for each unit of accounting when the revenue recognition criteria have been met for that unit of accounting.
Licensing
Licensing revenue consists of fees earned from license agreements, development services and support and maintenance. For stand-alone license agreements or license deliverables in multi-deliverable arrangements that do not require significant development, modification or customization, revenue is recognized when all revenue recognition criteria have been met. Delivery of the licensed technology is typically the final revenue recognition criterion met, at which time revenue is recognized.
57
If any of the criteria are not met, revenue recognition is deferred until such time as all criteria have been met.
Effective with the first quarter of 2011, the Company allocates revenue among license deliverables in multi-deliverable arrangements using the relative selling price method. Revenue allocated to each element is recognized when the basic revenue recognition criteria is met for each element. Under generally accepted accounting principles, the Company is required to apply a hierarchy to determine the selling price to be used for allocating revenue to deliverables: (i) vendor-specific objective evidence of fair value (VSOE), (ii) third-party evidence of selling price (TPE) and (iii) best estimate of the selling price (ESP). In general, the Company is unable to establish VSOE or TPE for its license fees and development services; therefore, revenue is allocated to these elements based on the Company's ESP, which the Company determines after considering multiple factors such as management approved pricing guidelines, geographic differences, market conditions, competitor pricing strategies, internal costs and gross margin objectives. These factors may vary over time depending upon the unique facts and circumstances related to each deliverable. If the facts and circumstances underlying the factors considered change or should future facts and circumstances lead the Company to consider additional factors, the Company's ESP for license fee and development services could change. If the Company's arrangements entered into or materially modified on or after January 1, 2011 were subject to the previous accounting guidance, the reported net revenue amount would have remained consistent with reported amounts for the year ended December 31, 2011.
For license agreements involving deliverables that do require significant production, modification or customization, and where the Company has significant experience in meeting the design specifications in the contract and the direct labor hours related to services under the contract can be reasonably estimated, the Company recognizes revenue over the period in which the contract services are performed. For these arrangements, the Company recognizes revenue using the percentage of completion method. Under this method, revenue recognized in any period depends on the Company's progress toward completion of projects in progress. Significant management judgment and discretion are used to estimate total direct labor hours. These judgmental elements include determining that the Company has the experience to meet the design specifications and estimating the total direct labor hours to perform the contract services, based on experience in developing prior licensees' designs. The direct labor hours for the development of the licensee's design are estimated at the beginning of the contract. As the direct labor hours are incurred, they are used as a measure of progress towards completion. During the contract performance period, the Company reviews estimates of direct labor hours to complete the contracts and will revise its estimates of revenue and gross profit under the contract if it revises the estimations of the direct labor hours to complete. The Company's policy is to reflect any revision in the contract gross profit estimate in reported income or loss in the period in which the facts giving rise to the revision become known. Under the percentage of completion method, provisions for estimated losses on uncompleted contracts are recorded in the period in which such losses are determined to be likely. If the amount of revenue recognized under the percentage of completion accounting method exceeds the amount of billings to a customer, the excess amount is recorded as an unbilled contracts receivable.
For contracts involving design specifications that the Company has not previously met or if inherent risks make estimates doubtful, the contract is accounted for under the completed contract method. Under this method, the Company defers the recognition of all revenue until the design meets the contractual design specifications, and the cost of revenue is expensed as incurred. When the Company has experience in meeting design specifications but the lack of significant experience or inherent risks prevent the Company from reasonably estimating the direct labor hours related to services to meet a design specification, the Company defers the recognition of revenue.
From time to time, a licensee may cancel a project during the development phase. Such a cancellation is not within the Company's control and is often caused by changes in market conditions
58
or the licensee's business. Cancellations of this nature are an aspect of the Company's licensing business, and, in general, its license contracts allow the Company to retain all payments that the Company has received or is entitled to collect for items and services provided before the cancellation occurs. Typically under the Company's license agreements, the licensee is obligated to complete the project within a stated timeframe, including assisting the Company in completing the final milestone. If the Company performs the contracted services, the licensee is obligated to pay the license fees even if the licensee fails to complete verification or cancels the project prior to completion. For accounting purposes the Company will consider a project to have been cancelled even in the absence of specific notice from its licensee if there has been no activity under the contract for six months or longer and the Company believes that completion of the contract is unlikely. In this event, the Company recognizes revenue in the amount of cash received, if the Company has performed a sufficient portion of the development services. If a cancelled contract had been entered into before the establishment of technological feasibility, the costs associated with the contract would have been expensed prior to the recognition of revenue under the completed contract method. In that case, there would be no costs associated with that revenue recognition, and gross margin would increase for the corresponding period. No license revenue was recognized from cancelled contracts for the years ended December 31, 2011, 2010 and 2009.
The Company provides support and maintenance under many of its license agreements. Under these arrangements, the Company provides unspecified upgrades, design rule changes and technical support. No other upgrades, products or other post-contract support are provided. Support and maintenance revenue is recognized at its fair value established by VSOE, ratably over the period during which the obligation exists, typically 12 months. These arrangements are generally renewable annually by the customer.
Under limited circumstances, the Company also recognizes prepaid pre-production royalties as licensing revenue. These are lump sum payments made when the Company enters into licensing agreements that cover future shipments of a product that is not commercially available from the licensee. The Company characterizes such payments as licensing revenue because they are paid as part of the initial license fee and not with respect to products being produced by the licensee. These payments are non-cancelable and non-refundable.
Royalty
The Company's licensing contracts typically also provide for royalties based on licensees' use of the Company's memory technology in their currently shipping commercial products. The Company recognizes revenue on royalties in the quarter in which it receives the licensee's report. Under limited circumstances, the Company may also recognize prepaid post-production royalties as revenue upon execution of the contract, which are paid in a lump sum after the licensee commences production of the royalty-bearing product and applied against future unit shipments regardless of the actual level of shipments by the licensee. The criteria for revenue recognition of prepaid royalties are that a formal agreement with the licensee is executed, no deliverables, development or support services related to prepaid royalties are required, the fees are non-refundable and not contingent upon future product shipments by the licensee, and the fees are payable by the licensee in a time period consistent with the Company's normal billing terms. If any of these criteria are not met, the Company defers revenue recognition until such time as all criteria have been met.
Cost of Revenue
Cost of licensing revenue consists primarily of engineering personnel and overhead allocation costs directly related to development services specified in agreements. These services typically include customization of the Company's technologies for the licensee's particular IC design and may include
59
engineering support to assist in the commencement of production of a licensee's products. The Company recognizes cost of licensing revenue in the following manner:
- •
- If licensing revenue is recognized using the percentage of completion method, the associated cost of licensing revenue is
recognized in the period in which the Company incurs the engineering costs. If revenue is deferred, the corresponding costs are capitalized in other current assets and charged to cost of licensing
revenue when the related revenue is recognized.
- •
- If licensing revenue is recognized using the completed contract method, to the extent that the amount of engineering cost does not exceed the amount of the related licensing revenue, the cost of licensing revenue is deferred on a contract-by-contract basis from the time the Company has established technological feasibility of the product to be developed under the license contract. Technological feasibility is established when the Company has completed all activities necessary to demonstrate that the licensee's product can be produced to meet the performance specifications when incorporating its technology. Deferred costs are capitalized in other current assets and charged to cost of licensing revenue when the related revenue is recognized.
Research and Development
Engineering costs are recorded as research and development expense in the period incurred and include costs incurred with respect to internally developed technology and engineering services which are not directly related to a particular licensee, license agreement or license fees.
Stock-Based Compensation
The Company recognizes stock-based compensation for awards on a straight-line basis over the requisite service period, usually the vesting period, based on the grant-date fair value.
Per Share Amounts
Basic net income (loss) per share is computed by dividing net income (loss) for the period by the weighted-average number of shares of common stock outstanding during the period. Diluted net income (loss) per share gives effect to all potentially dilutive common shares outstanding during the period. Potential common shares are composed of incremental shares of common stock issuable upon the exercise of stock options or restricted stock awards. As of December 31, 2011, 2010 and 2009, stock awards to purchase approximately 9,015,000, 10,603,000 and 10,791,000 shares, respectively, were excluded from the computation of diluted net income (loss) per share as their inclusion would be
60
anti-dilutive. The following table sets forth the computation of basic and diluted net income (loss) per share for the periods indicated (in thousands, except per share amounts):
| |
Year Ended December 31, | |||||||||
|---|---|---|---|---|---|---|---|---|---|---|
| |
2011 | 2010 | 2009 | |||||||
Numerator: |
||||||||||
Net income (loss) |
$ | 11,256 | $ | (23,062 | ) | $ | (19,104 | ) | ||
Denominator: |
||||||||||
Add: weighted-average common shares outstanding |
37,942 | 32,049 | 31,238 | |||||||
Less: unvested common shares subject to repurchase |
(81 | ) | (179 | ) | — | |||||
Total shares: basic |
37,861 | 31,870 | 31,238 | |||||||
Add: weighted-average stock options outstanding |
2,435 | — | — | |||||||
Add: common shares subject to repurchase |
81 | — | — | |||||||
Total shares: diluted |
40,377 | 31,870 | 31,238 | |||||||
Net income (loss) per share: |
||||||||||
Basic |
$ | 0.30 | $ | (0.72 | ) | $ | (0.61 | ) | ||
Diluted |
$ | 0.28 | $ | (0.72 | ) | $ | (0.61 | ) | ||
Options Issued to Non-Employees
The Company records stock-based compensation expense for stock options granted to non-employees, excluding non-employee directors, based upon the estimated then-current fair value of the equity instrument using the Black-Scholes pricing model. Assumptions used to value the equity instruments are consistent with equity instruments issued to employees. The Company charges the value of the equity instrument to earnings over the term of the service agreement and the unvested shares underlying the option are subject to periodic revaluation over the remaining vesting period.
Income Taxes
The Company determines deferred tax assets and liabilities based upon the differences between the financial statement and tax bases of the Company's assets and liabilities using tax rates in effect for the year in which the Company expects the differences to affect taxable income. A valuation allowance is established for any deferred tax assets for which it is more likely than not that all or a portion of the deferred tax assets will not be realized.
The Company files U.S. federal and state and foreign income tax returns in jurisdictions with varying statutes of limitations. The Company is not currently under any tax jurisdiction examination. The 2003 through 2011 tax years generally remain subject to examination by federal, state and foreign tax authorities.
As of December 31, 2011, the Company did not have any unrecognized tax benefits nor expect its unrecognized tax benefits to change significantly over the next 12 months. The Company recognizes interest related to unrecognized tax benefits in its income tax expense and penalties related to unrecognized tax benefits as other income and expenses. During the years ended December 31, 2011, 2010 and 2009, the Company did not recognize any interest or penalties related to unrecognized tax benefits.
Comprehensive Income (Loss)
Comprehensive income (loss), as defined, includes all changes in equity (net assets) during a period from non-owner sources. The difference between net income (loss) and comprehensive income (loss) is due to unrealized gains and losses on investments classified as available-for-sale. Comprehensive income (loss) is reflected in the consolidated statements of stockholders' equity.
61
Recent Accounting Pronouncements
In June 2011, the Financial Accounting Standards Board (FASB) issued Accounting Standard Update (ASU) No. 2011-05, Presentation of Comprehensive Income (ASU No. 2011-05). ASU No. 2011-05 eliminates the option to report other comprehensive income and its components in the statement of stockholders' equity and requires an entity to present the total of comprehensive income, the components of net income and the components of other comprehensive income either in a single continuous statement or in two separate but consecutive statements. This pronouncement is effective for fiscal years, and interim periods within those years, beginning after December 15, 2011. The Company believes the adoption of ASU 2011-05 concerns presentation and disclosure only and will not have an impact on its consolidated financial position or results of operations.
In September 2011, the FASB issued ASU No. 2011-08, Intangibles-Goodwill and Other—Testing Goodwill for Impairment. Under this updated guidance, an entity is permitted to first assess qualitative factors to determine whether it is more-likely-than-not that the fair value of a reporting unit is less than its carrying amount as a basis for determining whether it is necessary to perform the two-step goodwill impairment test. The effective date of this guidance is for annual and interim goodwill impairment tests performed for fiscal years beginning after December 15, 2011. The Company does not believe the adoption of this guidance will have a material effect on its consolidated financial statements.
Note 2: Consolidated Balance Sheets and Statements of Operations Components
| |
December 31, | ||||||
|---|---|---|---|---|---|---|---|
| |
2011 | 2010 | |||||
| |
(in thousands) |
||||||
Prepaid expenses and other current assets: |
|||||||
Tax receivable |
$ | 157 | $ | 843 | |||
Deferred cost of revenue |
101 | 872 | |||||
Prepaid expenses and other assets |
1,264 | 1,662 | |||||
|
$ | 1,522 | $ | 3,377 | |||
Property and equipment: |
|||||||
Equipment, furniture and fixtures and leasehold improvements |
$ | 3,996 | $ | 3,761 | |||
Acquired software |
626 | 618 | |||||
|
4,622 | 4,379 | |||||
Less: Accumulated depreciation and amortization |
(3,240 | ) | (2,219 | ) | |||
|
$ | 1,382 | $ | 2,160 | |||
Property and equipment included $413,000 of testing equipment purchased through capital leases. The accumulated amortization of property and equipment under capital leases was $298,000 and $117,000, as of December 31, 2011 and 2010, respectively. See Note 12 for disclosure on future minimum lease payments.
| |
December 31, | ||||||
|---|---|---|---|---|---|---|---|
| |
2011 | 2010 | |||||
Accrued expenses and other liabilities: |
|||||||
Accrued wages and employee benefits |
$ | 782 | $ | 776 | |||
Employee stock purchase plan withholdings |
392 | 429 | |||||
Professional fees |
271 | 319 | |||||
Other |
1,334 | 1,099 | |||||
|
$ | 2,779 | $ | 2,623 | |||
62
Other income and expense, net:
| |
2011 | 2010 | 2009 | |||||||
|---|---|---|---|---|---|---|---|---|---|---|
| |
(in thousands) |
|||||||||
Interest income |
$ | 143 | $ | 272 | $ | 862 | ||||
Other income and expense, net |
63 | (95 | ) | (118 | ) | |||||
|
$ | 206 | $ | 177 | $ | 744 | ||||
Note 3: Fair Value of Financial Instruments
The estimated fair values of financial instruments outstanding at December 31, 2011 and 2010 were as follows (in thousands):
| |
2011 | ||||||||||||
|---|---|---|---|---|---|---|---|---|---|---|---|---|---|
| |
Cost | Unrealized Gains |
Unrealized Losses |
Fair Value |
|||||||||
Cash and cash equivalents |
$ | 40,025 | $ | — | $ | — | $ | 40,025 | |||||
Short-term investments: |
|||||||||||||
U.S. government debt securities |
$ | 4,834 | $ | 2 | $ | — | $ | 4,836 | |||||
Corporate notes |
4,578 | 1 | (2 | ) | 4,577 | ||||||||
Total short-term investments |
$ | 9,412 | $ | 3 | $ | (2 | ) | $ | 9,413 | ||||
Long-term investments: |
|||||||||||||
U.S. government debt securities |
$ | 5,721 | $ | 1 | $ | (1 | ) | $ | 5,721 | ||||
Corporate notes |
2,816 | 2 | (2 | ) | 2,816 | ||||||||
Total long-term investments |
$ | 8,537 | $ | 3 | $ | (3 | ) | $ | 8,537 | ||||
| |
2010 | ||||||||||||
|---|---|---|---|---|---|---|---|---|---|---|---|---|---|
| |
Cost | Unrealized Gains |
Unrealized Losses |
Fair Value |
|||||||||
Cash and cash equivalents |
$ | 14,340 | $ | — | $ | — | $ | 14,340 | |||||
Short-term investments: |
|||||||||||||
U.S. government debt securities |
$ | 8,711 | $ | 1 | $ | (2 | ) | $ | 8,710 | ||||
Corporate notes |
5,115 | 6 | (5 | ) | 5,116 | ||||||||
Certificates of deposit |
1,185 | — | — | 1,185 | |||||||||
Total short-term investments |
$ | 15,011 | $ | 7 | $ | (7 | ) | $ | 15,011 | ||||
Long-term investments: |
|||||||||||||
U.S. government debt securities |
$ | 6,204 | $ | — | $ | (2 | ) | $ | 6,202 | ||||
Corporate notes |
1,507 | 6 | — | 1,513 | |||||||||
Certificates of deposit |
480 | — | (2 | ) | 478 | ||||||||
Total long-term investments |
$ | 8,191 | $ | 6 | $ | (4 | ) | $ | 8,193 | ||||
As of December 31, 2011 and 2010, all of the available-for-sale securities with unrealized losses were in a loss position for less than 12 months. Total fair value of available-for-sale securities with unrealized losses was $8.6 million at December 31, 2011.
63
Cost and fair value of investments based on two maturity groups at December 31, 2011 and 2010 were as follows (in thousands):
| |
2011 | ||||||||||||
|---|---|---|---|---|---|---|---|---|---|---|---|---|---|
| |
Cost | Unrealized Gains |
Unrealized Losses |
Fair Value |
|||||||||
Due within 1 year |
$ | 9,412 | $ | 3 | $ | (2 | ) | $ | 9,413 | ||||
Due in 1-2 years |
8,537 | 3 | (3 | ) | 8,537 | ||||||||
Total |
$ | 17,949 | $ | 6 | $ | (5 | ) | $ | 17,950 | ||||
| |
2010 | ||||||||||||
|---|---|---|---|---|---|---|---|---|---|---|---|---|---|
| |
Cost | Unrealized Gains |
Unrealized Losses |
Fair Value |
|||||||||
Due within 1 year |
$ | 15,011 | $ | 7 | $ | (7 | ) | $ | 15,011 | ||||
Due in 1-2 years |
8,191 | 6 | (4 | ) | 8,193 | ||||||||
Total |
$ | 23,202 | $ | 13 | $ | (11 | ) | $ | 23,204 | ||||
The following table represents the Company's fair value hierarchy for its financial assets (cash equivalents and investments) and for an acquisition-related earn-out liability as of December 31, 2011 and 2010 (in thousands):
| |
2011 | ||||||||||||
|---|---|---|---|---|---|---|---|---|---|---|---|---|---|
| |
Fair Value | Level 1 | Level 2 | Level 3 | |||||||||
Money market funds |
$ | 2,792 | $ | 2,792 | $ | — | $ | — | |||||
Corporate notes |
7,393 | — | 7,393 | — | |||||||||
U.S. government debt securities |
10,557 | — | 10,557 | — | |||||||||
Total assets |
$ | 20,742 | $ | 2,792 | $ | 17,950 | $ | — | |||||
| |
2010 | ||||||||||||
|---|---|---|---|---|---|---|---|---|---|---|---|---|---|
| |
Fair Value | Level 1 | Level 2 | Level 3 | |||||||||
Money market funds |
$ | 4,399 | $ | 4,399 | $ | — | $ | — | |||||
Certificates of deposit |
1,853 | — | 1,853 | — | |||||||||
Corporate notes and commercial paper |
14,278 | — | 14,278 | — | |||||||||
U.S. government debt securities |
15,414 | — | 15,414 | — | |||||||||
Total assets |
$ | 35,944 | $ | 4,399 | $ | 31,545 | $ | — | |||||
Acquisition-related earn-out liability |
$ | 1,000 | $ | — | $ | — | $ | 1,000 | |||||
Total liabilities |
$ | 1,000 | $ | — | $ | — | $ | 1,000 | |||||
There were no transfers in or out of Level 1 and Level 2 securities during the years ended December 31, 2011 and 2010. There were no Level 3 financial assets as of December 31, 2011 and 2010.
64
The following table provides a summary of changes in fair value of the Company's acquisition-related earn-out liabilities measured at fair value using significant unobservable inputs (Level 3) for the years ended December 31, 2011 and 2010 (in thousands):
| |
Fair Value | |||
|---|---|---|---|---|
Balance at December 31, 2009 |
$ | 4,550 | ||
Issuance of earn-out (see Note 4) |
1,000 | |||
Payment of earn-out |
(4,550 | ) | ||
Balance at December 31, 2010 |
1,000 | |||
Payment of earn-out |
(1,000 | ) | ||
Balance at December 31, 2011 |
$ | — | ||
Note 4: Acquisitions
Prism Circuits
In June 2009, the Company acquired substantially all the assets and business of Prism Circuits, Inc. (Prism Circuits), a provider of semiconductor interface IP. The acquisition significantly expanded the Company's product portfolio by adding high-speed multi-protocol compliant interface IP, which enables communication between semiconductors in a system. With the acquisition, the Company added over 50 engineers experienced in interface IP development and analog/mixed-signal applications.
Under the terms of the acquisition agreement, the Company paid Prism Circuits $15.0 million in cash at closing (offset by approximately $1.4 million of cash acquired), assumed certain liabilities of Prism Circuits as consideration for the acquired assets and paid an additional $6.5 million of cash in July 2010 in satisfaction of a contractual earn-out commitment, as a result of the Company meeting certain objectives relating to the Prism Circuits business during the twelve-month period following the acquisition. In addition, the Company granted options to purchase 3,621,724 shares of the Company's common stock to the newly hired Prism Circuits employees as inducements material to employment in accordance with the terms of the acquisition agreement. The majority of these options are vesting on a straight-line basis over 48 months subject to continued employment requirements.
The objectives for the earn-out payment related to:
- •
- billing and collection by the Company of amounts payable under customer contracts assumed by the Company;
- •
- the achievement of specific product development milestones in accordance with a mutually agreed-upon schedule;
and
- •
- the retention by the Company of certain key employees formerly employed by Prism Circuits.
Because the acquisition agreement provided that 30% of the earn-out payment could be earned by the shareholders of Prism Circuits based on the Company's future employment of individuals, the amount allocated to this objective, or $1.95 million, was not considered to be a component of the acquisition price and was recognized as compensation expense and accrued on a straight-line basis over the one-year period subsequent to the acquisition. For 2010 and 2009, the Company recorded $0.8 million and $1.1 million, respectively, of expense and liability for the retention objective, which was achieved in June 2010. The remaining portion of the earn-out payment, or $4.55 million, was included in the acquisition price because the Company expected that it was more likely than not that the objectives related to this earn-out payment would be met.
65
The Company recorded a total acquisition price as follows (in thousands):
Cash |
$ | 15,000 | ||
Acquisition-related earnout |
4,550 | |||
Total acquisition price |
$ | 19,550 | ||
The allocation of the acquisition price for net tangible and intangible assets was as follows (in thousands):
Net tangible assets |
$ | 2,779 | ||
Identifiable intangible assets: |
||||
Developed technology |
4,800 | |||
Customer relationships |
390 | |||
Contract backlog |
750 | |||
Non-compete agreements |
140 | |||
Goodwill |
10,691 | |||
Total acquisition price |
$ | 19,550 | ||
The developed technology asset is attributable to products which have reached technological feasibility. The value of the developed technology was determined by discounting estimated net future cash flows of the products.
The customer relationships asset is attributable to the Company's ability and intent to sell existing, in process and future versions of the acquired products to the existing customers of Prism Circuits. The value of customer relationships was determined by discounting estimated net future cash flows from the customer agreements based on established valuation techniques accepted in the technology industry.
The developed technology and customer relationships assets are being amortized on a straight-line basis over their estimated lives of three years.
The contract backlog asset is attributable to the value of agreements acquired from Prism Circuits that were in the process of being delivered at the time of acquisition. The value of the contract backlog was determined by discounting estimated net future cash flows of the milestone payments based on established valuation techniques accepted in the technology industry. The Company expected to fulfill its obligations under these agreements during a one year period, and therefore this asset was amortized on a straight-line basis over one year.
The non-compete agreements asset was attributable to the non-compete agreements executed by certain former key employees of Prism Circuits that have been employed by the Company and was amortized on a straight-line basis over the eighteen month terms of the agreements.
Goodwill represents the excess of the acquisition price of an acquired business over the fair value of the underlying net tangible and intangible assets. Included in the goodwill amount is the value of the acquired workforce, which has significant expertise in high-speed interface IP and analog/mixed-signal technology. The Company assesses goodwill for impairment on at least an annual basis or when there is an indicator of impairment. The goodwill recognized is expected to be deductible for income tax purposes.
MagnaLynx
In March 2010, the Company acquired all of the outstanding stock of MagnaLynx, Inc. (MagnaLynx), a provider of semiconductor interface technology. Under the terms of the merger agreement, the Company paid approximately $2.2 million to settle debt and certain other liabilities of
66
MagnaLynx and approximately $1.2 million to MagnaLynx shareholders. An additional $0.5 million, referred to as the indemnification holdback, was payable 18 months after the closing, net of any costs related to indemnification claims that may have arisen during such 18 month period. An additional $1.0 million was payable six months after the closing as earn-out consideration based on MagnaLynx meeting certain contractually agreed-upon development milestones. Both the indemnification holdback and earn-out were paid in 2011. The earn-out consideration was included in the acquisition price because the Company expected that it was more likely than not that the objectives related to this earn-out would be met.
The Company recorded a total acquisition price as follows (in thousands):
Cash |
$ | 3,355 | ||
Acquisition-related earn-out |
1,000 | |||
Indemnification holdback |
500 | |||
Liabilities assumed by MoSys |
32 | |||
Total acquisition price |
$ | 4,887 | ||
The allocation of the acquisition price for net tangible and intangible assets was as follows (in thousands):
Net tangible assets |
$ | 100 | ||
Intangible asset—developed technology |
4,440 | |||
Goodwill |
347 | |||
Total acquisition price |
$ | 4,887 | ||
Goodwill represents the excess of the acquisition price of an acquired business over the fair value of the underlying net tangible and intangible assets. Included in the goodwill amount is the value of the acquired workforce, which has significant expertise in low-power interface IP. The goodwill recognized is expected to be deductible for income tax purposes.
The value of the identifiable intangible asset was determined by using future cash flow assumptions. The intangible asset, which is considered developed technology, is being amortized on a straight-line basis over its estimated life of five years.
Note 5: Restructuring Charges and Accruals
In 2008, the Company announced and initiated a plan to exit its unprofitable and non-core analog/mixed-signal product lines, which it had acquired through asset purchase transactions in 2007, resulting in the elimination of approximately 90 positions and closure of subsidiaries in China and Romania. In the first quarter of 2009, the Company recorded restructuring charges of $275,000, which were primarily related to employee terminations, costs to exit a leased facility in China and other costs related to closing the analog/mixed-signal subsidiaries. Total restructuring charges resulting from the exit of the analog/mixed-signal product lines were $1.6 million, and the Company does not expect to incur additional restructuring charges related to this exit initiative.
In 2009, the Company announced and initiated a plan to close its Korea research and development office resulting in the elimination of 15 positions. The Company recorded restructuring charges of $280,000, which were primarily related to employee terminations, costs to exit the leased facility and other costs related to closing the subsidiaries.
In addition, restructuring charges of $151,000 were incurred in 2009 in connection with the Company's exit from the leased facility occupied by Prism Circuits in Santa Clara, California.
67
Restructuring activity was as follows (in thousands):
| |
Facility related and other termination costs |
|||
|---|---|---|---|---|
Balance at December 31, 2009 |
$ | 112 | ||
Cash payments |
(93 | ) | ||
Balance at December 31, 2010 |
19 | |||
Cash payments |
(19 | ) | ||
Balance at December 31, 2011 |
$ | — | ||
Facility costs and other costs primarily include termination fees related to leases, and lease payments to be incurred until termination of the leases and services.
Note 6: Patent Sale and License
In December 2011, the Company entered into a patent purchase agreement for the sale of 43 United States and 30 related foreign memory technology patents for $35 million in cash and a license for the use of those patents in the Bandwidth Engine ICs and other limited uses. The Company recognized a $35.6 million gain on this transaction, which has been recorded as a reduction of operating expenses in the consolidated statements of operations. The gain was comprised of the $35 million of cash proceeds, plus $0.8 million for the patent license, net of transaction costs.
Under the patent purchase agreement, the Company received a license to the sold patents to cover its Bandwidth Engine IC product line and technology partners, along with related rights to offer sublicenses to current and future partners. This right to use the patents was valued to be $0.8 million and has been recorded as an intangible asset ("patent license") (see Note 2). The value was determined based on the present value of the future cash flows that could potentially be generated by the patent license over its estimated remaining life. The patent license is amortized over its estimated useful life of seven years.
Note 7: Income Taxes
The income tax provision (benefit) consisted of the following (in thousands):
| |
Year Ended December 31, |
|||||||||
|---|---|---|---|---|---|---|---|---|---|---|
| |
2011 | 2010 | 2009 | |||||||
Current portion: |
||||||||||
Federal |
$ | 247 | $ | (19 | ) | $ | (109 | ) | ||
State |
3 | 2 | (23 | ) | ||||||
Foreign |
38 | 68 | (23 | ) | ||||||
|
$ | 288 | $ | 51 | $ | (155 | ) | |||
Deferred income taxes reflect the net tax effects of temporary differences between the carrying amount of assets and liabilities for financial reporting purposes and the amounts used for income tax purposes.
68
Significant components of the Company's deferred tax assets and liabilities were as follows (in thousands):
| |
December 31, | ||||||
|---|---|---|---|---|---|---|---|
| |
2011 | 2010 | |||||
Deferred tax assets: |
|||||||
Federal and state loss carryforwards |
$ | 20,196 | $ | 24,468 | |||
Reserves, accruals and other |
685 | 512 | |||||
Depreciation and amortization |
2,117 | 2,193 | |||||
Deferred stock-based compensation |
3,061 | 2,320 | |||||
Research and development credit carryforwards |
6,856 | 6,434 | |||||
Foreign tax and other credits |
1,347 | 1,084 | |||||
Total deferred tax assets |
34,262 | 37,011 | |||||
Deferred tax liabilities: |
|||||||
Acquired intangible assets and other |
1,898 | 1,970 | |||||
Less: Valuation allowance |
(32,364 | ) | (35,041 | ) | |||
Net deferred tax assets |
$ | — | $ | — | |||
The valuation allowance decreased by $2.7 million during the year ended December 31, 2011 and increased $9.4 million during the year ended December 31, 2010. The valuation allowance at December 31, 2011 includes $1.8 million related to stock option deductions incurred prior to January 1, 2006, the benefit of which will be credited to additional paid-in capital if they become realized.
As of December 31, 2011, the Company had net operating loss carryforwards of approximately $52.7 million for federal income tax purposes and approximately $62.0 million for state income tax purposes. These losses are available to reduce future taxable income and expire at various times from 2017 through 2030. Approximately $4.6 million of federal net operating loss carryforwards and $3.9 million of state net operating loss carryforwards are related to excess tax benefits from stock-based compensation and will be charged to additional paid-in capital when realized.
The Company also had federal research and development tax credit carryforwards of approximately $4.7 million, which will expire beginning in 2012, and California research and development credits of approximately $3.3 million, which do not have an expiration date. The Company had foreign tax credits available for federal income tax purposes of approximately $1.1 million which will begin to expire in 2014.
Utilization of the Company's net operating loss and tax credit carryforwards may be subject to a substantial annual limitation due to the ownership change limitations provided by the Internal Revenue Code and similar state provisions. Such an annual limitation could result in the expiration or elimination of the net operating loss and tax credit carryforwards before utilization. Management does not believe it is likely that utilization will in fact be significantly limited due to ownership change limitation provisions.
69
A reconciliation of income taxes provided at the federal statutory rate (35%) to actual income tax provision (benefit) follows (in thousands):
| |
Year Ended December 31, | |||||||||
|---|---|---|---|---|---|---|---|---|---|---|
| |
2011 | 2010 | 2009 | |||||||
Income tax benefit computed at U.S. statutory rate |
$ | 4,040 | $ | (8,054 | ) | $ | (6,741 | ) | ||
Federal alternative minimum tax |
247 | — | — | |||||||
State income tax (net of federal benefit) |
2 | 2 | (22 | ) | ||||||
Foreign income tax at rate different from U.S. statutory rate |
(9 | ) | (90 | ) | 167 | |||||
Research and development credits |
(1,254 | ) | (1,239 | ) | (1,028 | ) | ||||
Foreign tax credit |
(17 | ) | (21 | ) | (196 | ) | ||||
Stock-based compensation |
292 | 607 | 545 | |||||||
Amortization of intangible assets |
(657 | ) | — | — | ||||||
Valuation allowance changes affecting tax provision |
(2,363 | ) | 8,979 | 7,006 | ||||||
Other |
7 | (133 | ) | 114 | ||||||
Income tax provision (benefit) |
$ | 288 | $ | 51 | $ | (155 | ) | |||
The domestic and foreign components of income (loss) before income tax provision (benefit) were as follows (in thousands):
| |
Year Ended December 31, | |||||||||
|---|---|---|---|---|---|---|---|---|---|---|
| |
2011 | 2010 | 2009 | |||||||
U.S. |
$ | 11,363 | $ | (23,499 | ) | $ | (18,692 | ) | ||
Non-U.S. |
181 | 488 | (567 | ) | ||||||
|
$ | 11,544 | $ | (23,011 | ) | $ | (19,259 | ) | ||
Note 8: Stock-Based Compensation
Equity Compensation Plans
Common Stock Option Plans
In 1996, the Company adopted the 1996 Stock Plan (1996 Plan), which expired in 2006. Until 2010, options were outstanding under the 1996 Plan, but, as of December 31, 2011, no options were available for future issuance and no options were outstanding.
In 2000, the Company adopted the 2000 Stock Plan, which was amended in 2004 (Amended 2000 Plan), and terminated in 2010. As of December 31, 2011, no options were available for future issuance under the Amended 2000 Plan and options to purchase approximately 4,006,000 shares were outstanding with a weighted-average exercise price of $4.68 per share. The Amended 2000 Plan will remain in effect as to outstanding equity awards granted under the plan prior to the date of expiration.
In June 2010, the Company's stockholders approved the 2010 Equity Incentive Plan (2010 Plan). The 2010 Plan authorizes the board of directors or the compensation committee of the board of directors to grant a broad range of awards including stock options, stock appreciation rights, restricted stock, performance-based awards, and restricted stock units. Under the 2010 Plan, 4,000,000 shares were initially reserved for issuance and there will be an automatic annual increase in the share reserve of 500,000 on January 1 of each year. The 2010 Plan has a 10 year term and provides for annual option grants or other awards to our non-employee directors to acquire up to 40,000 shares and for a one-time grant of an option or other award to a non-employee director to acquire up to 120,000 shares upon his or her initial appointment or election to the board of directors.
70
The term of options granted under the 2010 Plan may not exceed ten years. The term of all incentive stock options granted to a person who, at the time of grant, owns stock representing more than 10% of the voting power of all classes of the Company's stock may not exceed five years.
The exercise price of stock options granted under the 2010 Plan must be at least equal to the fair market value of the shares on the date of grant. Generally, options granted under the 2010 Plan will vest over a four-year period and will have a six-year term. In addition, the 2010 Plan provides for automatic acceleration of vesting for options granted to non-employee directors upon a change of control of the Company.
The 1996 Plan, Amended 2000 Plan and 2010 Plan are referred to collectively as the "Plans."
The Company may also award shares to new employees outside the Plans, as material inducements to the acceptance of employment with the Company. These grants must be approved by the compensation committee of the board of directors, a majority of the independent directors or an authorized executive officer.
Employee Stock Purchase Plan
In June 2010, the Company's stockholders approved the 2010 Employee Stock Purchase Plan (ESPP). A total of 2,000,000 shares of common stock have been reserved for issuance under the ESPP. The ESPP, which is intended to qualify under Section 423 of the Internal Revenue Code, is administered by the board of directors or the compensation committee of the board of directors. The ESPP provides that eligible employees may purchase up to $25,000 worth of the Company's common stock annually over the course of two six-month offering periods. The purchase price to be paid by participants is 85% of the price per share of the Company's common stock either at the beginning or the end of each six-month offering period, whichever is less. On September 1, 2010, the Company commenced the first offering period under the ESPP. For the year ended December 31, 2011, approximately 310,000 shares of common stock were issued at an aggregate purchase price of approximately $1.1 million under the ESPP.
Stock-Based Compensation Expense
The Company recorded $3.8 million, $3.3 million and $3.1 million of stock-based compensation expense in 2011, 2010 and 2009, respectively. The Company is required to present the tax benefits resulting from tax deductions in excess of the compensation cost recognized from the exercise of stock options as financing cash flows in the consolidated statements of cash flows. For the years ended December 31, 2011, 2010 and 2009, there were no such tax benefits associated with the exercise of stock options due to the Company's loss position.
In November 2007, the Company hired a new chief executive officer and the board of directors approved three option grants to this new officer with an exercise price equal to the fair market value of the Company's common stock on the date of grant. One option grant was for 800,000 shares of common stock and vests in equal amounts monthly for two years from November 8, 2007. The second option grant was for 350,000 shares of common stock and vests as to: i) 80% of these shares if the average closing price of the Company's common stock for any 90-day period is at least $10.00 per share, and ii) the remaining 20% of these shares pro rata for each $0.01 increase in the average price up to $12.00 per share. The third option grant was for 100,000 shares of common stock and vests as to: i) 50% of the shares if the average closing price of the Company's common stock for any 90-day period is at least $13.00 per share, and ii) the remaining 50% of these shares pro rata for each $0.01 increase up to $15.00 per share. The vesting of all three option grants is subject to continued employment (or service as a director or consultant). In consideration of the market condition vesting requirement included for the second and third option grants, the Company valued the options using a binomial lattice model. Total compensation for these options was valued at $875,000. The compensation expense
71
is being recognized ratably over the projected requisite service period of three and three and a half years for the 350,000 and 100,000 shares, respectively. If the market condition is met before the projected requisite service period has elapsed, the unrecognized compensation cost related to the vested shares would be recognized immediately when the market condition is met.
In April 2010, the board of directors of the Company approved the modification of an option previously granted to the chief executive officer to purchase 450,000 shares of common stock to allow him to exercise the option prior to vesting, subject to a right of repurchase by the Company for any shares that subsequently failed to vest in accordance with the terms of a restricted stock purchase agreement. In April 2010, the chief executive officer exercised the option and acquired 337,500 shares, which vested over the next 18 months. The modification did not result in any incremental expense. In November 2011, the option fully vested.
In June 2011, the Company's executive vice president of engineering resigned from the Company and agreed to act as a consultant for an indefinite period. As compensation for the consulting services, an option to purchase 675,000 shares of the Company's common stock that was granted to the executive vice president on June 26, 2009, of which the unvested and unexercised portion would have otherwise terminated by its terms following the termination of employment with the Company, will remain in effect and continue to vest in accordance with its vesting terms during the term of the consulting agreement. The Company accounts for this option as a variable award and the fair value compensation expense is recognized each period over the remaining vesting term of the option.
Valuation Assumptions and Expense Information for Stock-based Compensation
The fair value of the Company's share-based payment awards for the years ended December 31, 2011, 2010 and 2009 was estimated on the grant dates using a Black-Scholes valuation method and an option-pricing model with the following assumptions:
| |
Year Ended December 31, | |||||||||
|---|---|---|---|---|---|---|---|---|---|---|
Employee stock options:
|
2011 | 2010 | 2009 | |||||||
Risk-free interest rate |
0.2% - 1.7 | % | 0.6% - 2.1 | % | 1.2% - 2.1 | % | ||||
Volatility |
40.7% - 65.4 | % | 62.5% - 72.7 | % | 55.7% - 63.5 | % | ||||
Expected life (years) |
4.0 | 4.0 | 4.0 | |||||||
Dividend yield |
0 | % | 0 | % | 0 | % | ||||
The risk-free interest rate was derived from the Daily Treasury Yield Curve Rates as published by the U.S. Department of the Treasury as of the grant date for terms equal to the expected terms of the options. The expected volatility was based on the combination of: 1) four-year historical volatility and 2) implied volatility of the Company's stock price. The expected term of options granted was derived from historical data based on employee exercises and post-vesting employment termination behavior. A dividend yield of zero is applied because the Company has never paid dividends and has no intention to pay dividends in the near future.
The stock-based compensation expense recorded is adjusted based on estimated forfeiture rates. An annualized forfeiture rate has been used as a best estimate of future forfeitures based on the Company's historical forfeiture experience. The stock-based compensation expense will be adjusted in later periods if the actual forfeiture rate is different from the estimate.
72
A summary of activity under the Plans is presented below (in thousands, except exercise price):
| |
Shares Available for Grant |
Number of Options outstanding |
Weighted Average Exercise Prices |
|||||||
|---|---|---|---|---|---|---|---|---|---|---|
Balance at December 31, 2008 |
2,071 | 4,802 | $ | 6.38 | ||||||
Additional authorized under the Amended 2000 Plan |
500 | — | — | |||||||
Options granted |
(2,463 | ) | 2,463 | $ | 2.27 | |||||
RSU's granted |
(25 | ) | — | — | ||||||
Options cancelled |
1,813 | (1,813 | ) | $ | 6.78 | |||||
Options exercised |
— | (2 | ) | $ | 1.00 | |||||
Options expired |
(21 | ) | — | — | ||||||
Balance at December 31, 2009 |
1,875 | 5,450 | $ | 4.37 | ||||||
Additional authorized under the Amended 2000 Plan |
500 | — | — | |||||||
Additional authorized under the 2010 Plan |
4,000 | — | — | |||||||
Plan termination |
(1,502 | ) | — | — | ||||||
Options cancelled prior to and upon termination of the Amended 2000 Plan |
487 | (487 | ) | $ | 4.31 | |||||
Options cancelled and expired subsequent to termination of the Amended 2000 Plan |
— | (401 | ) | $ | 2.98 | |||||
Options granted |
(1,690 | ) | 1,690 | $ | 4.47 | |||||
Options exercised |
— | (658 | ) | $ | 2.47 | |||||
Options expired |
(20 | ) | — | — | ||||||
Balance at December 31, 2010 |
3,650 | 5,594 | $ | 4.64 | ||||||
Additional authorized under the 2010 Plan |
500 | — | — | |||||||
Options granted |
(2,201 | ) | 2,201 | $ | 4.13 | |||||
Options cancelled |
28 | (28 | ) | $ | 4.23 | |||||
Options exercised |
— | (524 | ) | $ | 3.34 | |||||
Options expired |
— | (715 | ) | $ | 5.45 | |||||
Balance at December 31, 2011 |
1,977 | 6,528 | $ | 4.48 | ||||||
73
A summary of the inducement grant option activity is presented below (in thousands, except exercise price):
| |
Options Outstanding | ||||||
|---|---|---|---|---|---|---|---|
| |
Number of Shares |
Weighted Average Exercise Prices |
|||||
Balance at December 31, 2008 |
2,107 | $ | 4.99 | ||||
Granted |
3,601 | $ | 1.55 | ||||
Cancelled |
(388 | ) | $ | 3.24 | |||
Exercised |
(25 | ) | $ | 1.55 | |||
Balance at December 31, 2009 |
5,295 | $ | 2.81 | ||||
Granted |
— | — | |||||
Cancelled |
(108 | ) | $ | 1.55 | |||
Exercised |
(375 | ) | $ | 1.54 | |||
Balance at December 31, 2010 |
4,812 | $ | 2.92 | ||||
Granted |
400 | $ | 6.06 | ||||
Cancelled |
(48 | ) | $ | 1.54 | |||
Exercised |
(349 | ) | $ | 1.55 | |||
Balance at December 31, 2011 |
4,815 | $ | 3.29 | ||||
A summary of the restricted stock award and restricted stock unit activity is presented below (in thousands, except fair value):
| |
Number of Shares |
Weighted Average Grant-Date Fair Value |
|||||
|---|---|---|---|---|---|---|---|
Non-vested shares at December 31, 2008 |
272 | $ | 7.01 | ||||
Granted |
46 | — | |||||
Vested |
(69 | ) | $ | 6.85 | |||
Cancelled |
(203 | ) | $ | 7.07 | |||
Non-vested shares at December 31, 2009 |
46 | $ | 1.60 | ||||
Vested |
(15 | ) | $ | 1.60 | |||
Non-vested shares at December 31, 2010 |
31 | $ | 1.60 | ||||
Vested |
(16 | ) | $ | 1.60 | |||
Non-vested shares at December 31, 2011 |
15 | $ | 1.60 | ||||
74
The following table summarizes significant ranges of outstanding and exercisable options and inducement grants, excluding restricted stock award and restricted stock unit activity, as of December 31, 2011 (in thousands, except contractual life and exercise price):
| |
Options Outstanding | |
Options Exercisable | |
|||||||||||||||||||||
|---|---|---|---|---|---|---|---|---|---|---|---|---|---|---|---|---|---|---|---|---|---|---|---|---|---|
Range of Exercise Price
|
Number Outstanding |
Weighted Average Remaining Contractual Life (in Years) |
Weighted Average Exercise Price |
Aggregate Intrinsic value |
Number Exercisable |
Weighted Average Remaining Contractual Life (in Years) |
Weighted Average Exercise Price |
Aggregate Intrinsic value |
|||||||||||||||||
$1.50 - $2.50 |
3,527 | 3.20 | $ | 1.69 | $ | 8,858 | 1,908 | 3.20 | $ | 1.69 | $ | 4,790 | |||||||||||||
$2.51 - $5.00 |
4,475 | 4.48 | $ | 3.97 | $ | 1,632 | 2,078 | 3.84 | $ | 4.12 | $ | 484 | |||||||||||||
$5.01 - $7.50 |
2,693 | 4.44 | $ | 5.87 | — | 1,759 | 3.98 | $ | 5.84 | — | |||||||||||||||
$7.51 - $15.00 |
648 | 1.17 | $ | 8.63 | — | 648 | 1.17 | $ | 8.63 | — | |||||||||||||||
|
11,343 | 3.88 | $ | 3.98 | $ | 10,490 | 6,393 | 3.42 | $ | 4.33 | $ | 5,274 | |||||||||||||
As of December 31, 2011, the Company had 10,472,556 options fully vested and expected to vest, after estimated forfeitures, with a remaining contractual life of 3.79 years, weighted average exercise price of $3.99 and aggregate intrinsic value of approximately $9.8 million.
The total fair value of options vested, excluding restricted stock units, during the year ended December 31, 2011 calculated using the Black-Scholes valuation method was $2.0 million. The total intrinsic value of employee stock options exercised during each of the years ended December 31, 2011, 2010 and 2009 was $2.4 million, $2.4 million and $33,000, respectively.
Options to purchase 6.4 million and 4.2 million shares with weighted average exercised prices of $4.33 and $5.40 per share were exercisable at December 31, 2011 and 2010, respectively. As of December 31, 2011, total compensation costs related to unvested, but not yet recognized, stock-based awards was $5.6 million, net of estimated forfeitures. This cost will be amortized on a straight-line basis over a weighted average remaining period of 2.5 years and will be adjusted for subsequent change in estimated forfeitures.
Note 9: Stockholders' Equity
In December 2010, the Company completed an equity offering and issued approximately 5 million shares of its common stock for approximately $20.0 million in net proceeds.
Stockholder Rights Plan
On November 10, 2010, the Company executed a rights agreement in connection with the declaration by the Company's board of directors of a dividend of one preferred stock purchase right (a "Right") to be paid on November 10, 2010 (the "Record Date") for each share of the Company's common stock issued and outstanding at the close of business on the Record Date. Each Right entitles the registered holder to purchase one one-thousandth of a share of Series AA Preferred Stock, $0.01 par value per share (a "Preferred Share"), of the Company at a price of $48.00 per one one-thousandth of a Preferred Share, subject to adjustment. The rights will not be exercisable until a third party acquires 15.0% of the Company's common stock or commences or announces its intent to commence a tender offer for at least 15.0% of the common stock, other than holders of "grandfathered stock" as defined below.
"Grandfathered stock" refers to stock held by Carl E. Berg, Artis Capital Management L.P. and their respective affiliates. The beneficial ownership threshold for a holder of grandfathered stock is 20%, rather than 15%. In addition, under the rights agreement, the firm of Ingalls & Snyder, or I&S, and its managed account beneficial owners collectively will not trigger the rights as long as none of
75
their shares are held for the purpose of acquiring control or effecting change or influence in control of MoSys . This exclusion applies only to shares of common stock for which there is only shared dispositive power and I&S has only non-discretionary voting power. The rights agreement could delay, deter or prevent an investor from acquiring the Company in a transaction that could otherwise result in its stockholders receiving a premium over the market price for their shares of common stock.
Stock Repurchases
In October 2008, the Company's board of directors authorized the Company to purchase up to $5.0 million of its common stock over a twelve month period. The share repurchases under this program were to be made from time to time in the open market subject to market conditions and other factors. The repurchases could be commenced or suspended at any time or from time to time without prior notice. As of December 31, 2009, total repurchases under the program authorized in October 2008 were approximately 704,000 shares of common stock for approximately $1.9 million. Repurchases under this program were suspended in February 2009, and this program expired in October 2009.
The total purchase prices of the common stock repurchased were reflected as decreases to stockholders' equity during the period of repurchase. Common stock repurchased was recorded based upon the dates of the applicable trades.
Note 10: Retirement Savings Plan
Effective January 1997, the Company adopted the MoSys 401(k) Plan (the Savings Plan) which qualifies as a thrift plan under Section 401(k) of the Internal Revenue Code. Full-time and part-time employees who are at least 21 years of age are eligible to participate in the Savings Plan at the time of hire. Participants may contribute up to 15% of their earnings to the Savings Plan. Prior to the second quarter of 2009, the Company made a matching contribution on behalf of each participant in an amount equal to 25% of a participant's contributions during the plan year. The Company made matching contributions of $52,000 in 2009. No matching contributions were made in 2010 and 2011.
Note 11: Business Segments, Concentration of Credit Risk and Significant Customers
The Company operates in one business segment and uses one measurement of profitability for its business. Revenue attributed to the United States and to all foreign countries is based on the geographical location of the customer.
Financial instruments that potentially subject the Company to significant concentrations of credit risk consist principally of cash, cash equivalents, short-term and long-term investments and accounts receivable. Cash, cash equivalents and short-term and long term investments are deposited with high credit quality institutions.
The Company recognized revenue from licensing of its technologies to customers in North America, Asia and Europe as follows (in thousands):
| |
Years Ended December 31, | |||||||||
|---|---|---|---|---|---|---|---|---|---|---|
| |
2011 | 2010 | 2009 | |||||||
United States |
$ | 5,476 | $ | 5,886 | $ | 2,741 | ||||
Japan |
4,700 | 6,661 | 7,288 | |||||||
Taiwan |
3,197 | 2,888 | 1,206 | |||||||
Europe |
727 | — | 24 | |||||||
Rest of Asia |
7 | 128 | 199 | |||||||
Total |
$ | 14,107 | $ | 15,563 | $ | 11,458 | ||||
76
Customers who accounted for at least 10% of total revenues were as follows:
| |
Years Ended December 31, | |||||||||
|---|---|---|---|---|---|---|---|---|---|---|
| |
2011 | 2010 | 2009 | |||||||
Customer A |
23 | % | 18 | % | 10 | % | ||||
Customer B |
17 | % | 23 | % | 44 | % | ||||
Customer C |
12 | % | 9 | % | 3 | % | ||||
Customer D |
6 | % | 15 | % | 2 | % | ||||
Customer E |
— | 2 | % | 10 | % | |||||
Four customers accounted for 96% of net accounts receivable at December 31, 2011. Four customers accounted for 99% of net accounts receivable at December 31, 2010.
Net property and equipment, classified by major geographic areas, was as follows at December 31, 2011 and 2010 (in thousands):
| |
December 31, | ||||||
|---|---|---|---|---|---|---|---|
| |
2011 | 2010 | |||||
| |
(in thousands) |
||||||
U.S. |
$ | 1,216 | $ | 1,937 | |||
Non-U.S. |
166 | 223 | |||||
Total |
$ | 1,382 | $ | 2,160 | |||
Note 12: Commitments and Contingencies
Leases and Purchase Commitments
The Company leases its facilities under non-cancelable operating leases that expire at various dates through 2020. Rent expense was approximately $915,000, $694,000 and $454,000 for the years ended December 31, 2011, 2010 and 2009, respectively. The leases provide for monthly payments and are being charged to operations ratably over the lease terms. In addition to the minimum lease payments, the Company is responsible for property taxes, insurance and certain other operating costs.
Future minimum lease payments under non-cancelable operating leases, capital leases and purchase commitments are as follows (in thousands):
Year ended December 31,
|
Operating leases |
Capital leases |
Purchase commitments |
Total | |||||||||
|---|---|---|---|---|---|---|---|---|---|---|---|---|---|
2012 |
$ | 837 | $ | 153 | $ | 3,299 | $ | 4,289 | |||||
2013 |
769 | — | 50 | 819 | |||||||||
2014 |
777 | — | — | 777 | |||||||||
2015 |
673 | — | — | 673 | |||||||||
2016 |
693 | — | — | 693 | |||||||||
Thereafter |
2,657 | — | — | 2,657 | |||||||||
Total minimum payments |
$ | 6,406 | $ | 153 | $ | 3,349 | $ | 9,908 | |||||
Purchase commitments include licenses related to computer-aided design tools payable through January 2013.
77
Indemnification
In the ordinary course of business, the Company enters into contractual arrangements under which it may agree to indemnify the counterparties from any losses incurred relating to breach of representations and warranties, failure to perform certain covenants, or claims and losses arising from certain events as outlined within the particular contract, which may include, for example, losses arising from litigation or claims relating to past performance. Such indemnification clauses may not be subject to maximum loss clauses. The Company has entered into indemnification agreements with its officers and directors. No material amounts were reflected in the Company's consolidated financial statements for the years ended December 31, 2011, 2010 or 2009 related to these indemnifications.
The Company has not estimated the maximum potential amount of indemnification liability under these agreements due to the limited history of prior claims and the unique facts and circumstances applicable to each particular agreement. To date, the Company has not made any payments related to these indemnification agreements.
Legal Matters
The Company is not a party to any material legal proceeding that the Company believes is likely to have a material adverse effect on its consolidated financial position or results of operations. From time to time the Company may be subject to legal proceedings and claims in the ordinary course of business. These claims, even if not meritorious, could result in the expenditure of significant financial resources and diversion of management efforts.
Note 13: Related Party Transactions
In July 2010, the Company entered into a lease agreement with Mission West Properties, Inc., the lessor, to lease approximately 47,000 square feet for its corporate headquarters in Santa Clara, California. The lease term is 120 months. The Company has an option to extend the lease for two additional five-year periods at 95% of the then fair market monthly rent rate. After the first two years of the lease, the Company may terminate the lease early in the event that it has signed a lease to move into a facility that is also owned by the lessor or one of its affiliates and is at least 20% larger. The Company may also terminate the lease at the end of 60 or 90 months if the Company has sold all or substantially all of its assets to an independent buyer or if the lessor cannot accommodate the Company's future expansion requirements, provided that the Company pays the lessor an amount equal to the outstanding unamortized balance of the initial improvements. The chief executive officer and chairman of the board of the lessor is Carl E. Berg. Mr. Berg is a director of the Company and a member of the compensation committee and the audit committee of the Company's board of directors. Mr. Berg beneficially owns approximately 5% of the Company's common stock, and his daughter's trust beneficially owns approximately 6% of the Company's common stock. For the years ended December 31, 2011 and 2010, a total of $716,000 and $379,000, respectively, of lease payments were paid to Mission West Properties, Inc.
A related party to one of the Company's executive officers performed construction work at its corporate headquarters. In 2010 and 2009, the construction work was completed at a cost of approximately $12,000 and $145,000, respectively, and was paid in full in the respective years.
78
Schedule II—Valuation and Qualifying Accounts
(In thousands)
| |
|
Additions | Deductions | |
|||||||||||||||
|---|---|---|---|---|---|---|---|---|---|---|---|---|---|---|---|---|---|---|---|
Description
|
Balance at beginning of period |
Charged to costs and expenses |
Charged to other accounts |
Amounts recovered |
Amounts written off |
Balance at end of period |
|||||||||||||
Allowance for doubtful accounts |
|||||||||||||||||||
Year ended December 31, 2011 |
$ | 125 | $ | — | $ | — | $ | (125 | ) | $ | — | $ | — | ||||||
Year ended December 31, 2010 |
$ | 93 | $ | — | $ | 125 | $ | (15 | ) | $ | (78 | ) | $ | 125 | |||||
Year ended December 31, 2009 |
$ | 75 | $ | 47 | $ | 46 | $ | (75 | ) | $ | — | $ | 93 | ||||||
79
| 2.1(1) | Agreement and Plan of Merger by and among MoSys, Inc., MLI Merger Corporation, MagnaLynx, Inc., and the Representative of the Shareholders of MagnaLynx, Inc. dated as of March 24, 2010 | |
| 3.1(2) | Restated Certificate of Incorporation of the Registrant | |
| 3.2(3) | Amended and Restated Bylaws of the Registrant | |
| 4.1(4) | Specimen common stock certificate | |
| 4.2(5) | Rights Agreement, dated November 10, 2010, by and between the Company and Wells Fargo Bank, N.A., as Rights Agent | |
| 4.2.1(5) | Form of Right Certificate | |
| 4.2.2(5) | Summary of Rights to Purchase Preferred Shares | |
| 4.4.3(6) | Amendment No. 1 to Rights Agreement, dated July 22, 2011, by and between the Registrant and Wells Fargo Bank, N.A., as Rights Agent | |
| 10.1(4) | Form of Indemnity Agreement between the Registrant and each of its directors and executive officers | |
| 10.2(7)* | Form of Restricted Stock Purchase Agreement | |
| 10.3(8)* | 2000 Stock Option Plan and form of Option Agreement thereunder | |
| 10.3.1(9)* | Amended and Restated 2000 Stock Option and Equity Incentive Plan | |
| 10.4(10)* | Form of Stock Option Agreement pursuant to Amended and Restated 2000 Stock Option and Equity Incentive Plan | |
| 10.5(11)* | Form of New Employee Inducement Grant Stock Option Agreement | |
| 10.6(12)* | Employment offer letter agreement and Mutual Agreement to Arbitrate between Registrant and Leonard Perham dated as of November 8, 2007 | |
| 10.7.1(13)* | New Employee Inducement Grant Stock Option Agreements between Registrant and Leonard Perham dated as of November 28, 2007 | |
| 10.7.2(14)* | New Employee Inducement Grant Stock Option Agreement between Registrant and Leonard Perham dated as of November 28, 2007 | |
| 10.7.3(15)* | New Employee Inducement Grant Stock Option Agreement between Registrant and Leonard Perham dated as of November 28, 2007 | |
| 10.8(16)* | Employment offer letter agreement between the Registrant and James Sullivan dated December 21, 2007 | |
| 10.9(17)* | Change-in-control Agreement between Registrant and James Sullivan dated January 18, 2008 | |
| 10.10(18)* | Employment offer letter agreement between Registrant and David DeMaria dated as of July 31, 2008 | |
| 10.11(19)* | Change-in-control Agreement between Registrant and David DeMaria dated as of August 18, 2008 | |
| 10.12(20)* | Employment offer letter agreement between Registrant and Sundari Mitra dated as of June 4, 2009 | |
| 10.13(21)* | Non-Competition Agreement between Registrant and Sundari Mitra dated as of June 5, 2009 | |
| 10.14(22)* | Form of Notice of Restricted Stock Unit Award and Agreement | |
| 10.15(23) | Lease Agreement between Registrant and Mission West Properties, Inc. dated July 19, 2010 | |
| 10.16(24)* | Employment offer letter agreement between Registrant and Thomas Riordan dated May 6, 2011 | |
| 10.17(24)* | New employee inducement grant stock option agreement between Registrant and Thomas Riordan dated May 10, 2011 | |
| 10.18(24)* | Consultant agreement between Registrant and Sundari Mitra dated June 30, 2011 |
80
| 10.19 | Form of New Employee Inducement Grant Stock Option Agreement (revised February 2012) | |
| 21.1 | List of subsidiaries | |
| 23.1 | Consent of Independent Registered Public Accounting Firm—Burr Pilger Mayer, Inc. | |
| 24.1 | Power of Attorney (see signature page) | |
| 31.1 | Rule 13a-14 certification | |
| 31.2 | Rule 13a-14 certification | |
| 32 | Section 1350 certification |
- (1)
- Incorporated
by reference to Exhibit 2.4 to Form 10-K filed by the Company on March 26, 2010 (Commission File
No. 000-32929).
- (2)
- Incorporated
by reference to Exhibit 3.6 to Form 8-K filed by the Company on November 12, 2010 (Commission File
No. 000-32929).
- (3)
- Incorporated
by reference to Exhibit 3.4 to Form 8-K filed by the Company on October 29, 2008 (Commission File
No. 000-32929).
- (4)
- Incorporated
by reference to the same-numbered exhibit to the Company's Registration Statement on Form S-1, as amended,
originally filed August 4, 2000, declared effective June 27, 2001 (Commission file No. 333-43122).
- (5)
- Incorporated
by reference to the same-numbered exhibit to Form 8-K filed by the Company on November 12, 2010
(Commission File No. 000-32929).
- (6)
- Incorporated
by reference to Exhibit 4.2.3 to the Current Report on Form 8-K, filed on July 27, 2011 (Commission File
No. 000-32929).
- (7)
- Incorporated
by reference to Exhibit 10.4 to the Company's Registration Statement on Form S-1, as amended, originally filed
August 4, 2000, declared effective June 17, 2001 (Commission File No. 333-43122).
- (8)
- Incorporated
by reference to Exhibit 10.5 to the Company's Registration Statement on Form S-1, as amended, originally filed
August 4, 2000, declared effective June 17, 2001 (Commission File No. 333-43122).
- (9)
- Incorporated
by reference to Appendix B to the Company's proxy statement on Schedule 14A filed by the Company on October 7, 2004
(Commission File No. 000-32929).
- (10)
- Incorporated
by reference to Exhibit 10.15 to Form 10-Q filed by the Company on August 9, 2005 (Commission File
No. 000-32929).
- (11)
- Incorporated
by reference to Exhibit 10.25 to Form 10-K filed by the Company on March 17, 2008 (Commission File
No. 000-32929).
- (12)
- Incorporated
by reference to Exhibit 10.24 to Form 10-K filed by the Company on March 17, 2008 (Commission File
No. 000-32929).
- (13)
- Incorporated
by reference to Exhibit 10.25.1 to Form 10-Q filed by the Company on May 9, 2008 (Commission File
No. 000-32929).
- (14)
- Incorporated
by reference to Exhibit 10.25.2 to Form 10-Q filed by the Company on May 9, 2008 (Commission File
No. 000-32929).
- (15)
- Incorporated by reference to Exhibit 10.25.3 to Form 10-Q filed by the Company on May 9, 2008 (Commission File No. 000-32929).
81
- (16)
- Incorporated
by reference to Exhibit 10.26 to Form 10-K filed by the Company on March 17, 2008 (Commission File
No. 000-32929).
- (17)
- Incorporated
by reference to Exhibit 10.27 to Form 10-K filed by the Company on March 17, 2008 (Commission File
No. 000-32929).
- (18)
- Incorporated
by reference to Exhibit 10.30 to Form 10-Q filed by the Company on November 7, 2008 (Commission File
No. 000-32929).
- (19)
- Incorporated
by reference to Exhibit 10.31 to Form 10-Q filed by the Company on November 7, 2008 (Commission File
No. 000-32929).
- (20)
- Incorporated
by reference to Exhibit 10.32 to Form 8-K filed by the Company on June 12, 2009 (Commission File
No. 000-32929).
- (21)
- Incorporated
by reference to Exhibit 10.33 to Form 10-K filed by the Company on March 26, 2010 (Commission File
No. 000-32929).
- (22)
- Incorporated
by reference to Exhibit 4.8 to Form S-8 filed by the Company on June 5, 2009 (Commission File
No. 333-159753).
- (23)
- Incorporated
by reference to Exhibit 10.35 to Form 8-K filed by the Company on July 22, 2010 (Commission File
No. 000-32929).
- (24)
- Incorporated
by reference to Exhibit 10.35 to Form 10Q filed by the Company on August 8, 2011 (Commission File
No. 000-32929).
- *
- Management contract, compensatory plan or arrangement.
82