Attached files
| file | filename |
|---|---|
| EX-10.9 - EX-10.9 - MERU NETWORKS INC | a2207994zex-10_9.htm |
| EX-21.1 - EX-21.1 - MERU NETWORKS INC | a2207994zex-21_1.htm |
| EX-31.1 - EX-31.1 - MERU NETWORKS INC | a2207994zex-31_1.htm |
| EX-31.2 - EX-31.2 - MERU NETWORKS INC | a2207994zex-31_2.htm |
| EX-23.1 - EX-23.1 - MERU NETWORKS INC | a2207994zex-23_1.htm |
| EX-32.1 - EX-32.1 - MERU NETWORKS INC | a2207994zex-32_1.htm |
| EX-32.2 - EX-32.2 - MERU NETWORKS INC | a2207994zex-32_2.htm |
| EXCEL - IDEA: XBRL DOCUMENT - MERU NETWORKS INC | Financial_Report.xls |
Use these links to rapidly review the document
Table of Contents
Index to Consolidated Financial Statements
UNITED STATES
SECURITIES AND EXCHANGE COMMISSION
Washington, D.C. 20549
FORM 10-K
| (Mark One) | ||
ý |
ANNUAL REPORT PURSUANT TO SECTION 13 OR 15(d) OF THE SECURITIES EXCHANGE ACT OF 1934 |
|
For the fiscal year ended December 31, 2011 |
||
OR |
||
o |
TRANSITION REPORT PURSUANT TO SECTION 13 OR 15(d) OF THE SECURITIES EXCHANGE ACT OF 1934 |
|
For the transition period from to |
||
Commission file number: 001-34659
Meru Networks, Inc.
(Exact name of registrant as specified in its charter)
| Delaware (State or other jurisdiction of incorporation or organization) |
26-0049840 (I.R.S. Employer Identification No.) |
894 Ross Drive
Sunnyvale, California 94089
(Address of Principal Executive Offices) (Zip Code)
Registrant's telephone number including area code: (408)215-5300
Securities registered pursuant to Section 12(b) of the Act:
| Title of each class | Name of each exchange on which registered | |
|---|---|---|
| Common stock, $0.0005 par value | The NASDAQ Global Market |
Securities registered pursuant to Section 12(g) of the Act: None
Indicate by check mark if the registrant is a well-known seasoned issuer, as defined in Rule 405 of the Securities Act. Yes o No ý
Indicate by check mark if the registrant is not required to file reports pursuant to Section 13 or Section 15(d) of the Act. Yes o No ý
Indicate by check mark whether the registrant (1) has filed all reports required to be filed by Sections 13 or 15(d) of the Securities Exchange Act of 1934 during the preceding 12 months (or for such shorter period that the registrant was required to file such reports), and (2) has been subject to such filing requirements for the past 90 days. Yes ý No o
Indicate by check mark whether the registrant has submitted electronically and posted on its corporate Web site, if any, every Interactive Data File required to be submitted and posted pursuant to Rule 405 of Regulation S-T (§232.405 of this chapter) during the preceding 12 months (or for such shorter period that the registrant was required to submit and post such files). Yes ý No o
Indicate by check mark if disclosure of delinquent filers pursuant to Item 405 of Regulation S-K (§229 .405 of this chapter) is not contained herein, and will not be contained, to the best of Registrant's knowledge, in definitive proxy or information statements incorporated by reference in Part III of this Form 10-K or any amendment to this Form 10-K. ý
Indicate by check mark whether the registrant is a large accelerated filer, an accelerated filer, a non-accelerated filer, or a smaller reporting company. See the definitions of "large accelerated filer," "accelerated filer" and "smaller reporting company" in Rule 12b-2 of the Exchange Act. (Check One):
| Large Accelerated Filer o | Accelerated Filer ý | Non-accelerated Filer o (Do not check if a smaller reporting company) |
Smaller reporting Company o |
Indicate by check mark whether the registrant is a shell company (as defined in Rule 12b-2 of the Exchange Act). Yes o No ý
The aggregate market value of voting and non-voting common equity held by non-affiliates of the registrant as of June 30, 2011 (the last business day of the registrant's most recently completed second fiscal quarter), based upon the closing price of the common stock reported by the NASDAQ Global Market on such date, was approximately $130,763,000. Shares of common stock held by each executive officer and director of the registrant and by each person who owns 10% or more of the registrant's outstanding common stock have been excluded in that such persons may be deemed to be affiliates. This determination of affiliate status is not necessarily a conclusive determination for other purposes.
Number of shares outstanding of the registrant's Common Stock, $0.0005 par value, as of February 29, 2012: 17,718,384.
Documents Incorporated By Reference:
Portions of the registrant's definitive Proxy Statement related to its 2012 Annual Stockholders' Meeting to be filed pursuant to Regulation 14A within 120 days after registrant's fiscal year ended December 31, 2011 are incorporated by reference into Part III of this Annual Report on Form 10-K.
2
Unless the context suggests otherwise, references to "Meru", "us", "our", or "we" are reference to Meru Networks, Inc. and its subsidiaries, taken as a whole.
Meru Networks is a registered trademark and the Meru Networks logo, AirFirewall, patented System Director, Virtual Cell, Virtual Port, MeruAssure and E(z)RF are trademarks of Meru Networks, Inc.
FORWARD-LOOKING STATEMENTS
This Annual Report on Form 10-K contains forward-looking statements within the meaning of Section 27A of the Securities Act of 1933, as amended, and Section 21E of the Securities Exchange Act of 1934, as amended. All statements other than statements of historical facts contained in this Form 10-K, including statements regarding our future results of operations and financial position, strategy and plans, and our expectations for future operations, are forward-looking statements. Any statements contained herein that are not statements of historical facts may be deemed to be forward-looking statements. The words "believe," "may," "should," "plan," "potential," "project," "will," "estimate," "continue," "anticipate," "design," "intend," "expect" and similar expressions are intended to identify forward-looking statements. We have based these forward-looking statements largely on our current expectations and projections about future events and trends that we believe may affect our financial condition, results of operations, strategy, short-term and long-term business operations and objectives, and financial needs. These forward-looking statements are subject to a number of risks, uncertainties and assumptions, including those described in "Risk Factors." In light of these risks, uncertainties and assumptions, the forward-looking events and circumstances discussed in this Form 10-K may not occur, and actual results and the timing of certain events could differ materially and adversely from those anticipated or implied in the forward-looking statements as a result of many factors.
Although we believe that the expectations reflected in the forward-looking statements are reasonable, we cannot guarantee future results, level of activity, performance or achievements. In addition, neither we nor any other person assumes responsibility for the accuracy and completeness of any of these forward-looking statements. We disclaim any duty to update any of these forward-looking statements after the date of this Form 10-K to confirm these statements to actual results or revised expectations.
Overview
We provide a virtualized wireless local area network, or LAN, solution that is designed to cost-effectively optimize the enterprise network to deliver the performance, reliability, predictability and operational simplicity of a wired network, with the advantages of mobility. We enable enterprises to migrate their business-critical applications from wired networks to wireless networks, and become what we refer to as All-Wireless Enterprises.
Our solution represents an innovative approach to wireless networking that utilizes virtualization technology to create an intelligent and self-monitoring wireless network. Our solution is designed to overcome the limitations of legacy wireless networking architectures that cause most enterprises to maintain two separate access networks: a wired network for business-critical applications, and a wireless network for casual use. Enterprises are now seeking to become All-Wireless Enterprises in order to improve business processes, increase workforce efficiency and respond to the evolving requirements of users. The need to transition to an All-Wireless Enterprise is becoming more urgent as wireless devices
3
increasingly become the means by which users access applications. Our virtualized wireless LAN solution enables organizations to become All-Wireless Enterprises.
Our virtualized wireless LAN solution takes a fundamentally different architectural approach to wireless networking compared to most other wireless solutions. Our solution combines wireless resources into one virtual, seamless pool, and partitions this virtual pool to match device and application requirements. The core of our virtualized wireless LAN solution is comprised of our innovative System Director Operating System and complementary software applications, which are coupled with our controllers and access points. These software and hardware products are designed to operate in concert to create a virtual wireless LAN that intelligently monitors, manages and directs network traffic to optimize application performance in a secure environment. Our solution is designed to be easily deployed and integrated into our customers' existing information technology, or IT, infrastructure, to be easily managed and to address the wireless networking needs of enterprises of all sizes in every major market.
We were founded with the vision of enabling organizations to become All-Wireless Enterprises. We began commercial shipments of our products in 2003. Our products are sold worldwide primarily through value-added resellers, or VARs, and distributors, and have been deployed by approximately 6,000 customers in 56 countries.
Our Strategy
Our goal is to become the leading provider of wireless networking solutions for the enterprise. Key elements of our strategy include:
- •
- Increasing Awareness of Our Brand and Solution—We intend to
continue to promote our brand and the effectiveness of our virtualized wireless LAN solution. We also intend to expand market awareness of the strategic benefits and cost-savings of
becoming an All-Wireless Enterprise. We expect to increase our sales and marketing activities with both our partners and customers through targeted marketing programs.
- •
- Expanding Adoption across Markets—To date, we have focused on
markets that have begun the transition from using wireless networks for casual use to using wireless networks for strategic advantages. These markets include education, healthcare, hospitality,
manufacturing and retail. We intend to continue to increase our sales within these markets and expand the use of our solution into new markets, such as technology, finance, government, telecom,
transportation and utilities.
- •
- Expanding Distribution—We intend to expand and leverage our
relationships with our VARs and distributors to extend our market penetration and geographic reach.
- •
- Extending Our Technological Advantage—We believe that we
currently offer a wireless LAN solution unlike any other widely-deployed wireless networking solution in the market today, with a virtualized networking architecture that is fundamentally different
than the legacy networking architectures used in other solutions. We intend to enhance our position as a leader in wireless networking through continued technological innovation.
- •
- Enhancing Our Solution—We plan to enhance our current solution to address our customers' evolving application and deployment requirements.
Our Solution
Our virtualized wireless LAN solution is designed to cost-effectively meet the increasing demands of users and enterprises for a wireless network that delivers the performance, reliability, predictability and operational simplicity of a wired network, with the advantages of mobility. Our solution represents
4
an innovative approach to wireless networking that utilizes virtualization technology to create a wireless network that is unimpeded by the architectural deficiencies of other wireless networking solutions. We have developed a wireless networking solution that enables enterprises to migrate their business-critical applications to a wireless network, and to become All-Wireless Enterprises.
Our solution combines wireless resources into one virtual, seamless pool and partitions this virtual pool to match device and application requirements. Our use of virtualization technology for wireless networking has enabled us to deliver a solution that is designed to cost-effectively optimize the enterprise network. Our System Director Operating System limits the ability of the wireless device to select which physical access point to use, and instead shifts control of network connections to the wireless network infrastructure. When a wireless device enters the enterprise and attempts to connect with the wireless network, it is presented with a unique virtual connection point.
Further, our virtualized wireless LAN solution enables the network to monitor itself and provide predictive and proactive diagnosis of issues affecting network service. Our solution also provides comprehensive and centralized wireless management. It represents a new approach to wireless network management, using continuous recording of key network events, as well as data collection and analysis to reduce the time spent by IT personnel troubleshooting user issues and minimize user downtime. Our solution offers access to real-time and cumulative performance metrics for both individual wireless user devices and access points, as well as the network as a whole. From a single interface, which can be accessed remotely, IT personnel can engage in focused and deep analysis of the entire wireless network, and view activity details at each level of the infrastructure: controllers, access points and individual wireless user devices.
Our solution is based on our System Director, embedded with Virtual Cell and Virtual Port technologies. Our System Director coordinates all of the components of our solution, including our access points and controllers. Our software, controllers and access points are designed to be easily deployed and integrated into existing IT infrastructure. Our solution is designed to be easily managed and scalable across enterprises of all sizes. In addition, it provides comprehensive security capabilities to ensure that the wireless network is at least as secure as a wired network. It has been deployed by enterprises in many markets, such as education, healthcare, hospitality, manufacturing, retail, technology, finance, government, telecom, transportation and utilities. We have achieved significant success among enterprises in these markets, which have been at the forefront of the transition from using wireless networks for casual use to using wireless networks for strategic advantages.
Our solution is designed to optimize the wireless enterprise network to cost-effectively deliver the performance, reliability, predictability and operational simplicity of a wired network.
Our virtualized wireless LAN solution is designed to deliver the following benefits to users:
- •
- Reliable Access to Applications—Our solution places control of
wireless connections with the network instead of the wireless device. Through our virtualization process, our solution ensures that each wireless device, whether stationary or in motion, is optimally
connected to the network, and provides a reliable experience for users regardless of the device or application they are using.
- •
- High Performance—Our solution is designed specifically to
leverage the capabilities of the ratified 802.11n wireless communication standard; and the performance of wireless networks using our solution can surpass the performance delivered by widely-deployed
wired access networks.
- •
- Enhanced Ability to Run Converged Applications—The performance, reliability and predictability of our solution enable a wired-like experience that allows users to access their business-critical applications, including voice, video and data, on their wireless devices.
5
Further, enterprises can realize the following benefits by deploying our solution:
- •
- Ability to Maximize the Benefits of Business-Critical
Applications—We deliver a reliable and predictable solution that enables enterprises to run business-critical applications over a wireless network. By enabling
their workforces to run business-critical applications in a mobile environment, enterprises can better serve their customers and increase the productivity of their workforces.
- •
- Reduced Infrastructure Costs—Our solution enables enterprises
to significantly reduce their network infrastructure expenses. Our solution enables enterprises to deploy a wireless network without expensive and detailed site surveys and configuration efforts.
Further, we believe that creating new wireless connections is significantly less capital-intensive than creating new wired connections, because less hardware and labor is required to provide network
connectivity. Additional cost savings are realized as enterprises add or move employees. Moreover, our solution typically requires fewer access points than other wireless networking solutions, thereby
reducing the hardware and labor costs associated with installing a wireless network.
- •
- Lower Operational Expenses—Our solution enables enterprises to
significantly reduce their network infrastructure operational expenses. It reduces the need for maintenance and management of a wired network. Our solution also reduces the need for periodic site
surveys and the physical redeployment of existing installed access points on an ongoing basis. Our solution coordinates the access points allowing them to operate at peak transmit power, thus
achieving a greater range of coverage, and typically requires fewer access points than other wireless solutions. Our solution is engineered so that each access point consumes energy more efficiently
than access points in other wireless networking solutions. This reduces the overall power consumption of the network and reduces ongoing operational expenses. All of these factors enhance an IT
department's ability to maintain and manage the network in a cost-effective manner.
- •
- Efficient Scalability—Our solution has been designed to easily increase the network's capacity in response to the changing needs of the enterprise. In order to expand the wireless network coverage areas, an enterprise deploying our solution can easily add access points as necessary. For increases in the capacity of a wireless network, an enterprise operating our solution can easily add another radio frequency, or RF, channel and deploy additional access points on that added RF channel. With our solution, unlike with other wireless networking solutions, typically there is no need to re-survey the enterprise's facilities or physically redeploy existing installed access points, which can significantly reduce the labor and material expenses of building out a wireless network.
Technology
Our virtualized wireless LAN architecture integrates our proprietary software on industry-standard hardware and protocols. In order to achieve wired-like performance, reliability, predictability and operational simplicity in a wireless network, our System Director Operating System integrates two key technologies: Virtual Cell and Virtual Port.
Virtual Cell—A Virtual Cell is created when wireless resources from multiple physical access points are pooled together to provide the abstraction of a single access point to a wireless device, with each physical access point operating on the same radio channel and offering identical services. This pooling completely masks the identities of individual access points from the perspective of users and their wireless devices. The physical access points become indistinguishable to wireless devices which only see one common network connection. The entire Virtual Cell has one common identity, and the wireless device effectively connects to the Virtual Cell and not to individual access points. As a wireless device
6
moves, our System Director determines the best physical access point to serve the device and seamlessly migrates the wireless device to the appropriate access point.
The use of Virtual Cell technology can provide a number of key advantages over legacy wireless network architectures:
- •
- Predictable Service through Network Control—In legacy wireless
network architectures, the wireless device remains in control of its connection to the network and is allowed to make connection decisions based on its own needs, which can degrade the overall
performance of the network. In a Virtual Cell, the network controls the connection decision for each device, ensuring optimum use of the network
resources, independent of the hardware, software, or settings of the device. Virtual Cell technology converts wireless service from a device-controlled
network to a network-controlled system, increasing the predictability of service available to each wireless device.
- •
- Stable Coverage—The design of legacy wireless architectures
requires that neighboring access points be placed on different channels to mitigate interference. This approach creates a complex optimization problem of ensuring that there are no gaps in wireless
coverage while simultaneously minimizing coverage overlap between access points on the same channel—a difficult problem to solve since coverage is practically impossible to predict
accurately. Virtual Cell takes a fundamentally different approach by pooling all access points together on the same channel. Our System Director coordinates
each device's access to the network, and through this coordination, mitigates interference across access points. Using this approach, coverage
issues are solved by simply adding access points to the Virtual Cell.
- •
- Cost Reductions from Fewer Access Points—Unlike with legacy
wireless architectures, where the RF transmit power of access points is typically lowered to reduce interference, with Virtual Cell all access points
operate at peak power, and thus achieve a greater range of coverage. We believe this approach results in more robust wireless coverage and also can reduce the number of access points required in the
network.
- •
- Rapid and Cost-Effective Deployment—The deployment
of other wireless networks involves the cumbersome and iterative process of placing and tuning access points in an effort to maximize wireless coverage and minimize interference. This often requires
detailed and expensive site surveys and configuration efforts. By pooling wireless resources without having to consider whether access points are poorly spaced, Virtual
Cell allows enterprises to deploy wireless networks more quickly and at lower cost than alternate approaches. Wireless network deployment with Virtual
Cell is more closely related to simple "painting" of the coverage area than to careful placing and adapting of access points. Our Virtual
Cell technology allows enterprises to react quickly to significant increases in the number of wireless devices and to changes in the physical layout of a particular location by
adding access points as necessary. Virtual Cell technology enables enterprises to avoid expensive and detailed site surveys and reconfiguration efforts
often required to adapt to these changes on networks deploying other wireless networking solutions.
- •
- Efficient Network Redundancy—In order to support business-critical applications over a network, enterprises require redundancy in the network infrastructure. We believe pooling wireless resources provides the most effective method for providing redundancy on a wireless network. Unlike legacy wireless architectures, which utilize multiple channels to provide basic coverage, a Virtual Cell occupies only one channel, leaving the remaining channels available. Adding a second Virtual Cell on one of these available channels instantly doubles the capacity of the network, and also provides a redundant channel.
7
Virtual Port—Within the Virtual Cell, our patented System Director assigns each wireless device a unique identifier and a dedicated virtual link to the network, which we refer to as a Virtual Port. The Virtual Port allows our System Director to allocate resources to each individual device taking into account that particular device's unique network needs and the applications running on that device. The Virtual Port remains with each wireless device for the life of its connection to the network, even as the wireless device moves. This allows the wireless network to deliver a dedicated and customized wireless service for each device. At the same time, our System Director continues to optimize the overall performance and reliability of the network.
Generating a unique Virtual Port for each wireless device can provide a number of key benefits:
- •
- Optimized Allocation of
Resources—Virtual Port allows our System Director to optimize the
allocation of network resources among devices, thereby ensuring that the service for a device is not impacted by the behavior of any other device. This provides wire-like predictability
and the ability to support diverse wireless devices.
- •
- Improved Support for Converged
Applications—Virtual Port provides an effective method for controlling the quality of service parameters for each
device and application, thereby enabling the network to support multiple types of applications, including latency-sensitive voice and video applications.
- •
- Enhanced Mobility—The Virtual Port always follows the wireless device and the associated network policies throughout the network. Our System Director seamlessly migrates the connection and associated network policies of the device to whichever physical access point can optimally service that device, thus providing the user with a predictable connection to the network.
Products
We provide a virtualized wireless LAN solution that is built around our System Director Operating System, which runs on our controllers and access points. We offer additional products designed to deliver centralized network management, predictive and proactive diagnostics, as well as enhanced security. Our products allow enterprises to leverage their investments in their existing IT infrastructures.
Meru System Director Operating System
Our patented System Director Operating System forms the core of our virtualized wireless LAN solution and is the common software foundation that runs on our scalable range of controllers and our line of Wi-Fi-certified wireless access points. It provides centralized coordination and control of all the access points on the network and delivers a set of services for application-aware optimization of the network, comprehensive security, high availability, flexible deployment and simple operations.
- •
- Application-Aware Optimization—Our System Director monitors and classifies applications being accessed by wireless
devices on the network to optimize the performance of these applications
over our virtualized wireless LAN. This enables our solution to support a high density of wireless devices and deliver wired-like performance for business-critical applications, such as
voice, video and other latency-sensitive applications like medical telemetry.
- •
- Comprehensive Security—Our System Director delivers firewalling and policy enforcement of centralized security policies that manage network access by application type, by device and by user. Our System Director also provides strong authentication and encryption using the industry-standard WPA2 protocol, integration with enterprise authentication and authorization infrastructure, as well as guest access management for temporary users. Additional security
8
- •
- High Availability—Our System
Director includes a redundancy feature that increases the availability of the wireless network in a cost-effective manner. It allows one of our controllers to serve
as a backup to multiple controllers, providing cost-effective redundancy. Controller redundancy increases the reliability of wireless networks by mitigating the failure of a controller in
the network. Our System Director also allows an additional layer of access points to be easily added by deploying an additional channel, providing
another cost-effective redundancy alternative.
- •
- Flexible Deployment—Our System
Director has numerous capabilities that allow for the flexible deployment of a wireless network. It supports the deployment of access points and controllers anywhere within an
enterprise's global infrastructure from headquarters to branch offices.
- •
- Simplified Operations—Our System Director simplifies the ongoing operation of wireless networks. It allows all management and security policies for the entire wireless network to be centrally configured and administered. Our System Director enables predictive and proactive diagnosis of service problems and rapid troubleshooting by recording and replaying network events. In addition, our System Director integrates with third-party enterprise IT management systems through industry-standard protocols.
features embedded within our System Director include wireless intrusion detection and mitigation capabilities, as well as user access logging and accounting capabilities.
Meru Controllers
We provide a family of scalable Meru controllers that run our System Director and work in conjunction with our access points to provide high performance and reliable network service to wireless devices. Our controllers synchronize access points to optimize the user experience and manage all traffic on the network.
Our family of controllers, summarized in the following table, is designed to meet the scale and performance needs of different sized networks from small branch offices or small enterprises to large campus environments or enterprise headquarters. All of the controller platforms run our System Director Operating System and each controller delivers a common set of capabilities independent of the size of the network.
| |
MC5000 | MC4200 | MC3200 | MC1500 | ||||
|---|---|---|---|---|---|---|---|---|
Maximum Number of Access Points |
1,500 | 500 | 200 | 30 | ||||
Typical Deployment |
Large Campus | Large Enterprise | Mid-sized | Small | ||||
|
Branch offices | Enterprise | Enterprise | |||||
|
Remote Office |
Meru Access Points
Our 802.11a/b/g/n industry-standard, Wi-Fi-certified access points provide network connectivity for wireless devices. They are typically deployed in ceilings within buildings and automatically discover and connect to our controllers, providing wireless service to users based on the centralized policies configured for the network. Our access points also monitor the network and gather information that is used to provide enhanced security, centralized network management, and proactive and predictive diagnostic capabilities.
We provide a comprehensive line of 802.11a/b/g/n industry-standard access points that can be combined with a set of external antennae to support different coverage needs. We have access point models for deployment indoors and outdoors.
9
In late 2010, we introduced the AP1000i, the newest entry level, high value access point solution in our product family designed to be an easy to deploy and manage wireless LAN, solution. This solution has broadened our opportunities to work with customers requiring world class connectivity and performance while also meeting aggressive budget requirements.
In 2011, we delivered the AP400 Series and OAP380. Featuring a three-radio, three-stream design and ability to add a fourth radio, the AP400 Series maximize high client density and diversity. Comprised of four radios, two for mesh and two for user services, the OAP 380 enables enterprises to extend network deployments to outdoor locations. In January 2012, we announced availability of our OAP433e, a new, rugged outdoor Wi-Fi access point and the first three-radio, three-stream 802.11n outdoor access point in the industry with 1.35 Gbps of data rate capacity; it is designed to bring state-of-the-art, virtualized Wi-Fi to the thousands of devices being used across education and corporate campuses, hotels, shopping malls and stadiums.
Meru E(z)RF Application Suite
The Meru Networks E(z)RF Application Suite enables enterprises to configure, monitor, troubleshoot, secure and operate our virtualized wireless LAN solution. Each of the following software applications can be purchased separately:
- •
- E(z)RF Network Manager—Our E(z)RF
Network Manager provides a comprehensive, centralized wireless management and troubleshooting system designed to lower the total cost of ownership for an organization. It
provides centralized management through network visualization, configuration, wireless performance dashboards and fault management. From a single interface, IT managers can rapidly view activity
details at each level of the infrastructure: controllers, access points and individual wireless devices. It offers access to real-time and cumulative performance metrics covering both
individual wireless devices or access points and the network as a whole. It is a highly scalable platform representing a new approach to wireless LAN management, using continuous recording of key
network events, as well as data collection and analysis to reduce the time spent by IT personnel troubleshooting user issues and to minimize user downtime.
- •
- E(z)RF Service Assurance Manager—Our E(z)RF Service Assurance Manager is designed to deliver
end-to-end service assurance for the network and the applications that
run on the wireless network. It creates virtual devices on existing access points, which actively inject traffic over the air to test and verify the performance of the network. This allows the system
to quickly isolate faults or potential issues, whether they occur in the wireless network or in the backend wired infrastructure even before users experience them.
- •
- E(z)RF Location Manager—Our E(z)RF
Location Manager provides the capability to automatically track the physical location of thousands of wireless devices, including wireless-enabled laptops and PDAs, wireless
VoIP handsets as well as unauthorized access points. It also has the capability to create security policies based on enterprise-defined parameters, and it provides an application programming interface
that enables integration with third-party business process applications, such as asset tracking.
- •
- E(z)RF OnTheGo—Our E(z)RF
OnTheGo provides customized dashboards on mobile devices, such as smartphones, allowing IT personnel to monitor and manage the network from any location in the world with a
Wi-Fi or cellular connection.
- •
- Spectrum Manager—Our Spectrum Manager is a comprehensive spectrum analysis solution. It identifies sources of interference and interferer data and presents in rich graphical dashboards as well as detailed current and historical reports.
10
- •
- Wired and Wireless Management—Our Wired and Wireless Management solution provides a centralized view of all network resources and operations for both wired and wireless networks. It delivers enterprise scalability, automated alerts, and multi-vendor fault and performance management.
Security Applications
We also provide a number of hardware and software security solutions that allow constant monitoring and defense against security breaches. Each of the following security applications can be purchased separately:
- •
- Identity Manager—Our Identity Manager simplifies secure,
scalable, flexible enterprise network access and identity management in dense wireless environments with a diversity of users and device, including employees and their guests. The Meru Smart Connect
feature gives users the power to easily connect to wireless and wired networks with any device while adhering to strict IT security
requirements. The Meru Guest Management feature provides easy-to-use, one-click self-provisioning
capabilities with centralized, customizable portals for guest authentication to allow deployment of secure, scalable and flexible visitor networks to manage thousands of users.
- •
- Wireless Intrusion Prevention System
(WIPS)—Our WIPS's built-in database includes signatures for a variety of common wireless security threats as well as a simple
way for network managers to add more. WIPS is able to recognize threats and then mitigate them before they can do any harm. The action taken upon
detection of a threat is fully customizable, as are the reports that the system can automatically generate using its full logging capability.
- •
- Compliance Manager—The Payment Card Industry Data Security
Standard (PCI DSS) mandates a minimum layer of protection and a set of best practices that everyone must follow who processes, transports or stores credit and debit card information. Compliance
Manager helps reduce the risk of a security breach, protecting customer and employee personal information by extending security to the wireless network. In addition, the solution offers physical
security that prevents outsiders from even knowing the network exists and makes it easy to follow PCI DSS best practices.
- •
- AirFirewall—Our AirFirewall is designed to intercept and block unwanted communications as they are
transmitted over the air, stopping them before they reach the
network. It prevents unauthorized access to the network, while leaving authorized services unaffected.
- •
- Security Gateway SG1000—Our Security Gateway SG1000 is a centralized system designed to meet the exacting demands of the Federal Information Processing Standard, or FIPS, 140-2 Level 3 security required by federal government agencies and other security-conscious organizations as they broadly adopt wireless LANs. It secures our entire wireless LAN to the FIPS 140-2 standard.
Support and Services
We offer customer support and services based on the deployment needs of our customers. We offer service contracts in varying lengths of up to five years.
MeruAssure, our customer support offering, maximizes and protects our customers' wireless LAN investment with comprehensive services and support. By helping to keep network operations running efficiently, MeruAssure minimizes disruption to business operations, combining incident detection, investigation and diagnosis with the monitoring, recovery and resolution needed to support business-critical network resources. Our customer support offering provides our customers with software upgrades, online access to our knowledge database of technical information related to our virtualized wireless LAN solution and access to our customer service personnel. In order to better serve our
11
customers, we have support centers in Sunnyvale, California and Bangalore, India and a separate outsourced support center in India available to respond live 24 hours a day, every day. Our customers also receive first level support through our VARs.
In addition, we may provide professional services to our customers. Our professional service offerings help our customers extract additional strategic value from our virtualized wireless LAN solution. With a team of experienced engineers and consultants, our professional services organization assists enterprises in deploying and operating our solution. We offer a variety of professional service engagements to meet the varying needs of our customers.
We also train our VARs and offer training to our customers. Our training department conducts basic and advanced courses online, onsite at customer locations and at our training facility in Sunnyvale, California. In addition to our standard training programs, we offer different levels of Meru certification programs, which certify participants upon successful completion of the program covering our products and wireless technologies.
Customers
Our virtualized wireless LAN solution has been deployed by approximately 6,000 customers in 56 countries worldwide in many markets, including education, healthcare, hospitality, manufacturing, retail, technology, finance, government, telecom, transportation and utilities. Our solution is deployed in a wide range of enterprises, from smaller enterprises with single locations to large global enterprises.
We derived 55%, 64% and 72% of our revenues from sales to customers located in the United States in the years ended December 31. 2011, 2010 and 2009, respectively, and 45%, 36% and 28% of our revenues from international sales in the years ended December 31, 2011, 2010 and 2009, respectively. See the discussion of international sales and operations under "Our international sales and operations subject us to additional risks that may materially and adversely affect our business and operating results" in Item 1A. "Risk Factors".
The table below lists our channel partners, sales to whom represent 10% or more of our consolidated revenues (in percentages):
| |
Years Ended December 31, |
|||||||||
|---|---|---|---|---|---|---|---|---|---|---|
Major Channel Partners
|
2011 | 2010 | 2009 | |||||||
Westcon Group, Inc. |
29 | 34 | 21 | |||||||
Catalyst Telecom, Inc. |
13 | 12 | 14 | |||||||
Siracom, Inc. |
11 | * | * | |||||||
- *
- Less than 10%
Revenues from external customers, measures of profit and loss and total asset information are included in our consolidated financial statements included in this report under Item 8 "Financial Statements and Related Data."
Sales and Marketing
We sell our products and support worldwide primarily through VARs and distributors. These channel partners help market and sell our products and services to a broad array of enterprises and allow us to leverage our sales force. In some cases, we support our VARs' market development efforts through contributions to their marketing spending. In accordance with our distribution agreements and industry practice, certain distributors have agreements with us which allow for price protection and stock return privileges on certain inventory.
12
Our sales force is responsible for managing sales within each of our geographic territories. Since early 2011, we rapidly expanded our field sales organization to provide improved coverage of the growing number of business opportunities in our target markets, approximately doubling our sales headcount by early 2012. We expect to continue to grow sales headcount, though at a reduced rate, in 2012. Significant ongoing efforts have been made in training and on-boarding activities to assist new sales teams to become productive. As of December 31, 2011, we had sales personnel located in the Americas, Europe, Middle East and Africa (EMEA) and the Asia Pacific regions. We operate in one reportable segment.
Our marketing activities consist primarily of public relations, demand generation, direct marketing, website operations, technology conferences, trade shows, seminars and events, advertising and promotions. In late 2011, we made a variety of investments in our marketing programs to complement the expansion of our field sales headcount. Market awareness of our capabilities and products is essential to our continued growth and our success in all of our markets.
We believe that there can be significant seasonal factors that may cause the first and third quarters of our fiscal year to have relatively weaker products revenues than the second and fourth fiscal quarters. See the discussion of seasonality under "Overview" in Item 7. "Management's Discussion and Analysis of Financial Condition and Results of Operations" for a more complete description of the factors contributing to seasonal variation in our business.
Research and Development
Our continued investment in research and development is critical to our business. We have assembled a team of engineers with expertise in various fields, including networking technologies, applications, wireless communications, and network and systems management. Our research and development team is based in Sunnyvale, California and Bangalore, India. We staff our development projects with engineers in both locations and operate our research and development team as an integrated unit. We have invested significant time and financial resources into the development of our System Director Operating System and related software and hardware products. We plan to expand our product offerings and solutions capabilities in the future and plan to dedicate significant resources to these continued research and development efforts. In the years ended December 31, 2011, 2010, and 2009, our research and development operating expenses were $14.0 million, $12.4 million, and $10.0 million, respectively.
Manufacturing
We outsource manufacturing of our hardware products to original design manufactures, or ODMs, and contract manufacturers, or CMs. Our ODMs and CMs are responsible for sourcing all the components included in our hardware products. These components and the raw materials required to manufacture them are generally available but, the chipsets that we use in our products are currently available only from a limited number of sources, with whom neither we nor our manufacturers have entered into supply agreements. We perform rigorous in-house quality control testing to ensure the reliability of our products. We outsource the warehousing and delivery of our products to a third-party logistics provider in the U.S. for worldwide fulfillment.
Competition
The wireless networking market is highly competitive and continually evolving. We believe that we compete primarily on the basis of providing a comprehensive solution that delivers high-performing, reliable and predictable wireless networking solutions in a cost-effective manner. We believe other principal competitive factors in our market include the ability to provide quality customer service and support, the ease with which a wireless network can be initially deployed and scaled to meet an
13
enterprise's needs, the interoperability of a wireless network with a wide range of devices, the ability to provide appropriate levels of security and the ability to bundle wireless products with other networking offerings. We generally compete favorably with our competitors; however, many of our actual and potential competitors enjoy substantial competitive advantages over us, such as greater name recognition, more products and services and substantially greater financial, technical and other resources.
Our primary competitors include Cisco Systems, primarily through its wireless networking business unit, Aruba Networks, Motorola through its acquisition of Symbol Technologies, Hewlett-Packard through its acquisition of Colubris Networks and Juniper Networks through its acquisition of Trapeze Networks. We also face competition from a number of smaller companies.
Intellectual Property
Our success as a company depends upon our ability to protect our core technology and intellectual property. To accomplish this, we rely on a combination of intellectual property rights, including patents, trade secrets, copyrights and trademarks, as well as customary contractual protections.
Patents and Patent Applications. We have been granted eight U.S. patents, which will expire in 2026 through 2030. We have 28 non-provisional patent applications pending in the U.S. Patent and Trademark Office. We expect to file additional patent applications from time to time. We do not know whether any of our outstanding patent applications will result in the issuance of a patent, and even if additional patents are ultimately issued, the examination process may require us to narrow our claims. Our issued patents are intended to protect certain of our core technologies, but these patents may be contested, circumvented, found unenforceable or invalidated, and we may not be able to prevent third parties from infringing them. Therefore, the exact effect of having a patent cannot be predicted with certainty.
Atheros License Agreement. We are party to a non-exclusive license agreement with Atheros Communications whereby we license certain technology that we incorporate into our access points. Atheros Communications is our only supplier of this technology in several of our access points. In the event our license agreement with Atheros Communications is terminated, we would be required to redesign some of our products in order to incorporate technology from alternative sources, and any such termination of the license agreement and redesign of certain of our products could materially and adversely affect our business. The initial term of the license agreement with Atheros Communications began on August 7, 2009 with a one year term and automatically renews for successive one-year periods unless the agreement is terminated prior to the end of the then-current term.
Our registered trademark in the U.S. is Meru Networks. In addition, we rely on a combination of trade secrets and trademark laws to maintain and develop our competitive position with respect to intellectual property. We generally control access to and use of our proprietary software and other confidential information through the use of internal and external controls, including contractual protections with employees, contractors, customers and partners, and our software is protected by U.S. and international copyright laws. We also incorporate certain generally available software programs into our products pursuant to license agreements with third parties.
From time to time, we may encounter disputes over rights and obligations concerning intellectual property. Although we believe that our product offerings do not infringe the intellectual property rights of any third party, we cannot be certain that we will prevail in any intellectual property dispute. If we do not prevail in these disputes, we may lose some or all of our intellectual property protection, be enjoined from further sales of our products that are determined to infringe the rights of others, and/or be forced to pay substantial royalties to a third party, any of which would adversely affect our business, financial condition and results of operations.
14
On June 13, 2011, we entered into a Patent Cross License Agreement, or Motorola License Agreement, with Motorola Solutions, Inc., and its affiliates, including Symbol Technologies, Inc., Wireless Valley Communications, Inc., and AirDefense, Inc., or collectively Motorola. Pursuant to the Motorola License Agreement, we and Motorola each agreed to:
- •
- provide one another with limited licenses through November 3, 2016 to certain of each of their respective 802.11
wireless LAN patent portfolios;
- •
- release one another of certain claims based on infringement or alleged infringement of certain patent rights; and
- •
- covenant not to assert patent claims against one another's current products and certain commercially reasonable extensions thereof for three years.
As part of the Motorola License Agreement, we paid Motorola $7.3 million in 2011.
Employees
As of December 31, 2011, we had 403 employees in offices across the Americas, EMEA and Asia Pacific regions. A total of 166 employees are located outside the United States. As of December 31, 2011, none of our employees were represented by a union or covered by a collective bargaining agreement. We consider our employee relations to be good and have never experienced a work stoppage.
Effective May 12, 2011, Dr. Vaduvur Bharghavan, our Chief Technology Officer, notified us of his intention to transition from his day to day role as our Chief Technology Officer. On October 3, 2011, we announced that Ihab Abu-Hakima had informed us of his determination to resign as Chief Executive Officer, effective the earlier of (a) March 31, 2012, or (b) the date that is 30 days after the date on which we appoint a new Chief Executive Officer who begins work in that capacity. Subsequent to Mr. Abu-Hakima's decision, Barry Newman was appointed to serve as Vice Chairman of the Board of Directors and William Quigley, in his position as Chairman of the Board of Directors, took a more active role during the transition of Mr. Abu-Hakima as the Company's Chief Executive Officer.
Corporate Information
We were incorporated in Delaware in January 2002. Our principal executive offices are located at 894 Ross Drive, Sunnyvale, California, 94089, U.S.A., and our telephone number is 1-408-215-5300. Our website address is www.merunetworks.com. The information on or accessible through our website is not part of this Annual Report on Form 10-K.
On August 31, 2011, we acquired all of the outstanding stock of Identity Networks, or Identity, a privately-owned provider of complete guest and device access management solutions located in the United Kingdom.
Additional Information
We make available, free of charges, through a link at our investor relations website located at investors.merunetworks.com, access to our Annual Report on Form 10-K, quarterly reports on Form 10-Q, current reports on Form 8-K and any amendments to those reports filed or furnished pursuant to Section 13(a) or 15(d) of the U.S. Securities Exchange Act of 1934, as amended (Exchange Act) as soon as reasonably practicable after they are electronically filed with or furnished to the Securities and Exchange Commission, or SEC. Our SEC reports can be accessed through the Investor Relations section of our website. The information found on our website is not part of this or any other report we file with or furnish to the SEC. A copy of our Annual Report on Form 10-K is available without charge to stockholders upon written request to: Investor Relations, Meru Networks, Inc.,
15
894 Ross Drive, Sunnyvale, California 94089. Further, a copy of this Annual Report on Form 10-K is located at the SEC's Public Reference Room at 100 F Street, N.E., Washington, D.C. 20549. Information on the operation of the Public Reference Room can be obtained by calling the SEC at 1-800-SEC-0330. The SEC maintains an Internet site that contains reports, proxy and information statements and other information regarding our filings at http://www.sec.gov.
Risks Related to Our Business and Industry
Our business is subject to many risks and uncertainties, which may affect our future financial performance. If any of the events or circumstances described below occurs, our business and financial performance could be harmed, our actual results could differ materially from our expectations and the market value of our stock could decline. The risks and uncertainties discussed below are not the only ones we face. There may be additional risks and uncertainties not currently known to us or that we currently do not believe are material that may harm our business and financial performance. Because of the risks and uncertainties discussed below, as well as other variables affecting our operating results, past financial performance should not be considered as a reliable indicator of future performance and investors should not use historical trends to anticipate results or trends in future periods.
We expect to incur operating losses throughout 2012 that, absent additional financing, would result in lower cash balances on hand by the end of 2012.
We expect to incur operating losses and continued cash usage in 2012 as a result of expenses associated with the continued development and expansion of our business, including expenditures related to the strategic decision to double the size of our field sales team between early 2011 and early 2012. As of December 31, 2011, we had cash and cash equivalents and short-term investment balances of $40.3 million.
While we believe our cash and cash equivalents will be sufficient to meet our anticipated cash needs for at least the next 12 months from the date of this report, if we do not borrow from our credit line or otherwise raise additional financing, our cash balances will be reduced to comparatively lower levels over the next twelve months. Should these lower cash balances materialize, it could make it more difficult to obtain new customers and retain existing customers. In addition, we could see increased employee attrition and difficulty attracting new employees. These developments could materially and adversely impact our business and operating results.
Our future capital needs are uncertain and we may need to raise additional funds in the future, and if we require additional funds in the future, such funds may not be available on acceptable terms, or at all.
We believe that our existing cash and cash equivalents, short-term investments and the amounts available under our line of credit facility, will be sufficient to meet our anticipated cash requirements for at least the next 12 months. We may, however, need to raise substantial additional capital due to changes in business conditions or other future developments or in order to:
- •
- expand the commercialization of our products;
- •
- fund our operations;
- •
- continue our research and development;
- •
- defend, in litigation or otherwise, any claims that we infringe third-party patents or violate other intellectual property
rights;
- •
- commercialize new products; and
- •
- acquire companies and in-licensed products or intellectual property.
16
Our future funding requirements will depend on many factors, including:
- •
- the time required for new sales managers to become productive.
- •
- successful implementation of, and achieving benefits from, our marketing activities;
- •
- market acceptance of our products;
- •
- the cost of our research and development activities;
- •
- the cost of filing and prosecuting patent applications;
- •
- the cost of defending, in litigation or otherwise, any claims that we infringe third-party patents or violate other
intellectual property rights;
- •
- the cost and timing of establishing additional sales, marketing and distribution capabilities;
- •
- the cost and timing of establishing additional technical support capabilities;
- •
- the effect of competing technological and market developments;
- •
- the market for such funding requirements and overall economic conditions; and
We may require additional funds in the future and we may not be able to obtain such funds on acceptable terms, or at all. If we raise additional funds by issuing equity securities, our stockholders may experience dilution. The holders of new equity securities may also receive rights, preferences or privileges that are senior to those of existing holders of our common stock. Debt financing, if available, may involve covenants restricting our operations or our ability to incur additional debt. Any debt or additional equity financing that we raise may contain terms that are not favorable to us or our stockholders. If we do not have, or are not able to obtain, sufficient funds, we would be required to modify our growth and operating plans to the extent of available funding, which would harm our ability to grow our business. We may also have to delay development or commercialization of our products or license to third parties the rights to commercialize products or technologies that we would otherwise seek to commercialize. If we raise additional funds through collaboration and licensing arrangements with third parties, it may be necessary to relinquish some rights to our technologies or our products, or grant licenses on terms that are not favorable to us. If we are unable to raise adequate funds, we may have to liquidate some or all of our assets, or delay, reduce the scope of or eliminate some or all of our development programs. We also may have to reduce sales, marketing, customer support or other resources devoted to our products or cease operations. Any of these factors could harm our operating results. See "Management's Discussion and Analysis of Financial Condition and Results of Operations—Liquidity and Capital Resources—Capital Resources.
If we do not effect a smooth transition to a new Chief Executive Officer, our business and operating results may suffer and our stock price may decline.
On October 3, 2011, we announced that our Chief Executive Officer, Ihab Abu-Hakima, had informed us of his determination to transition his role with our Company to new leadership. At that time, Mr. Abu-Hakima agreed pursuant to a transitional employment agreement to remain as our President and Chief Executive Officer for a transition period until the earlier of March 31, 2012, or the date that is thirty days after the date on which a new Chief Executive Officer is appointed and commences work in that capacity. However, Mr. Abu-Hakima remains an at-will employee and he may terminate his employment with us at any time for any reason. As of the date of this filing, efforts to identify and retain the new Chief Executive Officer are ongoing. In the event that we are unable to identify and retain a new Chief Executive Officer prior to March 31, 2012 or such earlier date as Mr. Abu-Hakima may elect to terminate his employment with us, or if we are otherwise unable to effect a smooth transition to a new Chief Executive Officer, our Board of Directors and senior management team may be challenged in their ability to effectively lead and manage Meru, it may result
17
in uncertainty from our business partners, customers, employees and investors and it may cause other disruptions to our business, any of which could harm our business and operating results and cause our stock price to decline. Our new Chief Executive Officer will likely also require a period of time to assimilate into our company and become fully productive, which could negatively impact our business, at least in the short term. In addition, we will incur substantial costs in connection with Mr. Abu-Hakima's transition, including costs relating to our financial obligations to Mr. Abu-Hakima under the transitional employment agreement and the fees of the executive search firm we have retained to assist us in identifying Chief Executive Officer candidates.
We have a limited operating history, which makes it difficult to predict our future operating results.
We were incorporated in January 2002 and began commercial shipments of our products in December 2003. As a result of our limited operating history, it is very difficult to forecast our future operating results. We face challenges in our business and financial planning as a result of the uncertainties resulting from having had a relatively limited time period in which to implement and evaluate our business strategies as compared to more mature companies with longer operating histories. These uncertainties make it difficult to predict our future operating results. If the assumptions we use to plan our business are incorrect or change in reaction to a change in our markets, our financial results could suffer.
We have incurred significant losses since inception, and could continue to incur losses in the future.
We have incurred significant losses since our inception, including net losses of $26.7 million, $36.6 million and $17.4 million during 2011, 2010 and 2009, respectively. As of December 31, 2011, we had an accumulated deficit of $221.9 million. These losses have resulted principally from costs incurred in our research and development programs, sales and marketing programs, and non-cash adjustments to the fair value of our warrant liability. We expect to incur operating losses in the future as a result of the expenses associated with the continued development and expansion of our business, including expenditures to hire additional personnel for sales and marketing. Additionally, our general and administrative expenses have increased due to the additional operational and reporting costs associated with being a public company and we expect these costs to continue to increase. We may also increase our research and development expenses. Our ability to attain profitability in the future will be affected by, among other things, our ability to execute on our business strategy, the continued acceptance of our products, the timing and size of orders, the average selling prices of our products, the costs of our products, and the extent that we invest in our sales and marketing, research and development, and general and administrative resources. Even if we do achieve profitability, we may not be able to sustain or increase our profitability. As a result, our business could be harmed and our stock price could decline.
Fluctuations in our revenues and operating results could cause the market price of our common stock to decline.
Our revenues and operating results are difficult to predict, even in the near term. Our historical operating results have in the past fluctuated significantly, and may continue to fluctuate in the future, as a result of a variety of factors, many of which are outside of our control. As a result, comparing our revenues and operating results on a period-to-period basis may not be meaningful, and you should not rely on our past results as an indication of our future performance. We may not be able to accurately predict our future revenues or results of operations. We base our current and future expense levels on our operating plans and sales forecasts, and our operating costs are relatively fixed in the short-term. As a result, we may not be able to reduce our costs sufficiently to compensate for an unexpected shortfall in revenues, and even a small shortfall in revenues could disproportionately and adversely affect financial results for that quarter. It is possible that our operating results in some periods may be
18
below market expectations. This would likely cause the market price of our common stock to decline. In addition to the other risk factors listed in this section, our operating results are affected by a number of factors, including:
- •
- our sales volume;
- •
- fluctuations in demand for our products and services, including seasonal variations;
- •
- average selling prices and the potential for increased discounting of products by us or our competitors;
- •
- the timing of revenue recognition in any given period as a result of revenue recognition guidance under accounting
principles generally accepted in the U.S.;
- •
- our ability to forecast demand and manage lead times for the manufacturing of our products;
- •
- shortages in the availability of components used in our products, including components whose manufacturing lead times have
increased significantly or may increase in the future;
- •
- our ability to control costs, including our operating expenses and the costs of the components we purchase;
- •
- our ability to develop and maintain relationships with our channel partners;
- •
- our ability to develop and introduce new products and product enhancements that achieve market acceptance;
- •
- any significant changes in the competitive dynamics of our markets, including new entrants, or further consolidation;
- •
- reductions in customers' budgets for information technology purchases and delays in their purchasing cycles;
- •
- changes in the regulatory environment for the certification and sale of our products;
- •
- claims of intellectual property infringement against us and any resulting temporary or permanent injunction prohibiting us
from selling our products or the requirement to pay damages or expenses associated with any such claims; and
- •
- general economic conditions in our domestic and international markets.
Further, as a result of customer buying patterns, historically we have received a substantial portion of a quarter's sales orders and generated a substantial portion of a quarter's revenues during the last two weeks of the quarter. If expected revenues at the end of any quarter are delayed for any reason, including the failure of anticipated purchase orders to materialize, our inability to deliver products prior to quarter-end to fulfill purchase orders received near the end of the quarter, our failure to manage inventory properly in a way to meet demand, or our inability to release new products on schedule, our revenues for that quarter could be materially and adversely affected and could fall below market expectations.
As a result of the above factors, or other factors, our operating results in one or more future periods may fail to meet or exceed the expectations of securities analysts or investors. In that event, the trading price of our common stock would likely decline.
We compete in a rapidly evolving market, and the failure to respond quickly and effectively to changing market requirements could cause our business and operating results to decline.
The wireless networking market is characterized by rapidly changing technology, changing customer needs, evolving industry standards and frequent introductions of new products and services. In order to
19
deliver a competitive wireless LAN, our virtualized wireless LAN solution must be capable of operating with an ever increasing array of wireless devices and an increasingly complex network environment. In addition, our products are designed to be compatible with industry standards for communications over wireless networks. As new wireless devices are introduced and standards in the wireless networking market evolve, we may be required to modify our products and services to make them compatible with these new products and standards. Likewise, if our competitors introduce new products and services that compete with ours, we may be required to reposition our product and service offerings or introduce new products and services in response to such competitive pressure. For example, the Institute of Electrical and Electronics Engineers, or IEEE, is expected to approve a new standard, IEEE 802.11ac, in 2013. This is a major upgrade of IEEE 802.11 technologies that is designed to enable very high throughput operation for stations in Wi-Fi networks. We are actively working on developing IEEE 802-11ac solutions with our silicon partners. We may not be successful in modifying our current products or introducing new ones in a timely or appropriately responsive manner, or at all. If we fail to address these changes successfully, our business and operating results could be materially harmed.
We must increase market awareness of our brand and our solution and develop and expand our sales channels, and if we are unsuccessful, our business, financial condition and operating results could be adversely affected.
We must improve the market awareness of our brand and solution and expand our relationships with our channel partners in order to increase our revenues. We intend to continue to add personnel and to expend resources in our sales and marketing functions as we focus on expanding awareness of our brand and our solution, capitalizing on our market opportunities and increasing our sales. Further, we believe that we must continue to develop our relationships with new and existing channel partners to effectively and efficiently extend our geographic reach and market penetration. Our efforts to improve sales of our solution could result in a material increase in our sales and marketing expense and general and administrative expense, and there can be no assurance that such efforts will be successful. If we are unable to significantly increase the awareness of our brand and solution, expand our relationships with channel partners, or effectively manage the costs associated with these efforts, our business, financial condition and results of operations could be materially and adversely affected.
We compete in highly competitive markets, and competitive pressures from existing and new companies may harm our business and operating results.
The markets in which we compete are highly competitive and influenced by the following competitive factors:
- •
- performance, reliability and predictability of wireless networking solutions;
- •
- initial price and total cost of ownership;
- •
- comprehensiveness of the solution;
- •
- ability to provide quality customer service and support;
- •
- interoperability with other devices;
- •
- scalability of solution;
- •
- ability to provide secure mobile access to the network; and
- •
- ability to bundle wireless products with other networking offerings.
We expect competition to intensify in the future as other companies introduce new products into our markets. This competition could result in increased pricing pressure, reduced profit margins,
20
increased sales and marketing expenses and failure to increase, or the loss of, market share, any of which would likely seriously harm our business, operating results or financial condition. If we do not keep pace with product and technology advances, there could be a material and adverse effect on our competitive position, revenues and prospects for growth.
A number of our current or potential competitors have longer operating histories, greater name recognition, larger customer bases and significantly greater financial, technical, sales, marketing and other resources than we. As a result, our competitors may be able to adapt more quickly to new or emerging technologies and changes in customer requirements, devote greater resources to the promotion and sale of their products and services, initiate or withstand substantial price competition, take advantage of acquisitions or other opportunities more readily and develop and expand their product and service offerings more quickly than we. Our competitors with larger volumes of orders and more diverse product offerings may require our VARs and distributors to stop selling our products, or to reduce their efforts to sell our products, which could harm our business and results of operations. In addition, certain of our competitors offer, or may in the future offer, more diverse product offerings and may be able to bundle wireless products with other networking offerings. Potential customers may prefer to purchase all of their equipment from a single provider, or may prefer to purchase wireless networking products from an existing supplier rather than a new supplier, regardless of product performance or features.
We expect increased competition if our market continues to expand. Conditions in our markets could change rapidly and significantly as a result of technological advancements or other factors. In addition, current or potential competitors may be acquired by third parties with greater available resources, such as Motorola's acquisition of Symbol Technologies, Hewlett-Packard's acquisition of Colubris Networks and Juniper Networks' acquisition of Trapeze Networks. As a result of such acquisitions, our current or potential competitors might take advantage of the greater resources of the larger organization to compete with us. Continued industry consolidation may adversely impact customers' perceptions of the viability of smaller and even medium-sized wireless networking companies and, consequently, customers' willingness to purchase from such companies.
If we are unable to hire, integrate and retain qualified personnel, our business will suffer.
Our future success depends, in part, on our ability to continue to attract, integrate and retain highly skilled personnel. Our inability to attract, integrate or retain qualified personnel, or delays in hiring required personnel, particularly in engineering and sales, may seriously harm our business, financial condition and results of operations. Competition for highly skilled personnel is frequently intense, especially in the locations where we have a substantial presence and need for highly-skilled personnel, including the San Francisco Bay Area and India. We may not be successful in attracting qualified personnel to fulfill our current or future needs.
If we cannot effectively integrate and retain key employees, the execution of our business strategy may be significantly delayed or adversely impacted. During 2011, we hired a senior vice president to run our worldwide sales, service and support organization, a senior vice president to run our engineering organization and a senior vice president to run our marketing organization. Dr. Vaduvur Bharghavan, our Chief Technology Officer, transitioned from his day to day role as Meru's Chief Technology Officer and Ihab Abu-Hakima, our Chief Executive Officer, informed us of his determination to transition his role with our Company to new leadership. We have commenced a search for a new Chief Executive Officer. Our success in the subsequent periods will depend a significant part on our ability to recruit new executives and integrate them into our operations and their ability to enhance and implement our operations and strategy.
Often, significant amounts of time and resources are required to train technical, sales and other personnel. Qualified individuals are in high demand. We are currently increasing our investment in field
21
sales personnel and we have no assurance that they will become fully productive in the time periods anticipated. We may incur significant costs to attract and retain them, and we may lose new employees to our competitors or other technology companies before we realize the benefit of our investment in recruiting and training them. We may be unable to attract and retain suitably qualified individuals who are capable of meeting our growing technical, operational and managerial requirements, on a timely basis or at all, and we may be required to pay increased compensation in order to do so. If we are unable to attract and retain the qualified personnel we need to succeed, our business would suffer.
Except for the transitional employment agreement we signed with Ihab Abu-Hakima, our Chief Executive Officer, no other employees have employment agreements for specific terms, and any of our employees may terminate their employment at any time. Volatility or lack of performance in our stock price may also affect our ability to attract and retain our key employees. Many of our senior management personnel and other key employees have become, or will soon become, vested in a substantial amount of stock or stock options. Employees may be more likely to leave us if the shares they own or the shares underlying their vested options have significantly appreciated in value relative to the original purchase prices of the shares or the exercise prices of the options, or if the exercise prices of the options that they hold are significantly above the market price of our common stock. The loss of services of key employees could significantly delay or prevent the achievement of our strategic objectives, which could adversely affect our business and operating results.
Our strategy to rapidly increase our investments in sales and marketing programs and personnel may not generate the revenue increases anticipated or such revenue increases may only be realized over a longer period than currently expected.
Since early 2011, we substantially expanded our field sales organization to provide improved coverage of the growing number of business opportunities in our target markets, approximately doubling our sales headcount by early 2012. We expect to continue to grow sales headcount, though at a reduced rate, in 2012. Significant ongoing efforts have been and are being made in training and on-boarding activities to assist new sales teams to become productive in a relatively short period of time. In addition, in late 2011 we made a variety of investments in marketing programs to complement the expansion of our field sales headcount. Market awareness of our capabilities and products is essential to our continued growth and our success in all of our markets. If our marketing programs are not successful in creating market awareness of our company and products or the timing and degree of increased revenues resulting from our increased sales and marketing efforts does not meet our expectations, our business, financial condition and results of operations may suffer materially, and we will not be able to achieve sustained growth.
Claims by others that we infringe their proprietary technology could harm our business.
Our industry is characterized by vigorous protection and pursuit of intellectual property rights, which has resulted in protracted and expensive litigation for many companies. Any claims or proceedings against us, whether meritorious or not, could be time consuming, result in costly litigation, require significant amounts of management time, result in the diversion of significant operational resources, or require us to enter into royalty or licensing agreements, any of which could materially and adversely affect our business and results of operations. Third parties, including some of our competitors, have asserted and may in the future assert claims of infringement of intellectual property rights against us or against our customers or channel partners for which we may be liable. For example:
- •
- On May 11, 2010, Extricom Ltd., filed suit against us in the Federal District Court of Delaware asserting infringement of U.S. Patent No. 7,697,549. Also on May 11, 2010, we filed a declaratory relief action against Extricom Ltd. in the Federal District Court for Northern California seeking a declaration that we are not infringing the Extricom Ltd. patent and that the patent is invalid. Our declaratory relief action in the Northern District of California was
22
- •
- In October 2010, a complaint was filed by Eon Corp. IP Holdings LLC against us as well as numerous other
defendants, in the United States District Court for the Eastern District of Texas, Marshall Division. The complaint alleges infringement by the defendants of U.S. Patent 5,592,491. Our initial
attempts at informally resolving the action were unsuccessful. On January 11, 2011, Eon filed an amended complaint, adding, among other things, additional defendants. On March 7, 2011,
we answered the complaint, alleging that the EON patents are not infringed and are invalid. No settlement conferences or mediations have been scheduled. On January 9, 2012, the Texas court
transferred the case to the United States District Court for the Northern District of California. At this time, we are unable to determine the outcome of this matter and, accordingly, cannot estimate
the potential financial impact this action could have on our business, results of operations, cash flows and financial position.
- •
- On June 2, 2011, the United States International Trade Commission instituted a Section 337 Investigation, based on allegations that Linex Technologies, Inc.'s U.S. Patents relating to multiple-input-multiple-output technology are infringed by 802.11n products imported and sold by us—as well as by Hewlett-Packard, Apple, Aruba Networks, and Ruckus Wireless. We and our co-respondents are currently in the expert discovery phase of the Section 337 Investigation. A second settlement conference was held on March 5, 2012, but no resolution was reached. If the parties are unable to resolve the dispute, we intend to defend the suit vigorously. At this time, we are unable to determine the outcome of this matter and, accordingly, cannot estimate the potential financial impact this action could have on our business, operating results, cash flows or financial position.
dismissed by the Court on August 31, 2010 in favor of the Delaware action on the ground that Extricom Ltd. filed its suit in the Federal District Court of Delaware first. On December 30, 2011, we filed a renewed motion to transfer this case to the Northern District of California in light of the recent Federal Circuit decision in In re Link_A_Media Devices Corp., 2011 WL 6004566 (Fed. Cir. Dec. 2, 2011). The previous motion to transfer was denied on October 12, 2011. Fact discovery was opened on March 2, 2011, and trial is scheduled to commence on November 12, 2012. The Extricom Ltd. complaint seeks unspecified monetary damages and injunctive relief. During March 2012, our settlement negotiations with Extricom Ltd., progressed, and as of March 15, 2012, the parties are discussing the form, terms and conditions of a potential license and settlement agreement with the expectation that a payment of approximately $2.3 million will be made to Extricom Ltd., if mutually agreeable terms and conditions can be reached. Given the remaining uncertainties, we are unable to allocate the expected payment to any of the elements in the potential license and settlement agreement, and as such, have not adjusted our consolidated financial statements.
Additionally, we received letters from, and had ongoing discussions with Motorola, one of our competitors who has a large patent portfolio and substantial resources alleging that our products infringe upon certain of its patents. Those negotiations ultimately resulted in us entering into a cross license with Motorola under which we agreed to pay Motorola $7.3 million, which was paid out during the quarter ended September 30, 2011. We do not believe this license agreement will provide future value as we do not plan to utilize the underlying technology in any future product development or sales.
Third parties have from time to time claimed, and others may claim in the future, that we have infringed their past, current or future intellectual property rights. These claims, whether meritorious or not, could be time-consuming, result in costly litigation, require expensive changes to our products or could require us to enter into costly royalty or licensing agreements, if available. As a result, these claims could harm our business, results of operations, cash flows and financial position.
As our business expands and the number of products and competitors in our market increases and overlaps occur, we expect that infringement claims may increase in number and significance.
23
Intellectual property lawsuits are subject to inherent uncertainties due to the complexity of the technical issues involved, and we cannot be certain that we will be successful in defending ourselves against intellectual property claims. In addition, we currently have a limited portfolio of issued patents compared to our major competitors, and therefore may not be able to effectively utilize our intellectual property portfolio to assert defenses or counterclaims in response to patent infringement claims or litigation brought against us by third parties. Further, litigation may involve patent holding companies or other adverse patent owners who have no relevant products revenues and against whom our potential patents may provide little or no deterrence, and many of potential litigants have the capability to dedicate substantially greater resources to enforce their intellectual property rights and to defend claims that may be brought against them. Furthermore, a successful claimant could secure a judgment that requires us to pay substantial damages or prevents us from distributing certain products or performing certain services. We might also be required to seek a license and pay royalties for the use of such intellectual property, which may not be available on commercially acceptable terms or at all. Alternatively, we may be required to develop non-infringing technology, which could require significant effort and expense and may ultimately not be successful.
In addition, much of our business relies on, and many of our products incorporate, proprietary technologies of third parties. We may not be able to obtain, or continue to obtain, licenses from such third parties on reasonable terms, and such licensing may increase our exposure to claims of infringement by other third parties.
If we are unable to protect our intellectual property rights, our competitive position could be harmed or we could be required to incur significant expenses to enforce our rights.
We depend on our ability to protect our proprietary technology. We protect our proprietary information and technology through licensing agreements, nondisclosure agreements and other contractual provisions, as well as through patent, trademark, copyright and trade secret laws in the U.S. and similar laws in other countries. These protections may not be available in all cases or may be inadequate to prevent our competitors from copying, reverse engineering or otherwise obtaining and using our technology, proprietary rights or products. The laws of some foreign countries may not be as protective of intellectual property rights as those in the United States, and mechanisms for enforcement of intellectual property rights may be inadequate. For example, the laws of India, where we conduct significant research and development activities, do not protect our proprietary rights to the same extent as the laws of the U.S. In addition, third parties may seek to challenge, invalidate or circumvent our patents, trademarks, copyrights and trade secrets, or applications for any of the foregoing. Our competitors may independently develop technologies that are substantially equivalent, or superior, to our technology or design around our proprietary rights. In each case, our ability to compete could be significantly impaired.
To prevent substantial unauthorized use of our intellectual property rights, it may be necessary to prosecute actions for infringement or misappropriation of our proprietary rights against third parties. Any such action could result in significant costs and diversion of our resources and management's attention, and there can be no assurance that we will be successful in such action. Furthermore, many of our current and potential competitors have the ability to dedicate substantially greater resources to enforce their intellectual property rights than we. Accordingly, despite our efforts, we may not be able to prevent third parties from infringing or misappropriating our intellectual property.
We have a limited patent portfolio. To date, we have not applied for patent protection outside of the U.S. While we plan to protect our intellectual property with, among other things, patent protection, there can be no assurance that:
- •
- current or future U.S. or future foreign patent applications will be approved;
- •
- our issued patents will protect our intellectual property and not be held invalid or unenforceable if challenged by third parties;
24
- •
- we will succeed in protecting our technology adequately in all key jurisdictions in which we or our competitors operate;
- •
- the patents of others will not have an adverse effect on our ability to do business; or
- •
- others will not independently develop similar or competing products or methods or design around any patents that may be issued to us.
The failure to obtain patents with claims of a scope necessary to cover our technology, or the invalidation or our patents, or our inability to protect any of our intellectual property, may weaken our competitive position and may materially and adversely affect our business and results of operations.
We might be required to spend significant resources to monitor and protect our intellectual property rights. We may initiate claims or litigation against third parties for infringement of our proprietary rights or to establish the validity of our proprietary rights. Any litigation, whether or not it is resolved in our favor, could result in significant expense to us and divert the efforts of our technical and management personnel, which may adversely affect our business, operating results and financial condition.
If the demand for wireless networks does not continue to develop as we anticipate, demand for our virtualized wireless LAN solution may not grow as we expect.
The success of our business depends on enterprises continuing to adopt wireless networks for use with their business-critical applications. The market for enterprise-wide wireless networks has only developed in recent years as enterprises have deployed wireless networks to take advantage of the convenient access to the network that they provide. As businesses seek to run their business-critical applications on these wireless networks, they recognize the limitations of other wireless solutions and the need for our virtualized wireless LAN solution. Ultimately, however, enterprises may not elect to deploy wireless networks and may not elect to run their business-critical applications on a wireless network. Accordingly, demand for our solution may not continue to develop as we anticipate, or at all.
Our sales cycles can be long and unpredictable. As a result, our sales are difficult to predict and may vary substantially from quarter to quarter, which may cause our operating results to fluctuate significantly.
The timing of our sales is difficult to predict. Our sales efforts involve educating our customers about the use and benefits of our virtualized wireless LAN solution, including the technical capabilities of our products and the potential cost savings achievable by organizations deploying our solution. Customers typically undertake a significant evaluation process, which frequently involves not only our products but also those of our competitors and can result in a lengthy sales cycle. We spend substantial time, effort and money in our sales efforts without any assurance that our efforts will produce any sales. In addition, purchases of our virtualized wireless LAN solution are frequently subject to budget constraints, multiple approvals, and unplanned administrative, processing and other delays. If sales expected from a specific customer for a particular quarter are not realized in that quarter or at all, our operating results could be materially and adversely affected.
Our revenues may decline as a result of changes in public funding of educational institutions.
We have historically generated a substantial portion of our revenues from sales to educational institutions. Public schools receive funding from local tax revenue, and from state and federal governments through a variety of programs, many of which seek to assist schools located in underprivileged or rural areas. We believe that the funding for a substantial portion of our sales to educational institutions comes from federal funding, in particular the E-Rate program. E-Rate is a program of the Federal Communications Commission that subsidizes the purchase of approved telecommunications, Internet access, and internal connections costs for eligible public educational institutions. In the event that the federal government reduces the amounts dedicated to the E-Rate
25
program in future periods, or eliminates the program completely, our sales to educational institutions may be reduced. Furthermore, if state or local funding of public education is significantly reduced because of legislative changes or by fluctuations in tax revenues due to changing economic conditions, our sales to educational institutions may be negatively impacted. Any reduction in spending on information technology systems by educational institutions would likely materially and adversely affect our business and results of operations.
Seasonality may cause fluctuations in our operating results.
We believe that there can be significant seasonal factors that may cause the first and third quarters of our fiscal year to have relatively weaker products revenues than the second and fourth fiscal quarters. We believe that this seasonality results from a number of factors, including:
- •
- customers with a December 31 fiscal year end may choose to spend remaining budgets before their year end resulting
in a positive impact on our products revenues in the fourth quarter of our fiscal year;
- •
- the structure of our direct sales compensation program may provide additional financial incentives to our sales personnel
for exceeding their annual goals;
- •
- the timing of our annual training for the entire sales force in our first fiscal quarter combined with the above fourth
quarter factors can potentially cause our first fiscal quarter to be seasonally weak;
- •
- many of our education customers have procurement and deployment cycles that can result in stronger order flow in our
second fiscal quarter than other quarters assuming the continued availability of traditional funding sources, such as the E-Rate program in the United States; and
- •
- seasonal reductions in business activity during the summer months in the United States, Europe and certain other regions may have a negative impact on our third quarter revenues.
We believe that our historical growth, variations in the amount of orders booked in a prior quarter but not shipped until a later quarter and other variations in the amount of deferred revenues may have overshadowed the nature or magnitude of seasonal or cyclical factors that might have influenced our business to date. In addition, the timing of one or more large transactions may overshadow seasonal factors in any particular quarterly period. Seasonal or cyclical variations in our operations may become more pronounced over time and may materially affect our results of operations in the future.
The average sales prices of our products may decrease.
The average sales prices for our products may decline for a variety of reasons, including competitive pricing pressures, a change in our mix of products, anticipation of the introduction of new products or promotional programs. The markets in which we compete are highly competitive and we expect this competition to increase in the future, thereby leading to increased pricing pressures. Larger competitors with more diverse product offerings may reduce the price of products that compete with ours in order to promote the sale of other products or may bundle them with other products. For example, some of our large competitors who provide network switching equipment may offer a wireless overlay network at very low prices or on a bundled basis. Furthermore, average sales prices for our products have typically decreased over product life cycles. A decline in our average selling prices in excess of our expectations may harm our operating results.
We expect our gross margin to vary over time, and our level of gross margin may not be sustainable.
Our level of gross margin may not be sustainable and may be adversely affected by numerous factors, including:
- •
- increased price competition;
26
- •
- changes in customer or product and service mix;
- •
- introduction of new products;
- •
- our ability to reduce production costs;
- •
- increases in material or labor costs;
- •
- increased costs of licensing third party technologies that are used in our products;
- •
- excess inventory, inventory holding charges and obsolescence charges;
- •
- the timing of revenue recognition and revenue deferrals;
- •
- changes in our distribution channels or with our channel sales partners;
- •
- increased warranty costs; and
- •
- inbound shipping charges.
As a result of any of these factors, or other factors, our gross margin may be adversely affected, which in turn would harm our operating results.
We rely on channel partners to generate a substantial majority of our revenues. If our partners fail to perform, our operating results could be materially and adversely affected.
A substantial majority of our revenues is generated through sales by our channel partners, which are distributors and VARs. Sales through our channel partners accounted for 93% of our total shipments during the year ended December 31, 2011. To the extent our channel partners are unsuccessful in selling our products, or we are unable to obtain and retain a sufficient number of high-quality channel partners, our operating results could be materially and adversely affected.
Westcon Group and Catalyst Telecom distribute a significant amount of our products worldwide. Resale of product through Westcon Group and Catalyst Telecom accounted for 42%, 46% and 35% of our worldwide net revenues in 2011, 2010 and 2009, respectively.
Our channel partners may be unsuccessful in marketing, selling and supporting our products and services. They may also market, sell and support products and services that are competitive with ours, and may devote more resources to the marketing, sales and support of such products. They may have incentives to promote our competitors' products in lieu of our products, particularly for our competitors with larger volumes of orders, more diverse product offerings and a longer relationship with our VARs or distributors. In these cases, our channel partners may stop selling our products completely. New sales channel partners may take several months or more to achieve significant sales. Our channel partner sales structure could subject us to lawsuits, potential liability and reputational harm if, for example, any of our channel partners misrepresents the functionality of our products or services to customers, violate laws or our corporate policies. If we fail to effectively manage our existing or future sales channel partners, our business would be seriously harmed.
We base our inventory purchase decisions on our forecasts of customers' demand, and if our forecasts are inaccurate, our operating results could be materially harmed.
We place orders with our manufacturers based on our forecasts of our customers' demand. Our forecasts are based on multiple assumptions, each of which may introduce errors into our estimates affecting our ability to service our customers. When demand for our products increases significantly, we may not be able to meet demand on a timely basis, and we may need to expend a significant amount of time working with our customers to allocate limited supply and maintain positive customer relations, or we may incur additional costs in order to rush the manufacture and delivery of additional inventory. If we underestimate customer demand, we may forego revenue opportunities, lose market share and
27
damage our customer relationships. Conversely, if we overestimate customer demand, we may purchase more inventory than we are able to sell when we expect to or at all. As a result, we could have excess or obsolete inventory, resulting in a decline in the value of our inventory, which would increase our costs of revenues and reduce our liquidity. Our failure to accurately manage inventory against demand would adversely affect our operating results.
Our virtualized wireless LAN solution incorporates complex technology and may contain defects or errors, which could cause harm to our reputation and adversely affect our business.
Our virtualized wireless LAN solution incorporates complex technology and must operate with a significant number and types of wireless devices, which attempt to run new and complex applications in a variety of environments that utilize different wireless communication industry standards. Our products have contained and may in the future contain defects or errors. In some cases, these defects or errors have delayed the introduction of our new products. Some errors in our products may only be discovered after a product has been installed and used by customers. These issues are most prevalent when new products are introduced into the market. Any errors or defects discovered in our products, after commercial release could result in loss of revenues or delay in revenue recognition, loss of customers, damage to our brand and reputation, and increased service and warranty cost, any of which could materially and adversely affect our business and operating results.
We could face claims for product liability, tort or breach of warranty, including claims relating to changes to our products made by our channel partners. Our contracts with customers contain provisions relating to warranty disclaimers and liability limitations, which may not be upheld. Defending a lawsuit, regardless of its merit, is costly and may divert management's attention and adversely affect the market's perception of us and our products.
If we fail to develop new products and enhancements to our virtualized wireless LAN solution, we may not be able to remain competitive.
We must develop new products and continue to enhance our virtualized wireless LAN solution to meet rapidly evolving customer requirements. If we fail to develop new products or enhancements to our existing products, our business could be adversely affected, especially if our competitors are able to introduce products with enhanced functionality. In addition, as new mobile applications are introduced, our success may depend on our ability to provide a solution that supports these applications.
We are subject to a number of industry standards established by various standards bodies, such as the IEEE, and we design our products to comply with these standards. As new industry standards emerge, we could be required to invest a substantial amount of resources to develop new products that comply with these standards. For example, we devoted a substantial amount of our research and development resources to design a virtualized wireless LAN solution that could optimize the performance allowed by the 802.11n standard. In addition, the IEEE is expected to approve a new standard, IEEE 802.11ac, in 2013. This is a major upgrade of IEEE 802.11 technologies that is designed to enable very high throughput operation for stations in Wi-Fi networks. We are actively working on developing IEEE 802-11ac solutions with our silicon partners. If we are not able to adapt to new or changing standards that are ratified by the IEEE or other standards bodies, our ability to sell our products may be adversely affected and we may not realize the benefits of our research and development efforts.
Our research and development efforts relating to new products and technologies are time-consuming, costly and complex. If we expend a significant amount of resources on research and development and our efforts do not lead to the successful introduction of products that are competitive in the marketplace, this could materially and adversely affect our business and operating results.
28
Although certain technical problems experienced by users may not be caused by our virtualized wireless LAN solution, our business and reputation may be harmed if users perceive our solution as the cause of a slow or unreliable network connection.
Our solution has been deployed in many different environments and is capable of providing wireless access to many different types of wireless devices operating a variety of applications. The ability of our virtualized wireless LAN solution to operate effectively can be negatively impacted by many different elements unrelated to our products. For example, a user's experience may suffer from an incorrect setting in a wireless device, which is not a problem caused by the network. Although certain technical problems experienced by users may not be caused by our solution, users often perceive the underlying cause to be a result of poor performance of the wireless network. This perception, even if incorrect, could harm our business and reputation.
Our international sales and operations subject us to additional risks that may materially and adversely affect our business and operating results.
We derive a significant portion of our revenues from customers outside the U.S. During the years ended December 31, 2011, 2010 and 2009, 45%, 36% and 28% of our revenues were derived from customers outside of the U.S. While our international sales have typically been denominated in U.S. dollars, fluctuations in currency exchange rates could cause our products to become relatively more expensive to customers in a particular country, leading to a reduction in sales or profitability in that country.
In addition, we have a research and development facility located in India, and we expect to expand our offshore development efforts and general and administrative functions within India and possibly in other countries. We have sales and support personnel in numerous countries worldwide. We expect to continue to add personnel in additional countries.
Our international operations subject us to a variety of risks, including:
- •
- the difficulty of managing and staffing international offices and the increased travel, infrastructure and legal
compliance costs associated with multiple international locations;
- •
- difficulties in enforcing contracts and collecting accounts receivable, and longer payment cycles, especially in emerging
markets;
- •
- tariffs and trade barriers, export regulations and other regulatory or contractual limitations on our ability to sell or
develop our products in certain foreign markets;
- •
- increased exposure to foreign currency exchange rate risk;
- •
- heightened exposure to political and economic instability, war and terrorism;
- •
- reduced protection for intellectual property rights in some countries;
- •
- costs of compliance with, and the risks and costs of non-compliance with, differing and changing regulatory
and legal requirements in the jurisdictions in which we operate;
- •
- heightened risks of unfair or corrupt business practices in certain geographies and of improper or fraudulent sales
arrangements that may impact financial results and result in restatements of, and irregularities in, financial statements;
- •
- multiple conflicting tax laws and regulations;
- •
- the need to localize our products for international customers; and
- •
- increased cost of terminating employees in some countries.
29
As we continue to expand our business globally, our success will depend, in large part, on our ability to anticipate and effectively manage these and other risks associated with our international operations. Our failure to manage any of these risks successfully could harm our international operations and reduce our international sales, adversely affecting our business, operating results and financial condition.
Another significant risk resulting from our international operations is compliance with the U.S. Foreign Corrupt Practices Act, or FCPA, and other anti-bribery laws applicable to our operations. In many foreign countries, particularly in those with developing economies, it may be a local custom that businesses operating in such countries engage in business practices that are prohibited by the FCPA or other U.S. and foreign laws and regulations applicable to us. Although we have implemented procedures designed to ensure compliance with the FCPA and similar laws, there can be no assurance that all of our employees, agents and other channel partners, as well as those companies to which we outsource certain of our business operations, will not take actions in violation of our policies. Any such violation could have a material and adverse effect on our business.
Our product and service sales may be subject to foreign governmental regulations, which vary substantially from country to country and change from time to time. Failure to comply with these regulations could adversely affect our business. Further, in many foreign countries it is common for others to engage in business practices that are prohibited by our internal policies and procedures or U.S. regulations applicable to us. Although we implemented policies and procedures designed to ensure compliance with these laws and policies, there can be no assurance that all of our employees, contractors, channel partners and agents will comply with these laws and policies. Violations of laws or key control policies by our employees, contractors, channel partners or agents could result in delays in revenue recognition, financial reporting misstatements, fines, penalties or the prohibition of the importation or exportation of our products and services and could have a material adverse effect on our business and results of operations.
Our use of and reliance on research and development resources in India may expose us to unanticipated costs or events.
We have a significant research and development center in Bangalore, India and, in recent years, have increased headcount and development activity at this facility. There is no assurance that our reliance upon research and development resources in India will enable us to achieve meaningful cost reductions or greater resource efficiency. Further, our research and development efforts and other operations in India involve significant risks, including:
- •
- difficulty hiring and retaining appropriate engineering personnel due to intense competition for such resources and
resulting wage inflation;
- •
- the knowledge transfer related to our technology and resulting exposure to misappropriation of intellectual property or
information that is proprietary to us, our customers and other third parties;
- •
- heightened exposure to change in the economic, security and political conditions in India;
- •
- fluctuations in currency exchange rates and regulatory compliance in India; and
- •
- interruptions to our operations in India as a result of floods and other natural catastrophic events as well as manmade problems such as power disruptions or terrorism.
Difficulties resulting from the factors above and other risks related to our operations in India could expose us to increased expense, impair our development efforts and harm our competitive position.
30
We rely on third parties to manufacture our products, and depend on them for the supply and quality of our products.
We outsource the manufacturing of our products, and are therefore subject to the risk that our third-party manufacturers do not provide our customers with the quality and performance that they expect from our products. Our orders may represent a relatively small percentage of the overall orders received by our manufacturers from their customers. As a result, fulfilling our orders may not be considered a priority in the event our manufacturers are constrained in their ability to fulfill all of their customer obligations in a timely manner. We must also accurately predict the number of products that we will require. If we overestimate our requirements, our manufacturers may assess charges, or we may incur liabilities for excess inventory, each of which could negatively affect our gross margins. Conversely, if we underestimate our requirements, our manufacturers may have inadequate materials and components required to produce our products. This could result in an interruption of the manufacturing of our products, delays in shipments and deferral or loss of revenues. Quality or performance failures of our products or changes in our manufacturers' financial or business condition could disrupt our ability to supply quality products to our customers and thereby have a material and adverse effect on our business and operating results.
Some of the components and technologies used in our products are purchased and licensed from a single source or a limited number of sources. The loss of any of these suppliers may cause us to incur additional transition costs, result in delays in the manufacturing and delivery of our products, or cause us to carry excess or obsolete inventory and could cause us to redesign our products.
While supplies of our components are generally available from a variety of sources, we currently depend on a single source or limited number of sources for several components for our products. For example, the chipsets that we use in our products are currently available only from a limited number of sources, with whom neither we nor our manufacturers have entered into supply agreements. We have also entered into license agreements with some of our suppliers for technologies that are used in our products, and the termination of these licenses, which can generally be done on relatively short notice, could have a material adverse effect on our business. For example, our access points incorporate certain technology that we license from Atheros Communications, Inc., or Atheros. We have entered into a license agreement with Atheros, and such license agreement automatically renews for successive one-year periods unless the agreement is terminated prior to the end of the then-current term. In the event our license agreement with Atheros is terminated, we would be required to redesign some of our products in order to incorporate technology from alternative sources, and any such termination of the license agreement and redesign of certain of our products could require additional licenses and materially and adversely affect our business.
As there are no other sources identical to these components and technologies, if we lost any of these suppliers, we could be required to transition to a new supplier, which could increase our costs, result in delays in the manufacturing and delivery of our products or cause us to carry excess or obsolete inventory, and we could be required to redesign our hardware and software in order to incorporate components or technologies from alternative sources.
In addition, for certain components for which there are multiple sources, we are still subject to potential price increases and limited availability due to market demand for such components. In the past, unexpected demand for communication products caused worldwide shortages of certain electronic parts. If such shortages occur in the future, our business would be adversely affected. We carry very little inventory of our products, and we and our manufacturers rely on our suppliers to deliver necessary components in a timely manner. We and our manufacturers rely on purchase orders rather than long-term contracts with these suppliers, and as a result, even if available, we or our manufacturers may not be able to secure sufficient components at reasonable prices or of acceptable quality to build products in a timely manner and, therefore, may not be able to meet customer demands for our products, which would have a material and adverse effect on our business, operating results and financial condition.
31
We rely on a third party for the fulfillment of our customer orders, and the failure of this third party to perform could have an adverse effect upon our reputation and our ability to distribute our products, which could cause a material reduction in our revenues.
We use a third party to hold our inventory and fulfill our customer orders. If our third-party fulfillment agent fails to perform, our ability to deliver our products and to generate revenues would be adversely affected. The failure of our third-party logistics provider to deliver products in a timely manner could lead to the dissatisfaction of our channel partners and customers and damage our reputation, which may cause our channel partners or customers to cancel existing agreements with us and to stop doing business with us. In addition, this reliance on a third-party logistics provider also may impact the timing of our revenue recognition if our logistics provider fails to deliver orders during the prescribed time period. Although we believe that alternative logistics providers are readily available in the market, in the event we are unexpectedly forced to change providers we could experience short-term disruptions in our delivery and fulfillment process that could adversely affect our business.
Our ability to sell our products is highly dependent on the quality of our support and services offerings, and our failure to offer high-quality support and services could have a material and adverse effect on our business and results of operations.
Once our products are deployed within our customers' networks, they depend on our support organization to resolve any issues relating to our products. High-quality support is critical for the continued successful marketing and sale of our products. If we or our channel partners do not effectively assist our customers in deploying our products, succeed in helping our customers quickly resolve post-deployment issues, or provide effective ongoing support, it could adversely affect our ability to sell our products to existing customers and could harm our reputation with potential customers. In addition, as we expand our operations internationally, our support organization will face additional challenges including those associated with delivering support, training and documentation in languages other than English. Our failure or the failure of our channel partners to maintain high-quality support and services could have a material and adverse effect on our business and operating results.
We may engage in future acquisitions that could disrupt our business, cause dilution to our stockholders and harm our business, operating results and financial condition.
We completed our first acquisition, that of Identity Networks, in 2011. In the future we may acquire other businesses, products or technologies. If we do complete acquisitions, we may not ultimately strengthen our competitive position or achieve our goals, or such acquisitions may be viewed negatively by customers, financial markets or investors. We may also face additional challenges, because acquisitions entail numerous risks, including:
- •
- difficulties in the integration of acquired operations, technologies, personnel and/or products;
- •
- unanticipated costs associated with the acquisition transaction;
- •
- the diversion of management's attention from the regular operations of the business and the challenges of managing larger
and more widespread operations;
- •
- adverse effects on new and existing business relationships with suppliers and customers;
- •
- risks associated with entering geographic or business markets in which we have no or limited prior experience;
- •
- the potential loss of key employees of acquired businesses;
32
- •
- an acquisition may result in a delay or reduction of customer purchases for both us and the company acquired due to
customer uncertainty about continuity and effectiveness of products and services from either company; and
- •
- delays in realizing or failure to realize the benefits of an acquisition.
Competition within our industry for acquisitions of businesses, technologies, assets and product lines has been, and may in the future continue to be, intense. As such, even if we are able to identify an acquisition that we would like to consummate, we may not be able to complete the acquisition on commercially reasonable terms or because the target is acquired by another company. Furthermore, in the event that we are able to identify and consummate any future acquisitions, we could:
- •
- issue equity securities which would dilute current stockholders' percentage ownership;
- •
- incur substantial debt;
- •
- incur significant acquisition-related expenses;
- •
- assume contingent liabilities; or
- •
- expend significant cash.
Our reported financial results may be adversely affected by changes in accounting principles applicable to us.
Generally accepted accounting principles in the U.S. are subject to interpretation by the Financial Accounting Standards Board, or FASB, the Securities and Exchange Commission, or SEC, and other various bodies formed to promulgate and interpret appropriate accounting principles. A change in these principles or interpretations could have a significant effect on our reported financial results, and could affect the reporting of transactions completed before the announcement of a change. Any difficulties in the implementation of these pronouncements could cause us to fail to meet our financial reporting obligations, which could result in regulatory discipline.
In addition, the SEC has announced a multi-year plan that could ultimately lead to the use of International Financial Reporting Standards by U.S. issuers in their SEC filings. Any such change could have a significant effect on our reported financial results.
If our estimates or judgments relating to our critical accounting policies are based on assumptions that change or prove to be incorrect, our operating results could fall below expectations of securities analysts and investors, resulting in a decline in our stock price.
The preparation of consolidated financial statements in conformity with generally accepted accounting principles requires management to make estimates and assumptions that affect the amounts reported in the consolidated financial statements and accompanying notes. We base our estimates on historical experience and on various other assumptions that we believe to be reasonable under the circumstances, the results of which form the basis for making judgments about the carrying values of assets and liabilities that are not readily apparent from other sources. Our operating results may be adversely affected if our assumptions change or if actual circumstances differ from those in our assumptions, which could cause our operating results to fall below market expectations, resulting in a decline in our stock price. Significant assumptions and estimates used in preparing our consolidated financial statements include those related to revenue recognition, stock-based compensation, valuation of inventory, fair value of financial instruments, allowance for doubtful accounts, and accounting for income taxes.
33
We are subject to governmental export and import controls that could subject us to liability or impair our ability to compete in international markets.
Our products incorporate encryption technology and are subject to United States export controls, and may be exported outside the U.S. only with the required level of export license or through an export license exception. In addition, various countries regulate the import of certain encryption technology and have enacted laws that could limit our ability to distribute our products or could limit our customers' ability to implement our products in those countries. Changes in our products or changes in export and import regulations may create delays in the introduction of our products in international markets, prevent our customers with international operations from deploying our products throughout their global systems or, in some cases, prevent the export or import of our products to certain countries altogether. Any change in export or import regulations or related legislation, shift in approach to the enforcement or scope of existing regulations, or change in the countries, persons or technologies targeted by such regulations, could result in decreased use of our products by, or in our decreased ability to export or sell our products to, existing or potential customers with international operations.
In addition, we have implemented limited procedures to ensure our compliance with export regulations, and if our export compliance procedures are not effective, we could be subject to civil or criminal penalties, which could lead to a material fine or sanction that could have an adverse effect on our business and results of operations.
Our use of open source software could impose limitations on our ability to commercialize our products.
Our products contain software modules licensed for use from third-party authors under open source licenses, including the GNU Public License, the GNU Lesser Public License, the Apache License and others. Use and distribution of open source software may entail greater risks than use of third-party commercial software, as open source licensors generally do not provide warranties or other contractual protections regarding infringement claims or the quality of the code. Some open source licenses contain requirements that we make available source code for modifications or derivative works we create based upon the type of open source software we use. If we combine our proprietary software with open source software in a certain manner, we could, under certain of the open source licenses, be required to release the source code of our proprietary software to the public. This could allow our competitors to create similar products with lower development effort and time and ultimately could result in a loss of product sales for us.
Although we monitor our use of open source closely, the terms of many open source licenses have not been interpreted by U.S. courts, and there is a risk that such licenses could be construed in a manner that could impose unanticipated conditions or restrictions on our ability to commercialize our products. In such event, we could be required to seek licenses from third parties in order to continue offering our products, to re-engineer our products or to discontinue the sale of our products in the event re-engineering cannot be accomplished on a timely basis, any of which could materially and adversely affect our business and operating results.
If we do not appropriately manage any future growth, or are unable to improve our systems and processes, our operating results could be negatively affected.
Our future growth, if it occurs, could place significant demands on our management, infrastructure and other resources. We may need to increasingly rely on IT systems, some of which we do not currently have significant experience in operating, to help manage critical functions. To manage any future growth effectively, we must continue to improve and expand our information technology and financial infrastructure, operating and administrative systems and controls, and continue to manage headcount, capital and processes in an efficient manner. We may not be able to successfully implement
34
improvements to these systems and processes in a timely or efficient manner, which could result in additional operating inefficiencies and could cause our costs to increase more than planned. If we do increase our operating expenses in anticipation of the growth of our business and this growth does not meet our expectations, our financial results may be negatively impacted. In addition, our systems and processes may not prevent or detect all errors, omissions or fraud. Our failure to improve our systems and processes, or their failure to operate in the intended manner, may result in our inability to manage the growth of our business and to accurately forecast our revenues, expenses and earnings, or to prevent certain losses. Any future growth would add complexity to our organization and require effective coordination within our organization. Failure to manage any future growth effectively could result in increased costs and harm our business.
Our business, operating results and growth rates may be adversely affected by unfavorable economic or market conditions.
Our business depends on the overall demand for IT and on the economic health of our current and prospective customers. Our current business and operating plan assumes that economic activity in general, and IT spending in particular, will at least remain at close to current levels. We cannot be assured of the level of IT spending, however, the deterioration of which could have a material adverse effect on our results of operations and growth rates. The purchase of our products involves a significant commitment of capital and other resources, therefore, weak economic conditions, or a reduction in IT spending, even if economic conditions improve, would likely adversely impact our business, operating results and financial condition in a number of ways, including longer sales cycles, lower prices for our products and services, and reduced unit sales. For example, we believe that the recent economic downturns in the U.S. and international markets adversely affected our business as customers and potential customers reduced costs by reducing or delaying purchasing decisions. Any unfavorable economic or market conditions could materially and adversely affect our results of operations.
We are exposed to the credit risk of our VARs, distributors and customers, which could result in material losses and negatively impact our operating results.
Most of our sales are on an open credit basis, with typical payment terms of 30 days in the U.S. and, because of local customs or conditions, longer in some markets outside the U.S. If any of our VARs, distributors or customers becomes insolvent or suffers a deterioration in its financial or business condition and is unable to pay for our products, our results of operations could be harmed.
Our ability to use net operating losses to offset future taxable income may be subject to certain limitations.
In general, under Section 382 of the Internal Revenue Code, a corporation that undergoes an "ownership change" is subject to limitations on its ability to utilize its pre-change net operating losses, or NOLs, to offset future taxable income. Our existing NOLs may be subject to limitations arising from previous ownership changes, and if we undergo an ownership change in the future, our ability to utilize NOLs could be further limited by Section 382 of the Internal Revenue Code. Future changes in our stock ownership, many of which are outside of our control, could result in an ownership change under Section 382 of the Internal Revenue Code. Our net operating losses may also be impaired under state law. We may not be able to utilize a material portion of the NOLs.
35
Changes in our provision for income taxes or adverse outcomes resulting from examination of our income tax returns could adversely affect our results.
Our provision for income taxes is subject to volatility and could be adversely affected by the following:
- •
- earnings being lower than anticipated in countries that have lower tax rates and higher than anticipated in countries that
have higher tax rates;
- •
- changes in the valuation of our deferred tax assets and liabilities;
- •
- expiration of, or lapses in, the research and development tax credit laws;
- •
- transfer pricing adjustments including the effect of acquisitions on our intercompany research and development cost
sharing arrangement and legal structure;
- •
- tax effects of nondeductible compensation;
- •
- tax costs related to intercompany realignments;
- •
- changes in accounting principles; or
- •
- changes in tax laws and regulations including possible U.S. changes to the taxation of earnings of our foreign subsidiaries, and the deductibility of expenses attributable to foreign income, or the foreign tax credit rules.
Significant judgment is required to determine the recognition and measurement attributes prescribed in the accounting guidance for uncertainty in income taxes. The accounting guidance for uncertainty in income taxes applies to all income tax positions, including the potential recovery of previously paid taxes, which if settled unfavorably could adversely impact our provision for income taxes or additional paid-in capital. Further, as a result of certain of our ongoing employment and capital investment actions and commitments, our income in certain countries is subject to reduced tax rates. Our failure to meet these commitments could adversely impact our provision for income taxes. In addition, we are subject to the examination of our income tax returns by the Internal Revenue Service and other tax authorities. We regularly assess the likelihood of adverse outcomes resulting from these examinations to determine the adequacy of our provision for income taxes. The outcomes from these examinations may have a material and adverse effect on our operating results and financial condition.
New regulations or changes in existing regulations related to our products may result in unanticipated costs or liabilities, which could have a material and adverse effect on our business, results of operations and future sales, and could place additional burdens on the operations of our business.
Our products are subject to governmental regulations in a variety of jurisdictions. If any of our products becomes subject to new regulations or if any of our products becomes specifically regulated by additional government entities, compliance with such regulations could become more burdensome, and there could be a material adverse effect on our business and results of operations. For example, radio emissions are subject to regulation in the U.S. and in other countries in which we do business. In the U.S., various federal agencies including the Center for Devices and Radiological Health of the Food and Drug Administration, the Federal Communications Commission, the Occupational Safety and Health Administration and various state agencies have promulgated regulations that concern the use of radio/electromagnetic emissions standards. Member countries of the European Union have enacted similar standards concerning electrical safety and electromagnetic compatibility and emissions standards.
In addition, our wireless communication products operate through the transmission of radio signals. Currently, operation of these products in specified frequency bands does not require licensing by regulatory authorities. Regulatory changes restricting the use of frequency bands or allocating
36
available frequencies could become more burdensome and could have a material and adverse effect on our business and results of operations.
Our business is subject to the risks of earthquakes, fire, floods and other natural catastrophic events, and to interruption by manmade problems such as power disruptions or terrorism.
Our corporate headquarters are located in the San Francisco Bay Area, a region known for seismic activity. We also have significant research and development activities in India and facilities in Japan, regions known for typhoons, floods and other natural disasters. A significant natural disaster, such as an earthquake, fire or a flood, occurring at our headquarters, our other facilities or where our ODMs and channel partners are located, could have a material adverse impact on our business, operating results and financial condition. In addition, acts of terrorism could cause disruptions in our or our customers' businesses or the economy as a whole. We also rely on information technology systems to communicate among our workforce located worldwide, and in particular, our research and development activities that are coordinated between our corporate headquarters in the San Francisco Bay Area and our facility in India. Any disruption to our internal communications, whether caused by a natural disaster or by manmade problems, such as power disruptions, could delay our research and development efforts. To the extent that such disruptions result in delays or cancellations of customer orders, our research and development efforts or the deployment of our products, our business and operating results would be materially and adversely affected.
If we fail to maintain an effective system of internal controls, our ability to produce accurate financial statements or comply with applicable regulations could be impaired.
As a public company, we are subject to the reporting requirements of the Exchange Act, the Sarbanes-Oxley Act of 2002, or the Sarbanes-Oxley Act, and the rules and regulations of The NASDAQ Stock Market. We expect that the requirements of these rules and regulations will continue to increase our legal, accounting and financial compliance costs, make some activities more difficult, time-consuming and costly and place undue strain on our personnel, systems and resources.
The Sarbanes-Oxley Act requires, among other things, that we maintain effective disclosure controls and procedures and internal control over financial reporting. We are continuing to develop and refine our disclosure controls and other procedures that are designed to ensure that information required to be disclosed by us in the reports that we file with the SEC is recorded, processed, summarized and reported within the time periods specified in SEC's rules and forms.
Our current controls and any new controls that we develop may become inadequate because of changes in conditions, and the degree of compliance with the policies or procedures may deteriorate. Further, weaknesses in our internal controls may be discovered in the future. Any failure to develop or maintain effective controls, or any difficulties encountered in their implementation or improvement, could harm our operating results or cause us to fail to meet our reporting obligations and may result in a restatement of our prior period financial statements. Any failure to implement and maintain effective internal controls also could adversely affect the results of periodic management evaluations and annual auditor attestation reports regarding the effectiveness of our internal control over financial reporting that we are required to include in our periodic reports filed with the SEC under Section 404 of the Sarbanes-Oxley Act. Ineffective disclosure controls and procedures and internal control over financial reporting could also cause investors to lose confidence in our reported financial and other information, which would likely have a negative effect on the trading price of our common stock.
In order to maintain and improve the effectiveness of our disclosure controls and procedures and internal control over financial reporting, we have expended, and anticipate that we will continue to expend, significant resources and provide significant management oversight, which involve substantial accounting-related costs. Any failure to maintain the adequacy of our internal controls, or consequent
37
inability to produce accurate financial statements on a timely basis, could increase our operating costs and could materially impair our ability to operate our business. In the event that we are not able to continue to demonstrate compliance with Section 404 of the Sarbanes-Oxley Act in a timely manner, that our internal controls are perceived as inadequate or that we are unable to produce timely or accurate financial statements, investors may lose confidence in our operating results and our stock price could decline. In addition, if we are unable to continue to meet these requirements, we may not be able to remain listed on The NASDAQ Global Market.
We have not yet implemented a complete disaster recovery plan or business continuity plan for our accounting and related information technology systems. Any disaster could therefore materially impair our ability to maintain timely accounting and reporting.
Risks Related to Ownership of our Common Stock
Our stock price may be volatile. Further, you may not be able to resell shares of our common stock at or above the price you paid.
The trading price of our common stock has been highly volatile and could be subject to wide fluctuations in response to various factors, some of which are beyond our control. These factors include:
- •
- actual or anticipated variation in anticipated results of operations of us or our competitors;
- •
- the financial projections we may provide to the public, any changes in these projections or our failure to meet these
projections;
- •
- announcements by us or our competitors of new products, new or terminated significant contracts, commercial relationships
or capital commitments;
- •
- additional dilution to our existing shareholders due to new financing activities;
- •
- failure of securities analysts to maintain coverage of us, changes in financial estimates by any securities analysts who
follow our company, or our failure to meet these estimates or the expectations of investors;
- •
- developments or disputes concerning our intellectual property or other proprietary rights;
- •
- commencement of, or our involvement in, litigation;
- •
- announced or completed acquisitions of businesses or technologies by us or our competitors;
- •
- changes in operating performance and stock market valuations of other technology companies generally, or those in our
industry in particular;
- •
- price and volume fluctuations in the overall stock market, including as a result of trends in the economy as a whole, such
as the continuing volatility in the financial markets;
- •
- rumors and market speculation involving us or other companies in our industry;
- •
- any major change in our management;
- •
- general economic conditions and slow or negative growth of our markets; and
- •
- other events or factors, including those resulting from war, incidents of terrorism or responses to these events.
In addition, the stock market in general, and the market for technology companies in particular, has experienced extreme price and volume fluctuations that have often been unrelated or disproportionate to the operating performance of those companies. Broad market and industry factors may seriously affect the market price of our common stock, regardless of our actual operating
38
performance. In addition, in the past, following periods of volatility in the overall market and the market price of a particular company's securities, securities class action litigation has often been instituted against these companies. This litigation, if instituted against us, could result in substantial costs and a diversion of our management's attention and resources.
If securities or industry analysts issue an adverse or misleading opinion regarding our stock or do not publish research or reports about our business, our stock price and trading volume could decline.
The trading market for our common stock relies in part on the research and reports that equity research analysts publish about us and our business. We do not control these analysts or the content and opinions included in their reports. The price of our common stock could decline if one or more equity research analysts downgrade our common stock or if those analysts issue other unfavorable commentary or cease publishing reports about us or our business. If one or more equity research analysts cease coverage of our company, we could lose visibility in the market, which in turn could cause our stock price to decline. Further, securities analysts may elect not to provide research coverage of our common stock and such lack of research coverage may adversely affect the market price of our common stock.
Insiders have substantial control over us and will be able to influence corporate matters.
As of February 29, 2012, our directors and executive officers and their affiliates beneficially owned approximately 35% of our outstanding capital stock. As a result, these stockholders will be able to exercise significant influence over all matters requiring stockholder approval, including the election of directors and approval of significant corporate transactions, such as a merger or other sale of our company or its assets. This concentration of ownership could limit stockholders' ability to influence corporate matters and may have the effect of delaying or preventing a third party from acquiring control over us.
Future sales of shares by existing stockholders could cause our stock price to decline.
If our existing stockholders sell, or indicate an intention to sell, substantial amounts of our common stock in the public market, the trading price of our common stock could decline. The lock-up agreements with directors and officers, and holders of substantially all of our outstanding equity securities expired in September of 2010. As of December 31, 2011, approximately 17.7 million shares of common stock were issued and outstanding. At that date, we had approximately 4.0 million shares of our common stock that will become eligible for sale in the public market to the extent exercised and permitted by the provisions of various stock plans and vesting agreements outstanding as of December 31, 2011. The weighted-average exercise price for options was $9.04 per share as of December 31, 2011. In addition, warrants to purchase 2.7 million shares of common stock at a weighted average exercise price of $10.76 per share had not been exercised and were still outstanding as of December 31, 2011. If these additional shares are sold, or if it is perceived that they will be sold, in the public market, the trading price of our common stock could decline.
We have never paid dividends on our capital stock, and we do not anticipate paying any cash dividends in the foreseeable future.
We have paid no cash dividends on any of our classes of capital stock to date, have contractual restrictions against paying cash dividends and currently intend to retain our future earnings to fund the development and growth of our business. As a result, capital appreciation, if any, of our common stock will be the sole source of gain for the foreseeable future.
39
Certain provisions of our certificate of incorporation and bylaws and of Delaware law may make it difficult for stockholders to change the composition of our board of directors and may discourage hostile takeover attempts that some of our stockholders may consider to be beneficial.
Certain provisions of our certificate of incorporation and bylaws and of Delaware law may have the effect of delaying or preventing changes in control if our board of directors determines that such changes in control are not in the best interests of us and our stockholders. The provisions in our certificate or incorporation and bylaws include, among other things, the following:
- •
- the ability of our board of directors to issue shares of preferred stock and to determine the price and other terms,
including preferences and voting rights, of those shares without stockholder approval;
- •
- stockholder action can only be taken at a special or regular meeting and not by written consent;
- •
- advance notice procedures for nominating candidates to our board of directors or presenting matters at stockholder
meetings;
- •
- allowing only our board of directors to fill vacancies on our board of directors; and
- •
- supermajority voting requirements to amend our bylaws and certain provisions of our certificate of incorporation.
While these provisions have the effect of encouraging persons seeking to acquire control of our company to negotiate with our board of directors, they could enable the board of directors to hinder or frustrate a transaction that some, or a majority, of the stockholders might believe to be in their best interests and, in that case, may prevent or discourage attempts to remove and replace incumbent directors. We are also subject to Delaware laws that could have similar effects. One of these laws prohibits us from engaging in a business combination with a significant stockholder unless specific conditions are met.
ITEM 1B. UNRESOLVED STAFF COMMENTS
Not applicable.
Our principal administrative, research and development, sales and marketing, and customer support office space is located in approximately 44,000 square feet leased facility in Sunnyvale, California. This lease expires in March of 2015. We also lease approximately 35,000 square feet for a research and development facility in Bangalore, India pursuant to a lease that expires in November 2016, which is non-cancellable prior to 2014. We have the option to renew the lease for an additional five years. In addition, we lease office space for sales offices at various locations throughout the world under operating leases. These leases expire at various dates. We believe our facilities are either adequate for our needs for at least the next 12 months or that suitable additional or alternative space will be reasonably available to accommodate foreseeable expansion of our operations.
We are subject to various claims arising in the ordinary course of business. Although no assurance may be given, we believe that we are not presently a party to any litigation of which the outcome, if determined adversely, would individually or in the aggregate be reasonably expected to have a material and adverse effect on our business, operating results, cash flows or financial position.
40
On May 11, 2010, Extricom Ltd., filed suit against us in the Federal District Court of Delaware asserting infringement of U.S. Patent No. 7,697,549. Also on May 11, 2010, we filed a declaratory relief action against Extricom Ltd. in the Federal District Court for Northern California seeking a declaration that we are not infringing the Extricom Ltd. patent and that the patent is invalid. Our declaratory relief action in the Northern District of California was dismissed by the Court on August 31, 2010 in favor of the Delaware action on the ground that Extricom Ltd. filed its suit in the Federal District Court of Delaware first. On December 30, 2011, we filed a renewed motion to transfer this case to the Northern District of California in light of the recent Federal Circuit decision in In re Link_A_Media Devices Corp., 2011 WL 6004566 (Fed. Cir. Dec. 2, 2011). The previous motion to transfer was denied on October 12, 2011. Fact discovery was opened on March 2, 2011, and trial is scheduled to commence on November 12, 2012. The Extricom Ltd. complaint seeks unspecified monetary damages and injunctive relief. During March 2012, our settlement negotiations with Extricom Ltd., progressed, and as of March 15, 2012, the parties are discussing the form, terms and conditions of a potential license and settlement agreement with the expectation that a payment of approximately $2.3 million will be made to Extricom Ltd., if mutually agreeable terms and conditions can be reached. Given the remaining uncertainties, we are unable to allocate the expected payment to any of the elements in the potential license and settlement agreement, and as such, have not adjusted our consolidated financial statements.
In October 2010, a complaint was filed by Eon Corp. IP Holdings LLC against us as well as numerous other defendants, in the United States District Court for the Eastern District of Texas, Marshall Division. The complaint alleges infringement by the defendants of U.S. Patent 5,592,491. Our initial attempts at informally resolving the action were unsuccessful. On January 11, 2011, Eon filed an amended complaint, adding, among other things, additional defendants. On March 7, 2011, we answered the complaint, alleging that the EON patents are not infringed and are invalid. No settlement conferences or mediations have been scheduled. On January 9, 2012, the Texas court transferred the case to the United States District Court for the Northern District of California. At this time, we are unable to determine the outcome of this matter and, accordingly, cannot estimate the potential financial impact this action could have on our business, results of operations, cash flows and financial position.
On June 2, 2011, the United States International Trade Commission instituted a Section 337 Investigation, based on allegations that Linex Technologies, Inc.'s U.S. Patents relating to multiple-input-multiple-output technology are infringed by 802.11n products imported and sold by us—as well as by Hewlett-Packard, Apple, Aruba Networks, and Ruckus Wireless. We and our co-respondents are currently in the expert discovery phase of the Section 337 Investigation. A second settlement conference was held on March 5, 2012, but no resolution was reached. If the parties are unable to resolve the dispute, we intend to defend the suit vigorously. At this time, we are unable to determine the outcome of this matter and, accordingly, cannot estimate the potential financial impact this action could have on our business, operating results, cash flows or financial position.
Third parties have from time to time claimed, and others may claim in the future, that we have infringed their past, current or future intellectual property rights. These claims, whether meritorious or not, could be time-consuming, result in costly litigation, require expensive changes to our products or could require us to enter into costly royalty or licensing agreements, if available. As a result, these claims could harm our business, results of operations, cash flows and financial position.
ITEM 4. MINE SAFETY DISCLOSURES
Not applicable.
41
ITEM 5. MARKET FOR REGISTRANT'S COMMON EQUITY, RELATED STOCKHOLDER MATTERS AND ISSUER PURCHASES OF EQUITY SECURITIES
Market Information for Our Common Stock
Our common stock is traded on the NASDAQ Global Market under the symbol "MERU" since it began trading on March 31, 2010. Our initial public offering was priced at $15.00 per share on March 31, 2010. At December 31, 2011, there were 118 stockholders of record of our common stock.
The following table sets forth the high and low closing prices by quarter for fiscal years 2011 and 2010:
| |
High | Low | |||||
|---|---|---|---|---|---|---|---|
Fiscal Year 2011 |
|||||||
First Quarter |
$ | 25.50 | $ | 15.82 | |||
Second Quarter |
$ | 20.56 | $ | 12.01 | |||
Third Quarter |
$ | 12.20 | $ | 7.36 | |||
Fourth Quarter |
$ | 8.48 | $ | 3.17 | |||
Fiscal Year 2010 |
|||||||
First Quarter (March 31, 2010) |
$ | 19.17 | $ | 19.17 | |||
Second Quarter |
$ | 19.33 | $ | 11.62 | |||
Third Quarter |
$ | 17.67 | $ | 10.56 | |||
Fourth Quarter |
$ | 17.50 | $ | 13.82 | |||
Stock Performance Graph and Cumulative Total Return
The following graph shows a comparison from March 31, 2010 through December 31, 2011 of the cumulative total return on our common stock, the NASDAQ Composite Index and the NASDAQ Computer Index. The graph and table assume that $100 was invested on March 31, 2010 in Meru Networks, Inc. common stock, the NASDAQ Composite Index and the NASDAQ Computer Index with
42
the reinvestment of all dividends, if any. Such returns are based on historical results and are not intended to suggest future performance.
COMPARISON OF 21 MONTH CUMULATIVE TOTAL RETURN*
Among Meru Networks, Inc., the NASDAQ Composite Index, and the NASDAQ Computer Index
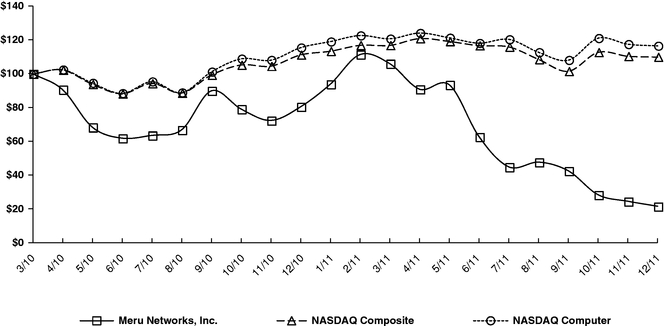
- *
- $100
invested on 3/31/10 in stock or index, including reinvestment of dividends.
Fiscal year ending December 31.
Dividend Policy
We have never declared or paid any cash dividends on our capital stock. We currently expect to retain future earnings, if any, and do not anticipate paying any cash dividends in the foreseeable future. In addition, our debt agreements contain certain affirmative and negative covenants, including restrictions with respect to payment of cash dividends. Any further determination to pay dividends on our capital stock will be at the discretion of our board of directors and will depend on our financial condition, results of operations, capital requirements and other factors that our board of directors considers relevant.
43
Equity Compensation Plan Information
The following table summarizes information about our equity compensation plans as of December 31, 2011. All outstanding awards relate to our common stock.
| |
Number of Securities to be Issued Upon Exercise of Vested Options, Purchase Rights under Employee Stock Purchase Plan and Vesting of Restricted Stock(1) |
Weighted Average Exercise Price |
Number of Securities Remaining Available for Future Issuance Under Equity Compensation Plan |
|||||||
|---|---|---|---|---|---|---|---|---|---|---|
Equity compensation plans approved by security holders |
3,958,951 | $ | 9.04 | 1,934,720 | ||||||
Equity compensation plans not approved by security holders |
— | — | — | |||||||
Total equity compensation plans |
3,958,951 | $ | 9.04 | 1,934,720 | ||||||
- (1)
- Prior to our Initial Public Offering, or IPO, we issued securities under our 2002 Stock Incentive Plan. Following our IPO, we issued securities under our 2010 Stock Incentive Plan, or 2010 Plan, and our 2010 Employee Stock Purchase Plan, or ESPP.
Under the 2010 Plan we may issue stock awards, including but not limited to restricted stock awards, restricted stock units, stock bonus awards, stock appreciation rights and performance share awards. The 2010 Plan contains a provision that the number of shares available for grant and issuance will be increased on January 1 of each year from 2011 through 2020 by an amount equal to the lesser of 4% of our shares outstanding on the immediately preceding December 31 and the number of shares determined by our board of directors.
Under the ESPP, we may grant options for the purchase of our common stock. The ESPP contains a provision that the number of shares available for grant and issuance will be increased on January 1 of each of 2011 through 2020, by an amount equal to the lesser of 1% of our shares outstanding on the immediately preceding December 31 and the number of shares determined by our board of directors.
Recent Sales of Unregistered Securities
In March and April of 2010, warrants to purchase 4,510,843 shares of Series E stock were exercised, of which 1,020,463 were cash exercises and we received $0.7 million for the cash exercises. The other 3,490,380 were exercised utilizing a cashless exercise provision. In aggregate, 3,084,368 shares of Series E were issued in conjunction with these exercises, all of which converted to common stock in connection with our initial public offering. The sales of these securities were deemed to be exempt from registration under the Securities Act in reliance upon Section 4(2) of the Securities Act as transactions by an issuer not involving any public offering.
From January 1, 2010 to March 30, 2010, options to purchase 613,593 shares of common stock with an exercise price of $9.10 per share were granted to our directors, officers, employees, and consultants and options to purchase 27,853 shares of common stock were exercised under the 2002 Stock Incentive Plan. The sales of these securities were deemed to be exempt from registration under the Securities Act in reliance upon Section 4(2) of the Securities Act or Rule 701 promulgated under Section 3(b) of the Securities Act as transactions by an issuer not involving any public offering or pursuant to benefit plans and contracts relating to compensation as provided under Rule 701.
None of the foregoing transactions involved any underwriters, underwriting discounts or commissions, or any public offering. The recipients of securities in each of these transactions represented their intention to acquire the securities for investment only and not with view to or for sale in connection with any distribution thereof, and appropriate legends were affixed to the share
44
certificates and instruments issued in such transactions. All recipients had adequate access, through their relationship with us, to information about us.
Use of Proceeds from Initial Public Offering
On March 30, 2010, the registration statement (No. 333-163859) on Form S-1 for our IPO of our common stock was declared effective by the SEC, and the offering commenced. The managing underwriters were Bank of America Merrill Lynch, Baird, Cowen and Company, JMP Securities and ThinkEquity LLC.
As the result of the IPO, we sold 4,233,017 shares of our common stock and received $57.1 million in proceeds, net of underwriting discount and net of commission of $4.4 million and offering related expenses of $2.0 million, on April 6, 2010, which was the closing date of the offering. As of December 31, 2011, we have used $16.8 million of the proceeds of our initial public offering to fund operations. We expect to use the remaining net proceeds from the IPO for general corporate purposes, including further expansion of our sales and marketing efforts, continued investments in research and development and for capital expenditures. There has been no material changes in the planned use of proceeds from our IPO as described in the final prospectus filed with SEC pursuant to Rule 424(b).
Our management will retain broad discretion in the allocation and use of the net proceeds of our IPO, and investors will be relying on the judgment of our management regarding the application of the net proceeds. Pending specific utilization of the net proceeds as described above, we have invested the net proceeds of the offering in money market funds and U.S. Treasury securities. The goal with respect to the investment of the net proceeds will be capital preservation and liquidity so that such funds are readily available to fund our operations.
Purchases of Equity Securities by the Issuer and Affiliated Purchasers
We did not make any repurchases of our common stock and no purchases of common stock were made on our behalf during the fourth quarter and the fiscal year of 2011.
45
ITEM 6. SELECTED FINANCIAL DATA
The information set forth below should be read in conjunction with Item 7, "Management's Discussion and Analysis of Financial Condition and Results of Operations" and Item 8, "Financial Statements and Supplementary Data", and related notes, schedules and information included in this Annual Report on Form 10-K. The selected consolidated financial data in this section is not necessarily indicative of the results of future operations.
| |
Years Ended December 31, | |||||||||||||||
|---|---|---|---|---|---|---|---|---|---|---|---|---|---|---|---|---|
| |
2011 | 2010 | 2009 | 2008 | 2007 | |||||||||||
| |
(in thousands, except for share and per share amounts) |
|||||||||||||||
Consolidated Statement of Operations Data |
||||||||||||||||
Revenues: |
||||||||||||||||
Products |
$ | 74,279 | $ | 63,197 | $ | 45,196 | $ | 29,532 | $ | 4,981 | ||||||
Support and services |
12,957 | 10,479 | 5,866 | 1,300 | 401 | |||||||||||
Ratable products and services |
3,235 | 11,328 | 18,432 | 23,820 | 10,578 | |||||||||||
Total revenues |
90,471 | 85,004 | 69,494 | 54,652 | 15,960 | |||||||||||
Costs of revenues: |
||||||||||||||||
Products |
26,415 | 22,060 | 17,332 | 15,318 | 3,996 | |||||||||||
Support and services |
4,581 | 2,297 | 876 | 123 | 57 | |||||||||||
Ratable products and services |
1,863 | 6,021 | 9,571 | 13,376 | 10,593 | |||||||||||
Total costs of revenues(1) |
32,859 | 30,378 | 27,779 | 28,817 | 14,646 | |||||||||||
Gross margin |
57,612 | 54,626 | 41,715 | 25,835 | 1,314 | |||||||||||
Operating expenses |
||||||||||||||||
Research and development(1) |
13,966 | 12,399 | 10,018 | 12,527 | 12,052 | |||||||||||
Sales and marketing(1) |
47,688 | 33,483 | 25,762 | 30,209 | 25,687 | |||||||||||
General and administrative(1) |
14,779 | 10,462 | 6,858 | 7,386 | 4,850 | |||||||||||
Litigation reserve |
7,250 | — | — | — | — | |||||||||||
Total operating expenses |
83,683 | 56,344 | 42,638 | 50,122 | 42,589 | |||||||||||
Loss from operations |
(26,071 | ) | (1,718 | ) | (923 | ) | (24,287 | ) | (41,275 | ) | ||||||
Interest expense, net |
(253 | ) | (813 | ) | (1,825 | ) | (2,365 | ) | (39 | ) | ||||||
Other income (expense), net |
41 | (33,821 | ) | (14,447 | ) | 108 | 178 | |||||||||
Loss before provision for income taxes |
(26,283 | ) | (36,352 | ) | (17,195 | ) | (26,544 | ) | (41,136 | ) | ||||||
Provision for income taxes |
411 | 254 | 191 | 209 | 60 | |||||||||||
Net loss |
(26,694 | ) | (36,606 | ) | (17,386 | ) | (26,753 | ) | (41,196 | ) | ||||||
Accretion on convertible preferred stock |
— | — | 221 | (68 | ) | (66 | ) | |||||||||
Net loss attributable to common stockholders |
$ | (26,694 | ) | $ | (36,606 | ) | $ | (17,165 | ) | $ | (26,821 | ) | $ | (41,262 | ) | |
Net loss per share of common stock: |
||||||||||||||||
Basic and diluted |
$ | (1.54 | ) | $ | (3.06 | ) | $ | (45.15 | ) | $ | (80.31 | ) | $ | (240.93 | ) | |
Shares used in computing net loss per share of common stock: |
||||||||||||||||
Basic and diluted |
17,377,503 | 11,981,170 | 380,179 | 333,989 | 171,264 | |||||||||||
- (1)
- Includes stock-based compensation expense as follows:
| |
Years Ended December 31, | |||||||||||||||
|---|---|---|---|---|---|---|---|---|---|---|---|---|---|---|---|---|
| |
2011 | 2010 | 2009 | 2008 | 2007 | |||||||||||
| |
(in thousands) |
|||||||||||||||
Costs of revenues |
$ | 346 | $ | 197 | $ | 71 | $ | 62 | $ | 10 | ||||||
Research and development |
1,131 | 767 | 187 | 92 | 61 | |||||||||||
Sales and marketing |
2,217 | 985 | 312 | 365 | 158 | |||||||||||
General and administrative |
2,480 | 1,896 | 297 | 199 | 63 | |||||||||||
46
| |
As of December 31, | |||||||||||||||
|---|---|---|---|---|---|---|---|---|---|---|---|---|---|---|---|---|
| |
2011 | 2010 | 2009 | 2008 | 2007 | |||||||||||
| |
(in thousands) |
|||||||||||||||
Consolidated Balance Sheet Data: |
||||||||||||||||
Cash and cash equivalents and short-term investments |
$ | 40,259 | $ | 67,269 | $ | 21,283 | $ | 5,172 | $ | 19,384 | ||||||
Working capital (deficit) |
30,952 | 52,642 | (23,537 | ) | (28,677 | ) | 8,700 | |||||||||
Total assets |
66,843 | 84,368 | 38,412 | 30,812 | 51,881 | |||||||||||
Convertible promissory notes |
— | — | — | 11,450 | — | |||||||||||
Warrant liability |
— | — | 18,939 | 505 | 574 | |||||||||||
Total debt, excluding convertible promissory notes |
— | 2,808 | 14,255 | 16,101 | 17,432 | |||||||||||
Convertible preferred stock |
— | — | 125,255 | 94,157 | 94,089 | |||||||||||
Total stockholders' equity (deficit) |
32,471 | 49,918 | (155,448 | ) | (139,359 | ) | (113,499 | ) | ||||||||
ITEM 7. MANAGEMENT'S DISCUSSION AND ANALYSIS OF FINANCIAL CONDITION AND RESULTS OF OPERATIONS
The following discussion and analysis of our financial condition and results of operations should be read in conjunction with our consolidated financial statements and related notes included elsewhere in this Form 10-K. This discussion contains forward-looking statements that involve risks and uncertainties. Our actual results could differ materially from those discussed below. Factors that could cause or contribute to such differences include, but are not limited to, those identified below and those discussed in the section entitled "Risk Factors" included elsewhere in this Form 10-K.
Overview
We provide a virtualized wireless LAN solution that is designed to cost-effectively optimize the enterprise network to deliver the performance, reliability, predictability and operational simplicity of a wired network, with the advantages of mobility. Our solution represents an innovative approach to wireless networking that utilizes virtualization technology to create an intelligent and self-monitoring wireless network. We sell a virtualized wireless LAN solution built around our System Director Operating System, which runs on our controllers and access points. We also offer additional products designed to deliver centralized network management, predictive and proactive diagnostics and enhanced security.
We were founded in January 2002 with the vision of developing a virtualized wireless LAN solution that enables enterprises to deliver business-critical applications over wireless networks, and become what we refer to as All-Wireless Enterprises. From our inception through 2003, we were principally engaged in the design and development of our virtualized wireless LAN solution. We focused on developing technology that could reliably and predictably deliver business-critical applications using voice, video and data over wireless networks in dense environments. We began commercial shipments of our products in December 2003, and initially targeted markets where the wireless delivery of applications in dense environments is critical, such as healthcare and education. Since that time, we have broadened our focus to include organizations in more markets, and have significantly expanded our geographic reach. To date, our products have been deployed by approximately 6,000 customers worldwide in many markets, including education, healthcare, hospitality, manufacturing, retail, technology, finance, government, telecom, transportation and utilities.
We outsource the manufacturing of our hardware products, including all of our access points and controllers, to original design manufacturers and contract manufacturers. We also outsource the warehousing and delivery of our products to a third-party logistics provider in the United States for worldwide fulfillment.
47
Our products and support services are sold worldwide, primarily through value-added resellers, or VARs and distributors, which serve as our channel partners. We employ a sales force that is responsible for managing sales within each geographic territory in which we market and sell our products.
Since inception, we have expended significant resources on our research and development operations. Our research and development activities were primarily conducted at our headquarters in Sunnyvale, California until 2005, when we significantly expanded our research and development operations in Bangalore, India. In 2006, we began developing products specifically to leverage the capabilities of a new wireless communication standard promulgated by the IEEE, the 802.11n standard, and began commercial shipments of our 802.11n products in the second half of 2007.
We believe several emerging trends and developments will be integral to the future growth of our business. The growing number of wireless devices and the increased expectations of the users of these devices are driving demand for better performing wireless networks. Enterprises increasingly view wireless networks as a means to deliver better service to their customers and increase the productivity of their workforce, and as a result, they are shifting from the casual use of wireless networks to the strategic use of wireless networks for business-critical applications. Further, enterprises are increasingly realizing that wireless networks designed to optimize the 802.11n standard and the planned 802.11ac standard can deliver the capacity and performance to support their business-critical applications.
Our ability to capitalize on emerging trends and developments will depend, in part, on our ability to execute our growth strategy of increasing the recognition of our brand and the effectiveness of our solution, expanding the adoption of our solution across markets, and expanding and leveraging our relationships with the channel partners. We continue to evolve our entire organization to further capitalize on growth opportunities. On October 3, 2011, our Chief Executive Officer, Ihab Abu-Hakima, informed us of his determination to resign effective the earlier of March 31, 2012, or the date that is 30 days after the date on which a new Chief Executive Officer is appointed and commences work in that capacity. In connection with that determination, we and Mr. Abu-Hakima entered into a transitional employment agreement for his continued service during the transitional period. We expect to incur total cost of $2.0 million for the Chief Executive Officer transition including costs related to Mr. Abu-Hakima's transitional employment agreement. We are recognizing this expense over Mr. Abu-Hakima's October 2011 to March 2012 transitional service period. We are also in the process of identifying and recruiting a new Chief Executive Officer. Our ability to achieve and maintain profitability as well as our other goals in the future will be affected by, among other things, the continued acceptance of our products, the timing and size of orders, the average selling prices for our products and services, the costs of our products, and the extent to which we invest in our sales and marketing, research and development, and general and administrative resources, as well as our ability to recruit and integrate a new Chief Executive Officer.
Our revenues have grown from $1.1 million in 2005 to $90.5 million in 2011. It is very difficult to predict our revenues in the near term. Our revenues have in the past fluctuated significantly, and may continue to fluctuate in the future. Further, our revenues during any given quarter depend on multiple factors, including, but not limited to, the amount of orders booked in a prior quarter but not shipped until the given quarter, new orders received and shipped in the given quarter, the amount of deferred revenue recognized in the given quarter and the amount of revenues that meet the accounting standards for revenue recognition. These factors could impact our revenues significantly in any given quarter.
48
In addition, we believe that there can be significant seasonal factors that may cause the first and third quarters of our fiscal year to have relatively weaker products revenues than the second and fourth fiscal quarters. We believe that this seasonality results from a number of factors, including:
- •
- customers with a December 31 fiscal year end may choose to spend remaining budgets before their year end resulting
in a positive impact on our products revenues in the fourth quarter of our fiscal year;
- •
- the structure of our direct sales compensation program may provide additional financial incentives to our sales personnel
for exceeding their annual goals;
- •
- the timing of our annual training for the entire sales force in our first fiscal quarter combined with the above fourth
quarter factors can potentially cause our first fiscal quarter to be seasonally weak;
- •
- many of our education customers have procurement and deployment cycles that can result in stronger order flow in our
second fiscal quarter than other quarters assuming the continued availability of traditional funding sources, such as the E-Rate program in the United States; and
- •
- seasonal reductions in business activity during the summer months in the United States, Europe and certain other regions may have a negative impact on our third quarter revenues.
We believe that our historical growth, variations in the number of orders booked in a prior quarter but not shipped until a later quarter and other variations in the amount of deferred revenues may have overshadowed the nature or magnitude of seasonal or cyclical factors that might have influenced our business to date. In addition, the timing of one or more large transactions may overshadow seasonal factors in any particular quarterly period. Seasonal or cyclical variations in our operations may become more pronounced over time and may materially affect our results of operations in the future.
We have incurred losses since inception as we grew our business and invested in research and development, sales and marketing, and administrative functions. As of December 31, 2011, we had an accumulated deficit of $221.9 million.
Vendor Specific Objective Evidence
Our recognition of revenues in a particular period depends on the satisfaction of specific revenue recognition criteria, which we describe in more detail below. We adopted two new accounting standards for certain revenue arrangements that include software elements and multiple deliverable revenue arrangements on January 1, 2011. The adoption of these two accounting standards resulted in $0.9 million additional revenue recognized during the year ended December 31, 2011, which would not have been recognized in the current year if the previous revenue recognition standards were in effect. This difference mainly relates to revenue recognized on delivered elements within transactions where there were partial shipments. Under previous accounting guidance, revenue from these orders was deferred in its entirety until the entire order was delivered.
The manner in which we recognize our revenues has changed significantly over time, particularly in 2008 and 2009, when we established vendor specific objective evidence of fair value, or VSOE, for our support services. These changes have had a significant impact on the timing of when we recognize revenues from sales of our products and services. Generally, upon establishing VSOE for support services for a customer or class of customers, our total recognized revenues from sales to these customers increased in subsequent periods because we were able to recognize all of the products revenues from these sales in these periods once all revenue recognition criteria were satisfied, and we were no longer required to defer the recognition of products revenues over the support period. We also continued to recognize ratable products and services revenues from sales to customers made prior to establishing VSOE for support services. This impact will decrease over time as our deferred revenue
49
balance declines from the time we established VSOE for support services. We recognize the costs of revenues in the same period in which we recognize the associated revenues. When reviewing our financial performance and making period-to-period comparisons, you should consider the impact that the timing of the adoption of the two new accounting standards and the establishment of VSOE had on our financial results, including the amount of our revenues and costs of revenues.
For additional discussion of the impact on our results of operations of our establishment of VSOE for support services, see the sections below entitled "Components of Revenues, Costs of Revenues and Operating Expenses-Revenues" and "Critical Accounting Policies—Revenue Recognition."
Key Metrics
We monitor the key financial metrics set forth below to help us evaluate growth trends, establish budgets, measure the effectiveness of our sales and marketing efforts and assess operational efficiencies. We discuss product revenues, support and services revenues and the components of operating income below under "Components of Revenues, Cost of Revenues and Operating Expenses" and we discuss our cash and cash equivalents and short-term investments under "Liquidity and Capital Resources."
| |
Fiscal Years or as of Fiscal Years Ended |
|||||||||
|---|---|---|---|---|---|---|---|---|---|---|
| |
2011 | 2010 | 2009 | |||||||
| |
(dollars in thousands) |
|||||||||
Products revenues |
$ | 74,279 | $ | 63,197 | $ | 45,196 | ||||
Support and services revenues |
12,957 | 10,479 | 5,886 | |||||||
Gross margin-products and support and services |
64 | % | 64 | % | 60 | |||||
Loss from operations(1) |
$ | (26,071 | ) | $ | (1,718 | ) | $ | (923 | ) | |
Cash and cash equivalents and short-term investments |
40,259 | 67,269 | 21,283 | |||||||
Net cash used in operating activities |
(22,402 | ) | (2,119 | ) | (5,683 | ) | ||||
(1) Includes stock-based compensation expense of: |
$ | 6,174 | $ | 3,845 | $ | 867 |
Gross margin-products and support and services. We monitor gross margin to measure our cost efficiencies, including primarily whether our manufacturing costs and component costs are in line with our product revenues and our personnel costs associated with our technical support, professional services and training teams are in line with our support and services revenues.
Net cash used in operating activities. We monitor cash flow from operations as a measure of our overall business performance. Our primary uses of cash from operating activities are for personnel-related expenditures, purchases of inventory, costs related to our facilities and litigation reserve expense. Monitoring cash flow from operations enables us to analyze our financial performance without the non-cash effects of certain items such as depreciation and amortization, stock-based compensation expenses and warrant expense, thereby allowing us to better understand and manage the cash needs of our business.
50
Components of Revenues, Costs of Revenues and Operating Expenses
Revenues. We derive our revenues from sales of our products, and support and services. Our total revenues are comprised of the following:
- •
- Products Revenues—We generate products revenues from sales of
our software and hardware products, which primarily consist of our System Director Operating System running our access points and controllers, as well
as additional software applications.
- •
- Support and Services Revenues—We generate support and services
revenues primarily from service contracts for our Meru Assure customer support program, which includes software updates, maintenance releases and
patches, telephone and internet access to our technical support personnel and hardware support. We also generate support and services revenues from the professional and training services that we
provide to our VARs, distributors and customers.
- •
- Ratable Products and Services Revenues—Prior to January 1, 2009, we recognized ratable products and services revenues from sales of our products and services in circumstances where VSOE for support services being provided could not be segregated from the value of the entire sales arrangement, or where we provided technical support or unspecified software upgrades outside of contractual terms. In these cases, revenues were deferred and recognized ratably over either the economic life of the product or the contractual period. As of January 1, 2009, we established VSOE for support services for all our channel partners and customers, and we no longer offer support outside of contractual terms, and therefore, we are able to recognize products revenues and support and services revenues separately.
Deferred Revenue. Prior to establishing VSOE for our support services provided to VARs, distributors and customers, we recognized the revenues from such sales over either the economic life of the related products or the contractual support period, depending on the party and the time at which the sale occurred. As such, prior to establishing VSOE for support services sold to VARs, distributors and customers, only a small amount of our invoiced products and services within a quarter were recognized as revenues in such quarter, with the majority recorded as deferred revenue. We established VSOE for support services sold to our channel partners, including VARs, distributors and customers, at different times during 2007, 2008 and 2009. The decreases in deferred revenue due to the related recognition of ratable revenue are partially offset by the sale of support services that will be recognized over the term of the support agreements. The total deferred revenue as of December 31, 2011 and 2010 were $16.2 million and $16.6 million, respectively.
Costs of Revenues. Our total costs of revenues is comprised of the following:
- •
- Costs of Products Revenues—A substantial majority of the costs
of products revenues consists of third-party manufacturing costs and component costs. Our costs of products revenues also include shipping costs, third-party logistics costs, write-offs
for excess and obsolete inventory and warranty costs.
- •
- Costs of Support and Services Revenues—Costs of services
revenues is primarily comprised of personnel costs associated with our technical support, professional services and training teams.
- •
- Costs of Ratable Products and Services Revenues—Costs of ratable products and services revenues is comprised primarily of deferred costs of products revenues and an allocation of costs of services revenues.
Operating Expenses. Our operating expenses consist of research and development, sales and marketing, general and administrative expenses and litigation reserve expense. The largest component of our operating expenses is personnel costs. Personnel costs consist of salaries, commissions, bonuses and benefits for our employees. We grant our employees and members of our board of directors equity
51
awards and recognize stock-based compensation cost as part of operating expenses. We expect to continue to incur significant stock-based compensation expense as our employee base grows. Professional services consist of outside legal and accounting services and information technology and other consulting costs. We expect our operating expenses to continue to grow in absolute dollars in the near term, although they are likely to fluctuate as a percentage of revenues.
Research and Development Expenses. Research and development expenses primarily consist of personnel, engineering, testing and compliance, facilities and professional services costs. We expense research and development costs as incurred. We are devoting substantial resources to the continued development of additional functionality for our existing products and the development of new products.
Sales and Marketing Expenses. Sales and marketing expenses represent the largest component of our operating expenses and primarily consist of personnel costs, sales commissions, travel costs, cost for marketing programs and facilities costs. We plan to continue to invest in sales and marketing, including our VARs and distributors, and increase the number of our sales personnel worldwide, although at a slower rate of increase than experienced in 2011.
General and Administrative Expenses. General and administrative expenses primarily consist of personnel, professional services and facilities costs related to our executive, finance, human resource and information technology functions. Professional services consist of outside legal and accounting services and information technology consulting costs. We have incurred additional accounting and legal costs related to compliance with rules and regulations enacted by the SEC, including the additional costs of complying with Section 404 of the Sarbanes-Oxley Act, as well as additional insurance, investor relations and other costs associated with being a public company.
Litigation Reserve Expense. Litigation reserve expense consists of settlements or anticipated settlements of litigation. In 2011, the litigation reserve expense was related to the Motorola License Agreement. As part of the Motorola License Agreement, we paid Motorola $7.3 million in 2011.
Interest Expense, Net. Interest expense, net consists primarily of interest expense on debt, prompt payment discounts and interest income on cash and cash equivalents and short-term investments balances. We paid off our long-term debt in 2011. Interest expense, net consists primarily of customer prompt payment discounts for December 31, 2011.
Other Income (Expense), Net. In 2011, other income (expense), net consists primarily of gains and losses on foreign currency transactions. In 2010, other income (expense), net consists primarily of charges to record fair value adjustments for our warrants to purchase convertible preferred stock and warrants to purchase common stock. Until the closing of our initial public offering on April 6, 2010, our outstanding warrants were classified as a liability on our consolidated balance sheets and any changes in fair value were recognized as a component of other income (expense), net.
52
Major Channel Partners
We sell products and services directly to our channel partners, including VARs and distributors. The following table sets forth our channel partners representing greater than 10% of revenues in the periods presented (in percentages):
| |
Years Ended December 31, |
|||||||||
|---|---|---|---|---|---|---|---|---|---|---|
Major Channel Partners
|
2011 | 2010 | 2009 | |||||||
Westcon Group, Inc. |
29 | 34 | 21 | |||||||
Catalyst Telecom, Inc. |
13 | 12 | 14 | |||||||
Siracom, Inc. |
11 | * | * | |||||||
- *
- Less than 10%
Critical Accounting Policies
Our consolidated financial statements are prepared in accordance with generally accepted accounting principles in the United States, or GAAP. The preparation of these consolidated financial statements requires us to make estimates and assumptions that affect the reported amounts of assets, liabilities, revenues, costs and expenses and related disclosures. We base our estimates on historical experience and on various other assumptions that we believe to be reasonable under the circumstances. In many instances, we could have reasonably used different accounting estimates, and in other instances changes in the accounting estimates are reasonably likely to occur from period-to-period. Accordingly, actual results could differ significantly from the estimates made by our management. To the extent that there are material differences between these estimates and actual results, our future financial statement presentation, financial condition, results of operations and cash flows will be affected. We believe that the accounting policies discussed below are critical to understanding our historical and future performance, as these policies relate to the more significant areas involving management's judgments and estimates.
Revenue Recognition
In October 2009, the Financial Accounting Standards Board ("FASB") amended the accounting standards for revenue recognition to remove tangible products containing software components and non-software components that function together to deliver the product's essential functionality from the scope of industry-specific software revenue recognition guidance. Also in October 2009, the FASB amended the accounting standards for multiple-deliverable arrangements to (i) provide updated guidance on how the elements in a multiple-deliverable arrangement should be separated, and how the consideration should be allocated; (ii) require an entity to allocate revenue amongst the elements in an arrangement using estimated selling prices, or ESP, if a vendor does not have VSOE or third-party evidence, or TPE, of the selling price; and (iii) eliminate the use of the residual method and require an entity to allocate revenue using the relative selling price method.
We adopted this accounting guidance at the beginning of our first quarter of the year ended December 31, 2011 on a prospective basis for applicable arrangements originating or materially modified after December 31, 2010. The adoption of these two accounting standards resulted in $0.9 million additional revenue recognized during the year ended December 31, 2011, which would not have been recognized if the previous revenue recognition standards were in effect. The majority of this difference relates to revenue recognized on partial shipment transactions. Under previous accounting guidance, revenue from these orders was deferred in its entirety until the entire order was delivered. We cannot reasonably estimate the effect of the adoption on future financial periods as the impact may vary depending on the nature and volume of future sale contracts.
53
This guidance does not generally change the units of accounting for our revenue transactions. Most non-software products and services qualify as separate units of accounting because they have value to the customer on a stand-alone basis and our revenue arrangements generally do not include a general right of return relative to delivered products.
Our revenues are derived primarily from two sources: (i) products revenues, including hardware and software products, and (ii) related support and service revenues. The majority of our products are networking communications hardware with embedded software components such that the software functions together with the hardware to provide the essential functionality of the product. Therefore, our hardware deliverables are considered to be non-software elements and are excluded from the scope of industry-specific software revenue recognition guidance. Our products revenues also includes revenues from the sale of stand-alone software products. Stand-alone software products may operate on our networking communications hardware, but are not considered essential to the functionality of the hardware. Sales of stand-alone software generally include a perpetual license to our software. Sales of stand-alone software continue to be subject to the industry-specific software revenue recognition guidance. Product support typically includes software updates on a when and if available basis, telephone and internet access to our technical support personnel and hardware support. Software updates provide customers with rights to unspecified software product upgrades and to maintenance releases and patches released during the term of the support period.
For all arrangements originating or materially modified after December 31, 2010, we recognize revenue in accordance with the amended accounting guidance. Certain arrangements with multiple-deliverables may continue to have stand-alone software elements that are subject to the existing software revenue recognition guidance along with non-software elements that are subject to the amended revenue accounting guidance. The revenues for these multiple deliverable arrangements are allocated to the stand-alone software elements as a group and the non-software elements based on the relative selling prices of all of the elements in the arrangement using the hierarchy in the amended revenue accounting guidance.
For sales of stand-alone software after December 31, 2010 and for all transactions entered into prior to the year ended December 31, 2011, we recognize revenues based on software revenue recognition guidance. Under the software revenue recognition guidance, we use the residual method to recognize revenues when a product agreement includes one or more elements to be delivered at a future date and VSOE of the fair value of all undelivered elements exists. In the majority of our contracts, the only element that remains undelivered at the time of delivery of the product is support services. Under the residual method, the fair value of the undelivered elements is deferred and the remaining portion of the contract fee is recognized as products revenues. If evidence of the fair value of one or more undelivered elements does not exist, all revenues are generally deferred and recognized when delivery of those elements occurs or when fair value can be established. When the undelivered element for which we do not have VSOE of fair value is support, revenues for the entire arrangement are bundled and recognized ratably over the support period.
VSOE for elements of an arrangement is based upon the normal pricing and discounting practices for those services when sold separately. In determining VSOE, we require that a substantial majority of the selling prices for an element falls within a reasonably narrow pricing range, generally evidenced by a substantial majority of such historical stand-alone transactions falling within a reasonably narrow range of the median rates. In addition, we consider major service groups, geographies, customer classifications, and other variables in determining VSOE.
TPE is determined based on competitor prices for similar deliverables when sold separately. We are typically not able to determine TPE for our products or services. Generally, our go-to-market strategy differs from that of our peers and our offerings contain a significant level of differentiation such that the comparable pricing of products with similar functionality cannot be obtained.
54
Furthermore, we are unable to reliably determine what similar competitor products' selling prices are on a stand-alone basis.
When we are unable to establish the selling price of our non-software elements using VSOE or TPE, we use ESP in the allocation of arrangement consideration. The objective of ESP is to determine the price at which we would transact a sale if the product or service were sold on a stand-alone basis. We determine ESP for a product or service by considering multiple factors including, but not limited to, pricing policies, internal costs, gross margin objectives, competitive landscapes, geographies, customer classes and distribution channels.
We regularly review VSOE and ESP and maintain internal controls over the establishment and updates of these estimates. There was not a material impact during the year nor do we currently expect a material impact in the near term from changes in VSOE or ESP.
We recognize revenues when all of the following have occurred: (1) we have entered into a legally binding arrangement with a customer; (2) delivery has occurred; (3) customer payment is deemed fixed or determinable and free of contingencies and significant uncertainties; and (4) collection is probable. The sales prices for our products are typically considered to be fixed or determinable at the inception of an arrangement. Delivery is considered to have occurred when product title has transferred to the customer, when the service or training has been provided, when software is delivered, or when the support period has lapsed. To the extent that agreements contain rights of return or acceptance provisions, revenues are deferred until the acceptance provisions or rights of return lapse.
The majority of our sales are generated through distributors. Revenues from distributors with return rights are recognized when the distributor reports that the product has been sold through, provided that all other revenue recognition criteria have been met. We obtain sell-through information from these distributors. For transactions with all other distributors, we do not provide for rights of return and recognize products revenues at the time of shipment, assuming all other revenue recognition criteria have been met.
Prior to April 1, 2008, we allowed some customers to receive support services outside of the contractual terms. Accordingly, we deferred and recognized revenues on all transactions, except for transactions with one customer, ratably over the economic life of the products sold as we determined that this was the best estimate of the period of time over which we provided these support services. The one exception relates to a customer for which we established VSOE of fair value for the related support contracts during the year ended December 31, 2007. Accordingly, we began to account for these support contracts as separate elements from the hardware sales.
We estimated the economic life of the hardware to be three and a half years based on several factors such as: (1) the history of technology development of related products; (2) a Company-specific evaluation of product life cycles from both a sales and product development perspective; and (3) information on customer usage of our products.
On April 1, 2008, we ceased providing support services outside of the contractual terms. As a result, we began recognizing ratable revenues from sales in which VSOE of fair value for the related support services had not been established over the contractual support period and not the three and a half year economic life of the product. Also on April 1, 2008, we established VSOE of fair value for support services to distributors. Accordingly, we recognized revenues from sales to distributors after this date and prior to January 1, 2011 using the residual method, assuming all revenue recognition criteria were met.
On January 1, 2009, we established VSOE of fair value for all remaining support services. Accordingly, we recognized revenues for other than support services for all sales made on and after January 1, 2009 and prior to January 1, 2011 using the residual method, assuming all revenue recognition criteria were met.
55
Revenues for support services are recognized on a straight-line basis over the support period, which typically ranges from one year to five years.
Shipping charges billed to customers are included in products revenues and the related shipping costs are included in costs of products revenues.
Stock-Based Compensation
We recognize stock-based compensation for equity awards on a straight-line basis over the requisite service period, usually the vesting period, based on the grant date fair value. We use the Black-Scholes option-pricing model to estimate the fair value of our stock options and shares under our ESPP. The determination of the fair value of these awards on the date of grant using the Black-Scholes option-pricing model is affected by our stock price, the expected holding period of the awards, the risk-free interest rate and the expected stock price volatility. Further, the forfeiture rate also affects the amount of aggregate compensation that we are required to record as an expense. These inputs are subjective and generally require significant judgment. If any of the assumptions used in the Black-Scholes option-pricing model change significantly, stock-based compensation for future awards may differ materially from the awards granted previously.
We account for stock options issued to nonemployees based on their estimated fair value determined using the Black-Scholes option-pricing model. However, the fair value of the equity awards granted to nonemployees is remeasured as the awards vest, and the resulting increase in value, if any, is recognized as expense during the period the related services are rendered.
Fair Value of Financial Instruments
Prior to our IPO, freestanding warrants to purchase shares of our convertible preferred stock and some of our warrants to purchase common stock were classified as a liability on the consolidated balance sheets at fair value because the warrants may have conditionally obligated us to transfer assets at some point in the future. The warrants were subject to remeasurement at each balance sheet date, and any changes in fair value were recognized as a component of other income (expense), net in the consolidated statements of operations. We estimated the fair value of these warrants at the respective balance sheet dates using the Black-Scholes option-pricing model which includes a number of highly judgmental inputs such as the fair value and expected volatility of our common stock.
During the years ended December 31, 2010 and 2009, we recorded expense of $33.6 million and $14.2 million due to the change in fair value of the warrant liability. Upon the closing of our IPO and amending the common stock warrants, the warrants were no longer considered a liability and the warrant liability was reclassified to additional paid-in capital.
We measure the fair value of financial instruments using a fair value hierarchy that prioritizes the inputs to valuation techniques used to measure fair value into three broad levels, as follows:
Level I—Inputs used to measure fair value are observable inputs such as quoted prices in active markets.
Level II—Pricing is provided by inputs other than the quoted prices in active markets that are observable either directly or indirectly. We consider the most reliable information available for the valuation of our Level II securities, which includes pricing data from our investment advisors and other independent sources.
Level III—Unobservable inputs in which there is little or no market data that requires us to develop our own assumptions. The determination of fair value for Level III investments and other financial instruments involves the most management judgment and subjectivity.
56
Inventory Valuation
Inventory consists of hardware and related component parts and is stated at the lower of cost or fair market value. We record inventory write-downs for potentially excess inventory based on forecasted demand, economic trends and technological obsolescence of our products. If future demand or market conditions are less favorable than our projections, additional inventory write-downs could be required and would be reflected in costs of product revenues in the period the revision is made. At the point of the loss recognition, a new, lower-cost basis for that inventory is established, and subsequent changes in facts and circumstances do not result in the restoration or increase in that newly established cost basis. If actual demand and market conditions are less favorable than anticipated, additional inventory adjustments could be required in future periods.
Allowances for Doubtful Accounts
We record a provision for doubtful accounts based on historical experience and a detailed assessment of the collectibility of our accounts receivable. To assist with the estimate, our management considers, among other factors, (1) the aging of the accounts receivable, including trends within the age of the accounts receivable, (2) our historical write-offs, (3) the credit-worthiness of each purchaser, (4) the economic conditions of the purchaser's industry, and (5) general economic conditions. In cases where we are aware of circumstances that may impair a specific purchaser's ability to meet their financial obligations to us, we record a specific allowance against amounts due from the customer, and thereby reduce the net recognized receivable to the amount we reasonably believe will be collected. There is significant judgment involved in estimating the allowance for doubtful accounts.
Write-offs of accounts receivable to bad debt expense were approximately $143,000 and $80,000 during the years ended December 31, 2011 and 2009. There was no bad debt expense during the year ended December 31, 2010. We collected previously written-off bad debt expense in the amount of $61,000 during the year ended December 31, 2010.
Income Taxes
Significant management judgment is required in determining our provision for income taxes, our deferred tax assets and liabilities and any valuation allowance recorded against our net deferred tax assets. We make these estimates and judgments about our future taxable income that are based on assumptions that are consistent with our future plans. As of December 31, 2011 and 2010, we have recorded a full valuation allowance on our net deferred tax assets due to uncertainties related to our ability to utilize our deferred tax assets in the foreseeable future. These deferred tax assets primarily consist of certain net operating loss carryforwards and research and development tax credits. Should the actual amounts differ from our estimates, the amount of our valuation allowance could be materially impacted.
Since inception, we have incurred operating losses, and, accordingly, we have not recorded a provision for income taxes for any of the periods presented other than foreign and state provisions for income tax. Accordingly, there have not been significant changes to our provision for income taxes during the years ended December 31, 2011, 2010 or 2009, and we do not expect any significant changes until we are no longer incurring losses.
As of December 31, 2011, we had federal net operating loss carryforwards of $126.6 million and state net operating loss carryforwards of $113.5 million. We also had federal and state research credit carryforwards of $3.7 million and $3.6 million and foreign tax credits of $435,000. Realization of deferred tax assets is dependent upon future earnings, if any, the timing and amount of which are uncertain. Accordingly, the net deferred tax assets have been fully offset by a valuation allowance. If not utilized, the federal net operating loss and tax credit carryforwards will expire beginning in 2022 and 2018, respectively and the state net operating losses have begun expiring in certain jurisdictions
57
since 2009. Utilization of these net operating losses and credit carryforwards may be subject to an annual limitation due to applicable provisions of the Internal Revenue Code of 1986, as amended, and state and local tax laws if we have experienced an "ownership change" in the past, or if an ownership change occurs in the future, including, for example, as a result of the shares issued in our initial public offering aggregated with certain other sales of our stock before or after the offering.
Significant judgment is also required in evaluating our uncertain tax positions. We establish reserves for tax-related uncertainties based on estimates of whether, and the extent to which, additional taxes will be due. These reserves are established when we believe that certain positions might be challenged despite our belief that our tax return positions are in accordance with applicable tax laws. We adjust these reserves in light of changing facts and circumstances, such as the closing of a tax audit, new tax legislation, or the change of an estimate based on new information. To the extent that the final tax outcome of these matters is different than the amounts recorded, such differences will affect the provision for income taxes in the period in which such determination is made. The provision for income taxes includes the effect of reserve provisions and changes to reserves that are considered appropriate, as well as the related net interest and penalties.
Loss Contingencies
We are or have been subject to proceedings, lawsuits and other claims arising in the ordinary course of business. We evaluate contingent liabilities including threatened or pending litigation for potential losses. If the potential loss from any claim or legal proceedings is considered probable and the amount can be estimated, we accrue a liability for the estimated loss. Because of uncertainties related to these matters, accruals are based upon management's judgment and the best information available to management at the time. As additional information becomes available, we reassess the potential liability related to pending claims and litigation and may revise our estimates, which could materially impact our results of operations, financial position and cash flows.
58
Results of Operations
Year ended December 31, 2011 compared to the year ended December 31, 2010
The following table presents our historical operating results in dollars (in thousands) and as a percentage of revenues for the periods presented:
| |
Years Ended December 31, | ||||||||||||
|---|---|---|---|---|---|---|---|---|---|---|---|---|---|
| |
2011 | 2010 | |||||||||||
REVENUES: |
|||||||||||||
Products |
$ | 74,279 | 82.1 | % | $ | 63,197 | 74.4 | % | |||||
Support and services |
12,957 | 14.3 | 10,479 | 12.3 | |||||||||
Ratable products and services |
3,235 | 3.6 | 11,328 | 13.3 | |||||||||
Total revenues |
90,471 | 100.0 | 85,004 | 100.0 | |||||||||
COSTS OF REVENUES: |
|||||||||||||
Products |
26,415 | 29.2 | 22,060 | 25.9 | |||||||||
Support and services |
4,581 | 5.1 | 2,297 | 2.7 | |||||||||
Ratable products and services |
1,863 | 2.0 | 6,021 | 7.1 | |||||||||
Total costs of revenues* |
32,859 | 36.3 | 30,378 | 35.7 | |||||||||
Gross margin |
57,612 | 63.7 | 54,626 | 64.3 | |||||||||
OPERATING EXPENSES: |
|||||||||||||
Research and development* |
13,966 | 15.5 | 12,399 | 14.6 | |||||||||
Sales and marketing* |
47,688 | 52.7 | 33,483 | 39.4 | |||||||||
General and administrative* |
14,779 | 16.3 | 10,462 | 12.3 | |||||||||
Litigation reserve |
7,250 | 8.0 | — | — | |||||||||
Total operating expenses |
83,683 | 92.5 | 56,344 | 66.3 | |||||||||
Loss from operations |
(26,071 | ) | (28.8 | ) | (1,718 | ) | (2.0 | ) | |||||
Interest expense, net |
(253 | ) | (0.3 | ) | (813 | ) | (1.0 | ) | |||||
Other income (expense), net |
41 | 0.0 | (33,821 | ) | (39.8 | ) | |||||||
Loss before provision for income taxes |
(26,283 | ) | (29.1 | ) | (36,352 | ) | (42.8 | ) | |||||
Provision for income taxes |
411 | 0.4 | 254 | 0.3 | |||||||||
Net loss |
$ | (26,694 | ) | (29.5 | )% | $ | (36,606 | ) | (43.1 | )% | |||
- *
- The following table sets forth the stock-based compensation expense included in the Consolidated Statements of Operations for the periods presented (in thousands):
| |
Years Ended December 31, |
||||||
|---|---|---|---|---|---|---|---|
| |
2011 | 2010 | |||||
Costs of revenues |
$ | 346 | $ | 197 | |||
Research and development |
1,131 | 767 | |||||
Sales and marketing |
2,217 | 985 | |||||
General and administrative |
2,480 | 1,896 | |||||
59
Revenues
Our total revenues increased by $5.5 million, or 6.4%, to $90.5 million in 2011, from $85.0 million in 2010. Our products and support and services revenues, or total revenues excluding ratable revenues, increased by $13.6 million, or 18.4%, to $87.2 million in 2011, from $73.7 million in 2010. This increase was primarily the result of increased demand for our products, particularly in the EMEA and Asia Pacific regions
Products revenues. Products revenues increased by $11.1 million, or 17.5%, to $74.3 million in 2011, from $63.2 million in 2010. The increase was primarily a result of an increase in unit shipments particularly in the EMEA and the Asia Pacific regions in 2011.
Support and services revenues. Support and services revenues increased by $2.5 million, or 23.6%, to $13.0 million in 2011, from $10.5 million in 2010. The increase in support and services revenues is a result of increased product sales, particularly in the EMEA and Asia Pacific regions, resulting in first-year support sales, and the renewal of support contracts by existing customers. As our customer base grows over time, we expect our support revenues to increase.
Ratable products and services revenues. Ratable products and services revenues decreased by $8.1 million, or 71.4%, to $3.2 million in 2011, from $11.3 million in 2010. This ratable revenue is being amortized from transactions initiated prior to 2009 and is expected to continue to decline over time as the related deferred revenue balance is depleted through 2013.
Costs of Revenue and Gross Margin
Total costs of revenues increased by $2.5 million, or 8.2%, to $32.9 million in 2011 from $30.4 million in 2010. Overall gross margins, as a percentage of total revenues, decreased to 63.7% in 2011 from 64.3% in 2010. Our product gross margins, as a percentage of product revenues, decreased to 64.4% in 2011 from 65.1% in 2010. This decrease was primarily the result of a geographic mix. Our support and services gross margins, as a percentage of support and services revenues, decreased to 64.6% in 2011 from 78.1% in 2010. This decrease was primarily the result of our increased headcount related to customer support and professional services and a reduction in the amount of support costs allocated to ratable revenues. Our ratable gross margins, as a percentage of ratable revenues, decreased to 42.4% in 2011 from 46.8% in 2010.
Operating Expenses
Our operating expenses increased by $27.3 million, or 48.5%, to $83.7 million in 2011 from $56.3 million in 2010. Our operating expenses increased as a percentage of revenue from 66.3% in 2010 to 92.5% in 2011. The increase was primarily due to an increase of $8.7 million in personnel costs related to increased headcount, a litigation reserve expense of $7.3 million, an increase of $2.2 million in stock-based compensation expense, an increase of $1.8 million in travel expenses, an increase of $1.8 million in sales and marketing program expenses, an increase of $1.4 million in legal fees related to the acquisition of Identity Networks and our ongoing litigation matters, an increase of $0.6 million in facility expense as well as an increase of $0.5 million in research and development project costs in 2011 as compared to the prior year.
Research and Development Expenses
Research and development expenses increased by $1.6 million, or 12.6%, to $14.0 million in 2011 from $12.4 million in 2010. This increase is primarily the result of an increase of $0.2 million in research and development personnel costs, an increase of $0.5 million in project costs to support continued enhancements to existing products and the development of new products, an increase of $0.4 million in stock-based compensation expense and an increase of $0.2 million in facility expense in 2011 as compared to the prior year.
60
Sales and Marketing Expenses
Sales and marketing expenses increased by $14.2 million, or 42.4%, to $47.7 million in 2011 from $33.5 million in 2010. This increase is primarily the result of an increase of $7.7 million in sales and marketing personnel costs as a result of increased headcount, an increase of $1.8 million in travel expenses, an increase of $1.1 million in sales and marketing program expenses, an increase of $1.2 million in stock-based compensation expense and an increase of $0.2 million in facility expense in 2011 as compared to the prior year.
General and Administrative Expenses
General and administrative expenses increased by $4.3 million, or 41.3%, to $14.8 million in 2011 from $10.5 million in 2010. This increase is primarily the result of $1.1 million transition costs related to our Chief Executive Officer's transitional employment agreement, an increase of $0.8 million in general and administrative personnel costs, an increase of $1.4 million in legal expense related to the acquisition of Identity Networks and ongoing litigation and $0.6 million in stock-based compensation expense. We have incurred additional accounting and legal costs related to compliance with the rules and regulations that govern us as a public company, including the additional costs of Section 404 of the Sarbanes-Oxley Act compliance, as well as additional insurance, investor relations and other costs associated with being a public company.
Litigation Reserve Expense
In 2011, we entered into a license agreement with Motorola. As part of the Motorola License Agreement, we agreed to pay Motorola $7.3 million and expensed the full amount in 2011.
Interest Expense, Net
Interest expense, net decreased by $0.6 million, or 68.9%, to $0.3 million in 2011 from $0.8 million in 2010. This decrease is primarily due to the paydown of the principal balances on our long-term debt.
Other Income (Expense), Net
Other income (expense), net changed from a net expense of $33.8 million in 2010 to a net income of $41,000 in 2011. This change is primarily due to the increase in the fair value of our warrants to purchase convertible preferred stock and common stock and the related adjustment to the warrant liability in the amount of $33.6 million in 2010. Upon the closing of our initial public offering on April 6, 2010, we remeasured the warrants and reclassified the related fair value to additional paid-in capital. Accordingly, we no longer recognize gains and losses as a result of changes in the fair value of these warrants and incurred no such expense in 2011.
Provision for Income Taxes
Our income taxes increased by $0.2 million, or 61.8%, to $0.4 million in 2011 from $0.3 million in 2010. Our tax expense was mainly driven by income earned by certain of our oversee entities. This increase of taxes was due to growth of our international entities.
61
Year ended December 31, 2010 compared to the year ended December 31, 2009
The following table presents our historical operating results in dollars (in thousands) and as a percentage of revenues for the periods presented:
| |
Years Ended December 31, | ||||||||||||
|---|---|---|---|---|---|---|---|---|---|---|---|---|---|
| |
2010 | 2009 | |||||||||||
REVENUES: |
|||||||||||||
Products |
$ | 63,197 | 74.4 | % | $ | 45,196 | 65.1 | % | |||||
Support and services |
10,479 | 12.3 | 5,866 | 8.4 | |||||||||
Ratable products and services |
11,328 | 13.3 | 18,432 | 26.5 | |||||||||
Total revenues |
85,004 | 100.0 | 69,494 | 100.0 | |||||||||
COSTS OF REVENUES: |
|||||||||||||
Products |
22,060 | 25.9 | 17,332 | 24.9 | |||||||||
Support and services |
2,297 | 2.7 | 876 | 1.3 | |||||||||
Ratable products and services |
6,021 | 7.1 | 9,571 | 13.8 | |||||||||
Total costs of revenues* |
30,378 | 35.7 | 27,779 | 40.0 | |||||||||
Gross margin |
54,626 | 64.3 | 41,715 | 60.0 | |||||||||
OPERATING EXPENSES: |
|||||||||||||
Research and development* |
12,399 | 14.6 | 10,018 | 14.4 | |||||||||
Sales and marketing* |
33,483 | 39.4 | 25,762 | 37.1 | |||||||||
General and administrative* |
10,462 | 12.3 | 6,858 | 9.9 | |||||||||
Total operating expenses |
56,344 | 66.3 | 42,638 | 61.4 | |||||||||
Loss from operations |
(1,718 | ) | (2.0 | ) | (923 | ) | (1.3 | ) | |||||
Interest expense, net |
(813 | ) | (1.0 | ) | (1,825 | ) | (2.6 | ) | |||||
Other expense, net |
(33,821 | ) | (39.8 | ) | (14,447 | ) | (20.8 | ) | |||||
Loss before provision for income taxes |
(36,352 | ) | (42.8 | ) | (17,195 | ) | (24.7 | ) | |||||
Provision for income taxes |
254 | 0.3 | 191 | 0.3 | |||||||||
Net loss |
$ | (36,606 | ) | (43.1 | )% | $ | (17,386 | ) | (25.0 | )% | |||
- *
- The following table sets forth the stock-based compensation expense included in the Consolidated Statements of Operations for the periods presented (in thousands):
| |
Years Ended December 31, |
||||||
|---|---|---|---|---|---|---|---|
| |
2010 | 2009 | |||||
Costs of revenues |
$ | 197 | $ | 71 | |||
Research and development |
767 | 187 | |||||
Sales and marketing |
985 | 312 | |||||
General and administrative |
1,896 | 297 | |||||
Revenues
Our total revenues increased by $15.5 million, or 22.3%, to $85.0 million in 2010, from $69.5 million in 2009. Our products and support and services revenues, or total revenues excluding ratable revenues, increased by $22.6 million, or 44.3%, to $73.7 million in 2010, from $51.1 million in 2009. This increase was primarily the result of increased demand for our products, driven in part by improved economic conditions, particularly in the EMEA and the Americas regions.
62
Products revenues increased by $18.0 million, or 39.8%, to $63.2 million in 2010, from $45.2 million in 2009. The increase was primarily a result of an increase in unit shipments particularly in the EMEA and the Americas regions in 2010.
Support and services revenues increased by $4.6 million, or 78.6%, to $10.5 million in 2010, from $5.9 million in 2009. The increase in support and services revenues is a result of increased product sales resulting in first-year support sales, and the renewal of support contracts by existing customers. As our customer base grows over time, we expect our support revenues will continue to increase.
Ratable products and services revenues decreased by $7.1 million, or 38.5%, to $11.3 million in 2010, from $18.4 million in 2009. This ratable revenue is being amortized from transactions initiated prior to 2009 and is expected to continue to decline over time as the related deferred revenue balance is depleted.
Costs of Revenue and Gross Margin
Total costs of revenues increased by $2.6 million, or 9.4%, to $30.4 million in 2010, from $27.8 million in 2009. Overall gross margins improved to 64.3% in 2010 from 60.0% in 2009. The combination of support and services and ratable revenue margins improved to 61.9% in 2010 from 57.0% in 2009. Our product gross margins increased to 65.1% in 2010 from 61.7% in 2009. This increase in the product gross margin was primarily the result of a favorable product mix and economies of scale as we grew our revenues.
Operating Expenses
Our operating expenses increased by $13.7 million, or 32.1%, to $56.3 million in 2010, from $42.6 million in 2009, and increased as a percentage of revenue from 61.4% in 2009 to 66.3% in 2010. This increase was primarily due to an increase of $7.8 million in personnel costs related to the increased headcount and an increase of $3.0 million in stock-based compensation expense in 2010 compared to the prior year.
Research and Development Expenses
Research and development expenses increased by $2.4 million, or 23.8%, to $12.4 million in 2010, from $10.0 million in 2009. This increase is primarily the result of an increase of $1.4 million in research and development personnel costs, $0.6 million in stock-based compensation expense and $0.5 million in project costs to support continued enhancements to our existing products and the development of new products.
Sales and Marketing Expenses
Sales and marketing expenses increased by $7.7 million, or 30.0%, to $33.5 million in 2010, from $25.8 million in 2009. This increase is primarily the result of an increase of $5.2 million in sales and marketing personnel costs, $0.7 million in stock-based compensation expense, $0.6 million in sales and marketing program expenses and $0.5 million in travel expenses.
General and Administrative Expenses
General and administrative expenses increased by $3.6 million, or 52.6%, to $10.5 million in 2010, from $6.9 million in 2009. This increase is primarily the result of an increase of $1.2 million in general and administrative personnel costs associated with operating as a publicly traded company and $1.6 million in stock-based compensation expense. We have incurred additional accounting and legal costs related to compliance with rules and regulations enacted by the SEC, including the additional
63
costs of beginning work toward compliance with Section 404 of the Sarbanes-Oxley Act, as well as additional insurance, investor relations and other costs associated with being a public company.
Interest Expense, net
Interest expense, net decreased by $1.0 million, or 55.5%, to $0.8 million in 2010, from $1.8 million in 2009. This decrease is primarily due to the decrease in the principal balances on our outstanding long-term debt and the conversion of our convertible promissory notes in March 2009.
Other Expense, net
Other expense, net increased by $19.4 million to $33.8 million in 2010, from $14.4 million in 2009. This increase is primarily due to the increase in the fair value of our warrants to purchase convertible preferred stock and common stock and the related adjustment to the warrant liability in 2010. Upon the closing of our initial public offering on April 6, 2010, we remeasured the warrants and reclassified the related fair value to additional paid-in capital. Accordingly, we no longer recognize gains and losses as a result of changes in the fair value of these warrants.
Liquidity and Capital Resources
Since inception, we have funded our operations primarily with proceeds from issuances of convertible preferred stock, common stock, long-term debt and a credit facility. From 2007 through 2009, we raised an aggregate of $62.3 million from the sale of our convertible preferred stock, including amounts received through the conversion of promissory notes. We have also funded purchases of equipment and other general corporate services with proceeds from our long-term debt in the amount of $16.5 million. In 2010, we received $57.1 million from our initial public offering, representing the net proceeds of the offering after deducting underwriters' commissions and discounts and other issuance costs. In 2011, we paid off our long-term debt and, as of December 31, 2011, we had no outstanding long-term debt. We have a working capital line of credit bearing interest at the lenders' prime rate. As of December 31, 2011, the total amount outstanding under the line of credit was zero and we had unused amounts under the line of credit of up to $7.0 million based on a percentage of eligible accounts receivable. Our line of credit agreement contains certain affirmative and negative covenants, including restrictions with respect to payment of cash dividends, merger or consolidation, changes in the nature of our business, disposal of assets and obtaining additional loans. As of December 31, 2011, we were in compliance with our debt covenants. Our line of credit agreement is collateralized by all of our assets. In the event we fail to comply with our debt covenants, any amounts outstanding under our line of credit agreement would become due and payable absent a waiver from our lender.
As of December 31, 2011, we had cash and cash equivalents of $35.3 million and short-term investments of $5.0 million, resulting in a combined balance of $40.3 million as compared to a combined cash and cash-equivalents and short-term investments balance of $67.3 million as of December 31, 2010.
Operating Activities
Our primary uses of cash from operating activities have been for personnel-related expenditures, purchases of inventory and costs related to our facilities. We have experienced negative cash flows from operations as we expanded our business. Our cash flows from operating activities will continue to be affected principally by our working capital requirements and the extent to which we increase spending on personnel as our business grows. Our largest source of operating cash flows is cash collections from our customers. Cash used in operating activities was $22.4 million, $2.1 million and $5.7 million in fiscal years 2011, 2010 and 2009, respectively.
64
Cash used in operating activities of $22.4 million in 2011 reflected a net loss of $26.7 million and changes in our net operating assets and liabilities of $2.8 million, partially offset by non-cash charges of $7.1 million, $6.2 million of which relates to stock-based compensation in 2011. The change in our net operating assets and liabilities was comprised of an increase of $4.3 million in accounts receivable, net due to larger than usual concentration of sales in December 2011 and an increase of $1.9 million in inventory that was partially offset by a net increase of $2.9 million in accounts payable and accrued liabilities and a decrease of $1.2 million in deferred inventory costs.
Cash used by operating activities of $2.1 million in 2010 reflected a net loss of $36.6 million, offset by non-cash charges of $38.1 million, $33.6 million of which relates to the increase in the fair value of the common stock underlying our warrants and $3.8 million of which relates to stock-based compensation. Cash from our net operating assets and liabilities decreased by $3.6 million in 2010. A decrease of $8.5 million in deferred revenue, an increase of $2.8 million in accounts receivable and an increase of $1.8 million in inventory was partially offset by a decrease of $4.6 million in deferred inventory costs and an increase of $4.4 million in accrued liabilities.
Cash used in operating activities of $5.7 million in 2009 reflected a net loss of $17.4 million, partially offset by non-cash charges of $14.2 million from charges related to our warrants as a result of the issuance of additional warrants and an increase in the fair value of the common stock underlying these warrants. The increase in our net operating assets and liabilities was primarily a result of a decrease of $15.1 million in deferred revenue partially offset by a decrease of $8.0 million in deferred inventory costs as we established VSOE for support services for all customers on January 1, 2009.
Investing Activities
Our investing activities have consisted of our short-term investments, our Identity Networks acquisition, investment in non-marketable securities, and capital expenditures in 2011. The purchase of $10.0 million of short-term investments was offset by the maturity of $10.0 million of short-term investments. We used $1.4 million for capital expenditures. In addition, we acquired Identity Networks for a purchase price of $2.5 million, of which $2.2 million was paid in 2011 and the remaining $0.3 million is expected to be paid in 2012. Further, we invested $1.3 million in a non-public company.
The cash used in investing activities of $5.7 million in 2010 reflected a purchase of $5.0 million of short-term investments and $0.7 million of capital expenditures. In 2009, cash used in investing activities was $0.2 million as a result of our capital expenditures.
Financing Activities
To date, we have financed our operations primarily with proceeds from the sale of our common stock in our initial public offering, issuance of common stock in conjunction with the exercises of the Company's stock options, the sale of convertible preferred stock, the incurrence of long-term debt and the use of a line of credit facility. In 2011, we paid off our long-term debt and, as of December 31, 2011, we had no outstanding long-term debt.
Cash provided by financing activities was $381,000 in 2011 primarily as a result of the proceeds from the exercise of stock options and the purchases under the employee stock purchase plan in the amount of $3.2 million offset by the principal payments on our long-term debt of $2.9 million.
Cash provided by financing activities was $48.8 million in 2010 primarily as a result of the net proceeds from our initial public offering in the amount of $57.1 million and proceeds from the exercise of warrants on convertible preferred stock, from employee stock purchase plan and from the exercise of stock options in the amount of $3.3 million, partially offset by net payments on our long-term debt of $11.6 million.
65
Cash provided by financing activities was $22.0 million in 2009 primarily as a result of the receipt of $23.8 million from our sale of Series E convertible preferred stock, including the conversion of convertible promissory notes in 2009, and a net increase of $3.2 million in borrowings on our line of credit facility, partially offset by principal repayments on our long-term debt of $5.2 million.
Capital Resources
We believe our existing cash and cash equivalents and short-term investments combined with up to $7.0 million available under our line of credit facility, will be sufficient to meet our working capital and capital expenditure needs for at least the next 12 months. Our future capital requirements may vary materially from those currently planned and will depend on many factors, including, among other things, market acceptance of our products, the cost of our research and development activities and overall economic conditions.
If our cash sources are insufficient to satisfy our cash requirements, we may be required to sell convertible debt or equity securities to raise additional capital or to borrow or increase the amount available to us for borrowing under our credit facility. We may be unable to raise additional capital through the sale of securities, or to do so on terms that are favorable to us, particularly if capital market and overall economic conditions change adversely. Any sale of convertible debt securities or additional equity securities could result in substantial dilution to our stockholders. Additionally, we may be unable to borrow under or increase the size of our credit facility, or to do so on terms that are acceptable to us, particularly if credit market conditions change adversely.
Contractual Obligations
The following summarizes our contractual obligations as of December 31, 2011:
| |
Payments Due by Period | ||||||||||||
|---|---|---|---|---|---|---|---|---|---|---|---|---|---|
Contractual Obligations:
|
Less Than 1 Year |
1 to 3 Years |
3 to 5 Years |
Total | |||||||||
| |
(in thousands) |
||||||||||||
Operating lease obligations |
$ | 1,320 | $ | 2,209 | $ | 132 | $ | 3,661 | |||||
Purchase commitments |
10,355 | — | — | 10,355 | |||||||||
Total |
$ | 11,675 | $ | 2,209 | $ | 132 | $ | 14,016 | |||||
Off-Balance Sheet Arrangements
As of December 31, 2011, we did not have any off balance sheet arrangements as defined in Item 303(a)(4) of the SEC's Regulation S-K.
Debt and Interest
We paid off our long-term debt in 2011. As of December 31, 2010, the principal amount of our long-term debt outstanding, including our line of credit facility, was $2.8 million.
Recent Accounting Pronouncements
In September 2011, the Financial Accounting Standards Board, or FASB, issued an update to existing guidance on the assessment of goodwill impairment. This amendment is intended to reduce the cost and complexity of the annual goodwill impairment test by providing entities an option to perform a qualitative assessment to determine whether further impairment testing is necessary. If an entity concludes that it is more-likely-than-not that the fair value of a reporting unit is less than its carrying amount, two-step goodwill impairment test is required. Otherwise, the two-step goodwill impairment test is not required. This standard is effective for reporting periods beginning on or after December 15,
66
2011 and early adoption is permitted if an entity's financial statements for the most recent annual or interim period have not yet been issued. We will adopt this standard in the first quarter of 2012 and do not expect the adoption to have a material impact on our consolidated financial position, results of operations or cash flows.
In June 2011, the FASB issued a new accounting standard to improve the comparability and transparency of financial reporting and to increase the prominence of items reported in other comprehensive income. The new standard requires companies to present the components of net income and other comprehensive income either as one continuous statement or as two separate but consecutive statements. It eliminates the option to report other comprehensive income and its components as part of the statement of changes in shareholders' equity. This standard is effective for fiscal years, and interim periods within those years, beginning after December 15, 2011. Early adoption is permitted, and full retrospective application is required. We will adopt this standard in the first quarter of 2012 and do not expect the adoption to have a material impact on our consolidated financial position, results of operations or cash flows.
In May 2011, the FASB issued a revised accounting standard. This amendment provides a consistent definition of fair value and ensures that the fair value measurement and disclosure requirements are similar between Generally Accepted Accounting Principles and International Financial Reporting Standards. The amendment clarifies the application of existing fair value measurements and disclosures, and changes certain principles or requirements for fair value measurements and disclosures. The amendment changes certain fair value measurement principles and enhances the disclosure requirements particularly for level 3 fair value measurements. The standard is effective for reporting periods beginning on or after December 15, 2011 and should be applied prospectively. We will adopt this standard in the first quarter of 2012 and do not expect the adoption to have a material impact on our consolidated financial position, results of operations or cash flows.
ITEM 7A. QUANTITATIVE AND QUALITATIVE DISCLOSURES ABOUT MARKET RISK
Market Risk
Market risk represents the risk of loss that may impact our financial position due to adverse changes in financial market prices and rates. Our market risk exposure is primarily a result of fluctuations in foreign currency exchange rates and interest rates. We do not hold financial instruments for trading purposes.
Foreign Currency Risk
Most of our sales are denominated in U.S. dollars, and therefore, our revenues are not currently subject to significant foreign currency risk. Our operating expenses are denominated in the currencies of the countries in which our operations are located, and may be subject to fluctuations due to changes in foreign currency exchange rates, particularly changes in the Indian rupee, Euro, British pound sterling and Japanese yen relative to the U.S. dollar. To date, we have not entered into any hedging contracts. During 2011, a 10% appreciation or depreciation in the value of the U.S. dollar relative to the other currencies in which our expenses are denominated would not have had a material impact on our earnings, fair values, or cash flows.
Interest Rate Sensitivity
We had cash, cash equivalents and short-term investments of $40.3 million and $67.3 million as of December 31, 2011 and 2010. These amounts were held primarily in cash deposits, money market funds and U.S. government securities. Cash and cash equivalents are held for working capital purposes. We do not use derivative financial instruments to hedge the risk of interest rate volatility. Due to the short-term nature of these instruments, we believe that we do not have any material exposure to
67
changes in the fair value of our investment portfolio as a result of changes in interest rates. Declines in interest rates, however, will reduce future interest income. During 2011, a 10% appreciation or depreciation in overall interest rates would not have had a material impact on our earnings, fair values, or cash flows.
ITEM 8. FINANCIAL STATEMENTS AND SUPPLEMENTARY DATA
Quarterly Results of Operations
The following table sets forth our unaudited quarterly consolidated statements of operations data for each of the four quarters in the years ended December 31, 2011 and 2010. In management's opinion, the data below has been prepared on the same basis as the audited consolidated financial statements included elsewhere in this Form 10-K, and reflects all necessary adjustments, consisting only of normal recurring adjustments, necessary for a fair statement of this data. The results of historical periods are not necessarily indicative of the results of operations for a full year or any future period.
| |
Quarters Ended | ||||||||||||
|---|---|---|---|---|---|---|---|---|---|---|---|---|---|
Fiscal Year 2011
|
December 31, 2011 |
September, 30 2011 |
June, 30 2011 |
March 31, 2011 |
|||||||||
| |
Unaudited |
||||||||||||
| |
(in thousands, except share and per share data) |
||||||||||||
Net revenues |
$ | 23,333 | $ | 23,758 | $ | 23,229 | $ | 20,151 | |||||
Gross margin |
$ | 15,043 | $ | 14,995 | $ | 14,883 | $ | 12,691 | |||||
Loss before income taxes |
$ | (8,031 | ) | $ | (5,274 | ) | $ | (9,680 | ) | $ | (3,298 | ) | |
Net loss |
$ | (8,181 | ) | $ | (5,372 | ) | $ | (9,766 | ) | $ | (3,375 | ) | |
Net loss per share of common stock: |
|||||||||||||
Basic and diluted |
$ | (0.46 | ) | $ | (0.31 | ) | $ | (0.56 | ) | $ | (0.20 | ) | |
Shares used in per share calculations: |
|||||||||||||
Basic and diluted |
17,616,664 | 17,519,217 | 17,393,322 | 16,972,165 | |||||||||
| |
Quarters Ended | ||||||||||||
|---|---|---|---|---|---|---|---|---|---|---|---|---|---|
Fiscal Year 2010
|
December 31, 2010 |
September, 30 2010 |
June, 30 2010 |
March 31, 2010 |
|||||||||
| |
Unaudited |
||||||||||||
| |
(in thousands, except share and per share data) |
||||||||||||
Net revenues |
$ | 22,646 | $ | 21,837 | $ | 20,902 | $ | 19,619 | |||||
Gross margin |
$ | 14,690 | $ | 14,039 | $ | 13,512 | $ | 12,385 | |||||
Income (loss) before income taxes |
$ | (836 | ) | $ | (709 | ) | $ | 958 | $ | (35,765 | ) | ||
Net income (loss) |
$ | (895 | ) | $ | (797 | ) | $ | 901 | $ | (35,815 | ) | ||
Net income (loss) per share of common stock: |
|||||||||||||
Basic |
$ | (0.06 | ) | $ | (0.05 | ) | $ | 0.06 | $ | (74.19 | ) | ||
Diluted |
$ | (0.06 | ) | $ | (0.05 | ) | $ | 0.05 | $ | (74.19 | ) | ||
Shares used in per share calculations: |
|||||||||||||
Basic |
16,094,659 | 15,916,524 | 15,219,636 | 482,778 | |||||||||
Diluted |
16,094,659 | 15,916,524 | 18,196,368 | 482,778 | |||||||||
During the quarter ended June 30, 2011, we entered into a Patent Cross License Agreement with Motorola and agreed to pay Motorola $7.3 million. Since we will not receive any future benefits from this agreement, we expensed the entire $7.3 million in the quarter ended June 30, 2011.
Our operating results may fluctuate due to a variety of factors, many of which are outside our control. As a result, comparing our operating results on a period-to-period basis may not be meaningful. You should not rely on our past results as an indication of our future performance.
68
Index to Consolidated Financial Statements
69
REPORT OF INDEPENDENT REGISTERED PUBLIC ACCOUNTING FIRM
To
the Board of Directors and Stockholders
of Meru Networks, Inc.
We have audited the accompanying consolidated balance sheets of Meru Networks, Inc. and its subsidiaries (the "Company") as of December 31, 2011 and 2010, and the related consolidated statements of operations, convertible preferred stock and of stockholders' equity (deficit), and cash flows for each of the three years in the period ended December 31, 2011. Our audits also included the financial statement schedule listed in Item 15(a)(2). These consolidated financial statements and the financial statement schedule are the responsibility of the Company's management. Our responsibility is to express an opinion on these consolidated financial statements and financial statement schedule based on our audits.
We conducted our audits in accordance with the standards of the Public Company Accounting Oversight Board (United States). Those standards require that we plan and perform the audit to obtain reasonable assurance about whether the financial statements are free of material misstatement. An audit includes examining, on a test basis, evidence supporting the amounts and disclosures in the consolidated financial statements. An audit also includes assessing the accounting principles used and significant estimates made by management, as well as evaluating the overall financial statement presentation. We believe that our audits provide a reasonable basis for our opinion.
In our opinion, the consolidated financial statements referred to above present fairly, in all material respects, the financial position of Meru Networks, Inc. and its subsidiaries as of December 31, 2011 and 2010, and the results of their operations and their cash flows for each of the three years in the period ended December 31, 2011 in conformity with accounting principles generally accepted in the United States of America. Also, in our opinion, the related financial statement schedule, when considered in relation to the consolidated financial statements taken as a whole, presents fairly, in all material respects, the information set forth therein.
We also have audited, in accordance with the standards of the Public Company Accounting Oversight Board (United States), the Company's internal control over financial reporting as of December 31, 2011, based on criteria established in Internal Control—Integrated Framework issued by the Committee of Sponsoring Organizations of the Treadway Commission, and our report dated March 15, 2012 expressed an unqualified opinion thereon.
/s/ Burr Pilger Mayer, Inc.
San
Jose, California
March 15, 2012
70
MERU NETWORKS, INC.
Consolidated Balance Sheets
(in thousands, except for share and per share amounts)
| |
December 31, 2011 |
December 31, 2010 |
|||||
|---|---|---|---|---|---|---|---|
ASSETS |
|||||||
CURRENT ASSETS: |
|||||||
Cash and cash equivalents |
$ | 35,259 | $ | 62,270 | |||
Short-term investments |
5,000 | 4,999 | |||||
Accounts receivable, net of allowance for doubtful accounts of $134 and $366 as of December 31, 2011 and 2010 |
13,038 | 8,796 | |||||
Inventory |
6,548 | 4,636 | |||||
Deferred inventory costs, current portion |
86 | 1,273 | |||||
Prepaid expenses and other current assets |
912 | 1,195 | |||||
Total current assets |
60,843 | 83,169 | |||||
Property and equipment, net |
1,476 | 763 | |||||
Goodwill |
1,658 | — | |||||
Intangible assets, net |
693 | — | |||||
Deferred inventory costs, net of current portion |
26 | 77 | |||||
Other assets |
2,147 | 359 | |||||
TOTAL ASSETS |
$ | 66,843 | $ | 84,368 | |||
LIABILITIES AND STOCKHOLDERS' EQUITY |
|||||||
CURRENT LIABILITIES: |
|||||||
Accounts payable |
$ | 5,733 | $ | 4,302 | |||
Accrued liabilities |
12,394 | 10,694 | |||||
Long-term debt, current portion |
— | 2,808 | |||||
Deferred revenue, current portion |
11,764 | 12,723 | |||||
Total current liabilities |
29,891 | 30,527 | |||||
Deferred revenue, net of current portion |
4,481 | 3,923 | |||||
Total liabilities |
34,372 | 34,450 | |||||
Commitments and contingencies (Note 12) |
|||||||
STOCKHOLDERS' EQUITY: |
|||||||
Preferred stock, $0.0005 par value—5,000,000 authorized as of of December 31, 2011 and December 31, 2010; no shares issued and outstanding as of December 31, 2011 and December 31, 2010 |
— | — | |||||
Common stock, $0.0005 par value—150,000,000 shares authorized as of December 31, 2011 and December 31, 2010; 17,674,552 and 16,337,804 shares issued and outstanding as of December 31, 2011 and December 31, 2010 |
9 | 8 | |||||
Additional paid-in capital |
254,576 | 245,160 | |||||
Accumulated other comprehensive loss |
(197 | ) | (27 | ) | |||
Accumulated deficit |
(221,917 | ) | (195,223 | ) | |||
Total stockholders' equity |
32,471 | 49,918 | |||||
TOTAL LIABILITIES AND STOCKHOLDERS' EQUITY |
$ | 66,843 | $ | 84,368 | |||
See notes to consolidated financial statements.
71
MERU NETWORKS, INC.
Consolidated Statement of Operations
(in thousands, except for share and per share amounts)
| |
For the Years Ended December 31, | |||||||||
|---|---|---|---|---|---|---|---|---|---|---|
| |
2011 | 2010 | 2009 | |||||||
REVENUES: |
||||||||||
Products |
$ | 74,279 | $ | 63,197 | $ | 45,196 | ||||
Support and services |
12,957 | 10,479 | 5,866 | |||||||
Ratable products and services |
3,235 | 11,328 | 18,432 | |||||||
Total revenues |
90,471 | 85,004 | 69,494 | |||||||
COSTS OF REVENUES: |
||||||||||
Products |
26,415 | 22,060 | 17,332 | |||||||
Support and services |
4,581 | 2,297 | 876 | |||||||
Ratable products and services |
1,863 | 6,021 | 9,571 | |||||||
Total costs of revenues* |
32,859 | 30,378 | 27,779 | |||||||
Gross margin |
57,612 | 54,626 | 41,715 | |||||||
OPERATING EXPENSES: |
||||||||||
Research and development* |
13,966 | 12,399 | 10,018 | |||||||
Sales and marketing* |
47,688 | 33,483 | 25,762 | |||||||
General and administrative* |
14,779 | 10,462 | 6,858 | |||||||
Litigation reserve |
7,250 | — | — | |||||||
Total operating expenses |
83,683 | 56,344 | 42,638 | |||||||
Loss from operations |
(26,071 | ) | (1,718 | ) | (923 | ) | ||||
Interest expense, net |
(253 | ) | (813 | ) | (1,825 | ) | ||||
Other income (expense), net |
41 | (33,821 | ) | (14,447 | ) | |||||
Loss before provision for income taxes |
(26,283 | ) | (36,352 | ) | (17,195 | ) | ||||
Provision for income taxes |
411 | 254 | 191 | |||||||
Net loss |
(26,694 | ) | (36,606 | ) | (17,386 | ) | ||||
Accretion on convertible preferred stock |
— | — | 221 | |||||||
Net loss attributable to common stockholders |
$ | (26,694 | ) | $ | (36,606 | ) | $ | (17,165 | ) | |
Net loss per share of common stock: |
||||||||||
Basic and diluted |
$ | (1.54 | ) | $ | (3.06 | ) | $ | (45.15 | ) | |
Shares used in computing net loss per share of common stock: |
||||||||||
Basic and diluted |
17,377,503 | 11,981,170 | 380,179 | |||||||
- *
- Includes stock-based compensation expense as follows:
| |
Years Ended December 31, | |||||||||
|---|---|---|---|---|---|---|---|---|---|---|
| |
2011 | 2010 | 2009 | |||||||
Costs of revenues |
$ | 346 | $ | 197 | $ | 71 | ||||
Research and development |
1,131 | 767 | 187 | |||||||
Sales and marketing |
2,217 | 985 | 312 | |||||||
General and administrative |
2,480 | 1,896 | 297 | |||||||
See notes to consolidated financial statements.
72
MERU NETWORKS, INC.
Consolidated Statements of Convertible Preferred Stock and of Stockholders' Equity (Deficit)
(in thousands, except for share amounts)
| |
Convertible Preferred Stock |
|
|
|
|
|
|
||||||||||||||||||
|---|---|---|---|---|---|---|---|---|---|---|---|---|---|---|---|---|---|---|---|---|---|---|---|---|---|
| |
Common Stock | |
Accumulated Other Comprehensive Loss |
|
Total Stockholders' Equity (Deficit) |
||||||||||||||||||||
| |
Additional Paid-in Capital |
Accumulated Deficit |
|||||||||||||||||||||||
| |
Shares | Amount | Shares | Amount | |||||||||||||||||||||
BALANCE—January 1, 2009 |
57,935,414 | $ | 94,157 | 371,806 | $ | 1 | $ | 2,169 | $ | (77 | ) | $ | (141,452 | ) | $ | (139,359 | ) | ||||||||
Sale of Series E convertible preferred stock (net of issuance costs of $1,227) |
52,001,974 | 31,249 | — | — | — | — | — | — | |||||||||||||||||
Issuance of Series E upon settlement of litigation |
95,400 | 70 | — | — | — | — | — | — | |||||||||||||||||
Accretion of stock issuance costs |
— | (221 | ) | — | — | — | — | 221 | 221 | ||||||||||||||||
Issuance of common stock upon exercise of vested stock options and vesting of stock options exercised early |
— | — | 42,312 | — | 175 | — | — | 175 | |||||||||||||||||
Stock-based compensation |
— | — | — | — | 867 | — | — | 867 | |||||||||||||||||
Comprehensive loss: |
|||||||||||||||||||||||||
Foreign currency translation adjustment |
— | — | — | — | — | 34 | — | 34 | |||||||||||||||||
Net loss |
— | — | — | — | — | — | (17,386 | ) | (17,386 | ) | |||||||||||||||
Total comprehensive loss |
(17,352 | ) | |||||||||||||||||||||||
BALANCE—December 31, 2009 |
110,032,788 | 125,255 | 414,118 | 1 | 3,211 | (43 | ) | (158,617 | ) | (155,448 | ) | ||||||||||||||
Exercise of Series E warrants into convertible preferred stock |
3,084,368 | 5,001 | — | — | — | — | — | — | |||||||||||||||||
Proceeds from initial public offering, net of issuance costs of $6,436 |
— | — | 4,233,017 | 2 | 57,057 | — | — | 57,059 | |||||||||||||||||
Conversion of convertible preferred stock into common stock in connection with initial public offering |
(113,117,156 | ) | (130,256 | ) | 11,185,891 | 5 | 130,251 | — | — | 130,256 | |||||||||||||||
Reclassification of warrant liability to additional paid-in capital upon initial public offering |
— | — | — | — | 48,274 | — | — | 48,274 | |||||||||||||||||
Issuance of common stock upon cashless exercises of warrants |
— | — | 60,421 | — | — | — | — | — | |||||||||||||||||
Issuance of common stock under the employee stock purchase plan |
— | — | 93,307 | 1,100 | — | — | 1,100 | ||||||||||||||||||
Issuance of common stock upon exercise of vested stock options and vesting of restricted stock |
— | — | 351,050 | — | 1,422 | — | — | 1,422 | |||||||||||||||||
Stock-based compensation |
— | — | — | — | 3,845 | — | — | 3,845 | |||||||||||||||||
Comprehensive loss: |
|||||||||||||||||||||||||
Foreign currency translation adjustment |
— | — | — | — | — | 15 | — | 15 | |||||||||||||||||
Unrealized gain on short-term investments |
— | — | — | — | — | 1 | — | 1 | |||||||||||||||||
Net loss |
— | — | — | — | — | — | (36,606 | ) | (36,606 | ) | |||||||||||||||
Total comprehensive loss |
(36,590 | ) | |||||||||||||||||||||||
BALANCE—December 31, 2010 |
— | — | 16,337,804 | 8 | 245,160 | (27 | ) | (195,223 | ) | 49,918 | |||||||||||||||
Issuance of common stock upon cashless exercises of warrants |
— | — | 574,645 | — | — | — | — | — | |||||||||||||||||
Issuance of common stock under the employee stock purchase plan |
— | — | 178,150 | — | 1,306 | — | — | 1,306 | |||||||||||||||||
Issuance of common stock upon exercise of vested stock options and vesting of restricted stock, net of shares withheld for employee taxes |
— | — | 583,953 | 1 | 1,936 | — | — | 1,937 | |||||||||||||||||
Stock-based compensation |
— | — | — | — | 6,174 | — | — | 6,174 | |||||||||||||||||
Comprehensive loss: |
|||||||||||||||||||||||||
Foreign currency translation adjustment |
— | — | — | — | — | (170 | ) | — | (170 | ) | |||||||||||||||
Net loss |
— | — | — | — | — | — | (26,694 | ) | (26,694 | ) | |||||||||||||||
Total comprehensive loss |
(26,864 | ) | |||||||||||||||||||||||
BALANCE—December 31, 2011 |
— | $ | — | 17,674,552 | $ | 9 | $ | 254,576 | $ | (197 | ) | $ | (221,917 | ) | $ | 32,471 | |||||||||
See notes to consolidated financial statements.
73
MERU NETWORKS, INC.
Consolidated Statements of Cash Flows
(in thousands)
| |
Years Ended December 31, | |||||||||
|---|---|---|---|---|---|---|---|---|---|---|
| |
2011 | 2010 | 2009 | |||||||
CASH FLOWS FROM OPERATING ACTIVITIES: |
||||||||||
Net loss: |
$ | (26,694 | ) | $ | (36,606 | ) | $ | (17,386 | ) | |
Adjustments to reconcile net loss to net cash used in operating activities: |
||||||||||
Depreciation and amortization |
724 | 615 | 551 | |||||||
Stock-based compensation |
6,174 | 3,845 | 867 | |||||||
Adjustment of fair value of warrant liability |
— | 33,620 | 14,230 | |||||||
Accrued interest on convertible promissory notes |
— | — | 201 | |||||||
Amortization of debt issuance costs |
44 | 107 | 134 | |||||||
Provision for (recovery of) bad debt |
143 | (61 | ) | 80 | ||||||
Changes in operating assets and liabilities: |
||||||||||
Accounts receivable, net |
(4,292 | ) | (2,768 | ) | 69 | |||||
Inventory |
(1,912 | ) | (1,803 | ) | 749 | |||||
Deferred inventory costs |
1,238 | 4,616 | 8,040 | |||||||
Prepaid expenses and other assets |
(325 | ) | (560 | ) | (775 | ) | ||||
Accounts payable |
1,431 | 992 | 1,160 | |||||||
Accrued liabilities |
1,483 | 4,350 | 1,522 | |||||||
Deferred revenue |
(416 | ) | (8,466 | ) | (15,125 | ) | ||||
Net cash used in operating activities |
(22,402 | ) | (2,119 | ) | (5,683 | ) | ||||
CASH FLOWS FROM INVESTING ACTIVITIES: |
||||||||||
Purchase of property and equipment |
(1,360 | ) | (680 | ) | (203 | ) | ||||
Purchase of short-term investments |
(9,996 | ) | (4,998 | ) | — | |||||
Proceeds from maturities of short-term investments |
10,000 | — | — | |||||||
Investment in non-marketable securities |
(1,250 | ) | — | — | ||||||
Net cash paid in purchase of business |
(2,217 | ) | — | — | ||||||
Net cash used in investing activities |
(4,823 | ) | (5,678 | ) | (203 | ) | ||||
CASH FLOWS FROM FINANCING ACTIVITIES: |
||||||||||
Proceeds from initial public offering, net |
— | 57,059 | — | |||||||
Repurchase of shares of unvested common stock |
— | — | — | |||||||
Proceeds from exercise of stock options |
1,927 | 1,439 | 161 | |||||||
Proceeds from employee stock purchase plan |
1,306 | 1,100 | — | |||||||
Proceeds from exercise of convertible preferred stock warrants |
— | 716 | — | |||||||
Proceeds from issuance of convertible preferred stock and warrants, net of issuance costs |
— | — | 20,632 | |||||||
Proceeds from issuance of convertible promissory notes |
— | — | 3,170 | |||||||
Proceeds from long-term debt |
— | 4,986 | 23,016 | |||||||
Repayment of long-term debt |
(2,852 | ) | (16,540 | ) | (24,996 | ) | ||||
Net cash provided by financing activities |
381 | 48,760 | 21,983 | |||||||
Effect of exchange rate changes on cash and cash equivalents |
(167 | ) | 24 | 14 | ||||||
NET (DECREASE) INCREASE IN CASH AND CASH EQUIVALENTS |
(27,011 | ) | 40,987 | 16,111 | ||||||
CASH AND CASH EQUIVALENTS—Beginning of year |
62,270 | 21,283 | 5,172 | |||||||
CASH AND CASH EQUIVALENTS—End of year |
$ | 35,259 | $ | 62,270 | $ | 21,283 | ||||
SUPPLEMENTAL DISCLOSURES OF CASH FLOW INFORMATION: |
||||||||||
Cash paid for interest |
$ | 65 | $ | 691 | $ | 1,521 | ||||
Cash paid for income taxes |
$ | 179 | $ | 282 | $ | 105 | ||||
NONCASH INVESTING AND FINANCING ACTIVITIES: |
||||||||||
Assets acquired in business combination for future consideration |
$ | 269 | $ | — | $ | — | ||||
Conversion of convertible promissory notes to Series E convertible preferred stock |
$ | — | $ | — | $ | 14,821 | ||||
Conversion of convertible preferred stock to common stock |
$ | — | $ | 130,256 | $ | — | ||||
Reclassification of warrant liability to convertible preferred stock upon exercise of warrants |
$ | — | $ | 4,285 | $ | — | ||||
Reclassification of warrant liability to additional paid-in capital upon closing of initial public offering |
$ | — | $ | 48,274 | $ | — | ||||
See notes to consolidated financial statements.
74
MERU NETWORKS, INC.
NOTES TO CONSOLIDATED FINANCIAL STATEMENTS
1. Business and Summary of Significant Accounting Policies
Business—Meru Networks, Inc. ("Meru") was incorporated in Delaware in January 2002. Meru and its wholly owned subsidiaries (collectively, the "Company") develop and market a virtualized wireless Local Area Network ("LAN") solution. The Company's solution is built around its System Director Operating System which runs on its controllers and access points. The Company offers additional products designed to deliver network management, diagnostics and security. The Company also offers support services related to its products, professional services, and training. Products and services are sold through value added resellers, and distributors, as well as the Company's sales force.
Reverse Stock Split—In March 2010, the Company's board of directors approved a 13-for-1 reverse stock split of the Company's common stock. All common stock data and stock option information in this report have been adjusted to reflect the reverse split. In addition, any reference to the conversion ratios of the Company's Series A-1, B, C, D and E convertible preferred stock reflect the effect of the reverse split.
Initial Public Offering—On March 30, 2010, the Company sold 3,575,000 shares of common stock at a price of $15.00 per share in an initial public offering ("IPO"). The shares began trading on the NASDAQ Global Market on March 31, 2010. Also on March 31, 2010, the Company's underwriters exercised their overallotment option to purchase another 658,017 shares of common stock. As part of the offering, 811,784 shares of common stock, as converted, were also sold by existing shareholders at $15.00 per share. Included in the amounts sold by the existing shareholders were 795,836 shares of common stock which were converted from 8,770,054 shares of convertible preferred stock immediately prior to the IPO. The $59.1 million in proceeds, net of underwriting discount and commission, from the IPO were received on April 6, 2010, which was the closing date of the offering. Upon the closing of the offering, all outstanding shares of convertible preferred stock converted into common stock at each series of convertible preferred stock's respective conversion rate as adjusted for the 13-for-1 reverse stock split and shares of convertible preferred stock are no longer authorized to be issued. The convertible preferred stock converted into 10,390,055 shares of common stock. Concurrently, the Company increased the number of authorized common stock to 150,000,000 shares and authorized 5,000,000 shares of preferred stock, both with a par value of $0.0005 per share.
Basis of Presentation—These consolidated financial statements have been prepared in accordance with accounting principles generally accepted in the United States ("GAAP") and include the accounts of Meru and its wholly owned subsidiaries. The Company has wholly owned subsidiaries in India and Japan. These subsidiaries use their local currency as their functional currency. All intercompany transactions and balances have been eliminated.
Use of Estimates—The preparation of consolidated financial statements in conformity with GAAP requires management to make estimates and assumptions that affect the reported amounts of assets and liabilities at the date of the consolidated financial statements and the reported amounts of revenues and expenses during the reporting period. Such management estimates include implicit service periods for revenue recognition, litigation and settlement costs, other loss contingencies, sales returns and allowances, allowance for doubtful accounts, inventory valuation, reserve for warranty costs, valuation of deferred tax assets, fair value of common stock, stock-based compensation expense, fair value of warrants and fair value of earn-out consideration. The Company bases its estimates on historical experience and also on assumptions that it believes are reasonable. The Company assesses these estimates on a regular basis; however, actual results could materially differ from those estimates.
75
MERU NETWORKS, INC.
NOTES TO CONSOLIDATED FINANCIAL STATEMENTS (Continued)
1. Business and Summary of Significant Accounting Policies (Continued)
Certain Significant Risks and Uncertainties—The Company is subject to certain risks and uncertainties that could have a material and adverse effect on the Company's future financial position or results of operations, which risks and uncertainties include, among others: it expects to incur operating losses throughout 2012 which would result in lower cash balances on hand, any inability of the Company to raise additional funds, it may not be able to find a new Chief Executive Officer and effect a smooth transition, it has a limited operating history, it may experience fluctuations in its revenues and operating results, any inability of the Company to compete in a rapidly evolving market and to respond quickly and effectively to changing market requirements, any inability of the Company to increase market awareness of its brand and products and develop and expand its sales channels, the continued development of demand for wireless networks, its long and unpredictable sales cycle, declining average sales prices for its products, varying gross margins of its products and services, any inability of the Company to forecast customer demand accurately in making purchase decisions, its reliance on channel partners to generate a substantial majority of its revenues and the potential failure of these partners to perform, any inability of the Company to protect its intellectual property rights, claims by others that the Company infringes their proprietary technology, new or modified regulations related to its products, and any inability of the Company to raise additional funds in the future.
Concentration of Supply Risk—The Company relies on third parties to manufacture its products, and depends on them for the supply and quality of its products. Quality or performance failures of the Company's products or changes in its manufacturers' financial or business condition could disrupt the Company's ability to supply quality products to its customers and thereby have a material and adverse effect on its business and operating results. Some of the components and technologies used in the Company's products are purchased and licensed from a single source or a limited number of sources. The loss of any of these suppliers may cause the Company to incur additional transition costs, result in delays in the manufacturing and delivery of its products, or cause it to carry excess or obsolete inventory and could cause it to redesign its products. The Company relies on a third party for the fulfillment of its customer orders, and the failure of this third party to perform could have an adverse effect upon the Company's reputation and its ability to distribute its products, which could adversely affect the Company's business.
Concentration of Credit Risk—Financial instruments that subject the Company to concentrations of credit risk consist primarily of cash, cash equivalents, short-term investments and accounts receivable. The Company maintains its cash, cash equivalents and short-term investments in fixed-income securities with financial institutions and invests in only high-quality credit instruments. Deposits held with banks may exceed the amount of insurance provided on such deposits.
Credit risk with respect to accounts receivable in general is diversified due to the number of different entities comprising the Company's customer base and their location throughout the world. The Company performs ongoing credit evaluations of its customers and generally does not require collateral on accounts receivable. The Company maintains reserves for estimated potential credit losses. As of December 31, 2011 and 2010, one distributor customer accounted for 31% and 32% of the Company's net accounts receivable.
76
MERU NETWORKS, INC.
NOTES TO CONSOLIDATED FINANCIAL STATEMENTS (Continued)
1. Business and Summary of Significant Accounting Policies (Continued)
No end customer accounted for more than 10% of our net revenues in 2011, 2010 or 2009. The Company's channel partners representing greater than 10% of revenues for the periods presented were as follows (in percentages):
| |
Years Ended December 31, |
|||||||||
|---|---|---|---|---|---|---|---|---|---|---|
Major Channel Partners
|
2011 | 2010 | 2009 | |||||||
Westcon Group, Inc. |
29 | 34 | 21 | |||||||
Catalyst Telecom, Inc. |
13 | 12 | 14 | |||||||
Siracom, Inc. |
11 | * | * | |||||||
- *
- Less than 10%
Cash Equivalents and Short-Term Investments—The Company considers all highly liquid investments with a maturity of three months or less when purchased to be cash equivalents. Cash and cash equivalents may consist of cash on hand, balances with banks, and highly liquid investments in money market funds, commercial paper, government securities, certificates of deposit and corporate debt securities. Short-term investments consist of government securities with original maturities beyond 90 days. Short-term investments are carried at fair value based on quoted market prices with unrealized gains and losses included in accumulated other comprehensive loss in stockholders' equity.
Foreign Currency—The Company's non-U.S. subsidiaries in India and Japan use the local currency as their functional currency. The assets and liabilities of the non-U.S. subsidiaries are, therefore, translated into U.S. dollars at exchange rates in effect at the balance sheet date, with the resulting translation adjustments recorded to a separate component of accumulated other comprehensive loss within stockholders' equity. Income and expense accounts are translated at average exchange rates during the year. Transaction gains and losses were not material during the years ended December 31, 2011, 2010 and 2009.
Inventory—Inventory is stated at the lower of cost or market value. Inventory is determined to be salable based on a demand forecast within a specific time horizon, generally one year or less. Inventory in excess of salable amounts and inventory which is considered obsolete based upon changes in existing technology is written off. At the point of loss recognition, a new lower cost basis for that inventory is established and subsequent changes in facts and circumstances do not result in the restoration or increase in that new cost basis.
Channel Inventory—Products shipped to distributors are considered channel inventory until acceptance provisions are met and return rights lapse. The Company includes channel inventory within inventory on the consolidated balance sheets.
Deferred Inventory Costs—Deferred inventory costs represent the unamortized cost of products associated with ratable products and services revenues, which is based upon the actual cost of the hardware sold and is amortized over the economic life of the product.
Advertising Costs—The Company expenses advertising costs as incurred. The Company incurred advertising costs of $28,000, $22,000, and $37,000 during the years ended December 31, 2011, 2010 and
77
MERU NETWORKS, INC.
NOTES TO CONSOLIDATED FINANCIAL STATEMENTS (Continued)
1. Business and Summary of Significant Accounting Policies (Continued)
2009 which is included within sales and marketing expense on the consolidated statements of operations.
Property and Equipment—Property and equipment, including leasehold improvements, is stated at cost less accumulated depreciation and amortization. Depreciation is computed using the straight-line method over the estimated useful lives of the assets, which is generally three to five years. Internal test units are transferred from inventory at the stated cost and are amortized over the estimated service life of one year from the date of transfer. Leasehold improvements are amortized over the shorter of the estimated useful life of the improvements or the lease term.
Accounting for Internal-Use Computer Software—The Company capitalizes certain external and internal costs, including internal payroll costs, incurred in the connection with the development or acquisition of software for internal use. These costs are capitalized when the Company has entered the application development stage and ceases when the software is substantially complete and is ready for its intended use. The Company purchased and capitalized costs of $24,000, $94,000 and $63,000 during the years ended December 31, 2011, 2010 and 2009. Software is amortized using the straight-line method over the estimated useful life of three years.
Revenue Recognition—In October 2009, the Financial Accounting Standards Board ("FASB") amended the accounting standards for revenue recognition to remove tangible products containing software components and non-software components that function together to deliver the product's essential functionality from the scope of industry-specific software revenue recognition guidance. Also in October 2009, the FASB amended the accounting standards for multiple-deliverable arrangements to (i) provide updated guidance on how the elements in a multiple-deliverable arrangement should be separated, and how the consideration should be allocated; (ii) require an entity to allocate revenue amongst the elements in an arrangement using estimated selling prices ("ESP") if a vendor does not have vendor-specific objective evidence ("VSOE") or third-party evidence ("TPE") of the selling price; and (iii) eliminate the use of the residual method and require an entity to allocate revenue using the relative selling price method.
The Company adopted this accounting guidance at the beginning of its first quarter of the year ended December 31, 2011 on a prospective basis for applicable arrangements originating or materially modified after December 31, 2010. The adoption of these two accounting standards resulted in $0.9 million of additional revenue recognized during the year ended December 31, 2011, which would not have been recognized if the previous revenue recognition standards were in effect. The majority of this difference relates to revenue recognized on partial shipment transactions. Under previous accounting guidance, revenue from these orders was deferred in its entirety until the entire order was delivered. The Company cannot reasonably estimate the effect of the adoption on future financial periods as the impact may vary depending on the nature and volume of future sale contracts.
This guidance does not generally change the units of accounting for the Company's revenue transactions. Most non-software products and services qualify as separate units of accounting because they have value to the customer on a stand-alone basis and the Company's revenue arrangements generally do not include a general right of return relative to delivered products.
The Company's revenues are derived primarily from two sources: (i) products revenues, including hardware and software products, and (ii) related support and service revenues. The majority of the Company's products are networking communications hardware with embedded software components
78
MERU NETWORKS, INC.
NOTES TO CONSOLIDATED FINANCIAL STATEMENTS (Continued)
1. Business and Summary of Significant Accounting Policies (Continued)
such that the software functions together with the hardware to provide the essential functionality of the product. Therefore, the Company's hardware deliverables are considered to be non-software elements and are excluded from the scope of industry-specific software revenue recognition guidance. The Company's products revenues also include revenues from the sale of stand-alone software products. Stand-alone software products may operate on the Company's networking communications hardware, but are not considered essential to the functionality of the hardware. Sales of stand-alone software generally include a perpetual license to the Company's software. Sales of stand-alone software continue to be subject to the industry-specific software revenue recognition guidance. Product support typically includes software updates on a when and if available basis, telephone and internet access to the Company's technical support personnel and hardware support. Software updates provide customers with rights to unspecified software product upgrades and to maintenance releases and patches released during the term of the support period.
For all arrangements originating or materially modified after December 31, 2010, the Company recognizes revenue in accordance with the amended accounting guidance. Certain arrangements with multiple-deliverables may continue to have stand-alone software elements that are subject to the existing software revenue recognition guidance along with non-software elements that are subject to the amended revenue accounting guidance. The revenues for these multiple deliverable arrangements are allocated to the stand-alone software elements as a group and the non-software elements based on the relative selling prices of all of the elements in the arrangement using the hierarchy in the amended revenue accounting guidance.
For sales of stand-alone software after December 31, 2010 and for all transactions entered into prior to the year ended December 31, 2011, the Company recognizes revenues based on software revenue recognition guidance. Under the software revenue recognition guidance, the Company uses the residual method to recognize revenues when a product agreement includes one or more elements to be delivered at a future date and VSOE of the fair value of all undelivered elements exists. In the majority of the Company's contracts, the only element that remains undelivered at the time of delivery of the product is support services. Under the residual method, the fair value of the undelivered elements is deferred and the remaining portion of the contract fee is recognized as products revenues. If evidence of the fair value of one or more undelivered elements does not exist, all revenues are generally deferred and recognized when delivery of those elements occurs or when fair value can be established. When the undelivered element for which the Company does not have VSOE of fair value is support, revenues for the entire arrangement are bundled and recognized ratably over the support period.
VSOE for elements of an arrangement is based upon the normal pricing and discounting practices for those services when sold separately. In determining VSOE, the Company requires that a substantial majority of the selling prices for an element falls within a reasonably narrow pricing range, generally evidenced by a substantial majority of such historical stand-alone transactions falling within a reasonably narrow range of the median rates. In addition, the Company considers major service groups, geographies, customer classifications, and other variables in determining VSOE.
TPE is determined based on competitor prices for similar deliverables when sold separately. The Company is typically not able to determine TPE for its products or services. Generally, the Company's go-to-market strategy differs from that of its peers and the Company's offerings contain a significant level of differentiation such that the comparable pricing of products with similar functionality cannot be obtained. Furthermore, the Company is unable to reliably determine what similar competitor products' selling prices are on a stand-alone basis.
79
MERU NETWORKS, INC.
NOTES TO CONSOLIDATED FINANCIAL STATEMENTS (Continued)
1. Business and Summary of Significant Accounting Policies (Continued)
When the Company is unable to establish the selling price of its non-software elements using VSOE or TPE, the Company uses ESP in its allocation of arrangement consideration. The objective of ESP is to determine the price at which the Company would transact a sale if the product or service were sold on a stand-alone basis. The Company determines ESP for a product or service by considering multiple factors including, but not limited to, pricing policies, internal costs, gross margin objectives, competitive landscapes, geographies, customer classes and distribution channels.
The Company regularly reviews VSOE and ESP and maintains internal controls over the establishment and updates of these estimates. There was not a material impact during 2011 nor does the Company currently expect a material impact in the near term from changes in VSOE or ESP.
The Company recognizes revenues when all of the following have occurred: (1) the Company has entered into a legally binding arrangement with a customer; (2) delivery has occurred; (3) customer payment is deemed fixed or determinable and free of contingencies and significant uncertainties; and (4) collection is probable. The sales prices for the Company's products are typically considered to be fixed or determinable at the inception of an arrangement. Delivery is considered to have occurred when product title has transferred to the customer, when the service or training has been provided, when software is delivered, or when the support period has lapsed. To the extent that agreements contain rights of return or acceptance provisions, revenues are deferred until the acceptance provisions or rights of return lapse.
The majority of the Company's sales are generated through its distributors. Revenues from distributors with return rights are recognized when the distributor reports that the product has been sold through, provided that all other revenue recognition criteria have been met. The Company obtains sell-through information from these distributors. For transactions with all other distributors, the Company does not provide for rights of return and recognizes products revenues at the time of shipment, assuming all other revenue recognition criteria have been met.
Prior to April 1, 2008, the Company allowed some customers to receive support services outside of the contractual terms. Accordingly, the Company deferred and recognized revenues on all transactions, except for transactions with one customer, ratably over the economic life of the products sold as the Company determined that this was the best estimate of the period of time over which the Company provided these support services. The one exception relates to a customer for which the Company established VSOE of fair value for the related support contracts during the year ended December 31, 2007. Accordingly, the Company began to account for these support contracts as separate elements from the hardware sales.
The Company estimated the economic life of the hardware to be three and a half years based on several factors such as: (1) the history of technology development of related products; (2) a Company-specific evaluation of product life cycles from both a sales and product development perspective; and (3) information on customer usage of the Company's products.
On April 1, 2008, the Company ceased providing support services outside of the contractual terms. As a result, the Company began recognizing ratable revenues from sales in which VSOE of fair value for the related support services had not been established over the contractual support period and not the three and a half year economic life of the product. Also on April 1, 2008, the Company established VSOE of fair value for its support services to distributors. Accordingly, the Company recognized revenues from sales to distributors after this date and prior to January 1, 2011 using the residual method, assuming all revenue recognition criteria were met.
80
MERU NETWORKS, INC.
NOTES TO CONSOLIDATED FINANCIAL STATEMENTS (Continued)
1. Business and Summary of Significant Accounting Policies (Continued)
On January 1, 2009, the Company established VSOE of fair value for all its remaining support services. Accordingly, the Company recognized revenues for other than support services for all sales made on and after January 1, 2009 and prior to January 1, 2011 using the residual method, assuming all revenue recognition criteria were met.
Revenues for support services are recognized on a straight-line basis over the support period, which typically ranges from one year to five years.
Shipping charges billed to customers are included in products revenues and the related shipping costs are included in costs of products revenues.
Impairment of Long-Lived Assets—The Company evaluates its long-lived assets for indicators of possible impairment when events or changes in circumstances indicate the carrying amount of an asset may not be recoverable. Impairment exists if the carrying amounts of such assets exceed the estimates of future net undiscounted cash flows expected to be generated by such assets. Should impairment exist, the impairment loss would be measured based on the excess carrying value of the asset over the asset's estimated fair value. As of December 31, 2011, the Company has not written down any of its long-lived assets as a result of impairment.
Goodwill—Goodwill represents the excess of the purchase price over the fair value of the net tangible and identifiable intangible assets acquired in a business combination. The Company reviews goodwill for impairment on an annual basis or whenever events or changes in circumstances indicate the carrying value may not be recoverable. The Company uses a two-step impairment test. In the first step, the Company compares the fair value of the reporting unit to its carrying value. The fair value of the reporting unit is determined using the market approach. If the fair value of the reporting unit exceeds the carrying value of net assets of the reporting unit, goodwill is not impaired, and the Company is not required to perform further testing. If the carrying value of the net assets of the reporting unit exceeds the fair value of the reporting unit, then the Company must perform the second step in order to determine the implied fair value of the reporting unit's goodwill and compare it to the carrying value of the reporting unit's goodwill. If the carrying value of a reporting unit's goodwill exceeds its implied fair value, then the Company we must record an impairment charge equal to the difference. The Company has determined that it has a single reporting unit for purposes of performing its goodwill impairment test. The Company performs the annual impairment test in the second quarter of its fiscal year. As the Company uses the market approach to assess impairment, the price of its common stock price is an important component of the fair value calculation. If its stock price continues to experience significant price and volume fluctuations, this will impact the fair value of the reporting unit, which can lead to potential impairment in future periods. As of December 31, 2011, the Company had not identified any factors that indicated there was an impairment of its goodwill and determined that no additional impairment analysis was required.
Fair Value of Financial Instruments—Due to their short-term nature, the carrying amounts of the Company's financial instruments reported in the consolidated financial statements, which include cash, cash equivalents, accounts receivable, accounts payable and accrued liabilities approximate fair value.
Warrant Liability—Prior to the IPO, the Company accounted for its freestanding warrants for shares of the Company's convertible preferred stock and warrants to purchase shares of the Company's common stock as liabilities at fair value on the consolidated balance sheets because some of the warrants were potentially redeemable. The warrants were remeasured at each balance sheet date with
81
MERU NETWORKS, INC.
NOTES TO CONSOLIDATED FINANCIAL STATEMENTS (Continued)
1. Business and Summary of Significant Accounting Policies (Continued)
any changes in fair value being recognized as a component of other income (expense), net on the consolidated statements of operations. Upon the closing of the IPO in April 2010, these warrants were amended to remove the cash redemption feature and other variable terms, remeasured and the related fair value was reclassified to additional paid-in capital.
Income Taxes—As part of the process of preparing the Company's consolidated financial statements, the Company is required to estimate its taxes in each of the jurisdictions in which it operates. The Company estimates actual current tax exposure together with assessing temporary differences resulting from differing treatment of items, such as accruals and allowances not currently deductible for tax purposes. These differences result in deferred tax assets and liabilities, which are included in the Company's consolidated balance sheets. In general, deferred tax assets represent future tax benefits to be received when certain expenses previously recognized in the Company's consolidated statements of operations become deductible expenses under applicable income tax laws or loss or credit carryforwards are utilized. Accordingly, realization of the Company's deferred tax assets is dependent on future taxable income against which these deductions, losses, and credits can be utilized.
The Company must assess the likelihood that the Company's deferred tax assets will be recovered from future taxable income, and to the extent the Company believes that recovery is not likely, the Company establishes a valuation allowance. Management judgment is required in determining the Company's provision for income taxes, deferred tax assets and liabilities, and any valuation allowance recorded against the net deferred tax assets. The Company recorded a full valuation allowance as of December 31, 2011, 2010 and 2009. Based on the available evidence, the Company believes it is more likely than not that it will not be able to utilize its deferred tax assets in the future. The Company intends to maintain valuation allowances until sufficient evidence exists to support the reversal of the valuation allowances. The Company makes estimates and judgments about its future taxable income that are based on assumptions that are consistent with its plans. Should the actual amounts differ from the Company's estimates, the carrying value of the Company's deferred tax assets could be materially impacted.
The Company recognizes in the financial statements the impact of a tax position, if that position is more likely than not of being sustained on audit, based on the technical merits of the position. The Company's policy is to recognize interest and penalties accrued on any unrecognized tax benefits as a component of income tax expense. There are no tax positions for which it is reasonably possible that the total amounts of unrecognized tax benefits will significantly increase or decrease within 12 months of the reporting date.
Stock-Based Compensation—Compensation costs related to employee stock options that were either granted or modified during the years ended December 31, 2011, 2010 and 2009 are based on the fair value of the awards on the date of grant or modification, net of estimated forfeitures. The Company determines the grant date fair value of the awards using the Black-Scholes option-pricing model. The Company recognizes stock-based compensation expense on a straight-line basis over the vesting period of the respective option grants.
The Company accounts for stock options issued to nonemployees based on the fair value of the awards also determined using the Black-Scholes option-pricing model. The fair value of stock options granted to nonemployees is remeasured as the stock options vest, and the resulting change in value, if any, is recognized in the Company's consolidated statement of operations during the period the related services are rendered.
82
MERU NETWORKS, INC.
NOTES TO CONSOLIDATED FINANCIAL STATEMENTS (Continued)
1. Business and Summary of Significant Accounting Policies (Continued)
Research and Development Costs—Research and development costs are expensed as incurred.
Software Development Costs—The costs to develop software have not been capitalized as the Company believes its current software development process is essentially completed concurrent with the establishment of technological feasibility.
Accounts Receivable—Trade accounts receivable are recorded at the invoiced amount, net of allowances for doubtful accounts. The allowance for doubtful accounts is based on the Company's assessment of the collectibility of customer accounts. The Company regularly reviews the allowance by considering certain factors such as historical experience, credit quality, age of the accounts receivable balances, and current economic conditions that may affect a customer's ability to pay. Write-offs of accounts receivable to bad debt expense were approximately $143,000 and $80,000 during the years ended December 31, 2011 and 2009. There was no bad debt expense during the year ended December 31, 2010. The Company collected previously written-off bad debt expense for the amount of $61,000 during 2010.
Comprehensive Loss—Comprehensive loss is comprised of net loss and other comprehensive income (loss). For the Company, other comprehensive loss includes foreign currency translation adjustments and unrealized gains and losses on short-term investments. Total comprehensive loss for all periods presented has been disclosed in the consolidated statements of convertible preferred stock and of stockholders' equity (deficit). The components of accumulated other comprehensive loss were as follows (in thousands):
| |
Yeas Ended December 31, |
||||||
|---|---|---|---|---|---|---|---|
| |
2011 | 2010 | |||||
Cumulative foreign currency translation adjustment |
$ | (197 | ) | (28 | ) | ||
Net unrealized gain on available-for-sale securities |
— | 1 | |||||
Accumulated other comprehensive loss |
$ | (197 | ) | $ | (27 | ) | |
Warranty—The Company provides a warranty on product sales and estimated warranty costs are recorded during the period of sale. The Company establishes warranty reserves based on estimates of product warranty return rates and expected costs to repair or to replace the products under warranty. The warranty provision is recorded as a component of costs of products revenues in the consolidated statements of operations.
Accrued warranty, which is included in accrued liabilities on the consolidated balance sheets, is summarized for the years ended December 31, 2011, 2010 and 2009 as follows (in thousands):
| |
Years Ended December 31, |
|||||||||
|---|---|---|---|---|---|---|---|---|---|---|
| |
2011 | 2010 | 2009 | |||||||
Accrued warranty balance—beginning of period |
$ | 417 | $ | 194 | $ | 172 | ||||
Warranty costs incurred |
(118 | ) | (125 | ) | (249 | ) | ||||
Provision for warranty |
363 | 348 | 271 | |||||||
Accrued warranty balance—end of period |
$ | 662 | $ | 417 | $ | 194 | ||||
83
MERU NETWORKS, INC.
NOTES TO CONSOLIDATED FINANCIAL STATEMENTS (Continued)
1. Business and Summary of Significant Accounting Policies (Continued)
Loss Contingencies—The Company is or has been subject to proceedings, lawsuits and other claims arising in the ordinary course of business. The Company evaluates contingent liabilities, including threatened or pending litigation, for potential losses. If the potential loss from any claim or legal proceedings is considered probable and the amount can be estimated, the Company accrues a liability for the estimated loss. Because of uncertainties related to these matters, accruals are based upon the best information available at the time. As additional information becomes available, the Company reassesses the potential liability related to pending claims and litigation and may revise its estimates, which could materially impact its consolidated financial statements.
2. Recently Issued Accounting Pronouncements
In September 2011, the FASB issued an update to existing guidance on the assessment of goodwill impairment. This amendment is intended to reduce the cost and complexity of the annual goodwill impairment test by providing entities an option to perform a qualitative assessment to determine whether further impairment testing is necessary. If an entity concludes that it is more-likely-than-not that the fair value of a reporting unit is less than its carrying amount, then a two-step goodwill impairment test is required. Otherwise, the two-step goodwill impairment test is not required. This standard is effective for reporting periods beginning on or after December 15, 2011 and early adoption is permitted if an entity's financial statements for the most recent annual or interim period have not yet been issued. The Company will adopt this standard in the first quarter of 2012 and does not expect the adoption to have a material impact on the Company's consolidated financial position, results of operations or cash flows.
In June 2011, the FASB issued a new accounting standard to improve the comparability and transparency of financial reporting and to increase the prominence of items reported in other comprehensive income. The new standard requires companies to present the components of net income and other comprehensive income either as one continuous statement or as two separate but consecutive statements. It eliminates the option to report other comprehensive income and its components as part of the statement of changes in shareholders' equity. This standard is effective for fiscal years, and interim periods within those years, beginning after December 15, 2011. Early adoption is permitted, and full retrospective application is required. The Company will adopt this standard in the first quarter of 2012 and does not expect the adoption to have a material impact on the Company's consolidated financial position, results of operations or cash flows.
In May 2011, the FASB issued a revised accounting standard. This amendment provides a consistent definition of fair value and ensures that the fair value measurement and disclosure requirements are similar between Generally Accepted Accounting Principles and International Financial Reporting Standards. The amendment clarifies the application of existing fair value measurements and disclosures, and changes certain principles or requirements for fair value measurements and disclosures. The amendment changes certain fair value measurement principles and enhances the disclosure requirements particularly for level 3 fair value measurements. The standard is effective for reporting periods beginning on or after December 15, 2011 and should be applied prospectively. The Company will adopt this standard in the first quarter of 2012 and does not expect the adoption to have a material impact on the Company's consolidated financial position, results of operations or cash flows.
84
MERU NETWORKS, INC.
NOTES TO CONSOLIDATED FINANCIAL STATEMENTS (Continued)
3. Acquisition of Identity Networks
On August 31, 2011, the Company acquired all of the outstanding shares of Identity Networks ("Identity"), a privately-owned provider of complete guest and device access management solutions located in the United Kingdom. Under the terms of the share purchase agreement, at closing, the Company paid approximately $2.0 million, net of cash acquired, to Identity shareholders. An additional $0.1 million was paid to Identity shareholders in October 2011 due to a working capital adjustment. In addition, the Company agreed to pay up to $0.4 million to the former shareholders of Identity within six months of the acquisition date as earn-out consideration based on Identity meeting certain contractually agreed-upon development milestones, of which $0.1 million was paid to Identity shareholders in November 2011. The Company assessed the probability of the earn-out milestones being met and included the estimated fair value of those milestones, as adjusted for the time-value of money, in the acquisition price.
The Company recorded the total acquisition price as follows (in thousands):
Cash |
$ | 2,117 | ||
Contingent consideration at estimated fair value on closing date |
369 | |||
Total |
$ | 2,486 | ||
The allocation of the acquisition price for net tangible and intangible assets was as follows (in thousands):
Net tangible assets |
$ | 38 | ||
Identifiable intangible assets: |
||||
Developed technology |
630 | |||
Customer relationships |
160 | |||
Goodwill |
1,658 | |||
Total |
$ | 2,486 | ||
The developed technology asset is attributable to products which have reached technological feasibility. The customer relationships asset is attributable to the Company's ability and intent to sell existing in process and future versions of the acquired products to the existing customers of Identity. The value of the identified intangible assets was determined by discounting the estimated net future cash flows from the acquired products and customer agreements based on valuation technologies accepted in the technology industry. The Company is amortizing the developed technology and customer relationships assets on a straight-line basis over their estimated useful lives of three and two years, respectively.
Goodwill represents the excess of the purchase price of an acquired business over the fair value of the underlying net tangible and intangible assets and is not deductible for tax purposes. Among the factors that contributed to a purchase price in excess of the fair value of the net tangible and identified intangible assets was the acquisition of an assembled workforce of experienced engineers, synergies in products, technologies, skill sets, operations, customer base and organizational cultures that can be leveraged to enable the Company to build an enterprise greater than the sum of its parts.
85
MERU NETWORKS, INC.
NOTES TO CONSOLIDATED FINANCIAL STATEMENTS (Continued)
3. Acquisition of Identity Networks (Continued)
The Company has included the financial results of Identity in the Company's consolidated financial statements commencing at the acquisition date. No pro forma information was presented based on the determination that the acquisition is not significant to the Company's consolidated financial statements.
4. Goodwill and Intangible Assets
The following table summarizes the activity related to the carrying value of goodwill (in thousands):
Balance as of December 31, 2010 |
$ | — | ||
Goodwill recorded in connection with the acquisition of Identity Networks |
1,658 | |||
Balance as of December 31, 2011 |
$ | 1,658 | ||
Intangible assets acquired are accounted for based on the fair value of assets purchased and are amortized over the period in which economic benefit is estimated to be received. Identifiable intangible assets were as follows (in thousands):
| |
As of December 31, 2011 | |||||||||||
|---|---|---|---|---|---|---|---|---|---|---|---|---|
| |
Estimated Useful Life |
Gross Value |
Accumulated Amortization |
Net Value |
||||||||
Developed technology |
3 years | $ | 630 | $ | (70 | ) | $ | 560 | ||||
Customer relationships |
2 years | 160 | (27 | ) | 133 | |||||||
Total |
$ | 790 | $ | (97 | ) | $ | 693 | |||||
The Company recorded amortization expense related to these identified intangible assets in the condensed consolidated statements of operations as follows (in thousands):
| |
Year Ended December 31, 2011 |
|||
|---|---|---|---|---|
Costs of products revenues |
$ | 70 | ||
Sales and marketing |
27 | |||
Total amortization expense |
$ | 97 | ||
As of December 31, 2011, the estimated aggregate future amortization expense in future years is as follows (in thousands):
Fiscal Years:
|
|
|||
|---|---|---|---|---|
2012 |
$ | 290 | ||
2013 |
263 | |||
2014 |
140 | |||
Total |
$ | 693 | ||
86
MERU NETWORKS, INC.
NOTES TO CONSOLIDATED FINANCIAL STATEMENTS (Continued)
5. Cost Method Investments
During the year ended December 31, 2011, the Company invested $1.3 million in a company which is developing value-added applications that are designed to allow its customers to achieve greater benefit from wireless networks such as those offered by the Company. The investment of $1.3 million is included in other assets. This investee is co-founded by Dr. Vaduvur Bharghavan, a co-founder of the Company and a member of the Company's board of directors.
The Company uses the cost method to account for this investment due to (i) the Company's investment represents approximately 16% equity ownership of the investee (ii) Dr. Bharghavan, who is the co-founder of the investee, transitioned from his day to day role as the Company's Chief Technology Officer during the year ended December 31, 2011, and (iii) Dr. Bharghavan, who remains the member of the Company's board of directors, ceased receiving any cash compensation for his role as an executive of the Company as of May 2011. The Company does not have the ability to exercise significant influence over the investee's operating and financial policies.
Equity investments, especially equity investments in private companies are inherently risky. Many factors, including technical and product development challenges, market acceptance, competition, additional funding availability and the overall economy, could cause the investment to be impaired. The Company monitors the indicators of impairment. In the event that the fair value of the investment is below its carrying value and the impairment is other-than-temporary, the Company writes down the investment to its fair value. During the year ended December 31, 2011, there were no indicators of impairment. The Company has not elected the fair value option for this investment.
6. Inventory
Inventory as of December 31, 2011 and 2010 is as follows (in thousands):
| |
December 31, 2011 |
December 31, 2010 |
|||||
|---|---|---|---|---|---|---|---|
Finished goods |
$ | 5,670 | $ | 3,951 | |||
Channel inventory |
878 | 685 | |||||
Inventory |
$ | 6,548 | $ | 4,636 | |||
7. Net Loss Per Share of Common Stock
The Company's basic net loss per share of common stock is calculated by dividing the net loss attributable to common stockholders by the weighted-average number of shares of common stock outstanding for the period. The weighted-average number of shares of common stock used to calculate the Company's basic net loss per share of common stock excludes stock awards prior to vesting and also those shares subject to repurchase related to stock options that were exercised prior to vesting as these shares are not deemed to be issued for accounting purposes until they vest. The diluted net loss per share of common stock is calculated by giving effect to all potential common stock equivalents outstanding for the period determined using the treasury-stock method. For purposes of the diluted shares outstanding calculation, convertible preferred stock, stock awards and options to purchase common stock, common stock subject to repurchase, warrants to purchase convertible preferred stock and warrants to purchase common stock are considered to be common stock equivalents. In periods in
87
MERU NETWORKS, INC.
NOTES TO CONSOLIDATED FINANCIAL STATEMENTS (Continued)
7. Net Loss Per Share of Common Stock (Continued)
which the Company has reported a net loss, the common stock equivalents have been excluded from the calculation of diluted net loss per share of common stock as their effect is antidilutive.
The following outstanding shares of common stock and common stock equivalents were excluded from the computation of diluted net loss per share of common stock for the periods presented because including them would have been antidilutive:
| |
Years Ended December 31, | |||||||||
|---|---|---|---|---|---|---|---|---|---|---|
| |
2011 | 2010 | 2009 | |||||||
Convertible preferred stock |
— | — | 10,909,067 | |||||||
Stock awards and stock options to purchase common stock* |
4,128,334 | 2,787,933 | 2,190,173 | |||||||
Common stock subject to repurchase |
104 | 2,996 | 7,051 | |||||||
Convertible preferred stock warrants |
— | — | 491,691 | |||||||
Common stock warrants |
2,723,957 | 4,033,452 | 4,084,354 | |||||||
- *
- Includes 169,383 and 79,744 shares, which were expected to be issued pursuant to the Company's Employee Stock Purchase Plan as of December 31, 2011 and 2010, respectively, based on employee enrollment.
8. Fair Value of Financial Instruments
As a basis for determining the fair value of certain of the Company's assets and liabilities, the Company established a three-tier value hierarchy which prioritizes the inputs used in measuring fair value as follows: (Level I) observable inputs such as quoted prices in active markets; (Level II) inputs other than the quoted prices in active markets that are observable either directly or indirectly; and (Level III) unobservable inputs in which there is little or no market data that requires the Company to develop its own assumptions. This hierarchy requires the Company to use observable market data, when available, and to minimize the use of unobservable inputs when determining fair value. The Company's financial assets that are measured at fair value on a recurring basis consist of cash equivalents and short-term investments. The Company's liability that is measured at fair value on a recurring basis consists of an earn-out consideration.
Level I instrument valuations are obtained from quotes for transactions in active exchange markets involving identical assets. Level II instrument valuations are obtained from readily-available pricing sources for comparable instruments. The Company's cash equivalents and short-term investments are valued using market prices on active markets (Level I) and less active markets (Level II). Pricing is provided by third party sources of market information obtained through the Company's investment advisors rather than models. The Company does not adjust for or apply any additional assumptions or estimates to the pricing information it receives from advisors. The Company's Level 2 securities include cash equivalents and available-for-sale securities, which consisted primarily of certificates of deposit, corporate debt, and government agency and municipal debt securities from issuers with high quality credit ratings. The Company's investment advisors obtain pricing data from independent sources, such as Standard & Poor's, Bloomberg and Interactive Data Corporation, and rely on comparable pricing of other securities because the Level 2 securities it holds are not actively traded and have fewer observable transactions. The Company considers this the most reliable information available for the
88
MERU NETWORKS, INC.
NOTES TO CONSOLIDATED FINANCIAL STATEMENTS (Continued)
8. Fair Value of Financial Instruments (Continued)
valuation of the securities. The Company had no transfers between Level I and Level II during the years ended December 31, 2011 and 2010.
The Company's earn-out consideration liability as of December 31, 2011 was classified within Level III of the fair value hierarchy. The Company's warrant liability and penalty provision as of December 31, 2009 were classified within Level III of the fair value hierarchy. Level III assets and liabilities are valued using unobservable inputs to the valuation methodology that are supported by little or no market activity and that are significant to the measurement of the fair value of the assets or liabilities. Level III assets and liabilities include those whose fair value measurements are determined using pricing models, discounted cash flow methodologies or similar valuation techniques, as well as significant management judgment or estimation.
As of December 31, 2011, the Company's fair value hierarchy for its financial assets and liabilities was as follows (in thousands):
| |
December 31, 2011 | ||||||||||||
|---|---|---|---|---|---|---|---|---|---|---|---|---|---|
| |
Quoted Prices in Active Markets for Identical Instruments (Level I) |
Significant Other Observable (Level II) |
Significant Unobservable (Level III) |
Total Fair Value |
|||||||||
Assets: |
|||||||||||||
Money market funds |
$ | 30,027 | $ | — | $ | — | $ | 30,027 | |||||
U.S. government securities |
— | 5,000 | — | 5,000 | |||||||||
Liabilities: |
|||||||||||||
Earn-out consideration liability |
$ | — | $ | — | $ | 300 | $ | 300 | |||||
The following table provides a summary of changes in fair value of the Company's earn-out consideration liability measured at fair value using significant unobservable inputs (Level III) for the year ended December 31, 2011 (in thousands):
| |
Fair Value | |||
|---|---|---|---|---|
Balance as of December 31, 2010 |
$ | — | ||
Fair value of earn-out at acqusition date |
369 | |||
Adjustment to fair value |
31 | |||
Earn-out consideration payment |
(100 | ) | ||
Balance as of December 31, 2011 |
$ | 300 | ||
The valuation of the earn-out consideration is discussed in Note 3.
At December 31, 2011 and 2010, the Company had $5.0 million of U.S. government securities which mature in less than one year and approximated cost.
89
MERU NETWORKS, INC.
NOTES TO CONSOLIDATED FINANCIAL STATEMENTS (Continued)
8. Fair Value of Financial Instruments (Continued)
As of December 31, 2010, the Company's fair value hierarchy for its financial assets and liabilities was as follows (in thousands):
| |
December 31, 2010 | ||||||||||||
|---|---|---|---|---|---|---|---|---|---|---|---|---|---|
| |
Quoted Prices in Active Markets for Identical Instruments (Level I) |
Significant Other Observable (Level II) |
Significant Unobservable (Level III) |
Total Fair Value |
|||||||||
Assets: |
|||||||||||||
Money market funds |
$ | 31,092 | $ | — | $ | — | $ | 31,092 | |||||
U.S. government securities |
— | 29,998 | — | 29,998 | |||||||||
The changes in the value of the warrant liability and penalty provision during the years ended December 31, 2010 and 2009 were as follows (in thousands):
| |
Years Ended December 31, |
||||||
|---|---|---|---|---|---|---|---|
| |
2010 | 2009 | |||||
Fair value—beginning of period |
$ | 19,089 | $ | 505 | |||
Issurances of warrants |
— | 4,264 | |||||
Exercise of Series E convertible preferred stock warrants |
(4,285 | ) | — | ||||
Realized gain on release of penalty provision |
(150 | ) | — | ||||
Amendment and conversion of warrants upon IPO |
(48,274 | ) | — | ||||
Change in fair value |
33,620 | 14,320 | |||||
Fair value—end of period |
$ | — | $ | 19,089 | |||
The fair value of the exercised warrants was reclassified to additional paid-in capital within stockholders' equity (deficit) upon the close of the Company's IPO. See further discussion of the valuation of the warrants in Note 14.
9. Property and Equipment, net
Property and equipment, net as of December 31, 2011 and 2010 is as follows (in thousands):
| |
December 31, 2011 |
December 31, 2010 |
|||||
|---|---|---|---|---|---|---|---|
Computer equipment and software |
$ | 3,952 | $ | 2,646 | |||
Furniture and fixtures |
94 | 89 | |||||
Leasehold improvements |
500 | 471 | |||||
Property and equipment, gross |
4,546 | 3,206 | |||||
Less accumulated depreciation and amortization |
(3,070 | ) | (2,443 | ) | |||
Property and equipment, net |
$ | 1,476 | $ | 763 | |||
Depreciation expense was $627,000, $615,000 and $551,000 during the years ended December 31, 2011, 2010 and 2009.
90
MERU NETWORKS, INC.
NOTES TO CONSOLIDATED FINANCIAL STATEMENTS (Continued)
10. Accrued Liabilities
Accrued liabilities as of December 31, 2011 and 2010 consist of the following (in thousands):
| |
December 31, 2011 |
December 31, 2010 |
|||||
|---|---|---|---|---|---|---|---|
Accrued compensation and benefits |
$ | 4,310 | $ | 4,418 | |||
Accrued commissions |
1,882 | 1,500 | |||||
Accrued inventory |
163 | 282 | |||||
Sales returns reserve |
125 | 277 | |||||
Accrued professional service fees |
547 | 77 | |||||
Reserve for product warranty |
662 | 417 | |||||
Income tax payable |
478 | 222 | |||||
Accrued employee stock purchase plan |
274 | 171 | |||||
Earn-out consideration for Identity Networks |
300 | — | |||||
Other |
3,653 | 3,330 | |||||
|
$ | 12,394 | $ | 10,694 | |||
Accrued compensation and benefits includes approximately $0.8 million related to a transitional employment agreement with the Company's Chief Executive Officer.
11. Short-Term Debt
In January 2007, the Company entered into a debt agreement that provided the Company with up to $6.5 million in debt financing in the form of a loan of $1.5 million and a working capital line of credit of $5.0 million. This debt agreement was later amended to increase the working capital line of credit up to $7.0 million based on eligible accounts receivable. The Company also entered into a new term agreement to provide an additional loan of $15.0 million. All of the debt agreements are collateralized by substantially all of the Company's assets. The Company paid off its debt in 2011.
As of December 31, 2011, the line of credit bore interest at the lenders' prime rate which is currently 3.25%. As of December 31, 2011 and 2010, the total amount outstanding under the line of credit was zero. As of December 31, 2011 and 2010, the Company had unused amounts under the line of credit of up to7.0 million.
In connection with these loan agreements in November 2007, the Company issued to the lender a warrant to purchase a total of 76,922 shares of the Company's common stock. The warrant was exercisable upon issuance, had an exercise price of $8.32 per share, and was fully exercised utilizing a cashless exercise provision in 2010. Upon issuance, the relative fair value of the warrant was recorded as a debt discount on the consolidated balance sheet in the amount of $456,000. The debt discount was amortized to interest expense over the repayment period for the loan. The amortization expense related to the debt discount for the bank borrowings was $44,000, $107,000 and $134,000 during the years ended December 31, 2011, 2010 and 2009.
91
MERU NETWORKS, INC.
NOTES TO CONSOLIDATED FINANCIAL STATEMENTS (Continued)
12. Commitments and Contingencies
Legal Matters—On June 13, 2011, the Company entered into a Patent Cross License Agreement (the "Motorola License Agreement") with Motorola Solutions, Inc., a Delaware corporation, and its affiliates, including Symbol Technologies, Inc., Wireless Valley Communications, Inc., and AirDefense, Inc. (collectively "Motorola"). Pursuant to the Motorola License Agreement, the Company and Motorola each agreed to:
- •
- provide one another with limited licenses through November 3, 2016 to certain of each of their respective 802.11
wireless LAN patent portfolios;
- •
- release one another of certain claims based on infringement or alleged infringement of certain patent rights; and
- •
- covenant not to assert patent claims against one another's current products and certain commercially reasonable extensions thereof for three years.
As part of the Motorola License Agreement, the Company agreed to pay Motorola $7,250,000 on or before July 1, 2011.
In evaluating the accounting treatment for this transaction, the Company identified the following specific items the Company received from the Motorola License Agreement: (1) release of past infringement claims, (2) covenant by Motorola not to sue, and (3) limited license to certain Motorola technology. The Company does not believe this Motorola License Agreement will provide future value as the Company does not plan to utilize the underlying technology in any future product development or sales. The Motorola License Agreement released and avoided certain potential litigation for the Company, but provided no other future benefits to the Company. Therefore, the Company expensed the full $7.3 million in the second quarter of the Company's fiscal year 2011.
Operating Leases—The Company leases office space for its headquarters in Sunnyvale, California under a noncancelable operating lease that expires in 2015. In addition, the Company leases space for a research and development facility in Bangalore, India pursuant to an operating lease that expires in 2016, which is noncancelable prior to 2014. The Company has the option to renew the lease for an additional five years. The Company also leases office space for sales offices in multiple locations around the world under noncancelable operating leases that expire at various dates. Rent expense related to these noncancelable operating leases was $1.6 million, $1.3 million, and $1.3 million in 2011, 2010 and 2009. Rent expense is recognized on a straight-line basis over the term of the lease.
The aggregate future noncancelable minimum payments on operating leases are as follows (in thousands):
| |
Operating Leases |
|||
|---|---|---|---|---|
Fiscal Years: |
||||
2012 |
$ | 1,320 | ||
2013 |
1,132 | |||
2014 |
1,077 | |||
2015 |
132 | |||
Total |
$ | 3,661 | ||
92
MERU NETWORKS, INC.
NOTES TO CONSOLIDATED FINANCIAL STATEMENTS (Continued)
12. Commitments and Contingencies (Continued)
Other commitments as of December 31, 2011 totaled approximately $10.4 million and consisted of inventory and other non-cancelable purchase obligations.
Litigation—The Company is subject to various claims arising in the ordinary course of business. Although no assurance may be given, the Company believes that it is not presently a party to any litigation of which the outcome, if determined adversely, would individually or in the aggregate be reasonably expected to have a material and adverse effect on the business, operating results, cash flows or financial position of the Company.
On May 11, 2010, Extricom Ltd., filed suit against the Company in the Federal District Court of Delaware asserting infringement of U.S. Patent No. 7,697,549. Also on May 11, 2010, the Company filed a declaratory relief action against Extricom Ltd. in the Federal District Court for Northern California seeking a declaration that the Company is not infringing the Extricom Ltd. patent and that the patent is invalid. The Company's declaratory relief action in the Northern District of California was dismissed by the Court on August 31, 2010 in favor of the Delaware action on the ground that Extricom Ltd. filed its suit in the Federal District Court of Delaware first. On October 7, 2010, the Company filed a motion to transfer the Delaware action to the Northern District of California based upon the convenience of witnesses and in the interests of justice. The Court has not yet ruled on this motion. The Extricom Ltd. complaint seeks unspecified monetary damages and injunctive relief. During March 2012, the Company's settlement negotiations with Extricom Ltd., progressed, and as of March 15, 2012, the parties are discussing the form, terms and conditions of a potential license and settlement agreement with the expectation that a payment of approximately $2.3 million will be made to Extricom Ltd., if mutually agreeable terms and conditions can be reached. Given the remaining uncertainties, the Company is unable to allocate the expected payment to any of the elements in the potential license and settlement agreement, and as such, has not adjusted its consolidated financial statements.
On October 22, 2010, EON Corp. IP Holdings, LLC, filed suit against the Company and several other defendants in the United States District Court for the Easter District of Texas asserting infringement of U.S. Patent No. 5,592,491. EON Corp. IP Holdings, LLC has amended its Complaint to add additional defendants and to add specificity to certain of its claims. The Company's response to the Amended Complaint was filed on March 7, 2011, denying the allegations of the complaint, and asserting that the EON patent is not infringed and is invalid. One of the co-defendants in the action has filed a motion to transfer the case to the Northern District of California, and the Company has joined in the motion to transfer. The EON Corp. IP Holdings, LLC Amended Complaint seeks unspecified monetary damages and injunctive relief. At this time, the Company is unable to determine the outcome of this matter and, accordingly, cannot estimate the potential financial impact this action could have on its business, results of operations, cash flows and financial position.
On June 2, 2011, the United States International Trade Commission instituted a Section 337 Investigation, based on allegations that Linex Technologies, Inc.'s U.S. Patents relating to multiple-input-multiple-output technology are infringed by 802.11n products imported and sold by the Company—as well as by Hewlett-Packard, Apple, Aruba Networks, and Ruckus Wireless. The Company and its co-respondents are currently in the expert discovery phase of the Section 337 Investigation. A second settlement conference was held on March 5, 2012, but no resolution was reached. If the parties are unable to resolve the dispute, the Company intends to defend the suit vigorously. At this time, the Company is unable to determine the outcome of this matter and, accordingly, cannot estimate the
93
MERU NETWORKS, INC.
NOTES TO CONSOLIDATED FINANCIAL STATEMENTS (Continued)
12. Commitments and Contingencies (Continued)
potential financial impact this action could have on the Company's business, operating results, cash flows or financial position.
Third parties have from time to time claimed, and others may claim in the future that the Company has infringed their past, current or future intellectual property rights. These claims, whether meritorious or not, could be time-consuming, result in costly litigation, require expensive changes in the Company's methods of doing business or could require the Company to enter into costly royalty or licensing agreements, if available. As a result, these claims could harm the Company's business, operating results, cash flows and financial position.
Indemnifications—Under the indemnification provisions of the Company's standard sales contracts, the Company agrees to defend its customers against third-party claims asserting infringement of certain intellectual property rights, which may include patents, copyrights, trademarks, or trade secrets, and to pay any judgments entered on such claims. The exposure to the Company under these indemnification provisions is generally limited to the total amount paid by the customer under the agreement. However, certain agreements include indemnification provisions that could potentially expose the Company to losses in excess of the amount received under the agreement. To date, there have been no material claims under such indemnification provisions.
13. Convertible Promissory Notes from Related Parties and Convertible Preferred Stock
In June 2008, the Company entered into a convertible note purchase agreement with current investors in the Company. The Company issued $10.0 million in convertible promissory notes upon finalizing this agreement. In September 2008 after the 60 day period noted in the original agreement had lapsed, this convertible note purchase agreement was amended to allow the Company to issue another $1.0 million in convertible promissory notes.
In January 2009, the Company amended the agreement related to the outstanding convertible promissory notes in order to extend the due date of the convertible promissory notes to March 2009. Also in January 2009, the Company issued an additional $3.2 million in convertible promissory notes under the same convertible promissory note agreement.
In March 2009, the Company raised $15.0 million in exchange for the issuance of 21,358,707 shares of Series E convertible preferred stock ("Series E") and warrants to purchase 1,642,966 shares of common stock. In addition, the Company converted all outstanding convertible promissory notes in the amount of $14.2 million and $651,000 in related accrued interest into 21,103,049 shares of Series E, warrants to purchase 1,623,274 shares of common stock, and warrants to purchase 4,035,256 shares of Series E. As the accounting conversion price exceeded the fair value per share of the underlying common stock on the transaction date, the Company determined that there was no beneficial conversion feature on the Series E.
In May and June 2009, the Company raised an additional $6.7 million in exchange for the issuance of 9,540,218 shares of the Series E and warrants to purchase 733,854 shares of common stock. In September 2009, the Company settled an ongoing lawsuit with a former employee in exchange for the issuance of 95,400 shares of Series E and warrants to purchase 7,338 shares of common stock.
In March and April of 2010, warrants to purchase 4,510,843 shares of Series E stock were exercised, of which 1,020,463 were cash exercises and the other 3,490,380 were exercised utilizing a
94
MERU NETWORKS, INC.
NOTES TO CONSOLIDATED FINANCIAL STATEMENTS (Continued)
13. Convertible Promissory Notes from Related Parties and Convertible Preferred Stock (Continued)
cashless exercise provision. In aggregate, 3,084,368 shares of Series E were issued in conjunction with these exercises.
All 113,117,156 shares of the Company's convertible preferred stock outstanding at the time of the Company's IPO converted into 11,185,891 shares of common stock on April 6, 2010 upon the closing of the Company's IPO.
14. Warrants for Convertible Preferred Stock and Common Stock
Series E
During 2008 and 2009, the Company issued warrants to purchase 4,510,843 shares of Series E convertible preferred stock. The Series E warrants were exercisable immediately and had an exercise price equal to $0.70 per share.
The relative fair value of the Series E warrants in the amount of $1.2 million was recorded in the consolidated balance sheets as a warrant liability upon issuance and, subsequently, the fair value of the warrant liability from the Series E warrants was remeasured at each period end. The change in fair value of the warrants resulted in a charge to other income (expense), net in the amount of $2.7 million and $815,000 during the years ended December 31, 2010 and 2009, respectively.
The Company determined the fair value of the Series E warrants as of their respective exercise dates in April 2010 using the Black-Scholes option-pricing model with the following assumptions:
| |
April 2010 |
|||
|---|---|---|---|---|
Dividend rate |
0 | % | ||
Risk-free interest rate |
0.2 | % | ||
Expected life (in years) |
0 | |||
Expected volatility |
53.9 | % | ||
Upon the closing of the IPO, these warrants were remeasured and the related fair value was reclassified to additional paid-in capital. During the year ended December 31, 2010, all of the Series E warrants were exercised and are no longer outstanding.
Series B
In 2005, the Company issued a warrant to purchase 541,346 shares of Series B convertible preferred stock ("Series B warrant"). The Series B warrant was exercisable upon issuance and had an exercise price equal to $0.74 per share.
The relative fair value of the Series B warrant of $503,000 was recorded in the consolidated balance sheets as a warrant liability and debt discount. The fair value of the warrant liability for the Series B warrant was remeasured at each period end. As of April 6, 2010, all of the Company's convertible preferred stock converted into shares of common stock upon the closing of the Company's IPO. Following the conversion of the convertible preferred stock, the Series B warrant became a warrant to purchase 44,202 shares of common stock. Prior to the conversion of the convertible preferred stock, the change in fair value of the warrant resulted in a charge through other income
95
MERU NETWORKS, INC.
NOTES TO CONSOLIDATED FINANCIAL STATEMENTS (Continued)
14. Warrants for Convertible Preferred Stock and Common Stock (Continued)
(expense), net in the amount of $344,000 during the year ended December 31, 2010 and a gain through other income (expense), net in the amount of $330,000 during the year ended December 31, 2009.
The Company determined the fair value of the Series B warrant as of April 6, 2010 using the Black-Scholes option-pricing model with the following assumptions:
| |
April 6, 2010 |
|||
|---|---|---|---|---|
Dividend rate |
0 | % | ||
Risk-free interest rate |
1.3 | % | ||
Expected life (in years) |
2.5 | |||
Expected volatility |
67.1 | % | ||
Upon the closing of the IPO, the Series B warrant was remeasured and the related fair value was reclassified to additional paid-in capital. In 2011, this Series B warrant to purchase 44,202 shares of common stock (after giving effect to the stock split in connection with the IPO) was exercised, in full, utilizing a cashless exercise provision. As a result, the Company issued 26,520 shares of common stock.
Common Stock
In connection with bank borrowings in January and November 2007, the Company issued to the lender warrants to purchase a total of 76,922 shares of the Company's common stock. These warrants were exercisable upon issuance, had an exercise price of $8.32 per share, and were to expire on the earlier of November 2017 or within three years following the occurrence of an underwritten public offering of the Company's common stock. The Company estimated the total relative fair value of the warrants to be $456,000 upon issuance using the Black-Scholes option-pricing model. The fair value of these common stock warrants was recorded through stockholders' equity (deficit) upon issuance. During the year ended 2010, warrants to purchase all 76,922 shares of common stock were exercised utilizing a cashless exercise provision. As a result, the Company issued 41,349 shares of common stock.
In connection with the convertible promissory notes discussed at Note 13 and the Series E financing that took place in 2009, the Company issued warrants to purchase 4,007,432 shares of common stock. During 2010, the Company issued another warrant to purchase 36,582 shares of common stock as a result of the exercise of a Series E warrant. These common stock warrants are exercisable immediately, have exercise prices ranging from $9.78 to $11.74 and expire in 2014. During the year ended 2010, warrants to purchase 54,764 shares were exercised utilizing a cashless exercise provision. As a result, the Company issued 19,072 shares of common stock. In 2011, warrants to purchase 1,265,293 shares were exercised utilizing a cashless exercise provision. As a result, the Company issued 548,125 shares of common stock. The remaining warrants to purchase 2,723,957 shares of common stock have not been exercised and were still outstanding as of December 31, 2011.
Because these common stock warrants were potentially redeemable for cash under certain change in control provisions and included certain variable terms outside of the control of the Company prior to the Company's IPO, these common stock warrants were recorded as a warrant liability at fair value and were subject to remeasurement at each period end with any changes in fair value being recognized in other income (expense), net on the consolidated statements of operations. The Company determined
96
MERU NETWORKS, INC.
NOTES TO CONSOLIDATED FINANCIAL STATEMENTS (Continued)
14. Warrants for Convertible Preferred Stock and Common Stock (Continued)
the fair value of these common stock warrants as of April 6, 2010 using the Black-Scholes option-pricing model, with the following assumptions:
| |
April 6, 2010 |
|||
|---|---|---|---|---|
Dividend rate |
0 | % | ||
Risk-free interest rate |
2.1 | % | ||
Expected life (in years) |
3.9 | |||
Expected volatility |
62.6 | % | ||
These common stock warrants were amended to remove the cash redemption feature and the other variable terms outside of the Company's control effective upon the closing of the Company's IPO which occurred on April 6, 2010. The change in fair value of the warrants resulted in a charge through other income (expense), net in the amount of approximately $30.6 million and $13.7 million during the years ended December 31, 2010 and 2009. Upon the closing of the Company's IPO, these warrants were remeasured and the related fair value was reclassified to additional paid-in capital.
15. Equity Incentive Plans
The Company's equity incentive plans are broad-based retention programs. The plans are intended to attract talented employees, directors and non-employee consultants. In March 2010, the Company's board of directors and its stockholders approved the 2010 Stock Incentive Plan (the "2010 Plan"). A total of 1,846,154 shares of common stock plus any shares reserved and not issued or subject to outstanding grants under the 2002 Stock Incentive Plan were reserved for future issuance under the 2010 Plan, which became effective upon the completion of the Company's IPO on April 6, 2010. The 2010 Plan provides for the granting of stock options, restricted stock, restricted stock units and stock appreciation rights. The number of shares reserved for issuance under the 2010 Plan will be increased on the first day of each of the Company's fiscal years by the lesser of 4% of the Company's outstanding common stock on the last day of the immediately preceding fiscal year or the number of shares determined by the board of directors. In 2011, shares equal to 4% of the outstanding shares of the Company on December 31, 2010, or 653,512 shares, were registered and reserved for issuance under the 2010 Plan. In addition, an amendment to the Company's 2010 Stock Incentive Plan to add an additional 700,000 shares to the number of shares of common stock authorized for issuance under the Company's 2010 Stock Incentive Plan was approved at the Company's 2011 shareholder meeting.
The Company's stock-based compensation expense was $6.2 million, $3.8 million and $867,000 during the years ended December 31, 2011, 2010 and 2009. The total stock-based compensation expense consisted of stock-based compensation expense for stock options granted to employees of $6.2 million, $3.8 million and $861,000 and nonemployees of $2,000, $46,000 and $6,000 for the years ended December 31, 2011, 2010 and 2009.
97
MERU NETWORKS, INC.
NOTES TO CONSOLIDATED FINANCIAL STATEMENTS (Continued)
15. Equity Incentive Plans (Continued)
Determining Fair Value of Stock Options
The fair value of stock options granted during the years ended December 31, 2011, 2010 and 2009 were determined by the Company using the methods and assumptions discussed below. Each of these inputs is subjective and generally requires significant judgment to determine.
Valuation Method—The Company estimates the fair value of stock options granted using the Black-Scholes option-pricing model.
Expected Term—The expected term represents the period that the Company's stock-based awards are expected to be outstanding. The expected term is derived from historical data on employee exercises and post-vesting employment termination behavior taking into account the contractual life of the award.
Expected Volatility—The expected volatility was based on the historical stock volatilities of several of the Company's publicly listed peers over a period equal to the expected terms of the options as the Company did not have a sufficient trading history to use the volatility of its own common stock.
Fair Value of Common Stock—Prior to the Company's IPO, the fair value of the shares of common stock underlying the stock options was determined by the board of directors because there was no public market for the Company's common stock. The board of directors therefore determined fair value of the common stock at the time of grant of the option by considering a number of objective and subjective factors including valuation of comparable companies, sales of convertible preferred stock to unrelated third parties, operating and financial performance, the lack of liquidity of capital stock and general and industry specific economic outlook, amongst other factors. Following the IPO, the fair value of the underlying common stock is based on the list price for the Company's common stock as noted on the NASDAQ on the grant date.
Risk-Free Interest Rate—The risk-free interest rate is based on the U.S. Treasury yield curve in effect at the time of grant for zero coupon U.S. Treasury notes with maturities approximately equal to the option's expected term.
Expected Dividend—The Company has never paid dividends and does not expect to pay dividends.
Forfeiture Rate—The Company estimates its forfeiture rate based on an analysis of its actual forfeitures and will continue to evaluate the adequacy of the forfeiture rate based on actual forfeiture experience, analysis of employee turnover behavior, and other factors. The impact from a forfeiture rate adjustment will be recognized in full in the period of adjustment, and if the actual number of future forfeitures differs from that estimated by the Company, the Company may be required to record adjustments to stock-based compensation expense in future periods.
98
MERU NETWORKS, INC.
NOTES TO CONSOLIDATED FINANCIAL STATEMENTS (Continued)
15. Equity Incentive Plans (Continued)
Summary of Assumptions—The fair value of each employee stock option was estimated at the date of grant using a Black-Scholes option-pricing model, with the following weighted-average assumptions for grants of options during the years ended December 31, 2011, 2010 and 2009:
| |
Years Ended December 31, |
|||||||||
|---|---|---|---|---|---|---|---|---|---|---|
| |
2011 | 2010 | 2009 | |||||||
Dividend rate |
0 | % | 0 | % | 0 | % | ||||
Risk-free interest rate |
1.3 | % | 2.7 | % | 3.0 | % | ||||
Expected life (in years) |
5.1 | 5.6 | 6.1 | |||||||
Expected volatility |
57.9 | % | 60.5 | % | 62.2 | % | ||||
The weighted-average grant date fair value of the Company's stock options granted during the years ended December 31, 2011, 2010 and 2009 was $4.96, $7.76 and $3.90 per share. The aggregate grant date fair value of the Company's stock options granted to employees for the years ended December 31, 2011, 2010 and 2009 was $6.8 million, $6.3 million and $5.0 million.
99
MERU NETWORKS, INC.
NOTES TO CONSOLIDATED FINANCIAL STATEMENTS (Continued)
15. Equity Incentive Plans (Continued)
A summary of the Company's stock option activity for the years ended December 31, 2011, 2010 and 2009 is presented below:
| |
Shares Available for Grant |
Number of Stock Options Outstanding |
Weighted- Average Exercise Price |
Weighted- Average Remaining Contractual Life (Years) |
Aggregate Intrinsic Value (in thousands) |
|||||||||||
|---|---|---|---|---|---|---|---|---|---|---|---|---|---|---|---|---|
Outstanding—January 1, 2009 |
194,898 | 1,084,174 | 3.59 | 7.6 | 1,940 | |||||||||||
Additional options authorized |
1,146,153 | — | ||||||||||||||
Granted |
(1,291,172 | ) | 1,291,172 | 7.68 | ||||||||||||
Repurchased |
684 | — | ||||||||||||||
Forfeited |
146,240 | (146,240 | ) | 6.07 | ||||||||||||
Exercised |
— | (38,933 | ) | 4.14 | ||||||||||||
Outstanding—December 31, 2009 |
196,803 | 2,190,173 | 5.82 | 8.4 | 7,183 | |||||||||||
Additional options authorized |
2,307,692 | — | ||||||||||||||
Options granted |
(844,565 | ) | 844,565 | 11.05 | ||||||||||||
Restricted stock granted |
(255,372 | ) | — | — | ||||||||||||
Repurchased |
370 | — | — | |||||||||||||
Forfeited options |
227,241 | (227,241 | ) | 8.80 | ||||||||||||
Forfeited restricted stock |
6,163 | — | — | |||||||||||||
Exercised |
— | (346,953 | ) | 4.15 | ||||||||||||
Outstanding—December 31, 2010 |
1,638,332 | 2,460,544 | 7.58 | 8.2 | 19,603 | |||||||||||
Additional options authorized |
1,353,512 | — | — | |||||||||||||
Options granted |
(1,377,825 | ) | 1,377,825 | 9.85 | ||||||||||||
Restricted stock granted |
(550,968 | ) | — | — | ||||||||||||
Repurchased |
1,187 | — | — | |||||||||||||
Forfeited options |
193,473 | (193,473 | ) | 9.09 | ||||||||||||
Forfeited restricted stock |
54,318 | — | — | |||||||||||||
Exercised |
— | (504,613 | ) | 4.11 | ||||||||||||
Outstanding—December 31, 2011 |
1,312,029 | 3,140,283 | $ | 9.04 | 8.4 | $ | 295 | |||||||||
Vested and expected to vest—December 31, 2011 |
1,847,441 | $ | 8.75 | 8.2 | $ | 280 | ||||||||||
Vested—December 31, 2011 |
989,863 | $ | 8.29 | 7.3 | $ | 269 | ||||||||||
The aggregate intrinsic value of options exercised under the Plan was $7.6 million, $3.7 million and $98,000 for the years ended December 31, 2011, 2010 and 2009, determined as of the date of option exercise.
100
MERU NETWORKS, INC.
NOTES TO CONSOLIDATED FINANCIAL STATEMENTS (Continued)
15. Equity Incentive Plans (Continued)
Additional information regarding the Company's stock options outstanding and vested as of December 31, 2011 is summarized below:
| |
Options Outstanding | Options Vested and Exercisable |
||||||||||||||
|---|---|---|---|---|---|---|---|---|---|---|---|---|---|---|---|---|
Exercise Prices
|
Shares | Weighted-Average Remaining Contractual Life (Years) |
Weighted- Average Exercise Price per Share |
Shares | Weighted- Average Exercise Price per Share |
|||||||||||
$0.91 - $6.50 |
908,933 | 8.7 | $ | 4.80 | 227,365 | $ | 3.37 | |||||||||
$6.51 - $8.67 |
1,117,060 | 8.0 | $ | 7.86 | 492,909 | $ | 7.83 | |||||||||
$8.68 - $15.18 |
565,298 | 8.4 | $ | 10.16 | 163,039 | $ | 10.08 | |||||||||
$15.19 - $21.68 |
548,992 | 8.9 | $ | 17.31 | 106,550 | $ | 18.04 | |||||||||
|
3,140,283 | 8.4 | $ | 9.04 | 989,863 | $ | 8.29 | |||||||||
As of December 31, 2011, total compensation cost related to unvested stock-based awards granted to employees, but not yet recognized, was $6.4 million, net of estimated forfeitures. This cost will be amortized on a straight-line basis over a weighted-average remaining period of 2.6 years and will be adjusted for subsequent changes in estimated forfeitures. Future option grants will increase the amount of compensation expense that will be recorded.
Restricted Stock Awards and Restricted Stock Units—The Company issued restricted stock awards ("RSAs") and restricted stock units ("RSUs") to employees and members of the board of directors. These restricted shares will vest from three months to four years from the date of issuance if the employees or directors, as applicable, remain with the Company for the duration of the vesting period. Some RSUs are performance based awards, therefore, the vesting of these RSUs is subject to the achievement of specific performance metrics in addition to continued service. The Company issued 550,968 and 224,800 shares of RSUs in 2011 and 2010, respectively. The Company recognized stock-based compensation in the amount of $2.0 million and $0.2 million for the RSUs in 2011 and 2010, respectively. The Company did not issue RSAs in 2011. The Company issued 30,572 shares of restricted stock awards to directors in 2010. The Company recognized stock-based compensation in the amount of $0.2 million for RSAs in each of the years ended December 31, 2011 and 2010.
101
MERU NETWORKS, INC.
NOTES TO CONSOLIDATED FINANCIAL STATEMENTS (Continued)
15. Equity Incentive Plans (Continued)
A summary of the Company's restricted stock award activity for the years ended December 31, 2011 and 2010 is presented below:
| |
Number of Restricted Stock Awards Outstanding |
Weighted Average Grant Date Fair Value |
Aggregate Intrinsic Value (in thousands) |
|||||||
|---|---|---|---|---|---|---|---|---|---|---|
Outstanding—January 1, 2010 |
— | $ | — | $ | — | |||||
Restricted stock awards granted |
30,572 | 17.34 | ||||||||
Restricted stock awards released |
(564 | ) | 17.70 | |||||||
Restricted stock awards forfeited |
(3,713 | ) | 18.69 | |||||||
Outstanding—December 31, 2010 |
26,295 | 17.15 | 405 | |||||||
Restricted stock awards granted |
— | — | ||||||||
Restricted stock awards released |
(22,695 | ) | 17.69 | |||||||
Restricted stock awards forfeited |
— | — | ||||||||
Outstanding—December 31, 2011 |
3,600 | $ | 13.73 | $ | 15 | |||||
A summary of the Company's restricted stock unit activity for the years ended December 31, 2011 and 2010 is presented below:
| |
Number of Restricted Stock Units Outstanding |
Weighted Average Grant Date Fair Value |
Aggregate Intrinsic Value (in thousands) |
|||||||
|---|---|---|---|---|---|---|---|---|---|---|
Outstanding—January 1, 2010 |
— | $ | — | $ | — | |||||
Restricted stock units granted |
224,800 | 15.13 | ||||||||
Restricted stock units released |
— | — | ||||||||
Restricted stock units forfeited |
(2,450 | ) | 15.13 | |||||||
Outstanding—December 31, 2010 |
222,350 | 15.13 | 3,429 | |||||||
Restricted stock units granted |
550,968 | 11.76 | ||||||||
Restricted stock units released |
(73,315 | ) | 15.86 | |||||||
Restricted stock units forfeited |
(54,318 | ) | 15.36 | |||||||
Outstanding—December 31, 2011 |
645,685 | $ | 12.24 | $ | 2,667 | |||||
The weighted average fair value as of the vesting date of RSUs was $15.86 for 2011. The majority of the RSUs that vested in 2011 were net-share settled such that the Company withheld shares with value equivalent to the employees' minimum statutory obligation for the applicable income and other employment taxes, and remitted the cash to the appropriate taxing authorities. The total shares withheld were 18,375, and were based on the value of the RSUs on their vesting date as determined by the Company's closing stock price. Total payments for the employees' tax obligations to the taxing authorities were $0.1 million. These net-share settlements had the effect of share repurchases by the Company as they reduced and retired the number of shares that would have otherwise been issued as a result of the vesting and did not represent an expense to the Company.
102
MERU NETWORKS, INC.
NOTES TO CONSOLIDATED FINANCIAL STATEMENTS (Continued)
15. Equity Incentive Plans (Continued)
Common Stock Subject to Repurchase—The Company has allowed employees to exercise options prior to vesting. The Company has the right to repurchase these options at the original purchase price paid by the employee for any unvested (but issued) shares of common stock upon the termination of the employee. The consideration received for an exercise of an option is considered to be a deposit of the exercise price and the related dollar amount is recorded as a liability on the consolidated balance sheets. The shares and liability are reclassified into equity on a pro rata basis as the options vest. The shares subject to repurchase are not deemed to be issued for accounting purposes until those shares vest.
The shares of common stock subject to repurchase issued pursuant to the exercise of options prior to vesting for the years ended December 31, 2011, 2010 and 2009 are as follows:
| |
Shares | |||
|---|---|---|---|---|
Shares subject to repurchase—January 1, 2009 |
11,114 | |||
Exercise of options prior to vesting |
3,366 | |||
Vesting of options exercised early |
(6,744 | ) | ||
Unvested shares repurchased |
(685 | ) | ||
Unvested shares—December 31, 2009 |
7,051 | |||
Exercise of options prior to vesting during the period |
3,373 | |||
Vesting of options exercised early during the period |
(7,058 | ) | ||
Options repurchased during the period |
(370 | ) | ||
Unvested shares—December 31, 2010 |
2,996 | |||
Vesting of options exercised early during the period |
(1,705 | ) | ||
Options repurchased during the period |
(1,187 | ) | ||
Unvested shares—December 31, 2011 |
104 | |||
Stock Option Activity for Non-employee Consultants—During the years ended December 31, 2011 and 2010, the Company issued options to nonemployees for the purchase of 2,000 and 28,653 shares of common stock in exchange for services. The Company did not issue options to purchase common stock to non-employees in 2009. These options were issued with an exercise price of $5.54 per share during the year ended December 31, 2011 and $9.10 per share during the year ended December 31, 2010. These options generally vest monthly over three months to four years. The Company accounts for nonemployee consultant options based on the fair value of the awards as they vest. The options were valued using the Black-Scholes option-pricing model using the remaining contractual term as the expected term.
During the year ended December 31, 2010, the remaining unvested shares of a nonemployee grant in the amount of 25,072 shares were cancelled in connection with the consultant becoming a director of the Company. In exchange for the cancellation of these options, the director was granted stock options and restricted stock awards with a total grant date fair value of $372,000 which resulted in an incremental value of $112,000. The total fair value of the options and restricted stock awards will be recognized as stock-based compensation over vesting periods of seven months to four years.
Total stock-based compensation related to nonemployees amounted to $2,000, $46,000 and $6,000 for the years ended December 31, 2011, 2010 and 2009.
103
MERU NETWORKS, INC.
NOTES TO CONSOLIDATED FINANCIAL STATEMENTS (Continued)
15. Equity Incentive Plans (Continued)
Employee Stock Purchase Plan—In March 2010, the Company's board of directors approved the 2010 Employee Stock Purchase Plan ("ESPP"). A total of 730,770 shares of common stock were reserved for future issuance under the ESPP, which became effective upon the closing of the Company's IPO. The price of the common stock purchased under the ESPP shall be the lower of 85% of the market value of the Company's common stock at the beginning of the offering period or 85% of the market value of the Company's common stock on the last trading day of the applicable offering period. On the first day of each of the Company's fiscal years, beginning on January 1, 2011, shares equal to the lesser of one percent (1%) of the outstanding shares of the Company on such date or a lesser amount determined by the Company's board of directors will be reserved for issuance under the ESPP; provided, however, that no annual increase shall be added more than ten years after March 30, 2010. In 2011, shares equal to one percent (1%) of the outstanding shares of the Company on January 1, 2011, or 163,378 shares, were registered and reserved for issuance under the ESPP.
The Company calculated the compensation expense for the ESPP using the Black-Scholes option-pricing model with the following weighted-average assumptions during the years ended December 31, 2011 and 2010:
| |
Years Ended December 31, |
||||||
|---|---|---|---|---|---|---|---|
| |
2011 | 2010 | |||||
Dividend rate |
0 | % | 0 | % | |||
Risk-free interest rate |
0.1 | % | 0.2 | % | |||
Expected life (in years) |
0.5 | 0.7 | |||||
Expected volatility |
56.5 | % | 62.0 | % | |||
The Company recognized compensation expense related to the ESPP in the amount of $0.6 million for each of the years ended 2011 and 2010. The Company issued 178,150 shares of common stock for $1.3 million during the year ended 2011. The Company issued 93,307 shares of common stock for $1.1 million during the year ended 2010. The Company had 622,691 shares of its common stock available for future issuance under the ESPP as of December 31, 2011.
16. Income Taxes
The Company's loss before provision for income taxes for the years ended December 31, 2011, 2010 and 2009 is as follows (in thousands):
| |
Years ended December 31, | |||||||||
|---|---|---|---|---|---|---|---|---|---|---|
| |
2011 | 2010 | 2009 | |||||||
Domestic |
$ | (27,670 | ) | $ | (37,176 | ) | $ | (17,995 | ) | |
International |
1,387 | 824 | 800 | |||||||
Loss before provision for income taxes |
$ | (26,283 | ) | $ | (36,352 | ) | $ | (17,195 | ) | |
104
MERU NETWORKS, INC.
NOTES TO CONSOLIDATED FINANCIAL STATEMENTS (Continued)
16. Income Taxes (Continued)
The components of the provision for income taxes for the years ended December 31, 2011, 2010 and 2009 are as follows (in thousands):
| |
Years ended December 31, |
|||||||||
|---|---|---|---|---|---|---|---|---|---|---|
| |
2011 | 2010 | 2009 | |||||||
Current |
||||||||||
Federal |
$ | — | $ | — | $ | (14 | ) | |||
State |
9 | 14 | 29 | |||||||
Foreign |
402 | 240 | 176 | |||||||
Total current |
411 | 254 | 191 | |||||||
Deferred |
||||||||||
Federal |
— | — | — | |||||||
State |
— | — | — | |||||||
Foreign |
— | — | — | |||||||
Total deferred |
— | — | — | |||||||
Total provision for income taxes |
$ | 411 | $ | 254 | $ | 191 | ||||
Reconciliations of the statutory federal income tax to the Company's effective tax for the years ended December 31, 2011, 2010 and 2009 are as follows (in thousands):
| |
Years ended December 31, | |||||||||
|---|---|---|---|---|---|---|---|---|---|---|
| |
2011 | 2010 | 2009 | |||||||
Tax at statutory federal rate |
$ | (8,938 | ) | $ | (12,361 | ) | $ | (5,846 | ) | |
State tax—net of federal benefit |
(1,302 | ) | (1,728 | ) | (972 | ) | ||||
Nondeductible expenses |
1,201 | 13,630 | 6,013 | |||||||
Foreign income rate differential |
(484 | ) | (289 | ) | (253 | ) | ||||
Foreign tax |
402 | 238 | 176 | |||||||
Credits |
(1,190 | ) | (523 | ) | 272 | |||||
Other |
519 | 341 | (487 | ) | ||||||
Valuation allowance changes affecting the tax provision |
10,203 | 946 | 1,288 | |||||||
Provision for income taxes |
$ | 411 | $ | 254 | $ | 191 | ||||
105
MERU NETWORKS, INC.
NOTES TO CONSOLIDATED FINANCIAL STATEMENTS (Continued)
16. Income Taxes (Continued)
Net deferred tax assets as of December 31, 2011 and 2010 consist of the following (in thousands):
| |
December 31, 2011 |
December 31, 2010 |
|||||
|---|---|---|---|---|---|---|---|
Deferred tax assets: |
|||||||
Depreciation and amortization |
$ | 9,733 | $ | 11,173 | |||
Accruals and other |
9,984 | 8,269 | |||||
Research credits |
4,990 | 3,800 | |||||
Net operating loss carryforward |
46,745 | 38,007 | |||||
Gross deferred tax asset |
71,452 | 61,249 | |||||
Valuation allowance |
(71,452 | ) | (61,249 | ) | |||
Net deferred tax assets |
$ | — | $ | — | |||
A valuation allowance is provided when it is more likely than not that the deferred tax assets will not be realized. The Company has established a valuation allowance to offset net deferred tax assets at December 31, 2011 due to the uncertainty of realizing future tax benefits from its net operating loss carryforwards and other deferred tax assets.
The valuation allowance increased by $10.2 million, $2.8 million, and $1.3 million during the years ended December 31, 2011, 2010, and 2009.
At December 31, 2011, the Company has federal and state net operating loss carryforwards of approximately $126.6 million and $113.5 million, respectively, expiring in 2022 and 2012, respectively.
As of December 31, 2011 the Company has federal and state research credit carryovers of approximately $3.7 million and $3.6 million, respectively, expiring beginning in 2018 for federal. California credits will carryforward indefinitely.
Internal Revenue Code section 382 places a limitation (the "Section 382 Limitation") on the amount of taxable income can be offset by net operating ("NOL") carryforwards after a change in control (generally greater than 50% change in ownership) of a loss corporation. California has similar rules. The Company's capitalization described herein may have resulted in such a change. Generally, after a control change, a loss corporation cannot deduct NOL carryfowards in excess of the Section 382 Limitation.
The Company has made no provision for U.S. income taxes on undistributed earnings of certain foreign subsidiaries because it is the Company's intention to permanently reinvest such earnings in its foreign subsidiaries. If such earnings were distributed, the Company would be subject to additional U.S. income tax expense. Determination of the amount of unrecognized deferred income tax liability related to these earnings is not practicable.
Uncertain Tax Positions
The Company files income tax returns in the U.S. federal jurisdiction and various state and foreign jurisdictions. The Company's tax years for 2002 and forward are subject to examination by the U.S. tax authorities and various state tax authorities. These years are open due to net operating losses and tax credits unutilized from such years. The Company's tax years for December 31, 2005 and forward are subject to examination by the major foreign taxing jurisdictions in which the Company is subject to tax.
106
MERU NETWORKS, INC.
NOTES TO CONSOLIDATED FINANCIAL STATEMENTS (Continued)
16. Income Taxes (Continued)
As of December 31, 2011, the Company had $1.9 million of cumulative unrecognized tax benefits of which $133,000 has an effect on the Company's effective tax rate.
A reconciliation of the beginning and ending unrecognized tax benefit amounts since adoption is as follows (in thousands):
Balance at January 1, 2009 |
$ | 1,272 | ||
Increase related to 2009 tax position |
194 | |||
Balance at December 31, 2009 |
1,466 | |||
Increase related to 2010 tax position |
119 | |||
Balance at December 31, 2010 |
1,585 | |||
Increase related to 2011 tax position |
364 | |||
Balance at December 31, 2011 |
$ | 1,949 | ||
17. Employee Benefit Plan
The Company has established a 401(k) tax-deferred savings plan (the "401(k) Plan") which permits participants to make contributions by salary deduction pursuant to Section 401(k) of the Internal Revenue Code. The Company is responsible for administrative costs of the 401(k) Plan and has made no contributions to the 401(k) Plan since inception.
18. Related-Party Transactions
The Company invested in a private company that is a related party. The investee is co-founded by Dr. Vaduvur Bharghavan, who is a member of the Company's board of directors. The total investment in this related party amounted to $1.3 million in 2011. See Note 5 for further discussion of this investment.
The Company has a reseller in Japan that is a related party. This reseller owned shares of the Company's stock during the years ended December 31, 2011, 2010 and 2009. The total revenue from this related party amounted to $0.9 million, $1.4 million and $1.8 million for years ended December 31, 2011, 2010 and 2009. Accounts receivable from the reseller were $74,000 and $156,000 as of December 31, 2011 and 2010.
The Company has a distributor in Japan that is a related party. This distributor owned shares of the Company's stock during the years ended December 31, 2011, 2010 and 2009. The total revenue from this related party amounted to $1.0 million, $662,000 and $409,000 for years ended December 31, 2011, 2010 and 2009. Accounts receivable from this distributor were $58,000 and $101,000 as of December 31, 2011 and 2010.
19. Information about Geographic Areas
The Company considers operating segments to be components of the Company in which separate financial information is available that is evaluated regularly by the Company's chief operating decision maker, or decision making group, in deciding how to allocate resources and in assessing performance. The chief operating decision maker for the Company is the Chief Executive Officer. The Chief Executive Officer reviews financial information presented on a consolidated basis, accompanied by
107
MERU NETWORKS, INC.
NOTES TO CONSOLIDATED FINANCIAL STATEMENTS (Continued)
19. Information about Geographic Areas (Continued)
information about revenue by geographic region, for purposes of allocating resources and evaluating financial performance. The Company has one business activity and there are no segment managers who are held accountable for operations, operating results or plans for levels or components below the consolidated unit level. Accordingly, the Company has determined that it has a single reporting segment and operating unit structure which is the development and marketing of wireless infrastructure solutions.
Revenues by geography are based on the billing address of the customer. The following table sets forth revenue by geographic area (in thousands):
Revenues
| |
Years ended December 31, | |||||||||
|---|---|---|---|---|---|---|---|---|---|---|
| |
2011 | 2010 | 2009 | |||||||
United States |
$ | 49,908 | $ | 54,072 | $ | 49,800 | ||||
Rest of Americas |
7,699 | 7,187 | 2,246 | |||||||
United Kingdom |
11,031 | 5,145 | 1,500 | |||||||
Rest of EMEA |
13,051 | 13,281 | 11,479 | |||||||
Asia Pacific |
8,782 | 5,319 | 4,469 | |||||||
Total |
$ | 90,471 | $ | 85,004 | $ | 69,494 | ||||
Long-Lived Assets
The following table sets forth long-lived assets by geographic area (in thousands):
| |
December 31, 2011 |
December 31, 2010 |
|||||
|---|---|---|---|---|---|---|---|
United States |
$ | 1,312 | $ | 649 | |||
India |
141 | 114 | |||||
Japan |
23 | — | |||||
Total |
$ | 1,476 | $ | 763 | |||
108
ITEM 9. CHANGES IN AND DISAGREEMENTS WITH ACCOUNTANTS ON ACCOUNTING AND FINANCIAL DISCLOSURE
None.
ITEM 9A. CONTROLS AND PROCEDURES
Evaluation of Disclosure Controls and Procedures
Our management, with the participation and supervision of our chief executive officer ("CEO") and our chief financial officer ("CFO"), has evaluated the effectiveness of our disclosure controls and procedures pursuant to Rules 13a-15 under the Securities Exchange Act of 1934, as amended (the "Exchange Act"). In designing and evaluating the disclosure controls and procedures, management recognizes that any controls and procedures, no matter how well designed and operated, can provide only reasonable assurance of achieving the desired control objectives. In addition, the design of disclosure controls and procedures must reflect the fact that there are resource constraints and that management is required to apply its judgment in evaluating the benefits of possible controls and procedures relative to their costs.
Based upon the aforementioned evaluation, our CEO and CFO have concluded that, as of December 31, 2011, our disclosure controls and procedures are designed at a reasonable assurance level and are effective to provide reasonable assurance that information we are required to disclose in reports that we file or submit under the Exchange Act is recorded, processed, summarized and reported within the time periods specified in the SEC rules and forms, and that such information is accumulated and communicated to our management, including our CEO and CFO, as appropriate to allow timely decisions regarding required disclosure.
Management Report on Internal Control Over Financial Reporting
Our management is responsible for establishing and maintaining adequate internal control over financial reporting (as defined in Rules 13a-15(f) and 15d-15(f) under the Exchange Act). Under the supervision and with the participation of our management, including our CEO and our CFO, we conducted an evaluation of the effectiveness of our internal control over financial reporting as of December 31, 2011 based on the guidelines established in Internal Control—Integrated Framework issued by the Committee of Sponsoring Organizations of the Treadway Commission (COSO). Based on the results of this evaluation, management has concluded that our internal control over financial reporting was effective as of December 31, 2011 to provide reasonable assurance regarding the reliability of financial reporting and the preparation of consolidated financial statements for external reporting purposes in accordance with accounting principles generally accepted in the United States. We reviewed the results of management's assessment with the Audit Committee of our Board of Directors. The effectiveness of our internal control over financial reporting as of December 31, 2011 has been audited by Burr Pilger Mayer, Inc., an independent registered public accounting firm, as stated in their report which appears herein.
109
REPORT OF INDEPENDENT REGISTERED PUBLIC ACCOUNTING FIRM
To
the Board of Directors and Stockholders
of Meru Networks, Inc.
We have audited the internal control over financial reporting of Meru Networks, Inc. and its subsidiaries (the "Company") as of December 31, 2011, based on criteria established in Internal Control—Integrated Framework issued by the Committee of Sponsoring Organizations of the Treadway Commission (COSO). The Company's management is responsible for maintaining effective internal control over financial reporting and for its assessment of the effectiveness of internal control over financial reporting, included in the accompanying Management's Annual Report on Internal Control over Financial Reporting. This is in Item 9A. Our responsibility is to express an opinion on the Company's internal control over financial reporting based on our audit.
We conducted our audit of internal control over financial reporting in accordance with the standards of the Public Company Accounting Oversight Board (United States). Those standards require that we plan and perform the audit to obtain reasonable assurance about whether effective internal control over financial reporting was maintained in all material respects. Our audit included obtaining an understanding of internal control over financial reporting, assessing the risk that a material weakness exists, testing and evaluating the design and operating effectiveness of internal control based on the assessed risk, and performing such other procedures as we considered necessary in the circumstances. We believe that our audit provides a reasonable basis for our opinion.
A company's internal control over financial reporting is a process designed to provide reasonable assurance regarding the reliability of financial reporting and the preparation of financial statements for external purposes in accordance with generally accepted accounting principles. A company's internal control over financial reporting includes those policies and procedures that (1) pertain to the maintenance of records that, in reasonable detail, accurately and fairly reflect the transactions and dispositions of the assets of the company; (2) provide reasonable assurance that transactions are recorded as necessary to permit preparation of financial statements in accordance with generally accepted accounting principles, and that receipts and expenditures of the company are being made only in accordance with authorizations of management and directors of the company; and (3) provide reasonable assurance regarding prevention or timely detection of unauthorized acquisition, use, or disposition of the company's assets that could have a material effect on the financial statements.
Because of its inherent limitations, internal control over financial reporting may not prevent or detect misstatements. Also, projections of any evaluation of effectiveness to future periods are subject to the risk that controls may become inadequate because of changes in conditions, or that the degree of compliance with the policies or procedures may deteriorate.
In our opinion, the Company maintained, in all material respects, effective internal control over financial reporting as of December 31, 2011, based on the COSO criteria.
We also have audited, in accordance with the standards of the Public Company Accounting Oversight Board (United States), the consolidated balance sheets of Meru Networks, Inc. and its subsidiaries as of December 31, 2011 and 2010, and the related consolidated statements of operations, convertible preferred stock and of stockholders' equity (deficit) , and cash flows for each of the three years in the period ended December 31, 2011, and the related financial statement schedule and our report dated March 15, 2012 expressed an unqualified opinion on those consolidated financial statements and the related financial statement schedule.
/s/ Burr Pilger Mayer, Inc.
San
Jose, California
March 15, 2012
110
None.
ITEM 10. DIRECTORS, EXECUTIVE OFFICERS AND CORPORATE GOVERNANCE
The information required by this item is incorporated by reference to our Proxy Statement for our 2011 Annual Meeting of Stockholders to be filed with the SEC within 120 days after the end of the fiscal year ended December 31, 2011.
We maintain a Code of Business Conduct and Ethics that incorporates our code of ethics applicable to all employees, including all officers. Our Code of Business Conduct and Ethics is published on the Investor Relations section of our website at investors.merunetworks.com. We intend to disclose future amendments to certain provisions of our Code of Business Conduct and Ethics, or waivers of such provisions granted to executive officers and directors, on this website within four business days following the date of such amendment or waiver.
ITEM 11. EXECUTIVE COMPENSATION
The information required by this item is incorporated by reference to our Proxy Statement for our 2012 annual Meeting of Stockholders to be filed with the SEC within 120 days after the end of the fiscal year ended December 31, 2011.
ITEM 12. SECURITY OWNERSHIP OF CERTAIN BENEFICIAL OWNERS AND MANAGEMENT AND RELATED STOCKHOLDER MATTERS
The information required by this item is incorporated by reference to our Proxy Statement for our 2012 annual Meeting of Stockholders to be filed with the SEC within 120 days after the end of the fiscal year ended December 31, 2011. For the information required by this item with respect to Item 201(d) of Regulation S-K regarding securities authorized for issuance under equity compensation plans, see "Item 5: Market for Registrant's Common Equity, Related Stockholder Matters and Issuer Purchases of Equity Securities—Equity Compensation Plan Information."
ITEM 13. CERTAIN RELATIONSHIPS AND RELATED TRANSACTIONS
The information required by this item is incorporated by reference to our Proxy Statement for our 2012 annual Meeting of Stockholders to be filed with the SEC within 120 days after the end of the fiscal year ended December 31, 2011.
ITEM 14. PRINCIPAL ACCOUNTANT FEES AND SERVICES
The information required by this item is incorporated by reference to our Proxy Statement for our 2012 Annual Meeting of Stockholders to be filed with the SEC within 120 days after the end of the fiscal year ended December 31, 2011.
111
ITEM 15. EXHIBITS and FINANCIAL STATEMENT SCHEDULES
- (a)
- The following documents are filed as part of this report:
(1) Financial Statements: the financial statements required by Item 15(a) are filed in Item 8 of this report, and listed on the index to financial statements.
(2) Financial Statement Schedules: the financial statement schedule required by Item 15(a) (Schedule II, Valuation and Qualifying Accounts) is included in this section of Form 10-K.
Schedule II "Valuation and Qualifying Accounts" should be read in conjunction with the Consolidated Financial Statements included in this report.
SCHEDULE II—VALUATION AND QUALIFYING ACCOUNTS
| |
Years Ended December 31, |
|||||||||
|---|---|---|---|---|---|---|---|---|---|---|
| |
2011 | 2010 | 2009 | |||||||
| |
(in thousands) |
|||||||||
Allowance for Doubtful Accounts: |
||||||||||
Beginning balance |
$ | 366 | $ | 430 | $ | 368 | ||||
Charged to costs and expenses |
143 | — | 80 | |||||||
Recovery of bad debt |
— | (61 | ) | — | ||||||
Bad debt write-offs |
(375 | ) | (3 | ) | (18 | ) | ||||
Ending balance |
$ | 134 | $ | 366 | $ | 430 | ||||
(3) Exhibits: the exhibits listed on the Exhibit Index are included or incorporated by reference as part of this Annual Report on Form 10-K.
112
Pursuant to the requirements of Section 13 or 15(d) of the Securities Exchange Act of 1934, the Registrant has duly caused this Report to be signed on its behalf by the undersigned, thereunto duly authorized.
Dated:
March 15, 2012
| MERU NETWORKS, INC. | ||||
By: |
/s/ IHAB ABU-HAKIMA Ihab Abu-Hakima President, Chief Executive Officer and Director (Principal Executive Officer) |
|||
MERU NETWORKS, INC. |
||||
By: |
/s/ BRETT T. WHITE Brett T. White Chief Financial Officer (Principal Financial and Accounting Officer) |
|||
KNOW ALL PERSONS BY THESE PRESENTS, that each person whose signature appears below constitutes and appoints Ihab Abu-Hakima and Brett White, and each of them, his attorneys-in-fact, each with the power of substitution, for him in any and all capacities, to sign any amendments to this Annual Report on Form 10-K, and to file the same, with exhibits thereto and other documents in connection therewith, with the Securities and Exchange Commission, hereby ratifying and confirming all that each of said attorneys-in-fact, or his substitute or substitutes, may do or cause to be done by virtue hereof.
Pursuant to the requirements of the Securities Exchange Act of 1934 this Annual Report on Form 10-K has been signed below by the following persons on behalf of the Registrant in the capacities and on the dates indicated.
Name
|
Title
|
Date
|
||
|---|---|---|---|---|
| /s/ IHAB ABU-HAKIMA Ihab Abu-Hakima |
President, Chief Executive Officer and Director (Principal Executive Officer) | March 15, 2012 | ||
/s/ BRETT WHITE Brett White |
Chief Financial Officer (Principal Financial and Accounting Officer) |
March 15, 2012 |
||
/s/ VADUVUR BHARGHAVAN Vaduvur Bharghavan |
Director |
March 15, 2012 |
113
Name
|
Title
|
Date
|
||
|---|---|---|---|---|
| /s/ HAROLD COPPERMAN Harold Copperman |
Director | March 15, 2012 | ||
/s/ CHUCK KISSNER Chuck Kissner |
Director |
March 15, 2012 |
||
/s/ STANLEY MERESMAN Stanley Meresman |
Director |
March 15, 2012 |
||
/s/ NICHOLAS MITSAKOS Nicholas Mitsakos |
Director |
March 15, 2012 |
||
/s/ BARRY NEWMAN Barry Newman |
Director |
March 15, 2012 |
||
/s/ WILLIAM QUIGLEY William Quigley |
Director |
March 15, 2012 |
114
| Exhibit No | Exhibit Title | Form | File No. | Exhibit | Filing Date |
Filed Herewith |
|||||||
|---|---|---|---|---|---|---|---|---|---|---|---|---|---|
| 3.1 | Form of Amended and Restated Certificate of Incorporation of Registrant, and amendments thereto. | S-1/A | 333-163859 | 3.1(b) | March 12, 2010 | ||||||||
3.2 |
Form of Amended and Restated Bylaws of Registrant. |
S-1/A |
333-163859 |
3.2(b) |
March 12, 2010 |
||||||||
4.1 |
Form of Common Stock Certificate |
S-1/A |
333-163859 |
4.1 |
March 12, 2010 |
||||||||
4.2 |
Amended and Restated Registration Rights Agreement between the Registrant and certain investors |
S-1/A |
333-163859 |
4.2 |
March 12, 2010 |
||||||||
4.3 |
Form of Warrant to Purchase Common Stock |
S-1/A |
333-163859 |
4.3 |
March 12, 2010 |
||||||||
4.4 |
Warrant to Purchase Series B Preferred Stock, as amended, issued to Venture Lending & Leasing IV, LLC. (exercisable for common stock) |
S-1/A |
333-163859 |
4.4 |
March 12, 2010 |
||||||||
4.5 |
Form of Class A Warrant to purchase Common Stock, as amended |
S-1/A |
333-163859 |
4.5 |
March 12, 2010 |
||||||||
4.6 |
Form of Class B Warrant to purchase Common Stock, as amended |
S-1/A |
333-163859 |
4.6 |
March 12, 2010 |
||||||||
4.7 |
Class A Warrant to purchase Common Stock, as amended, issued to Vision Opportunity Master Fund, Ltd. |
S-1/A |
333-163859 |
4.7 |
March 12, 2010 |
||||||||
4.8 |
Class A Warrant to purchase Common Stock, as amended, issued to Vision Opportunity Master Fund, Ltd |
S-1/A |
333-163859 |
4.8 |
March 12, 2010 |
||||||||
10.01 |
Transitional Employment Agreement |
8-K |
001-34659 |
10.01 |
October 6, 2011 |
||||||||
10.01 |
Patent Cross License Agreement |
8-K |
001-34659 |
10.01 |
June 16, 2011 |
||||||||
10.01 |
Meru Networks, Inc. 2012 Management Bonus Plan |
8-K |
001-34659 |
10.01 |
March 2, 2012 |
||||||||
10.02 |
Advisory Service Agreement between Ihab Abu-Hakima and Meru Networks, Inc. |
8-K |
001-34659 |
10.02 |
March 2, 2012 |
||||||||
10.1 |
Form of Indemnification Agreement between the Registrant and its officers and directors |
S-1/A |
333-163859 |
10.1 |
March 12, 2010 |
||||||||
10.2 |
Sublease Agreement, dated April 20, 2007 for 894 Ross Drive, Sunnyvale, California |
S-1 |
333-163859 |
10.7 |
December 18, 2009 |
||||||||
10.3 |
2010 Employee Stock Purchase Plan |
S-8 |
333-165827 |
99.1 |
March 31, 2010 |
||||||||
10.4 |
Forms of (a) Notice of Stock Option Grant, (b) Stock Option Agreement, (c) Notice of Cash Exercise of Stock Option, (d) Notice of Stock Unit Award, (e) Stock Unit Agreement, (f) Notice of Restricted Stock Award, and (g) Restricted Stock Agreement for 2010 Stock Incentive Plan |
S-8 |
333-168631 |
99.1 |
August 6, 2010 |
||||||||
99.01 |
Meru Networks, Inc. 2010 Stock Incentive Plan |
8-K |
001-34659 |
99.01 |
June 10, 2011 |
||||||||
10.5 |
Form of Severance and Change of Control Agreement |
10-Q |
001-34659 |
10.5 |
November 8, 2011 |
||||||||
10.6 |
Atheros Technology License Agreement by and between Atheros Communications, Inc. and the Registrant effective August 7, 2009 |
S-1/A |
333-163859 |
10.8 |
January 25, 2010 |
||||||||
115
| Exhibit No | Exhibit Title | Form | File No. | Exhibit | Filing Date |
Filed Herewith |
|||||||
|---|---|---|---|---|---|---|---|---|---|---|---|---|---|
| 10.7 | Lease dated as of June 11, 2010 between Meru Networks, Inc. and Hines VAF No Cal Properties, L.P. | 8-K | 001-34659 | 10.1 | June 17, 2010 | ||||||||
10.8 |
Term Loan and Security Agreement dated as of November 30, 2007 between Registrant and Silicon Valley Bank and the modifications related thereto |
S-1/A |
333-163859 |
10.5 |
March 26, 2010 |
||||||||
10.9 |
Fourteenth Loan Modification Agreement dated December 27, 2011 by and among Silicon Valley Bank and Meru Networks, Inc. |
x |
|||||||||||
21.1 |
List of Subsidiaries of the Registrant |
x |
|||||||||||
23.1 |
Consent of Independent Registered Public Accounting Firm |
x |
|||||||||||
31.1 |
Certification of the President and Chief Executive Officer pursuant to Exchange Act Rule 13a-14(a) or 15d-14(a), as adopted pursuant to Section 302(a) of the Sarbanes-Oxley Act of 2002. |
x |
|||||||||||
31.2 |
Certification of the Chief Financial Officer and Secretary pursuant to Exchange Act Rule 13a-14(a) or 15d-14(a), as adopted pursuant to Section 302(a) of the Sarbanes-Oxley Act of 2002. |
x |
|||||||||||
32.1 |
Certificate of President and Chief Executive Officer pursuant to 18 U.S.C. Section 1350, as adopted pursuant to Section 906 of the Sarbanes-Oxley Act of 2002. |
x |
|||||||||||
32.2 |
Certificate of Chief Financial Officer and Secretary pursuant to 18 U.S.C. Section 1350, as adopted pursuant to Section 906 of the Sarbanes-Oxley Act of 2002. |
x |
|||||||||||
101.INS |
XBRL Instance Document |
x |
|||||||||||
101.SCH |
XBRL Taxonomy Extension Schema Document |
x |
|||||||||||
101.DEF |
XBRL Taxonomy Extension Definition Linkbase Document |
x |
|||||||||||
101.CAL |
XBRL Taxonomy Calculation Linkbase Document |
x |
|||||||||||
101.LAB |
XBRL Taxonomy Label Linkbase Document |
x |
|||||||||||
101.PRE |
XBRL Taxonomy Extension Presentation Linkbase Document |
x |
|||||||||||
116