Attached files
| file | filename |
|---|---|
| EXCEL - IDEA: XBRL DOCUMENT - KOPIN CORP | Financial_Report.xls |
| EX-31.1 - SECTION 302 CEO CERTIFICATION - KOPIN CORP | d268820dex311.htm |
| EX-32.1 - SECTION 906 CEO CERTIFICATION - KOPIN CORP | d268820dex321.htm |
| EX-32.2 - SECTION 906 CFO CERTIFICATION - KOPIN CORP | d268820dex322.htm |
| EX-21.1 - SUBSIDIARIES OF KOPIN CORPORATION - KOPIN CORP | d268820dex211.htm |
| EX-31.2 - SECTION 302 CFO CERTIFICATION - KOPIN CORP | d268820dex312.htm |
| EX-10.18 - KOPIN CORPORATION FISCAL YEAR 2012 INCENTIVE BONUS PLAN - KOPIN CORP | d268820dex1018.htm |
| EX-23.1 - CONSENT OF INDEPENDENT REGISTERED PUBLIC ACCOUNTING FIRM - KOPIN CORP | d268820dex231.htm |
UNITED STATES
SECURITIES AND EXCHANGE COMMISSION
WASHINGTON, DC 20549
FORM 10-K
| x | ANNUAL REPORT PURSUANT TO SECTION 13 OR 15(d) OF THE SECURITIES EXCHANGE ACT OF 1934 |
For the fiscal year ended December 31, 2011
OR
| ¨ | TRANSITION REPORT PURSUANT TO SECTION 13 OR 15(d) OF THE SECURITIES EXCHANGE ACT OF 1934 |
For the transition period from to
Commission file number 0-19882
KOPIN CORPORATION
(Exact Name of Registrant as Specified in its Charter)
| Delaware | 04-2833935 | |
| (State or other jurisdiction of incorporation or organization) |
(I.R.S. Employer Identification No.) | |
| 200 John Hancock Rd., Taunton, MA | 02780-1042 | |
| (Address of principal executive offices) | (Zip Code) | |
| Registrant’s telephone number, including area code: |
(508) 824-6696 | |
| Securities registered pursuant to Section 12(b) of the Act: |
Common Stock, par value $.01 per share | |
| (Title of Class) | ||
| Name of each exchange on which registered |
NASDAQ Global Market | |
| Securities registered pursuant to Section 12(g) of the Act: |
None |
Indicate by check mark if the registrant is a well-known seasoned issuer, as defined in Rule 405 of the Securities Act. Yes ¨ No x
Indicate by check mark if the registrant is not required to file reports pursuant to Section 13 or Section 15(d) of the Act. Yes ¨ No x
Indicate by check mark whether the registrant (1) has filed all reports required to be filed by Section 13 or 15(d) of the Securities Exchange Act of 1934 during the preceding 12 months (or for such shorter period that the registrant was required to file such reports), and (2) has been subject to such filing requirements for the past 90 days. Yes x No ¨
Indicate by check mark whether the registrant has submitted electronically and posted on its corporate Web site, if any, every Interactive Data File required to be submitted and posted pursuant to Rule 405 of Regulation S-T (§232.405 of this chapter) during the preceding 12 months (or for such shorter period that the registrant was required to submit and post such files). x Yes ¨ No
Indicate by check mark if disclosure of delinquent filers pursuant to Item 405 of Regulation S-K is not contained herein, and will not be contained, to the best of registrant’s knowledge, in definitive proxy or information statements incorporated by reference in Part III of this Form 10-K or any amendment to this Form 10-K. ¨
Indicate by check mark whether the Registrant is a large accelerated filer, an accelerated filer, a non-accelerated filer, or a smaller reporting company. See definitions of “large accelerated filer”, “accelerated filer” and “smaller reporting company” in Rule 12b-2 of the Exchange Act. (Check one):
| Large Accelerated Filer ¨ |
Accelerated Filer x | Non-Accelerated Filer ¨ | Smaller Reporting Company ¨ |
Indicate by check mark whether the registrant is a shell company (as defined in rule 12b-2 of the Exchange Act). Yes ¨ No x
As of June 25, 2011 (the last business day of the most recent second fiscal quarter) the aggregate market value of outstanding shares of voting stock held by non-affiliates of the registrant was $304,717,934.
As of March 9, 2012, 67,016,963 shares of the registrant’s Common Stock, par value $.01 per share, were issued and outstanding.
DOCUMENTS INCORPORATED BY REFERENCE
Portions of the registrant’s definitive Proxy Statement relating to its 2012 Annual Meeting of Shareholders are incorporated by reference into Part III of this Annual Report on Form 10-K where indicated.
Part I
Forward Looking Statements
This Annual Report on Form 10-K contains forward-looking statements within the meaning of the United States Private Securities Litigation Reform Act of 1995, including, without limitation, statements made relating to our expectation that sales to Skyworks Solutions and the customers who use our displays for military applications will represent a significant portion of our revenues for 2012; our expectation that we will continue developing HBT transistor wafers and other gallium arsenide products for advanced integrated circuit applications from other compound materials; our expectation that we will continue to pursue other U.S. government development contracts for applications that relate to our commercial product applications; our expectation that sales of our III-V products for wireless handset applications and our display products for consumer electronic applications will decline; our belief that products using HBT transistor wafers are easier to design, which can translate into reduced component costs and smaller equipment; our expectation that we will prosecute and defend our proprietary technology aggressively; our belief that it is important to invest in research and development to remain profitable even during periods when we are not profitable; our belief that we are a leading developer and manufacturer of advanced semiconductor materials and miniature displays; our belief that our products enable our customers to develop and market an improved generation of products; our belief that there will be increased sales of 3G, 4G and smart phones in 2012; our statement that we may make equity investments in companies; our expectation that KoBrite will incur additional losses in the near term; our expectation that revenue will be between $110 million and $120 million for 2012; our expectation that 2012 revenues will primarily be to customers located in the U.S.; our belief that a strengthening of the U.S. dollar could increase the price of our products in foreign markets; our expectation that a manufacturing/distribution partner will commence selling Golden-i products in 2012; our expectation that we will not receive additional amounts from the sale of patents; our expectation that our CyberDisplay products will benefit from further general technological advances in the design and production of integrated circuits and active matrix LCDs, resulting in further improvements in resolution and miniaturization; our expectation that a significant reduction or delay in orders from any of our significant military customers could result in us not being able to achieve profitability in 2012; our belief that our HBT transistor wafers offer greater power efficiency, improved signal quality and less complexity over gallium arsenide field effect transistors; our belief that our manufacturing process offers greater miniaturization, reduced cost, higher pixel density, full color capability and lower power consumption compared to conventional active matrix LCD manufacturing approaches; our expectation not to pay cash dividends for the foreseeable future and to retain earnings for the development of our businesses; our expectation, based on current negotiations with our customers and certain contractual obligations, that the sales prices of certain products will decline in fiscal year 2012; our expectation that sales prices of our displays for military applications will remain relatively flat in 2012; our plan to base production and inventory levels based on internal forecasts of customer demands; our belief that the overall increase or decrease in the average sales price of our display products will be dependent on the sales mix of commercial and military display sales; our belief that we may have impairment charges on Kowon’s long-lived assets; our expectation that we will expend between $5.0 and $8.0 million on capital expenditures over the next twelve months; our intent to reduce our per unit production costs primarily through increasing manufacturing yield, lowering fixed costs per unit through increased sales volume, and increasing productivity and efficiency; our expectation that the market for display products for military applications will not be seasonal; our expectation that prices of our HBT transistor and display products sold for consumer electronic applications will decline by approximately 5 to 7 percent during fiscal year 2012, but may decline more depending on final negotiations with our customers; our expectation that competition will increase; our belief that our CyberDisplay products are well suited for new applications such as reading e-mail and browsing the Internet using digital wireless devices and other consumer electronics devices; our belief that small form factor displays will be a critical component in the development of advanced wireless communications systems; our belief that general technological advances in the design and fabrication of integrated circuits, LCD technology and LCD manufacturing processes will allow us to continue to enhance our CyberDisplay product manufacturing process; our expectation that a significant market for new wireless communication devices, including personal entertainment systems, will develop; our belief that continued introduction of new products in
2
our target markets is essential to our growth; our belief that our future success will depend primarily upon the technical expertise, creative skills and management abilities of our officers and key employees rather than on patent ownership; our belief that our available cash resources will support our operations and capital needs for at least the next twelve months; and our belief that the effect, if any, of reasonably possible near-term changes in interest rates on our financial position, results of operations, and cash flows should not be material. These forward-looking statements are based on current expectations, estimates, forecasts and projections about the industries in which we operate, management’s beliefs, and assumptions made by management. In addition, other written or oral statements, which constitute forward-looking statements, may be made by or on behalf of us. Words such as “expects”, “anticipates”, “intends”, “plans”, “believes”, “could”, “seeks”, “estimates”, and variations of such words and similar expressions are intended to identify such forward-looking statements. These statements are not guarantees of future performance and involve certain risks, uncertainties and assumptions, which are difficult to predict. Therefore, actual outcomes and results may differ materially from what is expressed or forecasted in such forward-looking statements, whether as a result of new information, future events or otherwise. Factors that could cause or contribute to such differences in outcomes and results include, but are not limited to, those discussed below in Item 1A and those set forth in our other periodic filings filed with the Securities and Exchange Commission.
| Item 1. | Business |
Introduction
We were incorporated in Delaware in 1984 and are a leading developer and manufacturer of III-V products and miniature flat panel displays. We use our proprietary semiconductor material technology to design, manufacture and market our products. Our products enable our customers to develop and market an improved generation of products for applications in wireless and consumer electronic devices. Our fiscal year ends on the last Saturday in December. The fiscal years ended December 31, 2011, December 25, 2010 and December 26, 2009 are referred to herein as fiscal years 2011, 2010 and 2009, respectively. Our principal executive offices are located at 200 John Hancock Road, Taunton, Massachusetts. Our telephone number is (508) 824-6696.
We commercially develop and manufacture Gallium Arsenide-based heterojunction bipolar transistor wafers (HBT transistor wafers) and other commercial semiconductor products that use Gallium Nitride and Gallium Arsenide-based substrates. We collectively refer to our products based on compound semiconductor materials, which primarily consists of our HBT transistor wafers, as our “III-V” products because we use elements categorized on the III and V columns of the periodic table of elements to manufacture such products. Our HBT transistor wafers are customer-specific arrays of vertically oriented transistors that our customers use primarily to produce high performance integrated circuits for wireless communications products. Sales of our HBT transistor wafers to Skyworks Solutions, Inc. (Skyworks Solutions) accounted for approximately 28%, 25% and 20% of our total revenues for fiscal years 2011, 2010 and 2009, respectively. Skyworks Solutions also uses the foundry services of Advanced Wireless Semiconductor Company (AWSC) to process our HBT transistor wafers on its behalf. We sell HBT transistor wafers directly to AWSC for eventual resale by AWSC to Skyworks Solutions and its other customers. Although we do not know exactly how much of our sales to AWSC are for Skyworks we believe an investor should view our sales to Skyworks Solutions and AWSC in the aggregate when evaluating the importance of Skyworks Solutions as a customer to Kopin. Sales to AWSC were 9%, 12% and 8%, of our 2011, 2010 and 2009 revenues, respectively. In addition to Skyworks Solutions, original equipment manufacturers such as RF Micro Devices and TriQuint Semiconductor purchase our HBT transistor wafers.
Our CyberDisplay™ products consist of miniature, high performance, high resolution displays either sold separately or in various configurations with optical lenses and electronics contained in either plastic or metal housings. Current applications which include our CyberDisplay products are military devices such as thermal weapon sights and consumer devices such as camcorders, digital cameras, and devices that are capable of browsing the Internet using digital wireless devices and viewing video from other consumer electronics devices such as MP3 or iPod™ storage devices. We have sold our CyberDisplay product to Samsung Electronics Co., Ltd. (Samsung) for use in digital camcorders, Eastman Kodak Company (Kodak), Olympus Corporation
3
(Olympus) and Fuji Corporation (Fuji) for digital still cameras and DRS Technologies, BAE Systems (through a third party QiOptic), Raytheon and ITT for use in military applications. For fiscal years 2011, 2010 and 2009, significant display customers were as follows: (Note the caption “Military Customers in Total” in the table below includes Raytheon, DRS Technologies and QiOptic but excludes research and development contracts (“*” denotes that the customer’s revenues were less than 10% of our total company revenues))
| Customer |
Percent of Total Revenues |
|||||||||||
| 2011 | 2010 | 2009 | ||||||||||
| Military Customers in Total |
30 | % | 33 | % | 45 | % | ||||||
| Raytheon Company |
12 | % | 18 | % | 14 | % | ||||||
| DRS Technologies |
* | * | 19 | % | ||||||||
Our Golden-i™ product is a head worn computer headset which we developed that includes a microprosessor and an optical pod which includes a CyberDisplay product. In 2010, we entered into a license agreement with a customer who acquired the exclusive rights to develop Golden-i products for the industrial market. In 2011 we commenced selling Golden-i Developer Kits which provided the basic functionality in order to spur interest from potential end customers of our licensee and also software application developers. Sales of the Golden-i Developer Kits were diminimis in 2011 and we do not expect significant revenue from this product in 2012.
Industry Overview
III-V Products
Advanced semiconductor materials are used in the manufacture of integrated circuits for high frequency, low power applications. The rapid growth in the wireless communications industry has fueled demand for these integrated circuits for use in wireless handsets.
In first generation wireless handsets, integrated circuits used in high frequency, low power amplifiers were generally constructed with silicon-based semiconductors. These integrated circuits, while relatively inexpensive to manufacture, were unable to deliver the ever increasing performance demanded by wireless handset manufacturers and their customers. This inability led to the development of gallium arsenide products for use in wireless communications. Gallium arsenide is generally regarded as having better performance characteristics than silicon due, in part, to its inherent physical properties that permit gallium arsenide integrated circuits to operate at much higher frequencies than silicon integrated circuits, or operate at the same frequency with lower power consumption. The reduction in system power requirements is particularly important in portable applications, such as wireless handsets, because it extends battery life.
The high performance characteristics of gallium arsenide have led to an increased use of gallium arsenide-based transistors to satisfy the industry’s need for even greater performance. Since the mid 1990s these gallium arsenide transistors include our HBT transistor wafer for use in wireless handset products which use digital signal processing and generally operate at higher cellular frequencies. Air interface standards in these frequency bands include Global System Mobile, or GSM, Time Division Multiple Access, or TDMA, and Code Division Multiple Access, or CDMA, and provide improved capacity, sound quality and capabilities at cellular and wireless frequency bands, but are incompatible with each other and have fragmented the market for equipment. Suppliers of wireless handsets now offer multi-mode and multi-band wireless handsets which are capable of switching from one high frequency band to another to enable consumers to use wireless handsets across various territories and different interface standards. This new generation of products is significantly more complex than the prior generation and requires certain key features, including:
| • | Simpler system design; |
| • | Support for higher frequencies; |
4
| • | Lower power consumption; |
| • | Improved signal quality; and |
| • | Wider range of operating temperatures. |
CyberDisplay™ Products
Small form factor displays are used in military, consumer electronic and industrial products such as thermal weapon sights, camcorders and digital cameras. We expect the market for wireless communications devices, including personal entertainment systems, will continue to grow. In order for this market to develop, advances in wireless communications systems such as greater bandwidth and increased functionality, including real-time wireless data, broadband Internet access and mobile television, will be necessary. We believe small form factor displays will be a critical component in the development of advanced mobile wireless communications systems as these systems must provide high resolution images without compromising the portability of the product.
There are several display technologies currently available. The most commonly used technology in portable applications is based on the traditional liquid crystal display, or LCD, which is now in widespread use in products requiring a solid state monochrome or color display. These displays form an image by either transmitting or blocking light emitted from a source located behind the LCD. The principal LCD technologies are passive and active matrix.
| • | Passive Matrix LCD. These displays are primarily used in calculators, watches, pagers and wireless handsets because of their relatively low cost and low power consumption. Their relatively low image quality, slow response time and limited viewing angle, however, make them inadequate for many demanding applications. |
| • | Active Matrix LCD. These displays are used primarily in laptop computers, instrumentation and projection systems. These displays are also being introduced on wireless handsets and storage devices such as Apple’s iPods™. In contrast to passive matrix LCDs, monochrome active matrix LCDs incorporate a transistor at every pixel location and color active matrix LCDs incorporate three transistors at every pixel location. This arrangement allows each pixel to be turned on and off independently which improves image quality and response time and also provides an improved side-to-side viewing angle of the display. The increased number of transistors required to produce those benefits, however, creates significant drawbacks, particularly in color applications. The high number of transistors used in conventional active matrix LCDs limits achievable pixel density and their relatively high power consumption makes them difficult to use in high information content ultra-portable electronics products. |
We believe that the high growth potential for portable communications products can be realized effectively only if these products are available at a reasonable price and are able to clearly present to end users the information they wish to access without compromising the size of the product. These products, as well as future models of digital cameras and other consumer electronics, are well suited for the use of a miniature, low cost display with low power consumption and sharp monochrome or rich, full color high resolution images. To date, display technologies have not fully addressed these needs due to constraints with respect to size, power consumption, resolution, cost or full color capability.
Golden-i™ Products
Laptop computers, PCs and tablets are used in the work place as stand alone devices or as part of systems. These devices require the user to operate a key board for data input and information retrieval. If the user of these devices works outdoors or in environments with similar conditions the device may have to be “ruggedized”, which adds weight, increases its size and adds cost. The display performance of these devices is affected by ambient lighting conditions. In addition if the user is required to wear gloves in the performance of their responsibilities the use of the key board may be inefficient.
5
Our Solution
III-V Products
We manufacture our HBT transistor wafers using our proprietary metal organic chemical vapor deposition (MOCVD) semiconductor growth techniques and our Wafer Engineering™ process. Our Wafer Engineering™ process significantly reduces the number of defects which naturally occur when different semiconductor materials are combined. By depositing films of atomic-level thickness on gallium arsenide or indium phosphide wafers, we are able to create HBT transistor wafers that consist of a series of material layers which form a vertical transistor. This transistor structure enables the design of integrated circuits in which individual transistors are vertically arranged.
We believe that the vertical structure of an HBT transistor offers the following advantages to an integrated circuit manufacturer:
| • | Smaller Size. We believe integrated circuits fabricated from our HBT transistor wafers can be made smaller than integrated circuits fabricated from gallium arsenide field effect transistors. Smaller size enables more die per wafer, which can increase manufacturing yields and lead to reduced costs. |
| • | Faster Circuits. We believe our HBT transistor wafers enable the design of faster integrated circuits than may be designed with gallium arsenide field effect transistors because the effective transistor gate length, or the distance an electron must travel within a transistor, is shorter. The transistor gate length of gallium arsenide field effect transistors is constrained by current optical lithography techniques to approximately 0.13 microns for commercial volumes. We currently manufacture our HBT transistor wafers in commercial volumes with an effective transistor gate length ranging from approximately 0.05 microns to 0.1 microns. We are able to achieve this result because the thickness of the vertical base layer of our HBT transistor wafers determines transistor gate length rather than the limitations of current optical lithography techniques. |
We believe our HBT transistor wafers also offer the following additional advantages over gallium arsenide field effect transistors:
| • | Greater Power Efficiency. Efficiency is a measure of power output as a percentage of battery power consumed by the device. We believe our HBT transistor wafers are more efficient and use less power to transmit the same output power than comparable gallium arsenide field effect transistors. Increased efficiency can translate into improved battery life and increased talk time. |
| • | Improved Signal Quality. Power amplifiers within wireless handsets are a key determinant of signal quality. We believe that power amplifiers based on our HBT transistor wafers can amplify signals with reduced distortion, providing increased signal quality. Improved signal quality is important for wireless networks that use digital air interface standards such as Time Division Multiple Access, or TDMA, and Code Division Multiple Access, or CDMA. |
| • | Less Complexity. Power amplifiers and other integrated circuits based on our HBT transistor wafers run on a single power supply voltage. In contrast, gallium arsenide field effect transistors generally require both a positive and negative power supply, which results in the need to include a negative voltage generator and other additional components or circuitry in the end product. As a result, we believe products using our HBT transistor wafers are easier to design, which can translate into reduced component costs and smaller equipment. |
CyberDisplay™ Products
Our principal CyberDisplay products are miniature high density color or monochrome active matrix LCDs with resolutions which range from approximately 320 x 240 resolution to 1280 x 1024 resolution, a device with a single display, backlight and optics in a plastic housing which we call an Electronic Viewfinder or EVF, a device which contain two CyberDisplays, light emitting diodes, optics and electronics in a plastic housing which we call
6
a Binocular Display Module or BDM, and thermal weapon sight eyepieces which contain a CyberDisplay, light emitting diode, optics, and electronics in a hermetically sealed housing. In contrast to current passive matrix and active matrix LCD approaches, our CyberDisplay products utilize high quality, single crystal silicon—the same high quality silicon used in conventional integrated circuits. This single crystal silicon is not grown on glass; rather, it is first formed on a silicon wafer and patterned into an integrated circuit (including the active matrix, driver circuitry and other logic circuits) in an integrated circuit foundry. The silicon wafer is then sent to our facilities and the integrated circuit is lifted off as a thin film and transferred to glass using our proprietary Wafer™ Engineering technology, so that the transferred layer is a fully functional active matrix integrated circuit.
Our proprietary technology enables the production of transparent circuits on a transparent substrate, in contrast to conventional silicon circuits, which are on an opaque substrate. Our CyberDisplay products’ imaging properties are a result of the formation of a liquid crystal layer between the active matrix integrated circuit glass and the transparent glass. We believe our manufacturing process offers several advantages over conventional active matrix LCD manufacturing approaches with regard to small form factor displays, including:
| • | Greater miniaturization; |
| • | Higher pixel density; |
| • | Full color capability; and |
| • | Lower power consumption. |
Our use of high quality single crystal silicon in the manufacture of our CyberDisplay products offers several performance advantages. The color CyberDisplay displays we sell generate colors by using color filters with a white backlight. Color filter technology is a process in which display pixels are patterned with materials, which selectively absorb or transmit the red, green or blue colors of light.
Our CyberDisplay displays have the additional advantage of being fabricated using conventional silicon integrated circuit lithography processes. These processes enable the manufacture of miniature active matrix circuits, resulting in comparable or higher resolution displays relative to passive and other active matrix displays that are fabricated on glass. Our production partners, United Microelectronics Corporation, or UMC, and MagnaChip, fabricate integrated circuits for our CyberDisplay displays in their foundries in Taiwan and Korea, respectively. The fabricated wafers are then returned to our facilities, where we lift the integrated circuits off the silicon wafers and transfer them to glass using our proprietary technology. The transferred integrated circuits are then processed and packaged with liquid crystal at our Westborough, Massachusetts facility. The packaged units are then assembled into display panels at our Seoul Korea facility, Kowon Technology Co., Ltd. (Kowon), if the display is to be used in a commercial application or at our Westborough, Massachusetts facility if the display is to be used in a military application, and shipped to customers. This arrangement allows us to benefit from UMC’s and MagnaChip’s economies of scale and advanced fabrication processes. We expect our CyberDisplay displays will benefit from further general technological advances in the design and production of integrated circuits and active matrix LCDs, resulting in further improvements in resolution and miniaturization.
After the CyberDisplay display has been packaged and if it is to be used in a weapon sight such as a thermal weapon sight, the packaged display is sent to our “Higher Level Assembly” or HLA, where it is incorporated in to a module we manufacture. We offer a variety of models with varying levels of complexity but common to all is a light emitting diode, optics and electronics in a housing unit.
Golden-i™ Technology
Our Golden-i™ technology is a head –worn computer headset that we developed that includes an optical pod which includes a CyberDisplay product, a microprocessor, memory and various software packages we licensed that are managed by an operating software we developed. The Golden-i product is placed on the user’s head as a stand alone unit or may be incorporated with a “hard” hat and performs its functions through voice
7
commands and head gestures. The system allows the user to access information or operate remote devices through the internet using WiFi or Bluetooth or potentially other wireless networks. The optical pod allows the user to view information such as technical diagrams, streaming video or face to face communication. When viewing schematics or similar documents the user is capable of zooming-in to see finer details or zooming out to see an entire system perspective. The Golden-i product has a camera feature which enables the user to stream live video to a Remote Subject Matter Expert so that both the user and expert can analyze the issue at the same time. Our Golden-i products are significantly lighter than competing solutions such as laptops, PCs or tablets. We believe our Golden-i technology will provide for increased worker productivity, safety and improved manufacturing quality through more efficient issue resolution and improved communication.
Strategy
Our strategy is to develop products which are centered on the mobile world. Our III-V products improve the speed and volume of voice and data which can be transmitted wirelessly to mobile devices such as 3G and 4G smartphones, our micro display was created to be the destination point for the data flowing over the wireless networks and our Golden-i device is designed to provide a hands-free remote access, control and collaboration via the internet through the wireless networks. Our objective is to be the leading supplier of advanced semiconductor materials and miniature displays and display systems that enable our customers to develop and manufacture differentiated communications, military, industrial and consumer electronic devices in high volumes. The critical elements of our strategy include:
| • | Maintain Our Technological Leadership. We believe our ability to develop innovative products based on our extensive materials science expertise enhances our opportunity to grow within our targeted markets. By continuing to invest in research and development, we are able to add to our expertise in the design of HBT transistor wafers, and innovative, high-resolution, miniature flat panel displays. We intend to continue to focus our development efforts on our proprietary HBT transistor wafers and miniature displays. |
| • | Increase the Number of Product Designs That Use Our Components. Our goal is to grow sales of our components and systems by increasing the number and type of products into which they are incorporated. Our product lines are subject to long design lead-times and we work closely with our customers to help them design and develop cost-effective products based on our III-V and CyberDisplay products. We use an aggressive pricing strategy as an inducement for manufacturers of consumer electronics and wireless communications products to integrate our products into their products. |
| • | Reduce Production Costs. We intend to reduce our per unit production costs primarily through increasing manufacturing yield, lowering fixed costs per unit through increased sales volume, and increasing productivity and efficiency. We plan to increase productivity and efficiency by migrating the CyberDisplay production line which uses 6 inch diameter wafers to a production line which uses 8 inch diameter wafers, and shifting III-V production from primarily production on 4 inch wafers to 6 inch wafers and consolidating facilities. |
| • | Leverage Integrated Circuit and Display Technologies and Infrastructure. We will continue to leverage our use of standard integrated circuit fabrication and LCD packaging technologies to achieve greater production capacity and to reduce capital investment and process development costs. Our use of these technologies allows us to engage third party manufacturers for certain portions of the fabrication of our CyberDisplay products and to take advantage of new technologies, cost-efficiencies and increased production capabilities of these third party manufacturers. We believe that general technological advances in the design and fabrication of integrated circuits, LCD technology and LCD manufacturing processes will allow us to continue to enhance our CyberDisplay product manufacturing process. |
8
Markets and Customers
III-V Products
We develop and manufacture customer and application specific HBT transistor wafers for advanced integrated circuit applications. We believe we are one of the world’s leading suppliers of HBT transistor wafers and currently support volume production of four-inch and six-inch HBT transistor wafers. Our primary HBT transistor wafer products are based on indium gallium arsenide (InGaP), aluminum gallium arsenide (AlGaAs) and gallium nitride (GaN) vertical layer structures. We also offer customers pseudomorphic high electron mobility transistors (pHEMT) and BiHEMTs, a product which combines the HBT and pHEMTs into a single structure. We vary our manufacturing process to create customized HBT transistor wafer products for customers. For fiscal years 2011, 2010 and 2009, sales of III-V products accounted for 51%, 52% and 40% of our revenues, respectively.
Using our HBT transistor wafers, our customers have developed gallium arsenide power amplifiers for wireless handsets. Our HBT transistor wafers are used in Code Division Multiple Access, Global System Mobile and Time Division Multiple Access power amplifiers, third generation (3G) and fourth generation (4G) wireless handset standards.
In addition to wireless handset power amplifiers, our HBT transistor wafers are also being used in the fabrication of power amplifiers for devices which communicate using wireless fidelity or “WiFi” integrated circuits. Our HBT transistor wafers are also used in high-speed fiber optic switching.
We design our HBT transistor wafers in collaboration with our customers’ engineering teams in order to create customized products that meet their specific application needs. Our largest customer for our HBT transistor wafers is Skyworks Solutions. Skyworks Solutions also uses the foundry services of Advanced Wireless Semiconductor Company to process our HBT transistor wafers on its behalf. We sell HBT transistor wafers directly to AWSC for eventual resale by AWSC to Skyworks Solutions and their other customers. Other customers of our gallium arsenide products include RF Micro Devices and TriQuint Semiconductor. For fiscal years 2011, 2010 and 2009, sales of gallium arsenide products to Skyworks Solutions accounted for approximately 28%, 25%, and 20% of our total revenues, respectively. Sales to AWSC in 2011, 2010 and 2009 were 9%, 12% and 8% of our 2011, 2010 and 2009 revenues, respectively. Although we do not know exactly how much of our sales to AWSC are for products sold to Skyworks Solutions, we believe an investor should view our sales to Skyworks Solutions and AWSC in the aggregate for evaluating the importance of Skyworks Solutions as a customer to Kopin. We have a supply agreement with Skyworks Solutions which is scheduled to terminate in July 2012, excluding the agreement’s last buy option.
CyberDisplay™ Products
We currently sell our CyberDisplay products to our customers as either a single display component, a unit which includes a lens and backlight (referred to as an electronic view finder or EVF), or a complete module, which includes the display, lens, backlight, focus mechanism and electronics, which are assembled in a plastic or metal housing (referred to as a binocular display module or BDM for commercial customers and higher level assemblies or HLA for military customers). Eyewear is the term we use to describe a device which is worn in a similar fashion as eye glasses to view images. Our customers either buy individual displays or a BDM from us to create an Eyewear product. We provide our CyberDisplay products to Samsung, Olympus, Fuji and Sanyo for use in digital camcorders and cameras and to the U.S. military and certain foreign governments for use in military applications.
In order for our CyberDisplay products to function properly in their intended applications, integrated circuit chip sets generally are required. Several companies have designed integrated circuit chip sets to work with our CyberDisplay products and our customers can procure these chip sets directly from the manufacturer or through us.
9
For fiscal years 2011, 2010 and 2009, sales to military customers, excluding research and development contracts, as a percentage of total revenue were 30%, 33% and 45%, respectively.
For fiscal years 2011, 2010 and 2009, research and development revenues, primarily from multiple contracts with various U.S. governmental agencies, accounted for approximately 4%, 3% and 6%, respectively, of our total revenues.
Golden-i™ Products
Our business model is to generate revenues by licensing for a royalty fee the Golden-i technology and knowhow, which includes the operating software and patented product designs, and selling a CyberDisplay product to a partner who develops and manufactures or distributes products based on the Golden-i technology. Our revenues in 2011 from the sale of Golden-i Development Kits were not significant and while we anticipate our licensee customer will introduce a product in 2012, we do not believe the revenues will be material in 2012.
For additional information with respect to our operating segments including sales and geographical information, see footnote 13 to our Financial Statements for the year ended December 31, 2011 included with this Form 10-K.
Sales and Marketing
We principally sell our III-V products directly to integrated circuit manufacturers in the United States and Asia. We sell our consumer electronic CyberDisplay products both directly and through distributors to original equipment manufacturers. We sell our military CyberDisplay products directly to prime contractors of the U.S. government or foreign governments. Our strategy is to license our Golden-i technology to customers who will develop end user products. For both our III-V and CyberDisplay products we have a few customers who purchase in large volumes and many customers who buy in small volumes as part of their product development efforts. “Large volume” is a relative term. For consumer display customers purchases may be in the tens of thousands per week whereas military customers may purchase less than two thousand per month.
We believe that the technical nature of our products and markets demands a commitment to close relationships with our customers. Our sales and marketing staff, assisted by our technical staff and senior management, visit prospective and existing customers worldwide on a regular basis. We believe these contacts are vital to the development of a close, long-term working relationship with our customers, and in obtaining regular forecasts, market updates and information regarding technical and market trends. We also participate in industry specific trade shows and conferences.
Our design and engineering staff is actively involved with a customer during all phases of prototype design and production by providing engineering data, up-to-date product application notes, regular follow-up and technical assistance. In most cases, our technical staff works with each customer in the development stage to identify potential improvements to the design of the customer’s product in parallel with the customer’s effort. We have established a prototype product design group in Scotts Valley, California to assist our military CyberDisplay and Golden-i customers with incorporating our products into their products and to accelerate their design process, achieving cost-effective and manufacturable products, and ensuring a smooth transition into high volume production. This group is also actively involved with research and development contracts for military applications.
Product Development
We believe that continued introduction of new products in our target markets is essential to our growth. Our commercial display products tend to have one to three year life cycles. We have assembled a group of highly skilled engineers who work internally as well as with our customers to continue our product development efforts. For the Golden-i products we develop software using both internal and external resources. For fiscal years 2011,
2010 and 2009 we incurred total research and development expenses of $25.9 million, $19.7 million and $14.1
10
million, respectively. Included in total research and development expenses are our internal development programs for new HBT and CyberDisplay products and development of the processes to manufacture CyberDisplay products using 8 inch wafers, which were $22.1 million, $17.0 million and $10.6 million, respectively, for fiscal years 2011, 2010 and 2009.
III-V Products
We intend to continue developing HBT transistor wafers and other gallium arsenide products for advanced integrated circuit applications from other compound materials. We are working with current and potential customers in the development of the next generation of HBT transistor wafers, including developing GaN (Gallium Nitride) HEMT (high electron mobility transistor) wafers.
CyberDisplay™ Products
Our product development efforts are focused towards continually enhancing the resolution, performance and manufacturability of our CyberDisplay products. A principal focus of this effort is the improvement of manufacturing processes for very small active matrix pixels with our eight inch line, which we will use in succeeding generations of our CyberDisplay products. The pixel size of our current CyberDisplay products ranges from 8.4 to 15 microns. These pixel sizes are much smaller than a pixel size of approximately 100 microns in a typical laptop computer display. The resolutions of our current commercially available CyberDisplay products are 320 x 240, 432 x 240, 640 x 480, 854 x 480, 800 x 600 and 1,280 x 1,024 pixels. In addition, we have demonstrated 2,048 x 2,048 resolution displays in a 0.96-inch diagonal size. We are also working on further decreasing the power consumption of our CyberDisplay products. Additional display development efforts include expanding the resolutions offered, increasing the quantity of CyberDisplay’s active matrix pixel arrays processed on each wafer by further reducing the display size, increasing the light throughput of our pixels, increasing manufacturing yields, and increasing the functionality of our HLA products.
Golden-i™ Products
Our product development efforts are primarily focused on operating and application software development, improving the optics of the display pod and reducing the size and power consumption of the unit.
Funded Research and Development
We have entered into various development contracts with agencies and prime contractors of the U.S. government. These contracts help support the continued development of our core technologies. We intend to continue to pursue U.S. government development contracts for applications that relate to our commercial and military product applications. Our contracts with U.S. government agencies and prime contractors to the U.S. government contain certain milestones relating to technology development and may be terminated by the government agencies prior to completion of funding. Our policy is to retain our proprietary rights with respect to the principal commercial applications of our technology. To the extent technology development has been funded by a U.S. federal agency, under applicable U.S. federal laws the federal agency has the right to obtain a non-exclusive, non-transferable, irrevocable, fully paid license to practice or have practiced this technology for governmental use. Revenues attributable to research and development contracts for fiscal years 2011, 2010 and 2009 totaled $5.7 million, $3.8 million and $6.5 million, respectively.
Competition
III-V Products
With respect to our HBT transistor wafers, we presently compete with several companies, including IQE, Visual Photonics Epitaxy Co. Ltd. (VPEC), and Hitachi Cable, as well as integrated circuit manufacturers with in-house transistor growth capabilities, such as RF Micro Devices and Fujitsu. For our III-V products, pricing
11
competition is intense. The production of gallium arsenide integrated circuits has been and continues to be more costly than the production of silicon integrated circuits. Although we have reduced production costs of our HBT transistor wafers by achieving higher volumes and reducing raw material costs, we cannot be certain we will be able to continue to decrease production costs. In addition, we believe the costs of producing gallium arsenide integrated circuits by our customers will continue to exceed the costs associated with the production of competing silicon integrated circuits. As a result, we must target markets where these higher costs are justified by their superior performance.
CyberDisplay™ Products
The commercial display market is highly competitive and is currently dominated by large Asian-based electronics companies including Sharp, Hitachi, Seiko, Toshiba, Sony, NEC and Sanyo. The display market consists of multiple segments, each focusing on different end-user applications applying different technologies. Competition in the display field is based on price and performance characteristics, product quality and the ability to deliver products in a timely fashion. The success of our display product offerings will also depend upon the adoption of our CyberDisplay products by consumers as an alternative to traditional active matrix LCDs and upon our ability to compete against other types of well-established display products and new emerging display products. Particularly significant is the consumer’s willingness to use a near eye display device, a display viewed in a similar fashion as using a set of binoculars, as opposed to a direct view display which may be viewed from a distance of several inches to several feet. We cannot be certain that we will be able to compete against these companies and technologies or that the consumer will accept the use of such eyewear in general or our form factor specifically.
There are also a number of active matrix LCD and alternative display technologies in development and production. These technologies include reflective, field emission display, plasma, organic light emitting diode (OLEDs) and virtual retinal displays, some of which target the high performance small form factor display markets in which our military display products are sold. There are many large and small companies that manufacture or have in development products based on these technologies. Our CyberDisplay products will compete with other displays utilizing these and other competing display technologies.
Golden-i™ Products
The markets Golden-i products are targets to currently use laptop computers, personal computers, tablets, ruggedized portable computers referred to as ‘tough books” and a variety of hand-held devices. This market is extremely competitive and is served by companies such as Panasonic, Toshiba, Dell, HTC, Hewlett Packard, Apple, Sony and Samsung.
Patents, Proprietary Rights and Licenses
An important part of our product development strategy is to seek, when appropriate, protection for our products and proprietary technology through the use of various United States and foreign patents and contractual arrangements. We intend to prosecute and defend our proprietary technology aggressively. Many of our United States patents and applications have counterpart foreign patents, foreign applications or international applications through the Patent Cooperation Treaty. In addition, we have licensed United States patents and some foreign counterparts to these United States patents from MIT.
The process of seeking patent protection can be time consuming and expensive and we cannot be certain that patents will be issued from currently pending or future applications or that our existing patents or any new patents that may be issued will be sufficient in scope or strength to provide meaningful protection or any commercial advantage to us. We may be subject to or may initiate interference proceedings in the United States Patent and Trademark Office, which can demand significant financial and management resources. Patent applications in the United States typically are maintained in secrecy until they are published about eighteen
12
months after their earliest claim to priority and since publication of discoveries in the scientific and patent literature lags behind actual discoveries, we cannot be certain that we were the first to conceive of inventions covered by pending patent applications or the first to file patent applications on such inventions. We cannot be certain that our pending patent applications or those of our licensors will result in issued patents or that any issued patents will afford protection against a competitor. In addition, we cannot be certain that others will not obtain patents that we would need to license, circumvent or cease manufacturing and sales of products covered by these patents, nor can we be sure that licenses, if needed, would be available to us on favorable terms, if at all.
We cannot be certain that foreign intellectual property laws will protect our intellectual property rights or that others will not independently develop similar products, duplicate our products or design around any patents issued or licensed to us. Our products might infringe the patent rights of others, whether existing now or in the future. For the same reasons, the products of others could infringe our patent rights. We may be notified, from time to time, that we could be or we are infringing certain patents and other intellectual property rights of others. Litigation, which could be very costly and lead to substantial diversion of our resources, even if the outcome is favorable, may be necessary to enforce our patents or other intellectual property rights or to defend us against claimed infringement of the rights of others. These problems can be particularly severe in foreign countries. In the event of an adverse ruling in litigation against us for patent infringement, we might be required to discontinue the use of certain processes, cease the manufacture, use and sale of infringing products, expend significant resources to develop non-infringing technology or obtain licenses to patents of third parties covering the infringing technology. We cannot be certain that licenses will be obtainable on acceptable terms, if at all, or that damages for infringement will not be assessed or that litigation will not occur. The failure to obtain necessary licenses or other rights or litigation arising out of any such claims could adversely affect our ability to conduct our business as we presently conduct it.
We also attempt to protect our proprietary information with contractual arrangements and under trade secret laws. We believe that our future success will depend primarily upon the technical expertise, creative skills and management abilities of our officers and key employees rather than on patent ownership. Our employees and consultants generally enter into agreements containing provisions with respect to confidentiality and employees generally assign rights to us for inventions made by them while in our employ. Agreements with consultants generally provide that rights to inventions made by them while consulting for us will be assigned to us unless the assignment of rights is prohibited by the terms of any agreements with their regular employers. Agreements with employees, consultants and collaborators contain provisions intended to further protect the confidentiality of our proprietary information. To date, we have had no experience in enforcing these agreements. We cannot be certain that these agreements will not be breached or that we would have adequate remedies for any breaches. Our trade secrets may not be secure from discovery or independent development by competitors.
Government Regulations
We are subject to a variety of federal, state and local governmental regulations related to the use, storage, discharge and disposal of toxic, volatile or otherwise hazardous chemicals used in our manufacturing process. The failure to comply with present or future regulations could result in fines being imposed on us, suspension of production or cessation of operations. Any failure on our part to control the use of, or adequately restrict the discharge of, hazardous substances, or otherwise comply with environmental regulations, could subject us to significant future liabilities. In addition, we cannot be certain that we have not in the past violated applicable laws or regulations, which violations could result in required remediation or other liabilities. We also cannot be certain that past use or disposal of environmentally sensitive materials in conformity with then existing environmental laws and regulations will protect us from required remediation or other liabilities under current or future environmental laws or regulations.
We are also subject to federal International Traffic in Arms Regulations (ITAR) laws which regulate the export of technical data and sale of products to other nations which may use these products for military purposes. The failure to comply with present or future regulations could result in fines being imposed on us, suspension of
13
production, or a cessation of operations. Any failure on our part to control the use of, or adequately restrict the discharge of, hazardous substances, or otherwise comply with environmental regulations, could subject us to significant future liabilities. Any failure on our part to obtain any required licenses for the export of technical data and/or sales of our products or to otherwise comply with ITAR, could subject us to significant future liabilities. In addition, we cannot be certain that we have not in the past violated applicable laws or regulations, which violations could result in required remediation or other liabilities.
Investments in Related Businesses
On January 11, 2011, we purchased 100% of the outstanding common stock of Forth Dimension Displays Ltd. (FDD) for approximately $11,000,000 of cash plus contingent consideration. The contingent consideration could have been earned depending upon the revenue FDD achieved in 2011, however FDD did not achieve the required revenue milestone and no additional consideration was due. Commencing in the first quarter of 2011 we consolidated the financial results of FDD.
We own 78% of Kowon Technology Co. LTD (Kowon) located in South Korea. We consolidate the financial statements of Kowon as part of our financial statements. Kowon’s revenues are principally denominated in U.S. dollars and its local expenses are principally denominated in South Korean won. In addition, Kowon holds U.S. dollars to pay certain expenses including purchases from Kopin. Accordingly, Kowon’s operations are subject to exchange rate fluctuations. Kowon is an integral part of our consumer CyberDisplay assembly process, performing the back-end packaging processes to complete the display.
From Kopin Taiwan Corp’s (KTC) inception in 2002 through July 2009 the Company owned approximately 35% of KTC. In July 2009, the Company purchased 19,572,468 and 128,226 shares of KTC common stock for approximately $5,975,000 and $300,000, respectively, which increased the Company’s ownership to approximately 87%. Accordingly since July 2009 the Company has included KTC in its consolidated financial statements. In 2010, the Company purchased 14,349,809 shares of KTC common stock for approximately $6,150,000 to increase the Company’s ownership to approximately 90%.
One of our Directors is chairman of KTC and owns approximately 1% of the outstanding common stock of KTC.
We have a 12% interest in KoBrite, and are accounting for our ownership interest using the equity method. We recorded equity losses from our investment in KoBrite of $0.3 million, $0.6 million and $0.3 million in fiscal years 2011, 2010 and 2009, respectively.
We may from time to time make further equity investments in these and other companies engaged in certain aspects of the display and electronics industries as part of our business strategy. These investments may not provide us with any financial return or other benefit and any losses by these companies or associated losses in our investments may negatively impact our operating results. Certain of our officers and directors have invested in some of the companies we have invested in.
Employees
As of December 31, 2011, our consolidated business employed 365 full-time and 5 part-time individuals. Of these, 14 hold Ph.D. degrees in Material Science, Electrical Engineering or Physics. Our management and professional employees have significant prior experience in semiconductor materials, device transistor and display processing, manufacturing and other related technologies. None of our employees are covered by a collective bargaining agreement. We consider relations with our employees to be good.
Sources and Availability of Raw Materials and Components
We rely on third party independent contractors for certain integrated circuit chip sets and other critical raw materials such as special glasses and chemicals. In addition, our higher-level CyberDisplay assemblies, binocular
14
display module, and other modules include lenses, backlights, printed circuit boards and other components, which we purchase from third party suppliers. Some of these third party contractors and suppliers are small companies with limited financial resources. In addition, relative to the commercial market, the military buys a small number of units which prevents us from qualifying and buying components economically from multiple vendors. As a result, we are highly dependent on a select number of third party contractors and suppliers.
Web Availability
We make available free of charge through our website, www.kopin.com, our annual reports on Form 10-K and other reports that we file with the Securities and Exchange Commission, as well as certain of our corporate governance policies, including the charters for the Board of Directors’ audit, compensation and nominating and corporate governance committees and its code of ethics, corporate governance guidelines and whistleblower policy. We will also provide to any person without charge, upon request, a copy of any of the foregoing materials. Any such request must be made in writing to us, c/o Investor Relations, Kopin Corporation, 200 John Hancock Road, Taunton, MA 02780.
Executive Officers of the Registrant
The following sets forth certain information with regard to our executive officers as of March 4, 2011 (ages are as of December 31, 2011):
| Item 1A. | Risk Factors |
The global economy in general and the United States economy specifically are experiencing a historic period of uncertainty which could impact our financial results and stock price, among other things. The United States economy is experiencing high levels of unemployment as compared to the recent past, large federal budget deficits and anticipated declining expenditures on military programs. These issues could have a severe adverse effect on our business and results of operation.
We have experienced a history of losses and have a significant accumulated deficit. Since inception, we have incurred significant net operating losses. As of December 31, 2011 we had an accumulated deficit of $124.0 million. We believe that our products are targeted towards markets that are still developing and our competitive strength is creating new technologies. Accordingly we believe it is important to continue to invest in research and development even during periods when we are not profitable. Our philosophy and strategies may result in our incurring losses from operations and negative cash flow.
15
Our revenues, profitability and cash flows could be negatively affected if sales of our CyberDisplay products for military applications significantly decline. A significant part of our fiscal year 2011 income from operations and our strategy to maintain profitability in fiscal year 2012 and beyond is to sell our CyberDisplay products for use in U.S. military applications because these products are sold with higher margins than our commercial display or III-V products. Our ability to continue to generate revenues and profits from sales to the U.S. military will be affected by the following events:
| • | The U.S. federal government has incurred and is expected to continue to incur large federal budget deficits. As part of its plan to deal with the federal deficits the U.S. federal government has stated its intention to reduce spending on military programs. The current federal budget forecasts lower unit purchases of thermal weapon sights (TWS) that incorporate our display products. |
| • | We are currently selling our display products to three defense contractors who in turn incorporate our product in to their TWS product which they sell to the U.S. military. The U.S. military has stated its intention to reduce the number of suppliers for this TWS program. We sell different display products to each of the three suppliers. One supplier buys only a display while the other two buy a display module. Our sales price and profits are different by product type ; accordingly our revenues and profits will be affected by who the military decides to source the TWS product. In addition the winner of the program has the option to procure displays from our competition in which case we may significantly less revenue than we have historically from this program. |
| • | There are new U.S. military production and development programs that we are bidding on such as the Enhanced Night Vision Goggle. We are competing against other display solutions and we may not be awarded contracts. In addition the government may delay awarding or implementing these programs. |
If the U.S. government significantly reduces funding for the TWS programs, and we are not able to win additional programs, we will not be profitable.
Our revenues, profitability and cash flows could be negatively affected if certain wireless handset trends do not meet expectations. Our Heterojunction Bipolar Transistor (HBT) wafers are sold to manufacturers who in turn produce Power Amplifier (PA) chip sets which are sold to wireless handset manufactures. The PA chip set amplifies signal strength in a wireless handset such as the voice signal. With the advent of smartphone the number of signals emitting from a wireless handset has increased. For instance the handset may have a voice signal, a GPS signal, and a WiFi signal. The number of our products which ultimately end up in a wireless handset is dependent on the number of signals emitting from a wireless handset. For instance smartphones, “3G” and “4G” wireless handsets typically contains more of our III-V products than a basic wireless handset. An important factor in our strategy to grow our III-V product sales is based on the expectation that the sales of smart phones, 3G and 4G wireless handsets and similar devices will become an increasing percentage of the overall sales of wireless handsets. Some industry estimates have smartphones growing at a constant annual rate of 25% or more over the next four to five years. We anticipate at least double digit growth rates for smartphones, 3G and 4G handsets and similar devices over the next few years.
In addition to the fact that a smartphone would generally contain more content of our product a smartphone typically requires our latest HBT products, called Bifets and BiHEMTs, which are more complex than the traditional HBT used in a basic wireless handset. Our Bifet and BiHEMT products have higher average selling prices than our traditional HBT. Our revenues, profits and cash flows may be negatively impacted if the following occur:
| • | The rate of growth of smartphones, 3G and 4G wireless handset and similar devices is lower than expected; |
| • | Our customers are able to design and sell products which can meet the increasing needs of smartphones, 3G, 4G and similar devices without the need to increase the amount content of our products in their products so that our expectation of demand increase because of smartphone, 3G and 4G wireless handsets and similar devices does not happen; and |
16
| • | We and our competitors overestimate the growth rate of smartphones, 3G and 4G wireless handsets and similar devices and we expand capacity at a rate in excess of demand. Historically this over capacity situation results in average sales prices declining at faster than normal rate. |
The market segment for our Golden-i™ head-worn, hands-free cloud computing products may not develop or may take longer to develop than we anticipate which may impact our ability to grow revenues. We have developed a head-worn, hands-free cloud computing product called Golden-i. This product platform is targeted for industrial, military and “prosumer” markets. Golden-i is a combination of our display technologies with wireless and voice activated software technologies, some of which we developed. The Golden-i product is significantly dependent on software which we have little experience in developing or selling. The Golden-i product is dependent on our ability to collaborate with software developers. We have licensed our Golden-i technology to a customer who anticipates launching a product incorporating our Golden-i technology in 2012. If a market for Golden-i products does not develop, our licensing partner decides not to sell products with Golden-i technology or we are unable to create and license the Golden-i product we may be unable to grow Golden-i revenues which will adversely affect our expectation of our future revenue, profit and cash flow growth rates.
If we are unable to reduce the cost of our products our financial results could be negatively impacted. The sales prices of our commercial products and, to a lesser extent, our military products, have historically declined each year. Our strategy to maintain our gross margin is to improve manufacturing efficiencies and yields, consolidate production facilities, shift production of legacy III-V products to Kopin Taiwan Corporation (KTC) which has is a lower cost production facility, increase production of larger diameter wafers (8-inch for display products) and use our purchasing power to obtain reduced raw material and component pricing from our vendors. In 2009, we obtained an 87% interest in KTC to increase our capacity to produce 6-inch HBT transistor wafers. In order to use KTC’s production capacity KTC’s production processes must be qualified by our customers. If we are unable to execute on our cost reduction strategies, in particular, our transition to larger diameter wafers and raw material purchasing strategy, our products may not be cost competitive with our competitors’ products which, may result in lower sales and reduced cash flow, and we may not be able to achieve profitability. Our purchasing power is predicated on the volumes of raw materials we buy which is directly related to our sales to certain significant customers.
Our revenue and cash flows could be negatively affected by the loss of any of the few customers who account for a substantial portion of our revenues. A few customers account for a substantial portion of our revenues. In addition, sales of our CyberDisplay products for military applications has been a significant factor in our profitability. The table below indicates, for the past three fiscal years, percentages of our total revenues from certain customers and for our sales for military applications. The symbol “*” indicates that sales to that particular customer for the given year were below 10 percent of our total revenues.
| Sales as a Percent of Total Revenue |
||||||||||||
| Customer |
2011 | 2010 | 2009 | |||||||||
| Skyworks Solutions, Inc (A) |
28 | % | 25 | % | 20 | % | ||||||
| Advanced Wireless Semiconductor Company |
9 | 12 | 8 | |||||||||
| Military Customers (B) |
30 | 33 | 45 | |||||||||
| United States Government Funded Research and Development Contracts |
4 | 3 | 6 | |||||||||
| Raytheon Company (B) |
12 | 18 | 14 | |||||||||
| DRS Technologies (B) |
* | * | 19 | |||||||||
| (A) | In addition to its internal capacity Skyworks Solution, Inc. (Skyworks) also uses Advanced Wireless Semiconductor Company (AWSC) to perform processing. We sell our HBT wafers directly to AWSC for use in Skyworks products as well as other customers. If we assume all of the HBT products we sold to AWSC were for Skyworks’ use the combined sales to Skyworks and AWSC would be 37%, 37% and 28% of our revenues for the years ended 2011, 2010 and 2009, respectively. |
17
| (B) | Sales to Raytheon Company and DRS Technologies are included within the Military Customers category. |
A significant reduction or delay in orders from any of our significant commercial customers would materially reduce our revenue and cash flow and adversely affect our ability to achieve or maintain profitability in the future. If we experience a significant reduction or delay in orders from any of our significant military customers our revenues and cash flow will be negatively impacted and we will not achieve profitability in 2011, unless the other military customers increased orders to sufficiently offset the decline. The sales to Skyworks Solutions and, to some extent, AWSC have been under a purchase and supply agreement with Skyworks Solutions which expires in July 2012. If we do not renew the agreement on commercially reasonable terms our revenue, cash flow and our ability to achieve or maintain profitability in the future would be adversely impacted.
If we fail to keep pace with changing technologies, we may lose customers. Rapidly changing customer requirements, evolving technologies and industry standards characterize the wireless communications, semiconductor materials and display industries. To achieve our goals, we need to enhance our existing products and develop and market new products that keep pace with continuing changes in industry standards, requirements and customer preferences. If we cannot keep pace with these changes, our business could suffer.
If our security systems are penetrated and confidential and or proprietary information were taken we could be subject to fines, law suits and loss of customers. We rely on our electronic information systems to perform the routine transactions to run our business. We transact business over the internet with customers, vendors electronically and our subsidiaries. We have implemented security measures to protect unauthorized access to this information. We have also implemented security policies which limit access via the internet from the company to the outside world based on the individual’s position in the company. We routinely receive security patches for the software we use from the software providers. Our primary concerns are inappropriate access to personnel information, information covered under the International Traffic in Arms Regulation, product designs and manufacturing information, financial information and our intellectual property, trade secrets and know-how. If our security systems are penetrated and confidential and or proprietary information where taken we could be subject to fines, law suites and loss of customers
Our ability to manufacture and distribute our CyberDisplay products would be severely limited if the foundries that we rely on to manufacture integrated circuits for our CyberDisplay products fail to provide those services. We depend on a Taiwanese foundry and a Korean foundry for the fabrication of integrated circuits for our CyberDisplay products. We have no long-term contracts with either of these two companies. These two companies use different methods to manufacture the integrated circuits and a shortage at one company cannot necessarily be supplied by the other company. One of the companies entered and exited bankruptcy in 2009. If either company were to terminate its arrangement with us or become unable to provide the required capacity and quality on a timely basis, we may not be able to manufacture and ship our CyberDisplay products or we may be forced to manufacture them in limited quantities until replacement foundry services can be obtained. Furthermore, we cannot assure investors that we would be able to establish alternative manufacturing and packaging relationships on acceptable terms.
Our reliance on these foundries involves certain risks, including but not limited to:
| • | Lack of control over production capacity and delivery schedules; |
| • | Limited control over quality assurance, manufacturing yields and production costs; |
| • | The risks associated with international commerce, including unexpected changes in legal and regulatory requirements, changes in tariffs and trade policies and political and economic instability; and |
| • | Natural disasters such as earthquakes, tsunami, mudslides, drought, hurricanes and tornadoes. |
18
Due to natural disasters such as earthquakes and typhoons that have occasionally occurred in Taiwan, many Taiwanese companies, including the Taiwanese foundry we use, have experienced related business interruptions. Our business could suffer significantly if either of the foundries we use had operations which were disrupted for an extended period of time, due to natural disaster, political unrest or financial instability. In addition, our CyberDisplays are manufactured on 6-inch and 8-inch silicon wafers. We currently do not anticipate redesigning all of our displays made on 6-inch wafers so they can be manufactured on 8-inch wafers. Our current military products are primarily manufactured on 6-inch wafers. We cannot be assured that if either the 6-inch or 8-inch manufacturing facilities we use were damaged they would be restored or whether our foundry service providers may decide to discontinue the operation of their 6-inch manufacturing lines. If the 6-inch manufacturing lines were discontinued and the displays had to be redesigned we may need to have the displays re-qualified by our customers, which would adversely affect our business until such qualification is complete.
We depend on third parties to provide integrated circuit chip sets and other critical raw materials for use with our CyberDisplay™ products. We do not manufacture the integrated circuit chip sets which are used to electronically interface between our CyberDisplay products and our customer’s products. Instead, we rely on third party independent contractors for these integrated circuit chip sets and other critical raw materials such as special glasses and chemicals. We also may use third parties to assemble our binocular display module (BDM). The critical raw materials, including the glasses and chemicals used in manufacturing the CyberDisplay products are used by other display manufacturers, many of which are much larger than Kopin. In addition, our higher-level CyberDisplay assemblies, BDMs, and other modules include lenses, backlights, printed circuit boards and other components, which we purchase from third party suppliers. Some of these third party contractors and suppliers are small companies with limited financial resources. In addition, relative to the commercial market, the military buys a small number of units which prevents us from qualifying and buying components economically from multiple vendors. If any of these third party contractors or suppliers were unable or unwilling to supply these integrated circuit chip sets or other critical raw materials to us, we would be unable to manufacture and sell our CyberDisplay products until a replacement supplier could be found. The U.S. military is expected to reduce its purchases which may result in lower demand for our products. Lower volume purchases may make it uneconomical for some of our suppliers to provide raw materials we need. We cannot assure investors that a replacement third party contractor or supplier could be found on reasonable terms or in a timely manner. Since 2008 some of the vendors we use have experienced liquidity problems and had difficulty obtaining inventory financing. Any interruption in our ability to manufacture and distribute our CyberDisplay products could cause our display business to be unsuccessful and the value of investors’ investment in us may decline.
Our customers who purchase display products for military applications typically incorporate our products into their products which are sold to the U.S. government under contracts. U.S. government contracts generally are not fully funded at inception and may be terminated or modified prior to completion, which could adversely affect our business. Congress funds the vast majority of the federal budget on an annual basis, and Congress often does not provide agencies with all the money requested in their budget. Many of our customers’ contracts cover multiple years and, as such, are not fully funded at contract award. If Congress or a U.S. government agency chooses to spend money on other programs, our customer contracts may be terminated for convenience. Federal laws, collectively called the Anti-Deficiency Act, prohibit involving the government in any obligation to pay money before funds have been appropriated for that purpose, unless otherwise allowed by law. Therefore, the Anti-Deficiency Act indirectly regulates how the agency awards our contracts and pays our invoices. Federal government contracts generally contain provisions, and are subject to laws and regulations, that provide the federal government rights and remedies not typically found in commercial contracts, including provisions permitting the federal government to, among other provisions: terminate our existing contracts; modify some of the terms and conditions in our existing contracts; subject the award to protest or challenge by competitors; suspend work under existing multiple year contracts and related delivery orders; and claim rights in technologies and systems invented, developed or produced by us.
The federal government may terminate a contract with us or our customer either “for convenience” (for instance, due to a change in its perceived needs) or if we default due to our failure or the failure of a
19
subcontractor to perform under the contract. If the federal government terminates a contract with our customer our contract with our customers generally would entitle us to recover only our incurred or committed costs, settlement expenses and profit on the work completed prior to termination. However, under certain circumstances, our recovery costs upon termination for convenience of such a contract may be limited. As is common with government contractors, we have experienced occasional performance issues under some of our contracts. We may in the future receive show-cause or cure notices under contracts that, if not addressed to the federal government’s satisfaction, could give the government the right to terminate those contracts for default or to cease procuring our services under those contracts.
In addition, U.S. government contracts and subcontracts typically involve long purchase and payment cycles, competitive bidding, qualification requirements, delays or changes in funding, extensive specification and performance requirements, price negotiations and milestone requirements. Each U.S. government agency often also maintains its own rules and regulations with which we must comply and which can vary significantly among agencies.
Most of our military sales are on a fixed-price basis, which could subject us to losses if there are cost overruns. Under a fixed-price contract, we receive only the amount indicated in the contract, regardless of the actual cost to produce the goods. While firm fixed-price contracts allow us to benefit from potential cost savings, they also expose us to the risk of cost overruns. If the initial estimates that we use to calculate the sales price and the cost to perform the work prove to be incorrect, we could incur losses. In addition, some of our contracts have specific provisions relating to cost, scheduling, and performance. If we fail to meet the terms specified in those contracts, then our cost to perform the work could increase, which would adversely affect our financial position and results of operations. Some of the contracts we bid on have “Indefinite Delivery, Indefinite Quantity” or IDIQ provisions. This means we are bidding a fixed price but are not assured of the quantity the government will buy or when it will buy during the term of the contract. This means we are exposed to the risk of price increases for labor, overhead and raw materials during the term of the contract. We may incur losses on fixed-price and IDIQ contracts that we had expected to be profitable, or such contracts may be less profitable than expected, which could have a material adverse effect on our business, financial condition, results of operations, and cash flows.
Our competitors can provide integrated solutions which could result in reduced market share or impact our ability to grow. Many portable consumer electronic devices, including camcorders and digital still cameras, have two displays for viewing images, an electronic viewfinder (EVF) and a flip-out or group view display. We only provide the display that is used as the electronic viewfinder. Our competitors may offer both EVF and flip-out displays and both displays may be run by the same interface electronics. A customer who buys our display is required to buy the flip-out display from another vendor who may compete with us. This may require our customer to purchase additional interface electronics to run our display. Our competitors may be able to offer a bundled solution of both displays and the interface electronics cheaper than the cost of buying our display and the other display and the interface electronics separately. If we are unable to offer displays with sufficient performance advantages over other displays to justify the additional cost of buying individual components versus a bundled solution or if our customers can not procure cost efficient interface electronics to run our display products we may lose market share or be unable to grow our business which in turn would adversely affect our ability to maintain profitability.
Our CyberDisplay™ products may not be widely accepted by the market. Our success will in large part depend on the widespread adoption of the viewing format of our CyberDisplay products in multiple applications. Our success also depends upon the widespread consumer acceptance of our customers’ products. CyberDisplay products work best when used close to the eye, which may not be acceptable to consumers. In addition, CyberDisplay products are not designed for a shared experience amongst multiple viewers at the same time. Potential customers may be reluctant to adopt our CyberDisplay products because of concerns surrounding perceived risks relating to:
| • | The introduction of our display technology generally; |
20
| • | Consumer acceptance of our CyberDisplay products; and |
| • | The relative complexity, reliability, usefulness and cost-effectiveness of our display products compared to other display products available in the market or that may be developed by our competitors. In addition, our customers may be reluctant to rely upon a relatively small company like us for a critical component. We cannot assure investors that prospective customers will adopt our CyberDisplay products or that consumers will accept our CyberDisplay products in future applications. If we fail to achieve market acceptance of our CyberDisplay products, our business may not be successful and we may not be able to maintain profitability. |
We generally do not have long-term contracts with our CyberDisplay customers, which makes forecasting our revenues and operating results difficult. We generally do not enter into long-term agreements with our commercial CyberDisplay customers obligating them to purchase our products. Our business is characterized by short-term purchase orders and shipment schedules and we generally permit orders to be canceled or rescheduled before shipment without significant penalty. As a result, our customers may cease purchasing our products at any time, which makes forecasting our revenues difficult. In addition, due to the absence of substantial non-cancelable backlog, we typically plan our production and inventory levels based on internal forecasts of customer demand, which are highly unpredictable and can fluctuate substantially. Our operating results are difficult to forecast because we are continuing to invest in capital equipment and increasing our operating expenses for new product development. If we fail to accurately forecast our revenues and operating results, our business may not be successful and the value of investors’ investment in us may decline.
We may have to record additional investment impairment losses. In fiscal years 2011and 2009 we recorded impairment charges totaling $0.2 million and $0.9 million, respectively, related to realized and unrealized losses on investments. In addition, our KoBrite joint venture has historically had losses from operations. If the equity and bond markets decline we may have to record additional losses. If the KoBrite joint venture generates operating losses in the future we will record additional losses, which will impact our ability to achieve or maintain profitability.
We may have to record additional intangible assets and/or goodwill impairment losses. In fiscal year 2011 we recorded an intangible asset impairment charge of $2.0 million and a goodwill impairment charge totaling $3.0 million, both related to our acquisition of Forth Dimension Displays. We may have to record additional intangible asset or goodwill write downs if Forth Dimension Displays does not achieve the operating results we expect, which will negatively affect our profitability.
A disruption to our information technology systems could significantly impact our operations and impact our revenue and profitability. We maintain proprietary data processing systems and use customized software systems. We also use software packages which are no longer supported by their developer. An interruption to these systems for an extended period may impact our ability to operate the businesses and process transactions which could result in a decline in sales and affect our ability to achieve or maintain profitability.
Fluctuations in operating results make financial forecasting difficult and could adversely affect the price of our common stock. Our quarterly and annual revenues and operating results may fluctuate significantly for several reasons, including:
| • | The timing and successful introduction of additional manufacturing capacity; |
| • | The timing of the initial selection of our III-V and CyberDisplay products as a component in our customers’ new products; |
| • | Availability of interface electronics for our CyberDisplay; |
| • | Competitive pressures on selling prices of our products; |
| • | The timing and cancellation of customer orders; |
| • | Our ability to introduce new products and technologies on a timely basis; |
21
| • | Our ability to successfully reduce costs; |
| • | The cancellation of U.S. government contracts; and |
| • | Our ability to secure agreements from our major customers for the purchase of our products. |
We typically plan our production and inventory levels based on internal forecasts of customer demand, which are highly unpredictable and can fluctuate substantially. Our operating results are difficult to forecast because we continue to invest in capital equipment and increase our operating expenses for new product development.
As a result of these and other factors, investors should not rely on our revenues and our operating results for any one quarter or year as an indication of our future revenues or operating results. If our quarterly revenues or results of operations fall below expectations of investors or public market analysts, the price of our common stock could fall substantially.
If we fail to comply with complex procurement laws and regulations, we could lose business and be liable for various penalties or sanctions. We must comply with laws and regulations relating to the formation, administration and performance of federal government contracts. These laws and regulations affect how we conduct business with our federal government contracts. In complying with these laws and regulations, we may incur additional costs, and non-compliance may also allow for the assignment of fines and penalties, including contractual damages. Among the more significant laws and regulations affecting our business are the following:
| • | The Federal Acquisition Regulation, which comprehensively regulates the formation, administration and performance of federal government contracts; |
| • | The Truth in Negotiations Act, which requires certification and disclosure of all cost and pricing data in connection with contract negotiations; |
| • | The Cost Accounting Standards and Cost Principles, which impose accounting requirements that govern our right to reimbursement under certain cost-based federal government contracts; and |
| • | Laws, regulations and executive orders restricting the use and dissemination of information classified for national security purposes and the export of certain products, services and technical data. We engage in international work falling under the jurisdiction of U.S. export control laws. Failure to comply with these control regimes can lead to severe penalties, both civil and criminal, and can include debarment from contracting with the U.S. government. |
Our contracting agency customers may review our performance under and compliance with the terms of our federal government contracts. If a government review or investigation uncovers improper or illegal activities, we may be subject to civil or criminal penalties or administrative sanctions, including
| • | Termination of contracts; |
| • | Forfeiture of profits; |
| • | Cost associated with triggering of price reduction clauses; |
| • | Suspension of payments; |
| • | Fines; and |
| • | Suspension or debarment from doing business with federal government agencies. |
Additionally, the False Claims Act provides for potentially substantial civil penalties where, for example, a contractor presents a false or fraudulent claim to the government for payment or approval. Actions under the civil False Claims Act may be brought by the government or by other persons on behalf of the government (who may then share a portion of any recovery).
22
If we fail to comply with these laws and regulations, we may also suffer harm to our reputation, which could impair our ability to win awards of contracts in the future or receive renewals of existing contracts. If we are subject to civil and criminal penalties and administrative sanctions or suffer harm to our reputation, our current business, future prospects, financial condition, or operating results could be materially harmed.
The government may also revise its procurement practices or adopt new contracting rules and regulations, including cost accounting standards, at any time. Any new contracting methods could be costly to satisfy, be administratively difficult for us to implement and could impair our ability to obtain new contracts.
We may be unable to modify our products to meet regulatory or customer requirements. From time to time our products are subject to new domestic and international requirements such as the European Union’s Restriction on Hazardous Substances (RoHS) Directive. If we are unable to comply with these regulations we may not be permitted to ship our products, which would adversely affect our revenue and ability to maintain profitability.
Increased competition may result in decreased demand or lower prices for our products. Competition in the markets for our products is intense and we may not be able to compete successfully. We compete with several companies, most of whom are much larger than us, who are primarily engaged in the business of designing, manufacturing and selling integrated circuits or alternative display technologies, as well as the supply of other discrete products. Our competitors could develop new process technologies that may be superior to ours, including technologies that target markets in which our products are sold. Many of our existing and potential competitors have strong market position, considerable internal manufacturing capacity, established intellectual property rights and substantial technological capabilities. Furthermore, they also have greater financial, technical, manufacturing, and marketing resources than we do, and we may not be able to compete successfully with them.
In addition, many of our existing and potential customers manufacture or assemble displays and wireless communications devices and have substantial in-house technological capabilities and substantially greater resources than we do. We may not be able to sell our products to these customers and they may commercialize their internal capabilities to become our competitors. If one of our large customers establishes internal design and manufacturing capabilities, it could have an adverse effect on our operating results.
We expect competition to increase. This could mean lower prices or reduced demand for our products. Any of these developments would have an adverse effect on our operating results.
Disruptions of our production of our III-V and CyberDisplay products would adversely affect our operating results. If we were to experience any significant disruption in the operation of our facilities, we would be unable to supply III-V and CyberDisplay products to our customers. In 2011 we experienced several power outages at our facilities which ranged in duration from one to four days. Typically these power outages have been isolated to either our Taunton, Massachusetts or Westborough, Massachusetts facilities but not both. We have a III-V production facility located in Taiwan which periodically experiences earthquakes which may affect the ability of the facility to operate. Additionally, as we introduce new equipment into our manufacturing processes, our III-V and CyberDisplay products could be subject to especially wide variations in manufacturing yields and efficiency. We may experience manufacturing problems that would result in delays in product introduction and delivery or yield fluctuations. We are also subject to the risks associated with the shortage of raw materials used in the manufacture of our products.
We may not be successful in protecting our intellectual property and proprietary rights. Our success depends in part on our ability to protect our intellectual property and proprietary rights. We have obtained certain domestic and foreign patents and we intend to continue to seek patents on our inventions when appropriate. We also attempt to protect our proprietary information with contractual arrangements and under trade secret laws. Our employees and consultants generally enter into agreements containing provisions with respect to confidentiality and the assignment of rights to inventions made by them while in our employ. These measures may not adequately protect our intellectual and proprietary rights. Existing trade secret, trademark and copyright laws afford only limited protection and our patents could be invalidated or circumvented. Moreover, the laws of certain foreign countries in which our products are or may be manufactured or sold may not fully protect our
23
intellectual property rights. Misappropriation of our technology and the costs of defending our intellectual property rights from misappropriation could substantially impair our business. If we are unable to protect our intellectual property and proprietary rights, our business may not be successful and the value of investors’ investment in us may decline.
Our products could infringe on the intellectual property rights of others. Companies in the wireless communications, semiconductor and display industries steadfastly pursue and protect intellectual property rights. This has resulted in considerable and costly litigation to determine the validity of patents and claims by third parties of infringement of patents or other intellectual property. Our products could be found to infringe on the intellectual property rights of others. Other companies may hold or obtain patents or inventions or other proprietary rights in technology necessary for our business. Periodically companies inquire about our products and technology in their attempts to assess whether we violate their intellectual property rights. If we are forced to defend against infringement claims, we may face costly litigation, diversion of technical and management personnel, and product shipment delays, even if the allegations of infringement are unwarranted. If there is a successful claim of infringement against us and we are unable to develop non-infringing technology or license the infringed or similar technology on a timely basis, or if we are required to cease using one or more of our business or product names due to a successful trademark infringement claim against us, it could adversely affect our business.
Our business could suffer if we lose the services of, or fail to attract, key personnel. In order to continue to provide quality products in our rapidly changing business, we believe it is important to retain personnel with experience and expertise relevant to our business. Our success depends in large part upon a number of key management and technical employees. The loss of the services of one or more key employees, including Dr. John C.C. Fan, our President and Chief Executive Officer, could seriously impede our success. We do not maintain any “key-man” insurance policies on Dr. Fan or any other employees. In addition, due to the level of technical and marketing expertise necessary to support our existing and new customers, our success will depend upon our ability to attract and retain highly skilled management, technical, and sales and marketing personnel. Competition for highly skilled personnel is intense and there may be only a limited number of persons with the requisite skills to serve in these positions. If the III-V or CyberDisplay markets experience an upturn, we may need to increase our workforce. Due to the competitive nature of the labor markets in which we operate, we may be unsuccessful in attracting and retaining these personnel. Our inability to attract and retain key personnel could adversely affect our ability to develop and manufacture our products.
We may pursue acquisitions and investments that could adversely affect our business. In the past we have made, and in the future we may make, acquisitions of, and investments in, businesses, products and technologies that could complement or expand our business. If we identify an acquisition candidate, we may not be able to successfully negotiate or finance the acquisition or integrate the acquired businesses, products or technologies into our existing business and products. Future acquisitions could result in potentially dilutive issuances of equity securities, the incurrence of debt and contingent liabilities, amortization expenses and write-downs of acquired assets. In January 2011 we acquired Forth Dimension Displays Ltd. (FDD). If we are unable to operate FDD profitably our results of operations will be negatively affected.
We may incur significant liabilities if we fail to comply with stringent environmental laws and regulations and the International Traffic in Arms Regulations or if we did not comply with these regulations in the past. We are subject to a variety of federal, state and local governmental regulations related to the use, storage, discharge and disposal of toxic or otherwise hazardous chemicals used in our manufacturing process. We are also subject to federal International Traffic in Arms Regulations (ITAR) laws which regulate the export of technical data and sale of products to other nations which may use these products for military purposes. The failure to comply with present or future regulations could result in fines being imposed on us, suspension of production, or a cessation of operations. Any failure on our part to control the use of, or adequately restrict the discharge of, hazardous substances, or otherwise comply with environmental regulations, could subject us to significant future liabilities. Any failure on our part to obtain any required licenses for the export of technical data and/or sales of our products or to otherwise comply with ITAR, could subject us to significant future liabilities. In addition, we cannot be certain
24
that we have not in the past violated applicable laws or regulations, which violations could result in required remediation or other liabilities. We also cannot be certain that past use or disposal of environmentally sensitive materials in conformity with then existing environmental laws and regulations will protect us from required remediation or other liabilities under current or future environmental laws or regulations.
Investors should not expect to receive dividends from us. We have not paid cash dividends in the past nor do we expect to pay cash dividends for the foreseeable future. We anticipate that earnings, if any, will be retained for the development of our businesses.
Our stock price may be volatile in the future. The trading price of our common stock has been subject to wide fluctuations in response to quarter-to-quarter variations in results of operations, announcements of technological innovations or new products by us or our competitors, general conditions in the wireless communications, semiconductor and display markets, changes in earnings estimates by analysts or other events or factors. In addition, the public stock markets recently have experienced extreme price and trading volatility. This volatility has significantly affected the market prices of securities of many technology companies for reasons frequently unrelated to the operating performance of the specific companies. These broad market fluctuations may adversely affect the market price of our common stock.
| Item 1B. | Unresolved Staff Comments |
None.
| Item 2. | Properties |
We lease our domestic III-V product manufacturing facilities and corporate headquarters located in Taunton, Massachusetts. The Taunton facilities occupy 25,100 and 60,000 square feet, including 6,000 and 6,400 square feet of contiguous environmentally controlled production clean rooms under leases that expire in 2012 and 2020, respectively. We do not anticipate renewing the Taunton lease which expires in 2012.
We lease our 74,000 square foot CyberDisplay production facility in Westborough, Massachusetts, of which 10,000 square feet is contiguous environmentally controlled production clean rooms operated between Class 10 and Class 1,000 levels. The lease expires in March 2012 and we are in the process of extending the lease for an additional 10 years. In addition to our Massachusetts facilities, we lease a 5,800 square foot design facility in Scotts Valley, California for developing prototypes of products incorporating our CyberDisplay product. This facility’s lease expires in October 2012.
Our subsidiary, Kowon Technology Co., LTD, owns two facilities in Kyungii-Do, South Korea, in which it manufactures its products and in which its corporate headquarters are located. These facilities occupy an aggregate of 28,000 square feet. Our subsidiary, Kopin Taiwan Corp, owns a facility in Hsin Shu Science Park, Hsin Shu Taiwan, in which it manufactures its products and in which its corporate headquarters are located. This facility occupies 46,800 square feet. Forth Dimension Displays, our subsidiary in Scotland, leases 20,000 square feet. This facility’s lease expires in 2013.
At this time we believe these properties are suitable for our needs for the foreseeable future.
| Item 3. | Legal Proceedings |
We may engage in legal proceedings arising in the ordinary course of business. Claims, suits, investigations and proceedings are inherently uncertain and it is not possible to predict the ultimate outcome of such matters and our business, financial condition, results of operations or cash flows could be affected in any particular period.
| Item 4. | Mine Safety Disclosures |
Not applicable
25
Part II
| Item 5. | Market for Registrant’s Common Equity, Related Stockholder Matters and Issuer Purchases of Equity Securities |
Our common stock is traded on the NASDAQ Global Market under the symbol “KOPN.” The following table sets forth, for the quarters indicated, the range of high and low sale prices for the Company’s common stock as reported on the NASDAQ Global Market for the periods indicated.
| High | Low | |||||||
| Fiscal Year Ended December 31, 2011 |
||||||||
| First Quarter |
$ | 4.40 | $ | 3.97 | ||||
| Second Quarter |
5.22 | 4.29 | ||||||
| Third Quarter |
4.85 | 3.31 | ||||||
| Fourth Quarter |
4.24 | 3.07 | ||||||
| Fiscal Year Ended December 25, 2010 |
||||||||
| First Quarter |
$ | 4.74 | $ | 3.60 | ||||
| Second Quarter |
4.50 | 3.21 | ||||||
| Third Quarter |
3.85 | 2.75 | ||||||
| Fourth Quarter |
4.48 | 3.37 | ||||||
As of March 9, 2012, there were approximately 481 stockholders of record of our common stock, which does not reflect those shares held beneficially or those shares held in “street” name.
In the past three years we have not sold any securities which were not registered under the Securities Act.
We have not paid cash dividends in the past, nor do we expect to pay cash dividends for the foreseeable future. We anticipate that earnings, if any, will be retained for the development of our businesses.
Equity Compensation Plan Information
The following table sets forth information as of December 31, 2011 about shares of the Company’s common stock issuable upon exercise of outstanding options, warrants and rights and available for issuance under our existing equity compensation plans.
| Plan Category |
Number of securities to be issued upon exercise of outstanding options, warrants and rights |
Weighted-average exercise price of outstanding options, warrants and rights |
Number of securities remaining available for future issuance under equity compensation plans (excluding securities reflected in column (a)) |
|||||||||
| (a) | ||||||||||||
| Total equity compensation plans approved by security holders (1) |
1,903,325 | $ | 5.07 | 580,178 | (2) | |||||||
| (1) | Consists of the 2001 Equity Incentive Plan and the 2010 Equity Incentive Plan. |
| (2) | Shares available under the 2010 Equity Incentive Plan. |
26
Company Stock Performance
The following graph shows a five-year comparison of cumulative total shareholder return for the Company, the NASDAQ Stock Market and the S&P 500 Information Technology index. The graph assumes $100 was invested in each of the Company’s common stock, the NASDAQ Stock Market and the S&P 500 Information Technology index on December 31, 2006. Data points on the graph are annual. Note that historical price performance is not necessarily indicative of future performance.
Kopin Corporation
S&P 500 Information Technology Index
Nasdaq Stock Market - U.S. Index
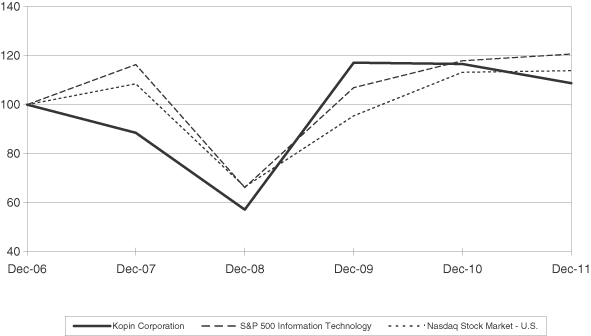
Issuer Purchase of Equity Securities
The following table provides information regarding repurchases of common stock made by us during the fiscal quarter ended December 31, 2011:
| Period |
Total number of Shares Purchased |
Average Price Paid per Share |
Total Number of Shares Purchased as Part of Publicly Announced Plans or Programs |
Maximum Approximate Dollar of Shares that May Yet Be Purchased Under the Plans or Programs |
||||||||||||
| (a) | ||||||||||||||||
| September 25, 2011 through October 22, 2011 |
117,920 | $ | 3.62 | 117,920 | $ | 11,512,702 | ||||||||||
| October 23, 2011 through November 19, 2011 |
99,694 | $ | 3.98 | 99,694 | $ | 11,116,085 | ||||||||||
| November 20, 2011 through December 31, 2011 (1)(2) |
383,785 | $ | 3.88 | 144,486 | $ | 10,585,373 | ||||||||||
|
|
|
|
|
|||||||||||||
| Total |
601,399 | $ | 3.84 | 362,100 | ||||||||||||
|
|
|
|
|
|||||||||||||
| (1) | Amount in column (a) includes shares of our common stock withheld from employees in connection with the satisfaction of tax withholding obligations under restricted stock agreements between Kopin and certain of its key employees. |
| (2) | On December 8, 2010 the Board of Directors of the Company approved a stock repurchase plan for up to $15 million of our common stock through December 8, 2012. |
27
| Item 6. | Selected Financial Data |
This information should be read in conjunction with our consolidated financial statements and notes thereto, and our “Management’s Discussion and Analysis of Financial Condition and Results of Operations” in Item 7 of this Form 10-K.
| Fiscal Year Ended | ||||||||||||||||||||
| 2011 | 2010 | 2009 | 2008 | 2007 | ||||||||||||||||
| (in thousands, except per share data) | ||||||||||||||||||||
| Statement of Operations Data: |
||||||||||||||||||||
| Revenues: |
||||||||||||||||||||
| Net product revenues |
$ | 125,465 | $ | 116,623 | $ | 108,118 | $ | 107,582 | $ | 94,191 | ||||||||||
| Research and development revenues |
5,680 | 3,763 | 6,537 | 7,223 | 3,958 | |||||||||||||||
|
|
|
|
|
|
|
|
|
|
|
|||||||||||
| Total revenues |
131,145 | 120,386 | 114,655 | 114,805 | 98,149 | |||||||||||||||
| Expenses: |
||||||||||||||||||||
| Cost of product revenues |
82,110 | 81,224 | 75,983 | 77,980 | 78,625 | |||||||||||||||
| Research and development—funded programs |
3,742 | 2,693 | 3,586 | 5,076 | 3,157 | |||||||||||||||
| Research and development—internal |
22,133 | 17,041 | 10,561 | 10,898 | 8,300 | |||||||||||||||
| Selling, general and administrative |
18,929 | 14,838 | 14,136 | 15,980 | 18,009 | |||||||||||||||
| Impairment of intangible assets and goodwill |
5,000 | — | — | — | — | |||||||||||||||
|
|
|
|
|
|
|
|
|
|
|
|||||||||||
| 131,914 | 115,796 | 104,266 | 109,934 | 108,091 | ||||||||||||||||
|
|
|
|
|
|
|
|
|
|
|
|||||||||||
| (Loss) income from operations |
(769 | ) | 4,590 | 10,389 | 4,871 | (9,942 | ) | |||||||||||||
| Other income and expense: |
||||||||||||||||||||
| Interest income |
1,305 | 2,192 | 2,181 | 3,281 | 4,451 | |||||||||||||||
| Other income and expense, net |
93 | 77 | 728 | 49 | 17 | |||||||||||||||
| Foreign currency transaction (losses) gains |
12 | (419 | ) | (1,005 | ) | 2,296 | 93 | |||||||||||||
| Gain (loss) on loans to KTC |
— | — | 1,188 | (1,188 | ) | — | ||||||||||||||
| Gain on remeasurement of investment in KTC |
— | — | 599 | — | — | |||||||||||||||
| Impairment of investment in Kenet |
— | — | — | (2,691 | ) | — | ||||||||||||||
| Other-than-temporary impairment of marketable debt securities |
(151 | ) | — | (927 | ) | (1,252 | ) | — | ||||||||||||
| Other-than-temporary impairment of Micrel common stock |
— | — | — | (224 | ) | (123 | ) | |||||||||||||
| Gain on sales of investments |
369 | 2,598 | — | — | — | |||||||||||||||
| Gain on sales of patents |
156 | 770 | 6,324 | — | — | |||||||||||||||
|
|
|
|
|
|
|
|
|
|
|
|||||||||||
| 1,784 | 5,218 | 9,088 | 271 | 4,438 | ||||||||||||||||
|
|
|
|
|
|
|
|
|
|
|
|||||||||||
| Income (loss) before benefit (provision) for income taxes, equity (losses) earnings in unconsolidated affiliates and net (income) loss of noncontrolling interest |
1,015 | 9,808 | 19,477 | 5,142 | (5,504 | ) | ||||||||||||||
| Tax benefit (provision) |
3,541 | (252 | ) | (690 | ) | (792 | ) | (465 | ) | |||||||||||
|
|
|
|
|
|
|
|
|
|
|
|||||||||||
| Income (loss) before equity (losses) earnings in unconsolidated affiliates and net (income) loss of noncontrolling interest |
4,556 | 9,556 | 18,787 | 4,350 | (5,969 | ) | ||||||||||||||
| Equity (losses) earnings in unconsolidated affiliates |
(296 | ) | (600 | ) | 483 | (1,081 | ) | (275 | ) | |||||||||||
|
|
|
|
|
|
|
|
|
|
|
|||||||||||
| Net income (loss) |
$ | 4,260 | $ | 8,956 | $ | 19,270 | $ | 3,269 | $ | (6,244 | ) | |||||||||
| Net (income) loss attributable to the noncontrolling interest |
(662 | ) | (22 | ) | 173 | (683 | ) | (312 | ) | |||||||||||
|
|
|
|
|
|
|
|
|
|
|
|||||||||||
| Net income (loss) attributable to the controlling interest |
$ | 3,598 | $ | 8,934 | $ | 19,443 | $ | 2,586 | $ | (6,556 | ) | |||||||||
|
|
|
|
|
|
|
|
|
|
|
|||||||||||
| Net income (loss) per share: |
||||||||||||||||||||
| Basic |
$ | 0.06 | $ | 0.14 | $ | 0.29 | $ | 0.04 | $ | (0.10 | ) | |||||||||
| Diluted |
$ | 0.06 | $ | 0.13 | $ | 0.29 | $ | 0.04 | $ | (0.10 | ) | |||||||||
| Weighted average number of common shares outstanding: |
||||||||||||||||||||
| Basic |
64,406 | 66,020 | 66,850 | 67,876 | 67,544 | |||||||||||||||
| Diluted |
65,234 | 66,712 | 67,458 | 68,164 | 67,544 | |||||||||||||||
| Fiscal Year Ended | ||||||||||||||||||||
| 2011 | 2010 | 2009 | 2008 | 2007 | ||||||||||||||||
| Balance Sheet Data: |
||||||||||||||||||||
| Cash and cash equivalents and marketable debt securities |
105,419 | 110,947 | 114,547 | 100,016 | 93,304 | |||||||||||||||
| Working capital |
123,948 | 132,098 | 134,198 | 116,841 | 107,931 | |||||||||||||||
| Total assets |
194,564 | 192,096 | 183,224 | 159,677 | 161,054 | |||||||||||||||
| Long-term obligations |
1,296 | 945 | 903 | 867 | 806 | |||||||||||||||
| Total stockholders’ equity |
170,788 | 170,625 | 164,302 | 141,394 | 141,034 | |||||||||||||||
28
DISCUSSION REGARDING THE USE OF NON-GAAP FINANCIAL MEASURES
Our earnings release contains some or all of the following financial measures which have not been calculated in accordance with United States Generally Accepted Accounting Principles (GAAP): (i) non-GAAP operating income and operating margin, (ii) non-GAAP net income, and (iii) non-GAAP net income per share (diluted). As set forth in the “Unaudited Reconciliation of Non-GAAP Financial Measures” table found below, we derive such non-GAAP financial measures by excluding certain expenses and other items from the respective GAAP financial measure that is most directly comparable to each non-GAAP financial measure. Management uses these non-GAAP financial measures to evaluate our operating performance and compare it against past periods, make operating decisions, forecast for future periods, compare operating performance against peer companies and determine payments under certain compensation programs. These non-GAAP financial measures provide management with additional means to understand and evaluate the operating results and trends in our ongoing business by eliminating certain non-recurring expenses (which may not occur in each period presented) and other items that management believes might otherwise make comparisons of our ongoing business with prior periods and competitors more difficult, obscure trends in ongoing operations or reduce management's ability to make useful forecasts.
We provide investors with non-GAAP operating income and operating margin and non-GAAP net income because we believe it is important for investors to be able to closely monitor and understand changes in our ability to generate income from ongoing business operations. We believe these non-GAAP financial measures give investors an additional method to evaluate historical operating performance and identify trends, additional means of evaluating period-over-period operating performance and a method to facilitate certain comparisons of operating results to peer companies. We also believe that providing non-GAAP operating income and operating margin allows investors to assess the extent to which ongoing operations impact our overall financial performance. We further believe that providing non-GAAP net income and non-GAAP net income per share (diluted) allows investors to assess the overall financial performance of ongoing operations by eliminating the impact of certain tax items which may not occur in each period for which financial information is presented and which represent gains unrelated to our ongoing operations. We believe that disclosing these non-GAAP financial measures contributes to enhanced financial reporting transparency and provides investors with added clarity about complex financial performance measures.
We calculate non-GAAP operating income by excluding from GAAP operating income, stock compensation expense and intangible assets and goodwill impairment charges. We calculate non-GAAP net income and net income per share (diluted) by excluding from GAAP net income and net income per share (diluted), stock compensation expense, goodwill impairment charges, insurance proceeds, and certain tax items, which may not occur in all periods for which financial information is presented. We exclude the items identified above from the respective non-GAAP financial measure referenced above for the reasons set forth with respect to each such excluded item below:
Stock Compensation—we believe (1) the total amount of expense is partially outside of our control because it is based on factors such as stock price volatility and interest rates, which may be unrelated to our performance during the period in which the expense is incurred, (2) it is an expense based upon a valuation methodology premised on assumptions that vary over time, and (3) the amount of the expense can vary significantly between companies due to factors that can be outside of the control of such companies.
Impairment of Intangible Assets and Goodwill—we believe such losses reflect forecasted results and do not necessarily reflect the performance of our ongoing operations for the period in which such charges are recognized.
Gains from Insurance Proceeds—we believe such gains are outside the control of management and we do not believe that they reflect the underlying performance of ongoing business operations for such period.
Certain Income Tax Items—includes the release of the valuation allowance which was recorded against the deferred tax assets of our Taiwanese subsidiary which do not result in a current tax refund.
29
The non-GAAP financial measures presented in the table below should not be considered in isolation and are not an alternative for the respective GAAP financial measure that is most directly comparable to each such non-GAAP financial measure. Investors are cautioned against placing undue reliance on these non-GAAP financial measures and are urged to review and consider carefully the adjustments made by management to the most directly comparable GAAP financial measures to arrive at these non-GAAP financial measures. Non-GAAP financial measures may have limited value as analytical tools because they may exclude certain expenses that some investors consider important in evaluating operating performance or ongoing business. Further, non-GAAP financial measures are likely to have limited value for purposes of drawing comparisons between companies because different companies may calculate similarly titled non-GAAP financial measures in different ways because non-GAAP measures are not based on any comprehensive set of accounting rules or principles.
| Fiscal year ended: | 2011 | 2010 | ||||||
| GAAP operating (loss) income |
(769,339 | ) | $ | 4,589,969 | ||||
| Share-based compensation expense |
3,924,000 | 2,584,000 | ||||||
| Impairment of intangible assets and goodwill |
4,999,512 | — | ||||||
| Insurance proceeds |
— | (1,500,000 | ) | |||||
|
|
|
|
|
|||||
| Non-GAAP operating income |
$ | 8,154,173 | $ | 5,673,969 | ||||
|
|
|
|
|
|||||
| GAAP net income |
$ | 3,597,927 | $ | 8,934,151 | ||||
| Share-based compensation expense |
3,924,000 | 2,584,000 | ||||||
| Impairment of intangible assets and goodwill |
4,999,512 | — | ||||||
| Insurance proceeds |
— | (1,787,000 | ) | |||||
| Release of valuation allowance |
(4,266,000 | ) | — | |||||
|
|
|
|
|
|||||
| Non-GAAP net income |
$ | 8,255,439 | $ | 9,731,151 | ||||
|
|
|
|
|
|||||
| GAAP net income per share, diluted |
$ | 0.06 | $ | 0.13 | ||||
| Share-based compensation expense |
0.06 | 0.04 | ||||||
| Impairment of intangible assets and goodwill |
0.08 | — | ||||||
| Insurance proceeds |
— | (0.03 | ) | |||||
| Release of valuation allowance |
(0.07 | ) | — | |||||
|
|
|
|
|
|||||
| Non-GAAP net income per share, diluted |
$ | 0.13 | $ | 0.15 | ||||
|
|
|
|
|
|||||
30
| Item 7. | Management’s Discussion and Analysis of Financial Condition and Results of Operations |
The following discussion should be read in conjunction with our consolidated financial statements and notes to those statements and other financial information appearing elsewhere in this Form 10-K. The following discussion contains forward looking information that involves risks and uncertainties. Our actual results could differ materially from those anticipated in the forward looking statements as a result of a number of factors, including the risks discussed in Item 1A “Risk Factors”, and elsewhere in this Annual Report on Form 10-K.
Management’s discussion and analysis of our financial condition and results of operations are based upon our audited consolidated financial statements. The preparation of these financial statements requires us to make estimates and judgments that affect the reported amount of assets, liabilities, revenues and expenses and related disclosure of contingent assets and liabilities. On an on-going basis, we evaluate our estimates, including those related to revenue recognition under the percentage-of-completion method, bad debts, inventories, warranty reserves, investment valuations, valuation of stock compensation awards, recoverability of deferred tax assets, liabilities for uncertain tax positions and contingencies. We base our estimates on historical experience and on various other assumptions that are believed to be reasonable under the circumstances, the results of which form the basis for making judgments about carrying values of assets and liabilities that are not apparent from other sources. Actual results may differ from these estimates under different assumptions.
We believe the following critical accounting policies are most affected by our more significant judgments and estimates used in the preparation of our consolidated financial statements:
Revenue Recognition
We recognize revenue if four basic criteria have been met: (1) persuasive evidence of an arrangement exists; (2) delivery has occurred and services rendered; (3) the price to the buyer is fixed or determinable; and (4) collectability is reasonably assured. We do not recognize revenue for products prior to customer acceptance unless we believe the product meets all customer specifications and has a history of consistently achieving customer acceptance of the product. Provisions for product returns and allowances are recorded in the same period as the related revenues. We analyze historical returns, current economic trends and changes in customer demand and acceptance of product when evaluating the adequacy of sales returns and other allowances. Certain product sales are made to distributors under agreements allowing for a limited right of return on unsold products. Sales to distributors are primarily made for sales to the distributors’ customers and not for stocking of inventory. We delay revenue recognition for our estimate of distributor claims of right of return on unsold products based upon our historical experience with our products and specific analysis of amounts subject to return based upon discussions with our distributors or their customers.
We recognize revenues from long-term research and development contracts on the percentage-of-completion method of accounting as work is performed, based upon the ratio of costs or hours already incurred to the estimated total cost of completion or hours of work to be performed. Revenue recognized at any point in time is limited to the amount funded by the U.S. government or contracting entity. We account for product development and research contracts that have established prices for distinct phases as if each phase were a separate contract. In some instances, we are contracted to create a deliverable which is anticipated to go into full production. In those cases, we discontinue the percentage-of-completion method after formal qualification of the deliverable has been completed and revenue is then recognized based on the criteria established for sale of products. In certain instances qualification may be achieved and delivery of production units may commence however our customer may have either identified new issues to be resolved or wish to incorporate a newer display technology. In these circumstances new units delivered will continue to be accounted for under the criteria established for sale of products.
We classify amounts earned on contracts in progress that are in excess of amounts billed as unbilled receivables and we classify amounts received in excess of amounts earned as billings in excess of revenues earned. We invoice based on dates specified in the related agreement or in periodic installments based upon our invoicing cycle. We recognize the entire amount of an estimated ultimate loss in our financial statements at the time the loss on a contract becomes known.
31
Accounting for design, development and production contracts requires judgment relative to assessing risks, estimating contract revenues and costs, and making assumptions for schedule and technical issues. Due to the size and nature of the work required to be performed on many of our contracts, the estimation of total revenue and cost at completion is complicated and subject to many variables. Contract costs include material, labor and subcontracting costs, as well as an allocation of indirect costs. We have to make assumptions regarding the number of labor hours required to complete a task, the complexity of the work to be performed, the availability and cost of materials, and performance by our subcontractors. For contract change orders, claims or similar items, we apply judgment in estimating the amounts and assessing the potential for realization. These amounts are only included in contract value when they can be reliably estimated and realization is considered probable. We have accounting policies in place to address these as well as other contractual and business arrangements to properly account for long-term contracts. If our estimate of total contract costs or our determination of whether the customer agrees that a milestone is achieved is incorrect, our revenue could be overstated and profits would be negatively impacted.
Bad Debt
We maintain allowances for doubtful accounts for estimated losses resulting from the inability of our customers to make required payments. This estimate is based on an analysis of specific customer creditworthiness and historical bad debts experience. If the financial condition of our customers were to deteriorate, resulting in their inability to make future payments, additional allowances may be required.
Inventory
We provide a reserve for estimated obsolete or unmarketable inventory based on assumptions about future demand and market conditions and our production plans. Inventories that are obsolete or slow moving are generally fully reserved (representing the estimated net realizable value) as such information becomes available. Our III-V products are made to each customer’s unique specifications and are generally produced upon receipt of a customer order. The manufacturing time to make our III-V products is less than one day; accordingly our III-V inventory consists primarily of raw material, primarily gallium arsenide wafers, or finished products. The finished product may be at our facilities or at our customer’s facilities under consignment programs. Our display products are manufactured based upon production plans whose critical assumptions include non-binding demand forecasts provided by our customers, lead times for raw materials, lead times for wafer foundries to perform circuit processing and yields. If a customer were to cancel an order or actual demand was lower than forecasted demand, we could not sell the excess III-V inventory and we may not be able to sell the excess display inventory and additional reserves would be required. If we were unable to sell the excess inventory, we would establish reserves to reduce the inventory to its estimated realizable value (generally zero).
Investment Valuation
At December 31, 2011 we held minority investments in Advance Wireless Semiconductor Company (AWSC) and WIN Semiconductor Corp. (WIN), publicly traded companies on the Taiwan stock exchange whose share prices have been, and may continue to be, highly volatile. We consider these investments to be “available for sale” and accordingly account for fluctuations in the value of these investments in accumulated other comprehensive income. The fair market values of AWSC and WIN were $1.6 million and $1.7 million, respectively, at December 31, 2011.
We periodically make equity investments in private companies, accounted for on the cost or equity method, whose values are difficult to determine. When assessing investments in private companies for an other-than-temporary decline in value, we consider such factors as, among other things, the share price from the investee’s latest financing round, the performance of the investee in relation to its own operating targets and its business plan, the investee’s revenue and cost trends, the liquidity and cash position, including its cash burn rate and market acceptance of the investee’s products and services. Because these are private companies which we do not control we may not be able to obtain all of the information we would want in order to make a complete assessment of the investment on a timely basis. Accordingly, our estimates may be revised if other information becomes available at a later date.
32
In addition to the above we make investments in government and agency-backed securities and corporate debt securities. For all of our investments we provide for an impairment valuation if we believe a decline in the value of an investment is other-than-temporary, which may have an adverse impact on our results of operations. The determination of whether a decline in value is other-than-temporary requires that we estimate the cash flows we expect to receive from the security. We use publicly available information such as credit ratings and financial information of the entity that issued the security in the development of our expectation of the cash flows to be received. Historically, we have periodically recorded other than temporary impairment losses.
Product Warranty
We generally sell products with a limited warranty of product quality and a limited indemnification of customers against intellectual property infringement claims related to our products. We accrue for known warranty and indemnification issues if a loss is probable and can be reasonably estimated. As of December 31, 2011, we had a warranty reserve of $1.3 million, which represents the estimated liabilities for warranty claims in process, potential warranty issues customers have notified us about and an estimate based on historical failure rates. For the fiscal years 2011, 2010 and 2009, our warranty claims and reversals were approximately $1.4 million, $0.8 million and $1.2 million, respectively. If our estimates for warranty claims are incorrect, our profits would be impacted.
Income Taxes
We have historically incurred domestic operating losses from both a financial reporting and tax return standpoint. We establish valuation allowances if it appears more likely than not that our deferred tax assets will not be realized. These judgments are based on our projections of taxable income and the amount and timing of our tax operating loss carryforwards and other deferred tax assets. Given our federal operating tax loss carryforwards, we do not expect to pay domestic federal taxes in the near term. It is possible that we could pay domestic alternative minimum taxes and state income taxes. We are also subject to foreign taxes from our Korean, Taiwanese and U.K. subsidiary operations.
Our income tax provision is based on calculations and assumptions that will be subject to examination by tax authorities. Despite our history of operating losses there can be exposures for state taxes, federal alternative minimum taxes or foreign tax that may be due. We regularly assess the potential outcomes of these examinations and any future examinations for the current or prior years in determining the adequacy of our provision for income taxes. Should the actual results differ from our estimates, we would have to adjust the income tax provision in the period in which the facts that give rise to the revision become known. Such adjustment could have a material impact on our results of operations. We have historically established valuation allowances against all of our net deferred tax assets because of our history of generating operating losses and restrictions on the use of certain items. Our evaluation of the recoverability of deferred tax assets has also included analysis of the expiration dates of net operating loss carryforwards. In forming our conclusions as to whether the deferred tax assets are more likely than not to be realized we consider the sources of our income and the projected stability of those sources and product life cycles. Over the last three fiscal years a significant component of our income has been derived from sales of higher margin military products to the U.S. government. If the U.S. government significantly reduces funding for these programs we will not be profitable. In assessing our ability to realize our domestic deferred tax assets in the future, we consider the potential impact of the U.S. government’s federal budget deficit on both the U.S. military programs in which we currently participate and those programs in which we anticipate participating in the future. A similar analysis is performed with respect to our foreign subsidiaries.
Stock Compensation
There were no stock options granted in fiscal years 2011, 2010 or 2009. The fair value of nonvested restricted common stock awards is generally the market value of the Company’s equity shares on the date of grant. The nonvested common stock awards require the employee to fulfill certain obligations, including remaining employed by the Company for one, two or four years (the vesting period) and in certain cases meeting
33
performance criteria. The performance criteria primarily consist of the achievement of the Company’s annual incentive plan goals. For nonvested restricted common stock awards which solely require the recipient to remain employed with the Company, the stock compensation expense is amortized over the anticipated service period. For nonvested restricted common stock awards which require the achievement of performance criteria, the Company reviews the probability of achieving the performance goals on a periodic basis. If the Company determines that it is probable that the performance criteria will be achieved, the amount of compensation cost derived for the performance goal is amortized over the service period. If the performance criteria are not met, no compensation cost is recognized and any previously recognized compensation cost is reversed. The Company recognizes compensation costs on a straight-line basis over the requisite service period for time vested awards.
We have an award to the CEO which vests upon our stock price achieving a certain price for 10 consecutive business days. The compensation expense associated with this award is recognized over the derived service period.
Results of Operations
We are a leading developer and manufacturer of advanced semiconductor materials and miniature displays. We use our proprietary semiconductor material technology to design, manufacture and market our III-V and CyberDisplay products for use in highly demanding commercial wireless communications and high-resolution portable military, industrial and consumer electronic applications. Our products enable our customers to develop and market an improved generation of products for these target applications.
We have two principal sources of revenues: product revenues and research and development revenues. Product revenues consist of sales of our III-V products, principally gallium arsenide (GaAs) HBT transistor wafers, and CyberDisplay products. Research and development revenues consist primarily of development contracts with agencies or prime contractors of the U.S. government. Research and development revenues were $5.7 million, or 4.3% of total 2011 revenues, $3.8 million, or 3.1% of total 2010 revenues and $6.5 million, or 5.7% of total revenues in 2009.
Our III-V products are manufactured by us in our manufacturing facilities in Taunton, Massachusetts, U.S.A. and Kopin Taiwan Corporation (KTC), our Taiwanese subsidiary and one of our reportable segments. Our CyberDisplay products are transmissive microdisplays and the initial manufacturing steps are performed in our Westborough, Massachusetts, U.S.A. facility and then the back end packaging steps for commercial transmissive display products is performed at our Korean subsidiary, Kowon, which is also one of our reportable segments. Forth Dimension Displays (FDD) manufactures reflective microdisplays in its facility located in Scotland and it too is a reportable segment.
Because our fiscal year ends on the last Saturday of December every seven years we have a fiscal year with 53 weeks. Our fiscal year 2011 was a 53 week year as compared to fiscal years 2010 and 2009 which were both 52 week years.
Fiscal Year 2011 Compared to Fiscal Year 2010
Revenues. Our revenues, which include product sales and amounts earned from research and development contracts, for fiscal years 2011 and 2010, were as follows (in millions):
| Revenues |
2011 | 2010 | ||||||
| III-V |
$ | 66.5 | $ | 62.2 | ||||
| Display |
64.6 | 58.2 | ||||||
|
|
|
|
|
|||||
| Total |
$ | 131.1 | $ | 120.4 | ||||
|
|
|
|
|
|||||
34
The increase in our III-V revenues resulted from an increase in demand for our products, specifically HBT transistors, from customers that use our products in the production of components sold to makers of wireless handsets. We believe this increase in demand was the result of both an increase in the number of wireless handsets that were sold over the prior year and because the percentage of “3G” or “smartphones”, which is a more technologically advanced type of wireless handset, increased over the prior year as a percentage of the total wireless handsets sold. 3G and smart phones offer more functions, for example web browsing, than a standard wireless handset. 3G and smart phones require more HBT transistors than a standard wireless handset to support the increased functionality. We believe the increase in industry sales of 3G and smart phones will continue in 2012.
In July 2012, our purchase and supply agreement with our largest III-V customer, a customer which represented 37% of our 2011 revenues, expires (see Item 1A, Risk Factors for explanation of percent of revenue calculation), subject to a last time buy option. If we do not renew this agreement or increase HBT sales to other customers our sales may decline.
Display revenues for 2011 and 2010 were as follows:
| Display Revenues by Category (in millions) |
2011 | 2010 | ||||||
| Military Applications |
$ | 38.9 | $ | 40.0 | ||||
| Consumer Electronic Applications |
16.5 | 10.9 | ||||||
| Eyewear Applications |
4.0 | 4.1 | ||||||
| Research & Development |
5.2 | 3.2 | ||||||
|
|
|
|
|
|||||
| Total |
$ | 64.6 | $ | 58.2 | ||||
|
|
|
|
|
|||||
Sales of our products for military applications declined in 2011 because of reduced demand from the U.S. government. Based on recently proposed federal budgets and discussions with our customers, we expect our revenues from sales of defense related products to the U.S. government to decline approximately $20 million in our 2012 fiscal year. Our military products have higher profit margins than our other display products and have been a significant contributor to our overall profitability for the pasts several years. The U.S. government is projected to incur large budget deficits for the near future and is expected to reduce spending on military programs as part of the solution to decrease these deficits. In addition an anticipated overall decline in military spending our military revenues may also decline because of a change in the U.S. government procurement process. We have been supplying our display products in support of a U.S. government thermal weapon sight program. Under this program we have had three customers. We have been notified that the U.S. government will most likely chose only one of the three to be the supplier for the program in the future. We sell different products to each of the three customers. The range of products consists of a single display to a module. The single display sells for approximately $300 as compared to the module which sells for more than $1,000. Depending on who the U.S. government awards the contract to support the thermal weapon sight program our revenues may be affected. We have been the sole supplier of displays to the U.S. military for several of its thermal weapon sight programs. We believe the U.S. military will evaluate competitors’ products for the next thermal weapon sight program. This could result in our receiving a lower percentage of these total programs than we historically have and while we do not believe it is probable, it is possible we may not receive any award. As a result of the factors above we anticipate a reduction in revenues from the sale of our military products in 2012.
The increase in the Consumer Electronic Applications category is the result of an increase in sales of our products for digital still cameras. Our ability to forecast our revenues in this category is very difficult as sales of our product ultimately depend on how successful our customers are in promoting their digital still cameras models. There are many digital still camera models offered by a number of large consumer electronic companies and it is a very competitive product category. In addition we typically rebid to win this business each year. The customers for our eyewear products tend to be smaller companies and the economic down turn during the recent years has affected their ability to obtain credit with which to purchase our products. The increase in Research and
35
Development revenues is the result of an increase in funding from the U.S. government. We are unable to predict the amount of funding for research and development by the U.S. government as it addresses its fiscal deficit issues.
In 2011, we began offering a headworn, hands-free cloud computing product that has an optical pod with a microdisplay which we refer to as Golden-i. Sales of Golden-i in 2011 were diminimis and were primarily to demonstrate the product concept. We have entered into an agreement to license the Golden-i technology and know how to a company that is developing an industrialized product which they anticipate offering in 2012. The license is exclusive for the industrial market; non-exclusive for certain other markets and prohibits sales to other markets. Under the terms of the license we will sell an optical pod which includes our display, optics and a back light. We do not believe revenue will be significant in 2012 from sales of these products but we do believe in successive years products such as this will be important for our revenue growth and ability to maintain profitability. This is the first product that we have developed that has a significant software component.
There are a number of different display technologies which can produce displays in small form factors. We believe one of the benefits of our display technology is the ability to produce high resolution displays in small form factors. The digital still camera market is mature and the majority of these devices use low-resolution display products which results in our having limited, if any, competitive advantage over our competitors and, therefore, the ability to sell displays into these markets is very price dependent. Accordingly for us to maintain or increase display revenues with above average gross margins, we will need to increase sales to customers who buy our higher resolution display products, such as the military, or develop new categories, such as our Golden-i product.
We also anticipate, based on current discussions with our customers and certain contractual obligations that the prices of certain of our products will decline in fiscal year 2012. We anticipate the average selling price of our HBT transistor wafers and display products sold to customers for consumer electronics applications will decline approximately 5% to 7% during fiscal year 2012 relative to 2011. We expect sales prices of our display products for military applications to remain relatively flat for 2012 as compared to 2011. The overall increase or decrease in the average sales price of our display products will be dependent on the sales mix of commercial and military displays.
We currently expect revenue of between $110 million and $120 million for fiscal year 2012, however due to the current worldwide economic situation our ability to forecast revenues and results of operations is very limited. Our forecasts are based on our discussions with customers and our expectations about the future global economy and are not based on firm non-cancellable orders.
International sales represented 22% and 23% of product revenues for fiscal years 2011 and 2010, respectively. The increase in international sales is primarily attributable to an increase in sales of our CyberDisplay products for digital still cameras and III-V products to customers who sell components to manufacturers of wireless handsets. We expect our 2012 revenues will primarily be from customers located in the U.S. International sales are primarily sales of CyberDisplay products to consumer electronic manufacturers located in Japan, Korea and China. Our international sales are primarily denominated in U.S. currency. Consequently, a strengthening of the U.S. dollar could increase the price in local currencies of our products in foreign markets and make our products relatively more expensive than competitors’ products that are denominated in local currencies, leading to a reduction in sales or profitability in those foreign markets. In addition, sales of our CyberDisplay products in Korea are transacted through our Korean subsidiary, Kowon Technology Co., LTD. Kowon’s sales are primarily denominated in U.S. dollars. However, Kowon’s local operating costs are primarily denominated in Korean won. Kowon also holds U.S. dollars in order to pay various expenses. As a result, our financial position and results of operations are subject to exchange rate fluctuation in transactional and functional currency. We have not taken any protective measures against exchange rate fluctuations, such as purchasing hedging instruments with respect to such fluctuations, because of the historically stable exchange rate between the Japanese yen, Korean won and the U.S. dollar.
36
Cost of Product Revenues.
| 2011 | 2010 | |||||||
| Cost of product revenues (in millions) |
$ | 82.1 | $ | 81.2 | ||||
| Cost of product revenues as a % of revenues |
65.4 | % | 69.6 | % | ||||
Cost of product revenues, which is comprised of materials, labor and manufacturing overhead related to the production of our products remained relatively consistent from 2010 to 2011 as a percentage of revenues. Our gross margin is affected by increases or decreases in the sales prices of our products, changes in raw material prices, unit volume of sales, manufacturing efficiencies and the mix of products sold. As discussed above our sales prices historically decline on an annual basis. Our overhead costs and, to a lesser extent, our labor costs are normally stable and do not fluctuate significantly during any twelve month period. Essentially, we consider labor and overhead costs to be fixed in nature over the short term and therefore profitability is very dependent on the sales prices of our products and the volume of sales. Gross margins, as a percentage of sales, increased from 2010 to 2011 because of the increase in sales in 2011 by KTC and FDD, which have higher gross margins as a percentage than our 2010 consolidated gross margin percentage. For 2012, we anticipate sale prices of display products for military applications to remain stable and sales prices of our III-V products for wireless handset applications and our displays products for consumer electronic applications to decline. As a result, in order for us to increase gross margins we need to increase manufacturing efficiencies and/or increase the unit volume of sales.
Research and Development. Research and development (R&D) expenses are incurred in support of internal display and III-V product development programs or programs funded by agencies or prime contractors of the U.S. government and commercial partners. R&D revenues associated with funded programs are presented separately in revenue in the statement of operations. Research and development costs include staffing, purchases of materials and laboratory supplies, circuit design costs, fabrication and packaging of display products, and overhead. For fiscal years 2011 and 2010 R&D expense was as follows (in millions):
| Research and development expense |
2011 | 2010 | ||||||
| Funded |
$ | 3.8 | $ | 2.7 | ||||
| Internal |
22.1 | 17.0 | ||||||
|
|
|
|
|
|||||
| Total |
$ | 25.9 | $ | 19.7 | ||||
|
|
|
|
|
|||||
R&D expense increased in 2011 as compared to the prior year primarily because of increases in costs to develop III-V products for use in 3G and smartphones and a new head-worn hands-free cloud computing display product.
Selling, General and Administrative. Selling, general and administrative (S,G&A) expenses consist of the expenses incurred by our sales and marketing personnel and related expenses, and administrative and general corporate expenses.
| 2011 | 2010 | |||||||
| Selling, general and administrative expense (in millions) |
$ | 18.9 | $ | 14.8 | ||||
| Selling, general and administrative expense as a % of revenues |
14.4 | % | 12.3 | % | ||||
The increase in S,G&A expenses in 2011 as compared to 2010 is primarily attributable to the addition of FDD in 2011 and a $1.4 million credit in 2010 due to the receipt of insurance proceeds. We acquired FDD in January of 2011 and its S,G,&A expense for 2011 was $2.6 million.
37
The Compensation Committee of the Company approved the following issuances of restricted stock:
| Date of Issuance |
Number of Shares Issued | |
| September 2011 |
919,000 | |
| February 2011 |
905,793 | |
| April 2010 |
465,500 | |
| December 2009 |
778,213 | |
| April 2009 |
676,726 |
We issue restricted stock awards to either current employees as part of our annual incentive plan (incentive equity awards) or to current or prospective employees to remain with us or join us for at least a certain period of time (retention equity awards). The number of shares of our common stock that an employee will ultimately receive and the compensation expense that we will ultimately recognize under an incentive equity award is based on achieving certain financial milestones and or remaining with the Company for a specific period of time. In the case of retention equity awards shares earned are solely a function of time employed. We filed a proxy statement on March 23, 2011 describing our 2010 Equity Incentive Plan, and we have also filed on behalf of certain officers and directors Form 4s with the Securities and Exchange Commission which detail the conditions under which our officers can earn the restricted stock awards. The 2011 proxy statement and Form 4s are available on our website www.kopin.com. In addition, as part of our Board of Director compensation in fiscal years 2011 and 2010, we issued a total of 60,000 shares of restricted stock each year to our board members representing annual grants for fiscal years 2011 and 2010. The equity awards to the Board of Directors vest 25% per year over the four years following the grant.
In connection with the issuance of the awards above, we recorded stock compensation expenses of $3.9 million and $2.6 million for fiscal years 2011 and 2010, respectively.
Impairment. On January 11, 2011, we purchased 100% of the outstanding common stock of FDD for approximately $11.0 million plus contingent consideration. In accounting for the acquisition of FDD, we allocated $4.3 million to identifiable intangible assets and $4.6 million to goodwill. The allocations were based on estimated cash flows as of the acquisition date. Subsequent to the acquisition date and during fiscal 2011 the actual operating results and cash flows generated by FDD were less than originally forecasted and at year end using revised forecasts we performed our annual review of intangible assets and goodwill. As a result of this review we recorded a non-cash charge of $5.0 million to write down the carrying value of the intangible assets and the goodwill to its implied fair market value based on projected discounted cash flows. The impairment of goodwill represented a 64% decrease in its recorded value. FDD produces a very high resolution micro display for niche markets. The majority of its current and forecasted revenues are derived from a small group of customers (less than 10). In addition approximately 50% of FDD’s forecasted sales over the next 10 years are dependent on relatively new customers. If FDD loses any of its significant customers, or the products which it is projecting to provide significant revenue in the future fail to meet expectations and are not complimented by other revenue sources, additional impairment charges may be necessary. The below table reports the activity during the year ended December 31, 2011.
| Intangible Assets |
Goodwill | |||||||
| Assets acquired with acquisition of FDD at Jan. 11, 2011, |
$ | 4,620,000 | $ | 4,604,459 | ||||
| Amortization |
(665,066 | ) | — | |||||
| Impairment |
(2,035,399 | ) | (2,964,114 | ) | ||||
| Foreign currency translation |
34,125 | 24,112 | ||||||
|
|
|
|
|
|||||
| As of December 31, 2011 |
$ | 1,953,660 | $ | 1,664,457 | ||||
|
|
|
|
|
|||||
38
Other Income and Expense.
| (in millions) |
2011 | 2010 | ||||||
| Interest income |
$ | 1.3 | $ | 2.2 | ||||
| Other income and expense, net |
0.1 | 0.0 | ||||||
| Foreign currency transaction (losses) gains |
— | (0.4 | ) | |||||
| Other-than-temporary impairment of marketable debt securities |
(0.2 | ) | — | |||||
|
|
|
|
|
|||||
| Subtotal |
1.2 | 1.8 | ||||||
| Gain on sales of investments |
0.4 | 2.6 | ||||||
| Gain on sales of patents |
0.2 | 0.8 | ||||||
|
|
|
|
|
|||||
| Other income and expense |
$ | 1.8 | $ | 5.2 | ||||
|
|
|
|
|
|||||
Other income and expense, net, as shown above, is composed of interest income, foreign currency transactions and remeasurement gains and losses incurred by our Korean, Taiwanese and United Kingdom subsidiaries, other-than temporary impairment on marketable debt securities, gains on sales of investments and license fees. For 2011, we recorded $0 of foreign currency gains (losses) as compared to ($0.4) million of foreign currency (losses) for 2010. This was primarily attributable to decreased fluctuations in the U.S. dollar and Korean won currency exchange rate. Other income and expense, net for 2011 also includes expense of $0.2 million to record an impairment of certain marketable debt securities which were deemed other-than-temporarily impaired.
As our marketable debt securities have matured we have been reinvesting in securities which, due to current interest rates, have lower yields than the securities which matured, accordingly we anticipate that our interest income will decline in 2012.
We have entered into agreements to sell certain patents which we were not using and that had a carrying value of $0. The total consideration the Company receives for the sale of the patents is a percentage of any sublicense fees, after expenses, the buyer receives. In 2011 and 2010 we sold certain additional patents we were no longer using for $0.2 million and $0.8 million, respectively. There is no additional consideration to be received for the patents sold. We continue to evaluate the patents in our portfolio for opportunities to monetize these assets.
Equity losses in unconsolidated affiliates. Our equity losses in unconsolidated affiliates consists of our approximate 12% share of the losses of KoBrite totaling $0.3 million in 2011 and our approximate 19% share of the losses of KoBrite totaling $0.6 million in 2010.
Tax benefit (provision). The benefit (provision) for income taxes for the fiscal years ended 2011 and 2010 represent alternative minimum taxes owed to U.S. federal and state taxing authorities of $0.4 million and $0.3 million, respectively, offset by the release of a $4.3 million valuation allowance which had been recorded against the deferred tax assets of KTC. Based on KTC’s results of operations for 2011 and its projected future results of operations, we concluded that the valuation allowance was not required. For 2012 we expect to have taxes based on U.S. federal tax liabilities based on federal alternative minimum tax rules and on our foreign operations. We also expect to have a state tax provision in 2012. Taiwan tax law requires a 10% tax on unappropriated earnings of our subsidiary, KTC. We recorded $0.5 million for this liability as of December 31, 2011.
Net (income) loss attributable to noncontrolling interest. We own approximately 78% of the equity of Kowon and 90% of the equity of KTC. Net (income) loss attributable to the noncontrolling interest on the consolidated statement of operations represents the portion of the results of operations of Kowon and KTC which are allocated to the shareholders of the approximately 22% of Kowon and 10% of KTC not owned by us. The change in the net (income) loss attributable to the noncontrolling interest of our subsidiaries is as follows (in millions):
| 2011 | 2010 | |||||||
| Kowon |
$ | — | $ | — | ||||
| KTC |
(0.7 | ) | — | |||||
|
|
|
|
|
|||||
| Total |
$ | (0.7 | ) | $ | — | |||
|
|
|
|
|
|||||
39
Fiscal Year 2010 Compared to Fiscal Year 2009
Revenues. Our revenues, which include product sales and amounts earned from research and development contracts, for fiscal years 2010 and 2009 were as follows (in millions):
| Revenues |
2010 | 2009 | ||||||
| III-V |
$ | 62.2 | $ | 46.5 | ||||
| CyberDisplay |
58.2 | 68.2 | ||||||
|
|
|
|
|
|||||
| Total |
$ | 120.4 | $ | 114.7 | ||||
|
|
|
|
|
|||||
The increase in our III-V revenues resulted from an increase in demand for our products, specifically HBT transistors, from customers that use our products in the production of components sold to makers of wireless handsets. We believe this increase in demand was the result of both an increase in the number of wireless handsets that were sold over the prior year and because the percentage of “3G” or “smartphones”, which is a more technologically advanced type of wireless handset, increased over the prior year as a percentage of the total wireless handsets sold. 3G and smart phones offer more functions, for example web browsing, than a standard wireless handset. 3G and smart phones require more HBT transistors than a standard wireless handset to support the increased functionality.
Display revenues for 2010 and 2009 were as follows:
| Display Revenues by Category (in millions) |
2010 | 2009 | ||||||
| Military Applications |
$ | 40.0 | $ | 51.5 | ||||
| Consumer Electronic Applications |
10.9 | 9.2 | ||||||
| Eyewear Applications |
4.1 | 1.8 | ||||||
| Research & Development |
3.2 | 5.7 | ||||||
|
|
|
|
|
|||||
| Total |
$ | 58.2 | $ | 68.2 | ||||
|
|
|
|
|
|||||
Sales of our products for military applications declined in 2010 because of reduced demand from the U.S. government. The U.S. government is projected to incur large budget deficits for the near future and is expected to reduce spending on military programs as part of the solution to decrease these deficits. As a result of this anticipated reduction in military spending demand for our military products may decline. Our military products have higher profit margins than our other display products. The increase in the Consumer Electronic Applications category is the result of an increase in sales of our products for digital still cameras. Our ability to forecast our revenues in this category is very difficult as sales of our product ultimately depend on how successful our customers are in promoting their digital still cameras models. There are many digital still camera models offered by a number of large consumer electronic companies and it is a very competitive product category. The customers for our eyewear products tend to be smaller companies and the economic down turn in 2008 and 2009 affected their ability to obtain credit with which to purchase our products. The increase in sale of our products in 2010 to customers that use them for eyewear products is the result of a few of these customers being able to obtain financing in 2010. We believe that some of the increase is from these customers refilling their inventory as well as for meeting current demand. The decline in Research and Development revenues is the result of a decline in funding from the U.S. government. We believe the amount of funding for research and development which is funded by the U.S. government may decline as it addresses its fiscal deficit issues.
In 2011 we anticipate offering a head-worn, hands-free cloud computing product that has an optical pod with a microdisplay. We do not believe revenue will be significant in 2011 from sales of these products but we do believe in successive years products such as this will be important for our revenue growth and ability to maintain profitability. This is the first product that we have developed that has a significant software component. We anticipate a business model whereby we will sell the optical pod and license the software.
40
We have been the sole supplier of displays to the US military for its thermal weapon sight programs, TWS, TWS II and currently TWS-Bridge. We believe the U.S. military will evaluate competitors’ products for the next thermal weapon sight program, TWS III. This could result in our receiving a lower percentage of these total programs than we historically have. There are a number of different display technologies which can produce displays in small form factors. We believe one of the benefits of our display technology is the ability to produce high resolution displays in small form factors. The digital still camera market is mature and the majority of these devices use low-resolution display products which results in our having limited, if any, competitive advantage over our competitors and, therefore, the ability to sell displays into these markets is very price dependent. Accordingly for us to maintain or increase display revenues with above average gross margins, we will need to increase sales to customers who buy our higher resolution display products, such as the military, or develop new categories, such as eyewear.
We also anticipate, based on current discussions with our customers and certain contractual obligations that the prices of certain of our products will decline in fiscal year 2011. We anticipate the average selling price of our HBT transistor wafers and display products sold to customers for consumer electronics applications will decline approximately 5% during fiscal year 2011 relative to 2010. We expect sales prices of our display products for military applications to remain relatively flat for 2011 as compared to 2010. The overall increase or decrease in the average sales price of our display products will be dependent on the sales mix of commercial and military display sales.
International sales represented 23% and 17% of product revenues for fiscal years 2010 and 2009 respectively. The increase in international sales is primarily attributable to an increase in sales of our CyberDisplay products for digital still cameras and III-V products to customers who sell components to manufacturers of wireless handsets. We expect our 2011 revenues will primarily be from customers located in the U.S. International sales are primarily sales of CyberDisplay products to consumer electronic manufacturers located in Japan, Korea and China. Our international sales are primarily denominated in U.S. currency. Consequently, a strengthening of the U.S. dollar could increase the price in local currencies of our products in foreign markets and make our products relatively more expensive than competitors’ products that are denominated in local currencies, leading to a reduction in sales or profitability in those foreign markets. In addition, sales of our CyberDisplay products in Korea are transacted through our Korean subsidiary, Kowon Technology Co., LTD. Kowon’s sales are primarily denominated in U.S. dollars. However, Kowon’s local operating costs are primarily denominated in Korean won. Kowon also holds U.S. dollars in order to pay various expenses. As a result, our financial position and results of operations are subject to exchange rate fluctuation in transactional and functional currency. We have not taken any protective measures against exchange rate fluctuations, such as purchasing hedging instruments with respect to such fluctuations, because of the historically stable exchange rate between the Japanese yen, Korean won and the U.S. dollar.
Cost of Product Revenues.
| 2010 | 2009 | |||||||
| Cost of product revenues (in millions) |
$ | 81.2 | $ | 76.0 | ||||
| Cost of product revenues as a % of revenues |
69.6 | % | 70.3 | % | ||||
Cost of product revenues, which is comprised of materials, labor and manufacturing overhead related to the production of our products remained relatively consistent from 2009 to 2010 as a percentage of revenues. Our gross margin is affected by increases or decreases in the sales prices of our products, changes in raw material prices, unit volume of sales, manufacturing efficiencies and the mix of products sold. As discussed above our sales prices historically decline on an annual basis. Our overhead costs and, to a lesser extent, our labor costs are normally stable and do not fluctuate significantly during any twelve month period. Essentially, we consider labor and overhead costs to be fixed in nature over the short term and therefore profitability is very dependent on the sales prices of our products and the volume of sales. Gross margins, as a percentage of sales, remained relatively consistent from 2009 to 2010 because the gross margins as a percent of sales for our III-V products increased
41
which offset the reduced gross margin contribution resulting from the decline in military display product sales. The gross margins on our III-V products increased because of the increase in unit volume of sales. Essentially the fixed cost per unit declined as we produced more units for approximately the same infrastructure cost as the prior year.
Research and Development. Research and development (R&D) expenses are incurred in support of internal display and III-V product development programs or programs funded by agencies or prime contractors of the U.S. government and commercial partners. R&D revenues associated with funded programs are presented separately in revenue in the statement of operations. Research and development costs include staffing, purchases of materials and laboratory supplies, circuit design costs, fabrication and packaging of display products, and overhead. For fiscal years 2010 and 2009 R&D expense was as follows (in millions):
| Research and development expense |
2010 | 2009 | ||||||
| Funded |
$ | 2.7 | $ | 3.6 | ||||
| Internal |
17.0 | 10.5 | ||||||
|
|
|
|
|
|||||
| Total |
$ | 19.7 | $ | 14.1 | ||||
|
|
|
|
|
|||||
R&D expense increased in 2010 as compared to the prior year primarily because of increases in costs to develop III-V products for use in 3G and smartphones and a new head-worn hands-free cloud computing display product.
Selling, General and Administrative. Selling, general and administrative (S,G&A) expenses consist of the expenses incurred by our sales and marketing personnel and related expenses, and administrative and general corporate expenses.
| 2010 | 2009 | |||||||
| Selling, general and administrative expense (in millions) |
$ | 14.8 | $ | 14.1 | ||||
| Selling, general and administrative expense as a % of revenues |
12.3 | % | 12.3 | % | ||||
The increase in S,G&A expenses in 2010 as compared to 2009 is attributable to an increase in investor relations expense of $0.4 million, insurance expense of $0.2 million, labor expense of $0.3 million and bad debts of $0.3 million partially offset by a reduction in professional fees of $1.0 million. The decrease in bad debts expense was not a true increase per se but rather in 2009 there was a credit in bad debt expense as a result of a reversal of $0.5 million allowance for doubtful accounts established at December 27, 2008 for the possible uncollectible receivables from KTC. This allowance was reversed when we acquired control of KTC in the third quarter of 2009. The reduction in professional fees was the result of insurance proceeds which reimbursed the Company for expenses previously incurred in dealing with certain legal actions.
In April 2010, December 2009 and April 2009, the Compensation Committee of the Company approved the issuance of 465,500, 778,213 and 676,726, respectively, of restricted stock awards to certain of our employees. We issue restricted stock awards either as part of our annual incentive plan (incentive equity awards) or to induce a prospective employee to join us or current employee to remain with us for at least a certain period of time (retention equity awards). The number of shares of our common stock that an employee will ultimately receive and the compensation expense that we will ultimately recognize under an incentive equity award is based on achieving certain financial milestones and remaining with the Company for a specific period of time. In the case of retention equity awards shares earned are solely a function of time employed. We filed a proxy statement on March 17, 2010 describing our 2010 equity incentive plan, and we have also filed on behalf of certain officers and directors Form 4s with the Securities and Exchange Commission which detail the conditions under our
42
officers can earn the restricted stock awards. The 2010 proxy statement and Form 4s are available on our website www.kopin.com. In December 2008 the Compensation Committee approved the issuance of 363,191 restricted stock awards to our employees, subject to certain conditions. These conditions were essentially the same conditions for the awards made in 2009. In addition, as part of its Board of Director compensation in fiscal years 2010 and 2009 we issued 120,000 shares of restricted stock to our board members representing the annual grants for fiscal years 2010 and 2009. The equity awards to the Board of Directors vest 25% per year over the four years following the grant.
In connection with the issuance of the awards above, and the amortization of awards issued before fiscal year 2008, we recorded stock compensation expenses of $2.6 million and $1.9 million for fiscal years 2010 and 2009, respectively.
Other Income and Expense.
| (in millions) |
2010 | 2009 | ||||||
| Interest income |
$ | 2.2 | $ | 2.2 | ||||
| Other income and expense, net |
0.0 | 0.7 | ||||||
| Foreign currency transaction (losses) gains |
(0.4 | ) | (1.0 | ) | ||||
| Other-than-temporary Impairment of marketable debt securities |
— | (0.9 | ) | |||||
|
|
|
|
|
|||||
| Subtotal |
1.8 | 1.0 | ||||||
| Gain on sales of investments |
2.6 | — | ||||||
| Gain on loans to KTC |
— | 1.2 | ||||||
| Gain on remeasurement of investment in KTC |
— | 0.6 | ||||||
| Gain on sales of patents |
0.8 | 6.3 | ||||||
|
|
|
|
|
|||||
| Other income and expense |
$ | 5.2 | $ | 9.1 | ||||
|
|
|
|
|
|||||
Other income and expense, net, as shown above, is composed of interest income, foreign currency transaction and remeasurement gains and losses incurred by our Korean and Taiwanese subsidiaries, other-than temporary impairment on marketable debt securities, gains resulting from our obtaining a controlling interest in KTC and license fees. For 2010, we recorded $0.4 million of foreign currency losses as compared to $1.0 million of foreign currency losses for 2009. This was primarily attributable to decreased fluctuations in the US dollar and Korean won currency exchange rate. Other income and expense, net for 2009 also includes expense of $0.9 million to record an impairment of certain marketable debt securities which were deemed other-than-temporarily impaired.
As announced in our 2010 earnings released on March 3, 2011 and as filed in the Current Report on Form 8-K, our income from operations was $4.1 million. Subsequent to the release we reclassified $0.4 million from other income and expense, net, to income from operations.
As our marketable debt securities have matured we have been reinvesting in securities which, due to current interest rates, have lower yields than the securities which matured, accordingly we anticipate that our interest income will decline in 2011.
In conjunction with our obtaining a controlling interest in KTC in 2009 we recorded a gain of $0.6 million for the remeasurement of our investment in KTC to fair market value and $1.2 million related to the repayment of loans from KTC which had been previously written-off. A more complete explanation of the impact on our financial statements from our obtaining a controlling interest in KTC is below.
In fiscal year 2008 we entered into an agreement to sell certain patents which we were not using and that had a carrying value of $0 to a buyer who would attempt to sublicense the patents. The total consideration the Company would receive for the sale of the patents would be a percentage of any sublicense fees, after expenses,
43
the buyer received. In 2009 we recorded $6.3 million of income which represented the Company’s share of sublicense fees income. In 2010 we sold certain additional patents we were no longer using for $0.8 million. We do not expect to receive any material additional amounts from the sales of these patents. Equity earnings (losses) in unconsolidated affiliates. Our equity earnings (losses) in unconsolidated affiliates consists of our approximate 19% share of the losses of KoBrite totaling $0.6 million in 2010 and $0.3 million in 2009, offset by the effects of the repayment of a loan by KTC which is discussed in more detail below, in 2009 of $0.8 million.
Tax (provision) benefit. The provision for income taxes for the fiscal years ended 2010 and 2009 represent alternative minimum taxes owed to U.S. federal and state taxing authorities of $0.3 million and $0.7 million, respectively. For 2011 we expect to have taxes based on U.S. federal tax liabilities based on Alternative Minimum Tax rules and on our foreign operations. We also expect to have a state tax provision for financial reporting purposes in 2011.
Net (income) loss attributable to noncontrolling interest. We own approximately 78% of the equity of Kowon Technology Co. Ltd. (Kowon) and 90% of the equity of KTC. Net loss (income) attributable to the noncontrolling interest on the consolidated statement of operations represents the portion of the results of operations of Kowon and KTC which are allocated to the shareholders of the approximately 22% of Kowon and 10% of KTC not owned by us. The change in the net loss (income) attributable to the noncontrolling interest of our subsidiaries is as follows (in millions):
| 2010 | 2009 | |||||||
| Kowon |
$ | — | $ | 0.3 | ||||
| KTC |
— | (0.1 | ) | |||||
|
|
|
|
|
|||||
| Total |
$ | — | $ | 0.2 | ||||
|
|
|
|
|
|||||
Acquisition of the controlling interest in Kopin Taiwan Corporation (KTC).
From Kopin Taiwan Corp’s (KTC) inception in 2002 through July 2009 the Company owned approximately 35% of KTC. In July 2009, the Company purchased 19,572,468 and 128,226 shares of KTC common stock for approximately $5,975,000 and $300,000, respectively which increased the Company’s ownership to approximately 87%. Subsequent to the purchase of additional shares in July 2009, KTC repaid the outstanding balance of loans due to us from KTC in the aggregate amount of approximately $2,012,000. We began consolidating KTC on July 31, 2009. In 2010, the Company purchased 14,349,809 shares of KTC common stock for approximately $6,150,000 to increase the Company’s ownership to approximately 90%.
The consolidated statement of operations for the periods shown below includes the following amounts (in millions) which were related to transactions with KTC:
| 2009 | ||||
| Gain on remeasurement of Kopin’s previous investment in KTC |
$ | 0.6 | ||
| Repayment of loan by KTC which was previously written-off |
2.0 | |||
| Reduction (increase) in bad debt allowance |
0.5 | |||
In the year ended December 27, 2008 we recorded equity losses of approximately $0.8 million and a loan loss reserve of approximately $1.2 million in connection with $2.0 million we loaned KTC in fiscal 2008. As a result of the acquisition in July 2009 the loan was repaid, and in 2009 we recorded a gain on the loan repayment of approximately $1.2 million and equity in earnings of unconsolidated affiliates of $0.8 million.
In fiscal 2008, due to KTC’s liquidity problems we recorded allowances for possible bad debts for the excess amount KTC owed to us over what we owed KTC. At December 27, 2008, the allowance for possible bad debts was approximately $0.5 million. During the nine months ended September 26, 2009 we reduced the allowance to $0, resulting in a reduction of selling, general and administrative expenses of $0.5 million.
44
Prior to July 2009 we recorded our investment in KTC under the equity method and wrote down the investment to $0. We remeasured and wrote-up our investment in KTC by approximately $0.6 million which represented the fair market value of the investment immediately prior to the acquisition in July 2009.
Liquidity and Capital Resources
As of December 31, 2011, we had cash and equivalents and marketable debt securities of $105.4 million and working capital of $123.9 million compared to $111.0 million and $132.1 million, respectively, as of December 25, 2010. The decrease in cash and equivalents and marketable securities was primarily due to cash provided by operating activities of approximately $19.3 million and proceeds from sales of investments of $0.4 million, which were offset by capital expenditures of $7.3 million, the acquisition of FDD for $10.0 million, net of cash acquired, repurchase of our common stock for $4.4 million and the net purchase of marketable debt securities and other assets of $3.6 million. The increase in capital expenditures is primarily the result of our investments in capacity for our III-V product line in response to customer demand.
Cash and marketable debt securities held in U.S. dollars
| Domestic |
$ | 89,803,174 | ||
| Foreign |
11,160,189 | |||
|
|
|
|||
| Subtotal cash and marketable debt securities |
100,963,363 | |||
| Cash and marketable debt securities held in other currencies and converted to U.S. dollars |
4,455,187 | |||
|
|
|
|||
| Total cash and marketable debt securities |
$ | 105,418,550 | ||
|
|
|
We have no plans to repatriate the foreign cash and marketable debt securities such that we have not recorded any deferred tax liability.
We have entered into a product development agreement under which we have agreed to fund up to $2.4 million of development expenses if certain milestones are achieved.
Included in the $2,467,461 of Billings in excess of revenue earned on the consolidated balance sheet at December 31, 2011 is approximately $2.2 million which we received from the state of Massachusetts as an incentive to retain jobs in Massachusetts. We earn amounts under the agreement by meeting certain employment milestones each year and amounts not earned will be repaid to the state of Massachusetts at the end of the agreement in 2017. The agreement also contains repayment provisions which require us to repay certain amounts back to the state of Massachusetts if we fail to achieve certain employment milestones after years three and five of the agreement, or if we move certain parts of our operations out of the state. Based on our current estimates we believe that we may be required to repay $1.0 million to the state of Massachusetts in 2012.
We have a purchase and supply agreement with a significant HBT customer that expires in July 2012. This agreement also provides for a last time buy option. Under the terms of this agreement we have agreed to maintain capacity levels for manufacturing HBT wafers and we committed to a pricing schedule under certain circumstances. The agreement also requires us to give prior notice if we exit our HBT product line. In consideration for this agreement the customer agreed to source a certain percentage of its HBT wafer needs from us subject to the customer’s right to source HBT wafers from other sources if we are unable to meet their requirements under certain circumstances. We agreed that failure to meet our supply obligations under the agreement would allow our customer to obtain court ordered specific performance and if we do not perform we could then be liable for monetary damages up to a maximum of $40 million.
We lease facilities located in Taunton and Westborough, Massachusetts, and Scotts Valley, California, under non-cancelable operating leases. We have two Taunton facilities, one whose lease expires in 2020 and the other in 2012. The Taunton lease which expires in 2020 may be extended for a 10 year term. The Westborough lease, which was extended subsequent to December 31, 2011, expires in 2023 and the Scotts Valley lease expires in 2012.
45
We also lease a facility in Dalgety Bay, Scotland which expires in April 2013.
We expect to expend between $5.0 and $8.0 million on capital expenditures over the next twelve months, primarily for the acquisition of equipment to increase capacity in our III-V product line.
As of December 31, 2011, we had substantial tax loss carry-forwards, which may be used to offset future federal taxes due. We may record a tax provision in our financial statements but we may be able to offset some or all of the amounts that are payable with our tax loss carry-forwards. We may be subject to alternative minimum taxes, foreign taxes and state income taxes depending on our taxable income and sources of taxable income.
Historically we have financed our operations primarily through public and private placements of our equity securities. Over the past several years we have generated sufficient cash from operations to fund the business. We believe our available cash resources will support our operations and capital needs for at least the next twelve months.
Off-Balance Sheet Arrangements
We have no off-balance sheet arrangements.
Seasonality
The markets for our III-V and consumer electronic CyberDisplay products have been traditionally seasonal, with sales of these products strongest in the third quarter followed by our second quarter then our fourth quarter and our first quarter being our lowest sales quarter. However this seasonal pattern did not exist in fiscal year 2011. The timing of new product introductions by our customers may have disrupted the seasonality of our business.
Climate Change
We do not believe there is anything unique to our business which would result in climate change regulations having a disproportional affect on us as compared to U.S. industry overall.
Inflation
We do not believe our operations have been materially affected by inflation in the last 3 fiscal years.
Contractual Obligations
The following is a summary of our contractual payment obligations for operating leases as of December 31, 2011:
| Contractual Obligations |
Total | Less than 1 year | 1-3 Years | 3-5 years | More than 5 years | |||||||||||||||
| Operating Lease Obligations |
$ | 4,986,820 | $ | 1,031,419 | $ | 1,490,276 | $ | 1,706,625 | $ | 758,500 | ||||||||||
46
| Item 7A. | Quantitative and Qualitative Disclosures About Market Risk |
We invest our excess cash in high-quality U.S. government, government-backed (Fannie Mae, FDIC guaranteed bonds and certificates of deposit) and corporate debt instruments, which bear lower levels of relative risk. We believe that the effect, if any, of reasonably possible near-term changes in interest rates on our financial position, results of operations and cash flows should not be material to our cash flows or income. It is possible that interest rate movements would increase our unrecognized gain or loss on interest rate securities. Included in other assets are equity investments in Advanced Wireless Semiconductor Company (AWSC) and WIN Semiconductor Corp. (WIN) of approximately $1.6 million and $1.7 million, respectively, which are subject to changes in value because of either specific operating issues or overall changes in the stock market. We are exposed to changes in foreign currency exchange rates primarily through our translation of our foreign subsidiary’s financial positions, results of operations, and transaction gains and losses as a result of non U.S. dollar denominated cash flows related to business activities in Asia, and remeasurement of United States dollars to the functional currency of our foreign subsidiaries. We are also exposed to the affects of exchange rates in the purchase of certain raw materials whose price is in U.S. dollars but the price on future purchases is subject to change based on the relationship of the Japanese Yen to the U.S. dollar. We do not currently hedge our foreign currency exchange rate risk. We estimate that any market risk associated with our international operations is unlikely to have a material adverse effect on our business, financial condition or results of operation. Our portfolio of marketable debt securities is subject to interest rate risk although our intent is to hold securities until maturity. The credit rating of our investments may be affected by the underlying financial health of the guarantors of our investments. We use Gallium Arsenide and Silicon wafers but do not enter into forward or futures hedging contracts.
| Item 8. | Financial Statements and Supplementary Data |
The financial statements required by this Item are included in this Report on pages 53 through 82. Reference is made to Item 15 of this Report.
| Item 9. | Changes in and Disagreements with Accountants on Accounting and Financial Disclosure |
Not Applicable.
| Item 9A. | Controls and Procedures |
Evaluation of Disclosure Controls and Procedures
We conducted an evaluation of the effectiveness of the design and operation of our “disclosure controls and procedures” (Disclosure Controls), as defined in Rules 13a-15(e) and 15d-15(e) under the Exchange Act, as of December 31, 2011. The controls evaluation was conducted under the supervision and with the participation of management, including our Chief Executive Officer and Chief Financial Officer. Disclosure Controls are controls and procedures designed to reasonably assure that information required to be disclosed in our reports filed under the Exchange Act, such as this Form 10-K, is recorded, processed, summarized and reported within the time periods specified in the U.S. Securities and Exchange Commission’s (SEC’s) rules and forms. Disclosure Controls are also designed to reasonably assure that such information is accumulated and communicated to our management, including the Chief Executive Officer and Chief Financial Officer, as appropriate to allow timely decisions regarding required disclosure. Our quarterly evaluation of Disclosure Controls includes an evaluation of some components of our internal control over financial reporting, and internal control over financial reporting is also separately evaluated on an annual basis for purposes of providing the management report which is set forth below.
Our Chief Executive Officer and Chief Financial Officer have concluded as of the end of the period covered by this Annual Report on Form 10-K, our disclosure controls and procedures were effective.
47
Management’s Report on Internal Control Over Financial Reporting
Our management is responsible for establishing and maintaining adequate internal control over financial reporting as defined in Rules 13a-15(f) and 15d-15(f) under the Exchange Act. A company’s internal control over financial reporting is a process designed by, or under the supervision of, the company’s principal executive and principal financial officers, or persons performing similar functions, and effected by the Company’s Board of Directors, management, and other personnel to provide reasonable assurance regarding the reliability of financial reporting and the preparation of financial statements for external purposes in accordance with generally accepted accounting principles and include those policies and procedures that:
| • | Pertain to the maintenance of records that, in reasonable detail, accurately and fairly reflect the transactions and dispositions of the assets of the company; |
| • | Provide reasonable assurance that transactions are recorded as necessary to permit preparation of financial statements in accordance with generally accepted accounting principles, and that receipts and expenditures of the company are being made in accordance with authorizations of management and directors of the company; and |
| • | Provide reasonable assurance regarding prevention or timely detection of unauthorized acquisition, use or disposition of the company’s assets that could have a material effect on the financial statements. |
Because of its inherent limitations, internal control over financial reporting may not prevent or detect misstatements. Projections of any evaluation of effectiveness to future periods are subject to the risk that controls may become inadequate because of changes in conditions, or that the degree of compliance with the policies or procedures may deteriorate.
Our management assessed the effectiveness of our internal control over financial reporting as of December 31, 2011, based on the criteria outlined in Internal Control—Integrated Framework issued by the Committee of Sponsoring Organizations of the Treadway Commission.
Based on their assessment, management concluded that, as of December 31, 2011, the Company’s internal control over financial reporting is effective based on those criteria.
Our independent registered public accounting firm that audited our consolidated financial statements included in this Form 10-K has issued an attestation report on our internal control over financial reporting. This report appears below.
Changes in Internal Control Over Financial Reporting
During our last fiscal quarter, there were no changes in our internal control over financial reporting that have materially affected, or are reasonably likely to materially affect, our internal control over financial reporting.
48
REPORT OF INDEPENDENT REGISTERED PUBLIC ACCOUNTING FIRM
To the Board of Directors and Stockholders of
Kopin Corporation
Taunton, Massachusetts
We have audited the internal control over financial reporting of Kopin Corporation and subsidiaries (the “Company”) as of December 31, 2011, based on criteria established in Internal Control—Integrated Framework issued by the Committee of Sponsoring Organizations of the Treadway Commission. The Company’s management is responsible for maintaining effective internal control over financial reporting and for its assessment of the effectiveness of internal control over financial reporting, included in the accompanying Management’s Report On Internal Control over Financial Reporting. Our responsibility is to express an opinion on the Company’s internal control over financial reporting based on our audit.
We conducted our audit in accordance with the standards of the Public Company Accounting Oversight Board (United States). Those standards require that we plan and perform the audit to obtain reasonable assurance about whether effective internal control over financial reporting was maintained in all material respects. Our audit included obtaining an understanding of internal control over financial reporting, assessing the risk that a material weakness exists, testing and evaluating the design and operating effectiveness of internal control based on the assessed risk, and performing such other procedures as we considered necessary in the circumstances. We believe that our audit provides a reasonable basis for our opinion.
A company’s internal control over financial reporting is a process designed by, or under the supervision of, the company’s principal executive and principal financial officers, or persons performing similar functions, and effected by the company’s board of directors, management, and other personnel to provide reasonable assurance regarding the reliability of financial reporting and the preparation of financial statements for external purposes in accordance with generally accepted accounting principles. A company’s internal control over financial reporting includes those policies and procedures that (1) pertain to the maintenance of records that, in reasonable detail, accurately and fairly reflect the transactions and dispositions of the assets of the company; (2) provide reasonable assurance that transactions are recorded as necessary to permit preparation of financial statements in accordance with generally accepted accounting principles, and that receipts and expenditures of the company are being made only in accordance with authorizations of management and directors of the company; and (3) provide reasonable assurance regarding prevention or timely detection of unauthorized acquisition, use, or disposition of the company’s assets that could have a material effect on the financial statements.
Because of the inherent limitations of internal control over financial reporting, including the possibility of collusion or improper management override of controls, material misstatements due to error or fraud may not be prevented or detected on a timely basis. Also, projections of any evaluation of the effectiveness of the internal control over financial reporting to future periods are subject to the risk that the controls may become inadequate because of changes in conditions, or that the degree of compliance with the policies or procedures may deteriorate.
In our opinion, the Company maintained, in all material respects, effective internal control over financial reporting as of December 31, 2011, based on the criteria established in Internal Control—Integrated Framework issued by the Committee of Sponsoring Organizations of the Treadway Commission.
We have also audited, in accordance with the standards of the Public Company Accounting Oversight Board (United States), the consolidated financial statements and financial statement schedule as of and for the year ended December 31, 2011, of the Company and our report dated March 15, 2012 expressed an unqualified opinion on those financial statements and financial statement schedule.
/s/ Deloitte & Touche LLP
Boston, Massachusetts
March 15, 2012
49
| Item 9B. | Other Information. |
None
Part III
| Item 10. | Directors, Executive Officers and Corporate Governance |
The information required under this item is incorporated herein by reference from our Proxy Statement relating to our 2012 Annual Meeting of Shareholders (the Proxy Statement). In addition to the disclosures made in our Proxy Statement and incorporated by reference herein, information with respect to executive officers required by this item is set forth in Part I of this Report.
Code of Ethics. We have adopted a Code of Business Conduct and Ethics (the Code) that applies to all of our employees (including our CEO and CFO) and directors. The Code is available on our website at www.kopin.com. We intend to satisfy the disclosure requirement regarding any amendment to or waiver of a provision of the Code applicable to any executive officer or director, by posting such information on our website.
Our corporate governance guidelines, whistleblower policy and the charters of the audit committee, compensation committee and nominating and corporate governance committee of the Board of Directors as well as other corporate governance document materials are available on our website at www.kopin.com under the heading “Investors”, then “Corporate Governance” then “Governance Documents”.
| Item 11. | Executive Compensation |
The information required under this item is contained in our Proxy Statement under the caption “Stock Ownership of Principal Stockholders and Management” and is incorporated herein by reference from the Proxy Statement.
| Item 12. | Security Ownership of Certain Beneficial Owners and Management and Related Stockholder Matters |
The information required by this item is incorporated herein by reference from the Proxy Statement. Refer also to the equity compensation plan information set forth in Part II Item 5 of this Annual Report on Form 10-K.
| Item 13. | Certain Relationships and Related Transactions and Director Independence |
The information required by this item is incorporated herein by reference from the Proxy Statement.
| Item 14. | Principal Accountant Fees and Services |
The information required by this item is incorporated herein by reference from the Proxy Statement.
| Item 15. | Exhibits and Financial Statement Schedules |
(a) Documents filed as part of the Report:
(1) Consolidated Financial Statements:
| Page | ||||
| 54 | ||||
| 55 | ||||
| 56 | ||||
| 56 | ||||
| 57 | ||||
| 58 | ||||
| 59 | ||||
50
(2) Financial Statement Schedule:
| 84 |
Schedules other than the one listed above have been omitted because of the absence of conditions under which they are required or because the required information is included in the consolidated financial statements or the notes thereto.
(3) Exhibits
| 3.1 | Amended and Restated Certificate of Incorporation | (2 | ) | |||||
| 3.2 | Amendment to Certificate of Incorporation | (5 | ) | |||||
| 3.3 | Amendment to Certificate of Incorporation | (5 | ) | |||||
| 3.4 | Fourth Amended and Restated By-laws | (8 | ) | |||||
| 4 | Specimen Certificate of Common Stock | (1 | ) | |||||
| 10.1 | Form of Employee Agreement with Respect to Inventions and Proprietary Information | (1 | ) | |||||
| 10.2 | Amended and Restated 1992 Stock Option Plan | (2 | )* | |||||
| 10.3 | 1992 Stock Option Plan Amendment | (5 | )* | |||||
| 10.4 | 1992 Stock Option Plan Amendment | (6 | )* | |||||
| 10.5 | Kopin Corporation 2001 Equity Incentive Plan | (7 | )* | |||||
| 10.6 | Kopin Corporation 2001 Equity Incentive Plan Amendment | (9 | )* | |||||
| 10.7 | Kopin Corporation 2001 Equity Incentive Plan Amendment | (10 | )* | |||||
| 10.8 | Kopin Corporation 2001 Equity Incentive Plan Amendment | (11 | )* | |||||
| 10.9 | Kopin Corporation 2001 Equity Incentive Plan Amendment | (13 | )* | |||||
| 10.10 | Kopin Corporation 2001 Supplemental Equity Incentive Plan | (6 | )* | |||||
| 10.11 | Form of Key Employee Stock Purchase Agreement | (1 | )* | |||||
| 10.12 | License Agreement by and between the Company and Massachusetts Institute of Technology dated April 22, 1985, as amended |
(1 | ) | |||||
| 10.13 | Facility Lease, by and between the Company and Massachusetts Technology Park Corporation, dated October 15, 1993 |
(3 | ) | |||||
| 10.14 | Joint Venture Agreement, by and among the Company, Kowon Technology Co., Ltd., and Korean Investors, dated as of March 3, 1998 |
(4 | ) | |||||
| 10.15 | Seventh Amended and Restated Employment Agreement between the Company and Dr. John C.C. Fan, dated as of December 8, 2010 |
|||||||
| 10.16 | Kopin Corporation Form of Stock Option Agreement under 2001 and 2010 Equity Incentive Plans |
(12 | )* | |||||
| 10.17 | Kopin Corporation 2001 and 2010 Equity Incentive Plan Form of Restricted Stock Purchase Agreement |
(12 | )* | |||||
| 10.18 | Kopin Corporation Fiscal Year 2012 Incentive Bonus Plan |
* | ||||||
| 10.19 | Kopin Corporation Stock Purchase Agreement of 19,572,468 shares of Kopin Taiwan Corporation, (KTC) common stock |
(14 | ) | |||||
| 10.20 | Kopin Corporation 2010 Equity Incentive Plan |
(15 | ) | |||||
| 21.1 | Subsidiaries of Kopin Corporation |
|||||||
| 23.1 | Consent of Independent Registered Public Accounting Firm |
|||||||
| 31.1 | Chief Executive Officer Certification Pursuant to 18 U.S.C. Section 1350, as Adopted Pursuant to Section 302 of the Sarbanes-Oxley Act of 2002 |
|||||||
51
| 31.2 | Chief Financial Officer Certification Pursuant to 18 U.S.C. Section 1350, as Adopted Pursuant to Section 302 of the Sarbanes-Oxley Act of 2002 |
|||||
| 32.1 | Chief Executive Officer Certification Pursuant to 18 U.S.C. Section 1350, as Adopted Pursuant to Section 906 of the Sarbanes-Oxley Act of 2002 |
|||||
| 32.2 | Chief Financial Officer Certification Pursuant to 18 U.S.C. Section 1350, as Adopted Pursuant to Section 906 of the Sarbanes-Oxley Act of 2002 |
|||||
| 101 | The following materials from the Company’s Annual Report on Form 10-K for the fiscal year ended December 31, 2011, formatted in XBRL (Extensible Business Reporting Language): (i) Consolidated Balance Sheets, (ii) Consolidated Statements of Income, (iii) Consolidated Statements of Cash Flows, and (iv) Notes to Consolidated Financial Statements, tagged as blocks of text |
|||||
| * | Management contract or compensatory plan required to be filed as an Exhibit to this Form 10-K. |
| (1) | Filed as an exhibit to Registration Statement on Form S-1, File No. 33-45853, and incorporated herein by reference. |
| (2) | Filed as an exhibit to Registration Statement on Form S-1, File No. 33-57450, and incorporated herein by reference. |
| (3) | Filed as an exhibit to Annual Report on Form 10-K for the fiscal year ended December 31, 1993 and incorporated herein by reference. |
| (4) | Filed as an exhibit to Annual Report on Form 10-Q for the quarterly period ended June 27, 1998 and incorporated herein by reference. |
| (5) | Filed as an exhibit to Quarterly Report on Form 10-Q for the quarterly period ended July 1, 2000 and incorporated herein by reference. |
| (6) | Filed as an exhibit to Registration Statement on Form S-8, filed on November 13, 2001 and incorporated herein by reference. |
| (7) | Filed as an appendix to Proxy Statement filed on April 20, 2001 and incorporated herein by reference. |
| (8) | Filed as an exhibit to Current Report on Form 8-K filed on December 12, 2008 and incorporated herein by reference. |
| (9) | Filed as an exhibit to Registration Statement on Form S-8 filed on August 16, 2002 and incorporated herein by reference. |
| (10) | Filed as an exhibit to Registration Statement on Form S-8 filed on March 15, 2004 and incorporated herein by reference. |
| (11) | Filed as an exhibit to Registration Statement on Form S-8 filed on May 10, 2004 and incorporated herein by reference. |
| (12) | Filed as an exhibit to Annual Report on Form 10-K for the fiscal year ended December 25, 2004 and incorporated herein by reference. |
| (13) | Filed as an exhibit to Registration Statement on Form S-8 filed on April 15, 2008 and incorporated herein by reference. |
| (14) | Filed as an exhibit to Annual Report on Form 10-K for the fiscal year ended December 26, 2009 and incorporated by reference herein. |
| (15) | Filed with the Corporation’s Definitive Proxy Statement on Schedule 14 filed as of March 17, 2010 and incorporated by reference herein. |
52
KOPIN CORPORATION
INDEX TO CONSOLIDATED FINANCIAL STATEMENTS
| Page | ||||
| 54 | ||||
| Consolidated Balance Sheets at December 31, 2011 and December 25, 2010 |
55 | |||
| 56 | ||||
| 56 | ||||
| 57 | ||||
| 58 | ||||
| 59 | ||||
53
REPORT OF INDEPENDENT REGISTERED PUBLIC ACCOUNTING FIRM
To the Board of Directors and Stockholders of
Kopin Corporation
Taunton, Massachusetts
We have audited the accompanying consolidated balance sheets of Kopin Corporation and subsidiaries (the “Company”) as of December 31, 2011 and December 25, 2010, and the related consolidated statements of operations, comprehensive income, stockholders’ equity, and cash flows for each of the three years in the period ended December 31, 2011. Our audits also included the financial statement schedule listed in the Index at Item 15(a)(2). These financial statements and financial statement schedule are the responsibility of the Company’s management. Our responsibility is to express an opinion on the financial statements and financial statement schedule based on our audits.
We conducted our audits in accordance with the standards of the Public Company Accounting Oversight Board (United States). Those standards require that we plan and perform the audit to obtain reasonable assurance about whether the financial statements are free of material misstatement. An audit includes examining, on a test basis, evidence supporting the amounts and disclosures in the financial statements. An audit also includes assessing the accounting principles used and significant estimates made by management, as well as evaluating the overall financial statement presentation. We believe that our audits provide a reasonable basis for our opinion.
In our opinion, such consolidated financial statements present fairly, in all material respects, the financial position of Kopin Corporation and subsidiaries as of December 31, 2011 and December 25, 2010, and the results of their operations and their cash flows for each of the three years in the period ended December 31, 2011, in conformity with accounting principles generally accepted in the United States of America. Also, in our opinion, such financial statement schedule, when considered in relation to the basic consolidated financial statements taken as a whole, presents fairly, in all material respects, the information set forth therein.
We have also audited, in accordance with the standards of the Public Company Accounting Oversight Board (United States), the Company’s internal control over financial reporting as of December 31, 2011, based on the criteria established in Internal Control—Integrated Framework issued by the Committee of Sponsoring Organizations of the Treadway Commission and our report dated March 15, 2012 expressed an unqualified opinion on the Company’s internal control over financial reporting.
/s/ Deloitte & Touche LLP
Boston, Massachusetts
March 15, 2012
54
CONSOLIDATED BALANCE SHEETS
| December 31, 2011 |
December 25, 2010 |
|||||||
| ASSETS | ||||||||
| Current assets: |
||||||||
| Cash and equivalents |
$ | 43,095,163 | $ | 49,834,547 | ||||
| Marketable debt securities, at fair value |
62,323,387 | 61,112,843 | ||||||
| Accounts receivable, net of allowance of $513,000 and $737,000 in 2011 and 2010, respectively |
16,510,851 | 14,539,664 | ||||||
| Accounts receivable from unconsolidated affiliates |
1,340,788 | 2,558,513 | ||||||
| Unbilled receivables |
36,115 | 391,171 | ||||||
| Inventory |
21,415,517 | 21,462,871 | ||||||
| Prepaid taxes |
412,068 | 664,320 | ||||||
| Prepaid expenses and other current assets |
1,294,368 | 2,060,833 | ||||||
|
|
|
|
|
|||||
| Total current assets |
146,428,257 | 152,624,762 | ||||||
| Property, plant and equipment, net |
32,369,441 | 32,613,961 | ||||||
| Deferred tax assets |
4,201,627 | — | ||||||
| Goodwill |
1,664,457 | — | ||||||
| Intangible assets, net |
1,953,660 | — | ||||||
| Other assets |
7,946,087 | 6,857,675 | ||||||
|
|
|
|
|
|||||
| Total assets |
$ | 194,563,529 | $ | 192,096,398 | ||||
|
|
|
|
|
|||||
| LIABILITIES AND STOCKHOLDERS’ EQUITY | ||||||||
| Current liabilities: |
||||||||
| Accounts payable |
$ | 12,384,870 | $ | 11,317,865 | ||||
| Accrued payroll and expenses |
4,182,505 | 2,741,004 | ||||||
| Accrued warranty |
1,318,000 | 1,300,000 | ||||||
| Billings in excess of revenue earned |
2,467,461 | 3,210,895 | ||||||
| Other accrued liabilities |
2,126,954 | 1,956,642 | ||||||
|
|
|
|
|
|||||
| Total current liabilities |
22,479,790 | 20,526,406 | ||||||
| Asset retirement obligations |
1,295,670 | 944,617 | ||||||
| Commitments and contingencies |
||||||||
| Stockholders’ equity: |
||||||||
| Preferred stock, par value $.01 per share: authorized, 3,000 shares; none issued |
— | — | ||||||
| Common stock, par value $.01 per share: authorized, 120,000,000 shares; issued 76,123,940 shares in 2011 and 74,604,442 shares in 2010; outstanding 64,361,491 in 2011 and 64,775,234 in 2010 |
732,263 | 725,708 | ||||||
| Additional paid-in capital |
315,710,160 | 313,311,889 | ||||||
| Treasury stock (8,864,767 and 7,795,605 shares in 2011 and 2010, respectively, at cost) |
(30,995,449 | ) | (26,580,823 | ) | ||||
| Accumulated other comprehensive income |
4,146,024 | 5,985,345 | ||||||
| Accumulated deficit |
(124,008,273 | ) | (127,606,200 | ) | ||||
|
|
|
|
|
|||||
| Total Kopin Corporation stockholders’ equity |
165,584,725 | 165,835,919 | ||||||
| Noncontrolling interest |
5,203,344 | 4,789,456 | ||||||
|
|
|
|
|
|||||
| Total stockholders’ equity |
170,788,069 | 170,625,375 | ||||||
|
|
|
|
|
|||||
| Total liabilities and stockholders’ equity |
$ | 194,563,529 | $ | 192,096,398 | ||||
|
|
|
|
|
|||||
See Accompanying Notes to Consolidated Financial Statements.
55
CONSOLIDATED STATEMENTS OF OPERATIONS
| Fiscal year ended |
2011 | 2010 | 2009 | |||||||||
| Revenues: |
||||||||||||
| Net product revenues |
$ | 125,464,687 | $ | 116,622,692 | $ | 108,118,271 | ||||||
| Research and development revenues |
5,679,908 | 3,763,074 | 6,536,486 | |||||||||
|
|
|
|
|
|
|
|||||||
| 131,144,595 | 120,385,766 | 114,654,757 | ||||||||||
| Expenses: |
||||||||||||
| Cost of product revenues |
82,110,464 | 81,224,350 | 75,982,694 | |||||||||
| Research and development-funded programs |
3,741,602 | 2,692,488 | 3,586,372 | |||||||||
| Research and development-internal |
22,133,360 | 17,041,440 | 10,560,662 | |||||||||
| Selling, general and administrative |
18,928,996 | 14,837,519 | 14,136,482 | |||||||||
| Impairment of intangible assets and goodwill |
4,999,512 | — | — | |||||||||
|
|
|
|
|
|
|
|||||||
| 131,913,934 | 115,795,797 | 104,266,210 | ||||||||||
|
|
|
|
|
|
|
|||||||
| (Loss) income from operations |
(769,339 | ) | 4,589,969 | 10,388,547 | ||||||||
| Other income and expense: |
||||||||||||
| Interest income |
1,305,240 | 2,192,334 | 2,180,678 | |||||||||
| Other income and expense, net |
93,125 | 77,202 | 728,686 | |||||||||
| Foreign currency transaction gains (losses) |
12,403 | (418,710 | ) | (1,005,184 | ) | |||||||
| Gain on loans to KTC |
— | — | 1,187,937 | |||||||||
| Gain on remeasurement of investment in KTC |
— | — | 599,328 | |||||||||
| Gain on sales of investments |
368,641 | 2,597,505 | — | |||||||||
| Other-than-temporary impairment of marketable debt securities |
(150,644 | ) | — | (926,630 | ) | |||||||
| Gain on sales of patents |
155,658 | 769,797 | 6,323,934 | |||||||||
|
|
|
|
|
|
|
|||||||
| 1,784,423 | 5,218,128 | 9,088,749 | ||||||||||
|
|
|
|
|
|
|
|||||||
| Income before benefit (provision) for income taxes, and equity (losses) earnings in unconsolidated affiliates and net (income) loss of noncontrolling interest |
1,015,084 | 9,808,097 | 19,477,296 | |||||||||
| Tax benefit (provision) |
3,541,000 | (252,000 | ) | (690,200 | ) | |||||||
|
|
|
|
|
|
|
|||||||
| Income before equity (losses) earnings in unconsolidated affiliates and net (income) loss of noncontrolling interest |
4,556,084 | 9,556,097 | 18,787,096 | |||||||||
| Equity (losses) earnings in unconsolidated affiliates |
(296,451 | ) | (600,299 | ) | 483,057 | |||||||
|
|
|
|
|
|
|
|||||||
| Net income |
$ | 4,259,633 | $ | 8,955,798 | $ | 19,270,153 | ||||||
| Net (income) loss attributable to the noncontrolling interest |
(661,706 | ) | (21,647 | ) | 173,217 | |||||||
|
|
|
|
|
|
|
|||||||
| Net income attributable to the controlling interest |
$ | 3,597,927 | $ | 8,934,151 | $ | 19,443,370 | ||||||
|
|
|
|
|
|
|
|||||||
| Net income per share |
||||||||||||
| Basic |
$ | 0.06 | $ | 0.14 | $ | 0.29 | ||||||
|
|
|
|
|
|
|
|||||||
| Diluted |
$ | 0.06 | $ | 0.13 | $ | 0.29 | ||||||
|
|
|
|
|
|
|
|||||||
| Weighted average number of common shares outstanding: |
||||||||||||
| Basic |
64,405,776 | 66,019,847 | 66,849,890 | |||||||||
|
|
|
|
|
|
|
|||||||
| Diluted |
65,234,212 | 66,711,501 | 67,457,751 | |||||||||
|
|
|
|
|
|
|
|||||||
CONSOLIDATED STATEMENTS OF COMPREHENSIVE INCOME
| Fiscal years ended |
2011 | 2010 | 2009 | |||||||||
| Net income |
$ | 4,259,633 | $ | 8,955,798 | $ | 19,270,153 | ||||||
| Foreign currency translation adjustments |
(1,368,829 | ) | 2,216,793 | 1,682,514 | ||||||||
| Holding (loss) gain on marketable securities |
(135,519 | ) | 1,274,580 | 4,615,316 | ||||||||
| Reclassifications of gains in net income |
(457,808 | ) | (1,732,568 | ) | (172,466 | ) | ||||||
|
|
|
|
|
|
|
|||||||
| Comprehensive income |
$ | 2,297,477 | $ | 10,714,603 | $ | 25,395,517 | ||||||
| Comprehensive loss attributable to the noncontrolling interest |
$ | (413,888 | ) | $ | (351,920 | ) | $ | (188,854 | ) | |||
|
|
|
|
|
|
|
|||||||
| Comprehensive income attributable to the controlling interest |
$ | 1,883,589 | $ | 10,362,683 | $ | 25,206,663 | ||||||
|
|
|
|
|
|
|
|||||||
See Accompanying Notes to Consolidated Financial Statements.
56
CONSOLIDATED STATEMENTS OF STOCKHOLDERS’ EQUITY
| Common Stock | Additional Paid-in Capital |
Treasury Stock |
Accumulated Other Comprehensive Income |
Accumulated Deficit |
Total Kopin Corporation Stockholders’ Equity |
Noncontrolling interest |
Total Stockholders’ Equity |
|||||||||||||||||||||||||||||
| Shares | Amount | |||||||||||||||||||||||||||||||||||
| Balance December 27, 2008 |
71,873,228 | $ | 718,732 | $ | 310,241,805 | $ | (14,552,865 | ) | $ | (168,303 | ) | $ | (157,757,433 | ) | $138,481,936 | $ | 2,912,519 | $ | 141,394,455 | |||||||||||||||||
| Exercise of stock options |
32,010 | 320 | 123,055 | — | — | — | 123,375 | — | 123,375 | |||||||||||||||||||||||||||
| Vesting of restricted stock |
555,604 | 5,556 | (5,556 | ) | — | — | — | — | — | — | ||||||||||||||||||||||||||
| Stock based compensation expense |
— | — | 1,884,340 | — | — | — | 1,884,340 | — | 1,884,340 | |||||||||||||||||||||||||||
| Net unrealized holding gain on marketable securities |
— | — | — | — | 4,442,850 | — | 4,442,850 | — | 4,442,850 | |||||||||||||||||||||||||||
| Foreign currency translation adjustments |
— | — | — | — | 1,320,443 | — | 1,320,443 | 362,071 | 1,682,514 | |||||||||||||||||||||||||||
| Cumulative effect adjustment as of March 29, 2009 related to non credit-related losses on investments recorded in operations |
— | — | — | — | (1,773,712 | ) | 1,773,712 | — | — | — | ||||||||||||||||||||||||||
| Change in other-than-temporary impairment loss recorded in other comprehensive income (loss) |
— | — | — | — | 735,535 | — | 735,535 | — | 735,535 | |||||||||||||||||||||||||||
| Acquisition of KTC equity interest |
— | — | (259,739 | ) | — | — | — | (259,739 | ) | 1,014,381 | 754,642 | |||||||||||||||||||||||||
| Restricted stock for tax withholding obligations |
(193,000 | ) | (1,930 | ) | (684,193 | ) | — | — | — | (686,123 | ) | — | (686,123 | ) | ||||||||||||||||||||||
| Treasury stock purchase |
— | — | — | (5,299,451 | ) | — | — | (5,299,451 | ) | — | (5,299,451 | ) | ||||||||||||||||||||||||
| Net income |
— | — | — | — | — | 19,443,370 | 19,443,370 | (173,217 | ) | 19,270,153 | ||||||||||||||||||||||||||
|
|
|
|
|
|
|
|
|
|
|
|
|
|
|
|
|
|
|
|||||||||||||||||||
| Balance December 26, 2009 |
72,267,842 | $ | 722,678 | $ | 311,299,712 | $ | (19,852,316 | ) | $ | 4,556,813 | $ | (136,540,351 | ) | $160,186,536 | $ | 4,115,754 | $ | 164,302,290 | ||||||||||||||||||
| Exercise of stock options |
9,665 | 97 | 36,147 | — | — | — | 36,244 | — | 36,244 | |||||||||||||||||||||||||||
| Vesting of restricted stock |
419,838 | 4,198 | (4,198 | ) | — | — | — | — | — | — | ||||||||||||||||||||||||||
| Stock based compensation expense |
— | — | 2,583,728 | — | — | — | 2,583,728 | — | 2,583,728 | |||||||||||||||||||||||||||
| Net unrealized holding gain on marketable securities |
— | — | — | — | (1,243,327 | ) | — | (1,243,327 | ) | — | (1,243,327 | ) | ||||||||||||||||||||||||
| Foreign currency translation adjustments |
— | — | — | — | 1,886,520 | — | 1,886,520 | 330,273 | 2,216,793 | |||||||||||||||||||||||||||
| Change in other-than-temporary impairment loss recorded in other comprehensive income (loss) |
— | — | — | — | 785,339 | — | 785,339 | — | 785,339 | |||||||||||||||||||||||||||
| Acquisition of KTC equity interest |
— | — | (72,882 | ) | — | — | — | (72,882 | ) | 321,782 | 248,900 | |||||||||||||||||||||||||
| Restricted stock for tax withholding obligations |
(126,510 | ) | (1,265 | ) | (530,618 | ) | — | — | — | (531,883 | ) | — | (831,883 | ) | ||||||||||||||||||||||
| Treasury stock purchase |
— | — | — | (6,728,507 | ) | — | — | (6,728,507 | ) | — | (6,728,507 | ) | ||||||||||||||||||||||||
| Net income |
— | — | — | — | — | 8,934,151 | 8,934,151 | 21,647 | 8,955,798 | |||||||||||||||||||||||||||
|
|
|
|
|
|
|
|
|
|
|
|
|
|
|
|
|
|
|
|||||||||||||||||||
| Balance December 25, 2010 |
72,570,835 | $ | 725,708 | $ | 313,311,889 | $ | (26,580,823 | ) | $ | 5,985,345 | $ | (127,606,200 | ) | $165,835,919 | $ | 4,789,456 | $ | 170,625,375 | ||||||||||||||||||
| Exercise of stock options |
19,700 | 197 | 72,248 | — | — | — | 72,445 | — | 72,445 | |||||||||||||||||||||||||||
| Vesting of restricted stock |
897,953 | 8,980 | (8,980 | ) | — | — | — | — | — | — | ||||||||||||||||||||||||||
| Stock based compensation expense |
— | — | 3,361,948 | — | — | — | 3,361,948 | — | 3,361,948 | |||||||||||||||||||||||||||
| Net unrealized holding loss on marketable securities |
— | — | — | — | (971,148 | ) | — | (971,148 | ) | — | (971,148 | ) | ||||||||||||||||||||||||
| Foreign currency translation adjustments |
— | — | — | — | (1,121,011 | ) | — | (1,121,011 | ) | (247,818 | ) | (1,368,829 | ) | |||||||||||||||||||||||
| Change in other-than-temporary impairment loss recorded in other comprehensive income |
— | — | — | — | 252,838 | — | 252,838 | — | 252,838 | |||||||||||||||||||||||||||
| Restricted stock for tax withholding obligations |
(262,230 | ) | (2,622 | ) | (1,026,945 | ) | — | — | — | (1,029,567 | ) | — | (1,029,567 | ) | ||||||||||||||||||||||
| Treasury stock purchase |
— | — | — | (4,414,626 | ) | — | — | (4,414,626 | ) | — | (4,414,626 | ) | ||||||||||||||||||||||||
| Net income |
— | — | — | — | — | 3,597,927 | 3,597,927 | 661,706 | 4,259,633 | |||||||||||||||||||||||||||
|
|
|
|
|
|
|
|
|
|
|
|
|
|
|
|
|
|
|
|||||||||||||||||||
| Balance December 31, 2011 |
73,226,258 | $ | 732,263 | $ | 315,710,160 | $ | (30,995,449 | ) | $ | 4,146,024 | $ | (124,008,273 | ) | $165,584,725 | $ | 5,203,344 | $ | 170,788,069 | ||||||||||||||||||
|
|
|
|
|
|
|
|
|
|
|
|
|
|
|
|
|
|
|
|||||||||||||||||||
See Accompanying Notes to Consolidated Financial Statements.
57
CONSOLIDATED STATEMENTS OF CASH FLOWS
| Fiscal year ended |
2011 | 2010 | 2009 | |||||||||
| Cash flows from operating activities: |
||||||||||||
| Net income |
$ | 4,259,633 | $ | 8,955,798 | $ | 19,270,153 | ||||||
| Adjustments to reconcile net income to net cash provided by operating activities: |
||||||||||||
| Depreciation and amortization |
8,598,672 | 6,565,365 | 5,990,951 | |||||||||
| Accretion (amortization) of premium or discount on marketable debt securities |
(152,665 | ) | 69,891 | (260,687 | ) | |||||||
| Stock-based compensation |
3,923,628 | 2,583,728 | 1,884,340 | |||||||||
| Net gain on investment transactions |
(368,641 | ) | (2,597,505 | ) | — | |||||||
| Losses (earnings) in unconsolidated affiliates |
296,451 | 600,299 | (483,057 | ) | ||||||||
| Impairment on marketable debt securities |
150,644 | — | 926,630 | |||||||||
| Impairment of intangible assets and goodwill |
4,999,512 | — | — | |||||||||
| Release of valuation allowance on deferred tax assets |
(4,266,000 | ) | — | — | ||||||||
| Gain on loans to KTC |
— | — | (1,187,937 | ) | ||||||||
| Gain on remeasurement of investment in KTC |
— | — | (599,328 | ) | ||||||||
| Foreign currency losses |
14,150 | 418,710 | 942,462 | |||||||||
| Change in allowance for bad debt |
(224,644 | ) | 154,000 | (588,066 | ) | |||||||
| Change in other non-cash items |
379,246 | (203,526 | ) | 564,252 | ||||||||
| Changes in assets and liabilities: |
||||||||||||
| Accounts receivable |
256,190 | 1,926,676 | 3,703,840 | |||||||||
| Inventory |
162,575 | (4,287,717 | ) | (2,666,190 | ) | |||||||
| Prepaid expenses and other current assets |
1,311,173 | (718,074 | ) | 132,458 | ||||||||
| Accounts payable and accrued expenses |
655,611 | 338,863 | (4,228,801 | ) | ||||||||
| Billings in excess of revenue earned |
(743,434 | ) | 126,833 | (43,861 | ) | |||||||
|
|
|
|
|
|
|
|||||||
| Net cash provided by operating activities |
19,252,101 | 13,933,341 | 23,357,159 | |||||||||
|
|
|
|
|
|
|
|||||||
| Cash flows from investing activities: |
||||||||||||
| Proceeds from sale of marketable debt securities |
40,732,353 | 47,956,856 | 31,328,136 | |||||||||
| Purchase of marketable debt securities |
(42,345,935 | ) | (48,730,506 | ) | (48,712,270 | ) | ||||||
| Other assets |
16,906 | 196,578 | (41,781 | ) | ||||||||
| Proceeds from sale of investments |
392,196 | 4,223,536 | — | |||||||||
| Net cash received from KTC equity interest investment |
— | — | 212,380 | |||||||||
| Cash paid to acquire FDD, net of cash acquired |
(10,084,307 | ) | — | — | ||||||||
| Purchase of cost based investment |
(1,980,609 | ) | — | — | ||||||||
| Proceeds from sale of property and equipment |
— | — | 426,537 | |||||||||
| Capital expenditures |
(7,132,371 | ) | (15,849,823 | ) | (3,684,630 | ) | ||||||
|
|
|
|
|
|
|
|||||||
| Net cash used in investing activities |
(20,401,767 | ) | (12,203,359 | ) | (20,471,628 | ) | ||||||
|
|
|
|
|
|
|
|||||||
| Cash flows from financing activities: |
||||||||||||
| Treasury stock purchases |
(4,414,626 | ) | (6,728,507 | ) | (5,299,451 | ) | ||||||
| Investment in KTC as controlling interest was acquired |
— | (72,085 | ) | (300,000 | ) | |||||||
| Issuance of KTC shares to noncontrolling interest |
— | 111,144 | — | |||||||||
| Settlements of restricted stock for tax withholding obligations |
(1,029,567 | ) | (531,883 | ) | (686,123 | ) | ||||||
| Proceeds from exercise of stock options |
72,445 | 36,244 | 123,375 | |||||||||
|
|
|
|
|
|
|
|||||||
| Net cash used in financing activities |
(5,371,749 | ) | (7,185,087 | ) | (6,162,199 | ) | ||||||
|
|
|
|
|
|
|
|||||||
| Effect of exchange rate changes on cash |
(217,970 | ) | 456,908 | 159,963 | ||||||||
|
|
|
|
|
|
|
|||||||
| Net decrease in cash and equivalents |
(6,739,384 | ) | (4,998,197 | ) | (3,116,705 | ) | ||||||
| Cash and equivalents: |
||||||||||||
| Beginning of year |
49,834,547 | 54,832,744 | 57,949,449 | |||||||||
|
|
|
|
|
|
|
|||||||
| End of year |
43,095,163 | $ | 49,834,547 | $ | 54,832,744 | |||||||
|
|
|
|
|
|
|
|||||||
| Supplemental disclosure of cash flow information: |
||||||||||||
| Income taxes paid |
$ | 186,000 | $ | 221,000 | $ | 1,304,000 | ||||||
|
|
|
|
|
|
|
|||||||
| Supplemental schedule of noncash investing activities: |
||||||||||||
| Construction in progress included in accrued expenses |
$ | 469,000 | $ | 1,194,000 | $ | 124,058 | ||||||
|
|
|
|
|
|
|
|||||||
See Accompanying Notes to Consolidated Financial Statements.
58
NOTES TO CONSOLIDATED FINANCIAL STATEMENTS
1. Summary of Significant Accounting Policies
The preparation of consolidated financial statements in conformity with accounting principles generally accepted in the United States of America requires management to make estimates and assumptions that affect the reported amounts of assets and liabilities and disclosure of contingent assets and liabilities at the date of the financial statements and the reported amounts of revenues and expenses during the reporting period. Actual results could differ from those estimates.
Fiscal Year
The Company’s fiscal year ends on the last Saturday in December. The fiscal year ended December 31, 2011 includes 53 weeks, the fiscal years ended December 25, 2010 and December 26, 2009 each include 52 weeks and are referred to as fiscal years 2011, 2010 and 2009, respectively, herein.
Principles of Consolidation
The consolidated financial statements include the accounts of the Company, its wholly owned subsidiaries, a majority owned (78%) subsidiary, Kowon Technology Co., Ltd. (Kowon), located in Korea and, a majority owned (90%) subsidiary Kopin Taiwan Corporation (KTC) located in Taiwan (collectively the “Company”). All inter-company transactions and balances have been eliminated. Amounts of Kowon and KTC not attributable to the Company are referred to as noncontrolling interests in the consolidated statements of operations. Investment in business entities in which the Company does not have control, but has the ability to exercise significant influence over operating and financial policies are accounted for by the equity method.
Revenue Recognition
The Company recognizes revenue if four basic criteria have been met: (1) persuasive evidence of an arrangement exists; (2) delivery has occurred and services rendered; (3) the price to the buyer is fixed or determinable; and (4) collectability is reasonably assured. The Company does not recognize revenue for products prior to customer acceptance unless it believes the product meets all customer specifications and the Company has a history of consistently achieving customer acceptance of the product. Provisions for product returns and allowances are recorded in the same period as the related revenues. The Company analyzes historical returns, current economic trends and changes in customer demand and acceptance of product when evaluating the adequacy of sales returns and other allowances. Certain product sales are made to distributors under agreements allowing for a limited right of return on unsold products. Sales to distributors are primarily made for sales to the distributor’s customers and not for their stocking of inventory. The Company delays revenue recognition for its estimate of distributor claims of right of return on unsold products based upon its historical experience with the Company’s products and specific analysis of amounts subject to return based upon discussions with the Company’s distributors or their customers.
The Company recognizes revenues from long-term research and development contracts on the percentage-of-completion method of accounting as work is performed, based upon the ratio of costs or hours already incurred to the estimated total cost of completion or hours of work to be performed. Revenue recognized at any point in time is limited to the amount funded by the U.S. government or contracting entity. The Company accounts for product development and research contracts that have established prices for distinct phases as if each phase were a separate contract. In some instances, the Company is contracted to create a deliverable which is anticipated to be qualified and go into full rate production stages. In those cases, the revenue recognition methodology will change from the percentage of completion method to the units-of-delivery method as new contracts are received after formal qualification has been completed.
59
KOPIN CORPORATION
NOTES TO CONSOLIDATED FINANCIAL STATEMENTS—(Continued)
The Company classifies amounts earned on contracts in progress that are in excess of amounts billed as unbilled receivables and classifies amounts received in excess of amounts earned as billings in excess of revenues earned. The Company invoices based on dates specified in the related agreement or in periodic installments based upon its invoicing cycle. The Company recognizes the entire amount of an estimated ultimate loss in its financial statements at the time the loss on a contract becomes known.
Research and Development Costs
Research and development expenses are incurred in support of internal display and III-V product development programs or programs funded by agencies or prime contractors of the U.S. government and commercial partners. Research and development costs include staffing, purchases of materials and laboratory supplies, circuit design costs, fabrication and packaging of experimental display products, and overhead, and are expensed immediately.
Cash and Equivalents and Marketable Securities
The Company considers all highly liquid, short-term debt instruments with original maturities of three months or less to be cash equivalents.
Marketable debt securities consist primarily of commercial paper, medium-term corporate notes, and United States government and agency backed securities. The Company classifies these marketable debt securities as available-for-sale at fair value in “Marketable Securities.” The investments in Advanced Wireless Semiconductor Company (AWSC) and WIN Semiconductor Corp. (WIN) are included in “Other Assets” as available-for-sale and at fair value. The Company records the amortization of premium and accretion of discounts on marketable debt securities in the results of operations.
The Company uses the specific identification method as a basis for determining cost and calculating realized gains and losses with respect to marketable debt securities. The gross gains and losses realized related to sales of marketable debt securities were not material during fiscal years 2011, 2010 and 2009.
Inventory
Inventory is stated at the lower of cost (determined on the first-in, first-out or specific identification method) or market and consists of the following at December 31, 2011 and December 25, 2010:
| 2011 | 2010 | |||||||
| Raw materials |
$ | 9,934,724 | $ | 10,775,935 | ||||
| Work-in-process |
5,220,353 | 4,159,064 | ||||||
| Finished goods |
6,260,440 | 6,527,872 | ||||||
|
|
|
|
|
|||||
| $ | 21,415,517 | $ | 21,462,871 | |||||
|
|
|
|
|
|||||
Inventory on consignment at customer locations was $3.9 million and $4.4 million at December 31, 2011 and December 25, 2010, respectively. Included in prepaid expenses and other current assets is a deposit of $0.4 million for raw materials in advance of delivery.
Property, plant and equipment
Property, plant and equipment are recorded at cost. Depreciation and amortization are provided using the straight-line method over the estimated useful lives of the assets, generally 3 to 10 years. Leasehold
60
KOPIN CORPORATION
NOTES TO CONSOLIDATED FINANCIAL STATEMENTS—(Continued)
improvements and leased equipment are amortized over the shorter of the term of the lease or the useful life of the improvement or equipment. As discussed below, obligations for asset retirement are accrued at the time property, plant and equipment is initially purchased or as such obligations are generated from use.
Product Warranty
The Company generally sells products with a limited warranty of product quality and a limited indemnification of customers against intellectual property infringement claims related to the Company’s products. The Company accrues for known warranty and indemnification issues if a loss is probable and can be reasonably estimated, and accrues for estimated incurred but unidentified issues based on historical activity. As of December 31, 2011 and December 25, 2010, the Company had warranty reserves of $1.3 million. For the fiscal years 2011, 2010 and 2009 warranty claims and reversals were approximately $1.4 million, $0.8 million and $1.2 million, respectively.
Asset Retirement Obligations
The Company recorded asset retirement obligations (ARO) liabilities of $1.3 million and $0.9 million at December 31, 2011 and December 25, 2010, respectively. This represents the legal obligations associated with retirement of the Company’s assets when the timing and/or method of settling the obligation are conditional on a future event that may or may not be within the control of the Company. The Company also recorded accumulated depreciation charges of $0.6 million and $0.6 million, at December 31, 2011 and December 25, 2010, respectively, which represents the cumulative amortization of the capitalized long-lived asset associated with this obligation. The Company estimated the ARO using a discounted cash flow model that considered the Company’s cost of capital as well as increases in costs prior to settlement of the obligations and considered the probability that performance would be required.
| 2011 | 2010 | |||||||
| Asset retirement obligation as of December 25, 2010 |
$ | 944,617 | $ | 903,133 | ||||
| Additions liabilities incurred |
309,119 | — | ||||||
| Accretion |
41,934 | — | ||||||
|
|
|
|
|
|||||
| Asset retirement obligation as of December 31, 2011 |
$ | 1,295,670 | $ | 944,617 | ||||
|
|
|
|
|
|||||
Income Taxes
The consolidated financial statements reflect provisions for federal, state, local and foreign income taxes. The Company recognizes deferred tax assets and liabilities for the future tax consequences attributable to differences between the financial statement carrying amounts of existing assets and liabilities and their respective tax basis, as well as operating loss and tax credit carryforwards. The Company measures deferred tax assets and liabilities using enacted tax rates expected to apply to taxable income in the years in which those temporary differences and carryforwards are expected to be recovered or settled. The effect on deferred tax assets and liabilities of a change in tax rates is recognized in income in the period that includes the enactment date. The Company provides valuation allowances if, based on the weight of available evidence, it is more likely than not that some or all of the deferred tax assets will not be realized.
Taiwan tax law requires a 10% tax on unappropriated earnings of the Company’s subsidiary KTC. The Company records this tax in the year the earnings are recorded.
61
KOPIN CORPORATION
NOTES TO CONSOLIDATED FINANCIAL STATEMENTS—(Continued)
Foreign Currency
Assets and liabilities of non-U.S. operations where the functional currency is other than the U.S. dollar are translated from the functional currency into U.S. dollars at year end exchange rates, and revenues and expenses at average rates prevailing during the year. Resulting translation adjustments are accumulated as part of accumulated other comprehensive income. Transaction gains or losses are recognized in income or loss in the period in which they occur.
Net Income Per Share
Basic net income per share is computed using the weighted-average number of shares of common stock outstanding during the period less any unvested restricted shares. Diluted earnings per common share is calculated using weighted-average shares outstanding and contingently issuable shares, less weighted-average shares reacquired during the period. The net outstanding shares are adjusted for the dilutive effect of shares issuable upon the assumed conversion of the Company’s common stock equivalents, which consist of outstanding stock options and unvested restricted stock units.
Weighted-average common shares outstanding used to calculate earnings per share, is as follows:
| 2011 | 2010 | 2009 | ||||||||||
| Weighted-average common shares outstanding—basic |
64,405,776 | 66,019,847 | 66,849,890 | |||||||||
| Stock options and nonvested restricted common stock |
828,436 | 691,654 | 607,861 | |||||||||
|
|
|
|
|
|
|
|||||||
| Weighted-average common shares outstanding—diluted |
65,234,212 | 66,711,501 | 67,457,751 | |||||||||
|
|
|
|
|
|
|
|||||||
The following were not included in weighted-average common shares outstanding- diluted because they are anti-dilutive.
| 2011 | 2010 | 2009 | ||||||||||
| Nonvested restricted common stock |
613,934 | 229,159 | 419,213 | |||||||||
| Stock options |
1,561,925 | 2,544,411 | 3,953,387 | |||||||||
|
|
|
|
|
|
|
|||||||
| Total |
2,175,859 | 2,773,570 | 4,372,600 | |||||||||
|
|
|
|
|
|
|
|||||||
Concentration of Credit Risk
The Company primarily invests its excess cash in government backed and corporate financial instruments management believes to be of high credit worthiness, which bear lower levels of relative credit risk. The Company relies on rating agencies to ascertain the credit worthiness of its marketable securities and, where applicable, guarantees by the Federal Deposit Insurance Company. The Company sells its products to customers worldwide and generally does not require collateral. The Company maintains a reserve for potential credit losses.
Fair Value of Financial Instruments
Financial instruments consist of current assets (except inventories, income tax receivables and prepaid assets) and certain current liabilities. Current assets (excluding marketable securities which are recorded at fair value) and current liabilities are carried at cost, which approximates fair value.
Stock-Based Compensation
The fair value of stock option awards is estimated on the date of grant using the Black-Scholes-Merton option-pricing model. There were no stock options granted in fiscal years 2011, 2010 or 2009.
62
KOPIN CORPORATION
NOTES TO CONSOLIDATED FINANCIAL STATEMENTS—(Continued)
The fair value of nonvested restricted common stock awards is generally the market value of the Company’s equity shares on the date of grant. The nonvested restricted common stock awards require the employee to fulfill certain obligations, including remaining employed by the Company for one, two or four years (the vesting period) and in certain cases also require meeting either performance criteria or the Company’s stock achieving a certain price. The performance criteria primarily consist of the achievement of the Company’s annual incentive plan goals. For nonvested restricted common stock awards which solely require the recipient to remain employed with the Company, the stock compensation expense is amortized over the anticipated service period. For nonvested restricted common stock awards which require the achievement of performance criteria, the Company reviews the probability of achieving the performance goals on a periodic basis. If the Company determines that it is probable that the performance criteria will be achieved, the amount of compensation cost derived for the performance goal is amortized over the service period. If the performance criteria are not met, no compensation cost is recognized and any previously recognized compensation cost is reversed. The Company recognizes compensation costs on a straight-line basis over the requisite service period for time vested awards.
In 2011, the Company granted compensation awards to its Chief Executive Officer that consisted of a grant of 260,000 shares of restricted stock and a grant of 380,000 shares of phantom stock to be settled in cash. The 260,000 shares of restricted stock and the 380,000 shares of phantom stock will vest at the end of the first 10 consecutive trading day period following the grant date during which the Company’s common stock trades at a price per share equal to or greater than $5.25, prior to September 12, 2016. The vesting of the awards upon achieving a closing stock price of $5.25 for 10 consecutive days is considered a market condition. The accounting for the 260,000 shares requires that the fair market value of the shares is determine on the grant day and then this fair market value is expensed straight-line over the derived service period. The accounting for the phantom stock award requires the Company to periodically assess the fair market value of the award, with increases or decrease in the fair market value being reflected in the statement of operations. The fair market value of the awards will be expensed over a derived service period currently estimated to be approximately 12 months. However, if the market condition occurs before the estimated service period of 12 months or if there are material changes in the underlying data used in the fair market valuation, the fair market valuation may increase or decrease and the period over which the fair market valuation is recognized in the statement of operations may increase or decrease.
Comprehensive Income
Comprehensive income is the total of net income and all other non-owner changes in equity including such items as unrealized holding gains (losses) on marketable equity and debt securities classified as available-for-sale and foreign currency translation adjustments.
The components of accumulated other comprehensive income (loss) is as follows:
| Cumulative Translation Adjustment |
Unrealized Holding (Loss) Gain on Marketable Securities |
Non-Credit Related Losses on Investments |
Accumulated Other Comprehensive Income (Loss) |
|||||||||||||
| Balance as of December 27, 2008 |
$ | (766,082 | ) | $ | 597,779 | $ | — | $ | (168,303 | ) | ||||||
| Changes during year |
1,320,443 | 4,442,850 | (1,038,177 | ) | 4,725,116 | |||||||||||
|
|
|
|
|
|
|
|
|
|||||||||
| Balance as of December 26, 2009 |
554,361 | 5,040,629 | (1,038,177 | ) | 4,556,813 | |||||||||||
| Changes during year |
1,886,520 | (1,243,327 | ) | 785,339 | 1,428,532 | |||||||||||
|
|
|
|
|
|
|
|
|
|||||||||
| Balance as of December 25, 2010 |
2,440,881 | 3,797,302 | (252,838 | ) | 5,985,345 | |||||||||||
| Changes during year |
(1,121,011 | ) | (971,148 | ) | 252,838 | (1,839,321 | ) | |||||||||
|
|
|
|
|
|
|
|
|
|||||||||
| Balance as of December 31, 2011 |
$ | 1,319,870 | $ | 2,826,154 | $ | — | $ | 4,146,024 | ||||||||
|
|
|
|
|
|
|
|
|
|||||||||
63
KOPIN CORPORATION
NOTES TO CONSOLIDATED FINANCIAL STATEMENTS—(Continued)
Impairment of Long-Lived Assets
The Company periodically reviews the carrying value of our long-lived assets to determine if facts and circumstances suggest that they may be impaired or that the amortization or depreciation period may need to be changed. The carrying value of a long-lived asset is considered impaired when the anticipated identifiable undiscounted cash flows from such asset are less than its carrying value. For assets that are to be held and used, impairment is measured based upon the amount by which the carrying amount of the asset exceeds its fair value. The carrying value of the Company’s long-lived assets was $32.4 million at December 31, 2011.
Recently Adopted Accounting Pronouncements
Intangibles, Goodwill and Other
In December 2010 and September 2011, the FASB issued ASU 2010-28 and ASU 2011-08 Intangibles—Goodwill and Other, respectively, which both modify the annual goodwill impairment testing procedures. ASU 2010-28 focuses on the carrying amount of goodwill for purposes of performing step one of the goodwill test and ASU 2011-08 focuses on allowing entities the ability to first assess the qualitative factors to determine whether it is necessary to perform the two-step quantitative goodwill impairment test. Both of these updates are effective for annual and interim reporting periods beginning after December 15, 2011 and early adoption is permitted. ASU 2010-28 requires retrospective application. The Company elected not to early adopt either of these updates and does not expect the adoption will have a material impact on its goodwill impairment calculation, financial position or results of operations.
Fair Value Measurement
In May 2011, the FASB issued ASU-2011-04 Fair Value Measurement that modifies the fair value measurements and disclosure requirements in U.S. GAAP and IFRS. This newly issued accounting standard clarifies the application of certain existing fair value measurement guidance and expands the disclosures for fair value measurements that are estimated using significant unobservable inputs. This guidance is effective on a prospective basis for annual and interim reporting periods beginning after December 15, 2011. The Company does not expect that adoption of this standard will have a material impact on its financial position or results of operations.
Statement of Comprehensive Income
In June 2011, the FASB issued ASU 2011-05 Statement of Comprehensive Income which (1) eliminates the option to present the components of other comprehensive income as part of the statement of changes in stockholders’ equity; (2) requires the consecutive presentation of the statement of net income and other comprehensive income; and (3) requires an entity to present reclassification adjustments on the face of the financial statements from other comprehensive income to net income. The FASB has deferred the third requirement under this ASU. This amendment does not change the items that must be reported in other comprehensive income or when an item of other comprehensive income must be reclassified to net income nor does this amendment affect how earnings per share is calculated or presented. This guidance is required to be applied retrospectively and is effective for fiscal years and interim periods beginning after December 15, 2011. The Company does not expect that adoption of this standard will have a material impact on its financial position or results of operations.
64
KOPIN CORPORATION
NOTES TO CONSOLIDATED FINANCIAL STATEMENTS—(Continued)
2. Property, Plant and Equipment
Property, plant and equipment consisted of the following at December 31, 2011 and December 25, 2010:
| Useful Life | 2011 | 2010 | ||||||||
| Land |
$ | 831,387 | $ | 867,573 | ||||||
| Buildings |
10 years | 5,773,270 | 5,106,251 | |||||||
| Equipment |
3-5 years | 68,794,841 | 48,225,704 | |||||||
| Leasehold improvements |
Life of the lease | 15,263,804 | 14,357,251 | |||||||
| Furniture and fixtures |
3 years | 400,304 | 404,143 | |||||||
| Equipment under construction |
1,889,396 | 16,536,645 | ||||||||
|
|
|
|
|
|||||||
| 92,953,002 | 85,497,567 | |||||||||
| Accumulated depreciation and amortization |
(60,583,561 | ) | (52,883,606 | ) | ||||||
|
|
|
|
|
|||||||
| $ | 32,369,441 | $ | 32,613,961 | |||||||
|
|
|
|
|
|||||||
There were no gains or losses on disposals of long-lived assets in fiscal years 2011, 2010 and 2009. Depreciation expense for the fiscal years 2011, 2010 and 2009 was approximately $7,934,000, $6,565,000 and $5,991,000 respectively.
3. Other Assets and Amounts Due To / Due From Affiliates
Other assets consist of the following as of December 31, 2011 and December 25, 2010:
| 2011 | 2010 | |||||||
| Marketable Equity Securities |
||||||||
| AWSC. |
$ | 1,602,096 | $ | 4,001,937 | ||||
| WIN |
1,709,189 | — | ||||||
| Non-Marketable Securities—Equity Method Investments |
||||||||
| KoBrite |
2,401,669 | 2,698,120 | ||||||
| Non-Marketable Securities-Cost Based Investments |
1,980,609 | — | ||||||
| Other |
252,525 | 157,618 | ||||||
|
|
|
|
|
|||||
| $ | 7,946,087 | $ | 6,857,675 | |||||
|
|
|
|
|
|||||
Marketable Equity Securities
As of December 31, 2011 and December 25, 2010 the Company had an investment in AWSC, with a fair market value of $1.6 million and $4.0 million, respectively and an adjusted cost basis of $0.7 million and $0.7 million, respectively. During the second quarter of 2011 the Company sold 300,000 shares of AWSC and recorded a gain of $0.4 million.
The table below shows amounts sold by the Company (revenues) from AWSC:
| 2011 | 2010 | 2009 | ||||||||||
| AWSC |
$ | 11,800,000 | $ | 14,466,000 | $ | 8,641,000 | ||||||
|
|
|
|
|
|
|
|||||||
As of December 31, 2011 the Company was owed $1.1 million from AWSC and $0.2 million from other related parties. As of December 25, 2010, the Company was owed $2.6 million from AWSC.
65
KOPIN CORPORATION
NOTES TO CONSOLIDATED FINANCIAL STATEMENTS—(Continued)
One of the Company’s Directors is a director of AWSC and several directors and officers of Kopin own amounts ranging from 0.1% to 0.5% of the outstanding stock of AWSC.
As of December 31, 2011 the Company had an investment in WIN, with a fair market value of $1.7 million and an adjusted cost basis of $0. In 2011 WIN completed an initial public offering on a Taiwanese stock market. The investment is now classified as an available-for-sale marketable equity security and its fair market value is determined by reference to quoted market prices. The Company had previously written the investment off. As a result of the reclassification as an available for sale marketable security the Company recorded an unrealized gain of $1.7 million in accumulated other comprehensive income.
AWSC and WIN are listed on the Gre Tai stock exchange in Taiwan. The Company determines the fair market value of these investments based on the quoted prices from this exchange.
During the year ended December 25, 2010 the Company sold its investment in Micrel, Inc. for $2.2 million and recorded a gain of $0.7 million and sold shares of AWSC for $1.7 million and recorded a gain of $1.6 million. In addition, in 2010 the Company received and recorded a gain of $0.3 million representing an amount escrowed from the sale of the Company’s Kenet investment in 2008.
Non-Marketable Securities—Equity Method Investments
Equity (losses) gains in unconsolidated affiliates recorded in the consolidated statement of operations are as follows:
| 2011 | 2010 | 2009 | ||||||||||
| KoBrite |
$ | (296,451 | ) | $ | (600,299 | ) | $ | (341,219 | ) | |||
| KTC |
— | — | 824,276 | |||||||||
|
|
|
|
|
|
|
|||||||
| Total |
$ | (296,451 | ) | $ | (600,299 | ) | $ | 483,057 | ||||
|
|
|
|
|
|
|
|||||||
The Company has an approximate 12% interest in KoBrite at December 31, 2011. The Company accounts for its interest using the equity method and at December 31, 2011 the carrying value of the investment was $2.4 million. KoBrite’s results are recorded one quarter in arrears. One of the Company’s Directors, who is the chairman of KTC, is a member of the Board of Directors of Bright LED, one of the other principal investors of KoBrite.
In the year ended December 27, 2008 the Company recorded equity losses of approximately $0.8 million and a loan loss reserve of approximately $1.2 million in connection with $2.0 million it loaned KTC in fiscal 2008. Subsequent to the close of the July 2009 acquisition of additional equity interest in KTC (described in Note 4) the loan was repaid and in 2009 the Company recorded a gain on the loan repayment of approximately $1.2 million and equity in earnings of unconsolidated affiliates of approximately $0.8 million.
Summarized financial information for KTC from the period January 1, 2010 to July 31, 2010 and the year ended December 31, 2009 and for KoBrite for the years ended September 30, 2011, 2010 and 2009 are as follows:
| 2011 | 2010 | 2009 | ||||||||||
| Current assets |
$ | 12,468,000 | $ | 8,952,000 | $ | 19,378,000 | ||||||
| Non current assets |
15,927,000 | 15,389,000 | 18,782,000 | |||||||||
| Current liabilities |
5,397,000 | 9,052,000 | 12,487,000 | |||||||||
| Revenues |
7,938,000 | 12,288,000 | 13,573,000 | |||||||||
| Margin loss |
(794,000 | ) | (1,316,000 | ) | (389,000 | ) | ||||||
| Loss from operations |
(2,685,000 | ) | (3,292,000 | ) | (2,793,000 | ) | ||||||
| Net loss |
$ | (2,526,000 | ) | $ | (3,091,000 | ) | $ | (2,410,000 | ) | |||
66
KOPIN CORPORATION
NOTES TO CONSOLIDATED FINANCIAL STATEMENTS—(Continued)
Non-Marketable Securities—Cost Method Investments
In the fourth quarter of 2011 the Company invested approximately $2.0 million in a private company which makes display related products.
The Company has a loan to a non-officer employee for approximately $140,000 at December 31, 2011, which is currently due.
The Company has entered into agreements to sell certain patents which it is not using and that had a carrying value of $0. The total consideration the Company receives for the sale of the patents is a percentage of any sublicense fees, after expenses, the buyer received. In 2011, 2010 and 2009 the Company recorded $0.2 million, $0.8 million and $6.3 million of income, respectively, which represented the Company’s share of sublicense fees income. The Company does not expect to receive any material additional amounts from the sales of these patents. There is no additional consideration to be received for the patents sold. The Company continues to evaluate the patents in its portfolio for opportunities to moneterize these assets.
4. Business Combinations
Kopin Taiwan Corp
From Kopin Taiwan Corp’s (KTC) inception in 2002 through July 2009 the Company owned approximately 35% of KTC. In July 2009, the Company purchased 19,572,468 and 128,226 shares of KTC common stock for approximately $5,975,000 and $300,000, respectively, which increased the Company’s ownership to approximately 87%. In 2010, the Company purchased 14,349,809 shares of KTC common stock for approximately $6,150,000 to increase the Company’s ownership to approximately 90%.
The consolidated statements of operations for the periods includes the following amounts which were recorded as a result of the transaction in 2009:
| 2009 | ||||
| Gain on remeasurement of Kopin’s previous investment in KTC |
$ | 599,000 | ||
| Repayment of loan by KTC which was previously written-off |
2,012,000 | |||
| Reduction in bad debt allowance |
507,000 | |||
In fiscal 2008, the Company recorded allowances for possible bad debts for the excess of what KTC owed the Company over what the Company owed KTC. During the nine months ended September 26, 2009 the Company reduced the allowance to $0, resulting in a reduction of selling, general and administrative expenses of approximately $0.5 million.
Prior to July 2009 the Company recorded its investment in KTC under the equity method and had written down the investment to $0. The Company remeasured and wrote-up its investment in KTC by approximately $0.6 million which represented the fair market value of the investment immediately prior to the purchase of the shares in July 2009.
One of the Company’s Directors is chairman of KTC and owns approximately 1% of the outstanding common stock of KTC. This director is also an employee and stockholder of MTI and is a member of the Board of Directors of KoBrite.
67
KOPIN CORPORATION
NOTES TO CONSOLIDATED FINANCIAL STATEMENTS—(Continued)
Included in the Company’s consolidated statement of operations for 2009 is $0.6 million of net income from KTC which represents KTC’s results of operations from July 30, 2009, the date the Company took a controlling interest in KTC, through December 26, 2009. The following supplemental pro forma disclosures are provided for the year ended December 26, 2009 assuming the acquisition of the controlling interest in KTC had occurred as December 28, 2008 (the first day of the Company’s 2009 fiscal year). All intercompany transactions have been eliminated.
| December 26, 2009 |
||||
| Revenues |
$ | 115,114,000 | ||
| Net income |
16,629,000 | |||
Forth Dimension Displays
On January 11, 2011, the Company purchased 100% of the outstanding common stock of Forth Dimension Displays Ltd. (FDD) for approximately $11.0 million plus contingent consideration. In addition to the approximate $11.0 million cash paid there were provisions for contingent consideration if certain revenue milestones were met. The revenue milestones were not met and no additional consideration was owed. Commencing in the first quarter of 2011, the Company consolidated the financial results of FDD. Accounting standards for business combinations require that an acquiring entity measures and recognizes identifiable assets acquired and liabilities assumed at the acquisition date fair value of the acquired company with limited exceptions.
The 2011 purchase of FDD shares was accounted for as follows:
| Cash consideration |
$ | 11,000,000 | ||
| Contingent consideration |
— | |||
|
|
|
|||
| Total purchase price |
$ | 11,000,000 | ||
|
|
|
The allocation of the purchase price is as follows:
| Jan 11, 2011 (As adjusted (A)) |
||||
| Cash and marketable securities |
$ | 1,000,605 | ||
| Accounts receivable |
341,156 | |||
| Inventory |
638,331 | |||
| Plant and equipment |
1,500,202 | |||
| Other identifiable assets |
247,711 | |||
| Customer relationships |
3,300,000 | |||
| Developed technology |
1,100,000 | |||
| Trademark portfolio |
220,000 | |||
| Identifiable liabilities |
(1,952,464 | ) | ||
| Goodwill |
4,604,459 | |||
|
|
|
|||
| Total |
$ | 11,000,000 | ||
| (A) | At the acquisition date the Company estimated that the contingent consideration would be $1.3 million and during 2011 it revised its estimate to $0. |
68
KOPIN CORPORATION
NOTES TO CONSOLIDATED FINANCIAL STATEMENTS—(Continued)
The Company’s goodwill balance is as follows:
| Goodwill, December 26, 2010 |
$ | — | ||
| Goodwill from the acquisition of FDD at Jan. 11, 2011 |
5,538,491 | |||
| Reduction in goodwill as a result of change in contingent consideration |
(934,032 | ) | ||
| Goodwill from the acquisition of FDD at Jan. 11, 2011, as adjusted |
4,604,459 | |||
| Impairment of goodwill |
(2,964,114 | ) | ||
| Foreign currency translation |
24,112 | |||
|
|
|
|||
| Goodwill, December 31, 2011 |
$ | 1,664,457 | ||
|
|
|
The Company performs impairment tests of goodwill at its reporting unit level. The Company conducts its annual goodwill impairment test on the last day of each fiscal year.
On December 31, 2011, the Company performed an impairment analysis of its finite-lived intangible assets based on a comparison of the undiscounted cash flows to the recorded carrying value of the intangible assets. This analysis resulted in the determination that a potential impairment was present. As a result of this analysis, the Company was required to determine the fair value of its finite-lived intangible assets and compare their respective fair values to their carrying values. The fair value of the acquired customer relationships is based on the benefit derived from the incremental revenue and related cash flows as a direct result of the customer relationships. The fair values of the acquired developed technology and trademark portfolio were determined by estimating the royalty expense that would be expected to be paid for the technology and trade name portfolio had they not been owned by the Company using market participant royalty rates and discounting the expected expense that is avoided given the Company’s ownership of these intangible assets. These forecasted cash flows are discounted to present value using an appropriate discount rate. As a result, the carrying values of the finite-lived intangible assets exceeded their fair values and the Company recorded impairments of $1.5 million related to customer relationships, $0.4 million related to developed technology, and $57,000 related to trademark portfolio.
After completing its finite-lived intangible asset impairment test, the Company completed its impairment analysis of the goodwill derived from the FDD acquisition and determined the goodwill was impaired. The Company’s impairment analysis for goodwill consisted of comparing the implied fair value of goodwill to its carrying value as of December 31, 2011. Determining the fair value of goodwill required determining the fair value of the FDD reporting unit using certain assumptions, including the consideration of two generally accepted valuation methodologies: (i) the income approach and (ii) the market approach. The income approach is based upon the present value of the expected income that can be generated through the ownership of the property. The market approach is a process by which the market value estimate is derived analyzing similar assets that have been recently sold or licensed and then comparing them to the subject. The Company concluded that, given the size of FDD and its relatively niche business, the income approach provided the most accurate method of valuation.
Based on this analysis, the Company recorded a $3.0 million goodwill impairment charge as of and for the year ended December 31, 2011.
The discount rate used was the value-weighted average of the Company’s estimated cost of equity and debt (“cost of capital”) derived using both known and estimated customary market metrics.
69
KOPIN CORPORATION
NOTES TO CONSOLIDATED FINANCIAL STATEMENTS—(Continued)
The identified intangible assets will be amortized on a straight-line basis over the following lives:
| Years | ||||
| Customer relationships |
7 | |||
| Developed technology |
7 | |||
| Trademark portfolio |
7 | |||
The Company recognized $170,000 and $665,000 in amortization for the three and twelve months ended December 31, 2011 related to its intangible assets.
Customer relationships represent the fair value of the underlying relationships and agreements with FDD customers. Developed technology represents the fair value of FDD’s technology as it exists in current products and has value through its continued use or reuse. The trademark represents the brand and name recognition associated with the marketing of FDD products and was determined to have a finite life.
The results of operations of the FDD acquisition have been included in the consolidated statements of operations from its acquisition date of January 11, 2011. FDD contributed approximately $4.9 million of net revenue to the consolidated results of operations for the fiscal year ended December 31, 2011. FDD’s net loss from operations included in the consolidated results of operation for the year ended December 31, 2011 was $6.9 million. The transaction related costs associated to the FDD acquisition were considered immaterial and included within selling, general and administrative expense for the fiscal year ended December 31, 2011.
The unaudited pro forma financial results for the fiscal year ended December 25, 2010 combine the unaudited historical results of the Company along with the unaudited historical results of FDD. The results include the effects of unaudited pro forma adjustments as if FDD was acquired on December 27, 2009 (the first day of the Company’s fiscal year 2010). There were no material nonrecurring pro forma adjustments in the calculation of revenue or earnings. The pro forma financial results presented below do not include any anticipated synergies or other expected benefits of the acquisition. The results of operations of FDD for the period January 1, 2011 through January 10, 2011 were immaterial. These results are presented for informational purposes only and are not necessarily indicative of future operations (in thousands, except per share amounts):
| Three Months Ended December 25, 2010 |
Twelve Months Ended December 25, 2010 |
|||||||
| Revenue |
$ | 34,590,000 | $ | 126,049,000 | ||||
| Net Income |
$ | 4,637,000 | $ | 8,497,000 | ||||
5. Financial Instruments
Fair Value Measurements
Financial instruments are categorized as Level 1, Level 2 or Level 3 based upon the method by which their fair value is computed. An investment is categorized as Level 1 when its fair value is based on unadjusted quoted prices in active markets for identical assets that the Company has the ability to access at the measurement date. An investment is categorized as Level 2 if its fair market value is based on quoted market prices for similar assets in active markets, quoted prices for identical or similar assets in markets that are not active, based on observable inputs such as interest rates, yield curves, or derived from or corroborated by observable market data by correlation or other means. An investment is categorized as Level 3 if its fair value is based on assumptions developed by the Company about what a market participant would use in pricing the assets.
70
KOPIN CORPORATION
NOTES TO CONSOLIDATED FINANCIAL STATEMENTS—(Continued)
The following table details the fair value measurements within the fair value hierarchy of the Company’s financial assets:
| Fair Value Measurement at December 31, 2011 Using: | ||||||||||||||||
| Total | Level 1 | Level 2 | Level 3 | |||||||||||||
| Money Markets and Cash Equivalents |
$ | 43,095,163 | $ | 43,095,163 | $ | — | $ | — | ||||||||
| U.S. Government Securities |
32,145,653 | 12,892,670 | 19,252,983 | — | ||||||||||||
| Corporate Debt |
18,754,992 | — | 18,754,992 | — | ||||||||||||
| Certificates of Deposit |
11,422,742 | — | 11,422,742 | — | ||||||||||||
| WIN Semiconductor Corp. |
1,709,189 | 1,709,189 | ||||||||||||||
| Advanced Wireless Semiconductor Company |
1,602,096 | 1,602,096 | — | — | ||||||||||||
|
|
|
|
|
|
|
|
|
|||||||||
| $ | 108,729,835 | $ | 59,299,118 | $ | 49,430,717 | $ | — | |||||||||
|
|
|
|
|
|
|
|
|
|||||||||
| Fair Value Measurement at December 25, 2010 Using: | ||||||||||||||||
| Total | Level 1 | Level 2 | Level 3 | |||||||||||||
| Money Markets and Cash Equivalents |
$ | 49,834,547 | $ | 49,834,547 | $ | — | $ | — | ||||||||
| U.S. Government Securities |
24,194,630 | 9,806,380 | 14,388,250 | — | ||||||||||||
| Corporate Debt |
23,212,833 | — | 23,212,833 | — | ||||||||||||
| Certificates of Deposit |
13,705,380 | — | 13,705,380 | — | ||||||||||||
| Advanced Wireless Semiconductor Company |
4,001,937 | 4,001,937 | — | — | ||||||||||||
|
|
|
|
|
|
|
|
|
|||||||||
| $ | 114,949,327 | $ | 63,642,864 | $ | 51,306,463 | $ | — | |||||||||
|
|
|
|
|
|
|
|
|
|||||||||
The corporate debt consists of floating rate notes with a maturity that is over multiple years but has interest rates which are reset every three months based on the then current three month London Interbank Offering Rate (3 month Libor). The Company determines the fair market values of these corporate debt instruments through the use of a model which incorporates the 3 month Libor, the credit default swap rate of the issuer and the bid and ask price spread of same or similar investments which are traded on several markets.
Marketable Debt Securities
Investments in available-for-sale marketable debt securities are as follows at December 31, 2011 and December 25, 2010:
| Amortized Cost | Unrealized Gains | Unrealized Losses | Fair Value | |||||||||||||||||||||||||||||
| 2011 | 2010 | 2011 | 2010 | 2011 | 2010 | 2011 | 2010 | |||||||||||||||||||||||||
| U.S. government and agency backed securities |
$ | 31,480,482 | $ | 23,899,218 | $ | 665,171 | $ | 295,412 | $ | — | $ | — | $ | 32,145,653 | $ | 24,194,630 | ||||||||||||||||
| Corporate debt and certificates of deposits |
30,879,717 | 36,949,546 | — | — | (701,983 | ) | (31,333 | ) | 30,177,734 | 36,918,213 | ||||||||||||||||||||||
|
|
|
|
|
|
|
|
|
|
|
|
|
|
|
|
|
|||||||||||||||||
| Total |
$ | 62,360,199 | $ | 60,848,764 | $ | 665,171 | $ | 295,412 | $ | (701,983 | ) | $ | (31,333 | ) | $ | 62,323,387 | $ | 61,112,843 | ||||||||||||||
|
|
|
|
|
|
|
|
|
|
|
|
|
|
|
|
|
|||||||||||||||||
71
KOPIN CORPORATION
NOTES TO CONSOLIDATED FINANCIAL STATEMENTS—(Continued)
The contractual maturity of the Company’s marketable debt securities is as follows at December 31, 2011:
| Less than One year |
One to Five years |
Greater than Five years |
Total | |||||||||||||
| U.S. government and agency backed securities |
$ | 5,301,740 | $ | 25,061,877 | $ | 1,782,036 | $ | 32,145,653 | ||||||||
| Corporate debt and certificates of deposits |
21,089,896 | 8,405,338 | 682,500 | 30,177,734 | ||||||||||||
|
|
|
|
|
|
|
|
|
|||||||||
| Total |
$ | 26,391,636 | $ | 33,467,215 | $ | 2,464,536 | $ | 62,323,387 | ||||||||
|
|
|
|
|
|
|
|
|
|||||||||
Other-than-Temporary Impairments
The Company reviews its marketable debt securities on a quarterly basis for the presence of other-than-temporary impairment (OTTI).
If the Company determines that an OTTI has occurred it further estimates the amount of OTTI resulting from a decline in the credit worthiness of the issuer (credit-related OTTI) and the amount of non credit-related OTTI. Noncredit-related OTTI can be caused by such factors as market illiquidity. Credit-related OTTI is recognized in earnings while noncredit-related OTTI on securities not expected to be sold is recognized in other comprehensive income (OCI). The Company reclassified $1.8 million of noncredit-related OTTI recognized in its earnings prior to March 29, 2009 from retained earnings to accumulated OCI as a cumulative effect adjustment when it adopted a new accounting standard in the second quarter of 2009.
Included in other income and expense is an impairment charge on investments in corporate debt instruments of $0.2 million and $0.9 million for fiscal years 2011 and 2010, respectively.
6. Stockholders’ Equity and Stock-Based Compensation
In December 2010 the Company’s Board of Directors authorized the repurchase of up to $15 million of the Company’s common stock in open market or negotiated transactions through December 2012. Since the plan’s inception through December 31, 2011 the Company has purchased 1,069,162 shares of its common stock for $4,414,626.
The Company has stock-based awards outstanding under several plans. In 2001, the Company adopted a 2001 Equity Incentive Plan (the Equity Plan) and a 2001 Supplemental Equity Plan (the Supplemental Plan). The Equity Plan authorized 7,100,000 shares of common stock, to be issued to employees, non-employees, and members of the Board of Directors (the Board). The Supplemental Plan authorized 1,300,000 shares of common stock, to be issued to employees and certain non-employees and only permits the issuance of nonqualified stock options and restricted common stock awards. The Equity Plan and the Supplemental had ten year lives and therefore no new equity awards may be issued under these plans. In 2010 the Company adopted a 2010 Equity Incentive Plan (the 2010 Equity Plan) which authorized the issuance of shares of common stock to employees, non-employees, and the Board. The 2010 Equity Plan has been subsequently amended to increase the number of authorized shares. The number of shares authorized is 1,800,000 plus the number of shares of common stock which were available for grant under the Equity Plan, the number of shares of common stock which were the subject of awards outstanding under the Equity Plan and are forfeited, terminated, cancelled or expire after the adoption of the 2010 Equity Plan and the number of shares of common stock delivered to the Company either in exercise of a Equity Plan award or in satisfaction of a tax withholding obligation. The option price of statutory incentive stock options shall not be less than 100% of the fair market value of the stock at the date of grant, or in the case of certain statutory incentive stock options, at 110% of the fair market value at the time of the grant. The
72
KOPIN CORPORATION
NOTES TO CONSOLIDATED FINANCIAL STATEMENTS—(Continued)
option price of nonqualified stock options is determined by the Board or Compensation Committee. Options must be exercised within a ten-year period or sooner if so specified within the option agreement. The term and vesting period for restricted stock awards and options granted under the 2010 Equity Plan are determined by the Board’s compensation committee.
The Company has available approximately 0.6 million shares of common stock available for issuance under the Company’s 2010 Equity Plan in excess of shares of common stock which have already been reserved for under previously issued equity awards.
Stock Options
A summary of stock option activity under the stock award plans as of December 31, 2011 and changes during the twelve month period is as follows:
| 2011 | ||||||||
| Shares | Weighted Average Exercise Price |
|||||||
| Balance, beginning of year |
2,899,261 | $ | 6.45 | |||||
| Options forfeited/cancelled |
(976,236 | ) | 9.19 | |||||
| Options exercised |
(19,700) | 3.68 | ||||||
|
|
|
|||||||
| Balance, end of year |
1,903,325 | $ | 5.07 | |||||
|
|
|
|||||||
| Exercisable, end of year |
1,903,325 | |||||||
|
|
|
|||||||
The following table summarizes information about stock options outstanding and exercisable at December 31, 2011:
| Options Outstanding | Options Exercisable | |||||||||||||||||||
| Range of Exercise Prices |
Number Outstanding |
Weighted Average Remaining Contractual Life (Years) |
Weighted Average Exercise Price |
Number Exercisable |
Weighted Average Exercise Price |
|||||||||||||||
| $ 0.01—$ 3.50 |
130,000 | 4.00 | $ | 3.49 | 130,000 | $ | 3.49 | |||||||||||||
| $ 3.75—$ 4.82 |
1,077,010 | 1.60 | 4.45 | 1,077,010 | 4.45 | |||||||||||||||
| $ 5.00—$ 8.72 |
596,215 | 2.13 | 5.70 | 596,215 | 5.70 | |||||||||||||||
| $10.00—$10.42 |
100,100 | 4.00 | 10.00 | 100,100 | 10.00 | |||||||||||||||
|
|
|
|
|
|||||||||||||||||
| 1,903,325 | 2.06 | $ | 5.07 | 1,903,325 | $ | 5.07 | ||||||||||||||
|
|
|
|
|
|||||||||||||||||
| Aggregate intrinsic value on December 31, 2011 |
$ | 78,637 | $ | 78,637 | ||||||||||||||||
|
|
|
|
|
|||||||||||||||||
No stock options were issued in 2011, 2010 or 2009. The intrinsic value of options exercised in 2011, 2010 and 2009 was approximately $23,000, $41,000 and $81,000, respectively. In June 2010 the Company issued a warrant to purchase 200,000 shares of the Company’s stock at $3.49. The warrant vests ratably over a two year period and as of December 31, 2011 150,000 shares had vested. The intrinsic value of the warrant at December 31, 2011 was approximately $78,000.
73
KOPIN CORPORATION
NOTES TO CONSOLIDATED FINANCIAL STATEMENTS—(Continued)
Cash received from option exercises under all share-based payment arrangements was approximately $0.1 million and $0.1 million for fiscal years 2011 and 2010, respectively. No tax benefits were realized during the three year period ended 2011 due to the existence of tax net operating loss carryforwards.
NonVested Restricted Common Stock
The Company has issued shares of nonvested restricted common stock to certain employees. Each award requires the employee to fulfill certain obligations, including remaining employed by the Company for one, two or four years (the vesting period) and in certain cases also meeting performance criteria. A summary of the activity for nonvested restricted common stock awards as of December 31, 2011 and changes during the twelve months then ended is presented below:
| Shares | Weighted Average Grant Fair Value |
|||||||
| Balance December 25, 2010 |
2,033,607 | $ | 3.79 | |||||
| Granted |
1,891,012 | 4.12 | ||||||
| Forfeited |
(128,988 | ) | 4.17 | |||||
| Vested |
(897,949 | ) | 3.13 | |||||
|
|
|
|||||||
| Balance, December 31, 2011 |
2,897,682 | $ | 4.20 | |||||
|
|
|
|||||||
The forfeitures in 2011 were primarily due to fact that the performance criteria were not met related to these awards.
Stock-Based Compensation
The following table summarizes stock-based compensation expense related to employee stock options and nonvested restricted common stock awards for the fiscal years 2011, 2010 and 2009 (no tax benefits were recognized):
| 2011 | 2010 | 2009 | ||||||||||
| Cost of product revenues |
$ | 613,274 | $ | 590,950 | $ | 475,461 | ||||||
| Research and development |
577,514 | 428,123 | 231,890 | |||||||||
| Selling, general and administrative |
2,732,840 | 1,564,655 | 1,176,989 | |||||||||
|
|
|
|
|
|
|
|||||||
| Total |
$ | 3,923,628 | $ | 2,583,728 | $ | 1,884,340 | ||||||
|
|
|
|
|
|
|
|||||||
Total unrecognized compensation expense for the nonvested restricted common stock as of December 31, 2011 totals $7,388,000 and is expected to be recognized over a period of 3 years.
7. Concentrations of Risk
Financial instruments that potentially subject the Company to concentration of credit risk other than marketable securities consist principally of trade accounts receivable. Trade receivables are primarily derived from sales to manufacturers of consumer electronic devices and wireless components or military applications.
74
KOPIN CORPORATION
NOTES TO CONSOLIDATED FINANCIAL STATEMENTS—(Continued)
Ongoing credit evaluations of customers’ financial condition are performed and collateral, such as letters of credit, are generally not required. The following table depicts the customer’s trade receivable balance as a percentage of gross trade receivables as of the end of the year indicated:
| Percent of Gross Accounts Receivable |
||||||||
| Customer |
2011 | 2010 | ||||||
| Skyworks Solutions, Inc. |
28 | % | 24 | % | ||||
| Advanced Wireless Semiconductor Co. |
* | 14 | ||||||
| DRS Technologies |
* | 11 | ||||||
| Raytheon Company |
14 | 11 | ||||||
Sales to significant non-affiliated customers, for fiscal years 2011, 2010 and 2009, as a percentage of total revenues is shown in the table below. Note the caption “Military Customers in Total” in the table below includes Raytheon and DRS Technologies but excludes research and development contracts. (The symbol “*” indicates that sales to that customer were less than 10% of the Company’s total revenues.)
| Sales as a Percent of Total Revenue |
||||||||||||
| Fiscal Year | ||||||||||||
| Customer |
2011 | 2010 | 2009 | |||||||||
| Skyworks Solutions, Inc. |
28 | % | 25 | % | 20 | % | ||||||
| Advanced Wireless Semiconductor Company |
9 | 12 | 8 | |||||||||
| DRS Technologies |
* | * | 19 | |||||||||
| Raytheon Company |
12 | 18 | 14 | |||||||||
| Military Customers in Total |
30 | 33 | 45 | |||||||||
| United States Government Funded Research and Development Contracts |
4 | 3 | 6 | |||||||||
Skyworks Solutions, Inc. (Skyworks Solutions) also uses the foundry services of Advanced Wireless Semiconductor Company (AWSC) to process the Company’s HBT transistor wafers on their behalf. The Company sells HBT transistor wafers directly to AWSC for eventual resale by AWSC to Skyworks Solutions. AWSC also purchases HBT transistor wafers from the Company for the processing and sale to other customers. The Company does not know exactly how many HBT transistor wafers sold to AWSC are for eventual delivery to Skyworks Solutions but believes the sales to Skyworks Solutions and AWSC should be aggregated for purposes of assessing the concentration of risk.
75
KOPIN CORPORATION
NOTES TO CONSOLIDATED FINANCIAL STATEMENTS—(Continued)
8. Income Taxes
The (benefit) provision for income taxes consists of the following for the fiscal years indicated:
| Fiscal Year | ||||||||||||
| 2011 | 2010 | 2009 | ||||||||||
| Current |
||||||||||||
| Federal |
$ | 150,000 | $ | 141,000 | $ | 251,000 | ||||||
| State |
242,000 | 231,000 | 468,000 | |||||||||
| Foreign |
333,000 | (120,000 | ) | (29,000 | ) | |||||||
|
|
|
|
|
|
|
|||||||
| Total current provision |
725,000 | 252,000 | 690,000 | |||||||||
| Deferred |
||||||||||||
| Federal |
3,977,000 | 10,253,000 | 6,532,000 | |||||||||
| State |
(30,000 | ) | 513,000 | 1,414,000 | ||||||||
| Foreign |
(467,000 | ) | (700,000 | ) | (100,000 | ) | ||||||
| Change in valuation allowance |
(7,746,000 | ) | (10,066,000 | ) | (7,846,000 | ) | ||||||
|
|
|
|
|
|
|
|||||||
| Total deferred provision |
(4,266,000 | ) | — | — | ||||||||
|
|
|
|
|
|
|
|||||||
| Total (benefit) provision for income taxes |
$ | (3,541,000 | ) | $ | 252,000 | $ | 690,000 | |||||
|
|
|
|
|
|
|
|||||||
Net operating losses utilized in 2011, 2010 and 2009 to offset federal and state taxes were $2,698,000, $2,743,000 and $6,923,000, respectively.
The actual income tax (benefit) provision reported from operations are different than those which would have been computed by applying the federal statutory tax rate to loss before income tax benefit. A reconciliation of income tax benefit as computed at the U.S. federal statutory income tax rate to the provision for income tax benefit is as follows:
| Fiscal Year | ||||||||||||
| 2011 | 2010 | 2009 | ||||||||||
| Tax provision at federal statutory rates |
$ | 355,000 | $ | 3,212,000 | $ | 6,817,000 | ||||||
| State tax liability |
158,000 | 150,000 | 1,718,000 | |||||||||
| Foreign deferred |
663,000 | (203,000 | ) | 10,000 | ||||||||
| Goodwill |
771,000 | — | — | |||||||||
| Nondeductible expenses |
415,000 | (35,000 | ) | (40,000 | ) | |||||||
| Utilized/expired net state operating loss carryforwards |
— | (28,000 | ) | (134,000 | ) | |||||||
| Provision to tax return adjustments and state tax rate change |
1,191,000 | 544,000 | (1,432,000 | ) | ||||||||
| Tax credits |
(858,000 | ) | (312,000 | ) | (636,000 | ) | ||||||
| Non-deductible equity compensation |
1,542,000 | 2,630,000 | 3,882,000 | |||||||||
| Other, net |
(32,000 | ) | (47,000 | ) | (1,649,000 | ) | ||||||
| Change in valuation allowance |
(7,746,000 | ) | (5,659,000 | ) | (7,846,000 | ) | ||||||
|
|
|
|
|
|
|
|||||||
| $ | (3,541,000 | ) | $ | 252,000 | $ | 690,000 | ||||||
|
|
|
|
|
|
|
|||||||
Pretax foreign (losses) earnings were approximately $(4,559,000), 237,000 and ($401,000) for fiscal years 2011, 2010 and 2009, respectively. The Company has not received remittance of any earnings from its foreign operations nor does it intend to in the foreseeable future. Accordingly, U.S. income taxes were not provided for approximately $10.2 million of undistributed earnings of the Company’s Korean subsidiary and $6.5 million of undistributed earnings of the Company’s Taiwan subsidiary.
76
KOPIN CORPORATION
NOTES TO CONSOLIDATED FINANCIAL STATEMENTS—(Continued)
Deferred taxes are provided to recognize the effect of temporary differences between tax and financial reporting. Deferred income tax assets and liabilities consist of the following:
| Fiscal Year | ||||||||
| 2011 | 2010 | |||||||
| Deferred tax liability: |
||||||||
| Intangible asset |
$ | (508,000 | ) | — | ||||
| Deferred tax assets: |
||||||||
| Federal net operating loss carryforwards |
3,398,000 | 6,137,000 | ||||||
| State net operating loss carryforwards |
13,000 | — | ||||||
| Foreign net operating loss carryforwards |
5,533,000 | 4,080,000 | ||||||
| Equity awards |
886,000 | 2,491,000 | ||||||
| Tax credits |
5,599,000 | 4,576,000 | ||||||
| Equipment |
5,068,000 | 5,300,000 | ||||||
| Investments |
3,867,000 | 3,818,000 | ||||||
| Other |
3,903,000 | 4,342,000 | ||||||
|
|
|
|
|
|||||
| Net deferred tax assets |
27,759,000 | 30,744,000 | ||||||
| Valuation allowance |
(23,493,000 | ) | (30,744,000 | ) | ||||
|
|
|
|
|
|||||
| $ | 4,266,000 | $ | — | |||||
|
|
|
|
|
|||||
As of December 31, 2011, the Company has available for tax purposes federal net operating loss carryforwards (NOLs) of $9.7 million expiring through 2021. The Company has recognized a full valuation allowance on its net deferred tax assets excluding the net deferred tax assets of KTC, as the Company has concluded that such assets are not more likely than not to be realized. Based upon KTC’s 2011 results of operations and 2012 projected results of operations the Company concluded that it was more likely than not that the benefit of the net deferred tax assets would be realized and removed the valuation allowance. The $7.7 million decrease in valuation allowance during fiscal year 2011 was due to the reversal of the $4.9 million KTC valuation allowance partially offset by a net decrease in deferred tax assets of approximately $1.7 million and utilization of net operating losses of $1.1 million. The change in valuation allowance during fiscal year 2010 was due to a net decrease in deferred tax assets of approximately $2.5 million and utilization of net operating losses of $3.1 million. The Company has not historically recorded, nor does it intend to record the tax benefits from stock awards until realized. Unrecorded benefits from stock awards approximated $12.9 million at December 31, 2011.
The Company’s income tax returns have not been examined by the Internal Revenue Service and are subject to examination for all years since 2002. State income tax returns are generally subject to examination for a period of 3 to 5 years after filing of the respective return. The state impact of any federal changes remains subject to examination by various states for a period of up to one year after formal notification to the states.
International jurisdictions have statutes of limitations generally ranging from 3 to 7 years after filing of the respective return. Years still open to examination by tax authorities in major jurisdictions include Korea (2006 onward), Japan (2006 onward), Hong Kong (2008 onward) and Taiwan (2010 onward) and UK returns (2011 onwards). The Company is not currently under examination in these jurisdictions.
9. Accrued Warranty
The Company warrants its products against defect for 12 months. A provision for estimated future costs and estimated returns for credit relating to warranty is recorded in the period when product is shipped and revenue
77
KOPIN CORPORATION
NOTES TO CONSOLIDATED FINANCIAL STATEMENTS—(Continued)
recognized, and is updated as additional information becomes available. The Company’s estimate of future costs to satisfy warranty obligations is based primarily on historical warranty expense experienced and a provision for potential future product failures. Changes in the accrued warranty for fiscal years 2011 and 2010 are as follows:
| Fiscal Year Ended | ||||||||
| December 31, 2011 |
December 25, 2010 |
|||||||
| Beginning Balance |
$ | 1,300,000 | $ | 1,600,000 | ||||
| Additions |
1,442,000 | 757,000 | ||||||
| Claim and reversals |
(1,424,000 | ) | (1,057,000 | ) | ||||
|
|
|
|
|
|||||
| Ending Balance |
$ | 1,318,000 | $ | 1,300,000 | ||||
|
|
|
|
|
|||||
10. Employee Benefit Plan
The Company has an employee benefit plan pursuant to Section 401(k) of the Internal Revenue Code of 1986, as amended. In 2011, the plan allowed employees to defer an amount of their annual compensation up to a current maximum of $16,500 if they are under the age of 50 and $22,000 if they are over the age of 50. The Company matches 50% of all deferred compensation up to a maximum of 3% of each employee’s annual compensation. The amount charged to operations in connection with this plan was approximately $229,000, $238,000 and $200,000 in fiscal years 2011, 2010 and 2009, respectively.
11. Commitments and Contingencies
Leases
The Company leases facilities located in Taunton and Westborough, Massachusetts, Scotts Valley, California, and Dalgety Bay, Scotland under non-cancelable operating leases. The Taunton leases expire in 2012 and 2020. The Westborough lease expires in 2023. The Scotts Valley lease terminates in 2012.The Dalgety Bay lease expires in 2013. Substantially all real estate taxes, insurance and maintenance expenses under these leases are the Company’s obligations and are expensed as incurred and were immaterial. The following is a schedule of minimum rental commitments under non-cancelable operating leases at December 31, 2011:
| Fiscal Year ending, |
Amount | |||
| 2012 |
1,031,000 | |||
| 2013 |
496,000 | |||
| 2014 |
461,000 | |||
| 2015 |
533,000 | |||
| 2016 |
569,000 | |||
| Thereafter |
1,897,000 | |||
|
|
|
|||
| Total minimum lease payments |
$ | 4,987,000 | ||
|
|
|
|||
Amounts incurred under operating leases are recorded as rent expense on a straight-line basis and aggregated approximately $1.8 million in fiscal year 2011, $1.6 million in fiscal year 2010 and $1.5 million in fiscal year 2009.
Other Agreements
The Company has entered into various license agreements which require payment of royalties based upon a set percentage of product sales, subject in some cases, to certain minimum amounts. Total royalty expense approximated $18,000, $27,000 and $20,000, respectively, in fiscal years 2011, 2010 and 2009.
78
KOPIN CORPORATION
NOTES TO CONSOLIDATED FINANCIAL STATEMENTS—(Continued)
The Company has a purchase and supply agreement with a significant HBT customer that expires in July 2012, excluding a last time buy option contained in the agreement. Under the terms of this agreement, the Company agreed to maintain capacity levels for manufacturing HBT wafers and the Company committed to a pricing schedule under certain circumstances. The agreement also requires the Company to give prior notice if the Company exits its HBT product line. In consideration for this agreement the customer agreed to source a certain percentage of its HBT wafer needs from the Company subject to the customer’s right to source HBT wafers from other sources if the Company is unable to meet their requirements under certain circumstances. The Company agreed that failure to meet its supply obligations under the agreement would allow the Company’s customer to obtain court ordered specific performance and if the Company does not perform it could then be liable for monetary damages up to a maximum of $40.0 million. To date the Company has met its commitments under this agreement.
Included in Billings in excess of revenue earned is $2.2 million which was received in 2008 from a state grant. Amounts from this grant are earned by achieving certain employment levels and other conditions through 2017. In the event the Company does not achieve these employment levels some or all of the $2.2 million will be refunded. The agreement also contains repayment provisions which require us to repay certain amounts back to the state if the Company fails to achieve certain employment milestones after years three and five of the agreement, or if we move certain parts of the Company’s operations out of the state. Based on current the Company has estimated that it may be required to repay $1.0 million to the state in 2012.
12. Litigation
The Company may engage in legal proceedings arising in the ordinary course of business. Claims, suits, investigations and proceedings are inherently uncertain and it is not possible to predict the ultimate outcome of such matters and our business, financial condition, results of operations or cash flows could be affected in any particular period.
13. Segments and Geographical Information
The Company’s chief operating decision maker is its Chief Executive Officer. The Company’s chief operating decision maker evaluates the operating results of the Company’s reportable segments based on revenues and net income (loss).
79
KOPIN CORPORATION
NOTES TO CONSOLIDATED FINANCIAL STATEMENTS—(Continued)
Effective as of January 11, 2011, when the Company acquired FDD, FDD is now a reportable segment. The Company has four operating and reportable segments: i) Kopin US, which includes the operations in the United States and the Company’s equity method investments, ii) Kowon iii) KTC and iv) FDD (commencing in 2011). The following table presents the Company’s reportable segment results for the years ended 2011, 2010 and 2009:
| Kopin U.S. | Kowon | KTC | FDD | Adjustments | Total | |||||||||||||||||||
| 2011 |
||||||||||||||||||||||||
| Revenues |
$ | 125,961,000 | $ | 10,989,000 | $ | 20,995,000 | $ | 4,874,000 | $ | (31,674,000 | ) | $ | 131,145,000 | |||||||||||
| Net income (loss) attributable to the controlling interest |
4,887,000 | 134,000 | 6,117,000 | (6,878,000 | ) | (662,000 | ) | 3,598,000 | ||||||||||||||||
| Total assets |
183,555,000 | 19,287,000 | 29,618,000 | 6,657,000 | (44,553,000 | ) | 194,564,000 | |||||||||||||||||
| Long lived assets |
14,022,000 | 2,689,000 | 14,624,000 | 1,038,000 | (4,000 | ) | 32,369,000 | |||||||||||||||||
| 2010 |
||||||||||||||||||||||||
| Revenues |
$ | 117,476,000 | $ | 11,603,000 | $ | 8,766,000 | $ | — | $ | (17,459,000 | ) | $ | 120,386,000 | |||||||||||
| Net income (loss) attributable to the controlling interest |
8,577,000 | (112,000 | ) | 433,000 | — | 36,000 | 8,934,000 | |||||||||||||||||
| Total assets |
174,973,000 | 19,992,000 | 19,652,000 | — | (22,521,000 | ) | 192,096,000 | |||||||||||||||||
| Long lived assets |
15,945,000 | 2,950,000 | 13,723,000 | — | (4,000 | ) | 32,614,000 | |||||||||||||||||
| 2009 |
||||||||||||||||||||||||
| Revenues |
$ | 113,183,000 | $ | 8,644,000 | $ | 3,346,000 | $ | — | $ | (10,518,000 | ) | $ | 114,655,000 | |||||||||||
| Net income (loss) attributable to the controlling interest |
19,642,000 | (1,095,000 | ) | 723,000 | — | 173,000 | 19,443,000 | |||||||||||||||||
| Total assets |
168,603,000 | 19,316,000 | 9,691,000 | — | (14,386,000 | ) | 183,224,000 | |||||||||||||||||
| Long lived assets |
13,906,000 | 2,969,000 | 3,882,000 | — | (4,000 | ) | 20,753,000 | |||||||||||||||||
The Company has $1.7 million of goodwill related to its FDD segment.
The adjustments to reconcile to the consolidated financial statement total revenue, net income (loss) and total assets include the elimination of intercompany sales and intercompany receivables and the recording of the noncontrolling interest in Kowon and KTC.
Geographical revenue information for the three years ended December 31, 2011, December 25, 2010 and December 26, 2009 was based on the location of the customers and is as follows:
| Fiscal Year | ||||||||||||||||||||||||
| 2011 | 2010 | 2009 | ||||||||||||||||||||||
| Revenue | % of Total | Revenue | % of Total | Revenue | % of Total | |||||||||||||||||||
| Asia-Pacific |
$ | 28,246,000 | 22 | % | $ | 27,977,000 | 23 | % | $ | 19,822,000 | 17 | % | ||||||||||||
| Americas |
102,899,000 | 78 | % | 92,409,000 | 77 | % | 94,833,000 | 83 | % | |||||||||||||||
|
|
|
|
|
|
|
|
|
|
|
|
|
|||||||||||||
| $ | 131,145,000 | 100 | % | $ | 120,386,000 | 100 | % | $ | 114,655,000 | 100 | % | |||||||||||||
|
|
|
|
|
|
|
|||||||||||||||||||
Revenues by product group consisted of approximately the following:
| Fiscal Year | ||||||||||||
| 2011 | 2010 | 2009 | ||||||||||
| III-V |
$ | 66,486,000 | $ | 62,244,000 | $ | 46,452,000 | ||||||
| Display |
64,659,000 | 58,142,000 | 68,203,000 | |||||||||
|
|
|
|
|
|
|
|||||||
| Total revenues |
$ | 131,145,000 | $ | 120,386,000 | $ | 114,655,000 | ||||||
|
|
|
|
|
|
|
|||||||
80
KOPIN CORPORATION
NOTES TO CONSOLIDATED FINANCIAL STATEMENTS—(Continued)
Long-lived assets by geographic area are as follows:
| Fiscal Years | ||||||||
| 2011 | 2010 | |||||||
| United States of America |
$ | 14,022,000 | $ | 15,944,000 | ||||
| United Kingdom |
1,038,000 | — | ||||||
| Republic of Korea |
2,685,000 | 2,947,000 | ||||||
| Taiwan, ROC |
14,624,000 | 13,723,000 | ||||||
|
|
|
|
|
|||||
| $ | 32,369,000 | $ | 32,614,000 | |||||
|
|
|
|
|
|||||
14. Selected Quarterly Financial Information (Unaudited)
The following tables present Kopin’s quarterly operating results for the fiscal years ended December 31, 2011 and December 25, 2010. The information for each of these quarters is unaudited and has been prepared on the same basis as the audited consolidated financial statements. In the opinion of management, all necessary adjustments, consisting only of normal recurring adjustments, have been included to present fairly the unaudited consolidated quarterly results when read in conjunction with Kopin’s audited consolidated financial statements and related notes. These operating results are not necessarily indicative of the results of any future period.
Quarterly Periods During Fiscal Year Ended December 31, 2011:
| Three months ended March 26, 2011 |
Three months ended June 25, 2011 |
Three months ended September 24, 2011 |
Three months ended December 31, 2011 |
|||||||||||||
| (In thousands, except per share data) | ||||||||||||||||
| Revenue |
$ | 34,934 | $ | 31,431 | $ | 29,566 | $ | 35,213 | ||||||||
| Gross profit (2) |
10,974 | 10,482 | 9,467 | 12,431 | ||||||||||||
| Net income attributable to the controlling interest |
$ | 2,066 | $ | 802 | $ | 797 | $ | (67 | ) | |||||||
| Net income per share (1): |
||||||||||||||||
| Basic |
$ | 0.03 | $ | 0.01 | $ | 0.01 | $ | 0.00 | ||||||||
| Diluted |
$ | 0.03 | $ | 0.01 | $ | 0.01 | $ | 0.00 | ||||||||
| Shares used in computing net income per share: |
||||||||||||||||
| Basic |
64,737 | 64,529 | 64,292 | 64,065 | ||||||||||||
| Diluted |
65,655 | 66,775 | 65,441 | 64,065 | ||||||||||||
| (1) | Net income per share is computed independently for each of the quarters presented; accordingly, the sum of the quarterly net income per share may not equal the total computed for the year. |
| (2) | Gross profit is defined as net product revenue less cost of product revenues. |
81
KOPIN CORPORATION
NOTES TO CONSOLIDATED FINANCIAL STATEMENTS—(Continued)
Quarterly Periods During Fiscal Year Ended December 25, 2010:
| Three months ended March 27 2010 |
Three months ended June 26 2010 |
Three months ended September 25 2010 |
Three months ended December 25, 2010 (3) |
|||||||||||||
| (In thousands, except per share data) | ||||||||||||||||
| Revenue |
$ | 25,454 | $ | 30,189 | $ | 31,602 | $ | 33,140 | ||||||||
| Gross profit (2) |
6,338 | 7,275 | 10,054 | 11,731 | ||||||||||||
| Net income attributable to the controlling interest |
$ | 1,037 | $ | 1,861 | $ | 1,361 | $ | 4,676 | ||||||||
| Net income per share (1): |
||||||||||||||||
| Basic |
$ | 0.02 | $ | 0.03 | $ | 0.02 | $ | 0.07 | ||||||||
| Diluted |
$ | 0.02 | $ | 0.03 | $ | 0.02 | $ | 0.07 | ||||||||
| Shares used in computing net income per share: |
||||||||||||||||
| Basic |
66,588 | 66,626 | 66,115 | 64,751 | ||||||||||||
| Diluted |
67,311 | 67,357 | 66,779 | 65,399 | ||||||||||||
| (1) | Net income (loss) per share is computed independently for each of the quarters presented; accordingly, the sum of the quarterly net income per share may not equal the total computed for the year. |
| (2) | Gross profit is defined as net product revenue less cost of product revenues. |
| (3) | The net income attributable to the controlling interest for the fourth quarter of fiscal year 2010 was impacted by gains of $1.4 million related to reimbursement of insurance claims. |
82
SIGNATURES
Pursuant to the requirements of Section 13 or 15(d) of the Securities Exchange Act of 1934, the registrant has duly caused this report to be signed on its behalf by the undersigned, thereunto duly authorized.
March 15, 2012
| KOPIN CORPORATION | ||
| By: | /s/ JOHN C.C. FAN | |
| John C.C. Fan Chairman of the Board, Chief Executive Officer, President and Director | ||
Pursuant to the requirements of the Securities Exchange Act of 1934, this report has been signed below by the following persons on behalf of the registrant in the capacities and on the dates indicated.
| Signature |
Title |
Date | ||
| /s/ JOHN C.C. FAN John C.C. Fan |
Chairman of the Board, Chief Executive Officer, President and Director (Principal Executive Officer) |
March 15, 2012 | ||
| /s/ JAMES BREWINGTON James Brewington |
Director | March 15, 2012 | ||
| /s/ DAVID E. BROOK David E. Brook |
Director | March 15, 2012 | ||
| /s/ MORTON COLLINS Morton Collins |
Director | March 15, 2012 | ||
| /s/ ANDREW H. CHAPMAN Andrew H. Chapman |
Director | March 15, 2012 | ||
| /s/ CHI CHIA HSIEH Chi Chia Hsieh |
Director | March 15, 2012 | ||
| /s/ MICHAEL J. LANDINE Michael J. Landine |
Director | March 15, 2012 | ||
| /s/ RICHARD A. SNEIDER Richard A. Sneider |
Treasurer and Chief Financial Officer (Principal Financial and Accounting Officer) |
March 15, 2012 | ||
83
KOPIN CORPORATION
SCHEDULE II—VALUATION AND QUALIFYING ACCOUNTS
Fiscal Years Ended December 31, 2011, December 25, 2010 and December 26, 2009
| Description |
Balance at Beginning of Year |
Additions Charged to Income |
Deductions from Reserve |
Balance at End of Year |
||||||||||||
| Reserve deducted from assets—allowance for doubtful accounts: |
||||||||||||||||
| 2009 |
$ | 1,171,000 | 114,000 | (702,000 | ) | 583,000 | ||||||||||
| 2010 |
583,000 | 156,000 | (2,000 | ) | 737,000 | |||||||||||
| 2011 |
737,000 | 182,000 | (406,000 | ) | 513,000 | |||||||||||
84
INDEX TO EXHIBITS
| Exhibits |
Sequential page number |
|||||||
| 3.1 | Amended and Restated Certificate of Incorporation | (2 | ) | |||||
| 3.2 | Amendment to Certificate of Incorporation | (5 | ) | |||||
| 3.3 | Amendment to Certificate of Incorporation | (5 | ) | |||||
| 3.4 | Fourth Amended and Restated By-laws | (8 | ) | |||||
| 4 | Specimen Certificate of Common Stock | (1 | ) | |||||
| 10.1 | Form of Employee Agreement with Respect to Inventions and Proprietary Information | (1 | ) | |||||
| 10.2 | Amended and Restated 1992 Stock Option Plan | (2 | )* | |||||
| 10.3 | 1992 Stock Option Plan Amendment | (5 | )* | |||||
| 10.4 | 1992 Stock Option Plan Amendment | (6 | )* | |||||
| 10.5 | Kopin Corporation 2001 Equity Incentive Plan | (7 | )* | |||||
| 10.6 | Kopin Corporation 2001 Equity Incentive Plan Amendment | (9 | )* | |||||
| 10.7 | Kopin Corporation 2001 Equity Incentive Plan Amendment | (10 | )* | |||||
| 10.8 | Kopin Corporation 2001 Equity Incentive Plan Amendment | (11 | )* | |||||
| 10.9 | Kopin Corporation 2001 Equity Incentive Plan Amendment | (13 | )* | |||||
| 10.10 | Kopin Corporation 2001 Supplemental Equity Incentive Plan | (6 | )* | |||||
| 10.11 | Form of Key Employee Stock Purchase Agreement | (1 | )* | |||||
| 10.12 | License Agreement by and between the Company and Massachusetts Institute of Technology dated April 22, 1985, as amended | (1 | ) | |||||
| 10.13 | Facility Lease, by and between the Company and Massachusetts Technology Park Corporation, dated October 15, 1993 | (3 | ) | |||||
| 10.14 | Joint Venture Agreement, by and among the Company, Kowon Technology Co., Ltd., and Korean Investors, dated as of March 3, 1998 | (4 | ) | |||||
| 10.15 | Seventh Amended and Restated Employment Agreement between the Company and Dr. John C.C. Fan, dated as of December 8, 2010 | (16 | ) | |||||
| 10.16 | Kopin Corporation Form of Stock Option Agreement under 2001 and 2010 Equity Incentive Plans | (12 | )* | |||||
| 10.17 | Kopin Corporation 2001 and 2010 Equity Incentive Plan Form of Restricted Stock Purchase Agreement | (12 | )* | |||||
| 10.18 | Kopin Corporation Fiscal Year 2012 Incentive Bonus Plan | * | ||||||
| 10.19 | Kopin Corporation Stock Purchase Agreement of 19,572,468 shares of Kopin Taiwan Corporation, (KTC) common stock | (14 | ) | |||||
| 10.20 | Kopin Corporation 2010 Equity Incentive Plan | (15 | ) | |||||
| 21.1 | Subsidiaries of Kopin Corporation | |||||||
| 23.1 | Consent of Independent Registered Public Accounting Firm | |||||||
| 31.1 | Chief Executive Officer Certification Pursuant to 18 U.S.C. Section 1350, as Adopted Pursuant to Section 302 of the Sarbanes-Oxley Act of 2002 | |||||||
| 31.2 | Chief Financial Officer Certification Pursuant to 18 U.S.C. Section 1350, as Adopted Pursuant to Section 302 of the Sarbanes-Oxley Act of 2002 | |||||||
| 32.1 | Chief Executive Officer Certification Pursuant to 18 U.S.C. Section 1350, as Adopted Pursuant to Section 906 of the Sarbanes-Oxley Act of 2002 | |||||||
85
| Exhibits |
Sequential page number | |||||
| 32.2 | Chief Financial Officer Certification Pursuant to 18 U.S.C. Section 1350, as Adopted Pursuant to Section 906 of the Sarbanes-Oxley Act of 2002 | |||||
| 101 | The following materials from the Company’s Annual Report on Form 10-K for the fiscal year ended December 31, 2011, formatted in XBRL (Extensible Business Reporting Language): (i) Consolidated Balance Sheets, (ii) Consolidated Statements of Income, (iii) Consolidated Statements of Cash Flows, and (iv) Notes to Consolidated Financial Statements, tagged as blocks of text |
|||||
| * | Management contract or compensatory plan required to be filed as an Exhibit to this Form 10-K. |
| (1) | Filed as an exhibit to Registration Statement on Form S-1, File No. 33-45853, and incorporated herein by reference. |
| (2) | Filed as an exhibit to Registration Statement on Form S-1, File No. 33-57450, and incorporated herein by reference. |
| (3) | Filed as an exhibit to Annual Report on Form 10-K for the fiscal year ended December 31, 1993 and incorporated herein by reference. |
| (4) | Filed as an exhibit to Annual Report on Form 10-Q for the quarterly period ended June 27, 1998 and incorporated herein by reference. |
| (5) | Filed as an exhibit to Quarterly Report on Form 10-Q for the quarterly period ended July 1, 2000 and incorporated herein by reference. |
| (6) | Filed as an exhibit to Registration Statement on Form S-8, filed on November 13, 2001 and incorporated herein by reference. |
| (7) | Filed as an appendix to Proxy Statement filed on April 20, 2001 and incorporated herein by reference. |
| (8) | Filed as an exhibit to Current Report on Form 8-K filed on December 12, 2008 and incorporated herein by reference. |
| (9) | Filed as an exhibit to Registration Statement on Form S-8 filed on August 16, 2002 and incorporated herein by reference. |
| (10) | Filed as an exhibit to Registration Statement on Form S-8 filed on March 15, 2004 and incorporated herein by reference. |
| (11) | Filed as an exhibit to Registration Statement on Form S-8 filed on May 10, 2004 and incorporated herein by reference. |
| (12) | Filed as an exhibit to Annual Report on Form 10-K for the fiscal year ended December 25, 2004 and incorporated herein by reference. |
| (13) | Filed as an exhibit to Registration Statement on Form S-8 filed on April 15, 2008 and incorporated herein by reference. |
| (14) | Filed as an exhibit to Annual Report on Form 10-K for the fiscal year ended December 26, 2009 and incorporated by reference herein. |
| (15) | Filed with the Corporation’s Definitive Proxy Statement on Schedule 14 filed as of March 17, 2010 and incorporated by reference herein. |
| (16) | Filed as an exhibit to Annual Report on Form 10-K for the fiscal year ended December 25, 2010 and incorporated by reference herein. |
86