Attached files
| file | filename |
|---|---|
| EXCEL - IDEA: XBRL DOCUMENT - CHINDEX INTERNATIONAL INC | Financial_Report.xls |
| EX-10.22 - EXHIBIT 10.22 - CHINDEX INTERNATIONAL INC | d295930dex1022.htm |
| EX-10.48 - EXHIBIT 10.48 - CHINDEX INTERNATIONAL INC | d295930dex1048.htm |
| EX-23.1 - EXHIBIT 23.1 - CHINDEX INTERNATIONAL INC | d295930dex231.htm |
| EX-31.1 - EXHIBIT 31.1 - CHINDEX INTERNATIONAL INC | d295930dex311.htm |
| EX-31.2 - EXHIBIT 31.2 - CHINDEX INTERNATIONAL INC | d295930dex312.htm |
| EX-31.3 - EXHIBIT 31.3 - CHINDEX INTERNATIONAL INC | d295930dex313.htm |
| EX-32.1 - EXHIBIT 32.1 - CHINDEX INTERNATIONAL INC | d295930dex321.htm |
| EX-32.2 - EXHIBIT 32.2 - CHINDEX INTERNATIONAL INC | d295930dex322.htm |
| EX-32.3 - EXHIBIT 32.3 - CHINDEX INTERNATIONAL INC | d295930dex323.htm |
| EX-10.23 - EXHIBIT 10.23 - CHINDEX INTERNATIONAL INC | d295930dex1023.htm |
Table of Contents
UNITED STATES
SECURITIES AND EXCHANGE COMMISSION
Washington, D.C. 20549
FORM 10-K
ANNUAL REPORT PURSUANT TO SECTION 13 OR 15(d) OF
THE SECURITIES EXCHANGE ACT OF 1934
For the Fiscal Year Ended December 31, 2011
Commission File No. 0-24624
CHINDEX INTERNATIONAL, INC.
(Exact name of registrant as specified in its charter)
![]()
| DELAWARE | 13-3097642 | |
| (State or other jurisdiction of incorporation or organization) |
(I.R.S. Employer Identification No.) |
4340 East West Highway, Suite 1100
Bethesda, Maryland 20814
(301) 215-7777
Securities registered pursuant to Section 12(b) of the Act: None
Securities registered pursuant to Section 12(g) of the Act:
Common Stock, $.01 par value and associated Preferred Stock Purchase Rights
Indicate by check mark if the registrant is a well-known seasoned issuer, as defined in Rule 405 of the Securities Act. Yes ¨ No x
Indicate by check mark if the registrant is not required to file reports pursuant to Section 13 or Section 15(d) of the Act. Yes ¨ No x
Indicate by check mark whether the registrant (1) has filed all reports required to be filed by Section 13 or 15(d) of the Securities Exchange Act of 1934 during the preceding 12 months (or for such shorter period that the registrant was required to file such reports), and (2) has been subject to such filing requirements for the past 90 days. Yes x No ¨
Indicate by check mark whether the registrant has submitted electronically and posted on its corporate Web site, if any, every Interactive Data File required to be submitted and posted pursuant to Rule 405 of Regulation S-T (& 232.405 of this chapter) during the preceding 12 months (or for such shorter period that the registrant was required to submit and post such files). Yes x No ¨
Indicate by check mark if disclosure of delinquent filers pursuant to Item 405 of Regulation S-K is not contained herein, and will not be contained, to the best of registrant’s knowledge, in a definitive proxy or information statements incorporated by reference in Part III of this Form 10-K or any amendment to this Form 10-K. x
Indicate by check mark whether the registrant is a large accelerated filer, an accelerated filer, a non-accelerated filer or a smaller reporting company. See the definitions of “large accelerated filer, “accelerated filer” and “smaller reporting company” in Rule 12b-2 of the Exchange Act.
| Large accelerated filer | ¨ | Accelerated filer | x | |||
| Non-accelerated filer | ¨ | Smaller reporting company | ¨ | |||
Indicate by check mark whether the registrant is a shell company (as defined in Rule 12b-2 of the Exchange Act). Yes ¨ No x
The aggregate market value of the voting stock held by non-affiliates computed by reference to the price at which the stock was sold, or the average bid and asked prices of such stock, as of June 30, 2011 (the last business day of the registrant’s most recently completed second fiscal quarter) was approximately $199,988,970.
The number of shares outstanding of each of the registrant’s class of common equity, as of March 8, 2012, was 15,652,917, shares of Common Stock and 1,162,500 shares of Class B Common Stock.
Documents Incorporated by Reference: Part III: Proxy Statement with respect to the Registrant’s 2012 annual meeting of shareholders.
Table of Contents
TABLE OF CONTENTS
| 3 | ||||
| 3 | ||||
| 4 | ||||
| 8 | ||||
| 8 | ||||
| 8 | ||||
| 9 | ||||
| 9 | ||||
| 26 | ||||
| 26 | ||||
| 27 | ||||
| 27 | ||||
| 27 | ||||
| 27 | ||||
| 31 | ||||
| ITEM 7. MANAGEMENT’S DISCUSSION AND ANALYSIS OF FINANCIAL CONDITION AND RESULTS OF OPERATIONS |
32 | |||
| 32 | ||||
| 34 | ||||
| Nine months ended December 31, 2010 compared to nine months ended December 31, 2009 |
33 | |||
| Fiscal year ended March 31, 2010 compared to fiscal year ended March 31, 2009 |
36 | |||
| 41 | ||||
| 44 | ||||
| 45 | ||||
| ITEM 7A. QUANTITATIVE AND QUALITATIVE DISCLOSURES ABOUT MARKET RISK |
45 | |||
| 45 | ||||
| ITEM 9. CHANGES IN AND DISAGREEMENTS WITH ACCOUNTANTS ON ACCOUNTING AND FINANCIAL DISCLOSURE |
77 | |||
| 77 | ||||
| 79 | ||||
| 79 | ||||
| ITEM 10. DIRECTORS, EXECUTIVE OFFICERS AND CORPORATE GOVERNANCE. |
79 | |||
| 79 | ||||
| 79 | ||||
| ITEM 13. CERTAIN RELATIONSHIPS AND RELATED TRANSACTIONS, AND DIRECTOR INDEPENDENCE |
79 | |||
| 79 | ||||
| 79 | ||||
| 79 | ||||
2
Table of Contents
Chindex International, Inc. (which we refer to as “Chindex” or “the Company,” “we” or “us”), founded in 1981, is an American health care company providing healthcare services in China through the operations of United Family Healthcare (“United Family”), a network of private primary care hospitals and affiliated ambulatory clinics. United Family currently operates in Beijing, Shanghai, Tianjin and Guangzhou. For the year ended December 31, 2011, our healthcare services business reported revenue of $114 million, a growth of 20% over the prior year. Our strategy is to continue our growth as a leading integrated healthcare provider in Greater China.
The Company historically also engaged in the distribution of western medical equipment to Chinese hospital purchasers through its former Medical Products division (“MPD”). The Company’s MPD business was restructured at the end of 2010 as described below.
Existing Facilities
We opened our first hospital facility in Beijing in 1997 and since inception have continuously pursued a strategy of expansion and market penetration. Our current operations consist of:
| • | Our Beijing hospital, which was the first private international-standards hospital in Beijing, recently was expanded to 120 licensed beds. |
| • | Four separate freestanding clinics in Beijing that coordinate services with our flagship hospital. |
| • | Our Shanghai hospital, which offers 50 licensed beds and made us the only foreign-invested, multi-facility hospital network in China. |
| • | Three medical clinics and one dental clinic in Shanghai that coordinate services with our flagship hospital. |
| • | Our Tianjin hospital, offering 26 licensed beds. |
| • | Our Guangzhou clinic, which offers its own broad scope of clinical services. |
Current Expansion Projects
We currently are engaged in a number of expansion projects in our current markets. The Chinese Government’s ongoing healthcare reform program encourages private investment, such as we offer, as the primary source for development of specialty and premium healthcare services within the Chinese healthcare system. Our current expansion projects include:
| • | In Beijing, continued expansion at our flagship hospital campus, where we recently more than doubled our licensed beds. |
| • | In Shanghai, continued expansion at our flagship hospital campus in Puxi and at our managed clinic in the Pudong district. |
3
Table of Contents
| • | In Tianjin, expansion through development of a freestanding clinic that will coordinate services with our newly opened hospital. |
| • | In Guangzhou, development of a new hospital expected to open in 2014-2015. |
Change in Fiscal Yearend
On September 27, 2010, the Board of Directors approved the change of the Company’s fiscal yearend from March 31 to December 31 each year, commencing with December 31, 2010.
Recent Joint Venture
Effective December 31, 2010, the Company and Shanghai Fosun Pharmaceutical (Group) Co., Ltd (“FosunPharma”) and its subsidiary Fosun Industrial Co., Limited (“Fosun Industrial” and, with Fosun Pharmaceutical, the “Fosun Entities”) and certain of their respective subsidiaries formed a joint venture created and consolidated under Chindex Medical Limited (“CML”), a Hong Kong company, for the purpose of engaging in (i) the marketing, distribution and servicing of medical equipment in China and Hong Kong (except that sales and distribution related activities in relation to sales and servicing in China and Hong Kong may take place in other jurisdictions) and (ii) the manufacturing, marketing, sales and distribution of medical devices and medical equipment and consumables (the “Medical Products Business”), including our former Medical Products division, which was transferred to the joint venture effective at the end of fiscal 2010. Consequently the business and results of operations of our former division have been deconsolidated from our financial statements, treated under the equity method of accounting, and retained by us only on a 49% equity interest basis. See Note 4 to the consolidated financial statements appearing elsewhere herein.
Our Healthcare Services Business
The United Family network is a leading international-standard healthcare provider committed to providing comprehensive and integrated healthcare services in a warm and caring patient and family service-oriented environment to the largest urban centers in China. Our patient base includes the expatriate communities and China’s rapidly growing upper-middle class. United Family generally transacts business in local Chinese currency. Services provided to patients who are not covered by insurance are on a fee-for-services cash basis.
In 1997, we opened the first private, international standard hospital in Beijing, which constituted our entry into the healthcare services arena. The development of the United Family network has continued in Beijing with increasing clinical services, opening of freestanding outpatient clinics and the recent completion of an expansion of the original hospital campus to offer 120 licensed beds. In 2004, we opened our second United Family hospital in the Puxi District of Shanghai. This made United Family the only foreign-invested, multi-facility hospital network in China. In 2008, we expanded the network to include operations at a facility in the southern China market of Guangzhou. That initial Guangzhou facility was opened in advance of our planned flagship hospital facility in Guangzhou, which we expect to open in 2014-2015. Also in 2008, we expanded our network to include a managed clinic in the city of Wuxi, west of Shanghai. In 2010, we expanded network operations with the opening of a managed clinic in the Pudong District of Shanghai and two additional clinics in Beijing. In 2011, we expanded the network to include a hospital facility offering 26 licensed beds in Tianjin, a city southeast of Beijing. Also in 2011, we expanded our managed clinic in the Pudong district of Shanghai, further increased service offerings in other existing facilities and opened a new dental clinic in Puxi in Shanghai near our existing hospital campus. Our facilities are managed through a corporate level shared administrative network allowing cost and clinical efficiencies.
4
Table of Contents
Emphasizing the need for well-care (routine visits in the absence of illness) and patient-centered care (involving the patient in healthcare decisions), United Family offers a full range of premium quality healthcare services throughout its hospital inpatient departments and integrated outpatient clinics as well as in satellite feeder clinics. These services include 24/7 emergency rooms, intensive care units and neonatal intensive care units, operating rooms, clinical laboratories, radiology and blood banking services. As an international-standard healthcare network we not only provide healthcare services at a level generally recognized and accepted internationally in the developed world, but we also manage our operations according to generally accepted international principles, such as those related to transparency, infection control, medical records, patient confidentiality and peer review. Our hospitals and clinics are staffed by a mix of Western and Chinese physicians. Our facilities are committed to community outreach programs and offer healthcare education classes, including CPR, Lamaze and Stress Management. The United Family facilities in Beijing, Shanghai and Guangzhou are accredited by the Joint Commission International (“JCI”).
The United Family flagship hospitals in both Beijing and Shanghai were originally licensed as 50-bed facilities with affiliated satellite clinics strategically located to expand geographical reach and service offerings into our target patient markets in those cities. In all markets, we establish direct billing relationships with most insurers covering care provided in China. Premium health insurance products are not yet widely available to our Chinese patient base. We continue to work toward facilitating more comprehensive insurance products to serve the increasing demand by the affluent Chinese population for high quality healthcare services. In addition, in 2008 the Chinese government announced a broad-based plan for reform of the Chinese healthcare system, including increasing investment such as a three-year $120 billion stimulus program, and development of health insurance products for the Chinese population. More recent reform policies announced by the Chinese government have emphasized the importance of developing policies friendly to the development of private medical facilities to cater to the varying needs of different strata of society beyond the basic care offered by the government. These reform and investment programs for the Chinese healthcare system remain a high priority for the Chinese government and we believe provide an advantageous environment for the development of our healthcare network. In December 2010 the Ministry of Health and the National Development and Reform Commission issued an opinion statement setting favorable policy in healthcare and specifically liberalizating and supporting investment in private healthcare in China.
Our more long-term expansion plans include the development of additional United Family facilities in the more affluent Chinese cities of Chengdu, Ningbo, Qingdao, and others, as well as additional facilities in our existing markets of Beijing, Shanghai, Tianjin and Guangzhou. Our plans also include the continued expansion of services at existing facilities and the opening of additional satellite clinics and hospitals.
Our proposed expansion will require capital resources, including the availability of financing and/or equity partners, as to which there can be no assurances. See “Risk Factors,” “Liquidity and Capital Resources” and Notes 7 and 8 to the consolidated financial statements.
United Family Beijing Market – Beijing United Family Hospital (BJU) and Clinics
BJU is housed in a modern facility in the eastern section of Beijing, amidst a concentration of high income communities. It was the first officially-approved healthcare joint venture to provide international-standard inpatient and outpatient healthcare services in China. The original entity was a contractual joint venture between Chindex and the Chinese Academy of Medical Sciences, with Chindex entitled to 90% of the net profits of the enterprise. In conjunction with the facility expansion from 50 to 120 licensed beds, a new contractual joint venture was established entitling Chindex to a 90% profit share. BJU received initial national level approvals from the Chinese Ministry of Health and Ministry of Foreign Trade and Economic Cooperation in 1995.
There currently are four satellite clinics affiliated with BJU. The first, which opened in 2002, is Beijing United Family Clinic – Shunyi. The Shunyi Clinic is located in the high-rent residential suburb of
5
Table of Contents
Shunyi County. It also is located near the International School of Beijing. The second, which opened in June of 2005, is Beijing United Jianguomen Clinic. It is in downtown Beijing in a prestigious luxury hotel complex in the heart of the diplomatic district. In 2010, we opened the third, Beijing United Family Clinic – Landmark, located in a high-rent diplomatic neighborhood and fourth, Beijing United Family New Hope Oncology Center, located close to the main hospital campus.
The expansion projects opening in Beijing in 2012-2014 will include a variety of increased services including comprehensive cancer care, neurosurgery, orthopedic surgery, cath lab and cardiovascular surgery. In addition, in 2011 we announced our latest development project, the United Family Rehabilitation Center in Beijing, which is a new 150 licensed bed, 124,000 square foot facility adjacent to a large park in east Beijing which is expected to open in 2012-2014. Our expansion of services into the premium rehabilitation market we expect will fill an existing void in China’s health care system for those seeking quality premium care when recovering from surgeries or debilitating illnesses in the neurological, cardiac and orthopedic areas.
BJU received accreditation from the JCI in 2004, its first reaccreditation in 2008 and its second reaccreditation in 2011. BJU is one of the few JCI-accredited hospitals in China. As a cornerstone component of the quality standard that is the hallmark of United Family, it is our goal that all of our facilities be JCI-accredited or eligible for such accreditation.
United Family Shanghai Market – Shanghai United Family Hospital (SHU) and Clinics
In 2002, we received approval to open a hospital venture in Shanghai. This second United Family hospital is located in the Changning District of Shanghai, which is a center of the expatriate community and an affluent Chinese residential district in Puxi, the western side of the Huangpu River. This facility is a contractual joint venture with our local partner, Shanghai Changning District Central Hospital, who provided the building site. Chindex is entitled to 70% of the net profits of the enterprise.
There are two satellite clinics affiliated with SHU in the Puxi district, an affiliated dental clinic close to the main hospital campus and the Shanghai Racquet Club Clinic, which also is geographically located in a luxury expatriate residential district. In 2011, we increased services at the current hospital campus and expanded into the Pudong district with an affiliated clinic established through a strategic joint venture management initiative. The Pudong district, on the eastern side of the Huangpu River, is another major residential concentration of expatriate and affluent Chinese populations. In 2012, we plan to continue to expand service offerings at the main Puxi campus, open a second clinic close to the hospital main campus and expand operations in Pudong.
The United Family hospital in Shanghai received its first JCI accreditation in 2008 and its first reaccreditation in 2011. It is one of only two JCI-accredited facilities in the Shanghai metropolitan area. As a cornerstone component of the quality standard that is the hallmark of United Family, it is our goal that all of our facilities be JCI-accredited or eligible for such accreditation.
United Family Tianjin Market – Tianjin United Family Hospital (TJU)
In 2011, we opened our entry facility in the northern city of Tianjin, which is 150 kilometers southeast of Beijing. Tianjin is China’s fifth largest city with a population of over 10 million and one of the fastest growing cities in China. Tianjin’s gross domestic product growth rates have been in the double digits in recent years. It is a Special Municipality administered directly by the Chinese Central Government. Tianjin United Family Hospital is located in the Hexi district of the city, one of the most affluent areas. Through close proximity to Beijing, the United Family brand and quality standards were already well known in Tianjin. Our facility is licensed for 26 beds and is designed to focus on primary care services. Expansion in the Tianjin market is planned through development of a satellite clinic in another affluent district of the city.
6
Table of Contents
United Family Guangzhou Market – Guangzhou United Family Clinic (GZC)
In 2008, we opened our entry facility in the southern city of Guangzhou. The Guangzhou United Family Clinic is located in the Yuexiu District of Guangzhou, a centrally located district in the affluent Chinese and international business and diplomatic community. In contrast to our clinics in Beijing and Shanghai, which were opened in support of a flagship hospital facility, the Guangzhou clinic is a stand-alone facility offering a broad scope of clinical services. This allows for United Family brand development and market penetration in Guangzhou in advance of the planned main hospital currently scheduled to open in 2014-2015. We believe that the demand for United Family services in Guangzhou is growing rapidly. Our Guangzhou clinic received its first JCI accreditation in 2011. As a cornerstone component of the quality standard that is the hallmark of United Family, it is our goal that all of our facilities be JCI-accredited or eligible for such accreditation.
United Family – The Investment Environment and New Market Development
The opportunity for growth in premium service healthcare markets in China has been significantly enhanced since the Chinese government initiated the current reform and investment program of the Chinese healthcare system in April of 2008. Most recently, in December 2010, the Chinese government’s National Development and Reform Commission and Ministry of Health issued an opinion which delineated a series of policies which we believe are favorable to and will benefit us and our proposed development of new markets for the United Family healthcare network. This opinion included the following points:
| • | The Chinese government encourages private capital investment in hospitals. |
| • | Healthcare projects will be moved from “restricted” to “permitted” in the Investment Catalog which may decrease the time it take to get projects approved. |
| • | The government hopes to gradually eliminate the 30% domestic ownership requirement and allow wholly-foreign owned (WFOE) hospitals on a pilot basis. |
| • | For-profit hospitals will be exempt from business tax and allowed to set pricing independently. |
These opinions from the highest levels of the Chinese government may be seen as indicators of a continuing favorable environment for our investment in premium healthcare services through our United Family healthcare network, although many of the specific changes cannot be implemented until attendant laws and regulations are issued pursuant to this opinion.
These opinions are in the context of China’s economic environment, which continues to be one of the most robust and positive in the world. The following points define the major characteristics of the investment environment for healthcare services in China and support the strategic growth plan for future development of United Family, which targets expansion into largely Chinese populated markets through the development of additional healthcare facilities in cities such as Chengdu, Qingdao and others, as well as additional facilities in our existing markets of Beijing, Shanghai, Tianjin and Guangzhou.
| • | China’s macro environment remained strong in 2011, poised for more modest growth in 2012 with GDP growing approximately 8.5% (American Chambers Commerce, Beijing 2012). |
| • | Affluent sectors of Chinese society are extremely under-served by the Chinese domestic healthcare system. |
7
Table of Contents
| • | UFH’s strategic growth plans now target top 3% - 5% in the 10 most affluent cities – over 2.5 million people. |
| • | More than 1 million millionaires in China now and growing at ~7% per year (Huren.com 2011). |
| • | Healthcare is second only to education in surveys of this demographic relative to disposable income. |
| • | Future health insurance products in China will facilitate broad based access to premium care. |
Our Joint Venture’s Medical Products Business
Our former Medical Products division sold medical capital equipment, instrumentation and other medical products for use in hospitals in China and Hong Kong on the basis of both exclusive and non-exclusive agreements with the manufacturers of these products. The joint venture, CML, combines our former Medical Products division and selected medical device companies of FosunPharma. The Chindex contributed businesses include distribution rights in China and Hong Kong for major imported brands in the areas of diagnostic ultrasound systems, robotic surgical systems, women’s health imaging systems and aesthetic laser systems. The FosunPharma contributed businesses include research and development and manufacturing in the areas of blood transfusion consumables and viral inactivation systems, surgical consumables and dental products and materials. CML’s growth strategy includes expansion of sales of existing products in the China market, new product introductions focusing on surgery, cardiology, dermatology, orthopedics, neurology/neurosurgery, women’s health and expansion of its current manufacturing base. CML also sells products in a variety of international markets and will seek to expand export sales in overseas markets. The joint venture also will seek to grow through mergers and acquisition strategies targeting both Chinese domestic and Western technologies.
There are no foreign investor-owned and operated hospital networks in China that compete with the United Family healthcare network in serving the expatriate, diplomatic and affluent local Chinese markets through a comprehensive healthcare service delivery system. Although plans for several foreign-invested hospitals had been previously announced, we do not know of any that have successfully opened. Although several local owners have opened specialty private hospitals, we understand that none are as comprehensive or would offer the same full scope and quality of services to the same patient base as United Family Healthcare. There are also, several Western-style outpatient clinics funded and controlled by foreign and/or domestic investors.
The Medical Products Business of the CML joint venture with FosunPharma competes with other independent distributors and manufacturers in China that market similar products. In markets for high value imported technologies, it faces significant competition from established manufacturers of medical equipment such as General Electric, Philips and Toshiba, as well as other Chinese, joint ventures and other foreign manufacturers. These manufacturers and distributors may maintain their own direct sales force in China and also sell through other distributors and may have greater resources, financial or otherwise, than does the joint venture.
At December 31, 2011, the Company had 1,448 full-time salaried employees. Of the full time salaried employees, 1,444 are located in China, of which 152 are expatriates and 1,292 are Chinese or third country nationals. Neither the Company nor its subsidiaries is subject to any labor union contracts. Employees’ compensation is usually indexed to local inflation statistics. The Company’s relations with its employees are good.
8
Table of Contents
Internet Information and SEC Documents
Our internet site is located at www.chindex.com. Copies of our reports and amendments thereto filed pursuant to Section 13(a) or 15(d) of the Securities Exchange Act of 1934, including Annual Reports filed on Form 10-K, Quarterly Reports filed on Form 10-Q and Current Reports filed on Form 8-K, may be accessed from the Company’s website, free of charge, as soon as reasonably practicable after we electronically file such reports with, or furnish such reports to, the Securities and Exchange Commission (SEC). The information found on our internet site is not part of this or any other report or statement Chindex files with or furnishes to the SEC.
The public may read and copy any materials we file with the SEC at the SEC’s Public Reference Room at 100 F Street, NE, Washington DC 20549. The public may obtain information on the operation of the Public Reference room by calling the SEC at 1-800-SEC-0330. Additionally, the SEC maintains an Internet site (http://www.sec.gov) that contains reports, proxy and information statements, and other information regarding issuers that file electronically with the SEC.
You should carefully consider the risks described below, together with all of the other information included in this Annual Report on Form 10-K. The following risks and uncertainties are not the only ones we face. However, these are the risks our management believes are material. If any of the following risks actually materialize, our business, financial condition or results of operations could be harmed. This report contains statements that are forward-looking. These statements are based on current expectations and assumptions that are subject to risks and uncertainties such as those listed below and elsewhere in this report, which, among others, should be considered in evaluating our future performance.
Risks Related to Our Business and Financial Condition
Global financial upheaval and credit restrictions may have a negative impact on operations.
In the year ended December 31, 2011, significant disruptions in the world financial and credit markets continued, including those in China, which have continued through the filing of this report. These events have been prolifically reported in the media. Should there be a catastrophic collapse of the global financial structure or continued downturns in China, we could lose our asset base and daily business operations, which could result in us being unable to operate the Company.
Our Healthcare Services business is dependent on foreign residents in Beijing, Shanghai, Tianjin and Guangzhou for the majority of its patients. Should foreign businesses significantly reduce their China operations, our hospitals could sustain a reduction in business, which may result in losses. To a lesser extent, our hospitals are dependent on affluent Chinese citizens for a portion of their patients. Should a slowdown in the Chinese economy continue or worsen, our hospitals could sustain a reduction in business which may result in losses.
The Medical Products Business of our joint venture, CML is somewhat dependent upon credit availability for the opening of bid and performance bonds and the extension of credit terms to Chinese customers through government-backed financing packages. The Medical Products Business has experienced and expects to continue to experience delays in renewal of credit facilities as they expire and/or delays or denials in approvals of new credit facilities similar in nature to existing facilities. Should there be a lack of sufficient credit availability, it may result in loss of bidding opportunities, delays in contract execution or cancellation of contracts.
9
Table of Contents
Our business, including our ongoing expansion projects, is capital intensive and we may not be able to access the capital markets or other sources of financing when we would like to raise capital.
We may not be able to raise adequate capital to complete some or all of our business strategies, including our ongoing expansion projects, or to react rapidly to changes in technology, products, services or the competitive landscape. Healthcare service and medical product providers in China often face high capital requirements in order to take advantage of new market opportunities, respond to rigorous competitive pressures and react quickly to changes in technology. Many of our competitors are committing substantial capital and, in many instances, are forming alliances to acquire or maintain market leadership. There can be no assurance that we will be able to satisfy our capital requirements in the future. In particular, our strategy of expanding our healthcare facilities and services includes the establishment and maintenance of healthcare facilities, which require particularly significant capital. In addition, CML plans to expand its distribution capabilities for medical products. In the absence of sufficient available capital, we would be unable to establish or maintain healthcare facilities as planned, and the joint venture would be unable to expand its distribution business as planned.
We may not generate sufficient cash flow to fund our capital expenditures, ongoing operations and indebtedness obligations.
Our ability to service our indebtedness and to fund planned capital expenditures will depend in part on our ability to generate cash flow. Our ability to generate cash flow is dependent on many factors, including:
| • | our future operating performance; |
| • | the demand for our services and products; |
| • | general economic conditions both in China and elsewhere and conditions affecting suppliers, customers and patients; |
| • | competition; and |
| • | legal and regulatory factors affecting us and our business, including exchange rate fluctuations. |
Some of these factors are beyond our control. If we are unable to generate sufficient cash flow, we may not be able to repay indebtedness, operate our business, respond to competition, pursue our growth strategy which is capital intensive and includes our ongoing expansion projects, or otherwise meet cash requirements.
If we fail to manage our growth or maintain adequate internal accounting, disclosure and other controls, we would lose the ability to manage our business effectively and/or experience errors or information lapses affecting public reporting.
We have expanded our operations rapidly in recent years and continue to explore ways to extend our service and product offerings. Our growth may place a strain on our management systems, information systems, resources and internal controls. Our ability to successfully offer services and provide products requires adequate information systems and resources and oversight from senior management. We will need to modify and improve our financial and managerial controls, reporting systems and procedures and other internal control and compliance procedures as we continue to grow and expand our business. If we are unable to manage our growth and improve our controls, systems and procedures, they may become ineffective, we may be unable to operate efficiently and we may lose the ability to manage many other aspects of our business effectively and/or experience errors or information lapses affecting public reporting.
10
Table of Contents
A control system, no matter how well designed and operated, cannot provide absolute assurance that the objectives of the control system are met, and no evaluation of controls can provide absolute assurance that all control issues have been detected. If we are not successful in discovering and eliminating weaknesses in internal controls, we will lose the ability to manage our business effectively.
If we lost the services of our key personnel, our leadership, expertise, experience, business relationships, strategic and operational planning and other important business attributes would be diminished.
Our success to a large extent depends upon the continued services of certain executive officers, particularly Roberta Lipson, our Chief Executive Officer, Lawrence Pemble, our Chief Operating Officer and Treasurer (as well as the chief financial officer of CML), Elyse Beth Silverberg, our Executive Vice President and Secretary (as well as the chief operating officer of CML) and Robert C. Low, our Senior Vice President for Finance and Chief Financial Officer. We have entered into an employment agreement with each of Ms. Lipson, Mr. Pemble, Ms. Silverberg and Mr. Low containing non-competition, non-solicitation and confidentiality provisions. The loss of service of any of our key employees could diminish our leadership, expertise, experience, business relationships, strategic and operating planning and other important business attributes, thus materially harming our business. In addition, the devotion of certain executives of time and effort to CML may reduce the services they are able to devote to the business of the Company.
Our business could be adversely affected by inflation or foreign currency fluctuation.
Because we receive 100% of our revenue and generate approximately 95% of our expenses within China, we have foreign currency exchange risk. The Chinese currency (RMB) is not freely traded and is closely controlled by the Chinese Government. The U.S. dollar (USD) has experienced volatility in world markets recently. During the year ended December 31, 2011, the RMB appreciated approximately 5.3% against the USD, resulting in an exchange gain of $670,000.
As part of our risk management program, we also perform sensitivity analyses to assess potential changes in revenue, operating results, cash flows and financial position relating to hypothetical movements in currency exchange rates. Our sensitivity analysis of changes in the fair value of the RMB to the USD at December 31, 2011, indicated that if the USD uniformly increased in value by 10% relative to the RMB, we would have experienced a 22% decrease in net income. Conversely, a 10% increase in the value of the RMB relative to the USD at December 31, 2011, would have resulted in a 27% increase in net income.
Based on the Consumer Price Index, for the year ended December 31, 2011, inflation in China was 5.4% and inflation in the United States was 3.2%. The average annual rate of inflation over the three-year period from 2009 to 2011 was 2.7% in China and 1.5% in the United States.
We have entered into loan arrangements that could impair our financial condition and prevent us from fulfilling our business obligations.
The Company has entered into financings with certain institutions pursuant to which we incurred indebtedness, which will require principal and interest payments. As of December 31, 2011, our total indebtedness was approximately $24 million, including $13 million of Tranche C Convertible Notes to a subsidiary of J. P. Morgan Chase & Co (JPM). Our indebtedness could affect our future operations, for example by:
| • | requiring a substantial portion of our cash flow from operations to be dedicated to the payment of principal and interest on indebtedness instead of funding working capital, capital expenditures, acquisitions and other business purposes; |
11
Table of Contents
| • | making it more difficult for us to satisfy all of our debt obligations, thereby increasing the risk of triggering a cross-default provision; |
| • | increasing our vulnerability to economic downturns or other adverse developments relative to less leveraged competitors; |
| • | limiting our ability to obtain additional financing for working capital, capital expenditures, acquisitions or other corporate purposes in the future; and |
| • | increasing our cost of borrowing to satisfy business needs. |
The Tranche C Notes mature in 2017 and are convertible by the holder at any time and will be automatically converted upon the opening of two proposed new and/or expanded hospitals in China (the “JV Hospitals”), subject to compliance with certain financing provisions. Notwithstanding the foregoing, the Tranche C Notes would be automatically converted after the earlier of 12 months having elapsed following commencement of operations at either of the JV Hospitals or either of the JV Hospitals achieving break-even earnings before interest, taxes, depreciation and amortization for any 12-month period ending on the last day of a fiscal quarter, subject to compliance with certain financing provisions. So long as we fail to meet the foregoing conditions to automatic conversion, the notes would remain outstanding, ultimately requiring repayment in 2017 or earlier upon any acceleration.
We currently are unable and may not in the future be able to draw down under our pre-existing loan facilities, which will be required for many of our expansion plans.
In 2007 and 2008, we entered into two US Dollar loan facilities in the amount of $25 million and $20 million with International Finance Corporation (IFC) and DEG-Deutsche Investitions und Entwicklungsgesellschaft (DEG), respectively, for the financing of expansion projects in China. The conditions to disbursement to these loan facilities have never been met and may never be met and the applicable lender has a right to terminate its commitment, with DEG having notified us of such effective termination. In order to draw under the IFC facility, we would have to amend the terms of that facility with respect to project scope, formation of joint venture entities (such entities have yet to be approved to construct, equip and operate their respective new Joint Venture Hospitals), collateral package, timing of disbursements (and extension of deadlines which have already passed) and other related provisions. However, we experienced delays in the development timeline and certain changes in project scope for the proposed healthcare facilities was necessary because of fluctuations and uncertainties in the real estate markets in China resulting from the global economic downturn and, as a result, the process to formally approve the two joint ventures has taken longer than originally anticipated. In July 2010, however, we received formal approval of the new joint venture for the Beijing expansion project from the Chinese authorities and are currently in discussions with IFC to amend its loan facility in order to draw thereunder. There can be no assurances that we will be able to amend the IFC facility on terms acceptable to us and IFC, which failure could have a material adverse effect on ability to complete all of our on going expansion projects as scheduled.
We may be unable to service or refinance our debt.
Our ability to make scheduled payments on, or to reduce or refinance, our indebtedness will depend on our future financial and operating performance. To a certain extent, our future performance will be affected by the impact of general economic, financial, competitive and other factors beyond our control, including the availability of financing in the banking and capital markets. We cannot be certain that our business will generate sufficient cash flow from operations to service our debt. If we are unable to meet our debt obligations or to fund our other liquidity needs, we will need to restructure or refinance all or a portion of our debt to avoid defaulting on our debt obligations or to meet other business needs. A refinancing of any
12
Table of Contents
of our indebtedness could be at higher interest rates, could require us to comply with more onerous covenants that further restrict our business operations, could be restricted by another of our debt instruments outstanding, or refinancing opportunities may not be available at all.
The terms of our indebtedness impose significant restrictions on our operating and financial flexibility.
The agreements relating to our indebtedness contain various covenants that limit our (and our subsidiaries’) ability to, among other things:
| • | incur or guarantee additional indebtedness; |
| • | make restricted payments, including dividends and management fees; |
| • | create or permit certain liens; |
| • | enter into business combinations and asset sale transactions; |
| • | make investments; |
| • | enter into transactions with affiliates; |
| • | incur certain expenditures; and |
| • | enter into new businesses. |
The terms of our agreements with JPM impose covenants that if not complied with could result in claims for damages and the acceleration of the Tranche C Notes, which we may be unable to convert to our common stock.
We entered into an investor rights agreement with JPM, pursuant to which, until the fifth anniversary of the date of such agreement (which anniversary is November 13, 2012), JPM will be entitled to certain financial information on an ongoing basis, access to our books and records, assurances of our management continuity, limitations on the use of proceeds to the JV Hospitals and other prescribed purposes, maintenance of our insurance policies, assurances as to certain terms of any new joint ventures entered into by us in connection with the JV Hospitals, cross defaults with certain other debt, various limitations on future issuances of equity securities by us, a right of first refusal as to 20% of certain future equity securities issuances (which would apply as to the anticipated final closing under the Stock Purchase Agreement discussed below), consolidated leverage ratio and consolidated interest coverage ratio financial covenants and other covenants and conditions. In the event that we fail to satisfy any of the covenants contained in the investor rights agreement, we may face claims for damages and the inability to automatically convert the Tranche C Notes to our common stock.
If requisite pending governmental approvals are not achieved, the Chindex Medical Limited joint venture may not be able to receive dividends from certain businesses included in the joint venture or proceeds of any sale of that portion of the joint venture’s business, which would adversely affect the joint venture and us.
Effective on December 31, 2010, the Company and Shanghai Fosun Pharmaceutical (Group) Co., Ltd (“FosunPharma”) and its subsidiary Fosun Industrial Co., Limited (“Fosun Industrial” and, with Fosun Pharmaceutical, the “Fosun Entities”) and certain of their respective subsidiaries formed a joint venture created and consolidated under CML, a Hong Kong company, for the purpose of engaging in (i) the marketing, distribution and servicing of medical equipment in China and Hong Kong (except that sales and
13
Table of Contents
distribution related activities in relation to sales and servicing in China and Hong Kong may take place in other jurisdictions) and (ii) the Medical Products Business, including our former Medical Products division, which was transferred to the joint venture effective December 31, 2010.
As previously disclosed, the Company, a subsidiary of the Company and CML previously entered into the Formation Agreement (the “Formation Agreement”) dated December 28, 2010 with FosunPharma and certain of its subsidiaries. The Formation Agreement provides for the formation and investiture of CML by the Company and the Fosun Entities in two separate closings. On December 31, 2010, the initial closing (the “Initial Closing”) under the Formation Agreement took place pursuant to which CML is now 51%-owned by FosunPharma and 49%-owned by the Company. At the Initial Closing, FosunPharma purchased its 51% interest in CML for a secured promissory note in the amount of $20,000,000. The contribution and investiture to CML of the portion of the Business to be contributed by FosunPharma was subject to the receipt of requisite governmental approvals and other closing conditions. On June 24, 2011, upon the issuance of certain amended business licenses from the Chinese government, CML became the holder of legal title to the FosunPharma-contributed businesses, and on August 30, 2011, CML paid to FosunPharma the purchase price for the FosunPharma-contributed businesses. Notwithstanding this transfer and payment, the registration with and approval of Shanghai Administration of Foreign Exchange (“SAFE”) is required in order for CML to obtain certain rights and benefits as shareholder of such businesses, including the right to receive dividends declared by the FosunPharma-contributed businesses or the proceeds of any sale of a company included in the FosunPharma-contributed businesses. Until such approval is obtained, CML will be entitled to such benefits on a contractual basis under the entrustment arrangement and other agreements relating to the joint venture. Upon the completion of the registration with and approval of SAFE, which will entitle CML to receive dividends from and proceeds of any sale of the FosunPharma-contributed businesses, the formal closing (the “Final Closing”) with respect to the investiture of the FosunPharma-contributed businesses will occur and the entrustment arrangement will terminate. There can be no assurances that such registration and approval will be received. If such registration and approval are not received, CML will have to rely on enforcement of contractual rights to obtain the benefit of certain economic rights with respect to the FosunPharma-contributed businesses that normally are available to shareholders as a matter of law. See “There can be no assurances that all of the terms of the CML joint venture formation documents will be enforceable.” The inability of CML to enforce such contractual right would adversely affect CML, thereby also adversely affecting the Company.
At the Initial Closing, the Company and a subsidiary of CML entered into a Services Agreement (the “Services Agreement”). In connection with the Services Agreement, the Company’s Executive Vice President, Elyse Beth Silverberg, and its Chief Operating Officer, Lawrence Pemble, serve as the Chief Operating Officer and Chief Financial Officer, respectively, of, and devote substantial time and effort to, CML. The Services Agreement also provides for the performance of such services by such executives as well as for the performance of other services to CML by other current Company employees. The Services Agreement further provides for payments to the Company for such services and related arrangements between the parties. In connection with the Services Agreement, the Company will continue to compensate such executives and certain such employees, which compensation is expected to be substantially offset by such payments from Chindex Medical. Although the Company believes that the services performed by such Company employees replicate such services they performed prior to the formation of the joint venture, there can be no assurances that the devotion of such time and effort will not adversely affect the Company.
Our Chindex Medical Limited joint venture with FosunPharma involves numerous risks.
CML is focused on the pre-existing operations of our former Medical Products Division as well as the businesses contributed to the joint venture by FosunPharma. Those businesses contributed by FosunPharma include research and development and manufacturing in the areas of blood transfusion consumables and viral inactivation systems, surgical consumables and dental products and materials. The joint venture involves the integration of different businesses and business models from us and FosunPharma that previously operated independently and that may not produce the intended synergies. This has been and will continue to be a complex and time-consuming process.
14
Table of Contents
There can be no assurance that we will achieve the expected benefits of the joint venture. CML and future joint ventures or acquisitions that we complete may result in unexpected costs, expenses, and liabilities, which may have a material adverse effect on our business, financial condition or results of operations. We may encounter difficulties in developing and expanding the business of CML, funding any future capital contributions to the business and exercising influence over the management and activities of the joint venture, which is controlled by FosunPharma. In addition, we may encounter quality control concerns regarding CML products and services and potential conflicts of interest with the joint venture and FosunPharma, our joint venture partner. Also, we could be disadvantaged in the event of disputes and controversies with our joint venture partner, since they are a significant stockholder of the Company.
CML is also subject to, and exposes us to, various additional risks that could adversely affect our results of operations. These risks include the following:
| • | we currently own 49% of the total equity interests in CML, so there are certain decisions affecting the business of CML that we cannot control or influence; |
| • | difficulties associated with preserving relationships with our customers, partners and vendors; |
| • | difficulties in retaining and integrating key sales, marketing and other personnel, the possible loss of such employees and costs associated with their loss; |
| • | risks that any technology, business plan or business model developed by CML may not perform as well as we had anticipated; |
| • | the diversion of management’s attention and other resources from other business operations and related concerns; |
| • | potential impairments of goodwill and intangible assets; |
| • | the requirement to maintain uniform standards, controls and procedures, including as required under applicable U.S. securities laws and accounting requirements; |
| • | the divergence of our interests from FosunPharma’s interests in the future, disagreements with FosunPharma on ongoing operational activities, or the amount, timing or nature of further investments in CML; |
| • | the terms of our joint venture arrangements may turn out to be unfavorable to us; |
| • | we may not be able to realize the operating efficiencies, cost savings or other benefits that we expect from the joint venture; and |
| • | CML profits and cash flows may prove inadequate to fund cash dividends from CML to the joint venture partners. |
If CML is not successful, our business, results of operations and financial condition will likely be adversely affected.
15
Table of Contents
We will be obligated to issue 1,057,425 shares of common stock at $15 per share in the event of the final asset vesting of the CML joint venture, which would be dilutive to existing stockholders to the extent that the current market price is above such price.
One agreement entered into in connection with the joint venture was a stock purchase agreement (the “Stock Purchase Agreement”) dated June 14, 2010, among the Company and the Fosun Entities. The Stock Purchase Agreement was approved by the Company’s board of directors on June 16, 2010. Pursuant to the Stock Purchase Agreement, we will be obligated to issue 1,057,425 shares of common stock at $15 per share at the Final Closing, which shares would represent approximately five percent of the outstanding shares of the Company. In the event that the market price of the common stock at the time of such issuance is greater than $15 per share, then holders of outstanding shares would experience immediate dilution, notwithstanding that the market price of the common stock at the time the Company approved the Stock Purchase Agreement was approximately $11.80, making the price per share a significant premium to market at that time.
There can be no assurances that all of the terms of the CML joint venture formation documents will be enforceable.
Another agreement entered into in connection with the CML joint venture was an entrustment agreement (the “Entrustment Agreement”) among the Company, a subsidiary of CML, FosunPharma and a subsidiary of FosunPharma, which would allow for the management and operation of the entire Business pending the final contribution and investiture by FosunPharma into CML at the Final Closing. The Entrustment Agreement would entrust such management and operation to a subsidiary of the Company from the date thereof until the Final Closing, giving such subsidiary full power and authority over the entire Business. For such services, such Chindex subsidiary would be reimbursable based on profitability. There can be no assurance that the specific terms of any agreement entered into in connection with the CML joint venture, including in particular the Entrustment Agreement, will be enforceable in whole or in part.
Risks Relating to our Healthcare Services Business
If we do not attract and retain qualified physicians, administrators or other hospital personnel, our hospital operations would be adversely affected.
The United Family Healthcare network is a pioneering, international standard healthcare organization, whose mission is to provide comprehensive and integrated healthcare services in a warm and caring patient and family service-oriented environment to the largest urban centers in China. Our success in operating our hospitals and clinics will be, in part, dependent upon the number and quality of physicians on the medical staff of these hospitals and clinics and our ability to maintain good relations with our physicians. As we offer international standard healthcare at our hospitals and clinics, we are further dependent on attracting a limited number of qualified Western healthcare professionals, not all of whom have long-term relationships with China or intend to remain in China for extended periods of time. Physicians may terminate their affiliation with our hospitals at any time. If we are unable to successfully maintain good relationships with physicians, our results of operations may be adversely affected. In addition, the failure to recruit and retain qualified management, nurses and other medical support personnel, or to control labor costs, could have an adverse effect on our business and results of operations.
Our business is heavily regulated and failure to comply with those regulations could result in penalties, loss of licensure, additional compliance costs or other adverse consequences.
Healthcare providers in China, as in most other populous countries, are required to comply with many laws and regulations at the national and local government levels. These laws and regulations relate to: licensing; the conduct of operations; the relationships among hospitals and their affiliated providers; the ownership of facilities; the addition of facilities and services; confidentiality, maintenance and security
16
Table of Contents
issues associated with medical records; billing for services; and prices for services. If we fail to comply with applicable laws and regulations, we could suffer penalties, including the loss of our licenses to operate. In addition, further healthcare legislative reform is likely, and could materially adversely affect our business and results of operations in the event we do not comply or if the cost of compliance is expensive. The above list of certain regulated areas is not exhaustive and it is not possible to anticipate the exact nature of future healthcare legislative reform in China. Depending on the priorities determined by the Chinese Ministry of Health, the political climate at any given time, the continued development of the Chinese healthcare system and many other factors, future legislative reforms may be highly diverse, including stringent infection control policies, improved rural healthcare facilities, introduction of health insurance policies, regulation of reimbursement rates for healthcare services, increased regulation of the distribution of pharmaceuticals and numerous other policy matters. Consequently, the implications of these future reforms could result in penalties, loss of licensure, additional compliance costs or other adverse consequences.
Our operations could be adversely affected by the high cost of malpractice insurance.
In recent years, physicians, hospitals and other healthcare providers in the U.S. have become subject to an increasing number of legal actions alleging malpractice or related legal theories. Many of these actions involve large claims and significant legal costs. While similar lawsuits are not common in China, to protect us from the cost of any such claims, we generally maintain professional malpractice liability insurance and general liability insurance coverage in amounts and with deductibles that we believe to be appropriate for our operations. However, our insurance coverage may not cover all claims against us or continue to be available at a reasonable cost for us to maintain adequate levels of insurance.
We depend on information systems, which if not implemented and maintained, could adversely affect our operations.
Our healthcare services business is dependent on effective information systems that assist us in, among other things, monitoring, utilization and other cost factors, supporting our healthcare management techniques, processing billing and providing data to regulators. If we experience a reduction in the performance, reliability or availability of our information systems, our operations and ability to produce timely and accurate reports could be adversely impacted.
Our information systems and applications require continual maintenance, upgrading and enhancement to meet operational needs. Moreover, the proposed expansion of facilities and similar activities requires transitions to or from, and the integration of, various information systems. We regularly upgrade and expand our information systems capabilities throughout our healthcare services operations. Upgrades, expansions of capabilities, and other potential system-wide improvements in information systems may require large capital expenditures. If we experience difficulties with the transition to or from information systems or are unable to properly implement, finance, maintain or expand our systems, we could suffer, among other things, from operational disruptions, which could adversely affect our prospects or results of operations.
Our operations face competition that could adversely affect our results of operations.
Our Beijing, Shanghai Tianjin and Guangzhou healthcare facilities compete with a large number and variety of healthcare facilities in their respective markets. There are numerous Chinese hospitals, many with VIP wards catering to the affluent Chinese market, available to the general populace, as well as international clinics serving the expatriate business, diplomatic community and affluent Chinese population. There can be no assurance that these or other clinics, hospitals or other facilities will not commence or expand such operations, which would increase their competitive position and potentially erode our market position. Further, there can be no assurance that a qualified Western or other healthcare organization, having greater resources in the provision or management of healthcare services, will not decide to begin operations similar to those being conducted by us in Beijing, Shanghai, Tianjin or Guangzhou.
17
Table of Contents
Expansion of healthcare services to reach the Chinese population depends to some extent on the development of insurance products that are not available now.
Medical insurance is not generally available too much of the Chinese population and reimbursement under Chinese government healthcare coverage is not allowed to our healthcare network. Consequently, visits to our hospital facilities by the local population normally must be paid for in cash. This limitation may impede the attractiveness of our services as compared to services for which government benefits are allowed, especially during challenging economic circumstances. Our expansion plans call for increasing the number of local Chinese who use our facilities. If we are not able to achieve this increase, our ability to continue to grow our business would be materially adversely affected.
Our loan from the IFC places restrictions on the conduct of our healthcare services business.
The existing loan from the IFC to BJU and SHU, which is guaranteed by the parent company, requires us to achieve specified liquidity and coverage ratios and meet other operating requirements in order for us to conduct certain transactions in our healthcare services business.
The terms of our indebtedness with the IFC impose significant restrictions on our business. The indentures governing our outstanding notes and the agreement governing our loan contain various covenants that limit the ability of our hospitals to, among other things:
| • | incur or guarantee additional indebtedness; |
| • | make restricted payments, including dividends and management fees; |
| • | create or permit certain liens; |
| • | enter into business combinations and asset sale transactions; |
| • | make investments; |
| • | enter into transactions with affiliates; |
| • | incur certain expenditures; and |
| • | enter into new businesses. |
These restrictions could limit our ability to obtain future financing, make acquisitions or needed capital expenditures, withstand a future downturn in our business, conduct operations or otherwise take advantage of business opportunities that may arise. The loan agreement with the IFC also requires us to maintain specified financial ratios and our ability to do so may be affected by events beyond our control such as business conditions in China. Our failure to maintain applicable financial ratios, in certain circumstances, would limit or prevent us from making payments from the hospitals to the parent company and would otherwise limit the hospitals’ flexibility in financial matters.
Timing of revenues due to seasonality and fluctuations in financial performance vary from quarter to quarter and are not necessarily indicative of our performance over longer periods.
Our revenue is dependent on seasonal fluctuations related to epidemiology factors and the lifestyles of the expatriate community. For example, many expatriate families traditionally take annual home leave outside of China during the summer months. As a result of these factors impacting the timing of revenues, our operating results have varied and are expected to continue to vary from period to period and year to year.
18
Table of Contents
We may not be able to complete our ongoing expansion projects on budget if at all, which would materially and adversely affect our financial condition and proposed expansion.
The JPM, IFC and other financings were designed to provide a portion of required funds for our proposed new and/or expanded healthcare facility projects. As presently budgeted, such projects will require more financing than we currently have obtained. Such projects are in various early stages and will take significant time to complete, which completion cannot be assured. If we are unable to obtain sufficient financing, including draws under the IFC facility (or additional, alternative or replacement facilities), our budgeted costs are incorrect or other factors, such as Chinese government regulations or global economic circumstances for example, which interfere with our ability to complete such projects, we may not be able to complete the projects as planned or at all, which would result in the incurrence of debt and other costs that are not necessarily offset by the anticipated revenues from the projects. In addition, obtaining additional financing and completing the projects may be required to automatically convert the Tranche C Notes. If such financing cannot be obtained and the projects cannot be completed, the Tranche C Notes would remain outstanding, ultimately requiring repayment which may interfere with future borrowing.
Our proposed healthcare facilities expansion plans and related capital expenditures could adversely affect our financial condition and results of operations.
Our long-term expansion plans include targeted expansion into largely Chinese populated markets through the development of additional United Family facilities in the more affluent Chinese cities such as Chengdu, Ningbo, Qingdao, and others as well as additional facilities in our existing markets of Beijing, Shanghai, Tianjin and Guangzhou. Our plans also include the continued expansion of services in existing facilities and the opening of additional affiliated satellite clinics and hospitals. Market expansion projects are underway in each geographic market. Therefore, we expect to continue to make substantial capital expenditures over several years in amounts that have not yet been determined in connection with this expansion plan.
The profitability or success of future healthcare facilities and similar capital projects and investments are subject to numerous factors, conditions and assumptions, many of which are beyond our control. Significant negative or unfavorable outcomes could reduce our available cash and cash investments resulting in lower investment interest or earnings, offset income to the extent resulting in net losses, reduce our ability to service current or future indebtedness, require additional borrowings resulting in higher debt service and interest costs, result in higher borrowing costs or increased difficulties in borrowing additional amounts, result in higher than anticipated depreciation expense, among other negative consequences, and could have a material adverse effect on our future financial condition or results of operations.
Commencement of facility construction is subject to governmental approval and permitting processes, which could materially affect the ultimate cost and timing of construction. Numerous factors, many of which are beyond our control, may influence the ultimate costs and timing of various projects or capital improvements at our facilities, including:
| • | delays in mandatory governmental approvals; |
| • | additional land or facilities acquisition costs; |
| • | increases in the cost of construction materials and labor; |
| • | unforeseen changes in design or delays in construction permits; |
| • | litigation, accidents or natural disasters affecting the construction site; and |
19
Table of Contents
| • | national or regional economic, regulatory or geopolitical changes. |
In addition, actual costs could vary materially from our estimates if those factors or our assumptions about the quality of materials or workmanship required or the cost of financing such construction were to change. Should healthcare facility projects be abandoned or substantially decreased in scope due to the inability to obtain necessary permits or other governmental approvals or other unforeseen negative factors, we could be required to expense some or all previously capitalized costs, which could have a material adverse effect on our future financial condition or results of operations.
Risks Relating to CML’s Medical Products Business
Future Losses in the Medical Products Business.
We experienced losses after corporate allocations in our Medical Products division over most of five fiscal years prior to the formation of the joint venture due to a variety of factors, including delays in product registration approvals from the Chinese government, delays in renegotiating the trade agreements between the United States and China allowing the use of U.S. Export-Import Bank backed financings and other factors. Although the results of operations of the business comprising that division (the “Medical Products Business”) were transferred to the CML joint venture effective December 31, 2010, are deconsolidated from our financial statements, are treated under the equity method of accounting, and are retained by us only on a 49% equity interest basis (to be supplemented with businesses from FosunPharma as proposed at the Final Closing relating to the joint venture), there can be no assurance that we will not experience losses in the future from the operation of that business, which would have a negative impact on our results of operations and us generally.
The Medical Products Business depends on relations with suppliers and would be adversely affected by the termination of arrangements with, or shortage or loss of any significant product line from them.
The Medical Products Business relies on a limited number of suppliers that account for a significant portion of its revenues. During the year ended December 31, 2011, the nine-months ended December 31, 2010 and year ended March 31, 2010, Siemens Medical Solutions (Siemens) represented 36%, 64% and 42% of product revenue, respectively. Although a substantial number of relationships with that business’ capital equipment suppliers, including Siemens, have been pursuant to exclusive contracts, the relationships are based substantially on specific sales quotas and mutual satisfaction in addition to the other terms of the contractual arrangements. The agreement with Siemens was renewed by CML with secondary financial guarantees provided by FosunPharma (for 51% of CML liability) and the Company (for 49% of CML liability) on December 31, 2011 for a 12-month term and is expected to be renewed in the future with sales quotas established annually. Agreements with other suppliers have been, or are expected to be, renewed by CML under similar terms requiring parent investor guarantees by FosunPharma and the Company to secure trade payment terms. The agreement with Siemens and contracts with other suppliers often contain short-term cancellation provisions permitting the contracts to be terminated, substantially amended on short notice (from 30 days to six months), minimum sales quantity requirements or targets and provisions triggering termination upon the occurrence of certain events. From time to time, suppliers terminate or revise these distribution arrangements. There can be no assurance that cancellations of, or other material adverse effects on, such agreements will not occur. There can be no assurance that suppliers will not elect to change their method of distribution into the Chinese marketplace to a form that does not use the services of CML.
The Medical Products Business depends to some extent on suppliers continuing to improve their products and introduce new models. If a supplier fails to upgrade its product line as quickly as competitive manufacturers have done, our revenues could be adversely impacted.
20
Table of Contents
The market for medical equipment in China is highly competitive and buyers are very interested in purchasing the latest technology. In operating under exclusive agreements with certain manufacturers, the Medical Products Business is tied to a single source in each product area and is dependent on the acceptance of the manufacturers’ products in the market place. If there is a delay in the introduction of new products or technology, this could influence buyers to choose competitive offerings from other sources. In addition, if the new product or technology fails to operate properly after product launch, results may suffer due to delays caused by the time required for the manufacturer to correct the initial product defects.
The sales of the Medical Products Business depend to some extent on suppliers maintaining the required product registrations required to sell their products in China. If a supplier fails to maintain or renew such product registrations in a timely manner, the joint venture would be unable to sell its products.
The Chinese government requires all medical devices to be registered for sale by the Chinese State Food and Drug Administration (SFDA) and other Chinese government organizations. For the products of the Medical Products Business, some of these registrations are handled by such business and some of them are handled by the original equipment manufacturer. If the manufacturers are not timely with their registrations or let them expire prior to renewal, CML would be unable to sell its products.
Timing of revenues and fluctuations in financial performance vary significantly from quarter to quarter and are not necessarily indicative of our performance over longer periods.
Sales of capital equipment often require protracted sales efforts, long lead times, financing arrangements and other time-consuming steps. For example, many end-users are required to purchase capital equipment through a formal public tendering process, which often entails an extended period of waiting time before the sale can be completed. Further, in light of the dependence by purchasers of capital equipment on the availability of credit, the timing of sales may depend upon the timing of CML’s or our purchasers’ abilities to arrange for credit sources, including loans from local Chinese banks or financing from international loan programs such as those offered by the U.S. Export-Import Bank and the German KfW Development Bank. In addition, a relatively limited number of orders and shipments may constitute a meaningful percentage of our revenue in any one period. As a result of these factors impacting the timing of revenues, our operating results have varied and are expected to continue to vary from period to period and year to year.
We and the joint venture may be subject to product liability claims and product recalls, and in the future the joint venture may not be able to obtain insurance against these claims at a reasonable cost or at all.
The nature of the Medical Products Business creates exposure to potential product liability risks, which are inherent in the distribution of medical equipment and healthcare products. This product liability exposure may not be avoidable, since third parties develop and manufacture the equipment and products sold in such business. If a product liability claim is successfully brought against us, CML or any of these third party manufacturers, or if a significant product recall occurs, there would be adverse reputational consequences, damages may be awarded, insurance, legal and other expenses would increase, customers and/or suppliers might be lost and there may be other adverse results.
We did not and CML does not maintain product liability insurance, but in the past we had requested that we be named as an “additional insured” on policies held by our manufacturers. There can be no assurance that one or more liability claims will not exceed the coverage limits of any of such or future policies. The Medical Products Business currently represents 11 manufacturers and CML and/or we are named as an additional insured on three of those manufacturers’ product liability policies and are otherwise
21
Table of Contents
protected from substantial liability risk through language inserted in agency agreements with an additional three of those manufacturers.
If we, CML or our manufacturers fail to comply with regulatory laws and regulations, we, the joint venture and/or such manufacturers may be subject to enforcement actions, which could affect the manufacturer’s ability to develop, market and sell products successfully. This could harm our and/or CML’s reputation and lead to less acceptance of such products by the market. These enforcement actions may include:
| • | product seizures; |
| • | voluntary or mandatory recalls; |
| • | voluntary or mandatory patient or physician notification; and |
| • | restrictions on or prohibitions against marketing the products. |
The Medical Products Business faces competition that may adversely impact that business, which impact may be increased as a result of China’s inclusion in the World Trade Organization.
The Medical Products Business competes with other independent distributors of medical products in China. Given the rapid pace of technological advancement, particularly in the medical products field, other independent distributors may introduce products that compete directly with the products distributed by that business. In addition to other independent distributors, that business faces significant competition from direct distribution by established manufacturers. In the medical products field, for example, that business competes with certain major manufacturers that maintain their own direct sales forces in China. In addition, to the extent that certain manufacturers market a wide variety of products in China to different market sectors (including non-medical) under one brand name, those manufacturers may be better able than CML to establish brand name recognition across industry lines.
As a result of China becoming a member of the World Trade Organization (WTO), tariffs on medical products have been lowered. In addition, the investment environment has improved for companies interested in establishing manufacturing operations in China. These developments may lead to increased imports of foreign medical products and increased domestic production of such products and therefore lead to increased competition in the domestic medical products markets. There can be no assurance that the Medical Products Business will be able to compete effectively with such manufacturers and distributors.
If the Chinese Government tightens controls or policies on purchases of medical equipment or implements reforms which disrupt the market for medical devices, including eliminating value added tax (VAT) and duty exemptions for procurement under KfW Development Bank or U.S. Export-Import Bank financings, sales of medical products could be adversely affected.
The Chinese Government has adopted a number of policies relating to purchase of medical products that affect how such products can be marketed and sold. For example, for most high value products, the Chinese Government requires that a public tendering process be utilized instead of direct sale negotiations between suppliers and customers. To the extent that requirements such as the tendering regulations continue to be required, sales by the Medical Products Business could be adversely affected due to delays or changes in the implementation of those regulations. In addition, the Chinese Government’s attempt at instituting reform programs directed at the procurement processes for medical devices, including potentially eliminating VAT and import duty exemptions for procurement under government-backed financings, such as our KfW Development Bank or U.S. Export-Import Bank financings, have from time-to-time resulted in disruptions in the marketplace that have adversely affected sales in that business. Elimination of VAT and
22
Table of Contents
import duty exemptions related to procurement under government-backed financings could render such programs uncompetitive and such sales could be adversely affected. There can be no assurances as to when or if such reform programs will be initiated in the future or how long they will last.
Risks Relating to Doing Business in China
Substantially all of our assets are located in China, and all of our revenue is derived from our operations in China. Accordingly, our business, financial condition and results of operations are subject, to a significant degree, to economic, political and legal developments in China. The economic system of China differs from the economies of most developed countries in many respects, including government investment, the level of development, control of capital investment, control of foreign exchange and allocation of resources.
The economic policies of the Chinese Government and economic growth of China could adversely affect us.
Since the late 1970s, the Chinese Government has been reforming the Chinese economic system from a planned economy to a market-oriented economy. In recent years, the Chinese Government has implemented economic reform measures emphasizing decentralization, utilization of market forces in the development of the Chinese economy and a higher level of management autonomy. These reforms have resulted in significant economic growth and social progress, but the growth has been uneven both geographically and among various sectors of the economy. Economic growth has also been accompanied by periods of high inflation. The Chinese Government has implemented various policies from time to time to restrain the rate of such economic growth, address issues of corruption, control inflation, regulate the exchange rate of the RMB and otherwise regulate economic expansion. In addition, the Chinese Government has attempted to control inflation by controlling the prices of basic commodities. The Chinese Government has also from time-to-time mandated changes in the Chinese tax law affecting Company operations. Although we believe that the economic reforms, changes and macroeconomic policies and measures adopted by the Chinese Government will continue to have a positive effect on economic development in China, these policies and measures may, from time to time, be modified or reversed. Adverse changes in economic and social conditions in China, in the policies of the Chinese Government or in the laws and regulations in China, could have a material adverse effect on the overall economic growth of China and on infrastructure investment in China. These developments could adversely affect our financial condition, results of operations and business by, for example, reducing the demand for our products and/or services.
The Chinese legal system is relatively new and may not provide protections to us or our investors.
The Chinese legal system is a civil law system based on written statutes. Unlike common law systems, it is a system in which decided legal cases have little precedential value. In 1979, the Chinese Government began to promulgate a comprehensive system of laws and regulations governing economic matters in general, including corporate organization and governance, foreign investments, commerce, taxation and trade. Legislation over the past 25 years has significantly enhanced the protections afforded to various forms of foreign investment in China. However, China has not developed a fully integrated legal system and these laws, regulations and legal requirements are relatively recent, and their interpretation and enforcement involves uncertainties, which may limit the legal protections available to foreign investors and may not sufficiently cover all aspects of economic activities in China.
The Chinese Government has often reiterated its policy of furthering reforms in the socialist market economy. No assurance can be given that these changes will not have an adverse effect on business conditions in China generally or on our business in particular.
The Chinese government has taken steps to strengthen labor law and labor contract law, and to enforce compliance with these laws. These actions, designed to improve protection of employees’ rights,
23
Table of Contents
often serve to increase the responsibilities and labor costs of employers. The most significant recent changes include a requirement to offer permanent employment at the conclusion of an initial fixed-term employment contract; a requirement to make severance payments in all cases of termination except for extreme breach of contract by employee or voluntary resignation; and requirement for financial compensation in return for non-compete agreements. No assurance can be given that these changes will not have an adverse effect on business conditions in China generally or on our business in particular.
The conversion of Renminbi (RMB) into foreign currency is regulated, and these regulations could adversely affect us.
All of our revenues and a significant portion of our operating expenses are denominated in RMB. A portion of our USD earnings are typically transferred to China and converted into RMB for the payment of expenses. The transmission of foreign currency in and out of China is subject to regulation by China’s State Administration for Foreign Exchange, or SAFE. It is possible that SAFE could impose new or increase existing restrictions on such currency uses or otherwise impose exchange controls that adversely affect our practices. Adverse actions by SAFE also could affect our ability to obtain foreign currency through debt or equity financing, including by means of loans or capital contributions.
A New SARS or similar outbreak, such as Avian flu or Swine Flu, could further adversely affect our operations.
In March 2003, several countries, including China, experienced an outbreak of a new and highly contagious form of atypical pneumonia now commonly known as Severe Acute Respiratory Syndrome, or SARS. The severity of the outbreak in certain municipalities, such as Beijing, and provinces, such as Guangdong Province, materially affected general commercial activity. Since the SARS epidemic in China had conflicting impacts on our healthcare businesses, the extent of the adverse impact that any future SARS outbreak or similar epidemic such as Avian flu or Swine flu, could have on the Chinese economy and on us cannot be predicted at this time. Any further epidemic outbreak could significantly disrupt our ability to adequately staff our facilities and may generally disrupt operations. In particular, a large percentage of the expatriate community that uses our healthcare services left China during the height of the SARS epidemic and could be expected to do so again under similar circumstances. Although no one is able to predict the future impact of SARS, the Chinese Government and the Chinese healthcare industry have taken measures to prepare in the event of another SARS outbreak. The Chinese Government has indicated that any future outbreak would be contained and not present the same magnitude of social and economic disruption as experienced in the first outbreak. Recently, there have been cases of Swine flu in the human population. While the risk of sustained human-to-human transmission is low, the possibility of new virus outbreaks and related adverse impact on our ability to conduct normal business operations cannot be discounted. Any further such outbreak could severely restrict the level of economic activity in affected areas, which could have a material adverse effect on us as previously experienced.
Natural disasters, such as the earthquakes in Sichuan Province in May 2008 and in Qinghai Province in April 2010, could adversely affect our business operations.
In May 2008, a major earthquake struck the southwestern Province of Sichuan. This event and the subsequent disaster relief efforts were widely reported by the international press. As a result of the catastrophe, many tens of thousands were killed and the lives of millions of Chinese citizens were impacted. This event significantly disrupted our ability to conduct the normal business operations of our former Medical Products division in the southwest region during disaster recovery operations during the prior year. Qinghai Province is in a remote area of China and the earthquake there had a lesser impact on our business operations. In both situations, our Healthcare Services business donated resources to assist the disaster recovery efforts. Similar natural disasters could have a similar adverse effect on our operations.
24
Table of Contents
The Chinese Government could change its policies toward, or even nationalize, private enterprise, which could harm our operations.
Over the past several years, the Chinese Government has pursued economic reform policies, including the encouragement of private economic activities and decentralization of economic regulation and substantial reforms of the healthcare system in China. The Chinese Government may not continue to pursue these policies or may significantly alter them to our detriment from time to time without notice. Changes in policies by the Chinese Government resulting in changes in laws, regulations, their interpretation, or the imposition of confiscatory taxation, restrictions on currency conversion or imports and sources of supply could materially and adversely affect our business and operating results. The nationalization or other expropriation of private enterprises by the Chinese Government could result in the total loss of our investment in China.
The Chinese tax system is subject to substantial uncertainties in both interpretation and enforcement of the laws. In the past, following the Chinese Government’s program of privatizing many state owned enterprises, the Chinese Government attempted to augment its revenues through heightened tax collection efforts. Continued efforts by the Chinese Government to increase tax revenues could result in other decisions or interpretations of the tax laws by the taxing authorities that increase our future tax liabilities or deny us expected refunds.
Risks Related to our Corporate Structure
Control by insiders and their ownership of shares having disproportionate voting rights could have a depressive effect on the price of common stock, impede a change in control and impede management replacement.
Certain of our present management stockholders own 1,162,500 shares of our Class B common stock, which vote as a single class with the common stock on all matters except as otherwise required by law. The Class B common stock and the common stock are identical on a share-for-share basis, except that the holders of Class B common stock have six votes per share on each matter considered by our stockholders. As of December 31, 2011 the three management holders of our outstanding Class B common stock represented approximately 7% of our outstanding capital stock and were deemed to beneficially own capital stock representing approximately 31% of total voting power and may be able to cause the election of all of our directors. These management stockholders have sufficient voting power to determine, in general, the outcome of any corporate transaction or other matter submitted to our stockholders for approval, including mergers, consolidations and the sale of all or substantially all of our assets. The disproportionate vote afforded the Class B common stock could serve to impede or prevent a change of control. As a result, potential acquirers will be discouraged from seeking to acquire control through the purchase of common stock, which could have a depressive effect on the price of our securities. In addition, the effective control by these management stockholders could have the effect of preventing or frustrating attempts to influence, replace or remove management.
Our unissued preferred stock could be issued to impede a change in control.
Our certificate of incorporation authorizes the issuance of 500,000 shares of “blank check” preferred stock with such designations, rights and preferences as may be determined from time to time by our Board of Directors. Accordingly, the Board of Directors is empowered, without stockholder approval (but subject to applicable government regulatory restrictions), to issue preferred stock with dividend, liquidation, conversion, voting or other rights that could adversely affect the voting power or other rights of the holders of our common stock. In the event of issuance, the preferred stock could be utilized, under certain circumstances, as a method of discouraging, delaying or preventing a change in control.
We have a Stockholder Rights Plan (the “Rights Plan”). The Rights Plan was designed to preserve long-term values and protect stockholders against inadequate offers and other unfair tactics to acquire
25
Table of Contents
control of the Company. Under the Rights Plan, each stockholder of record at the close of business on June 14, 2007 received a dividend distribution of one right to purchase from the Company one one-hundredth of a share of Series A junior participating preferred stock at a price of $38.67. The rights will become exercisable only if a person, other than certain current founders of the Company and their affiliates and certain existing investor pursuant to existing investment agreements, or group acquires 15% or more of the Company’s common stock or commences a tender or exchange offer which, if consummated, would result in that person or group owning at least 15% of our common stock (the “acquiring person or group”). In such case, all stockholders other than the acquiring person or group will be entitled to purchase, by paying the $38.67 exercise price, common stock (or a common stock equivalent) with a value of twice the exercise price. In addition, at any time after such event, and prior to the acquisition by any person or group of 50% or more of our common stock, the Board of Directors may, at its option, require each outstanding right (other than rights held by the acquiring person or group) to be exchanged for one share of our common stock (or one common stock equivalent). If a person or group becomes an acquiring person and the Company is acquired in a merger or other business combination or sells more than 50% of its assets or earning power, each right will entitle all other holders to purchase, by payment of $38.67 exercise price, common stock of the acquiring company with a value of twice the exercise price. The Rights Plan expires on June 14, 2017.
The Rights Plan may have anti-takeover effects by discouraging potential proxy contests and other takeover attempts, particularly those that have not been negotiated with the Board of Directors. The Rights Plan may also prevent or inhibit the acquisition of a controlling position in our common stock and may prevent or inhibit takeover attempts that certain stockholders may deem to be in their or other stockholders’ interest or in the interest of the Company, or in which stockholders may receive a substantial premium for their shares over then current market prices. The Rights Plan may also increase the cost of, and thus discourage, any such future acquisition or attempted acquisition, and would render the removal of the current Board of Directors or management of the Company more difficult.
ITEM 1B. UNRESOLVED STAFF COMMENTS
None.
Our executive and administrative offices of approximately 4,000 square feet are located in Bethesda, Maryland, which provides access to nearby Washington, D.C. The lease on this space expires in 2012, and as the date of this report, the Company has renewed the lease for another five years. This facility is used primarily by corporate administration.
We lease approximately 276,000 square feet in Beijing for hospital and clinic operations as well as for administrative departments. In addition, we also leased additional space of approximately 124,000 square feet for Rehab center as a part of our expansion plan in the Beijing market. These leases expire between 2012 and 2030 and include a right of first refusal for renewal.
We lease approximately 74,000 square feet in Tianjin for hospital operations as well as for administrative departments. The lease for our hospital facility in Tianjin expires in 2030.
We lease approximately 87,000 square feet in Shanghai for hospital and clinic operations as well as for administrative departments. The lease for our hospital facility in Shanghai expires in 2029.
We lease approximately 8,000 square feet in Guangzhou for clinic operations. The lease for our clinic facility in Guangzhou expires in 2017.
26
Table of Contents
Our current facilities are suitable for our current operating needs.
None.
ITEM 4. MINE SAFETY DISCLOSURE
Not Applicable.
ITEM 5. MARKET FOR REGISTRANT’S COMMON EQUITY, RELATED STOCKHOLDER MATTERS AND ISSUER REPURCHASES OF EQUITY SECURITIES
Our common stock is listed on The NASDAQ Global Market under the symbol “CHDX.” The following table shows the high and low common stock closing prices as quoted on the NASDAQ Global Market. Such quotations reflect interdealer prices, without retail mark-up, mark-down or commission and may not necessarily represent actual transactions.
| High | Low | |||||||
| Year Ended December 31, 2011: |
||||||||
| First Quarter |
$ | 17.98 | $ | 15.14 | ||||
| Second Quarter |
17.27 | 12.32 | ||||||
| Third Quarter |
13.68 | 8.15 | ||||||
| Fourth Quarter |
12.99 | 7.76 | ||||||
| Year Ended December 31, 2010: |
||||||||
| First Quarter |
$ | 14.99 | $ | 10.20 | ||||
| Second Quarter |
13.82 | 10.32 | ||||||
| Third Quarter |
15.11 | 11.45 | ||||||
| Fourth Quarter |
18.36 | 12.56 | ||||||
As of February 28, 2012, there were 152 record holders of our common stock and six record holders of our Class B common stock. We have never declared or paid cash dividends on our common stock. We currently intend to retain all available funds and future earnings, if any, for use in the operation and expansion of our business and do not anticipate paying dividends in the foreseeable future. We did not repurchase any shares of common stock in the year ended December 31, 2011.
27
Table of Contents
Equity compensation plan information as of December 31, 2011 is as follows:
| (c) | ||||||||||||
| Plan Category | (a) Number of |
(b) Weighted |
Number of Securities Remaining Available for Future Issuance Under Equity Compensation Plans (excluding securities reflected in column (a)) |
|||||||||
| Equity Compensation Plans Approved By Security Holders |
||||||||||||
| 1994 Stock Option Plan |
135,176 | $ | 6.01 | — | ||||||||
| 2004 Stock Incentive Plan |
272,749 | $ | 4.18 | — | ||||||||
| 2007 Stock Incentive Plan |
798,514 | $ | 13.19 | 98,987 | ||||||||
| Equity Compensation Plans Not Approved By Security Holders |
None | None | None | |||||||||
|
|
|
|
|
|
|
|||||||
| Total |
1,206,439 | 98,987 | ||||||||||
Other information required by this Item can be found in Note 8 to the consolidated financial statements appearing elsewhere in this Annual Report on Form 10-K.
28
Table of Contents
CHINDEX INTERNATIONAL, INC.
COMPARISON OF SIXTY-NINE MONTH CUMULATIVE TOTAL RETURN
The following table compares the cumulative return to holders of the Company’s Common Stock for the sixty-nine months ended December 31, 2011 with the National Association of Securities Dealers Automated Quotation System Market Index and a randomly selected peergroup of public companies randomly selected for us by a qualified independent firm based solely on such companies having the closest market capitalizations to that of the Company for the same period. Due to its unique operations in China, the Company does not use a published industry or line-of-business basis for identifying a peer group, and does not believe it could reasonably identify a different peer group.
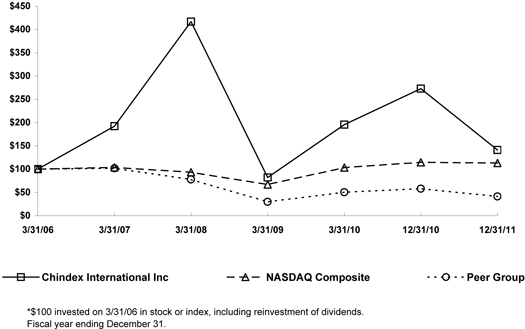
29
Table of Contents
TOTAL RETURN TO SHAREHOLDERS
(INCLUDES REINVESTMENT OF DIVIDENDS)
| Base Period | INDEXED RETURNS Years Ended | |||||||||||||||||||||||||||
| Company Name / Index |
3/31/06 | 3/31/07 | 3/31/08 | 3/31/09 | 3/31/10 | 12/31/10 | 12/31/11 | |||||||||||||||||||||
| Chindex International Inc |
100.00 | 192.27 | 416.78 | 82.28 | 195.53 | 273.01 | 141.06 | |||||||||||||||||||||
| NASDAQ Composite |
100.00 | 103.64 | 93.43 | 66.81 | 103.42 | 114.70 | 113.08 | |||||||||||||||||||||
| Peer Group |
100.00 | 101.93 | 78.01 | 29.94 | 50.45 | 58.09 | 41.41 | |||||||||||||||||||||
PEER GROUP COMPANIES
| Acorn Energy Inc | Global Ship Lease Inc | |
| Capital City Bank Group Inc | Lawson Products Inc | |
| Codexis Inc | MET-Pro Corp. | |
| Crimson Exploration Inc | Midsouth Bancorp Inc | |
| Entravision Communications Corp. | Red Lion Hotels Corp. | |
| Fortegra Financial Corp. | Tessco Technologies Inc | |
| Fxcm Inc | TRC Companies Inc |
30
Table of Contents
ITEM 6. SELECTED FINANCIAL DATA
(in thousands, except for per share data)
| Year ended December 31, |
Nine months ended December 31, |
Year ended March 31, | ||||||||||||||||||||||
| 2011 | 2010 | 2009 | 2010 | 2009 | 2008 | |||||||||||||||||||
| Statement of Operations Data: |
||||||||||||||||||||||||
| Revenue |
$ | 114,397 | $ | 136,676 | $ | 129,934 | $ | 171,191 | $ | 171,442 | $ | 130,058 | ||||||||||||
| Net income |
3,201 | 5,814 | 7,689 | 8,204 | 4,964 | 3,655 | ||||||||||||||||||
| Note: Periods prior to 2011 included results of both healthcare services and medical products division. | ||||||||||||||||||||||||
| Net income per common share - basic |
.20 | .38 | .53 | .56 | .34 | .32 | ||||||||||||||||||
| Net income per common share - diluted |
.20 | .36 | .48 | .52 | .31 | .27 | ||||||||||||||||||
| Market closing price per share - end of period |
8.52 | 16.49 | 14.13 | 11.81 | 4.97 | 25.17 | ||||||||||||||||||
| Book value per share - end of period |
8.47 | 8.02 | 7.18 | 7.30 | 6.60 | 6.14 | ||||||||||||||||||
| Note: Per share information has been retroactively adjusted to give effect to the three-for-two stock split effective as of April 1, 2008 | ||||||||||||||||||||||||
| Balance Sheet Data (at end of period): |
||||||||||||||||||||||||
| Total assets |
$ | 199,392 | $ | 174,173 | $ | 169,279 | $ | 170,843 | $ | 162,637 | $ | 135,979 | ||||||||||||
| Long term debt and capitalized leases |
23,818 | 23,070 | 21,578 | 22,593 | 23,709 | 22,578 | ||||||||||||||||||
| Total stockholders’ equity |
142,501 | 132,072 | 106,882 | 108,911 | 96,440 | 87,388 | ||||||||||||||||||
| Year ended December 31, |
Nine months ended December 31, |
Year ended March 31, | ||||||||||||||||||||||
| 2011 | 2010 | 2009 | 2010 | 2009 | 2008 | |||||||||||||||||||
| Segment information: |
||||||||||||||||||||||||
| Healthcare Services division - revenue |
$ | 114,397 | $ | 74,224 | $ | 64,610 | $ | 85,778 | $ | 79,357 | $ | 65,817 | ||||||||||||
| Healthcare Services division - operating income |
5,668 | 11,898 | 12,043 | 14,393 | 7,309 | 10,342 | ||||||||||||||||||
| Medical Products division - revenue |
— | 62,452 | 65,324 | 85,413 | 92,085 | 64,241 | ||||||||||||||||||
| Medical Products division - operating (loss) income |
— | (1,806 | ) | 25 | (366 | ) | 508 | (2,607 | ) | |||||||||||||||
31
Table of Contents
ITEM 7. MANAGEMENT’S DISCUSSION AND ANALYSIS OF FINANCIAL CONDITION AND RESULTS OF OPERATIONS
Statements contained in this Annual Report on Form 10-K relating to plans, strategies, objectives, economic performance and trends and other statements that are not descriptions of historical facts may be forward-looking statements within the meaning of Section 27A of the Securities Act of 1933, as amended (the “Securities Act”), and Section 21E of the Securities Exchange Act of 1934, as amended (the “Exchange Act”). Forward-looking information is inherently subject to risks and uncertainties, and actual results could differ materially from those currently anticipated due to a number of factors, which include, but are not limited to, the factors set forth under the heading “Risk Factors” and elsewhere in this Annual Report, and in other documents filed by the Company with the Securities and Exchange Commission from time to time. Forward-looking statements may be identified by terms such as “may,” “will,” “should,” “could,” “expects,” “plans,” “intends,” “anticipates,” “believes,” “estimates,” “predicts,” “forecasts,” “potential,” or “continue” or similar terms or the negative of these terms. Although the Company believes that the expectations reflected in the forward-looking statements are reasonable, the Company cannot guarantee future results, levels of activity, performance or achievements. The Company has no obligation to update these forward-looking statements.
The following discussion and analysis should be read in conjunction with the Company’s audited consolidated financial statements and notes thereto.
Chindex was founded in 1981, is an American health care company providing healthcare services in China through the operations of United Family Healthcare (“United Family”), a network of private primary care hospitals and affiliated ambulatory clinics. United Family currently operates in Beijing, Shanghai, Tianjin and Guangzhou. For the year ended December 31, 2011, our healthcare services business reported revenue of $114 million, a growth of 20% over the prior year twelve months ended December 31, 2010 period. Our strategy is to continue our growth as a leading integrated healthcare provider in Greater China.
We historically also engaged in the distribution of western medical equipment to Chinese hospital purchasers through our former Medical Products division (“MPD”). MPD was restructured at the end of 2010 as described below. Consequently, our healthcare services business currently comprises substantially all of our operations and is subject to challenges and risks associated with operating in China, including the laws, policies and regulations of the Chinese Government concerning healthcare facilities and dependence upon the healthcare professionals staffing our hospital and clinic facilities. Our operating results vary from period to period as a result of a variety of social and epidemiological factors in the patient base served by our hospital network and the investment and development cycle related to the opening of new facilities.
Substantially all of our non-cash assets are located in China, and all of our revenues are derived from our operations in China. Accordingly, our business, financial condition and results of operations are subject, to a significant degree, to economic, political and legal developments in China. The economic system in China differs from the economies of most developed countries in many respects, including government investment, level of development, control of capital investment, control of foreign exchange and allocation of resources.
Change in Fiscal Yearend
On September 27, 2010, the Board of Directors approved the change of the Company’s fiscal yearend from March 31 to December 31 each year, commencing with December 31, 2010.
32
Table of Contents
Existing Facilities
We opened our first hospital facility in Beijing in 1997 and since inception have continuously pursued a strategy of expansion and market penetration. Our current operations consist of:
| • | Our Beijing hospital, which was the first private international-standards hospital in Beijing, recently was expanded to 120 licensed beds. |
| • | Four separate freestanding clinics in Beijing that coordinate services with our flagship hospital. |
| • | Our Shanghai hospital, which offers 50 licensed beds and made us the only foreign-invested, multi-facility hospital network in China. |
| • | Three medical clinics and one dental clinic in Shanghai that coordinate services with our flagship hospital. |
| • | Our Tianjin hospital, offering 26 licensed beds. |
| • | Our Guangzhou clinic, which offers its own broad scope of clinical services. |
Current Expansion Projects
We currently are engaged in a number of expansion projects in our current markets. The Chinese Government’s ongoing healthcare reform program encourages private investment, such as we offer, as the primary source for development of specialty and premium healthcare services within the Chinese healthcare system. Our current expansion projects include:
| • | In Beijing, continued expansion at our flagship hospital campus, where we recently more than doubled our licensed beds. |
| • | In Shanghai, continued expansion at our flagship hospital campus in Puxi, a new clinic near that campus and continued expansion at our managed clinic in the Pudong district. |
| • | In Tianjin, expansion through development of a freestanding clinic that will coordinate services with our flagship hospital. |
| • | In Guangzhou, development of a new hospital expected to open in 2014-2015. |
Beijing. The expansion projects opening in Beijing in 2012-2014 will include a variety of increased services including comprehensive cancer care, neurosurgery, orthopedic surgery, cath lab and cardiovascular surgery. In addition, in 2011 we announced our latest development project, the United Family Rehabilitation Center in Beijing, which is a new 150 licensed bed, 124,000 square foot facility adjacent to a large park in east Beijing which is expected to open in 2012-2014. Our expansion of services into the premium rehabilitation market which we expect will fill an existing void in China’s health care system for those seeking quality premium care when recovering from surgeries or debilitating illnesses in the neurological, cardiac and orthopedic areas.
Shanghai. In Shanghai in 2012, we plan to continue to expand service offerings at our main Puxi campus, open a second clinic close to the hospital main campus and expand operations in Pudong.
Tianjin. In 2011, we opened our entry facility in Tianjin, which is licensed for 26 beds and is designed to focus on primary care services. Expansion in the Tianjin market is planned through development of a satellite clinic in another affluent district of the city.
33
Table of Contents
Guangzhou. In Guangzhou in 2014-2015, we plan to open a new hospital similar in scope to our Beijing, Shanghai and Tianjin hospitals.
In connection with the expansion plans outlined above, over the next twelve months we have planned capital expenditures of up to $40 million for construction, equipment and information systems (see “Liquidity and Capital Resources”). During the year ended December 31, 2011, the development, pre-opening and start-up expenses, including post-opening expenses, for these projects were $7,768,000 compared to $2,107,000 in the prior period, reflecting primarily expenses incurred for the Beijing, Pudong and Tianjin projects.
The Chinese Government’s healthcare reform program encourages private development, such as our United Family network, as the primary source for providing specialty and premium healthcare services within the Chinese healthcare system. Nevertheless, expansions of our existing facilities as well as new hospital and affiliated clinic projects are complex, requiring several phases over extended periods of time. The projects are subject to delays routinely encountered in complex construction projects in regulated industries and are subject to, among other things, the receipt of (i) medical-related approvals from local health authorities and in some cases the Ministry of Health at the national level, (ii) foreign invested joint venture health facility approvals from the local Bureau of Commerce and Trade, and (iii) local construction and safety approvals. Accordingly, we give windows of expected completion of our expansion projects, the exact timing of which are subject to the actual receipt of the various government licenses and permits.
Recent Joint Venture
Effective December 31, 2010, the Company and Shanghai Fosun Pharmaceutical (Group) Co., Ltd (“FosunPharma”) and its subsidiary Fosun Industrial Co., Limited (“Fosun Industrial” and, with Fosun Pharmaceutical, the “Fosun Entities”) and certain of their respective subsidiaries formed a joint venture created and consolidated under Chindex Medical Limited (“CML”), a Hong Kong company, for the purpose of engaging in (i) the marketing, distribution and servicing of medical equipment in China and Hong Kong (except that sales and distribution related activities in relation to sales and servicing in China and Hong Kong may take place in other jurisdictions) and (ii) the manufacturing, marketing, sales and distribution of medical devices and medical equipment and consumables (the “Medical Products Business”), including our MPD division, which was transferred to the joint venture effective at the end of fiscal 2010. Consequently the business and results of operations of our former division have been deconsolidated from our financial statements, treated under the equity method of accounting, and retained by us only on a 49% equity interest basis. See Note 4 to the consolidated financial statements appearing elsewhere herein.
The preparation of the consolidated financial statements in conformity with U.S. generally accepted accounting principles requires management to make estimates, judgments, and assumptions that affect the reported amounts of assets and liabilities and disclosure of contingent assets and liabilities at the date of the consolidated financial statements and the reported amounts of revenue and expenses during the reporting period. Because of the use of estimates inherent in the financial reporting process, actual results could differ from those estimates. Areas in which significant judgments and estimates are used include revenue recognition, receivable collectibility and deferred tax valuation allowances.
Revenue Recognition
All revenue in the Healthcare Services division is from providing healthcare services and substantially all revenue in the Medical Products division was from the sale of products. (See Note 15 for further information on sales, gross profit by division, and income (loss) from operations before foreign exchange.)
Revenue related to services provided by the Healthcare Services division is net of contractual adjustments or discounts and is recognized in the period services are provided. The Healthcare Services division makes an estimate at the end of the month for certain inpatients that have not completed service. This estimate reflects only the cost of care up to the end of the month.
In the Healthcare Services division, our revenue is dependent on seasonal fluctuations related to epidemiology factors and the life styles of the expatriate community. In the Medical Products division, sales of capital equipment often required protracted sales efforts, long lead times, financing arrangements and other time-consuming steps. As a result of these factors impacting the timing of revenues, our operating results have varied and are expected to continue to vary from period to period and year to year.
In prior years, revenue related to the sale of medical equipment, instrumentation and products to customers in China by our former Medical Products division was recognized upon product shipment. Revenue from sales to customers in Hong Kong was recognized upon delivery. We provided installation, warranty, and training services for certain of our capital equipment and instrumentation sales. These services were viewed as perfunctory to the overall arrangement and were not accounted for separately
34
Table of Contents
from the equipment sale. Costs associated with installation, training and standard warranty were not significant and were recognized in cost of sales as they were incurred, while costs associated with non-standard warranties were accrued. Revenue from the separate sale of extended warranties was deferred and recognized over the warranty period. Sales involving multiple elements were analyzed and recognized under the guidelines of Staff Accounting Bulletin (SAB) No. 104, “Revenue Recognition” and ASC 605-25. From time to time, the Company supplied products and services to its customers which are delivered over time. Additionally, the Company evaluated revenue from the sale of equipment in accordance with the provisions of ASC 605-45 to determine whether such revenue should be recognized on a gross or a net basis. All of the factors in ASC 605-45 were considered with the primary factor being that the Company assumed credit and inventory risk and therefore recorded the gross amount of all sales as revenue.
Accounts Receivable
Accounts receivable are customer obligations due under normal trade terms. Subsequent to the deconsolidation of the Medical Products division, accounts receivable consists of patient obligations for healthcare services. Accounts receivable are reviewed on a quarterly basis to determine if any receivables will potentially be uncollectible based on the aging of the receivable and historical cash collections. Any accounts receivable balances that are determined to be uncollectible, along with a percentage allowance for each aging category of receivables are included in the overall allowance for doubtful accounts. After all attempts to collect a receivable have failed, the receivable is written off against the allowance. Management believes that the allowance for doubtful accounts as of December 31, 2011 and 2010 is adequate; however, actual write-offs might exceed the recorded allowance.
Deferred tax valuation allowances
Our operations are taxed in various jurisdictions including the United States and China. In certain jurisdictions, individual subsidiaries are taxed separately. We have identified deferred tax assets resulting from cumulative temporary differences at each balance sheet date. A valuation allowance is provided for those deferred tax assets for which we are unable to conclude that it is more likely than not that the tax benefit will be realized.
We have provided deferred tax valuation allowances for certain deferred tax assets related to various subsidiaries in China and the U.S. as of December 31, 2011 because we are not able to conclude that it is more likely than not that those assets will be realized. The U.S. net operating loss carryforwards expire at varying dates through 2031 and the China net operating loss carryforwards expire at varying dates through 2016.
35
Table of Contents
Overview of Consolidated Results
Fiscal year change and comparative financial results
The Company changed its fiscal year end to December 31, effective on December 31, 2010. In addition, the Company entered into the CML joint venture on December 31, 2010 and deconsolidated the Medical Products division on that date. As result, the comparative income statements will consist of the following: (1) comparison of the year ended December 31, 2011 to the year ended December 31, 2010 (unaudited), (2) comparison of the year ended December 31, 2011 to the nine months ended December 31, 2010, and (3) comparison of the nine month ended December 31, 2010 to the year ended March 31, 2010.
Due to the change in our business organization, the operating results for the healthcare services business in 2011 are not completely comparable to 2010. In prior years, the Company operated in two businesses, and our income statements of operations presentation included appropriate captions for both. In 2011, the Company operated in only one business and, since corporate overhead costs are not allocated over two businesses, the healthcare services business results in 2011 include a greater proportion of corporate overhead than in prior years.
Year ended December 31, 2011 compared to year ended December 31, 2010 (unaudited)
Net Revenue
(in thousands)
| Year ended December 31, | ||||||||||||
| 2011 | 2010 | Change | ||||||||||
| Healthcare services net revenue |
$ | 114,397 | $ | 95,392 | 20 | % | ||||||
|
|
|
|
|
|
|
|||||||
Our healthcare services revenue for the year ended December 31, 2011 was $114,397,000, a 20% increase from the year ended December 31, 2010 revenue of $95,392,000. The increase in net revenue is attributable to growth in both inpatient and outpatient services, primarily generated by our existing facilities.
36
Table of Contents
The table below identifies the relative contribution of inpatient and outpatient services to gross revenue.
| Year ended December 31, |
||||||||
| 2011 | 2010 | |||||||
| Inpatient/Outpatient gross revenue percentages |
||||||||
| Inpatient services as percent of gross revenue |
41 | % | 40 | % | ||||
| Outpatient services as percent of gross revenue |
59 | % | 60 | % | ||||
|
|
|
|
|
|||||
| 100 | % | 100 | % | |||||
|
|
|
|
|
|||||
The table below identifies the primary service lines contributing to gross revenue.
| Year ended December 31, |
||||||||
| 2011 | 2010 | |||||||
| Gross revenue by service line (hospital facilities only): |
||||||||
| Surgical services |
18.4 | % | 18.7 | % | ||||
| OB/GYN |
15.3 | % | 14.9 | % | ||||
| Pediatrics |
8.1 | % | 8.0 | % | ||||
| Ancillary services |
||||||||
| Laboratory |
10.1 | % | 10.2 | % | ||||
| Radiology |
10.8 | % | 11.4 | % | ||||
| Pharmacy |
12.2 | % | 11.8 | % | ||||
| All other services |
25.1 | % | 25.0 | % | ||||
|
|
|
|
|
|||||
| 100 | % | 100 | % | |||||
|
|
|
|
|
|||||
Operating expenses
(in thousands)
| Year ended December 31, | ||||||||||||
| 2011 | 2010 | Change | ||||||||||
| Salaries, wages and benefits |
$ | 64,074 | $ | 52,429 | 22 | % | ||||||
| Other operating expenses |
17,947 | 15,627 | 15 | % | ||||||||
| Supplies and purchased medical services |
13,233 | 9,616 | 38 | % | ||||||||
| Bad debt expense |
2,131 | 1,703 | 25 | % | ||||||||
| Depreciation and amortization |
5,145 | 3,757 | 37 | % | ||||||||
| Lease and rental expense |
6,199 | 4,013 | 54 | % | ||||||||
|
|
|
|
|
|
|
|||||||
| $ | 108,729 | $ | 87,145 | 25 | % | |||||||
|
|
|
|
|
|
|
|||||||
Salaries, wages and benefits (SWB) increased 22% in the current period compared to the prior year period primarily due to the increase in average headcount up 20% from 1,016 in 2010 to 1,220 in 2011 associated with the revenue increases and development activities in our existing facilities as well as for pre-opening activities and the opening of our expanded Beijing and Tianjin facilities.
Other operating expenses increased by $2,320,000 or 15%, primarily due to increased office and administrative supplies of approximately $762,000, business travel and meals $680,000, marketing of $470,000, and building utilities and other services of $511,000 in line with increased business activities.
Supplies and purchased medical services increased by $3,617,000 or 38%, due to increased usage of medical supplies and pharmaceuticals related to higher patient procedures of approximately $3,196,000 or 39%, and increased purchased medical services of approximately $421,000 or 31%.
37
Table of Contents
Bad debt expense increased by $428,000, and, as a percentage of net revenue, bad debt expense was 1.9% in 2011 and 1.8% in the prior year, which are in line with our historic averages.
Depreciation and amortization expense increased by $1,388,000 or 37% to $5,145,000, primarily due to the opening of expanded facilities, which are now being depreciated.
Lease and rental expense increased to $6,199,000 in the current year compared to $4,013,000 in the prior year period, primarily due to the increase in the total building space utilized in the expanded operations of our hospital and clinic network, as well as building space utilized for development projects.
Other Income and Expenses
Interest income during the year and prior year was $803,000 and $633,000, respectively, as there were no significant changes in average investment balances or interest rates.
Interest expense during the year was $645,000 as compared to interest expense of $759,000 in the prior year due to decreases of short-term debt and increases of capitalized interest increased from $165,000 for the year ended December 31, 2010 to $564,000 for the year ended December 31, 2011 due to higher construction activities.
Equity in income of unconsolidated affiliates, in the amount of $1,121,000 represents our 49% interest in the income of CML for the year ended December 31, 2011.
Taxes
We recorded a provision for taxes of $3,688,000 (an effective tax rate of approximately 53.5%) for the year ended December 31, 2011, compared to a provision for taxes of $4,279,000 (an effective tax rate of approximately 40.3%) for the year ended December 31, 2010. The increase of the effective tax rate in the current period is primarily due to the effect of losses in entities for which we cannot recognize tax benefit.
Year ended December 31, 2011 compared to nine months ended December 31, 2010
Net Revenue
(in thousands)
| Year ended December 31, |
Nine months ended December 31, |
|||||||||||
| 2011 | 2010 | Change | ||||||||||
| Healthcare services net revenue |
$ | 114,397 | $ | 74,224 | 54 | % | ||||||
|
|
|
|
|
|
|
|||||||
Our healthcare services revenue for the year ended December 31, 2011 was $114,397,000, an increase of approximately $40 million compared to the revenue of $74,224,000 in nine months ended December 31, 2010. The increase in net revenue is due to approximately $21 million attributable to the comparison with a nine-month short period and due to approximately $19 million attributable to growth in both inpatient and outpatient services, primarily generated by our existing facilities.
38
Table of Contents
The table below identifies the relative contribution of inpatient and outpatient services to gross revenue.
| Year ended December 31, |
Nine months ended December 31, |
|||||||
| 2011 | 2010 | |||||||
| Inpatient/Outpatient gross revenue percentages |
||||||||
| Inpatient services as percent of gross revenue |
41 | % | 41 | % | ||||
| Outpatient services as percent of gross revenue |
59 | % | 59 | % | ||||
|
|
|
|
|
|||||
| 100 | % | 100 | % | |||||
|
|
|
|
|
|||||
The table below identifies the primary service lines contributing to gross revenue.
| Year ended December 31, |
Nine months ended December 31 |
|||||||
| 2011 | 2010 | |||||||
| Gross revenue by service line (hospital facilities only): |
||||||||
| Surgical services |
18.4 | % | 19.0 | % | ||||
| OB/GYN |
15.3 | % | 14.9 | % | ||||
| Pediatrics |
8.1 | % | 7.8 | % | ||||
| Ancillary services |
||||||||
| Laboratory |
10.1 | % | 10.1 | % | ||||
| Radiology |
10.8 | % | 11.2 | % | ||||
| Pharmacy |
12.2 | % | 11.8 | % | ||||
| All other services |
25.1 | % | 25.2 | % | ||||
|
|
|
|
|
|||||
| 100 | % | 100 | % | |||||
|
|
|
|
|
|||||
Operating expenses
(in thousands)
| Year ended December 31, |
Nine months ended December 31, |
|||||||||||
| 2011 | 2010 | Change | ||||||||||
| Salaries, wages and benefits |
$ | 64,074 | $ | 40,051 | 60 | % | ||||||
| Other operating expenses |
17,947 | 12,365 | 45 | % | ||||||||
| Supplies and purchased medical services |
13,233 | 7,496 | 77 | % | ||||||||
| Bad debt expense |
2,131 | 1,364 | 56 | % | ||||||||
| Depreciation and amortization |
5,145 | 2,877 | 79 | % | ||||||||
| Lease and rental expense |
6,199 | 3,001 | 107 | % | ||||||||
|
|
|
|
|
|
|
|||||||
| $ | 108,729 | $ | 67,154 | 62 | % | |||||||
|
|
|
|
|
|
|
|||||||
Salaries, wages and benefits (SWB) for the year ended December 31, 2011 was $64,074,000, an increase of approximately $24 million compared to the SWB of $40,051,000 in nine months ended December 31, 2010. The increase in SWB is due to approximately $12.4 million attributable to the comparison with a nine-month short period and due to approximately $11.7 million attributable to approximately 20% increase in headcount from 1,016 at December 31, 2010 to 1,220 at December 31, 2011. Increases in headcount were due to both increased activities at our existing facilities as well as for pre-opening activities and the opening of our expanded Beijing and Tianjin facilities.
39
Table of Contents
Other operating expenses increased by $5,582,000 or 45%, primarily due to increased audit and other professional fees of approximately $1,543,000, office and administrative supplies of $950,000, business travel and meals $931,000, marketing of $693,000, building utilities and other services of $793,000 and business tax of $395,000. Of the total change of $5,582,000, approximately $3.2 million of the increase is due to the comparison to the short period and approximately $2.3 million is due to the increase in expenses as discussed above.
Supplies and purchased medical services increased by $5,737,000 or 77%, with approximately $2.1 million of the increase due to the comparison to the short period and approximately $3.6 million due to increased usage of medical supplies and pharmaceuticals related to higher patient procedures.
Bad debt expense increased by $767,000, and, as a percentage of net revenue, bad debt expense was 1.9% in 2011 and 1.8% in the prior period, which are in line with our historical averages.
Depreciation and amortization expense increased by $2,268,000 or 79% to $5,145,000, with $0.9 million of the increase due to the comparison to the short period and approximately $1.4 million primarily due to the opening of expanded facilities, which are now being depreciated.
Lease and rental expense increased to $6,199,000 in the current period compared to $3,001,000 in the prior year period, with approximately $1.0 million of the increase due to the comparison to the short period and approximately $2.2 million primarily due to the increase in the total building space utilized in the expanded operations of our hospital and clinic network, as well as building space utilized for development projects.
Other Income and Expenses
Interest income during the year and prior period was $803,000 and $496,000, respectively, as there were no significant changes in average investment balances or interest rates. The variance primarily is due to the comparison to the short period.
Interest expense during the year was $645,000 as compared to interest expense of $560,000 in the prior period due to the comparison to the short period.
Equity in income of unconsolidated affiliates in the amount of $1,121,000 represents our 49% interest in the income of CML for the year ended December 31, 2011.
Taxes
We recorded a provision for taxes of $3,688,000 (an effective tax rate of approximately 53.5%) for the year ended December 31, 2011, compared to a provision for taxes of $3,488,000 (an effective tax rate of approximately 37.5%) for the nine months ended December 31, 2010. The increase of the effective tax rate in the current period is primarily due to the effect of losses in entities for which we cannot recognize tax benefit.
40
Table of Contents
Nine months ended December 31, 2010 compared to year ended March 31, 2010
Net Revenue
| (in thousands of U.S. Dollars) | ||||||||||||
| Nine months ended December 31, 2010 |
Year ended March 31, 2010 |
Change | ||||||||||
| Healthcare services net revenue |
$ | 74,224 | $ | 85,778 | -13 | % | ||||||
|
|
|
|
|
|
|
|||||||
Our healthcare services revenue for the nine months ended December 31, 2010 was $74,224,000, which is a lower amount than the $85,778,000 recognized in the full fiscal year ended March 31, 2010. However, the decrease is primarily attributable to the comparison of a short nine-month period to a full 12-month fiscal year period. If the March 31, 2010 fiscal year revenue of $85.8 million is reduced by 25 percent to reflect an approximation to a 9-month period, the revenue would be $64,334,000. Then, comparing similar nine-month periods, the December 2010 9-month revenue would be approximately 15% higher than the March 31, 2010 revenue. The increase in revenue was attributable to growth in patient services in the Beijing, Shanghai and Guangzhou markets.
The table below identifies the relative contribution of inpatient and outpatient services to gross revenue during the periods.
| Nine months ended December 31, 2010 |
Year ended March 31, 2010 |
|||||||
| Inpatient/Outpatient gross revenue percentages |
||||||||
| Inpatient services as percent of gross revenue |
41 | % | 42 | % | ||||
| Outpatient services as percent of gross revenue |
59 | % | 58 | % | ||||
|
|
|
|
|
|||||
| 100 | % | 100 | % | |||||
|
|
|
|
|
|||||
The table below identifies the primary service lines contributing to gross revenue.
| Nine months ended December 31, 2010 |
Year ended March 31, 2010 |
|||||||
| Gross revenue by service line (hospital facilities only): |
||||||||
| Surgical services |
19.0 | % | 18.2 | % | ||||
| OB/GYN |
14.9 | % | 14.3 | % | ||||
| Pediatrics |
7.8 | % | 8.0 | % | ||||
| Ancillary services |
||||||||
| Laboratory |
10.1 | % | 10.3 | % | ||||
| Radiology |
11.2 | % | 11.8 | % | ||||
| Pharmacy |
11.8 | % | 11.8 | % | ||||
| All other services |
25.2 | % | 25.6 | % | ||||
|
|
|
|
|
|||||
| 100 | % | 100 | % | |||||
|
|
|
|
|
|||||
Operating expenses
| (in thousands of U.S. dollars) | ||||||||||||
| Nine months ended December 31, 2010 |
Year ended March 31, 2010 |
Change | ||||||||||
| Salaries, wages and benefits |
$ | 40,051 | 49,012 | -18 | % | |||||||
| Other operating expenses |
12,365 | 12,686 | -3 | % | ||||||||
| Supplies and purchased medical services |
7,496 | 8,840 | -15 | % | ||||||||
| Bad debt expense |
1,364 | 1,149 | 19 | % | ||||||||
| Depreciation and amortization |
2,877 | 3,544 | -19 | % | ||||||||
| Lease and rental expense |
3,001 | 3,368 | -11 | % | ||||||||
|
|
|
|
|
|
|
|||||||
| $ | 67,154 | $ | 78,599 | -15 | % | |||||||
|
|
|
|
|
|
|
|||||||
Salaries, wages and benefits (SWB) for the nine months ended December 31, 2010 was $40,051,000, a decrease of approximately $9 million compared to the SWB of $49,012,000 in the year ended March 31, 2010. The decrease in SWB is due to approximately $12 million attributable to the comparison with a nine-month short period and due to approximately $3.4 million attributable to growth in SWB of approximately 9 percent, due to increased headcount and increases in compensation. As a percentage of net revenue, SWB in the nine months ended December 31, 2010 was 54%, an improvement compared to 57% of net revenue for SWB expense in the year ended March 31, 2010.
Other operating expenses decreased by $321,000 or 3%. However, if the December 31, 2010 period is compared to 75% of the March 31, 2010 full fiscal year, the increase in the comparable nine-month periods is approximately 30%. The increase is primarily due to relatively low operating expenses in the prior March 31, 2010 period, due to business tax refunds received of approximately $1,000,000 attributable due to a change in China regulations that applied to for-profit healthcare entities.
Supplies and purchased medical services decreased by $1,344,000 or 15%, with approximately $2.1 million of the decrease due to the comparison to the short period and approximately $3.6 million due to increased usage of medical supplies and pharmaceuticals related to higher patient procedures. Generally, supplies and purchased medical services will fluctuate directly with SWB variations.
Bad debt expense increased by $215,000, and, as a percentage of net revenue, bad debt expense was 1.8% in 2011 and 1.3% in the prior period, which are in line with our historical averages.
Depreciation and amortization expense decreased by $667,000 or 19%, primarily due to the comparison to the short period.
Lease and rental expense decreased to $3,001,000 in the current period compared to $3,368,000 in the prior year period, with approximately $1.0 million of the change due to the comparison of a twelve-month period to a short nine-month period. Using comparable nine-month periods, lease and rental expense increased approximately 19%, as the Company continues to expand its facilities in line with increasing patient demand.
Other Income and Expenses
Interest income during the year and prior period was $496,000 and $1,487,000, respectively. The variance primarily is due to the comparison to the short period.
Interest expense during the year was $560,000 as compared to interest expense of $983,000 in the prior period due to the comparison to the short period and due to higher capitalized interest expense related to construction activities, as well as to lower debt levels.
Other expenses were lower, as the March 31, 2010 period included a $659,000 charge for the change in the fair value of warrants, while there was no similar charge in the December 31, 2010 period.
Taxes
We recorded a provision for taxes of $3,488,000 (an effective tax rate of approximately 37.5%) for the nine months ended December 31, 2010, compared to a provision for taxes of $6,096,000 (an effective tax rate of approximately 42.6%) for the year ended March 31, 2010.
Liquidity and Capital Resources
The following table sets forth our unrestricted cash, short-term investments, and accounts receivable for the years ended December 31, 2011 and December 31, 2010 (in thousands):
| December 31, 2011 |
December 31, 2010 |
|||||||
| Cash and cash equivalents |
$ | 33,755 | $ | 32,007 | ||||
| Investments |
26,394 | 37,631 | ||||||
| Receivables from affiliates |
10,984 | 9,330 | ||||||
| Accounts receivable |
13,947 | 11,601 | ||||||
The following table sets forth a summary of our cash flows from operating activities for the years ended December 31, 2011 and 2010 and nine months ended December 31, 2010. (in thousands):
| Year ended December 31, | Nine months ended December 31, |
|||||||||||
| 2011 | 2010 | 2010 | ||||||||||
| (Unaudited) | ||||||||||||
|
|
|
|
|
|
|
|||||||
| OPERATING ACTIVITIES |
||||||||||||
| Net income |
$ | 3,201 | $ | 6,329 | $ | 5,814 | ||||||
| Non cash items |
8,069 | 11,416 | 7,382 | |||||||||
| Changes in operating assets and liabilities: |
||||||||||||
| Restricted cash |
300 | (298 | ) | 42 | ||||||||
| Accounts receivable |
(3,791 | ) | 2,679 | (3,797 | ) | |||||||
| Receivable from affiliate |
(1,653 | ) | — | — | ||||||||
| Inventories |
(811 | ) | (3,923 | ) | (2,735 | ) | ||||||
| Accounts payable, accrued expenses, other current liabilities and deferred revenue |
4,557 | 2,873 | 2,724 | |||||||||
| Payable to affiliate |
1,669 | — | — | |||||||||
| Other |
(982 | ) | (2,629 | ) | (2,339 | ) | ||||||
|
|
|
|
|
|
|
|||||||
| Net cash provided by operating activities |
$ | 10,559 | $ | 16,447 | $ | 7,091 | ||||||
|
|
|
|
|
|
|
|||||||
Operating cash flow for the year ended December 31, 2011 was higher than the year ended December 31, 2010, primarily due to the increase in accounts payable and payable to our unconsolidated affiliate.
41
Table of Contents
The following table sets forth a summary of our cash flows from investing activities for the years ended December 31, 2011 and 2010 and nine months ended December 31, 2010. (in thousands):
| Year ended December 31, | Nine months ended December 31, |
|||||||||||
| 2011 | 2010 | 2010 | ||||||||||
| (Unaudited) | ||||||||||||
|
|
|
|
|
|
|
|||||||
| INVESTING ACTIVITIES |
||||||||||||
| Purchases of short-term investments and CDs |
$ | (26,966 | ) | $ | (4,977 | ) | $ | (7,446 | ) | |||
| Proceeds from redemption of CDs |
41,091 | 21,174 | 2,843 | |||||||||
| Deconsolidation of cash held by subsidiaries contributed to joint venture |
— | (22,917 | ) | (22,917 | ) | |||||||
| Purchases of property and equipment |
(23,843 | ) | (13,716 | ) | (9,941 | ) | ||||||
|
|
|
|
|
|
|
|||||||
| Net cash (used in) provided by investing activities |
$ | (9,718 | ) | $ | (20,436 | ) | $ | (37,461 | ) | |||
|
|
|
|
|
|
|
|||||||
Investing activities for year ended December 31, 2011 included expenditures for leasehold improvements and equipment in connection with our ongoing development and expansion of the United Family Healthcare network of private hospitals and clinics, and redemption of CDs were reinvested in comparable instruments. Investing activities for the year ended December 31, 2010 resulted in a decrease in cash of $20,436,000 primarily due to the deconsolidation of cash of $22,917,000 held by the Chindex MPD subsidiaries which were contributed to CML. In addition, $13,716,000 was used for construction activities in connection with the build-out of the United Family Healthcare network of hospitals and clinics in China.
The following table sets forth a summary of our cash flows from financing activities for the years ended December 31, 2011 and 2010 and nine months ended December 31, 2010. (in thousands):
| Year ended December 31, | Nine months ended December 31, |
|||||||||||
| 2011 | 2010 | 2010 | ||||||||||
| (Unaudited) | ||||||||||||
|
|
|
|
|
|
|
|||||||
| FINANCING ACTIVITIES |
||||||||||||
| Repayment of debt, sinking fund deposits and vendor financing |
$ | — | $ | (2,720 | ) | $ | (2,425 | ) | ||||
| Repurchase of restricted stock for income tax withholding |
(233 | ) | (943 | ) | (942 | ) | ||||||
| Proceeds from issuance of common stock |
— | 13,803 | 13,803 | |||||||||
| Proceeds from exercise of stock options and warrants |
175 | 731 | 641 | |||||||||
|
|
|
|
|
|
|
|||||||
| Net cash (used in) provided by financing activities |
$ | (58 | ) | $ | 10,871 | $ | 11,077 | |||||
|
|
|
|
|
|
|
|||||||
Financing activities for the year ended December 31, 2010 mainly consisted of proceeds of $13,803,000, net of transaction costs, from the issuance of common stock to Fosun Industrial Co., Limited, under the first closing pursuant to the Stock Purchase Agreement dated June 14, 2010. This agreement provides for an additional issuance of common stock to Fosun Industrial in a second closing upon finalization of the Chindex Medical Limited joint venture transaction.
In 2007 and 2008, we entered into two US Dollar loan facilities in the amount of $25 million and $20 million with International Finance Corporation (IFC) and DEG-Deutsche Investitions und Entwicklungsgesellschaft (DEG), respectively, for the financing of expansion projects in China. The conditions to disbursement to these loan facilities have never been met and may never be met and the applicable lender has a right to terminate its commitment, with DEG having notified us of such effective termination. In order to draw under the IFC facility, we would have to amend the terms of that facility with respect to project scope, formation of joint venture entities (such entities have yet to be approved to construct, equip and operate their respective new Joint Venture Hospitals), collateral package, timing of disbursements (and extension of deadlines which have already passed) and other related provisions. However, we experienced delays in the development timeline and certain changes in project scope for the proposed healthcare facilities was necessary because of fluctuations and uncertainties in the real estate
42
Table of Contents
markets in China resulting from the global economic downturn and, as a result, the process to formally approve the two joint ventures has taken longer than originally anticipated. In July 2010, however, we received formal approval of the new joint venture for the Beijing expansion project from the Chinese authorities and are currently in discussions with IFC to amend its loan facility in order to draw thereunder. There can be no assurances that we will be able to amend the IFC facility on terms acceptable to us and IFC, which failure, absent an alternative source of financing, could have a material adverse effect on our operations and our ability to complete our proposed expansion projects on time or at all.
In October 2005, BJU and SHU obtained long-term debt financing under a program with IFC. As of December 31, 2011, the outstanding balance of this debt was 64,880,000 Chinese Renminbi (current translated value of $10,297,000 and is classified as long-term). Beginning of October 2010, we began payments to the sinking fund pursuant to the loan agreement. As of December 31, 2011, the sinking fund assets were 6,488,000 Chinese Renminbi (current translated value of $1,030,000 was recorded in long-term restricted cash). In the coming twelve months, we are scheduled to make the second and third deposits to the sinking fund of which total 19,464,000 Chinese Renminbi.
Over the past three years, there have been continuing and significant disruptions in the world financial markets including those in China. We have not experienced significant negative impacts to operating activities as a result of these events. We have taken steps to ensure the security of our cash and investment holdings through deposits with highly liquid, global banking institutions. Our daily operations generate significant operating cash flows and have not been dependent upon credit availability. Our patient base in our current facilities are by and large considered to be in the wealthiest segment of society, for whom healthcare spending represents a very small percentage of their income and therefore is expected to be less impacted by an economic slowdown and to the extent their assets are affected, this will likely not impact their decision making on healthcare purchases. Our current expansion projects as described above are expected to be funded with existing cash and credit facilities as described above, provided that there can be no assurances that such facilities will be available or sufficient, that the preconditions to disbursements under the facilities will be satisfied or that, in any event, disbursements under the IFC Facility will be achieved.
Over the next twelve months we anticipate total capital expenditures of up to $40 million related to the maintenance and expansion of our business operations. The Beijing and Shanghai operating hospital and clinic facilities, we plan maintenance and organic growth expenditures of up to $4 million for each facility. United Family Healthcare network development plans include up to $2 million in expenditures primarily related to network IT investment. Expansion projects are expected to account for up to $30 million in expenditures. Specifically, we anticipate final payments related to the expansion of the Beijing hospital main campus and New Hope clinic to be approximately $9 million; final payments related to the opening of the Tianjin hospital to be approximately $5 million; we plan for expenditures of approximately $16 million for the Beijing Rehabilitation project. We intend to fund these expenditures through corporate capital reserves and cash flow from operations. Registered foreign debt is expected to be secured by each operating foreign invested joint venture upon obtaining required governmental and credit approvals.
In addition, as described above, we had entered into the IFC facility, which is currently not available, for the purpose of funding the expansion of our United Family healthcare network. The expansion projects in the Beijing, Shanghai, Tianjin and Guangzhou markets are underway in various states of progress. In particular, due to the timing of the development process for the planned joint venture hospital in Guangzhou, significant expenditures for that project are not expected until 2013 and beyond.
Based on the foregoing, we believe that our existing capital resources are sufficient to fund our working capital and capital expenditure requirements for the next 12 months, although there can be no assurances to this effect. We will require financing arrangements to meet our capital expenditures beyond this period. As noted above, there can be no assurances that we will be able to amend the IFC Facility on terms acceptable to us and IFC, which failure, absent an alternative source of financing, could have a
43
Table of Contents
material adverse effect on our operations and our ability to complete our proposed expansion projects on time or at all. Although we regularly consider and evaluate possible additional or alternative financing opportunities, no such financing currently is in place or negotiations. We will continue to evaluate a wide range of such opportunities, including both debt and equity-based financings in which we may borrow funds and/or share with one or more financial, institutional or strategic partners the ownership interest in one or more projects.
We may not be able to raise adequate capital to complete some or all of our business strategies, including our ongoing expansion projects, or to react rapidly to changes in technology, products, services or the competitive landscape. Healthcare service and medical product providers in China often face high capital requirements in order to take advantage of new market opportunities, respond to rigorous competitive pressures and react quickly to changes in technology. Many of our competitors are committing substantial capital and, in many instances, are forming alliances to acquire or maintain market leadership. There can be no assurance that we will be able to satisfy our capital requirements in the future. In particular, our strategy of expanding our healthcare facilities and services includes the establishment and maintenance of healthcare facilities, which require particularly significant capital. In addition, CML plans to expand its distribution capabilities for medical products. In the absence of sufficient available capital, we would be unable to establish or maintain healthcare facilities as planned, and the joint venture would be unable to expand its distribution business as planned.
Contractual Arrangements
The following table sets forth our contractual obligations and sinking fund requirements as of December 31, 2011:
(in thousands)
| Total | 2012 | 2013 | 2014 | 2015 | 2016 | Thereafter | ||||||||||||||||||||||
| Bank Loan (1) |
$ | 9,624 | $ | 2,614 | $ | 2,475 | $ | 2,337 | $ | 2,198 | — | $ | 0 | |||||||||||||||
| JPM financing |
15,000 | — | — | — | — | — | 15,000 | |||||||||||||||||||||
| Operating leases |
69,437 | 6,036 | 5,791 | 5,437 | 5,365 | 4,314 | 42,494 | |||||||||||||||||||||
|
|
|
|
|
|
|
|
|
|
|
|
|
|
|
|||||||||||||||
| Total contractual obligations |
$ | 94,061 | $ | 8,650 | $ | 8,266 | $ | 7,774 | $ | 7,563 | $ | 4,314 | $ | 57,494 | ||||||||||||||
|
|
|
|
|
|
|
|
|
|
|
|
|
|
|
|||||||||||||||
| (1) | Represents sinking fund deposits and also includes interest of $1,386,000. |
Not included in the table above is our expected total capital expenditures for the expansion and maintenance of our United Family Healthcare network development over the five year period. For the next twelve months, see “Liquidity and Capital Resources.”
For information about these contractual obligations, see Notes 7 and 11 to the consolidated financial statements appearing elsewhere in this Annual Report on Form 10-K.
Our revenue is dependent on seasonal fluctuations related to epidemiology factors and the life styles of the expatriate community. For example, many expatriate families traditionally take annual home leave outside of China during the summer months.
44
Table of Contents
Foreign Currency Exchange and Impact of Inflation
Because we receive 100% of our revenue and generate approximately 95% of our expenses within China, we have foreign currency exchange risk. The Chinese currency (RMB) is not freely traded and is closely controlled by the Chinese Government. The U.S. dollar (USD) has experienced volatility in world markets recently. During the year ended December 31, 2011, the RMB appreciated approximately 5.3% against the USD, resulting in an exchange gain of $670,000.
As part of our risk management program, we also perform sensitivity analyses to assess potential changes in revenue, operating results, cash flows and financial position relating to hypothetical movements in currency exchange rates. Our sensitivity analysis of changes in the fair value of the RMB to the USD at December 31, 2011, indicated that if the USD uniformly increased in value by 10% relative to the RMB, we would have experienced a 21% decrease in net income. Conversely, a 10% increase in the value of the RMB relative to the USD at December 31, 2011, would have resulted in a 26% increase in net income.
Based on the Consumer Price Index, for the year ended December 31, 2011, inflation in China was 5.4% and inflation in the United States was 3.2%. The average annual rate of inflation over the three-year period from 2009 to 2011 was 2.7% in China and 1.5% in the United States.
ITEM 7A. QUANTITATIVE AND QUALITATIVE DISCLOSURES ABOUT MARKET RISK
The Company holds the majority of all cash assets in 100% principal protected AA/Aa or higher rated accounts. Therefore, the Company believes that its market risk exposures are immaterial and reasonable possible near-term changes in market interest rates will not result in material near-term reductions in other income, material changes in fair values or cash flows. The Company does not have instruments for trading purposes. Instruments for non-trading purposes are operating and development cash assets held in interest-bearing accounts. The Company is exposed to certain foreign currency exchange risk (See “Foreign Currency Exchange and Impact of Inflation”).
ITEM 8. FINANCIAL STATEMENTS AND SUPPLEMENTARY DATA
Report of Independent Registered Public Accounting Firm
Board of Directors and Stockholders
Chindex International, Inc.
Bethesda, Maryland
We have audited Chindex International, Inc.’s internal control over financial reporting as of December 31, 2011, based on criteria established in Internal Control – Integrated Framework issued by the Committee of Sponsoring Organizations of the Treadway Commission (the COSO criteria). Chindex International Inc.’s management is responsible for maintaining effective internal control over financial reporting and for its assessment of the effectiveness of internal control over financial reporting, included in the accompanying Item 9A, Management’s Report on Internal Control Over Financial Reporting. Our responsibility is to express an opinion on the Company’s internal control over financial reporting based on our audit.
We conducted our audit in accordance with the standards of the Public Company Accounting Oversight Board (United States). Those standards require that we plan and perform the audit to obtain reasonable assurance about whether effective internal control over financial reporting was maintained in all material respects. Our audit included obtaining an understanding of internal control over financial reporting, assessing the risk that a material weakness exists, and testing and evaluating the design and operating effectiveness of internal control based on the assessed risk. Our audit also included performing such other procedures as we considered necessary in the circumstances. We believe that our audit provides a reasonable basis for our opinion.
45
Table of Contents
A company’s internal control over financial reporting is a process designed to provide reasonable assurance regarding the reliability of financial reporting and the preparation of financial statements for external purposes in accordance with generally accepted accounting principles. A company’s internal control over financial reporting includes those policies and procedures that (1) pertain to the maintenance of records that, in reasonable detail, accurately and fairly reflect the transactions and dispositions of the assets of the company; (2) provide reasonable assurance that transactions are recorded as necessary to permit preparation of financial statements in accordance with generally accepted accounting principles, and that receipts and expenditures of the company are being made only in accordance with authorizations of management and directors of the company; and (3) provide reasonable assurance regarding prevention or timely detection of unauthorized acquisition, use, or disposition of the company’s assets that could have a material effect on the financial statements.
Because of its inherent limitations, internal control over financial reporting may not prevent or detect misstatements. Also, projections of any evaluation of effectiveness to future periods are subject to the risk that controls may become inadequate because of changes in conditions, or that the degree of compliance with the policies or procedures may deteriorate.
In our opinion, Chindex International, Inc. maintained, in all material respects, effective internal control over financial reporting as of December 31, 2011, based on the COSO criteria.
We also have audited, in accordance with the standards of the Public Company Accounting Oversight Board (United States), the consolidated balance sheets of Chindex International, Inc. as of December 31, 2011 and 2010, and the related consolidated statements of operations, stockholders’ equity, and cash flows for the year ended December 31, 2011, the nine months ended December 31, 2010, and the year ended March 31, 2010 and our report dated March 15, 2012 expressed an unqualified opinion thereon. We did not audit the financial statements of Chindex Medical Limited, the joint venture or CML (which starting as of December 31, 2010, is being accounted for under the equity method of accounting by Chindex International, Inc.), and which statements reflect total assets (equity investment) of $122,987,000 as of December 31, 2011, and income (equity method) of $3,353,000 for the year then ended. Those statements were audited by other auditors whose report has been furnished to us, and our opinion, insofar as it relates to the amounts included for CML, is based solely on the report of the other auditors.
/s/ BDO USA, LLP
Bethesda, Maryland
March 15, 2012
Report of Independent Registered Public Accounting Firm
Board of Directors and Stockholders
Chindex International, Inc.
Bethesda, Maryland
We have audited the accompanying consolidated balance sheets of Chindex International, Inc. (the Company) as of December 31, 2011 and 2010 and the related consolidated statements of operations, stockholders’ equity, and cash flows for the year ended December 31, 2011, the nine months ended December 31, 2010, and the year ended March 31, 2010. In connection with our audits of the financial statements, we have also audited the financial statement schedule listed in the accompanying index. These financial statements and schedule are the responsibility of the Company’s management. Our responsibility is to express an opinion on these financial statements and schedule based on our audits. We did not audit the financial statements of Chindex Medical Limited, the joint venture or CML (which starting as of December 31,
46
Table of Contents
2010, is being accounted for under the equity method of accounting by Chindex International, Inc.), and which statements reflect total assets (equity investment) of $122,987,000 as of December 31, 2011, and income (equity method) of $3,353,000 for the year then ended. Those statements were audited by other auditors whose report has been furnished to us, and our opinion, insofar as it relates to the amounts included for CML, is based solely on the report of the other auditors.
We conducted our audits in accordance with the standards of the Public Company Accounting Oversight Board (United States). Those standards require that we plan and perform the audit to obtain reasonable assurance about whether the financial statements and schedule are free of material misstatement. An audit includes examining, on a test basis, evidence supporting the amounts and disclosures in the financial statements and schedule, assessing the accounting principles used and significant estimates made by management, as well as evaluating the overall presentation of the financial statements and schedule. We believe that our audits and the report of the other auditor provide a reasonable basis for our opinion.
In our opinion, based on our audits and the report of other auditors, the consolidated financial statements referred to above present fairly, in all material respects, the financial position of Chindex International, Inc. at December 31, 2011 and 2010, and the results of its operations and its cash flows for the year ended December 31, 2011, the nine months ended December 31, 2010, and the year ended March 31, 2010, in conformity with accounting principles generally accepted in the United States of America.
Also, in our opinion, the financial statement schedule, when considered in relation to the basic consolidated financial statements taken as a whole, present fairly, in all material respects, the information set forth therein.
We also have audited, in accordance with the standards of the Public Company Accounting Oversight Board (United States), Chindex International, Inc.’s internal control over financial reporting as of December 31, 2011, based on criteria established in Internal Control – Integrated Framework issued by the Committee of Sponsoring Organizations of the Treadway Commission (COSO) and our report dated March 15, 2012 expressed an unqualified opinion thereon.
/s/ BDO USA, LLP
Bethesda, Maryland
March 15, 2012
47
Table of Contents
CHINDEX INTERNATIONAL, INC.
CONSOLIDATED BALANCE SHEETS
(in thousands except share data)
| December 31, 2011 | December 31, 2010 | |||||||
| ASSETS | ||||||||
| Current assets: |
||||||||
| Cash and cash equivalents |
$ | 33,755 | $ | 32,007 | ||||
| Restricted cash |
— | 300 | ||||||
| Investments |
26,394 | 37,631 | ||||||
| Accounts receivable, less allowance for doubtful accounts of $8,300 and $6,748, respectively |
13,947 | 11,601 | ||||||
| Receivables from affiliates |
10,984 | 9,330 | ||||||
| Inventories of supplies, net |
2,307 | 1,413 | ||||||
| Deferred income taxes |
3,887 | 3,242 | ||||||
| Other current assets |
4,652 | 3,856 | ||||||
|
|
|
|
|
|||||
| Total current assets |
95,926 | 99,380 | ||||||
| Restricted cash and sinking funds |
1,030 | 980 | ||||||
| Investments |
100 | 2,439 | ||||||
| Investment in unconsolidated affiliate |
33,728 | 31,756 | ||||||
| Property and equipment, net |
65,465 | 37,099 | ||||||
| Noncurrent deferred income taxes |
424 | 108 | ||||||
| Other assets |
2,719 | 2,411 | ||||||
|
|
|
|
|
|||||
| Total assets |
$ | 199,392 | $ | 174,173 | ||||
|
|
|
|
|
|||||
| LIABILITIES AND STOCKHOLDERS’ EQUITY | ||||||||
| Current liabilities: |
||||||||
| Accounts payable |
$ | 3,957 | $ | 4,038 | ||||
| Payable to affiliates |
9,404 | — | ||||||
| Accrued expenses |
11,735 | 8,541 | ||||||
| Other current liabilities |
5,549 | 3,874 | ||||||
| Income taxes payable |
2,141 | 2,147 | ||||||
|
|
|
|
|
|||||
| Total current liabilities |
32,786 | 18,600 | ||||||
| Long-term debt and convertible debentures |
23,818 | 23,070 | ||||||
| Long-term deferred tax liability |
287 | 431 | ||||||
|
|
|
|
|
|||||
| Total liabilities |
56,891 | 42,101 | ||||||
|
|
|
|
|
|||||
| Commitments and contingencies |
||||||||
| Stockholders’ equity: |
||||||||
| Preferred stock, $.01 par value, 500,000 shares authorized, none issued |
— | — | ||||||
| Common stock, $.01 par value, 28,200,000 shares authorized, including 3,200,000 designated Class B: |
||||||||
| Common stock – 15,652,917 and 15,310,426 shares issued and outstanding at December 31, 2011 and December 31, 2010, respectively |
157 | 153 | ||||||
| Class B stock – 1,162,500 shares issued and outstanding at December 31, 2011 and December 31, 2010, respectively |
12 | 12 | ||||||
| Additional paid-in capital |
118,930 | 115,815 | ||||||
| Accumulated other comprehensive income |
8,911 | 4,802 | ||||||
| Retained earnings |
14,491 | 11,290 | ||||||
|
|
|
|
|
|||||
| Total stockholders’ equity |
142,501 | 132,072 | ||||||
|
|
|
|
|
|||||
| Total liabilities and stockholders’ equity |
$ | 199,392 | $ | 174,173 | ||||
|
|
|
|
|
|||||
The accompanying notes are an integral part of these consolidated financial statements.
48
Table of Contents
CHINDEX INTERNATIONAL, INC.
CONSOLIDATED STATEMENTS OF OPERATIONS
(in thousands except share and per share data)
| Year ended December 31, |
Nine months ended December 31, | Year ended March 31, |
||||||||||||||
| 2011 | 2010 | 2009 | 2010 | |||||||||||||
| (Unaudited) | ||||||||||||||||
|
|
|
|
|
|
|
|
|
|||||||||
| Revenue |
||||||||||||||||
| Healthcare services revenue |
$ | 114,397 | $ | 74,224 | $ | 64,610 | $ | 85,778 | ||||||||
| Product sales |
— | 62,452 | 65,324 | 85,413 | ||||||||||||
|
|
|
|
|
|
|
|
|
|||||||||
| Total revenue |
114,397 | 136,676 | 129,934 | 171,191 | ||||||||||||
|
|
|
|
|
|
|
|
|
|||||||||
| Operating expenses |
||||||||||||||||
| Healthcare services: |
||||||||||||||||
| Salaries, wages and benefits |
64,074 | 40,051 | 36,634 | 49,012 | ||||||||||||
| Other operating expenses |
17,947 | 12,365 | 9,388 | 12,686 | ||||||||||||
| Supplies and purchased medical services |
13,233 | 7,496 | 6,720 | 8,840 | ||||||||||||
| Bad debt expense |
2,131 | 1,364 | 810 | 1,149 | ||||||||||||
| Depreciation and amortization |
5,145 | 2,877 | 2,664 | 3,544 | ||||||||||||
| Lease and rental expense |
6,199 | 3,001 | 2,392 | 3,368 | ||||||||||||
|
|
|
|
|
|
|
|
|
|||||||||
| 108,729 | 67,154 | 58,608 | 78,599 | |||||||||||||
|
|
|
|
|
|
|
|
|
|||||||||
| Products: |
||||||||||||||||
| Product sales costs |
— | 43,773 | 47,439 | 61,992 | ||||||||||||
| Product selling and other operating expenses |
— | 16,201 | 10,609 | 16,188 | ||||||||||||
|
|
|
|
|
|
|
|
|
|||||||||
| — | 59,974 | 58,048 | 78,180 | |||||||||||||
|
|
|
|
|
|
|
|
|
|||||||||
| Total operating expenses |
108,729 | 127,128 | 116,656 | 156,779 | ||||||||||||
|
|
|
|
|
|
|
|
|
|||||||||
| Income from operations |
5,668 | 9,548 | 13,278 | 14,412 | ||||||||||||
| Other income and (expenses) |
||||||||||||||||
| Interest income |
803 | 496 | 1,350 | 1,487 | ||||||||||||
| Interest (expense) |
(645 | ) | (560 | ) | (784 | ) | (983 | ) | ||||||||
| Loss on deconsolidation of subsidiaries |
— | (126 | ) | — | — | |||||||||||
| Equity in net income of unconsolidated affiliate |
1,121 | — | — | — | ||||||||||||
| Miscellaneous (expense) income - net |
(58 | ) | (56 | ) | (851 | ) | (616 | ) | ||||||||
|
|
|
|
|
|
|
|
|
|||||||||
| Income before income taxes |
6,889 | 9,302 | 12,993 | 14,300 | ||||||||||||
| Provision for income taxes |
(3,688 | ) | (3,488 | ) | (5,304 | ) | (6,096 | ) | ||||||||
|
|
|
|
|
|
|
|
|
|||||||||
| Net income |
$ | 3,201 | $ | 5,814 | $ | 7,689 | $ | 8,204 | ||||||||
|
|
|
|
|
|
|
|
|
|||||||||
| Net income per common share - basic |
$ | .20 | $ | .38 | $ | .53 | $ | .56 | ||||||||
|
|
|
|
|
|
|
|
|
|||||||||
| Weighted average shares outstanding - basic |
16,141,063 | 15,347,173 | 14,533,601 | 14,579,759 | ||||||||||||
|
|
|
|
|
|
|
|
|
|||||||||
| Net income per common share - diluted |
$ | .20 | $ | .36 | $ | .48 | $ | .52 | ||||||||
|
|
|
|
|
|
|
|
|
|||||||||
| Weighted average shares outstanding - diluted |
17,413,330 | 16,703,670 | 16,127,180 | 16,132,339 | ||||||||||||
|
|
|
|
|
|
|
|
|
|||||||||
The accompanying notes are an integral part of these consolidated financial statements.
49
Table of Contents
CHINDEX INTERNATIONAL, INC.
CONSOLIDATED STATEMENTS OF CASH FLOWS
(in thousands)
| Year ended December 31, |
Nine months ended December 31, | Year ended March 31, |
||||||||||||||
| 2011 | 2010 | 2009 | 2010 | |||||||||||||
| (Unaudited) | ||||||||||||||||
|
|
|
|
|
|
|
|
|
|||||||||
| OPERATING ACTIVITIES |
||||||||||||||||
| Net income |
$ | 3,201 | $ | 5,814 | $ | 7,689 | $ | 8,204 | ||||||||
| Adjustments to reconcile net income to net cash provided by operating activities: |
||||||||||||||||
| Depreciation and amortization |
5,145 | 2,877 | 2,664 | 3,544 | ||||||||||||
| Provision for demonstration inventory |
— | 491 | 404 | 541 | ||||||||||||
| Inventory write down |
10 | 137 | 259 | 342 | ||||||||||||
| Provision for doubtful accounts—healthcare services |
2,131 | 1,364 | 810 | 1,149 | ||||||||||||
| Loss on disposal of property and equipment |
80 | 139 | (4 | ) | 16 | |||||||||||
| Equity in income of unconsolidated affiliate |
(1,121 | ) | — | — | — | |||||||||||
| Deferred income taxes |
(939 | ) | (547 | ) | 156 | 704 | ||||||||||
| Stock based compensation |
3,177 | 2,059 | 2,429 | 3,283 | ||||||||||||
| Foreign exchange (gain) loss |
(670 | ) | 544 | (1,210 | ) | (385 | ) | |||||||||
| Amortization of debt issuance costs |
9 | 7 | 7 | 9 | ||||||||||||
| Amortization of debt discount |
247 | 185 | 185 | 247 | ||||||||||||
| Loss on deconsolidation of subsidiaries |
— | 126 | — | — | ||||||||||||
| Non-cash charge for change in fair value of warrants |
— | — | 883 | 659 | ||||||||||||
| Changes in operating assets and liabilities: |
||||||||||||||||
| Restricted cash |
300 | 42 | 689 | 349 | ||||||||||||
| Accounts receivable |
(3,791 | ) | (3,797 | ) | 6,412 | 12,888 | ||||||||||
| Receivable from affiliate |
(1,653 | ) | — | — | — | |||||||||||
| Inventories |
(811 | ) | (2,735 | ) | (2,730 | ) | (3,918 | ) | ||||||||
| Other current assets and other assets |
(872 | ) | (2,576 | ) | (863 | ) | (432 | ) | ||||||||
| Accounts payable, accrued expenses, other current liabilities and deferred revenue |
4,557 | 2,724 | (3,185 | ) | (3,060 | ) | ||||||||||
| Payable to affiliate |
1,669 | — | — | — | ||||||||||||
| Income taxes payable |
(110 | ) | 237 | 1,370 | 649 | |||||||||||
|
|
|
|
|
|
|
|
|
|||||||||
| Net cash provided by operating activities |
10,559 | 7,091 | 15,965 | 24,789 | ||||||||||||
| INVESTING ACTIVITIES |
||||||||||||||||
| Purchases of short-term investments and CDs |
(26,966 | ) | (7,446 | ) | (6,493 | ) | (4,024 | ) | ||||||||
| Proceeds from redemption of CDs |
41,091 | 2,843 | — | 18,331 | ||||||||||||
| Deconsolidation of cash held by subsidiaries contributed to Chindex Medical Limited JV |
— | (22,917 | ) | — | — | |||||||||||
| Purchases of property and equipment |
(23,843 | ) | (9,941 | ) | (3,843 | ) | (7,086 | ) | ||||||||
|
|
|
|
|
|
|
|
|
|||||||||
| Net cash (used in) provided by investing activities |
(9,718 | ) | (37,461 | ) | (10,336 | ) | 7,221 | |||||||||
| FINANCING ACTIVITIES |
||||||||||||||||
| Repayment of debt, sinking fund deposits and vendor financing |
— | (2,425 | ) | (1,398 | ) | (1,693 | ) | |||||||||
| Repurchase of restricted stock for income tax withholding |
(233 | ) | (942 | ) | (108 | ) | (109 | ) | ||||||||
| Proceeds from issuance of common stock |
— | 13,803 | — | — | ||||||||||||
| Proceeds from exercise of stock options and warrants |
175 | 641 | 400 | 490 | ||||||||||||
|
|
|
|
|
|
|
|
|
|||||||||
| Net cash (used in) provided by financing activities |
(58 | ) | 11,077 | (1,106 | ) | (1,312 | ) | |||||||||
| Effect of foreign exchange rate changes on cash and cash equivalents |
965 | 646 | (1,056 | ) | (337 | ) | ||||||||||
|
|
|
|
|
|
|
|
|
|||||||||
| Net increase (decrease) in cash and cash equivalents |
1,748 | (18,647 | ) | 3,467 | 30,361 | |||||||||||
| Cash and cash equivalents at beginning of period |
32,007 | 50,654 | 20,293 | 20,293 | ||||||||||||
|
|
|
|
|
|
|
|
|
|||||||||
| Cash and cash equivalents at end of period |
$ | 33,755 | $ | 32,007 | $ | 23,760 | $ | 50,654 | ||||||||
|
|
|
|
|
|
|
|
|
|||||||||
| Supplemental disclosures of cash flow information: |
||||||||||||||||
| Cash paid for interest |
$ | 670 | $ | 668 | $ | 724 | $ | 641 | ||||||||
| Cash paid for taxes |
$ | 4,751 | $ | 3,416 | $ | 3,744 | $ | 4,770 | ||||||||
| Non-cash investing and financing activities consist of the following: |
||||||||||||||||
| Property and equipment additions included in accounts payable and payable to affiliates |
$ | 7,931 | $ | 6,482 | $ | — | $ | 532 | ||||||||
| Investment in unconsolidated affiliates |
$ | — | $ | 8,839 | $ | — | $ | — | ||||||||
| Cashless exercise of warrants at fair value |
$ | — | $ | — | $ | — | $ | 800 | ||||||||
| Exercise of warrants at fair value |
$ | — | $ | — | $ | 201 | $ | — | ||||||||
The accompanying notes are an integral part of these consolidated financial statements.
50
Table of Contents
CHINDEX INTERNATIONAL, INC.
CONSOLIDATED STATEMENTS OF STOCKHOLDERS’ EQUITY
For the year ended December 31, 2011, the nine months ended December 31, 2010 and the year ended March 31, 2010
(in thousands)
| Common Stock | Common Stock Class B | Additional Paid In |
Retained Earnings Accumulated |
Accumulated Other Comprehensive |
||||||||||||||||||||||||||||
| Shares | Amount | Shares | Amount | Capital | Deficit | Income | Total | |||||||||||||||||||||||||
| Balance at March 31, 2009 |
13,452,007 | $ | 135 | 1,162,500 | $ | 12 | $ | 95,808 | $ | (2,587 | ) | $ | 3,072 | $ | 96,440 | |||||||||||||||||
| Net income FY 2010 |
— | — | — | — | — | 8,204 | — | 8,204 | ||||||||||||||||||||||||
| Foreign currency translation adjustment |
— | — | — | — | — | — | (56 | ) | (56 | ) | ||||||||||||||||||||||
|
|
|
|||||||||||||||||||||||||||||||
| Comprehensive income |
— | — | — | — | — | — | — | 8,148 | ||||||||||||||||||||||||
|
|
|
|||||||||||||||||||||||||||||||
| Cumulative effect of change in accounting principle |
— | — | — | — | — | (141 | ) | — | (141 | ) | ||||||||||||||||||||||
| Stock based compensation |
— | — | — | 3,283 | — | — | 3,283 | |||||||||||||||||||||||||
| Exercise of warrants |
— | — | — | — | 800 | — | — | 800 | ||||||||||||||||||||||||
| Options and warrants exercised and issuance of restricted stock |
313,850 | 3 | — | — | 378 | — | — | 381 | ||||||||||||||||||||||||
|
|
|
|
|
|
|
|
|
|
|
|
|
|
|
|
|
|||||||||||||||||
| Balance at March 31, 2010 |
13,765,857 | 138 | 1,162,500 | 12 | 100,269 | 5,476 | 3,016 | 108,911 | ||||||||||||||||||||||||
|
|
|
|
|
|
|
|
|
|
|
|
|
|
|
|
|
|||||||||||||||||
| Net income CY 2010 |
— | — | — | — | — | 5,814 | — | 5,814 | ||||||||||||||||||||||||
| Foreign currency translation adjustment |
— | — | — | — | — | — | 1,786 | 1,786 | ||||||||||||||||||||||||
|
|
|
|||||||||||||||||||||||||||||||
| Comprehensive income |
— | — | — | — | — | — | — | 7,600 | ||||||||||||||||||||||||
|
|
|
|||||||||||||||||||||||||||||||
| Stock based compensation |
— | — | — | 2,059 | — | — | 2,059 | |||||||||||||||||||||||||
| Proceeds from issuance of common stock |
933,022 | 9 | — | — | 13,794 | — | — | 13,803 | ||||||||||||||||||||||||
| Options exercised and issuance of restricted stock |
611,547 | 6 | — | — | 635 | — | — | 641 | ||||||||||||||||||||||||
| Purchase and retirement of restricted stock for tax witholding |
— | — | — | — | (942 | ) | — | — | (942 | ) | ||||||||||||||||||||||
|
|
|
|
|
|
|
|
|
|
|
|
|
|
|
|
|
|||||||||||||||||
| Balance at December 31, 2010 |
15,310,426 | 153 | 1,162,500 | 12 | 115,815 | 11,290 | 4,802 | 132,072 | ||||||||||||||||||||||||
|
|
|
|
|
|
|
|
|
|
|
|
|
|
|
|
|
|||||||||||||||||
| Net income |
— | — | — | — | — | 3,201 | — | 3,201 | ||||||||||||||||||||||||
| Foreign currency translation adjustment |
— | — | — | — | — | — | 3,276 | 3,276 | ||||||||||||||||||||||||
| Share of other comprehensive income of unconsolidated affiliate |
— | — | — | — | — | — | 833 | 833 | ||||||||||||||||||||||||
|
|
|
|||||||||||||||||||||||||||||||
| Comprehensive income |
— | — | — | — | — | — | — | 7,310 | ||||||||||||||||||||||||
|
|
|
|||||||||||||||||||||||||||||||
| Stock based compensation |
— | — | — | — | 3,177 | — | — | 3,177 | ||||||||||||||||||||||||
| Purchase and retirement of restricted stock for tax witholding |
(24,077 | ) | — | — | — | (233 | ) | — | — | (233 | ) | |||||||||||||||||||||
| Options exercised and issuance of restricted stock, net of restricted stock forfeited |
366,568 | 4 | — | — | 171 | — | — | 175 | ||||||||||||||||||||||||
|
|
|
|
|
|
|
|
|
|
|
|
|
|
|
|
|
|||||||||||||||||
| Balance at December 31, 2011 |
15,652,917 | $ | 157 | 1,162,500 | $ | 12 | $ | 118,930 | $ | 14,491 | $ | 8,911 | $ | 142,501 | ||||||||||||||||||
|
|
|
|
|
|
|
|
|
|
|
|
|
|
|
|
|
|||||||||||||||||
The accompanying notes are an integral part of these consolidated financial statements.
51
Table of Contents
CHINDEX INTERNATIONAL, INC.
NOTES TO CONSOLIDATED FINANCIAL STATEMENTS
December 31, 2011
1. SUMMARY OF SIGNIFICANT ACCOUNTING POLICIES
Chindex International, Inc. (“Chindex” or “the Company”), is a Delaware corporation, operating in several healthcare markets in China. Revenues are generated from the provision of healthcare services and in prior years, from the sale of medical equipment, instrumentation and products. Until December 31, 2010, the Company operated in two business segments: the Medical Product Division and the Healthcare Services Division. The Company operates hospitals and clinics in Beijing, Shanghai, Tianjin and Guangzhou. These hospitals and clinics generally transact business in Chinese Renminbi.
The Company formerly operated a Medical Products division, which marketed, distributed and sold select medical capital equipment, instrumentation and other medical products for use in hospitals in China and Hong Kong on the basis of both exclusive and non-exclusive agreements with the manufacturers of these products. Sales and purchases were made in a variety of currencies including U.S. dollars, Euros and Chinese Renminbi. On December 31, 2010, the Medical Products division was contributed to Chindex Medical Limited (CML), a newly formed Hong Kong joint venture, in which the Company received a 49% ownership interest for its contribution (see Note 4). Shanghai Fosun Pharmaceutical (Group) Co., Ltd. (“FosunPharma”) received a 51% interest in CML for its contribution of certain medical device and other businesses. Upon its contribution of the Medical Products division, the Company deconsolidated the business of that division. The investment in CML is recorded using the equity method of accounting, effective December 31, 2010, with Chindex’s 49% interest in the equity in the earnings of CML beginning January 1, 2011.
Change in fiscal yearend
On September 27, 2010, the Board of Directors approved the change of the Company’s fiscal yearend from March 31 to December 31 each year, commencing with December 31, 2010.
Due to the change of the Company’s fiscal yearend from March 31 to December 31 each year, commencing with December 31, 2010, as discussed below, the Company has included for comparative purposes unaudited consolidated financial statements for the nine months ended December 31, 2009. These unaudited consolidated financial statements have been prepared in accordance with accounting principles generally accepted in United States for interim financial information and with Article 10 of Regulation S-X. Accordingly, they do not include all of the information and footnotes required by accounting principles generally accepted in the United States for complete financial statements. In the opinion of management, all adjustments (consisting of normal recurring accruals) considered necessary for a fair presentation have been included.
Policies and procedures
Consolidation
The consolidated financial statements include the accounts of the Company, its subsidiaries in which the Company has greater than 50 percent ownership, and variable interest entities in which the Company has controlling financial interest. All inter-company balances and transactions are eliminated in consolidation. Entities in which the Company has less than 50 percent ownership or does not have a controlling financial interest but is considered to have significant influence are accounted for on the equity method. As of December 31, 2010, the Medical Products division was deconsolidated upon formation of CML, as the Company does not have a controlling financial interest in CML.
52
Table of Contents
Revenue Recognition
All revenue in the Healthcare Services division is from providing healthcare services and substantially all revenue in the Medical Products division was from the sale of products. (See Note 15 for further information on sales, gross profit by division, and income (loss) from operations before foreign exchange.)
Revenue related to services provided by the Healthcare Services division is net of contractual adjustments or discounts and is recognized in the period services are provided. The Healthcare Services division makes an estimate at the end of the month for certain inpatients that have not completed service. This estimate reflects only the cost of care up to the end of the month.
In the Healthcare Services division, our revenue is dependent on seasonal fluctuations related to epidemiology factors and the life styles of the expatriate community. In the Medical Products division, sales of capital equipment often required protracted sales efforts, long lead times, financing arrangements and other time-consuming steps. As a result of these factors impacting the timing of revenues, our operating results have varied and are expected to continue to vary from period to period and year to year.
In prior years, revenue related to the sale of medical equipment, instrumentation and products to customers in China by our former Medical Products division was recognized upon product shipment. Revenue from sales to customers in Hong Kong was recognized upon delivery. We provided installation, warranty, and training services for certain of our capital equipment and instrumentation sales. These services were viewed as perfunctory to the overall arrangement and were not accounted for separately from the equipment sale. Costs associated with installation, training and standard warranty were not significant and were recognized in cost of sales as they were incurred, while costs associated with non-standard warranties were accrued. Revenue from the separate sale of extended warranties was deferred and recognized over the warranty period. Sales involving multiple elements were analyzed and recognized under the guidelines of Staff Accounting Bulletin (SAB) No. 104, “Revenue Recognition” and ASC 605-25. From time to time, the Company supplied products and services to its customers which are delivered over time. Additionally, the Company evaluated revenue from the sale of equipment in accordance with the provisions of ASC 605-45 to determine whether such revenue should be recognized on a gross or a net basis. All of the factors in ASC 605-45 were considered with the primary factor being that the Company assumed credit and inventory risk and therefore recorded the gross amount of all sales as revenue.
Accounts Receivable
Accounts receivable are customer obligations due under normal trade terms. Subsequent to the deconsolidation of the Medical Products division, accounts receivable consists of patient obligations for healthcare services. Accounts receivable are reviewed on a quarterly basis to determine if any receivables will potentially be uncollectible based on the aging of the receivable and historical cash collections. Any accounts receivable balances that are determined to be uncollectible, along with a percentage allowance for each aging category of receivables are included in the overall allowance for doubtful accounts. After all attempts to collect a receivable have failed, the receivable is written off against the allowance. Management believes that the allowance for doubtful accounts as of December 31, 2011 and 2010 is adequate; however, actual write-offs might exceed the recorded allowance.
Inventories
Inventory items held by the Company are purchased to fill hospital operating requirements and are stated at the lower of cost or net realizable value using the average cost method.
53
Table of Contents
Inventory held by the former Medical Products division consisted of items that were purchased to fill executed sales contracts, items that were stocked for future sales, including sales demonstration units and service parts. These items were valued on the specific identification method or average cost basis. Inventory valuation was reviewed on a quarterly basis and adjustments were charged to the provision for inventory, which was a component of our product sales costs.
Property and Equipment
Property and equipment are stated at historical cost. The costs of additions and improvements are capitalized, while maintenance and repairs are charged to expense as incurred. Depreciation is computed on the straight line method over the estimated useful lives of the related assets. Useful lives for medical equipment deployed for clinical use in our hospitals is 10 years. Useful lives for office equipment, vehicles and furniture and fixtures range from 5 to 7 years. Leasehold improvements are amortized on the straight-line method over the shorter of the estimated useful lives of the improvements or the lease term.
The Company assesses the impairment of long-lived assets when indicators of impairment are identified. The Company records impairment charges based upon the difference between the fair value and carrying value of the original asset when undiscounted cash flows indicate the carrying value will not be recovered. No impairment losses have been recorded in the accompanying consolidated statements of operations.
Income Taxes
The Company’s provision for income taxes is computed for each entity in the consolidated group at applicable statutory rates based upon each entity’s income or loss, giving effect to temporary and permanent differences. The Company’s U.S. and foreign subsidiaries file separate income tax returns on a December 31 fiscal year.
In accordance with ASC 740, provisions for income taxes are based upon earnings reported for financial statement purposes and may differ from amounts currently payable or receivable because certain amounts may be recognized for financial reporting purposes in different periods than they are for income tax purposes. Deferred income taxes result from temporary differences between the financial statement amounts of assets and liabilities and their respective tax bases. A valuation allowance reduces the net deferred tax assets when it is more likely than not that some portion or all of the deferred tax assets will not be realized. The Company recognizes, in its consolidated financial statements, the impact of a tax position if that position is not more likely than not to be sustained upon examination, based on the technical merits of the position. It is our policy to recognize interest and penalties related to income tax matters in income tax expense.
Cash Equivalents and Restricted Cash
The Company considers unrestricted cash on hand, deposits in banks, certificates of deposit, money market funds and short-term marketable securities with an original or remaining maturity at the date of acquisition of three months or less to be cash and cash equivalents. Restricted cash is composed of sinking fund deposits related to the IFC RMB loan and deposits collateralizing performance bonds (see Note 7).
Earnings Per Share
The Company follows ASC 260 whereby basic earnings per share excludes any dilutive effects of options, warrants and convertible securities and diluted earnings per share includes such effects. The Company does not include the effects of stock options, restricted stock, warrants and convertible securities when the effects would be antidilutive.
54
Table of Contents
Stock-Based Compensation
ASC 718 requires that stock options and other share-based payments made to employees be accounted for as compensation expense and recorded at fair value. Under this Topic, companies are required to estimate the fair value of share-based payment awards on the date of the grant. The value of the portion of the award that is ultimately expected to vest is recognized as expense ratably over the requisite service periods in the Company’s consolidated statements of operations.
The Company generally grants stock options that vest over a three to four year period to senior, long-term employees. Option awards are granted with an exercise price equal to the market price of the Company’s stock on the date of grant. Stock options have up to 10-year contractual terms.
Options issued by the Company have grant-date fair values calculated using the Black-Scholes options pricing model. To calculate fair market value, this model utilizes certain information, such as the interest rate on a risk-free security maturing generally at the same time as the expected life of the option being valued and the exercise price of the option being valued. It also requires certain assumptions, such as the expected amount of time the option will be outstanding until it is exercised or it expires and the expected volatility of the Company’s common stock over the expected life of the option.
The assumptions used to determine the value of the options at the grant date for options granted as of December 31, 2011, December 31, 2010 and March 31, 2010 were:
| December 31, 2011 | December 31, 2010 | March 31, 2010 | ||||
| Volatility |
70% | 70% | 75.00% - 76.80% | |||
| Dividend yield |
0.00% | 0.00% | 0.00% | |||
| Risk-free interest rate |
2.0% | 1.44% | 2.70% | |||
| Expected average life |
7.0 years | 5.0 years | 6.0 years |
Expected volatility is calculated based on the historical volatility of the Company’s common stock over the period which is approximately equal to the expected life of the options being valued. The dividend yield of zero is based on the fact that the Company has never paid cash dividends and has no present intention to pay cash dividends. The risk-free interest rate is derived from the yield of a U.S. Treasury Strip with a maturity date which corresponds with the expected life of the options being valued. The expected average life is based on the Company’s historical share option exercise experience along with the contractual term of the options being valued.
Based on historical experience, the Company has assumed a forfeiture rate of 0% for executive management and 10% for all other employees as of December 31, 2011 and 2010. In the prior years, the Company used a blended forfeiture rate of 6% for the entire employee population receiving equity awards The Company will record additional expense if the actual forfeitures are lower than estimated and will record a recovery of prior expense if the actual forfeitures are higher than estimated.
Debt Issuance Costs
Debt issuance costs incurred are capitalized and amortized based on the life of the debt obligations from which they arose, using the effective interest method. The amortization of these costs is included in interest expense in the consolidated statements of operations.
55
Table of Contents
Foreign Currencies
Financial statements of the Company’s foreign subsidiaries are translated from the functional currency, generally the local currency, to U.S. dollars. Assets and liabilities are translated at the exchange rates on the balance sheet date. Results of operations are translated at average exchange rates. Accumulated other comprehensive income in the accompanying consolidated statements of stockholders’ equity consists primarily of the resulting exchange difference.
Use of Estimates
The preparation of the consolidated financial statements in conformity with U.S. generally accepted accounting principles requires management to make estimates, judgments, and assumptions that affect the reported amounts of assets and liabilities and disclosure of contingent assets and liabilities at the date of the consolidated financial statements and the reported amounts of revenue and expenses during the reporting period. Because of the use of estimates inherent in the financial reporting process, actual results could differ from those estimates. Areas in which significant judgments and estimates are used include revenue recognition, receivable collectibility and deferred tax valuation allowances.
Recent Accounting Pronouncements
In June 2011, the Financial Accounting Standard Board (“FASB”) issued new accounting guidance related to the presentation of comprehensive income that increases comparability between U.S. GAAP and International Financial Reporting Standards. This guidance eliminates the current option to report other comprehensive income (OCI) and its components in the statement of changes in stockholders’ equity. This guidance is effective for the Company’s interim and annual periods beginning January 1, 2012. The Company intends to adopt this guidance during the first quarter of 2012.
Reclassifications
Certain balances in the 2009 and 2010 consolidated financial statements have been reclassified to conform to the 2011 presentation. The changes primarily relate to the statements of operations. Due to the deconsolidation of the Company’s previous Medical Products business, the captions in the statements of operations have been revised to reflect a presentation more common for companies in the hospital and healthcare services businesses.
2. INVESTMENTS
The following table summarizes the Company’s investments, including accrued interest, as of December 31, 2011 and December 31, 2010 (in thousands):
| December 31, 2011 |
December 31, 2010 |
|||||||
| Current investments: |
||||||||
| Certificates of deposit |
$ | 18,812 | $ | 34,037 | ||||
| U.S. Government Sponsored Enterprises |
1,575 | 500 | ||||||
| Corporate bonds |
6,007 | 3,094 | ||||||
|
|
|
|
|
|||||
| Total current investments |
$ | 26,394 | $ | 37,631 | ||||
|
|
|
|
|
|||||
| Noncurrent investments: |
||||||||
| Corporate bonds |
$ | 100 | 2,439 | |||||
|
|
|
|
|
|||||
| Total noncurrent investments |
$ | 100 | $ | 2,439 | ||||
|
|
|
|
|
|||||
56
Table of Contents
The Company’s current investments as of December 31, 2011 include $18,812,000 of Certificates of Deposit, with fixed interest rate of 0.55% issued by HSBC, a large international financial institution. The Company’s investments in Certificates of Deposit are intended to be held to maturity. Other than Certificates of Deposit, the Company’s current investments also include available-for-sale securities at fair value, which approximates cost, of $1,575,000 issued by U.S. Government-sponsored enterprises and corporate bonds of $6,007,000, which mature within the next twelve months. The Company’s current investments are recorded at fair value, and the difference between fair value and amortized cost as of December 31, 2011 was de minimis. The Company’s noncurrent investments of $100,000 as of December 31, 2011, consist of corporate bonds which mature in 38 months.
The Company’s current investments as of December 31, 2010 include $34,037,000 of Certificates of Deposit, with fixed interest rates between 0.05% and 2.25% issued by HSBC, a large international financial institution, and by large financial institutions in China. The Company’s investments in Certificates of Deposit are intended to be held to maturity. Other than Certificates of Deposit, the Company’s current investments also include available-for-sale securities at fair value, which approximates cost, of $500,000 issued by U.S. Government-sponsored enterprises and corporate bonds of $3,094,000, which mature within one year from the period ended December 31, 2010. The Company’s current investments are recorded at fair value, and the difference between fair value and amortized cost as of December 31, 2010 was de minimis. The Company’s noncurrent investments of $2,439,000 as of December 31, 2010, consist of corporate bonds which mature in 13 to 21 months.
3. INVENTORIES, NET
Inventories consist of medical supplies and pharmaceuticals in the amounts of $2,307,000 at December 31, 2011 and $1,413,000 at December 31, 2010.
4. INVESTMENT IN UNCONSOLIDATED AFFILIATE
Background – Chindex Medical Limited
On December 31, 2010, Chindex International and FosunPharma, a leading manufacturer and distributor of Western and Chinese medicine and devices in China, completed the first closing (the “Initial Closing”) of the formation of CML to independently operate certain combined medical device businesses, including Chindex’s Medical Products division. The formation of CML represents a basis of the strategic alliance between the two companies, which aims to capitalize on the long-term opportunity presented by medical product sectors in China. CML is focused on marketing, distributing, selling and servicing medical devices in China, including in Hong Kong, as well as activities in R&D and manufacturing of medical devices for the Chinese and export markets. CML is owned 51% by FosunPharma and 49% by Chindex.
Upon the Initial Closing, CML became the owner of the Company’s former Medical Products division. On June 24, 2011, CML became the holder of legal title to the FosunPharma-contributed businesses. Notwithstanding this transfer, the registration with and approval of Shanghai Administration of Foreign Exchange (SAFE) was required in order for CML to exercise certain of the rights and benefits as shareholder of such businesses, but CML was entitled to such benefits on a contractual basis under an entrusted management agreement. The registration with and approval of SAFE was received on March 7, 2012.
57
Table of Contents
Deconsolidation
FosunPharma has a controlling financial interest in CML. The Company was required to deconsolidate the contributed businesses when it ceased to have a controlling financial interest in the applicable subsidiaries. As explained below, the Company concluded that CML is a voting interest entity, rather than a variable interest entity. Therefore, the reduction of the Company’s interest to 49% indicated that it no longer had a controlling financial interest and needed to deconsolidate under ASC 810. Accordingly, Chindex deconsolidated its MPD from its consolidated balance sheet, effective December 31, 2010.
Variable Interest Entity Analysis
ASC 810-10-20 defines a variable interest as an investment or other interest that will absorb portions of a variable interest entity’s (“VIE’s”) expected losses or receive portions of the entity’s expected residual returns. An equity interest is considered to be a variable interest in a company and as such, the Company’s interest in CML is a variable interest. A holder of a variable interest in an entity is required to determine whether the entity is a VIE and, if so, whether it must consolidate the entity.
In its VIE analysis, the Company considered the five characteristics of a VIE described in ASC 810-10-15-14. Management evaluated the characteristics of its investment in CML and believes that CML would not be deemed a VIE. Management concluded that FosunPharma effectively contributed its businesses to CML as of the formation date since the entrusted management agreement (the “Entrustment Agreement”) entered into by a subsidiary of CML, FosunPharma and a subsidiary of FosunPharma provides CML with unilateral control over Shanghai Chuangxin (as defined in the Entrustment Agreement). Although the legal form of the transaction is that FosunPharma initially delivered a promissory note in exchange for its interest in CML, Management notes that this was required solely due to a timing delay in receiving regulatory approvals. The substance of the arrangement is that FosunPharma has irrevocably arranged the contribution of Shanghai Chuangxin in exchange for its equity interest in CML particularly because the probability of governmental approvals was high (and in fact has already been obtained). Accordingly, Management believes that FosunPharma’s investment would be deemed equity at risk and that the combined equity of CML would be sufficient to permit the entity to finance its activities without additional subordinated financial support. It should be noted that CML has been financed 100% with equity and does not have any other forms of subordinated financial support, which justifies the position that the amount of equity is sufficient to conduct operations.
Management also considered certain characteristics related to control and expected economics of CML to support the conclusion that CML is not a VIE. The Company and FosunPharma control CML, as they have the ability to elect all of the members of the Board of Directors of CML, and there are no other interests that provide its holders with participating rights over the activities that most significantly impact CML’s economic performance. Accordingly, the group of holders of the equity investment at risk has the power to direct the activities of CML that most significantly impact CML’s economic performance. Additionally, Management concluded that, pursuant to the agreements entered into in connection with the formation of CML, the voting rights held by both FosunPharma and the Company are proportional to their economic interests in CML. Management further noted that FosunPharma and the Company have both the obligation to absorb the losses and the right to receive the expected residual returns of CML as there are no other interests that either protect them from absorbing expected losses or cap their residual returns. Therefore, Management has concluded the entity is not a VIE and must be assessed under the voting interest model.
It is generally understood that when a company owns less than 50% of an entity that is not considered a VIE, the company is precluded from consolidating its investee. Specifically, ASC 810-10-25-1 states that the usual condition for a controlling financial interest is ownership of a majority voting interest. Since the Company owns 49% of CML (whereas a single entity, FosunPharma, owns 51%), and does not have control over the entity through the Board of Directors (whereas FosunPharma has the power to appoint
58
Table of Contents
a majority of such Board of Directors), the Company should not consolidate CML. Conversely, FosunPharma obtained control through its majority stock ownership and Board of Directors representation upon the Initial Closing. Therefore, the Company’s investment in CML is accounted for as an equity method investment.
Summarized Financial Information for CML
Beginning with the commencement of CML operations on January 1, 2011, Chindex follows the equity method of accounting to recognize its 49% interest in the net assets and the net earnings of CML on an on-going basis. Summarized financial information for the unconsolidated CML affiliate for which the equity method of accounting is used is presented below on a 100 percent basis. The assets and liabilities of CML as of December 31, 2011 and December 31, 2010 as follows (in thousands):
| December 31, 2011 |
December 31, 2010 |
|||||||
| Current assets |
$ | 104,726 | $ | 99,697 | ||||
| Noncurrent assets |
18,261 | 17,071 | ||||||
|
|
|
|
|
|||||
| Total assets |
$ | 122,987 | $ | 116,768 | ||||
|
|
|
|
|
|||||
| Current liabilities |
$ | 59,941 | $ | 53,396 | ||||
| Noncurrent liabilities |
1,539 | 1,799 | ||||||
|
|
|
|
|
|||||
| Total liabilities |
61,480 | 55,195 | ||||||
| Stockholders’ equity |
61,507 | 61,573 | ||||||
|
|
|
|
|
|||||
| Total liabilities and stockholders’ equity |
$ | 122,987 | $ | 116,768 | ||||
|
|
|
|
|
|||||
The operating results of CML in 2011 were as follows (in thousands):
| Year ended December 31, 2011 |
||||
| Revenue |
$ | 126,778 | ||
| Income before income taxes |
4,947 | |||
| Net income |
3,353 | |||
CML is a 51%-owned subsidiary of FosunPharma. The assets, liabilities and stockholders’ equity in the summarized financial data table presented above for CML have been prepared on a stand-alone basis, with the assets and liabilities of the entities contributed to CML by FosunPharma reported on a historical cost basis, while the assets and liabilities acquired from Chindex have been recorded on a fair value basis. In reporting its 49% interest in the net assets and net earnings of CML using the equity method of accounting, Chindex includes its 49% interest in the stand-alone financial statements of CML, and also records adjustments to reflect the amortization of basis differences attributable to the fair values in excess of net book values of identified tangible and intangible assets contributed by FosunPharma to CML at its formation date. In addition, certain employees of CML participate in Chindex stock-based compensation programs. The expense for these stock options or restricted stock is recognized by CML as the services are provided. The total stock-based compensation expense recognized by CML in year ended December 31, 2011 was $1,224,000.
For the year ended December 31, 2011, Chindex recognized income of $1,121,000, for its 49% equity in the operating results of CML. This consisted of income of $1,636,000, respectively, for the stand-alone net income of CML (after recognition of stock-based compensation expense) and after deducting $515,000, for the amortization of basis differences attributable to acquired intangibles.
59
Table of Contents
As of December 31, 2011 and 2010, Chindex had a receivable from CML entities of $10,984,000 and $9,330,000, primarily related to advance payments for procurement of medical equipment supplied under logistics service agreement whereby CML serves as an agent for Chindex. As of December 31, 2011 and 2010, Chindex had a payable to CML entities of $9,404,000 and $0, respectively, which represented the actual purchases of medical equipment by CML on behalf of Chindex under the logistics service agreement. It is expected that the medical equipment will be purchased within one year.
Services Agreement
CML and Chindex International, Inc. entered into a services agreement, effective on January 1, 2011. Under the services agreement, Chindex provides advice and support services as requested by CML. The services include management and administrative support services for marketing, sales and order fulfillment activities conducted in the United States and China, order processing and exporting of goods sold to customers in China, advice relating to the marketing of products sold in China by CML, analysis of sales opportunities and other assistance including services such as payroll, database administration, internal auditing, accounting and finance that will assist CML in carrying out its activities in the United States and China. For the year ended December 31, 2011, total services recognized by CML were $3.5 million in addition to stock-based compensation.
5. PROPERTY AND EQUIPMENT, NET
(in thousands)
| December 31, 2011 |
December 31, 2010 |
|||||||
| Property and equipment, net consists of the following: |
||||||||
| Furniture and equipment |
$ | 25,376 | $ | 17,592 | ||||
| Vehicles |
240 | 170 | ||||||
| Construction in progress |
21,463 | 12,224 | ||||||
| Leasehold improvements |
34,566 | 17,988 | ||||||
|
|
|
|
|
|||||
| 81,645 | 47,974 | |||||||
| Less: accumulated depreciation and amortization |
(16,180 | ) | (10,875 | ) | ||||
|
|
|
|
|
|||||
| $ | 65,465 | $ | 37,099 | |||||
|
|
|
|
|
|||||
60
Table of Contents
Construction in progress relates to the development of the United Family Healthcare network of private hospitals and health clinics in China, including facilities and systems development. Construction costs incurred during the year ended December 31, 2011 primarily related to the expansion of the Company’s existing Beijing hospital campus and construction of the women and children’s hospital in Tianjin. Capitalized interest on construction in progress was $565,000 and $140,000 during the year ended December 31, 2011 and nine months ended December 31, 2010, respectively. Capitalized interest was $35,000 in the year ended March 31, 2010. The effective interest rate, based on the Company’s actual total borrowings, was 4.1% in 2011 and 4.0% in 2010. Depreciation and amortization expense for property and equipment for the year ended December 31, 2011 was $5,145,000 and was $3,004,000 for the nine months ended December 31, 2010, which included $127,000 related to the former Medical Products business, and $4,092,000 for the year ended March 31, 2010.
6. ACCRUED EXPENSES AND OTHER CURRENT LIABILITIES
(in thousands)
| December 31, 2011 |
December 31, 2010 |
|||||||
| Accrued expenses: |
||||||||
| Accrued expenses- rent |
$ | 3,775 | $ | 2,571 | ||||
| Accrued compensation |
6,056 | 3,531 | ||||||
| Accrued expenses- other |
1,904 | 2,439 | ||||||
|
|
|
|
|
|||||
| $ | 11,735 | $ | 8,541 | |||||
|
|
|
|
|
|||||
| Other current liabilities: |
||||||||
| Accrued other taxes payable- non-income |
$ | 717 | $ | 698 | ||||
| Customer deposits |
3,117 | 2,609 | ||||||
| Other current liabilities |
1,715 | 567 | ||||||
|
|
|
|
|
|||||
| $ | 5,549 | $ | 3,874 | |||||
|
|
|
|
|
|||||
7. DEBT
The Company’s short-term and long-term debt balances are (in thousands):
| December 31, 2011 | December 31, 2010 | |||||||||||||||
| Short term |
Long term |
Short term |
Long term |
|||||||||||||
| Long term loan |
$ | — | $ | 10,297 | $ | — | $ | 9,797 | ||||||||
| Convertible notes, net of debt discount |
— | 13,521 | — | 13,273 | ||||||||||||
|
|
|
|
|
|
|
|
|
|||||||||
| $ | — | $ | 23,818 | $ | — | $ | 23,070 | |||||||||
|
|
|
|
|
|
|
|
|
|||||||||
Long term loan- IFC 2005
In October 2005, Beijing United Family Hospital (BJU) and Shanghai United Family Hospital (SHU), majority-owned subsidiaries of the Company, obtained long-term debt financing under a program with the International Finance Corporation (IFC) (a division of the World Bank) for 64,880,000 Chinese Renminbi (approximately $8,000,000) (the “IFC 2005 RMB Loan”). The term of the loan is 10 years at an initial interest rate of 6.73% with the borrowers required to make annual payments into a sinking fund
61
Table of Contents
beginning with the first payment in September 2010. Deposits into the sinking fund will accumulate until a lump sum payment is made at maturity of the debt in October 2015. The interest rate will be reduced to 4.23% for any amount of the outstanding loan on deposit in the sinking fund. The loan program also includes certain other covenants which require the borrowers to achieve and maintain specified liquidity and coverage ratios in order to conduct certain business transactions such as pay intercompany management fees or incur additional indebtedness. Chindex International, Inc. guaranteed repayment of this loan. In terms of security, IFC has, among other things, a lien over the equipment owned by the borrowers and over their bank accounts. In addition, IFC has a lien over Chindex bank accounts not already pledged, but not over other Chindex assets. As of December 31, 2011, the outstanding balance of this debt was 64,880,000 Chinese Renminbi (current translated value of $10,297,000, see “Foreign Currency Exchange and Impact of Inflation”) classified as long-term. As the scheduled annual deposits into the sinking fund do not extinguish a portion of the long-term debt liability, the entire loan is expected to be classified as long-term until a financial reporting date that is less than one year from final maturity. The balance sheet classification of the sinking fund assets is similarly noncurrent, until a date that is less than one year from the lump sum payment. As of December 31, 2011, sinking fund assets of 6,488,000 Chinese Renminbi (current translated value of $1,030,000) were included in Restricted Cash and Sinking Funds on the Company’s consolidated balance sheets.
The Company is currently in discussions with IFC to revise the terms of the IFC 2005 RMB Loan, which is necessary in order to incorporate the effects of the expansion of the Beijing hospital campus on the collateral and loan covenant provisions. The Company expects the revised terms will provide for (1) advance funding by the Company of the full principal and interest amounts into a pledged bank account or the purchase of certificates of deposit having a face amount equal to the full principal and interest amount and subsequent pledge of such certificates of deposit to the IFC, and (2) revised loan covenants which will reflect the positive impact of the advance funding on IFC’s collateral and overall loan security. In connection with the finalization of the pledge documentation and the restated loan agreement, IFC issued a notice on March 8, 2012 which extended the existing waiver until the earlier of (1) the effective date of the restatement agreement and (2) June 30, 2012.
Convertible Notes- JPM
On November 7, 2007, the Company entered into a securities purchase agreement with Magenta Magic Limited, a wholly owned subsidiary of J.P. Morgan Chase & Co organized under the laws of the British Virgin Islands (JPM), pursuant to which the Company agreed to issue and sell to JPM: (i) 538,793 shares (the “Tranche A Shares”) of the Company’s common stock; (ii) the Company’s Tranche B Convertible Notes due 2017 in the aggregate principal amount of $25 million (the “Tranche B Notes”) and (iii) the Company’s Tranche C Convertible Notes due 2017 in the aggregate principal amount of $15 million (the “Tranche C Notes” and, with the Tranche B Notes, the “Notes”) at a price of $18.56 per Tranche A Share (for an aggregate price of $10 million for the Tranche A Shares) and at face amount for the Notes for a total purchase price of $50 million in gross proceeds (the “JPM Financing”).
The Tranche B Notes had a ten-year maturity, bore no interest of any kind and provided for conversion into shares of the Company’s common stock at an initial conversion price of $18.56 per share at any time and automatic conversion upon the Company entering into one or more newly committed financing facilities (the “Facilities”) making available to the Company at least $50 million, pursuant to which Facilities all conditions precedent (with certain exceptions) for initial disbursement had been satisfied, subject to compliance with certain JPM Financing provisions. The Facilities as required for conversion of the Tranche B Note had to have a minimum final maturity of 9.25 years from the date of initial drawdown, a minimum moratorium on principal repayment of three years from such date, principal payments in equal or stepped up amounts no more frequently than twice in each 12-month period, no sinking fund obligations, other covenants and conditions included in the Investor Rights Agreement, which expires on November 6, 2012, and also limit the purchase price of any equity issued under the Facilities to at least equal to the initial conversion price of the Notes or higher amounts depending on the date of issuance thereof. In January 2008, the Tranche B Notes were converted into 1,346,984 shares of our common stock.
62
Table of Contents
The Tranche C Notes have a ten-year maturity, bear no interest of any kind and are convertible at the same conversion price as the Tranche B Notes at any time and will be automatically converted upon the completion of two proposed new and/or expanded hospitals in China in Beijing and Guangzhou (the “JV Hospitals”), subject to compliance with certain JPM Financing provisions. Notwithstanding the foregoing, the Notes would be automatically converted after the earlier of 12 months having elapsed following commencement of operations at either of the JV Hospitals or either of the JV Hospitals achieving break-even earnings before interest, taxes, depreciation and amortization for any 12-month period ending on the last day of a fiscal quarter, subject to compliance with certain JPM Financing provisions.
The JPM Financing was completed in two closings. At the first closing, which took place on November 13, 2007, the Company issued (i) the Tranche A Shares, (ii) the Tranche B Notes and (iii) an initial portion of the Tranche C Notes in the aggregate principal amount of $6 million, with the closing of the balance of the Tranche C Notes in the aggregate principal amount of $9 million subject to, among other things, the approval of the Company’s stockholders. At the second closing, which took place on January 11, 2008, following such stockholder approval, the Company issued such balance of the Tranche C Notes.
In connection with the issuance of the Notes, the Company incurred issuance costs of $314,000, which primarily consisted of legal and other professional fees. Of these costs, $61,000 is attributable to the Tranche A shares, $159,000 is attributable to Tranche B Notes which converted in January 2008 and the remaining of $94,000 is attributable to the Tranche C Notes and has been capitalized to be amortized over the life of the Notes. As of December 31, 2011 and December 31, 2010, the unamortized financing cost was $54,000 and $64,000, respectively, and is included in Other Assets in the consolidated balance sheets.
The Company accounts for convertible debt in accordance with ASC 470-20. Accordingly, the Company recorded, as a discount to convertible debt, the intrinsic value of the conversion option based upon the differences between the fair value of the underlying common stock at the commitment date and the effective conversion price embedded in the note. Debt discounts under these arrangements are usually amortized over the term of the related debt to their stated date of redemption. So, in respect to the Notes, this debt discount would be amortized through interest expense over the 10 year term of the Notes unless earlier converted or repaid. In fiscal 2008, under this method, the Company recorded (i) a discount on the Tranche B Notes of $2,793,000 against the entire principal amount of the Notes; and (ii) a discount on the Tranche C Notes of $2,474,000 against the entire principal amount of the Notes.
The debt discount pursuant to the Notes as of December 31, 2011 and December 31, 2010 was $1,479,000 and $1,727,000, respectively. Amortization of the discount was approximately $248,000 for the year ended December 31, 2011, $185,000 for the nine months ended December 31, 2010, and $257,000 for the year ended March 31, 2010, respectively.
Loan Facilities - 2007 and 2008
In 2007 and 2008, we entered into two US Dollar loan facilities in the amount of $25 million and $20 million with International Finance Corporation (IFC) and DEG-Deutsche Investitions und Entwicklungsgesellschaft (DEG), respectively, for the financing of expansion projects in China. The conditions to disbursement to these loan facilities have never been met and may never be met and the applicable lender has a right to terminate its commitment, with DEG having notified us of such effective termination. In order to draw under the IFC facility, we would have to amend the terms of that facility with respect to project scope, formation of joint venture entities (such entities have yet to be approved to construct, equip and operate their respective new Joint Venture Hospitals), collateral package, timing of disbursements (and extension of deadlines which have already passed) and other related provisions. However, we experienced delays in the development timeline and certain changes in project scope for the
63
Table of Contents
proposed healthcare facilities was necessary because of fluctuations and uncertainties in the real estate markets in China resulting from the global economic downturn and, as a result, the process to formally approve the two joint ventures has taken longer than originally anticipated. In July 2010, however, we received formal approval of the new joint venture for the Beijing expansion project from the Chinese authorities and are currently in discussions with IFC to amend its loan facility in order to draw thereunder. There can be no assurances that we will be able to amend the IFC facility on terms acceptable to us and IFC, which failure, absent an alternative source of financing, could have a material adverse effect on our operations and our ability to complete our proposed expansion projects on time or at all.
The obligations of any borrower under the IFC facility would be guaranteed by the Company pursuant to a guarantee agreement with IFC, would be secured by a pledge by the Company of its equity interests in the borrowers pursuant to a share pledge agreement by the Company with IFC and would be secured pursuant to a mortgage agreement between the borrowers and IFC.
The IFC facility contains customary financial covenants, including maintenance of a maximum ratio of liabilities to tangible net worth and a minimum debt service coverage ratio, and covenants that, among other things, place limits on the Company’s ability to incur debt, create liens, make investments and acquisitions, sell assets, pay dividends, prepay subordinated debt, merge with other entities, engage in transactions with affiliates, and make capital expenditures. The IFC Facility also contains customary events of default. As of December 31, 2011, the Company was in compliance with the loan covenants as amended.
In connection with the issuance of the IFC Facility and the DEG Facility, the Company incurred issuance costs of $1,019,000, which primarily consisted of legal and other professional fees. These issuance costs have been capitalized and were intended to be amortized over the life of the debt. However, due the expiration of the DEG facility, the issuance cost related to DEG of $260,000 was expensed as interest expense in 2011. As of December 31, 2011 and December 31, 2010, the balance of the unamortized financing costs was $759,000 and $1,019,000 and is included in other assets in the consolidated balance sheets.
Debt Payments Schedule and Restricted Cash
The following table sets forth the Company’s debt obligations and sinking fund requirements as of December 31, 2011:
(in thousands)
| Total | 2012 | 2013 | 2014 | 2015 | 2016 | Thereafter | ||||||||||||||||||||||
| Long term loan less sinking fund deposits |
$ | 9,267 | $ | 3,090 | $ | 2,059 | $ | 2,059 | $ | 2,059 | $ | — | $ | — | ||||||||||||||
| Convertible notes |
15,000 | — | — | — | — | — | 15,000 | |||||||||||||||||||||
|
|
|
|
|
|
|
|
|
|
|
|
|
|
|
|||||||||||||||
| Total |
$ | 24,267 | $ | 3,090 | $ | 2,059 | $ | 2,059 | $ | 2,059 | $ | — | $ | 15,000 | ||||||||||||||
|
|
|
|
|
|
|
|
|
|
|
|
|
|
|
|||||||||||||||
Restricted cash was $1,030,000 as of December 31, 2011 for the sinking fund deposits related to the IFC Loans. Restricted cash of $1,280,000 as of December 31, 2010, consisted of $980,000 for the sinking fund deposits related to the IFC Loans and $300,000 for a performance bond.
64
Table of Contents
8. STOCKHOLDERS’ EQUITY
Common Stock
The Class B common stock and the common stock are substantially identical on a share-for-share basis, except that the holders of Class B common stock have six votes per share on each matter considered by stockholders and the holders of common stock have one vote per share on each matter considered by stockholders. Each share of Class B common stock will convert at any time at the option of the original holder thereof into one share of common stock and is automatically converted into one share of common stock upon (i) the death of the original holder thereof, or, if such stocks are subject to a stockholders agreement or voting trust granting the power to vote such shares to another original holder of Class B common stock, then upon the death of such original holder, or (ii) the sale or transfer to any person other than specified transferees.
Stock Option Plan
On September 1, 2004, the Company’s Board of Directors approved and on October 14, 2004, the Company’s shareholders approved the Company’s 2004 Incentive Stock Plan (2004 Plan). The 2004 Plan became effective upon the shareholders’ approval. The 2004 Plan provides for grants of: options to purchase common stock; restricted shares of common stock (which may be subject to both issuance and forfeiture conditions), which we refer to as restricted stock; deferred shares of common stock (which may be subject to the completion of a specified period of service and other issuance conditions), which we refer to as deferred stock; stock units (entitling the grantee to cash payments based on the value of the common stock on the date the payment is called for under the stock unit grant); and stock appreciation rights (entitling the grantee to receive the appreciation in value of the underlying common stock between the date of exercise and the date of grant), which are referred to as SARs. SARs may be either freestanding or granted in tandem with an option. Options to purchase the common stock may be either incentive stock options that are intended to satisfy the requirements of Section 422 of the Internal Revenue Code, or options that do not satisfy the requirements of Section 422 of the Code. Compensation costs for stock options and restricted stock are recognized ratably over the vesting period of the option or stock, which usually ranges from immediate to three years. All of the shares authorized under the 2004 Plan had been granted as of March 31, 2008.
On September 11, 2007, the Company adopted the 2007 Incentive Stock Plan (2007 Plan). The 2007 Plan provides for grants of: options to purchase common stock, restricted shares of common stock, deferred shares of common stock, stock units, and stock appreciation rights. Compensation costs for stock options and restricted stock are recognized ratably over the vesting period of the option or stock, which usually ranges from immediate to four years.
Compensation costs related to equity compensation, including stock options and restricted stock, for the year ended December 31, 2011, nine months ended December 31, 2010 and the year ended March 31, 2010 were $3,177,000, $2,059,000 and $3,283,000, respectively. $3,177,000 and $2,059,000 are all included in healthcare services – salaries, wages and benefits on the consolidated statements of operations. Of the $3,283,000, $3,123,000 is included in healthcare services – salaries, wages and benefits on the consolidated statements of operations and $160,000 in product selling and other operating expenses on the consolidated statements of operations. No amounts relating to the share-based payments have been capitalized.
Employees
During the year ended December 31, 2011, the nine months ended December 31, 2010 and the year ended March 31, 2010, the total intrinsic value of stock options exercised was $285,000, $3,983,000 and $1,671,000, respectively. The actual cash received upon exercise of stock options was $175,000, $641,000 and $490,000, respectively. The unamortized fair value of the stock options as of December 31, 2011 was $829,000, the majority of which is expected to be expensed over the weighted-average period of 1.12 years.
65
Table of Contents
A summary of the status of the Company’s non-vested options as of December 31, 2011 and changes during the year is presented below:
| Number of Shares |
Weighted Average Grant- Date Fair Value |
|||||||
| Nonvested options outstanding, December 31, 2010 |
345,381 | $ | 9.02 | |||||
| Granted |
18,000 | 8.99 | ||||||
| Vested |
(227,104 | ) | 9.06 | |||||
| Canceled |
(7,247 | ) | 8.96 | |||||
|
|
|
|
|
|||||
| Nonvested options outstanding, December 31, 2011 |
129,030 | $ | 8.95 | |||||
|
|
|
|||||||
A summary of the status of the Company’s non-vested options as of December 31, 2010 and changes during the nine month period is presented below:
| Number of Shares |
Weighted Average Grant- Date Fair Value |
|||||||
| Nonvested options outstanding, March 31, 2010 |
658,121 | $ | 9.12 | |||||
| Granted |
18,000 | 8.64 | ||||||
| Vested |
(225,860 | ) | 9.07 | |||||
| Canceled |
(104,880 | ) | 9.47 | |||||
|
|
|
|
|
|||||
| Nonvested options outstanding, December 31, 2010 |
345,381 | $ | 9.02 | |||||
|
|
|
|||||||
A summary of the status of the Company’s non-vested options as of March 31, 2010 and changes during the twelve month period is presented below:
| Number of Shares |
Weighted Average Grant- Date Fair Value |
|||||||
| Nonvested options outstanding, March 31, 2009 |
762,934 | $ | 9.40 | |||||
| Granted |
223,150 | 8.89 | ||||||
| Vested |
(210,287 | ) | 9.19 | |||||
| Canceled |
(117,676 | ) | 10.34 | |||||
|
|
|
|
|
|||||
| Nonvested options outstanding, March 31, 2010 |
658,121 | $ | 9.12 | |||||
|
|
|
|||||||
66
Table of Contents
The table below summarizes activity relating to restricted stock for the year ended December 31, 2011:
| Number of shares underlying restricted stock |
Aggregate Intrinsic Value of Restricted Stock (in thousands) * |
|||||||
| Outstanding at December 31, 2010 |
412,774 | |||||||
| Granted |
321,898 | |||||||
| Vested |
(200,017 | ) | ||||||
| Forfeited |
(8,855 | ) | ||||||
|
|
|
|
|
|||||
| Outstanding at December 31, 2011 |
525,800 | $ | 4,480 | |||||
|
|
|
|||||||
| Expected to vest |
499,995 | $ | 4,260 | |||||
|
|
|
|||||||
The table below summarizes activity relating to restricted stock for the nine months ended December 31, 2010:
| Number of shares underlying restricted stock |
Aggregate Intrinsic Value of Restricted Stock (in thousands) * |
|||||||
| Outstanding as of March 31, 2010 |
142,896 | |||||||
| Granted |
338,415 | |||||||
| Vested |
(67,977 | ) | ||||||
| Forfeited |
(560 | ) | ||||||
|
|
|
|
|
|||||
| Outstanding as of December 31, 2010 |
412,774 | $ | 6,807 | |||||
|
|
|
|||||||
| Expected to vest |
397,056 | $ | 6,547 | |||||
|
|
|
|||||||
The table below summarizes activity relating to restricted stock for the year ended March 31, 2010:
| Number of shares underlying restricted stock |
Aggregate Intrinsic Value of Restricted Stock (in thousands) * |
|||||||
| Outstanding as of March 31, 2009 |
135,290 | |||||||
| Granted |
118,000 | |||||||
| Vested |
(97,225 | ) | ||||||
| Forfeited |
(13,169 | ) | ||||||
|
|
|
|
|
|||||
| Outstanding as of March 31, 2010 |
142,896 | $ | 1,688 | |||||
|
|
|
|||||||
| Expected to vest |
134,321 | $ | 1,586 | |||||
|
|
|
|||||||
The weighted average contractual term of the restricted stock, calculated based on the service-based term of each grant, is two years for 2011 and 2010, respectively. As of December 31, 2011 the unamortized fair value of the restricted stock was $6,375,000. This unamortized fair value will be recognized over weighted-average period of 3 years. Restricted stock is valued at the stock price on the date of grant.
67
Table of Contents
The following is a summary of stock option activity during the year ended December 31, 2011, the nine months ended December 31, 2010 and the year ended March 31, 2010:
| December 31, 2011 |
Weighted Average Exercise Price |
Aggregate Intrinsic Value (in thousands)* |
December 31, 2010 |
Weighted Average Exercise Price |
Aggregate Intrinsic Value (in thousands)* |
March 31, 2010 |
Weighted Average Exercise Price |
Aggregate Intrinsic Value (in thousands)* |
||||||||||||||||||||||||||||
| Options outstanding, beginning of year |
1,256,889 | $ | 10.03 | 1,715,286 | $ | 8.64 | 1,789,184 | $ | 8.10 | |||||||||||||||||||||||||||
| Granted |
18,000 | 14.22 | 18,000 | 14.85 | 223,150 | 13.20 | ||||||||||||||||||||||||||||||
| Exercised |
(53,525 | ) | 3.27 | (345,221 | ) | 1.86 | (172,247 | ) | 4.62 | |||||||||||||||||||||||||||
| Canceled |
(7,247 | ) | 13.19 | (131,176 | ) | 14.00 | (124,801 | ) | 14.56 | |||||||||||||||||||||||||||
| Expired |
(7,678 | ) | 13.22 | — | — | — | — | |||||||||||||||||||||||||||||
|
|
|
|
|
|
|
|
|
|
|
|
|
|||||||||||||||||||||||||
| Options outstanding, end of year |
1,206,439 | $ | 10.35 | $ | 1,522 | 1,256,889 | $ | 10.03 | $ | 8,360 | 1,715,286 | $ | 8.64 | $ | 7,124 | |||||||||||||||||||||
|
|
|
|
|
|
|
|||||||||||||||||||||||||||||||
| Weighted Average Remaining Contractual Term (Years) |
5.58 | 6.32 | 5.89 | |||||||||||||||||||||||||||||||||
| Options exercisable at end of year |
1,077,409 | $ | 9.96 | $ | 1,522 | 911,508 | $ | 8.81 | $ | 7,159 | 1,057,165 | $ | 5.80 | $ | 6,873 | |||||||||||||||||||||
|
|
|
|
|
|
|
|||||||||||||||||||||||||||||||
| Options exercisable at end of year and expected to be exercisable** |
1,193,536 | $ | 10.32 | $ | 1,522 | 1,237,315 | $ | 5.19 | $ | 6,679 | 1,675,799 | $ | 8.53 | $ | 7,109 | |||||||||||||||||||||
|
|
|
|
|
|
|
|||||||||||||||||||||||||||||||
| * | The aggregate intrinsic value on this table was calculated based on the positive difference between the closing market price of the Company’s common stock on December 31, 2011, December 31, 2010 and March 31, 2010 ($8.52, $16.49 and $11.81, respectively) and the exercise price of the underlying options. |
| ** | Options exercisable at December 31, 2011, December 31, 2010 and March 31, 2010, are expected to be exercisable include both vested options and non-vested options outstanding less our expected forfeiture rate. |
Nonemployees
On December 31, 2010, Chindex Medical Limited (CML) was formed (see Note 4). In connection with the transaction, certain employees of the Company that transferred to CML retained 101,239 stock options, of which 62,353 options were vested and 38,886 were nonvested stock options previously issued by the Company. Those employees continue to vest in their nonvested stock options as they provide services to CML commencing January 1, 2011, which are accounted for on a mark-market to basis. The cost of the options for nonemployees in 2011 was $311,000, which was charged to CML.
68
Table of Contents
Stock Purchase Agreement– FosunPharma
On June 14, 2010, the Company entered into a stock purchase agreement (the “Stock Purchase Agreement”) with Fosun Industrial Co., Limited (the “Investor”) and Shanghai Fosun Pharmaceutical (Group) Co., Ltd (the “Warrantor”). Pursuant to the Stock Purchase Agreement, the Company has agreed to issue and sell to Investor up to 1,990,447 shares of the Company’s common stock (representing approximately 10% of all outstanding common stock after such sale, based on the number of outstanding shares as of the date of the Stock Purchase Agreement) at a purchase price of $15 per share, for an aggregate purchase price of $30 million, the net proceeds of which are expected to be used, among other things, to continue expansion of the Company’s United Family Healthcare network.
The sale of the shares of common stock to Investor would be completed in two closings, each of which would relate to approximately one-half of the shares to be purchased and be subject to certain customary closing conditions, including that no material adverse change shall have occurred with respect to the Company. In addition, the second closing is subject to the consummation of the joint venture (the “Joint Venture”) between the parties to be comprised of the Company’s Medical Products division and certain of Investor’s medical device businesses in China. The initial closing occurred on August 27, 2010, with the Investor purchasing 933,022 shares of Chindex common stock at $15 per share, resulting in proceeds to Chindex, net of transaction costs, of $13,803,000. The second closing has not yet occurred.
At the initial closing under the Stock Purchase Agreement, the Company, Investor and FosunPharma entered into a stockholder agreement (the “Stockholder Agreement”). Under the Stockholder Agreement, until the first to occur of (i) Investor holds 5% or less of the outstanding shares of common stock, (ii) there shall have been a change of control of the Company as defined in the Stockholder Agreement, and (iii) the seventh anniversary of the initial closing, Investor has agreed to vote its shares in accordance with the recommendation of the Company’s Board of Directors on any matters submitted to a vote of the stockholders of the Company relating to the election of directors and compensation matters and with respect to certain proxy or consent solicitations. The Stockholder Agreement also contains standstill restrictions on Investor generally prohibiting the purchase of additional securities of the Company. The standstill restrictions terminate on the same basis as does the voting agreement above, except that the 5% standard would increase to 10% upon the second closing. In addition, the Stockholder Agreement contains an Investor lock-up restricting sales by Investor of its shares of the Company’s common stock for a period of five years following the date of the Stockholder Agreement, subject to certain exceptions.
Upon the second closing under the Stock Purchase Agreement, Investor will have the right to, among other things, nominate two representatives for election to the Company’s Board of Directors, which will be increased to nine members, and pledge its shares, subject to certain conditions. In order to induce Investor to enter into the proposed transaction and without any consideration therefore, each of the Company’s chief executive, operating and financial officers, in their capacities as stockholders of the Company, has agreed to certain limitations on his or her right to dispose of shares of the Company’s common stock and to vote for the Investor’s board nominees.
The Company evaluated whether this contingent Stock Purchase Agreement should be accounted for as a derivative instrument or whether it qualified for a scope exception under ASC 815-10. The Company concluded that the contract qualified for the scope exception because the contract was indexed to the Company’s own stock and was classified in stockholders’ equity.
Shares of Common Stock Reserved
As of December 31, 2011, the Company has reserved 2,876,438 shares of common stock for issuance upon exercise of stock options, unvested restricted stock and Class B common stock convertibility.
69
Table of Contents
9. EARNINGS PER SHARE
The following is a reconciliation of the numerators and denominators of the basic and diluted Earnings per Share (EPS) computations for net income and other related disclosures:
(in thousands except share and per share data)
| Year
ended December 31, 2011 |
Nine months ended December 31, | Year
ended March 31, 2010 |
||||||||||||||
| 2010 | 2009 | |||||||||||||||
| Basic net income per share computation: |
||||||||||||||||
| Numerator: |
||||||||||||||||
| Net income |
$ | 3,201 | $ | 5,814 | $ | 7,689 | $ | 8,204 | ||||||||
| Denominator: |
||||||||||||||||
| Weighted average shares outstanding- basic |
16,141,063 | 15,347,173 | 14,533,601 | 14,579,759 | ||||||||||||
| Net income per common share - basic: |
$ | .20 | $ | .38 | $ | .53 | $ | .56 | ||||||||
|
|
|
|
|
|
|
|
|
|||||||||
| Diluted net income per share computation: |
||||||||||||||||
| Numerator: |
||||||||||||||||
| Net income |
$ | 3,201 | $ | 5,814 | $ | 7,689 | $ | 8,204 | ||||||||
| Interest expense for convertible notes |
247 | 185 | — | 256 | ||||||||||||
|
|
|
|
|
|
|
|
|
|||||||||
| Numerator for diluted earnings per share |
$ | 3,448 | $ | 5,999 | $ | 7,689 | $ | 8,460 | ||||||||
|
|
|
|
|
|
|
|
|
|||||||||
| Denominator: |
||||||||||||||||
| Weighted average shares outstanding- basic |
16,141,063 | 15,347,173 | 14,533,601 | 14,579,759 | ||||||||||||
| Effect of dilutive securities: |
||||||||||||||||
| Shares issuable upon exercise of dilutive outstanding stock options, conversion of convertible debentures, vesting of restricted stock and exercise of warrants: |
1,272,267 | 1,356,497 | 1,593,579 | 1,552,580 | ||||||||||||
|
|
|
|
|
|
|
|
|
|||||||||
| Weighted average shares outstanding-diluted |
17,413,330 | 16,703,670 | 16,127,180 | 16,132,339 | ||||||||||||
|
|
|
|
|
|
|
|
|
|||||||||
| Net income per common share - diluted: |
$ | .20 | $ | .36 | $ | .48 | $ | .52 | ||||||||
|
|
|
|
|
|
|
|
|
|||||||||
The following shares are not included in the computation of diluted earnings per share because the assumed proceeds were greater than the average market price of the Company’s stock during the related periods and the effect of including such options in the computation would be antidilutive:
| Year
ended December 31, 2011 |
Nine months ended December 31, |
Year ended March 31, 2010 |
||||||||||||||
| 2010 | 2009 | |||||||||||||||
| Number of shares considered antidulitive for calculating diluted net income per share: |
139,911 | 244,056 | 662,894 | 597,138 | ||||||||||||
70
Table of Contents
10. INCOME TAXES
U.S. and international components of income before income taxes were composed of the following for the year ended December 31, 2011, the nine months ended December 31, 2010 and the year ended March 31, 2010 (in thousands):
| December 31, 2011 |
December 31, 2010 |
March 31, 2010 |
||||||||||
| U.S. |
$ | (5,738 | ) | $ | (1,072 | ) | $ | (3,311 | ) | |||
| Foreign |
12,627 | 10,374 | 17,611 | |||||||||
|
|
|
|
|
|
|
|||||||
| Total |
$ | 6,889 | $ | 9,302 | $ | 14,300 | ||||||
|
|
|
|
|
|
|
|||||||
For the year ended December 31, 2011, the nine months ended December 31, 2010 and year ended March 31, 2010 the provision for income taxes consists of the following (in thousands):
| December 31, 2011 |
December 31, 2010 |
March 31, 2010 |
||||||||||
| Current: |
||||||||||||
| Federal |
$ | — | $ | — | $ | (8 | ) | |||||
| State |
— | — | — | |||||||||
| Foreign |
(4,627 | ) | (4,035 | ) | (5,384 | ) | ||||||
|
|
|
|
|
|
|
|||||||
| (4,627 | ) | (4,035 | ) | (5,392 | ) | |||||||
|
|
|
|
|
|
|
|||||||
| Deferred: |
||||||||||||
| Federal |
— | — | — | |||||||||
| State |
— | — | — | |||||||||
| Foreign |
939 | 547 | (704 | ) | ||||||||
|
|
|
|
|
|
|
|||||||
| 939 | 547 | (704 | ) | |||||||||
|
|
|
|
|
|
|
|||||||
| Total provision |
$ | (3,688 | ) | $ | (3,488 | ) | $ | (6,096 | ) | |||
|
|
|
|
|
|
|
|||||||
For the year ended December 31, 2011, the nine months ended December 31, 2010 and the year ended March 31, 2010 the provision for income taxes differs from the amount computed by applying the federal statutory income tax rate to the Company’s income from operations before income taxes as follows:
| December 31, 2011 |
December 31, 2010 |
March 31, 2010 |
||||||||||
| Income tax expense at federal statutory rate |
34.0 | % | 34.0 | % | 34.0 | % | ||||||
| State taxes (net of federal benefit) |
(4.5 | )% | 0.3 | % | (1.3 | )% | ||||||
| Foreign rate differential |
(17.8 | )% | (8.4 | )% | (12.1 | )% | ||||||
| Change in valuation allowance (excluding assets transferred) |
34.3 | % | (8.1 | )% | 11.8 | % | ||||||
| Equity in net income of unconsolidated affiliate |
(5.5 | )% | 0.0 | % | 0.0 | % | ||||||
| Change in tax rate |
0.0 | % | (1.4 | )% | 0.6 | % | ||||||
| Stock-based compensation |
4.2 | % | 1.9 | % | 1.7 | % | ||||||
| Nondeductible selling costs |
0.0 | % | 3.1 | % | 2.6 | % | ||||||
| Organization costs of joint venture |
0.0 | % | 5.3 | % | 0.0 | % | ||||||
| Impact of assets transferred to joint venture |
0.0 | % | 9.3 | % | 0.0 | % | ||||||
| Valuation allowance on assets transferred to joint venture |
0.0 | % | (9.3 | )% | 0.0 | % | ||||||
| Other permanent differences |
7.5 | % | 7.7 | % | 5.2 | % | ||||||
| Other |
1.3 | % | 3.1 | % | 0.1 | % | ||||||
|
|
|
|
|
|
|
|||||||
| 53.5 | % | 37.5 | % | 42.6 | % | |||||||
|
|
|
|
|
|
|
|||||||
71
Table of Contents
Deferred income taxes reflect the net tax effects of the temporary differences between the carrying amounts of assets and liabilities for financial reporting purposes and the amounts used for income tax purposes. Significant components of the Company’s deferred tax assets and liabilities are as follows as of December 31, 2011 and 2010 (in thousands):
| December 31, 2011 |
December 31, 2010 |
|||||||
| Deferred tax assets, net: |
||||||||
| Allowance for doubtful accounts |
$ | 2,052 | $ | 1,608 | ||||
| Accrued expenses |
1,856 | 1,617 | ||||||
| Net operating loss carryforwards |
4,745 | 576 | ||||||
| Alternative minimum tax |
107 | 736 | ||||||
| Start-up costs |
219 | 72 | ||||||
| Stock based compensation |
1,631 | 1,347 | ||||||
| Deferred rent |
380 | — | ||||||
|
|
|
|
|
|||||
| 10,990 | 5,956 | |||||||
| Valuation allowance |
(6,242 | ) | (2,340 | ) | ||||
|
|
|
|
|
|||||
| Deferred tax assets, net of valuation allowance |
4,748 | 3,616 | ||||||
| Deferred tax liabilities: |
||||||||
| Convertible debt beneficial conversion feature |
(583 | ) | (681 | ) | ||||
| Depreciation |
(121 | ) | (16 | ) | ||||
| Other |
(20 | ) | — | |||||
|
|
|
|
|
|||||
| Total deferred tax liabilities |
(724 | ) | (697 | ) | ||||
|
|
|
|
|
|||||
| Total net deferred taxes |
$ | 4,024 | $ | 2,919 | ||||
|
|
|
|
|
|||||
The Company has U.S. federal net operating losses of approximately $10.7 million (including the windfall benefit from stock option exercise) which will expire between 2025 and 2031. The Company also has foreign losses from China of which approximately $5.6 million will expire between 2012 and 2016.
The exercise of stock options and certain stock grants generated an income tax deduction equal to the excess of the fair market value over the exercise price. In accordance with ASC 718, the Company will not recognize a deferred tax asset with respect to the excess stock compensation deductions until those deductions actually reduce our income tax liability. As such, the Company has not recorded a deferred tax asset related to the net operating losses resulting from the exercise of these stock options in the accompanying financial statements. At such time as the Company utilizes these net operating losses to reduce income tax payable, the tax benefit will be recorded as an increase in additional paid in capital. As of December 31, 2011, the cumulative amount of the unrecognized tax benefit related to such option exercises and certain stock grants was $2,973,000.
Management assessed the realization of its deferred tax assets throughout each of the quarters of the year ended December 31, 2011. Management records a valuation allowance when it determines based on available positive and negative evidence, that it is more likely than not that some portion or all of its deferred tax assets will not be realized.
The valuation allowance as of December 31, 2011 and 2010 was $6.2 million and $2.3 million, respectively.
The Company intends to indefinitely reinvest the undistributed the earnings of its foreign subsidiaries. Accordingly, the annualized effective tax rate applied to the Company’s pre-tax income for the year ended December 31, 2011 did not include any provision for U.S. federal and state taxes on the projected amount of these undistributed 2011 foreign earnings. The total amount of undistributed earnings as of December 31, 2011 was approximately $43.3 million.
72
Table of Contents
The Company’s tax expense reflects the impact of varying tax rates in the different jurisdictions in which it operates. It also includes changes to the valuation allowance as a result of management’s judgments and estimates concerning projections of domestic and foreign profitability and the extent of the utilization of net operating loss carry forwards. As a result, we have experienced significant fluctuations in our world-wide effective tax rate. Changes in the estimated level of annual pre-tax income, changes in tax laws particularly related to the utilization of net operating losses in various jurisdictions, and changes resulting from tax audits can all affect the overall effective income tax rate which, in turn, impacts the overall level of income tax expense and net income.
The Company and its subsidiaries file income tax returns for U.S. federal jurisdiction and various states and foreign jurisdictions. For income tax returns filed by the Company, the Company is no longer subject to U.S. federal, state and local tax examinations by tax authorities for years before 2008, although carryforward tax attributes that were generated prior to 2008 may still be adjusted upon examination by tax authorities if they either have been or will be utilized. For the foreign jurisdictions, the Company is no longer subject to local examinations by the tax authorities for years prior to 2007.
As of December 31, 2011 and 2010, the Company had no unrecognized tax benefits, nor did it have any that would have an effect on the effective tax rate. The Company’s policy is that it would recognize interest and penalties accrued on any unrecognized tax benefits as a component of income tax expense. As of December 31, 2011 and 2010, the Company had no accrued interest or penalties related to uncertain tax positions.
11. COMMITMENTS
Leases
The Company leases office space and space for hospital and clinic operations under operating leases. Future minimum payments under these noncancelable operating leases consist of the following: (in thousands):
| Year ending December 31: |
||||
| 2012 |
$ | 6,036 | ||
| 2013 |
5,791 | |||
| 2014 |
5,437 | |||
| 2015 |
5,365 | |||
| 2016 |
4,314 | |||
| Thereafter |
42,494 | |||
|
|
|
|||
| Net minimum rental commitments |
$ | 69,437 | ||
|
|
|
The above leases require the Company to pay certain pass through operating expenses and rental increases based on inflation.
Rental expense was approximately $6,199,000, $3,975,000 and $4,756,000 for the year ended December 31, 2011, the nine months ended December 31, 2010, and the year ended March 31, 2010, respectively.
73
Table of Contents
12. FAIR VALUE OF FINANCIAL INSTRUMENTS
ASC 820, which defines fair value, establishes a framework and gives guidance regarding the methods used for measuring fair value, and expands disclosures about fair value measurements. It clarifies that fair value is an exit price, representing the amount that would be received to sell an asset or paid to transfer a liability in an orderly transaction between market participants. As such, fair value is a market-based measurement that should be determined based on assumptions that market participants would use in pricing an asset or liability. As a basis for considering such assumptions, ASC 820 establishes a three-tier value hierarchy, which prioritizes the inputs used in measuring fair value as follows: (Level 1) observable inputs such as quoted prices in active markets; (Level 2) inputs other than the quoted prices in active markets that are observable either directly or indirectly; and (Level 3) unobservable inputs in which there is little or no market data, which require us to develop our own assumptions. This hierarchy requires us to use observable market data, when available, and to minimize the use of unobservable inputs when determining fair value.
The following table presents the balances of investment securities measured at fair value on a recurring basis by level (in thousands):
| As of December 31, 2011: |
||||||||||||||||
| Description |
Total | Quoted Prices in Active Markets for Identical Assets (Level 1) |
Significant Other Observable Inputs (Level 2) |
Significant Unobservable Inputs (Level 3) |
||||||||||||
| Assets |
||||||||||||||||
| U.S. Government Sponsored Enterprises |
$ | 1,575 | $ | — | $ | 1,575 | $ | — | ||||||||
| Corporate Bonds |
6,007 | — | 6,007 | — | ||||||||||||
|
|
|
|
|
|
|
|
|
|||||||||
| Total |
$ | 7,582 | $ | — | $ | 7,582 | $ | — | ||||||||
|
|
|
|
|
|
|
|
|
|||||||||
| As of December 31, 2010: |
||||||||||||||||
| Description |
Total | Quoted Prices in Active Markets for Identical Assets (Level 1) |
Significant Other Observable Inputs (Level 2) |
Significant Unobservable Inputs (Level 3) |
||||||||||||
| Assets |
||||||||||||||||
| U.S. Government Sponsored Enterprises |
$ | 500 | $ | — | $ | 500 | $ | — | ||||||||
| Corporate Bonds |
5,533 | — | 5,533 | — | ||||||||||||
|
|
|
|
|
|
|
|
|
|||||||||
| Total |
$ | 6,033 | $ | — | $ | 6,033 | $ | — | ||||||||
|
|
|
|
|
|
|
|
|
|||||||||
74
Table of Contents
The valuation of these investment securities are obtained from a financial institution that trades in similar securities.
The carrying amounts reported in the consolidated balance sheets for cash and cash equivalents, accounts receivable and accounts payable approximate fair value because of the short-term maturity of these instruments.
The fair value of debt under ASC 820 is not the settlement amount of the debt, but is based on an estimate of what an entity might pay to transfer the obligation to another entity with a similar credit standing. Observable inputs for the Company’s debt such as quoted prices in active markets are not available, as the Company’s long-term debt is not publicly-traded. Accordingly, the Company has estimated the fair value amounts using available market information and commonly accepted valuation methodologies. However, it requires considerable judgment in interpreting market data to develop estimates of fair value. Accordingly, the fair value estimate presented is not necessarily indicative of the amount that the Company or holders of the debt instruments could realize in a current market exchange. The use of different assumptions and/or estimation methodologies may have a material effect on the estimated fair values.
The fair value of the Company’s convertible debt was calculated based on an estimate of the present value of the debt payments combined with an estimate of the value of the conversion option, using the Black-Scholes option pricing model. For the Company’s other long-term debt, the fair value was calculated based on an estimate of the present value of the debt payments. As of December 31, 2011, the carrying value of the Company’s convertible debt, net of debt discount, and the long-term debt outstanding for the IFC 2005 RMB Loan was $23.8 million, and the estimated fair value was $26.7 million. The carrying amounts of the remaining debt instruments approximate fair value, as the instruments are subject to variable rates of interest or have short maturities.
13. CONCENTRATIONS OF CREDIT RISK
Financial instruments which potentially subject the Company to concentrations of credit risk consist primarily of cash and cash equivalents and accounts receivables. Substantially all of the Company’s cash and cash equivalents at December 31, 2011 and December 31, 2010 were held by one U.S. financial institution, one Hong Kong financial institution and six Chinese financial institutions, as described above in Note 2.
The medical services and products provided by United Family Hospitals and Clinics and the marketing of such services are performed exclusively for/to patients in China. The Company’s results of operations and its ability to obtain financing could be adversely affected if there was a deterioration in trade relations between the United States and China.
The Company’s assets, consisting principally of cash and cash equivalents, accounts receivable, inventories, investment in unconsolidated affiliate, leasehold improvements, equipment and other assets, are primarily located in China. As of December 31, 2011, the Company’s assets in China were approximately $145,422,000, and $122,189,000 as of December 31, 2010, which includes the equity investment in CML.
75
Table of Contents
14. ACCOUNTING FOR VARIABLE INTEREST ENTITIES (VIE)
ASC 810 requires a variable interest entity (VIE) to be consolidated if a party with an ownership, contractual or other financial interest in the VIE (a variable interest holder) is obligated to absorb a majority of the risk of loss from the VIE’s activities, is entitled to receive a majority of the VIE’s residual returns (if no party absorbs a majority of the VIE’s losses), or both. A variable interest holder that consolidates the VIE is called the primary beneficiary. Upon consolidation, the primary beneficiary generally must initially record all of the VIE’s assets, liabilities and noncontrolling interests at fair value and subsequently account for the VIE as if it were consolidated based on majority voting interest.
The Company’s clinics in Beijing, Shanghai and Guangzhou are consolidated VIEs. These entities were founded for the express purpose of projecting United Family Healthcare general patient services closer to a large patient population for the convenience of the patients.
15. SEGMENT REPORTING
In years prior to 2011, the Company operated in two business segments. For the nine months ended December 31, 2010 and the year ended March 31, 2010, the Company operated in two businesses: Healthcare Services and Medical Products. The Company evaluated performance and allocated resources based on income or loss from operations before income taxes, not including foreign exchange gains or losses. All segments follow the accounting policies described above in Note 1. The following segment information has been provided as per ASC 280 (in thousands):
| Healthcare Services |
Medical Products |
Total | ||||||||||
| For the nine months ended December 31, 2010 |
||||||||||||
| Sales and service revenue |
$ | 74,224 | $ | 62,452 | $ | 136,676 | ||||||
| Gross Profit |
n/a | * | 18,679 | n/a | ||||||||
| Gross Profit % |
n/a | * | 30 | % | n/a | |||||||
| Income (loss) from operations before foreign exchange |
$ | 11,898 | $ | (1,806 | ) | $ | 10,092 | |||||
| Foreign exchange loss |
(544 | ) | ||||||||||
|
|
|
|||||||||||
| Income from operations |
$ | 9,548 | ||||||||||
| Other (expense), net |
(246 | ) | ||||||||||
|
|
|
|||||||||||
| Income before income taxes |
$ | 9,302 | ||||||||||
|
|
|
|||||||||||
| Assets as of December 31, 2010 |
$ | 142,417 | $ | 31,756 | ** | $ | 174,173 | |||||
| Healthcare Services |
Medical Products |
Total | ||||||||||
| For the year ended March 31, 2010 |
||||||||||||
| Sales and service revenue |
$ | 85,778 | $ | 85,413 | $ | 171,191 | ||||||
| Gross Profit |
n/a | * | 23,354 | n/a | ||||||||
| Gross Profit % |
n/a | * | 27 | % | n/a | |||||||
| Income (loss) from operations before foreign exchange |
$ | 14,393 | $ | (366 | ) | $ | 14,027 | |||||
| Foreign exchange gain |
385 | |||||||||||
|
|
|
|||||||||||
| Income from operations |
$ | 14,412 | ||||||||||
| Other (expense), net |
(112 | ) | ||||||||||
|
|
|
|||||||||||
| Income before income taxes |
$ | 14,300 | ||||||||||
|
|
|
|||||||||||
| Assets as of March 31, 2010 |
$ | 112,929 | $ | 57,914 | $ | 170,843 | ||||||
| * | Gross profit margins not routinely calculated in the healthcare industry. |
| ** | Represents investment in unconsolidated affiliate. |
76
Table of Contents
16. SELECTED QUARTERLY DATA (UNAUDITED)
(in thousands except per share data)
| First Quarter |
Second Quarter |
Third Quarter |
Fourth Quarter |
|||||||||||||
| For the year ended December 31, 2011: |
||||||||||||||||
| Revenue |
$ | 24,185 | $ | 29,465 | $ | 28,815 | $ | 31,932 | ||||||||
| (Loss) Income before income taxes |
(443 | ) | 4,218 | 1,106 | 2,008 | |||||||||||
| Net (loss) income |
(1,230 | ) | 2,943 | 315 | 1,173 | |||||||||||
| Net income per common share - basic |
(.08 | ) | .18 | .02 | .07 | |||||||||||
| Net income per common share - diluted |
(.08 | ) | .17 | .02 | .07 | |||||||||||
| For the nine months ended December 31, 2010: |
||||||||||||||||
| Revenue |
$ | 41,488 | $ | 45,174 | $ | 50,014 | N/A | |||||||||
| Income before income taxes |
1,848 | 4,734 | 2,720 | N/A | ||||||||||||
| Net income |
836 | 3,237 | 1,741 | N/A | ||||||||||||
| Net income per common share - basic |
.06 | .21 | .11 | N/A | ||||||||||||
| Net income per common share - diluted |
.06 | .20 | .10 | N/A | ||||||||||||
| For the year ended March 31, 2010: |
||||||||||||||||
| Revenue |
$ | 45,331 | $ | 38,119 | $ | 46,484 | $ | 41,257 | ||||||||
| Income before income taxes |
4,826 | 1,547 | 6,620 | 1,307 | ||||||||||||
| Net income |
3,253 | 538 | 3,898 | 515 | ||||||||||||
| Net income per common share - basic |
.22 | .04 | .27 | .04 | ||||||||||||
| Net income per common share - diluted |
.20 | .03 | .24 | .03 | ||||||||||||
ITEM 9. CHANGES IN AND DISAGREEMENTS WITH ACCOUNTANTS ON ACCOUNTING AND FINANCIAL DISCLOSURE
N/A
ITEM 9A. CONTROLS AND PROCEDURES
Disclosure Controls and Procedures.
We maintain disclosure controls and procedures that are designed to provide reasonable assurance that information required to be disclosed by us in the reports that we file or submit to the Securities and Exchange Commission (SEC) under the Securities Exchange Act of 1934, as amended (the “Exchange Act”), is recorded, processed, summarized and reported within the time periods specified by the SEC’s rules and forms, and that information is accumulated and communicated to our management, including our Chief Executive Officer and Chief Financial Officer, as appropriate to allow timely decisions regarding required disclosure.
77
Table of Contents
In accordance with Exchange Act Rules 13a-15 and 15d-15, we carried out an evaluation, under the supervision and with the participation of management, including our Chief Executive Officer (CEO) and Chief Financial Officer (CFO), of the effectiveness of our disclosure controls and procedures as of the end of the period covered by this report. A control deficiency exists when the design or operation of a control does not allow management or employees, in the ordinary course of performing their assigned functions, to prevent or detect misstatements on a timely basis. A significant deficiency is a control deficiency, or combination of control deficiencies, that adversely affects the Company’s ability to initiate, authorize, record, process, or report external financial data reliably in accordance with GAAP, such that there is a more than remote likelihood that a misstatement of the Company’s annual or interim financial statements that is more than inconsequential will not be prevented or detected. A material weakness is a control deficiency, or combination of control deficiencies, that results in more than a remote likelihood that a material misstatement of the annual or interim financial statements will not be prevented or detected. Our CEO and CFO have concluded that, as of the end of the period covered by this Annual Report on Form 10-K, the Company’s disclosure controls and procedures were effective to provide reasonable assurance that information required to be disclosed in our reports filed or submitted under the Exchange Act is recorded, processed, summarized and reported within the time periods specified in the SEC’s rules and forms.
Changes in Internal Control of Financial Reporting During the Quarter
Our management, including our principal executive and principal financial officers have evaluated any changes in our internal control over financial reporting that occurred during the quarter ended December 31, 2011, and has concluded that there was no change that occurred during the quarter ended December 31, 2011 that has materially affected, or is reasonably likely to materially affect, our internal control over financial reporting.
Management’s Annual Report on Internal Control over Financial Reporting
Management, including the CEO and CFO, has the responsibility for establishing and maintaining adequate internal control over financial reporting, as defined in the Exchange Act, Rule 13a-15(f). Internal control over financial reporting is a process designed by, or under the supervision of, the Company’s principal executive and principal financial officers, or persons performing similar functions and influenced by the Company’s Board of Directors, management and other personnel, to provide reasonable assurance regarding the reliability of financial reporting and the preparation of financial statements for external purposes in accordance with accounting principles generally accepted in the United States of America (GAAP). Because of its inherent limitations, internal control over financial reporting may not prevent or detect misstatements. In addition, projections of any evaluation of effectiveness to future periods are subject to the risk that controls may become inadequate or insufficient because of changes in operating conditions, or that the degree of compliance with the policies or procedures may deteriorate.
Management assessed internal control over financial reporting of the Company and subsidiaries as of December 31, 2011. The Company’s management conducted its assessment in accordance with the Internal Control—Integrated Framework issued by the Committee of Sponsoring Organizations of the Treadway Commission (COSO). Management concluded that our internal control over financial reporting was effective as of December 31, 2011.
BDO USA, LLP, the independent registered public accounting firm who also audited the Company’s consolidated financial statements, has issued its own attestation report on the effectiveness of internal controls over our financial reporting as of December 31, 2011, which is filed herewith.
78
Table of Contents
None.
ITEM 10. DIRECTORS, EXECUTIVE OFFICERS AND CORPORATE GOVERNANCE
Information required is set forth in the Proxy Statement with respect to our 2011 annual meeting of shareholders (Proxy Statement), which is incorporated herein by reference.
ITEM 11. EXECUTIVE COMPENSATION
Information required is set forth in the Proxy Statement, which is incorporated herein by reference.
ITEM 12. SECURITY OWNERSHIP OF CERTAIN BENEFICIAL OWNERS AND MANAGEMENT AND RELATED STOCKHOLDER MATTERS
Information required is set forth in the Proxy Statement, which is incorporated herein by reference.
ITEM 13. CERTAIN RELATIONSHIPS AND RELATED TRANSACTIONS, AND DIRECTOR INDEPENDENCE
Information required is set forth in the Proxy Statement, which is incorporated herein by reference.
ITEM 14. PRINCIPAL ACCOUNTANT FEES AND SERVICES
Information required is set forth in the Proxy Statement, which is incorporated herein by reference.
ITEM 15. EXHIBITS AND FINANCIAL STATEMENT SCHEDULES
(a)(1) The following consolidated financial statements of Chindex International, Inc. are included in Part II, Item 8:
Reports of Independent Registered Public Accounting Firm
Consolidated Balance Sheets as of December 31, 2011 and December 31, 2010.
Consolidated Statements of Operations for the year ended December 31, 2011, nine months ended December 31, 2010 and 2009 (unaudited) and the year ended March 31, 2010.
Consolidated Statements of Cash Flows for the year ended December 31, 2011, nine months ended December 31, 2010 and 2009 (unaudited) and the year ended March 31, 2010.
Consolidated Statements of Stockholders’ Equity for the year ended December 31, 2011 nine months ended December 31, 2010 and the year ended March 31, 2010.
Notes to Consolidated Financial Statements.
(a)(2) The following financial statement schedule of Chindex International is included in Item 15(d):
Schedule Valuation and Qualifying Accounts.
Schedule II Valuation and Qualifying Accounts.
79
Table of Contents
| Description (amounts in thousands) |
Balance beginning of year |
Additions expensed |
Additions not expensed |
Deductions* | Balance end of year |
|||||||||||||||
| For the year ended December 31, 2011: |
||||||||||||||||||||
| Allowance for doubtful receivables |
$ | 6,748 | 2,131 | 368 | 947 | $ | 8,300 | |||||||||||||
| Deferred income tax valuation allowance |
$ | 2,340 | 2,311 | 1,591 | — | $ | 6,242 | |||||||||||||
| For the nine months ended December 31, 2010: |
||||||||||||||||||||
| Allowance for doubtful receivables |
$ | 6,158 | 1,489 | — | 899 | $ | 6,748 | |||||||||||||
| Inventory valuation allowance |
$ | 276 | 137 | 89 | 502 | $ | — | |||||||||||||
| Deferred income tax valuation allowance |
$ | 5,097 | — | 97 | 2,854 | $ | 2,340 | |||||||||||||
| Demonstration inventory allowance |
$ | 2,397 | 491 | 71 | 2,959 | $ | — | |||||||||||||
| For the year ended March 31, 2010: |
||||||||||||||||||||
| Allowance for doubtful receivables |
$ | 5,041 | 1,467 | 6 | 356 | $ | 6,158 | |||||||||||||
| Inventory valuation allowance |
$ | 151 | 342 | — | 217 | $ | 276 | |||||||||||||
| Deferred income tax valuation allowance |
$ | 3,424 | 1,671 | 2 | — | $ | 5,097 | |||||||||||||
| Demonstration inventory allowance |
$ | 2,264 | 541 | — | 408 | $ | 2,397 | |||||||||||||
| * | For the nine months ended December 31, 2010, deductions primarily include amounts related to the deconsolidation of MPD. |
All other schedules for which provision is made in the applicable accounting regulation of the Securities and Exchange Commission are not required under the related instructions or are inapplicable and, therefore, have been omitted.
| (b) | Exhibits |
The exhibits listed below are filed as a part of this Annual Report:
| 3.1 | Amended and Restated Certificate of Incorporation of the Company dated October 28, 2004. Incorporated by reference to Exhibit 3.1 to the Company’s Annual Report on Form 10-K for the fiscal year ended March 31, 2005. | |
| 3.2 | Amendment to Certificate of Incorporation dated July 9, 2007. Incorporated by reference to Exhibit 3.1 to the Company’s Current Report on Form 8-K dated July 10, 2007. | |
| 3.3 | Amended and Restated By-laws of the Company dated September 21, 2011. Incorporated by reference to Exhibit 3.3 to the Company’s Current Report on Form 8-K filed September 23, 2011. | |
| 3.4 | Certificate of Designations of Series A Junior Participating Preferred Stock of the Company. Incorporated by reference to Exhibit 3.3 to the Company’s Annual Report on Form 10-K for the fiscal year ended March 31, 2007. | |
| 4.1 | Form of Specimen Certificate representing the Common Stock of the Company. Incorporated by reference to Exhibit 4.2 to the Registrant’s Registration Statement on Form SB-2 (No. 33-78446) (The “IPO Registration Statement”). | |
| 4.2 | Form of Specimen Certificate representing the Class B Common Stock of the Company. Incorporated by reference to Exhibit 4.3 to the IPO Registration Statement. | |
| 4.3 | Rights Agreement, dated as of June 7, 2007, between the Company and American Stock Transfer & Trust Company, as Rights Agent, which includes a form of Right Certificate as Exhibit B and a Summary of Rights to Purchase Preferred Stock as Exhibit C. Incorporated by reference to Exhibit 4.1 to the Company’s Current Report on Form 8-K dated June 4, 2007. | |
| 4.4 | Amendment No. 1 to Rights Agreement, dated as of November 4, 2007, between the Company and American Stock Transfer & Trust Company, as Rights Agent. Incorporated by reference to Exhibit 10.2 to the Company’s Current Report on Form 8-K dated November 7, 2007. | |
| 4.5 | Amendment No. 2 to Rights Agreement, dated as of June 8, 2010, between the Company and American Stock Transfer & Trust Company, as Rights Agent. Incorporated by reference to Exhibit 10.3 to the Company’s Current Report on Form 8-K dated June 14, 2010 (the “June 14, 2010 Form 8-K”). | |
| 10.1* | The Company’s 1994 Stock Option Plan, as amended as of July 17, 2001. Incorporated by reference to Exhibit 10.1 to the Company’s Quarterly Report on Form 10-Q for the six months ended June 30, 2001. | |
| 10.2* | The Company’s 2004 Stock Incentive Plan. Incorporated by reference to Annex B to the Company’s Proxy Statement on Schedule 14A filed with the Securities and Exchange Commission on September 14, 2004. | |
80
Table of Contents
| 10.3* | The Company’s 2007 Stock Incentive Plan, as amended and restated as of November 22, 2010 Incorporated by reference to Exhibit 10.3 to the Company’s Transition Report on Form 10-K for the transition period from April 1, 2010 to December 31, 2010 (the “December 31, 2010 Form 10-K”). | |
| 10.4* | The Company’s 2011 Executive Management Incentive Plan (“EMIP”). Incorporated by reference to Exhibit 10.1 to the Company’s Quarterly Report on Form 10-Q for the three months ended June 30, 2010. | |
| 10.5* | Form of Outside Director Restricted Stock Grant Letter. Incorporated by reference to Exhibit 99.2 to the Company’s Current Report on Form 8-K dated September 11, 2007 (the “September 11, 2007 Form 8-K”). | |
| 10.6* | Form of Employee Restricted Stock Grant Letter. Incorporated by reference to Exhibit 99.3 to the September 17, 2007 Form 8-K. | |
| 10.7* | Form of Employee Stock Option Grant Letter. Incorporated by reference to Exhibit 99.4 to the September 17, 2007 Form 8-K. | |
| 10.8* | Form of Stock Option Grant Letter for EMIP awards. Incorporated by reference to Exhibit 10.8 to the Company’s Annual Report on Form 10-K for the fiscal year ended March 31, 2009. | |
| 10.9* | Form of Employee Restricted Stock Grant Letter. Incorporated by reference to Exhibit 10.9 to the December 31, 2010 Form 10-K. | |
| 10.10* | Form of Executive Stock Option Grant Letter. Incorporated by reference to Exhibit 10.10 to the December 31, 2010 Form 10-K. | |
| 10.11 | Lease Agreement dated November 8, 1995 between the School of Posts and Telecommunications and the Company. Incorporated by reference to Exhibit 10.14 to the Company’s Annual Report on Form 10-KSB for the fiscal year ended December 31, 1995. | |
| 10.12 | Amendments Numbers One, Two and Three to the Lease Agreement between the School of Posts and Telecommunications and the Company dated November 8, 1995, each such amendment dated November 26, 1996. Incorporated by reference to Exhibit 10.13 to the Company’s Annual Report on Form 10-KSB for the fiscal year ended December 31, 1997. | |
| 10.13 | Lease Agreement dated May 10, 1998, between the School of Posts and Telecommunications and the Company relating to the lease of additional space. Incorporated by reference to Exhibit 10.13 to the Company’s Annual Report on Form 10-KSB for the fiscal year ended December 31, 1998. | |
| 10.14 | Contractual Joint Venture Contract dated September 27, 1995 between the Chinese Academy of Medical Sciences Union Medical & Pharmaceutical Group Beijing Union Medical & Pharmaceutical General Corporation and the Company. Incorporated by reference to Exhibit 10.16 to the Company’s Annual Report on Form 10-KSB for the fiscal year ended December 31, 1995. | |
| 10.15 | First Investment Loan Manager Demand Promissory Note dated July 10, 1997 between First National Bank of Maryland and the Company. Incorporated by reference to Exhibit 10.16 to the Company’s Annual Report on Form 10-KSB for the fiscal year ended December 31, 1997. | |
| 10.16 | Distribution Agreement dated October 11, 2001 between Siemens AG and the Company. Incorporated by reference to Exhibit 10.18 to the Company’s Quarterly Report on Form 10-Q for the nine months ended September 30, 2001. | |
| 10.17* | Amended and Restated Employment Agreement, dated as of December 15, 2008, between the Company and Roberta Lipson. Incorporated by reference to Exhibit 10.1 to the Company’s Quarterly Report on Form 10-Q for the nine months ended December 31, 2008. | |
| 10.18* | Amended and Restated Employment Agreement, dated as of December 15, 2008, between the Company and Elyse Beth Silverberg. Incorporated by reference to Exhibit 10.2 to the Company’s Quarterly Report on Form 10-Q for the nine months ended December 31, 2008. | |
| 10.19* | Amendment, dated as of December 31, 2010, to Amended and Restated Employment Agreement, dated as of December 15, 2008, between the Company and Elyse Beth Silverberg. Incorporated by reference to Exhibit 10.6 to the Company’s Current Report on Form 8-K dated December 31, 2010 (the “December 31, 2010 Form 8-K”). | |
| 10.20* | Amended and Restated Employment Agreement, dated as of December 22, 2008, between the Company and Lawrence Pemble. Incorporated by reference to Exhibit 10.3 to the Company’s Quarterly Report on Form 10-Q for the nine months ended December 31, 2008. | |
| 10.21* | Amendment, dated as of December 31, 2010, to Amended and Restated Employment Agreement, dated as of December 22, 2008, between the Company and Lawrence Pemble. Incorporated by reference to Exhibit 10.7 to the December 31, 2010 Form 8-K. | |
81
Table of Contents
| 10.22* | Amendment, dated as of January 1, 2012, to Amended and Restated Employment Agreement, dated as of December 22, 2008, between the Company and Lawrence Pemble (filed herewith). | |
| 10.23* | Amended and Restated Employment Agreement, dated January 1, 2012, between the Company and Robert Low (filed herewith). | |
| 10.24 | Securities Purchase Agreement dated November 7, 2007 between the Company and Magenta Magic Limited. Incorporated by reference to Exhibit 10.1 to the Company’s Current Report on Form 8-K dated November 7, 2007. | |
| 10.25 | RMB Loan Agreement dated October 10, 2005 among Beijing United Family Health Center, Shanghai United Family Hospital, Inc. and International Finance Corporation. Incorporated by reference to Exhibit 10.28 to the Company’s Quarterly Report on Form 10-Q for the six months ended September 30, 2005. | |
| 10.26 | Guarantee Agreement dated October 11, 2005 between the Company and International Finance Corporation. Incorporated by reference to Exhibit 10.29 to the Company’s Quarterly Report on Form 10-Q for the six months ended September 30, 2005. | |
| 10.27 | Loan Agreement dated December 10, 2007 between the Company and International Finance Corporation. Incorporated by reference to Exhibit 4.1 to the Company’s Current Report on Form 8-K dated December 10, 2007 (the “December 10, 2007 Form 8-K”). | |
| 10.28 | Amendment to Loan Agreement, dated as of January 3, 2008, between Chindex China Healthcare Finance, LLC and International Finance Corporation. Incorporated by reference to Exhibit 4.3 to the Company’s Current Report on Form 8-K dated January 10, 2008 (the “January 10, 2008 Form 8-K”). | |
| 10.29 | Securities Purchase Agreement dated December 10, 2007 between the Company and International Finance Corporation. Incorporated by reference to Exhibit 10.1 to the December 10, 2007 Form 8-K. | |
| 10.30 | Loan Agreement, dated as of January 8, 2008, between Chindex China Healthcare Finance, LLC and DEG-Deutsche Investitions-Und Entwicklungsgesellschaft. Incorporated by reference to Exhibit 4.1 to the January 10, 2008 Form 8-K. | |
| 10.31 | Amendment to Loan Agreement, dated as of May 27, 2009, between Chindex China Healthcare Finance, LLC and DEG-Deutsche Investitions-Und Entwicklungsgesellschaft. Incorporated by reference to Exhibit 10.27 to the Company’s Annual Report on Form 10-K for the fiscal year ended March 31, 2009. | |
| 10.32 | SPV Guarantee Agreement, dated as of January 8, 2008, between Chindex China Healthcare Finance, LLC and DEG-Deutsche Investitions und Entwicklungsgesellschaft. Incorporated by reference to Exhibit 4.2 to the January 10, 2008 Form 8-K. | |
| 10.33 | Contractual Joint Venture Contract dated February 9, 2002 between Shanghai Changning District Central Hospital and the Company. Incorporated by reference to Exhibit 10.24 to the Company’s Annual Report on Form 10-K for the fiscal year ended December 31, 2001. | |
| 10.34 | Lease Agreement between Shanghai Changning District Hospital and the Company related to the lease of the building for Shanghai United Family Hospital. Incorporated by reference to Exhibit 10.25 to the Company’s Annual Report on Form 10-K for the fiscal year ended December 31, 2001. | |
| 10.35 | Lease Agreement between China Arts & Crafts Import & Export Corporation and Chindex (Beijing) Consulting Incorporated related to the lease of the building for the Company’s main office in Beijing. Incorporated by reference to Exhibit 10.17 to the Company’s Quarterly Report on Form 10-Q for the six months ended June 30, 2002. | |
| 10.36 | Agreement between Siemens AG and the Company for long-term payment of vendor invoices. Incorporated by reference to Exhibit 10.18 to the Company’s Quarterly Report on Form 10-Q for the nine months ended September 30, 2002. | |
| 10.37 | Form of Common Stock Purchase Warrant issued to investors on March 24, 2005. Incorporated by reference to Exhibit 10.2 to the Company’s Current Report on Form 8-K dated March 21, 2005. | |
| 10.38 | Amendatory Letter No. 1 dated February 5, 2009 to Loan Agreement dated December 10, 2007 between the Company and International Finance Corporation. Incorporated by reference to Exhibit 10.34 to the Company’s Annual Report on Form 10-K for the fiscal year ended March 31, 2009. | |
| 10.39 | Stock Purchase Agreement dated June 14, 2010 among the Company, Fosun Industrial Co., Limited and Shanghai Fosun Pharmaceutical (Group) Co., Ltd. Incorporated by reference to Exhibit 10.1 to June 14, 2010 Form 8-K. | |
| 10.40 | Stockholder Agreement dated June 14, 2010 among the Company, Fosun Industrial Co., Limited and Shanghai Fosun Pharmaceutical (Group) Co., Ltd. Incorporated by reference to Exhibit 10.2 to the June 14, 2010 Form 8-K. | |
82
Table of Contents
| 10.41 | Formation Agreement dated December 28, 2010 among Fosun Industrial Co., Limited, Ample Up Limited, Shanghai Fosun Pharmaceutical (Group) Co., Ltd., the Company, Chindex Medical Holdings (BVI) Limited and Chindex Medical Limited. Incorporated by reference to Exhibit 10.1 to the Company’s Current Report on Form 8-K dated December 28, 2010 (the “December 28, 2010 Form 8-K”). | |
| 10.42 | Share Transfer Agreement dated December 27, 2010 between Shanghai Fosun Pharmaceutical (Group) Co., Ltd. and Chindex Export Limited. Incorporated by reference to Exhibit 10.2 to the December 28, 2010 Form 8-K. | |
| 10.43 | Entrusted Management Agreement dated December 31, 2010 among Shanghai Technology Innovation Co., Ltd., Shanghai Fosun Pharmaceutical (Group) Co., Ltd. and Chindex Export Limited. Incorporated by reference to Exhibit 10.1 to the December 31, 2010 Form 8-K. | |
| 10.44 | Shareholder’s Voting Proxy Agreement dated December 31, 2010 among Shanghai Technology Innovation Co., Ltd., Shanghai Fosun Pharmaceutical (Group) Co., Ltd. and Chindex Export Limited. Incorporated by reference to Exhibit 10.2 to the December 31, 2010 Form 8-K. | |
| 10.45 | Joint Venture Governance and Shareholders Agreement dated December 31, 2010 among Chindex Medical Holdings (BVI) Limited, Ample Up Limited, Chindex Medical Limited and certain subsidiaries of Chindex Medical Limited and Fosun Pharmaceutical (Group) Co., Ltd. Incorporated by reference to Exhibit 10.3 to the December 31, 2010 Form 8-K. | |
| 10.46 | Trademark License Agreement dated December 31, 2010 between the Company and Chindex Medical Limited. Incorporated by reference to Exhibit 10.4 to the December 31, 2010 Form 8-K. | |
| 10.47 | Services Agreement dated December 31, 2010 between the Company and Chindex Export Medical Products, LLC. Incorporated by reference to Exhibit 10.5 to the December 31, 2010 Form 8-K. | |
| 10.48 | Chindex Medical Limited consolidated financial statements as for the year ended December 31, 2011. | |
| 23.1 | Consent of Independent Registered Public Accounting Firm (filed herewith) | |
| 31.1 | Certification of the Company’s Chief Executive Officer Pursuant to Rule 13a-14(a) (filed herewith) | |
| 31.2 | Certification of the Company’s Chief Financial Officer Pursuant to Rule 13a-14(a) (filed herewith) | |
| 31.3 | Certification of the Company’s Principal Accounting Officer Pursuant to Rule 13a-14(a) (filed herewith) | |
| 32.1 | Certification of the Company’s Chief Executive Officer Pursuant to 18 U.S.C. Section 1350 (filed herewith) | |
| 32.2 | Certification of the Company’s Chief Financial Officer Pursuant to 18 U.S.C. Section 1350 (filed herewith) | |
| 32.3 | Certification of the Company’s Principal Accounting Officer Pursuant to 18 U.S.C. Section 1350 (filed herewith) | |
| 101.INS | XBRL Instance Document (furnished herewith) | |
| 101.SCH | XBRL Taxonomy Extension Schema Document (furnished herewith) | |
| 101.CAL | XBRL Taxonomy Extension Calculation Linkbase Document (furnished herewith) | |
| 101.LAB | XBRL Taxonomy Extension Labels Linkbase Document (furnished herewith) | |
| 101.PRE | XBRL Taxonomy Extension Presentation Linkbase Document (furnished herewith) | |
| 101.DEF | XBRL Taxonomy Extension Definition Linkbase Document (furnished herewith) | |
| * | Management contract or compensatory plan or arrangement |
83
Table of Contents
SIGNATURES
Pursuant to the requirements of Section 13 or 15(d) of the Securities Exchange Act of 1934, the Registrant has duly caused this report to be signed on its behalf by the undersigned, thereunto duly authorized.
| CHINDEX INTERNATIONAL, INC. | ||||
| Dated: March 15, 2012 | By: /S/ Roberta Lipson | |||
| Roberta Lipson | ||||
| Chief Executive Officer (principal executive officer) | ||||
Pursuant to the requirements of the Securities Exchange Act of 1934, this report has been signed below by the following persons on behalf of the registrant in the capacities and on the dates indicated.
| Dated: March 15, 2012 | By: /S/ Kenneth A. Nilsson
Kenneth A. Nilsson
Chairman of the Board | |||
| Dated: March 15, 2012 | By: /S/ Roberta Lipson
Roberta Lipson
Chief Executive Officer and Director
(principal executive officer) | |||
| Dated: March 15, 2012 | By: /S/ Lawrence Pemble
Lawrence Pemble
Chief Operating Officer and Director | |||
| Dated: March 15, 2012 | By: /S/ Elyse Beth Silverberg
Elyse Beth Silverberg
Executive Vice President, Secretary and Director | |||
| Dated: March 15, 2012 | By: /S/ Robert C. Low
Robert C. Low
Senior Vice President of Finance, Chief Financial Officer, and Corporate Controller
(principal financial and accounting officer) | |||
84
Table of Contents
| Dated: March 15, 2012 | By: /S/ Holli Harris
Holli Harris
Director | |||
| Dated: March 15, 2012 | By: /S/ Carol R. Kaufman
Carol R. Kaufman
Director | |||
| Dated: March 15, 2012 | By: /S/ Julius Y. Oestreicher
Julius Y. Oestreicher
Director | |||
85