Attached files
Table of Contents
UNITED STATES SECURITIES AND EXCHANGE COMMISSION
Washington, D.C. 20549
Form 10-K
(Mark One)
| þ | ANNUAL REPORT PURSUANT TO SECTION 13 OR 15(d) OF THE SECURITIES EXCHANGE ACT OF 1934 |
| For the fiscal year ended December 31, 2011 |
or
| ¨ | TRANSITION REPORT PURSUANT TO SECTION 13 OR 15(d) OF THE SECURITIES EXCHANGE ACT OF 1934 |
Commission file number: 001-33790
SoundBite Communications, Inc.
(Exact Name of Registrant as Specified in Its Charter)
| Delaware | 04-3520763 | |
| (State or Other Jurisdiction | (I.R.S. Employer | |
| of Incorporation or Organization) | Identification Number) |
| 22 Crosby Drive | ||
| Bedford, Massachusetts | 01730 | |
| (Address of Principal Executive Offices) | (Zip Code) |
Registrant’s telephone number, including area code:
(781) 897-2500
Securities registered pursuant to Section 12(b) of the Act:
| Title of Each Class |
Name of Each Exchange on Which Registered | |
| Common Stock, par value $0.001 per share | The NASDAQ Global Market |
Securities registered pursuant to Section 12(g) of the Act:
None
Indicate by check mark if the registrant is a well-known seasoned issuer, as defined in Rule 405 of the Securities Act. Yes ¨ No þ
Indicate by check mark if the registrant is not required to file reports pursuant to Section 13 or Section 15(d) of the Act. Yes ¨ No þ
Indicate by check mark whether the registrant (1) has filed all reports required to be filed by Section 13 or 15(d) of the Securities Exchange Act of 1934 during the preceding 12 months (or for such shorter period that the registrant was required to file such reports), and (2) has been subject to such filing requirements for the past 90 days. Yes þ No ¨
Indicate by check mark whether the registrant has submitted electronically and posted on its corporate Web site, if any, every Interactive Data File required to be submitted and posted pursuant to Rule 405 of Regulation S-T during the preceding 12 months (or for such shorter period that the registrant was required to submit and post such files) Yes þ No ¨
Indicate by check mark if disclosure of delinquent filers pursuant to Item 405 of Regulation S-K is not contained herein, and will not be contained, to the best of the registrant’s knowledge, in definitive proxy or information statements incorporated by reference in Part III of this Form 10-K or any amendment to this Form 10-K. þ
Indicate by check mark whether the registrant is a large accelerated filer, an accelerated filer, a non-accelerated filer, or a small reporting company. See the definition of “large accelerated filer,” “accelerated filer” and “smaller reporting company” in Rule 12b-2 of the Exchange Act. (Check one):
| Large accelerated filer ¨ |
Accelerated Filer ¨ | Non-accelerated Filer ¨ | Smaller Reporting Company þ | |||
| (Do not check if a smaller reporting company) |
Indicate by check mark whether the registrant is a shell company (as defined in Rule 12b-2 of the Exchange Act). Yes ¨ No þ
As of March 1, 2012, the aggregate market value of common stock (the only outstanding class of common equity of the registrant) held by non-affiliates of the registrant was $23.7 million based on a total of 9,802,886 shares of common stock held by non-affiliates and on a closing price of $2.42 on June 30, 2011 for the common stock as reported on The NASDAQ Global Market.
As of March 1, 2012, 16,464,504 shares of common stock were outstanding.
Documents Incorporated by Reference
The registrant intends to file a definitive proxy statement pursuant to Regulation 14A within 120 days after December 31, 2011. Portions of such proxy statement are incorporated by reference in Items 10, 11, 12, 13 and 14 of Part III of this annual report on Form 10-K.
Table of Contents
SOUNDBITE is our registered service mark in the United States, and SOUNDBITE AGENT PORTAL, SOUNDBITE DIALOG ENGINE, SOUNDBITE ENGAGE and SOUNDBITE INSIGHT are our service marks. This annual report also includes trademarks, trade names and service marks of other entities.
i
Table of Contents
Forward-Looking Information
This annual report contains, in addition to historical information, forward-looking statements within the meaning of Section 21E of the Securities Exchange Act, including information relating to revenues generated from our services to businesses, our efforts to expand our presence in mobile marketing, our expected gross margins for the foreseeable future, our ability to remain competitive and achieve future growth, information with respect to other plans and strategies for our business, and factors that may influence our revenues for 2012 and thereafter. Words such as “expect,” “anticipate,” “intend,” “plan,” “believe,” “seek,” “estimate” and variations of these words and similar expressions are intended to identify our forward-looking statements. These forward-looking statements are not guarantees of future performance and involve risks and uncertainties including those described in “Item 1A. Risk Factors” and elsewhere in this annual report and that may be described from time to time in our reports filed with the SEC after the filing of this annual report. The forward-looking statements included in this annual report represent our estimates as of the date of this annual report. We specifically disclaim any obligation to update these forward-looking statements in the future, except as specifically required by law or the rules of the SEC. These forward-looking statements should not be relied upon as representing our estimates or views as of any date subsequent to the date of this annual report.
This annual report also contains market data related to the industries in which we operate. These market data include projections that are based on a number of assumptions. If these assumptions turn out to be incorrect, actual results may differ from the projections based on these assumptions. As a result, our markets may not grow at the rates projected by these data, or at all. The failure of these markets to grow at these projected rates may have a material adverse effect on our business, results of operations, financial condition and the market price of our common stock.
1
Table of Contents
| Item 1. | Business |
Overview
We provide cloud-based, multi-channel services that enable businesses to design, execute and measure customer communication campaigns for a variety of marketing, customer care, payment and collection processes. Clients use the SoundBite Engage and SoundBite Insight platforms to communicate proactively with their customers through automated voice messaging, predictive dialing, emails, text messaging and web communications that are relevant, timely, personalized and engaging.
Our services are provided using a multi-tenant, cloud-based architecture that enables us to serve all of our clients cost-effectively. “Cloud-based” refers to the delivery of technology services through the Internet, which includes delivery of software as a service or SaaS. Because our services are cloud-based, businesses using our services do not need to invest in or maintain new hardware or to hire and manage additional dedicated information technology staff. In addition, we are able to implement new features on our platforms that become part of our services automatically and can benefit all clients immediately. Our secure platforms are designed to serve increasing numbers of clients and growing demand from existing clients, enabling the platforms to scale reliably and cost-effectively.
We serve two global markets: hosted contact centers and mobile marketing. Our hosted contact center services are used primarily by companies in the accounts receivable management (or collections), energy and utilities, financial services, retail, and telecommunications and media industries. Our mobile marketing client base consists principally of companies in the consumer package goods, retail, and telecommunications and media industries.
In 2011 our services were used by more than 400 businesses located in the United States and Europe, including approximately 25 Global 500 and 50 Fortune 500 companies. These businesses included 7 of the 10 largest global issuing banks, 5 of the 10 largest U.S. telecommunications and media providers, 5 of the 10 largest U.S. retailers, 12 of the 20 largest U.S. utility providers, and approximately 60 accounts receivable management agencies. We use our direct sales channel principally to target large business-to-consumer companies, and we leverage our partnership channel to offer our services more broadly within our target markets, to enter new vertical markets, to augment our international expansion and to sell to smaller businesses cost effectively.
We were founded in Delaware in April 2000. Our principal executive offices are located at 22 Crosby Drive, Bedford, Massachusetts 01730, and our telephone number is +1 781 897 2500. Our website address is www.soundbite.com. We are not, however, including the information contained on our website, or information that may be accessed through links on our website, as part of, or incorporating it by reference into, this annual report.
Industry Background and Trends
Improving customer communications is a key strategy by which businesses can increase revenue, drive market share and control operational costs. Businesses operate contact centers to serve as central points from which they can manage all customer contacts. A customer contact center typically includes one or more online call centers and also may include other types of customer contact such as email, postal mail, website inquiries and social media.
Traditionally, businesses have focused their customer contact centers on responding quickly and effectively to consumer inquiries and requests. A business cannot, however, afford to simply wait to be contacted by consumers. In recent years, increased competition, heightened expectations for — and costs of — customer service, dynamic regulatory environments, and a weakened economy have been helping to drive the implementation
2
Table of Contents
of “proactive” communication solutions that can help businesses increase customer loyalty and satisfaction and generate more revenue at a lower cost.
Development of Mobile Marketing
At the same time as they are seeking to address changing market dynamics, businesses have been trying to respond to — and take advantage of — continuing technological developments, most notably the emergence of mobile phones, smartphones, tablet computers and other mobile devices as the primary communications device of consumers worldwide. In an October 2011 publication, the International Telecommunication Union estimated that there would be close to 6 billion mobile cellular subscriptions around the world as of December 31, 2011. Consumers increasingly rely on their mobile devices and mobile device applications and no longer consider the home phone, if it exists, as their primary communications devices.
Mobile devices provide access to multiple communications channels, and consumers increasingly access and exchange information over a variety of communications channels, including email, text messaging, web, instant messaging, social media and voice. Moreover, as consumers have gained experience with the multiple communications channels offered by their mobile devices, they increasingly are developing and expressing preferences for the types of communications they wish to receive and the channels over which those communications are to be received.
By communicating with consumers through different channels and honoring customer communications preferences, businesses can provide relevant and timely information to consumers effectively and efficiently and can achieve higher response rates, stronger customer relationships and improved customer experiences — all of which can result in increased revenue and profitability.
In response to the trend across all demographics to utilize their mobile device as their primary communications device, businesses have increasingly sought to leverage the mobile medium as a means of communication to consumers. ABI Research estimated in the second quarter of 2011 that U.S. mobile marketing and advertising revenues totaled $1.6 billion in 2011 and will grow to $4.5 billion in 2015, representing a compound annual growth rate of 29%. Gartner projected in April 2011 that worldwide mobile advertising revenues will grow from $3.3 billion in 2011 to $20.6 billion in 2015, representing a compound annual growth rate of 58%.
Emergence of Hosted Contact Centers
Over the past several years, businesses have been able to begin communicating with customers proactively due not only to the proliferation of mobile devices but also to the emergence and enhancement of technologies that enable businesses to initiate outbound messages to consumers rather than waiting to respond to inbound consumer inquiries. Outbound messaging initially became feasible through the introduction of on-premise predictive dialers. On-premise predictive dialers are, however, costly to implement and maintain.
More recently, many contact center vendors have begun to offer hosted services that are alternatives to on-premise solutions and are delivered via the cloud in order to improve the time to deployment, reduce the maintenance burden and expedite the delivery of new features that can integrate seamlessly into an existing technology infrastructure. Hosted contact center solutions can support the automated placement of outbound consumer contacts using automated voice messaging, predictive dialing, email and text messaging. Based on third-party reports, we estimate that revenues from hosted outbound customer contact applications totaled $220 million in 2011 and will grow to $425 million in 2015, representing a compound annual growth rate of 18%.
Requirements of Proactive Communication
In order to establish and build trusted, long-term, profitable relationships with customers, businesses increasingly require a comprehensive solution that will enable them to communicate proactively throughout the
3
Table of Contents
customer life-cycle via marketing, customer care, payments and collections applications. With a proactive communication, a business can send a timely message to a consumer’s preferred access device using one or more communications channels. The consumer can respond immediately over his or her preferred communications channel. By proactively communicating timely and relevant information to their customers, businesses can increase customer satisfaction and loyalty to drive revenue and reduce inbound communications, resulting in operational cost savings.
A proactive communication solution must enable businesses to manage all digital communications through key channels such as voice, text, email and the web, and must be designed with the ability to add support for other channels as they emerge and gain broad-based market acceptance. The solution must offer businesses the flexibility to use the most appropriate channel based on a customer’s communication preferences, the channel’s efficacy, the message content and other business goals. The solution should provide a business with a unified view of its customers’ communications in order to facilitate consistent and personalized communications at every stage in the customer lifecycle. It should have the ability to capture and manage an increasing variety of both customer and client preferences related to the communication outreach. In addition, the solution should increase contact center efficiencies not only by further increasing the productivity of contact center agents, but also by facilitating “agent-less” communications where appropriate.
In order to support coherent, preference-based multi-channel communications, a communications solution should be delivered using a multi-tenant, cloud-based model. This model enables proactive communications to be delivered and deployed to a business quickly and cost-effectively. Moreover, this model can provide the flexible, robust architecture needed to respond to — and take advantage of — current and future technological advances and customer communication trends.
Our Solution
We provide cloud-based, multi-channel services that enable businesses to design, execute and measure customer communication campaigns for a variety of marketing, customer care, payment and collection processes. Clients use the SoundBite Engage and SoundBite Insight platforms to communicate proactively with their customers through automated voice messaging, predictive dialing, text, email messages and web communications that are relevant, timely, personalized and engaging.
Our multi-channel communications platform, SoundBite Engage, enables clients to design, execute and measure customer communications across the customer lifecycle. Our preference management platform, SoundBite Insight, helps businesses design relevant and targeted customer communications strategies. SoundBite Insight centralizes the ongoing tracking and management of consumer profile data, stated preferences and observed customer behavior. Our client management team assists clients in selecting service features and adopting best practices that enable them to use our multi-channel cloud-based platforms effectively. We offer performance analytical capabilities to assist clients in improving the design and execution of their campaigns. Our secure platforms are designed to scale reliably and cost-effectively.
Key benefits of our services for clients include:
Acquisition and Segmentation of Customers. Businesses can use our services to support a variety of marketing programs targeted at converting consumers to customers. Market realities and regulatory restrictions can make it difficult for businesses to communicate with consumers who are not customers. Our services support the efforts of a business to obtain “opt-in” consents that will allow the business to communicate with a potential customer and make that consumer a customer. Once a customer is acquired, the business can use our services to identify segments of customers that the business wishes to target with a particular program.
Unified Communications Across Multiple Channels. Using our services, a business can interact with its customers by automated voice messaging, predictive dialing, text, web or email, or by blending a combi-
4
Table of Contents
nation of those channels. As a result, the business can select a channel or channels based on a combination of a customer’s channel preferences, the channel’s efficacy, the message content and other business goals.
Lower Total Cost of Ownership. Our services do not require a business to invest in or maintain new hardware, or to hire and manage dedicated information technology staff. Because new features are implemented on our cloud-based platforms, those features become part of our services automatically and benefit clients immediately.
Automation of Communications. Businesses can reduce their contact center expense by using our services to fully automate a variety of customer communications, ranging from simple one-way notifications to more sophisticated customer interactions such as surveys or payments.
Improvement of Contact Center Performance. Our services automate many of the routine tasks otherwise handled by a contact center agent, thus reducing operating costs and freeing agents to focus on more significant tasks. By intelligently routing messages to the appropriate agent, our services provide those agents with access to customer data and alternative channels to interact with customers, thereby increasing agent productivity.
Burstable Capacity. Our services can initiate more than one million outbound messages each hour. This capacity enables clients to “burst” extremely large campaigns during short time periods, when customers are most likely to be responsive.
Rapid Initiation and Modification of Campaigns. A new client can initiate its first campaign using our services in a period as short as a week, using only its existing contact center infrastructure and Internet connections. New clients avoid the delay associated with installing the hardware and software required for an on-premise solution. Using the performance analytics of our services, clients can improve the design and execution of existing campaign strategies immediately by self service or quickly through our professional services organization.
Our Strategy
Our objective is to become the leading global provider of multi-channel customer communications solutions. To achieve this goal, we are pursuing the following:
Target Mobile Marketing Opportunities. Our platforms offer a wide array of features that facilitate interactive communications between clients and their customers, including automated and agent-assisted customer dialog over multiple delivery channels. In June 2011 we acquired key assets of SmartReply, a provider of text messaging and mobile communications solutions, and in February 2012 we acquired 2ergos Americas, a provider of mobile business and marketing solutions. In February 2012 we also added comprehensive support for the web channel to SoundBite Engage, and we will continue to enhance our services to provide additional interactive mobile messaging capability.
Expand Internationally. In recent years, we have enhanced our services to enable the delivery of multi-channel proactive customer communications in countries outside of North America. We now offer support for 40 countries. We will continue to invest in marketing and selling our services internationally, both directly and through partners, in order to broaden and deepen relationships we have established as well as to expand our penetration into new clients and resellers.
Extend Technology Leadership. In 2011 we released multiple updates to the SoundBite Engage platform that improved internationalization support, introduced support for the web channel, and enhanced our voice channel offering by adding support for preview and progressive dialing, session transfer and call recording. In 2012 we intend to broaden our hosted customer contact offerings by con-
5
Table of Contents
tinuing to enhance the SoundBite Engage and SoundBite Insight platforms through additional capabilities for the voice channel, extended support for self-service for the text channel, and advanced support for the web channel. We also intend to broaden our service offerings based upon core technology obtained through our acquisition of 2ergo Americas in February 2012.
Extend Indirect Channel. In 2009 we made a strategic decision to begin partnering with resellers, solution providers, original equipment manufacturers or OEMs, and international distributors in order to broaden our distribution reach. Our Business Partner Program enables us to offer our services more broadly within our target markets, to enter new vertical markets, to augment our international expansion, and to sell cost effectively to smaller businesses. We will seek to increase our revenues from the indirect channel by both leveraging existing relationships and selectively recruiting additional new partners.
Selectively Seek Strategic Acquisitions. To complement and accelerate our internal growth, we will selectively pursue acquisitions of businesses, technologies and products that will provide access to new markets or clients, expand the feature set of our services, or otherwise complement our existing operations. We have accelerated our growth in mobile marketing through our acquisition of key assets of SmartReply in June 2011 and our acquisition of 2ergo Americas in February 2012.
Our Services
We provide cloud-based, multi-channel services that enable businesses to design, execute and measure customer communication campaigns for a variety of marketing, customer care, payment and collection processes. Clients use the SoundBite Engage and SoundBite Insight platforms to communicate with their customers through automated voice messaging, predictive dialing, text, email messages and web communications that are relevant, timely, personalized and engaging.
Our multi-channel communications platform, SoundBite Engage, enables clients to design, execute and measure customer communications across the customer lifecycle. Our preference management platform, SoundBite Insight helps businesses design relevant and targeted customer communications strategies. SoundBite Insight centralizes the ongoing tracking and management of consumer profile data, stated preferences and observed customer behaviors.
Our services are provided using a multi-tenant architecture, which enables us to serve our clients cost-effectively. To use our services, a business does not need to invest in or maintain new hardware or to hire and manage additional dedicated information technology staff. In addition, we are able to implement new features on our platforms that become part of our services automatically and can benefit all clients immediately. As a result, a new client can begin using our services within a week and take advantage of new features as they become available.
Our secure platforms are designed to serve increasing numbers of clients and growing demand from existing clients, enabling the platforms to scale reliably and cost-effectively. We provide our services under a combination of usage- and subscription-based models.
SoundBite Insight
Clients use the SoundBite Insight platform to design relevant and targeted proactive customer communications that can improve business results. SoundBite Insight helps businesses create a comprehensive view of their customer communications by centralizing the ongoing tracking and management of consumer profile data, stated preferences and observed consumer behaviors.
Designed to enable quick implementation and results, the cloud-based SoundBite Insight platform has the flexibility and scalability to be deployed on a departmental or enterprise-wide basis. It supports the growing needs of businesses seeking to manage and honor changing customer communications preferences.
6
Table of Contents
The following diagram illustrates the key elements of the SoundBite Insight platform:
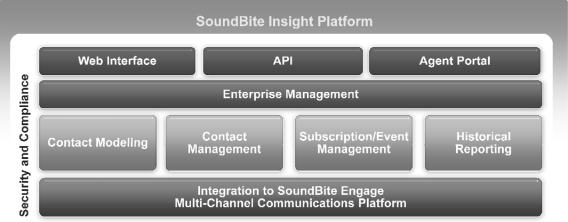
Client Access Layer. Clients access SoundBite Insight using one of the following secure interfaces:
Client Web Interface enables a client, using a web browser, to prime contact lists, manage individual contacts and generate near real-time reports. All of the SoundBite Insight features can be accessed through this secure, easy-to-use interface, which makes the service available to clients on a self-service basis.
Web Services API allows a client’s systems to interact directly with SoundBite Insight and permits the SoundBite Engage platform to interrogate SoundBite Insight for data related to the current interaction. Web Services API is an application programming interface that provides clients with the ability to exchange information directly with any customer relationship management system.
Agent Portal is a web-based user interface that enables an agent to access and manage limited data pertaining to an individual customer. The agent can use this interface to manage each customer’s attributes, such as opt-ins.
Enterprise Management. This component provides a client with the ability to manage access and identity across the SoundBite Insight platform.
Core Components. The SoundBite Insight platform includes the following core components, each of which can be accessed via the web or by integrating a client’s customer management system with the platform:
Contact Modeling manages the importing and updating of a client’s model of its customer. This component enables a client to define the particular attributes of each customer that need to be captured or managed. These attributes consist of the following:
| Ÿ | Consumer Profile Data are common across all clients and include, for example, consumer identification, last name, first name and date of birth, together with a set of client-specific attributes. These data may be preloaded and reflect the universe of customers with a relationship to the client. |
| Ÿ | Stated Preferences are provided by customers and typically are collected over time. For example, a customer’s opt-in consent on a text channel is an attribute that, once captured, enables the client to target the customer for an outbound campaign. As a business builds its opt-in consent databases, SoundBite Insight can capture and record the customer consents in order to enable the business to comply with Federal Trade Commission and other applicable regulations. |
7
Table of Contents
| Ÿ | Observed Consumer Behaviors are those attributes that are inferred from examining consumer behavior. For example, if a consumer never responds to an outbound email but regularly responds to text, we could record this fact as a channel affinity attribute. |
Contact Management enables a client to review and update the attributes of a particular customer.
Subscription and Event Management defines the set of subscriptions and events that a consumer can subscribe to receive. For example, a client may define an event that reflects a late departure of an airline flight and a consumer could elect to subscribe to text notifications of the event on the consumer’s mobile device.
Historical Reporting provides a client with reports in a variety of formats that can be exported at any time. These reports typically include details regarding consumer profile data, stated preferences and observed consumer behaviors. These types of reports often are used to review the performance of other marketing campaigns in order to provide insight into the number of opt-ins consents received with respect to a particular campaign.
SoundBite Engage
Clients use the SoundBite Engage platform to create and manage integrated, multi-channel customer communication campaigns for a variety of marketing, customer care, payments and collections processes. A campaign is a series of communications with a targeted group of customers, typically for a defined period of time. The targeted group is identified by a contact list containing customer-specific attributes, including first and last names, telephone numbers, email addresses and other information specific to the campaign. A campaign often encompasses multiple passes through the contact list. Campaigns can be conducted using contact center agents or on an agent-less basis. Sample campaigns include:
| Marketing |
Customer Care |
Payments | Collections | |||
| • Loyalty programs |
• Delivery notifications | • Payment reminders | • Contingent collections | |||
| • Promotions |
• Program enrollment | • Self-service payments | • Early-stage collections | |||
| • Service activations |
• Surveys | • Expedited payments | • Settlement offers |
The following diagram illustrates the key elements of the SoundBite Engage platform:
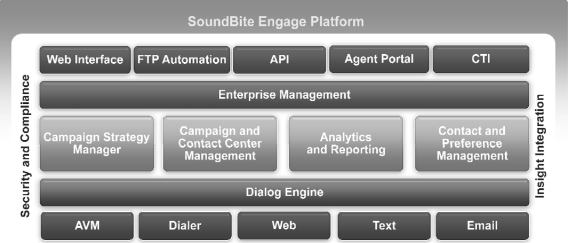
Client Access Layer. Clients access SoundBite Engage using one of the following secure interfaces:
Client Web Interface enables a client, using a web browser, to upload contact lists, initiate and manage campaigns, and generate near real-time customized reports. All of the platform features can be accessed
8
Table of Contents
through this secure, easy-to-use interface, which makes the SoundBite Engage service available to clients on a self-service basis.
FTP Automation facilitates a client’s uploading of contact lists and other information by providing the ability for a client to transfer at a pre-determined time a file using a variety of transfer protocols. Protocols supported include FTP, FTPS and SFTP.
Web Services API allows a client’s systems to interact directly with the SoundBite Engage platform. Web Services API is an application programming interface that provides clients with the ability to load information directly from any customer information management system. This approach also enables additional applications, such as fraud notifications and enhanced computer telephony integrations, that rely on real-time data exchange.
Agent Portal is a web-based user interface that enables automated and agent-assisted interactive customer communications over the voice and text messaging channels. Clients use Agent Portal in concert with predictive dialing or to support messages that, because of message content or business rules, are best handled by a customer support agent. Agent Portal allows agents to log in and to interact with customers in near real-time and to transfer a customer to another agent. SoundBite Engage can seamlessly transition between fully automated and agent-assisted dialogs, and supervisors can monitor agent activity as well as overall campaign status.
CTI Connect bridges a client’s contact center infrastructure to the SoundBite Engage platform, enabling a high-quality customer service experience while reducing operational costs. Through computer telephony integration, or CTI functionality, contact centers can match caller needs to agent resources and easily integrate functions such as screen pops, intelligent call routing and dynamic call pacing.
Enterprise Management. This component provides a client with the ability to manage, using a single control panel, all campaigns in any of the client’s accounts. Accounts and privileges can be created and customized at the enterprise level for greater security. The Enterprise Management component allows a client to share interaction scripts and suppression lists across the client’s entire enterprise and reports covering all of the client’s accounts can be provided on an enterprise-wide basis.
Core Components. The SoundBite Engage platform includes the following core components, each of which can be accessed via the web or by integrating a client’s customer management system with the platform:
Contact and Preference Management manages the importing and accessing of a client’s contact list. This component also manages contact suppression, which removes one or more contacts from a campaign either before the campaign begins or while the campaign is progressing. For example, contacts may be suppressed due to a customer who previously expressed a preference not to receive the proposed type of communication or a recipient who takes the requested action before all of the passes within a campaign are completed.
Campaign Strategy Manager defines the frequency and nature of the customer interactions to be employed to achieve the goals of a campaign. This component includes the following features:
| Ÿ | Flexible Scripting Languages control client interactions and enable those interactions to be highly personalized and dynamic in nature. |
| Ÿ | Multi-Pass Campaigns effects multiple overlapping passes through a contact list in accordance with client-defined parameters, in order to maximize contact list penetration and response rates. These passes may span different channels and occur over multiple days, and they can define the escalation conditions in which our services move to a different phone number or email address within a campaign. |
9
Table of Contents
| Ÿ | Contact Ordering prioritizes contacts based on client-specified criteria or on the likelihood that customers will be reached at a particular time. |
Campaign and Contact Center Management supports the initiation and management of campaigns. For those campaigns that require agents, this component manages the routing of qualified customers to agents and seeks to maximize the use of agents’ time while minimizing customers’ wait time. This component includes the following features:
| Ÿ | Pacing provides a client with the ability to select a model to control the rate of outgoing messages. The model selected may be either fixed-rate, time-based (rate determined by a time window) or agent-based. For Pacing involving contact center agents, adjustments are made based on factors such as agent availability, current abandon rate, average talk time and average hold time. |
| Ÿ | Call Forecasting provides continuously refreshed data concerning current and anticipated future contact attempts. Contact center managers use the data for contact center agent resource planning. |
| Ÿ | Contact Center Reports, which are available in near real-time, provide details on customer interactions with contact centers and furnish performance metrics related to contact center performance. |
Analytics and Reporting produces reports in a variety of formats that can be exported at any time during or after a campaign. We offer flexible report formatting, scheduling and delivery options. Reports typically contain details regarding contact attempts and outcomes. Reports are available for a specific campaign or for all of the campaigns of a department, group or other client account. This component also includes performance analytics capabilities to assist clients in improving the design and execution of their campaigns. For example, a client might determine, based on our analysis of campaign data, that the client’s next campaign should be executed at a different time of day or should target wireless customers via text rather than voice.
Dialog Engine tests and manages any number of contact scripts to be used to determine the content presented during customer interactions. In a telephone call, for example, a script specifies the sequence of audio prompts that are played and the step or action to result when a customer takes a particular action, such as pressing a button on the telephone or saying “yes.” An individual customer interaction is supported by a flexible scripting language and personalized messaging. Scripts can be modified and repurposed over time. Our personalized voice messages use professional voice talent recordings or text-to-speech technology to insert customer-specific information into an interaction. In a typical text interaction, a script may specify the action to be taken based upon a customer’s response to an initial outbound text message, such as requiring some form of authentication. This component supports the following activities:
| Ÿ | Automated Right-Party Verification enables the identity of a customer to be verified without contact center agent involvement by, for example, having a recipient enter a billing zip code. |
| Ÿ | Direct Connect to Contact Center allows a voice recipient to connect directly to a contact center in order to speak with an agent. |
Delivery Channels. The SoundBite Engage platform supports automated voice messaging, inbound voice, predictive dialing, outbound and inbound text (both standard and Free-to-End User or FTEU), web and outbound email communications. The predictive dialing channel supports both predictive and preview dialing. An outbound voice or text channel can be used for either a contact center agent-assisted or an agent-less campaign. An inbound channel typically is used in support of outbound campaigns or as part of an inbound-only agent-less campaign. These delivery channels can be used individually or combined on the SoundBite Engage platform.
Security and Compliance. Our SoundBite Insight and SoundBite Engage platforms include a number of security features designed to keep customer data safe and confidential, such as encryption of sensitive data, secure
10
Table of Contents
transmission, audit trails, non-shared accounts, need-to-know access policies and formal incident response. Clients can elect to use supplemental security features such as email and FTP address restrictions for report deliveries and encryption of reports. Compliance management provides a client with the ability to define a set of rules to control when a customer is contacted based on the customer’s location, which is determined either by reference to the phone number being contacted or by reference to the address of the customer. In September 2011, we renewed our compliance status as a Payment Card Industry Data Security Standard, or PCI/DSS, compliant Level 1 Service Provider, which enables us to work closely and exchange extensive data with banks and credit card companies. We have registered with the U.S. Department of Commerce and incorporate the European Union Safe Harbor Principles relating to the protection of personal data. In addition, we have instituted periodic internal and third-party reviews of our security structure, including an annual voluntary external Type II audit of our information technology-related control activities for our platforms under the Statement on Auditing Standards for Attestation Engagements No. 7016, also referred to as Service Organization Control No. 1, Reports on the Processing of Transactions by Service Organizations.
Our Client Management Services
Our client management organization helps clients select service features and adopt best practices that will enable the clients to use our multi-channel services effectively. This organization provides varying levels of support, such as managing entire campaigns, providing best practice recommendations and supporting self-service clients. It offers a range of services that includes script development, campaign strategy, professional voice talent recording, custom reporting and detailed analysis of campaign results. By hiring former employees of SmartReply and retaining employees of 2ergo Americas, we have augmented our client management services in mobile marketing to include strategic services that enable our clients to grow their mobile marketing databases and then leverage those databases with investment in marketing programs that can provide high returns on investment. At March 1, 2012, our client management organization had 45 employees.
Our client management organization consists of three principal teams:
Enterprise Program Directors help key clients fully understand their customer communications needs and then assist those clients in designing solutions to meet defined goals. This team works with sales personnel to help design successful program strategies and ensure effective execution. The team also works directly with prospective and existing clients to determine the most effective use of our platforms in their businesses. Demonstrations of our platforms are used to highlight features and functionality that are available in current or will be available in future releases.
Professional Services members provide implementation services and project management, including detailed requirements gathering, test, design and setup script development, voice talent recording, and all aspects of file interchange. This team builds and maintains a library of best practices based upon experience gained in helping design and optimize campaigns.
Training, Documentation and General Help Desk members provide clients with training both initially and on a continuing basis, in order to assist the clients in using our services more effectively and efficiently. Training modules include self-paced tutorials, on-line job aids and live instructor led classes. Our help desk is available around-the-clock to provide immediate support to clients.
Business Segments and Geographic Information
We manage our operations on a consolidated, single operating segment basis for purposes of assessing performance and making operating decisions. Accordingly, we have only one reporting segment. Businesses in the United States accounted for more than 90% of our revenues in 2011 and substantially all of our revenues in each of 2010 and 2009.
11
Table of Contents
Clients
We target companies in industries that are characterized by the need for regular interactions with large consumer bases throughout all of the phases of the customer lifecycle. Our Hosted Contact Center services are used primarily by companies in the accounts receivable management (or collections), energy and utilities, financial services, retail, and telecommunications and media industries. Our Mobile Marketing client base consists principally of companies in the consumer package goods, retail, and telecommunications and media industries.
In 2011 our services were used by more than 400 businesses located in the United States and Europe, including approximately 25 Global 500 and 50 Fortune 500 companies. Our clients include approximately 60 accounts receivable management agencies. Our services are used by a number of the largest business-to-consumer companies (measured by revenue) in our targeted industries, including:
| Ÿ | 7 of the 10 largest global issuing banks; |
| Ÿ | 5 of the 10 largest U.S. retailers; |
| Ÿ | 5 of the 10 largest U.S. telecommunications and media providers; and |
| Ÿ | 12 of the 20 largest U.S. utility providers. |
We use our direct sales channel principally to target large business-to-consumer companies, and we leverage our partnership channel to offer our services more broadly within our target markets, to enter new vertical markets, to augment our international expansion and to sell to smaller businesses cost effectively.
We provide our services under a combination of usage- and subscription-based models. Our pricing agreements with the significant majority of our clients do not require minimum levels of usage or payments.
T-Mobile USA, Inc., a provider of mobile telephone services, and NCO Group, a provider of business process outsourcing services, each accounted for more than ten percent of our revenues in each of 2011, 2010 and 2009. Neither T-Mobile USA, Inc. nor NCO Group accounted for twenty percent or more of our revenues in any of those years.
Sales and Marketing
We offer our services principally through our industry-aligned direct sales force. Sales leads are generated through cold calling, client and other referrals, and a variety of marketing programs. Once a lead is qualified, the sales process typically involves a web-based or in-person presentation and demonstration, together with pre-sales support from our client management organization. These presentations focus on explaining the benefits of our service offerings, including the speed with which the services can be deployed and demonstrating the potential return on investment from the use of our services. We encourage prospective clients to engage in a pilot campaign to evaluate the efficacy of our services. As of March 1, 2012, our direct sales force consisted of 24 employees located in the United States and the United Kingdom.
In order to broaden our distribution reach, we also offer our services through an indirect channel comprised of resellers, solution providers, OEMs and international distributors. Using our Web Services API, OEMs can integrate their applications into the SoundBite Engage platform. Since we launched our Business Partner Program in January 2009, our indirect channel has enabled us to offer our services more broadly within our target markets, enter new vertical markets, augment our international expansion and sell to smaller businesses cost effectively. During 2011, we continued to successfully transition to certain partners a number of smaller clients that were better suited working with a channel partner and added a number of resellers both in the U.S. and internationally.
12
Table of Contents
Our marketing communications and programs strategy has been designed to increase awareness of our services, generate qualified sales leads and expand relationships with existing clients. We reinforce our brand identity through our website and public relations, which are intended to build market awareness of our company. We host webinars, sponsor white papers, build relationships with leading analysts, and participate in industry events and associations. We distribute communications to prospects and to our clients through social media networks such as Twitter and Facebook. At March 1, 2012, our marketing group had 7 employees.
Our sales and marketing expenses totaled $14.1 million in 2011, $14.2 million in 2010 and $14.8 million in 2009.
Technology, Development and Operations
Technology
We launched our first multi-tenant, cloud-based service in 2000. Our services are provided through a secure, scalable platform written primarily in Java using the Java 2 Enterprise Edition, or J2EE, development framework. We use a combination of proprietary and commercially available software, including Apache web servers, Oracle WebLogic and JBoss application servers, Nuance text-to-speech and automated speech recognition software, and Oracle and MySQL databases. The software runs primarily on Linux servers.
Our services manage clients as separate tenants within our platforms. As a result, we amortize the cost of delivering our services across our entire client base. In addition, because we do not have to manage thousands of distinct applications with their own business logic and database schemas, we believe that we can scale our solution faster than on-premise solutions.
Our services enable clients to import and access data independent of format and to customize the script interaction and reporting output of their campaigns. The web user interface of our platforms can be customized for a client that wishes to have a specific “look and feel” across its enterprise.
Research and Development
Our research and development organization is responsible for developing new features and other new offerings for our platforms. The research and development organization also is responsible for performing platform functionality and load testing, as well as quality assurance activities. The organization currently is working on a number of enhancements, including work related to further enhancement of the SoundBite Engage and SoundBite Insight platforms through additional capabilities for the voice channel, extended support for self-service for the text channel, and advanced support for the web channel. In addition the organization is continuing to enhance the scalability and reliability of our core platforms. At March 1, 2012, our research and development organization had 38 employees.
Our research and development expenses totaled $6.1 million in 2011, $5.9 million in 2010 and $5.6 million in 2009.
Operations
We serve our clients from five third-party hosting facilities. One facility is located in Ashburn, Virginia, and is leased under an agreement that expires in March 2012. Another facility is located in Somerville, Massachusetts, and is leased under an agreement that expires in May 2012. Our agreements for these two facilities automatically renew for one-month periods under current terms unless written notification is made by either party 90 days prior to renewal. Our third hosting facility is located in Slough, United Kingdom and leased under an agreement that automatically renews for twelve-month periods unless written notification is made by either party three months prior to the expiration date. Our fourth facility is located in Las Vegas, Nevada and is leased under
13
Table of Contents
an agreement that automatically renews for monthly periods unless written notification is made 30 days prior to the expiration date. Our fifth facility, which also is located in Ashburn, Virginia, is leased by 2ergo Americas under an agreement that expires in 2014.
Facilities in the United States and United Kingdom have multiple Tier 1 interconnects to the Internet and are connected by a SONET ring. All of the hosting facilities provide around-the-clock security personnel, video surveillance and biometric access screening, and are serviced by uninterrupted power supplies, which are backed up by diesel-electrical generators for extended power loss. Each facility employs fire detection apparatus as well as dry-pipe pre-action fire suppression systems. We maintain insurance policies covering substantially all of the assets deployed at our hosting facilities. For information regarding the facility locations, operators and agreement terms, see “Item 2. Properties.”
We have multiple telecommunication carriers for voice termination, including Global Crossing, Level 3, Qwest and Equinix. We have selected our mix of telecommunication carriers to limit service interruptions, even in the event of a localized loss of a major provider.
We own all the hardware deployed in support of our platforms, except that we lease certain equipment at the third-party hosting facility used by 2ergo Americas. We continuously monitor the performance and availability of our services. We designed our service infrastructure using load-balanced service pools, redundant interconnected network switches and firewalls, clustered application servers and fault-tolerant storage devices. Production databases are backed up on a daily basis to ensure transactional integrity and restoration capability.
We have deployed a security infrastructure that includes internal and perimeter firewalls, network intrusion detection, and host intrusion detection systems. We maintain on-site as well as off-site third party log-aggregation services for audits and forensics. All inter-site connectivity is over a private wide area network. We perform at least three internal vulnerability scans of our production equipment every week. See “— Our Services — Security and Compliance” above.
We have service level agreements or arrangements with a small number of clients under which we warrant certain levels of system reliability and performance. If we fail to meet those levels, those clients are entitled to either receive credits or terminate their agreements with us. We did not provide any material credits in 2011, 2010 or 2009 pursuant to any service level provisions.
At March 1, 2012, our operations organization had 10 employees.
Competition
The market for our service offerings is intensely competitive, changing rapidly and fragmented. The following summarizes the principal products and services that compete with our hosted contact center and mobile marketing services.
On-Premise Predictive Dialers
Our voice service competes with on-premise predictive dialers from established vendors such as Aspect and Avaya as well as a number of smaller vendors. Our voice service competes with on-premise predictive dialers on the basis of both available features and delivery model, including:
| Ÿ | breadth of features; |
| Ÿ | speed of deployment; |
| Ÿ | capital investment required; |
14
Table of Contents
| Ÿ | pricing model for customers; and |
| Ÿ | capacity, including burstability. |
A number of predictive dialer vendors offer forms of hosted solutions, which we believe are typically services in which predictive dialers are hosted by first-generation application service providers, or ASPs, rather than on a multi-tenant basis. We believe these ASP-hosted services are deployed on individual servers and application infrastructures, using dedicated predictive dialers. We compete with ASP-hosted predictive dialer services on the same basis as on-premise predictive dialers, except that deployment speed and required capital investment are less significant in differentiating our services from these ASP-hosted services.
Predictive dialers have been the basic method of automated customer communications for the last two decades, particularly for collections activity. The vast majority of telephony customer contact today is completed using predictive dialer technology. Many businesses are likely to continue using on-premise predictive dialers that have been purchased and are still operative, despite the availability of new features and functionality in alternative services.
Some vendors of predictive dialers, particularly Aspect and Avaya, have significantly greater financial, technical, marketing, service and other resources than we have. Many of these vendors also have larger installed client bases and longer operating histories. Competitors with greater financial resources may be able to offer lower prices, additional products or services, or other incentives that we cannot match or offer. These competitors may be in a stronger position to respond quickly to new technologies and may be able to undertake more extensive marketing campaigns.
Hosted Customer Communications Solutions
Our services compete with a number of hosted customer communications solutions in both the hosted contact center and mobile marketing markets. Most vendors of hosted customer communications solutions focus on providing a basic service with limited features and compete principally on the basis of price. These vendors consist principally of a number of relatively small, privately held companies and a small number of larger, multi-product line companies such as CSG Systems, Nuance Communications and West Corporation. We compete with these vendors on the basis of the following:
| Ÿ | return on investment; |
| Ÿ | breadth of features; |
| Ÿ | price; |
| Ÿ | brand awareness based on referenceable customer base; and |
| Ÿ | security and reliability. |
We also compete directly with a small number of vendors in the customer communications and hosted contact center market, such as Adeptra and Varolii, that deliver services utilizing one or more channels on a SaaS delivery model similar to ours.
In the past few years, there have been a number of new entrants in the hosted customer communications market. Most of these new entrants offer basic, price-oriented customer communications services hosted on an ASP model. We believe that companies wishing to target this portion of the market may seek to acquire existing vendors. It is likely any such acquiring companies would have greater financial, technical, marketing, service and other resources than we have and may be able to offer lower prices, additional products or services, or other incentives that we cannot match or offer.
15
Table of Contents
Mobile Marketing Solutions
The market for mobile marketing solutions is developing rapidly and highly fragmented, and we compete with a wide array of companies in selling our mobile marketing offering. For example, we compete with a large number of vendors that focus on providing point solutions, each of which addresses a specific element of the mobile marketing solution set. These vendors typically compete on the basis of technology features and price. Some vendors focus on providing packaged solutions that target a broader range of mobile marketing and advertising applications. These vendors generally compete on the basis of the breadth of their offerings and the return on investment. For example, our mobile marketing offering competes directly with mobile marketing applications provided by Augme Technologies (in part through its acquisition of HipCricket in August 2011), Lenco Mobile (principally through its acquisition of iLoop Mobile in December 2011) and Velti. We compete with these vendors based on the breadth of our multi-channel functionality, our strategic client management services, the flexibility of our pricing model and our referenceable client base.
Intellectual Property
Our success depends in part on our ability to protect our intellectual property and to avoid infringement of the intellectual property of third parties. We rely on a combination of trade secret laws, trademarks and copyrights in the United States and other jurisdictions, as well as contractual provisions and licenses, to protect our proprietary rights and brands. We cannot, however, be sure that steps we take to protect our proprietary rights will prevent misappropriation of our intellectual property.
We have adopted a strategy of seeking patent protection with respect to certain technologies used in or relating to our products. We have three issued U.S. patents, which relate to: (a) a voice message delivery method and system (patent number U.S. 6,785,363 B3) that was issued in August 2004 and will expire in January 2021; (b) an address book for a voice message delivery method and system (patent number U.S. 6,829,331 B2) that was issued in December 2004 and will expire in January 2022; and (c) answering machine detection for voice message delivery and system (patent number U.S. 7,054,419) that was issued in May 2006 and will expire in April 2021. We have eleven pending U.S. patent applications that relate to the optimization of interactive communications campaigns and the provision of messages to mobile devices in an enterprise-centric architecture. Additionally, we evaluate ideas and inventions for patent protection with a team of engineers and product managers, in consultation with our outside patent counsel. We expect to file additional patent applications in the ordinary conduct of our business.
“SoundBite” is our sole registered service mark in the United States. We have unregistered service marks identifying some of our service offerings. None of our unregistered service marks is material to our business. We seek to protect our source code for our platforms, as well as documentation and other written materials, under trade secret and copyright laws.
We may not receive competitive advantages from the rights granted under our intellectual property rights. Others may develop technologies that are similar or superior to our proprietary technologies or duplicate our proprietary technologies. Our pending and any future patent applications may not be issued with the scope of claims sought by us, if at all, or the scope of claims we are seeking may not be sufficiently broad to protect our proprietary technologies. Our issued patents and any future patents we are granted may be circumvented, blocked, licensed to others or challenged as to inventorship, ownership, scope, validity or enforceability. We may be advised of, or otherwise become aware of, prior art or other literature that could negatively affect the scope or enforceability of any patent. If our issued patents, any future patents we are granted, our current or any future patent applications, or our services are found to conflict with any patents held by third parties, we could be prevented from selling our services, any current or future patent may be declared invalid, or our current or any future patent application may not result in an issued patent. In addition, in foreign countries, we may not receive effective patent and trademark protection. We may be required to initiate litigation in order to enforce any patents issued to us, or to determine the scope or validity of a third party’s patent or other proprietary rights. In addition, in the future we may be subject to lawsuits by third parties seeking to enforce their own intellectual property
16
Table of Contents
rights, as described in “Item 1A. Risk Factors — Our product development efforts could be constrained by the intellectual property of others, and we could be subject to claims of intellectual property infringement, which could be costly and time-consuming.”
We seek to avoid disclosure of our intellectual property by requiring employees and consultants with access to our proprietary information to execute nondisclosure and assignment of intellectual property agreements and by restricting access to our source code. Other parties may not comply with the terms of their agreements with us, and we may not be able to enforce our rights adequately against these parties.
Our service offerings incorporate technology licensed from third-party providers. If these providers were no longer to allow us to use these technologies for any reason, we would be required to:
| Ÿ | identify, license and integrate equivalent technology from another source; |
| Ÿ | rewrite the technology ourselves; or |
| Ÿ | rewrite portions of our source code to accommodate the change or no longer use the technology. |
Any one of these outcomes could delay further sales of our services, impair the functionality of our services, delay the introduction of new features or offerings, result in our substituting inferior or more costly technologies, or injure our reputation. In addition, we may be required to license additional technology from third parties, and we cannot assure you that we could license that technology on commercially reasonable terms or at all. Because of the relative immateriality of this third-party licensed technology as well as the availability of alternative equivalent technology, we do not expect that our inability to license this technology in the future would have a material effect on our business or operating results.
Government Regulation
Our business operations are affected, directly or indirectly, by a wide range of U.S. federal, state and international laws and regulations, including regulations that restrict customer communications activities using our services, our handling of information and other aspects of our business. On the U.S. federal level, for example, regulatory measures include:
| Ÿ | the Fair Debt Collection Practices Act, which regulates the timing and content of debt collection communications; |
| Ÿ | the Telephone Consumer Protection Act, which restricts the circumstances under which automated telephone dialing systems and artificial or prerecorded messages may be used in placing calls to residences and wireless telephone numbers and which, under FCC rules, treats text messages as “calls”; |
| Ÿ | Federal Trade Commission and Federal Communications Commission telemarketing regulations promulgated under the authority of the Telemarketing and Consumer Fraud and Abuse Prevention Act and the Telephone Consumer Protection Act, which regulations restrict the timing, content and manner of telemarketing calls, including the use of automated dialing systems, predictive dialing techniques and artificial or prerecorded voice messages, and which, over the course of the past four years, have increasingly encompassed text messaging; |
| Ÿ | the Controlling the Assault of Non-Solicited Pornography and Marketing (CAN-SPAM) Act, which sets standards for the sending of commercial email; |
| Ÿ | the Gramm-Leach-Bliley Act, which regulates the disclosure of consumer nonpublic personal information received from our financial institution clients and requires those clients to impose administrative, technical and physical data security measures in their contracts with us; and |
17
Table of Contents
| Ÿ | the Fair Credit Reporting Act, which defines permissible uses of consumer information furnished to or obtained from consumer reporting agencies. |
Many states and state agencies in the U.S, have also adopted and promulgated laws and regulations governing debt collection, contact with wireless, business and residential telephone numbers, telemarketing, and data privacy. These laws and regulations may, in certain cases, impose restrictions that are more stringent than the federal measures discussed above. To date, our employees have performed a significant portion of our activities in complying with U.S. federal and state laws and regulations and we have not incurred material out-of-pocket compliance costs.
Our foreign business operations are affected, directly or indirectly, by foreign laws and regulations. For example, our current telemarketing activities in the United Kingdom are subject to a comprehensive telemarketing regulation, which includes a prohibition on calls to numbers on the U.K.’s national do-not-call registry, the Telephone Preference Service, and other regulations imposed by the U.K. regulatory authority, Ofcom. Canada has also established a similar national do-not-call registry, which was first implemented on September 30, 2008. Furthermore, we may in the future determine to commence or expand our operations to other countries, and these countries may have laws or regulations comparable to or more stringent than those affecting our domestic business.
Our business, operating results and reputation may be significantly harmed if we violate, or are alleged to violate, U.S. federal, state or foreign laws or rules covering customer communications. In the pricing agreements they enter into with us, our clients typically agree to comply in all material respects with all applicable legal and regulatory requirements relating to their use of our services. We cannot be certain, however, that our clients comply with these obligations, and typically we cannot verify whether clients are complying with their obligations. Violations by our clients may subject us to costly legal proceedings and if we are found to be wholly or partially responsible for such violations, may subject us to damages, fines or other penalties. For a further description of some of the governmental regulations that may affect our business operations, see “Item 1A. Risk Factors — Risks Related to Regulation of Use of Our Services.”
Employees
As of March 1, 2012, we had a total of 140 employees, consisting of 45 employees in client management, 38 employees in research and development, 31 employees in sales and marketing, 10 employees in operations, and 16 employees in general and administrative. A total of 99 of our employees are based at our headquarters in Bedford, Massachusetts.
From time to time we also employ independent contractors and temporary employees to support our operations. None of our employees are subject to collective bargaining agreements. We have never experienced a work stoppage and believe that our relations with our employees are good.
Our History
We were founded in Delaware in April 2000. Our principal executive offices are located at 22 Crosby Drive, Bedford, Massachusetts 01730, and our telephone number is +1 781 897 2500. Our website address is www.soundbite.com, and we make available through the investor relations section of our website, free of charge, our annual reports on Form 10-K, quarterly reports on Form 10-Q and current reports on Form 8-K filed or furnished pursuant to Section 13(a) or 15(d) of the Securities Exchange Act as soon as reasonably practicable after such reports are electronically filed with the SEC. We also make our code of ethics and certain other governance documents and policies available through this site. We are not, however, including the information contained on our website, or information that may be accessed through links on our website, as part of, or incorporating it by reference into, this annual report.
18
Table of Contents
| Item | 1A. Risk Factors |
An investment in our common stock involves a high degree of risk. Investors should consider carefully the risks and uncertainties described below and all of the other information contained in this report before deciding whether to purchase our common stock. The market price of our common stock could decline due to any of these risks and uncertainties, and investors might lose all or part of their investments in our common stock.
Risks Related to Our Business and Industry
Our hosted contact center services face intense competition, and our failure to compete successfully would make it difficult for us to add and retain clients and would impede the growth of our business.
The market for hosted contact center services is intensely competitive, changing rapidly and highly fragmented. It is subject to rapidly developing technology, shifting client requirements, frequent introductions of new products and services, and increased marketing activities of industry participants. Increased competition could result in pricing pressure, reduced sales or lower margins, and could prevent our current or future services from achieving or maintaining broad market acceptance. If we are unable to compete effectively, it will be difficult for us to add and retain clients and our business, financial condition and operating results will be seriously harmed.
Predictive dialers have been the basic method of automated customer communications for the last two decades, particularly for collections activity. The vast majority of telephony customer contact today is completed using predictive dialer technology. Our hosted customer contact services compete with on-premise predictive dialers from a limited number of established vendors and a number of smaller vendors, as well as predictive dialers hosted by some of those smaller vendors on an application service provider basis. Many businesses have invested in on-premise predictive dialers and are likely to continue using those dialers until the dialers are no longer operational, despite the availability of additional functionality in our hosted customer contact services.
We also compete with a number of providers of hosted contact center services. A limited number of established vendors and a number of smaller, privately held companies offer hosted services that compete principally on the basis of price rather than features. In addition, a small number of vendors focus on providing hosted services with features more comparable to ours. These vendors generally compete on the basis of return on investment, features and price. Other companies may enter the market by offering competing products or services based on emerging technologies, such as open-source frameworks, or by competing on the basis of either features or price. Clients could also potentially employ a multi-vendor strategy for risk mitigation purposes.
We increasingly compete with companies providing hosted contact center services focused on specific vertical markets, such as healthcare, or on a single communications channel, such as text messaging. Because these solutions are targeted to more narrowly defined markets and enable their providers to develop targeted domain expertise, those providers may be able to develop and offer targeted customer contact solutions than a company, such as ours, that seeks to offer a broad range of hosted customer contact services to businesses across a variety of vertical markets.
Some of our competitors have significantly greater financial, technical, marketing, service and other resources than we have. These vendors also have larger installed client bases and longer operating histories. Competitors with greater financial resources might be able to offer lower prices, additional products or services, or other incentives that we cannot match or offer. These competitors could be in a stronger position to respond quickly to new technologies and could be able to undertake more extensive marketing campaigns.
We have begun to invest in our mobile marketing offerings, and our business could be negatively affected if the market does not develop as we expect or if we fail to offer services that successfully address the needs of a rapidly changing market.
In June 2011 we acquired key assets of SmartReply, a provider of text messaging and mobile communications solutions, and in February 2012 we acquired 2ergos Americas, a provider of mobile business and marketing
19
Table of Contents
solutions. As a result of these acquisitions and our internal development of mobile messaging solutions based on our existing technology, we have invested, and expect to continue to invest, significant financial and management resources in building and offering our mobile marketing services.
Our mobile marketing business is at an early stage of development, and we may not achieve or sustain demand for our mobile marketing offerings. Our success in this effort will depend in part on the performance, availability and pricing of our mobile marketing services in comparison to a wide array of competing products and services. It will also depend on the willingness of businesses to increase their use of mobile marketing applications. The market for these types of services is changing and developing rapidly, as competitors introduce new and enhanced products and services and react to changes in technology, client demands and regulatory requirements. To succeed, we need to enhance our current services and develop new services on a timely basis to keep pace with market needs and satisfy the increasingly sophisticated requirements of clients. New products and services based on emerging technologies or industry standards could render our existing services obsolete and unmarketable.
Our mobile marketing endeavors involve significant risks and uncertainties, including distraction of management from other operations, insufficient revenues to offset associated expenses and inadequate return on capital. We cannot assure you that our mobile marketing strategies and offerings will be successful and will not materially adversely affect our reputation, financial condition or operating results.
Our quarterly operating results can be difficult to predict and can fluctuate substantially, which could result in volatility in the price of our common stock.
Our quarterly revenues and other operating results have varied in the past and are likely to continue to vary significantly from quarter to quarter. Our agreements with clients typically do not require minimum levels of usage or payments, and our revenues therefore fluctuate based on the actual usage of our services each quarter by existing and new clients. Quarterly fluctuations in our operating results also might be due to numerous other factors, including:
| Ÿ | our ability to attract new clients, including the length of our sales cycles; |
| Ÿ | our ability to sell new applications and increased usage of existing applications to existing clients; |
| Ÿ | technical difficulties or interruptions in our cloud-based services; |
| Ÿ | changes in privacy protection and other governmental regulations applicable to the communications industry; |
| Ÿ | changes in our pricing policies or the pricing policies of our competitors; |
| Ÿ | changes in the rates we incur for services provided by telecommunication or data carriers or by text or email aggregators; |
| Ÿ | the financial condition and business success of our clients; |
| Ÿ | purchasing and budgeting cycles of our clients; |
| Ÿ | acquisitions of businesses and products by us or our competitors; |
| Ÿ | competition, including entry into the market by new competitors or new offerings by existing competitors; |
| Ÿ | our ability to hire, train and retain sufficient sales, client management and other personnel; |
20
Table of Contents
| Ÿ | restructuring expenses, including severance and other costs attributable to terminations of employment; |
| Ÿ | timing of development, introduction and market acceptance of new communication services or service enhancements by us or our competitors; |
| Ÿ | concentration of marketing expenses for activities such as trade shows and advertising campaigns; |
| Ÿ | expenses related to any new or expanded data centers; |
| Ÿ | expenses related to merger and acquisition activities; and |
| Ÿ | general economic and financial market conditions. |
Many of these factors are beyond our control, and the occurrence of one or more of them could cause our operating results to vary widely. Because of quarterly fluctuations, we believe that quarter-to-quarter comparisons of our operating results are not necessarily meaningful.
We may fail to forecast accurately the behavior of existing and potential clients or the demand for our services. Our expense levels are based, in significant part, on our expectations as to future revenues and are largely fixed in the short term. As a result, we could be unable to adjust spending in a timely manner to compensate for any unexpected shortfall in revenues.
Variability in our periodic operating results could lead to volatility in our stock price as equity research analysts and investors respond to quarterly fluctuations. Moreover, as a result of any of the foregoing or other factors, our operating results might not meet our announced guidance or expectations of investors and analysts, in which case the price of our common stock could decrease significantly.
We could be subject to substantial damages and expenses if our clients violate U.S. Telephone Consumer Protection Act restrictions as the result of the use of mobile termination text messages.
Over the past several months, class action litigation has been initiated against a number of banks and retailers, including some of our clients, alleging that “mobile termination” text messages violate the U.S. Telephone Consumer Protection Act or TCPA, which seeks to protect the privacy interests of residential telephone subscribers. When a business receives a text message indicating that the sender wishes to “opt out” of further text communications from the business, a mobile termination text message may be transmitted automatically in order to confirm that the business received the opt-out message and will not send any additional text messages.
On October 21, 2011, we received a notice from GameStop Corp. and GameStop Inc., which together we refer to as GameStop, requesting indemnification in connection with a class action litigation entitled Karayan v. GameStop Corp. and GameStop Inc., which we refer to as the Karayan Litigation, which had been initiated against GameStop based in part on mobile termination text messages. We are not a named defendant or other party in the Karayan Litigation.
On January 6, 2012, we delivered a letter agreement to GameStop, in which we agreed to indemnify GameStop in relation to the Karayan Litigation. After investigation, we determined to deliver the letter agreement dated January 6, 2012 in order to, pursuant to the provisions of our Master Pricing Agreement with GameStop, (a) indemnify GameStop for damages, losses and fees resulting from the aspects of the Karayan Litigation relating to mobile termination text messages and (b) confirm that we will take sole control over the defense, and any settlement, of those aspects of the Karayan Litigation. In addition to claims relating to mobile termination text messages, the Karayan Litigation also asserts claims alleging that GameStop is liable to certain of its customers because it failed to obtain prior express consent to the delivery of text messages. In the letter agreement, we reserved our rights concerning any argument that we may have as to our obligation to indemnify
21
Table of Contents
GameStop with respect to the aspects of the Karayan Litigation relating to the alleged lack of prior express consent.
We intend to defend vigorously against the claims in the Karayan Litigation that allege GameStop violated provisions of the TCPA in delivering mobile termination text messages. We are continuing to investigate this matter. At this time it is not possible for us to estimate the amount of damages, losses, fees and other expenses that we will incur as the result of our indemnification obligations to GameStop, but such an amount could have a material adverse effect on our business, financial condition and operating results. Even if we succeed in defending against the Karayan Litigation, we are likely to incur substantial costs and our management’s attention will be diverted from our operations.
We are not a party to any litigation involving a claim that we or any other party violated the TCPA as the result of mobile termination text messages, and we have not been requested to indemnify any client other than GameStop in connection with any such claim under the TCPA. Class action litigation has been initiated against a number of businesses to date with respect to claims under the TCPA involving mobile termination text messages, and it is likely that similar claims will be asserted in the future against businesses, some of which may be our clients. If we are required to indemnify a client under such a future claim, we could incur material costs and expenses that would have a material adverse effect on our business, financial condition and operating results. Moreover, if we were obligated to indemnify clients with respect to multiple class actions of this type, the costs of defending those actions could, by themselves and without regard to the ultimate outcomes of the actions, have a material adverse effect on our business, financial condition and operating results.
Defects in our platforms, disruptions in our services or errors in execution could diminish demand for our services and subject us to substantial liability.
Our multi-channel platforms are complex and incorporate a variety of hardware and proprietary and licensed software. From time to time we have found and corrected defects in a platform. Cloud-based services such as ours frequently experience issues from undetected defects when first introduced or when new versions or enhancements are released. Defects in either of our platforms could result in service disruptions for one or more clients. For example, in October 2008 we experienced a partial outage of the SoundBite Engage platform, which precluded some clients from executing their campaigns in their desired timeframes. Our clients might use our services in unanticipated ways that cause a service disruption for other clients attempting to access their contact list information and other data stored on a platform. In addition, a client may encounter a service disruption or slowdown due to high usage levels of our services.
Clients engage our client management organization to assist them in creating and managing a campaign. As part of this process, we typically construct and test a script, map the client’s input file into our platforms, and map our output files to a client-specific format. In order for a campaign to be executed successfully, our client management staff must correctly design, implement, test and deploy these work products. The performance of these tasks can require significant skill and effort, and from time to time has resulted in errors that adversely affected a client’s campaign.
Because clients use our services for critical business processes, any defect in one of our platforms, any disruption in our services or any error in execution could cause existing or potential clients not to use our services, could harm our reputation, and could subject us to litigation and significant liability for damage to our clients’ businesses.
The insurers under our existing liability insurance policy could deny coverage of a future claim that results from an error or defect in our platforms or a resulting disruption in our services, or our existing liability insurance might not be adequate to cover all of the damages and other costs of such a claim. Moreover, we cannot assure you that our current liability insurance coverage will continue to be available to us on acceptable terms or at all. The successful assertion against us of one or more large claims that exceed our insurance coverage, or the occur-
22
Table of Contents
rence of changes in our liability insurance policy, including an increase in premiums or imposition of large deductible or co-insurance requirements, could have a material adverse effect on our business, financial condition and operating results. Even if we succeed in litigation with respect to a claim, we are likely to incur substantial costs and our management’s attention will be diverted from our operations.
Interruptions, delays in service or errors in execution from our key vendors would impair the delivery of our services and could substantially harm our business and operating results.
In delivering our cloud-based services, we rely upon a combination of hosting providers, telecommunication and data carriers, and text and email aggregators. We serve our clients from five hosting facilities that are owned and operated by third parties. Three of the lease agreements for these facilities effectively renew for one-year periods, subject to three months’ advance notice of termination, and one renews monthly, subject to thirty days’ advance notice of termination. The fifth lease agreement terminates in 2014. If one of these lease agreements terminates and we are unable to renew the agreement on commercially reasonable terms, we may need to incur significant expense to relocate the data center or to agree to the terms demanded by the hosting provider, either of which could harm our business, financial position and operating results.
Our clients’ campaigns are handled through a mix of telecommunication and data carriers as well as text and email aggregators. We rely on these service providers to handle millions of customer contacts each day. From time to time these service providers may fail to handle contacts correctly, which could cause existing or potential clients not to use our services, could harm our reputation, and could subject us to litigation and significant liability for damage to our clients’ businesses for which we are not fully indemnified or insured. While we have entered into contracts with multiple telecommunication carriers and text aggregators, we currently do not have fully redundant data, text or email services. Our contracts with carriers and aggregators generally can be terminated by either party at the end of the contract term upon written notice delivered by the party a specified number of days before the end of the term. In addition, we generally can terminate a contract at any time upon written notice delivered a specified number of days in advance, subject to the payment of specified termination charges. If a contract is terminated, we might be unable to obtain pricing on similar terms from another provider, which would affect our gross margins and other operating results.
Our hosting facilities and the infrastructures of our service providers are vulnerable to damage or interruption from floods, fires and similar natural events, as well as acts of terrorism, break-ins, sabotage, intentional acts of vandalism and similar misconduct. The occurrence of such a natural disaster or misconduct, a loss of power, a decision by a hosting provider to close a facility without adequate notice or other unanticipated problems could result in lengthy interruptions in our provision of our services. Any interruption or delay in providing our services, even if for a limited time, could have an adverse effect on our business, financial condition and operating results.
Actual or perceived breaches of our security measures could diminish demand for our services and subject us to substantial liability.
Our services involve the storage and transmission of clients’ proprietary information. Cloud-based services such as ours are particularly subject to security breaches by third parties. Breaches of our security measures also might result from employee error or malfeasance or other causes, including as a result of adding new communications services and capabilities to our platforms. In the event of a security breach, a third party could obtain unauthorized access to our clients’ contact list information and other data. Techniques used to obtain unauthorized access or to sabotage systems change frequently, and they typically are not recognized until after they have been launched against a target. As a result, we could be unable to anticipate, and implement adequate preventative measures against, these techniques. Because of the critical nature of data security, any actual or perceived breach of our security measures could subject us to litigation and significant liability for damage to our clients’ businesses, could cause existing or potential clients not to use our services, and could harm our reputation.
23
Table of Contents
We currently are integrating the operations of two businesses that we acquired recently and we may enter into additional acquisitions in the future, which may be difficult to integrate, disrupt our business, dilute stockholder value and divert management attention.
In June 2011 we acquired key assets of SmartReply, a provider of text messaging and mobile communications solutions, and in February 2012 we acquired 2ergos Americas, a provider of mobile business and marketing solutions.
| Ÿ | SmartReply. We currently are completing the migration of former customers of SmartReply to our platforms. We acquired the SmartReply assets in order to broaden our client base, and we will be unable to recognize the anticipated benefits of the acquisition if we are unable to transition legacy SmartReply clients to our platforms in a timely manner. |
| Ÿ | 2ergo Americas. We have just begun the process of integrating the operations, technology and personnel of 2ergo Americas. We expect this process will be more complex than in our previous acquisitions due to the need to integrate elements of the 2ergo Americas software platform with our platforms and to the complexities likely to be involved in addressing certain technologies previously shared by 2ergo Americas and its parent. We acquired 2ergo Americas in order to broaden our client base and gain technology and personnel, and we will be unable to recognize the anticipated benefits of the acquisition if we are unable to integrate the acquired technology effectively in a timely manner or if we fail to maintain and incentivize the former 2ergo Americas employees in a manner that enables us to maintain existing clients and add additional mobile marketing clients. |
If we encounter unforeseen technical or other challenges in these integration and migration processes, our business and results of operations could be harmed. In particular, challenges or difficulties in migrating or expanding the legacy SmartReply and 2ergo Americas client bases may distract our management’s attention from focusing on our other business operations and may result in our recognizing a lower level of revenues than we expected when we entered into the transactions.
Our business strategy contemplates that we will seek to identify and pursue additional acquisitions of businesses, technologies and products that will complement our existing operations. We cannot assure you that any acquisition we make in the future will provide us with the benefits we anticipated in entering into the transaction. Acquisitions are typically accompanied by a number of risks, including:
| Ÿ | difficulties in integrating the operations and personnel of the acquired companies; |
| Ÿ | maintenance of acceptable standards, controls, procedures and policies; |
| Ÿ | potential disruption of ongoing business and distraction of management; |
| Ÿ | impairment of relationships with employees and clients as a result of any integration of new management and other personnel; |
| Ÿ | inability to maintain relationships with suppliers and clients of the acquired business; |
| Ÿ | difficulties in incorporating acquired technology and rights into our services and platforms; |
| Ÿ | unexpected expenses resulting from the acquisition; |
| Ÿ | potential unknown liabilities associated with acquired businesses; and |
| Ÿ | unanticipated expenses related to acquired technology and its integration into our existing technology. |
Acquisitions could result in the incurrence of debt, restructuring charges and large one-time write-offs. Acquisitions could also result in goodwill and other intangible assets that are subject to impairment tests, which
24
Table of Contents
might result in future impairment charges. Furthermore, if we finance acquisitions by issuing convertible debt or equity securities, our existing stockholders would be diluted and earnings per share could decrease.
From time to time, we might enter into negotiations for acquisitions that are not ultimately consummated. Those negotiations could result in diversion of management time and significant out-of-pocket costs. If we are unable to evaluate and execute acquisitions properly, we could fail to achieve our anticipated level of growth and our business and operating results could be adversely affected.
Our product development efforts could be constrained by the intellectual property of others, and we could be subject to claims of intellectual property infringement, which could be costly and time-consuming.
The customer communications industry and the telecommunications industry are characterized by the existence of a large number of patents, trademarks and copyrights, and by frequent litigation based upon allegations of infringement or other violations of intellectual property rights. We have in the past been subject to litigation, now concluded, with a third party that alleged that our services violated the third party’s intellectual property rights. As we seek to extend and expand our services, we could be constrained by the intellectual property rights of others.
We might not prevail in any future intellectual property infringement litigation given the complex technical issues and inherent uncertainties in litigation. Any claims, regardless of their merit, could be time-consuming and distracting to management, result in costly litigation or settlement, cause product development delays, or require us to enter into royalty or licensing agreements. If our services violate any third-party proprietary rights, we could be required to re-engineer our platforms or seek to obtain licenses from third parties, which might not be available on reasonable terms or at all. Any efforts to re-engineer our services, obtain licenses from third parties on favorable terms or license a substitute technology might not be successful and, in any case, might substantially increase our costs and harm our business, financial condition and operating results. Further, our platforms incorporate open source software components that are licensed to us under various public domain licenses. While we believe we have complied with our obligations under the various applicable licenses for open source software that we use, there is little or no legal precedent governing the interpretation of many of the terms of certain of these licenses and therefore the potential impact of such terms on our business is somewhat unknown.
The expansion of our business into international markets exposes us to additional business risks, and failure to manage those risks could adversely affect our business and operating results.
Historically we targeted substantially all of our sales and marketing efforts principally to businesses located in the United States. In recent years, however, we have focused on increasing resources on businesses located in Europe. We anticipate that an increasing portion of our revenue in future periods will be derived from outside the United States. The continued expansion of our international operations will require substantial financial investment and significant management efforts and will subject us to a number of risks and potential costs, including:
| Ÿ | difficulty in establishing, staffing and managing sales and other operations in countries outside of the United States; |
| Ÿ | compliance with multiple, conflicting and changing laws and regulations, including employment and tax laws and regulations; |
| Ÿ | longer payment cycles in some countries; |
| Ÿ | currency exchange rate fluctuations; |
| Ÿ | limited protection of intellectual property in some countries outside of the United States; |
| Ÿ | challenges encountered under local business practices, which vary by country and often favor local competitors; |
25
Table of Contents
| Ÿ | challenges caused by distance, language and cultural differences; and |
| Ÿ | difficulty in establishing and maintaining reseller relationships. |
Our failure to manage the risks associated with our international operations could limit the growth of our business and adversely affect our operating results.
The global economic conditions and related credit crisis may continue to adversely affect our business.
Global market and economic conditions have been negative in recent years, with tighter credit conditions in most major economies since 2009. Continuing concerns about the systemic impact of potential long-term and wide-spread recession, energy costs, geopolitical issues, the availability and cost of credit, and the global housing and mortgage markets have contributed to increased market volatility, declining business and consumer confidence, increased unemployment, and diminished economic expectations. These market conditions have led to a decrease in spending by businesses and consumers. Continuing turbulence in the United States and international markets and economies and prolonged declines in business and consumer spending could result in lower sales of our services, longer sales cycles, difficulties in collecting accounts receivable, gross margin deterioration, slower adoption of new technologies and increased price competition, any of which may have a negative effect on our financial condition and results of operations.
Many of our clients are not obligated to pay any minimum amount for our services on an on-going basis, and if those clients discontinue use of our services or do not use our services on a regular basis, our revenues would decline.
The agreements we enter into with many of our clients do not require minimum levels of usage or payments and are terminable at will by our clients. The periodic usage of our services by an existing client could decline or fluctuate as a result of a number of factors, including the client’s level of satisfaction with our services, the client’s ability to satisfy its customer contact processes internally, and the availability and pricing of competing products and services. If our services fail to generate consistent business from existing clients, our business, financial condition and operating results will be adversely affected.
We derive a significant portion of our revenues from the sale of our services for use in the collections process, and any event that adversely affects the accounts receivable management industry or in-house accounts receivable management departments would cause our revenues to decline.
We sell our hosted customer contact services for use in the collections process by accounts receivable management agencies and by large in-house accounts receivable management departments. Revenues from these businesses represented 70% of our revenues in 2011, 75% of our revenues in 2010 and 77% of our revenues in 2009. We expect that revenues from accounts receivable management businesses will continue to account for a substantial part of our revenues for the foreseeable future.
Accounts receivable management businesses are particularly subject to changes in the overall economy. In a sustained economic downturn such as the recession experienced globally since 2009, accounts receivable management agencies can be affected adversely by declines in liquidation rates as a result of higher debt and lower disposable income. A prolonged economic downturn will impact these agencies as fewer loans are granted due to the imposition by lenders of conditions on the extension of credit that are not acceptable to potential borrowers. Accounts receivable management businesses also can be affected adversely by a sustained economic upturn, which may result in lower levels of consumer debt default rates. In addition, these businesses may be affected adversely by tightening of credit granting practices as well as technological advances and regulatory changes that affect the collection of outstanding indebtedness. Any such changes, conditions or events that adversely affect these businesses could cause us to lose some or all of the recurring business of our clients in the
26
Table of Contents
accounts receivable management industry, which in turn could have a material adverse effect on our business, financial condition and operating results.
Moreover, two clients accounted for a total of 23% of our revenues in 2011, 23% of our revenues in 2010 and 29% of our revenues in 2009. One of these clients is an accounts receivable management agency and the other is a large in-house accounts receivable management department of a telecommunications business. In addition to the risks associated with accounts receivable management businesses in general, our business, financial condition and operating results would be negatively affected if either of these clients were to significantly decrease the extent to which it uses our hosted customer contact services.
Our business will be harmed if we fail to develop new features that keep pace with technological developments and emerging consumer trends.
Businesses can use a variety of communication channels to reach their customers. Emerging consumer trends have forced a greater focus on alternative channels, customer preferences and communications via mobile devices and a failure to address these trends would be a threat to the adoption of our services. Our business, financial condition and operating results will be adversely affected if we are unable to complete and introduce, in a timely manner, new features for our existing services that keep pace with technological developments. For example, because most of our clients access our cloud-based services using a web browser, we must modify and enhance our services from time to time to keep pace with new browser technology.
Mergers or other strategic transactions involving our competitors could weaken our competitive position, which could harm our operating results.
Our industry is highly fragmented, and we believe it is likely that some of our existing competitors will consolidate or will be acquired. For example, in February 2011 West Corporation, a provider of voice and data solutions, announced it had acquired Twenty First Century Communications, Inc., a provider of automated alerts and notification solutions. In August 2011 Augme Technologies, Inc., a mobile marketing service, acquired substantially all of the assets of Hipcricket, Inc, a mobile marketing and advertising company. In December 2011 Lenco Mobile Inc., a provider of advertising and technical platforms primarily for the high-growth mobile and online marketing sectors, acquired iLoop Mobile, Inc., a mobile marketing service organization.
In addition, some of our competitors may enter into new alliances with each other or may establish or strengthen cooperative relationships with systems integrators, third-party consulting firms or other parties. Any such consolidation, acquisition, alliance or cooperative relationship could lead to pricing pressure and our loss of market share and could result in a competitor with greater financial, technical, marketing, service and other resources, all of which could have a material adverse effect on our business, operating results and financial condition.
Failure to maintain our direct sales force will impede our growth.
We are highly dependent on our direct sales force to obtain new clients and to generate repeat business from our existing client base. It is therefore critical that our direct sales force maintain regular contact with our clients, both to gauge client satisfaction with our services as well as to highlight the value that use of our services adds to their enterprises. There is significant competition for direct sales personnel. Our ability to achieve growth in revenues in the future will depend in large part on our success in recruiting, training and retaining sufficient numbers of direct sales personnel. New hires require significant training and typically take more than a year before they achieve full productivity. Our recent and planned hires might not achieve full productivity as quickly as intended, or at all. If we fail to keep, hire and successfully train sufficient numbers of direct sales personnel, we will be unable to increase our revenues and the growth of our business will be impeded.
27
Table of Contents
Because competition for employees in our industry is intense, we might not be able to attract and retain the highly skilled employees we need to execute our business plan.
To continue to execute our business plan, we must attract and retain highly qualified personnel. Competition for these personnel is intense, especially for senior engineers and senior sales executives. We might not be successful in attracting and retaining qualified personnel. We have experienced from time to time in the past, and expect to continue to experience in the future, difficulty in hiring and retaining highly skilled employees with appropriate qualifications. Many of the companies with which we compete for experienced personnel have greater resources than we have. In addition, in making employment decisions, particularly in technology-based industries, job candidates often consider the value of the stock options they are to receive in connection with their employment. Volatility in the price of our common stock could therefore, adversely affect our ability to attract or retain key employees. Furthermore, the requirement to expense stock options could discourage us from granting the size or type of stock options awards that job candidates require to join our company. If we fail to attract new personnel or fail to retain and motivate our current personnel, our business plan and future growth prospects could be severely harmed.
If we are unable to protect our intellectual property rights, we would be unable to protect our technology and our brand.
If we fail to protect our intellectual property rights adequately, our competitors could gain access to our technology and our business could be harmed. We rely on trade secret, copyright and trademark laws, and confidentiality and assignment of invention agreements with employees and third parties, all of which offer only limited protection. The steps we have taken to protect our intellectual property might not prevent misappropriation of our proprietary rights. We have three issued patents and eleven patent applications pending in the United States. Our issued patents and any patents issued in the future may not provide us with any competitive advantages or may be successfully challenged by third parties. Furthermore, legal standards relating to the validity, enforceability and scope of protection of intellectual property rights in other countries are uncertain and might afford little or no effective protection of our proprietary technology. Consequently, we could be unable to prevent our intellectual property rights from being exploited abroad, which could diminish international sales or require costly efforts to protect our technology. Policing the unauthorized use of intellectual property rights is expensive, difficult and, in some cases, impossible. Litigation could be necessary to enforce or defend our intellectual property rights, to protect our trade secrets, or to determine the validity and scope of the proprietary rights of others. Any such litigation could result in substantial costs and diversion of management resources, either of which could harm our business. Accordingly, despite our efforts, we might not be able to prevent third parties from infringing upon or misappropriating our intellectual property.
We are subject to risks associated with outsourcing services to third parties, and failure to manage those risks could adversely affect our business and operating results.
We contract with several third-party vendors that provide services to us or to whom we delegate selected functions. These third-party vendors supplement our internal engineering efforts. Our arrangements with these third-party vendors may make our operations vulnerable if the third parties fail to satisfy their obligations to us:
| Ÿ | The failure of a third-party vendor to provide high-quality services that conform to required specifications or contractual arrangements could impair our ability to enhance our solutions or to develop new solutions, could create exposure for non-compliance with our contractual commitments to our clients, or could otherwise adversely affect our business and operating results. In particular, a client may impose specific requirements on us, such as an obligation to provide our solutions using only personnel in the United States, with which it may be difficult or impossible for a third-party vendor to comply or for which we may be unable to monitor compliance. |
28
Table of Contents
| Ÿ | If a third-party vendor fails to maintain and protect the security and confidentiality of data to which it has access, we could be exposed to lawsuits or damage claims that, if upheld, could materially and adversely affect our profitability or we could be subject to substantial regulatory fines or other penalties. |
| Ÿ | If a third-party vendor fails to comply with other applicable regulatory requirements, we may be held liable for the vendor’s failures or violations. We cannot assure you that our third-party vendors are, or will be, in full compliance with all applicable laws and regulations at all times or that our third-party vendors will be able to comply with any future laws and regulations. |
Our third-party vendor arrangements could be adversely impacted by changes in a vendor’s operations or financial condition or other matters outside of our control. There is no assurance that our third-party vendors will continue to provide services to us or that they will renew or not terminate their arrangements with us. Any interruption in their services could adversely affect our operations unless and until we can identify a new vendor or replace an existing vendor’s services with internal resources at additional cost.
Our platforms rely on technology licensed from third parties, and our inability to maintain licenses of this technology on similar terms or errors in the licensed technology could result in increased costs or impair the implementation or functionality of our cloud-based services, which would adversely affect our business and operating results.
Our multi-tenant customer communication platforms relies on technology licensed from third-party providers. For example, we use the Apache web server, the Oracle WebLogic application server, the JBoss Application server, Nuance Communications text-to-speech and automated speech recognition software, the Oracle database, and the MySQL database. We anticipate that we will need to continue to license technology from third parties in the future. There might not always be commercially reasonable software alternatives to the third-party software that we currently license. Any such software alternatives could be more difficult or costly to replace than the third-party software we currently license, and integration of that software into our platforms could require significant work and substantial time and resources. Any undetected errors in the software we license could prevent the implementation of our cloud-based services, impair the functionality of our services, delay or prevent the release of new features or offerings, and injure our reputation. Our use of additional or alternative third-party software would require us to enter into license agreements with third parties, which might not be available on commercially reasonable terms or at all.
Industry consolidation could reduce the number of our clients and adversely affect our business.
Some of our significant clients from time to time may merge, consolidate or enter into alliances with each other. The surviving entity or resulting alliance may subsequently decide to use a different service provider or to manage customer contact campaigns internally. Alternatively, the surviving entity or resulting alliance may elect to continue using our services, but its strengthened financial position or enhanced leverage may lead to pricing pressure. Either of these results could have a material adverse effect on our business, operating results and financial condition. We may not be able to offset the effects of any such price reductions, and may not be able to expand our client base to offset any revenue declines resulting from such a merger, consolidation or alliance.
Our ability to use net operating loss carryforwards in the United States may be limited.
As of December 31, 2011, we had net operating loss carryforwards of $24.0 million for U.S. federal tax purposes and an additional $6.0 million for state tax purposes. These carryforwards expire between 2013 and 2031. To the extent available, we intend to use these net operating loss carryforwards to reduce the corporate income tax liability associated with our operations. Section 382 of the Internal Revenue Code generally imposes an annual limitation on the amount of net operating loss carryforwards that may be used to offset taxable income when a corporation has undergone significant changes in stock ownership. We experienced ownership changes
29
Table of Contents
for these purposes in 2007, which resulted in an annual limitation amount of approximately $8.0 million on the use of net operating loss carryforwards generated from November 29, 2001 through November 8, 2007. To the extent our use of net operating loss carryforwards is limited, our income could be subject to corporate income tax earlier than it would if we were able to use net operating loss carryforwards, which could result in lower profits.
If we are unable to raise capital when needed in the future, we may be unable to execute our growth strategy, and if we succeed in raising capital, we may dilute investors’ percentage ownership of our common stock or may subject our company to interest payment obligations and restrictive covenants.
We may need to raise additional funds through public or private debt or equity financings in order to:
| Ÿ | fund ongoing operations; |
| Ÿ | take advantage of opportunities, including more rapid expansion of our business or the acquisition of complementary products, technologies or businesses; |
| Ÿ | develop new services and products; and |
| Ÿ | respond to competitive pressures. |
Any additional capital raised through the sale of equity may dilute investors’ percentage ownership of our common stock. Capital raised through debt financing would require us to make periodic interest payments and may impose potentially restrictive covenants on the conduct of our business. Furthermore, additional financings may not be available on terms favorable to us, or at all. A failure to obtain additional funding could prevent us from making expenditures that may be required to grow or maintain our operations.
Risks Related to Regulation of Use of Our Services
We derive a significant portion of our revenues from the sale of our services for use in the collections process, and our business and operating results could be substantially harmed if new U.S. federal and state laws or regulatory interpretations in one or more jurisdictions either make our services unavailable or less attractive for use in the collections process or expose us to regulation as a debt collector.
Revenues from clients in the accounts receivable management industry and large in-house, or first-party, accounts receivable management departments represented approximately 70% of our revenues in 2011, 75% of our revenues in 2010 and 77% of our revenues in 2009. These clients’ use of our services is affected by an array of complex federal and state laws and regulations. The U.S. Fair Debt Collection Practices Act, or FDCPA, limits debt collection communications by clients in the accounts receivable management industry, including third parties retained by creditors. For example, the FDCPA prohibits abusive, deceptive and other improper debt collection practices, restricts the timing and content of communications regarding a debt or a debtor’s location, and allows consumers to opt out of receiving debt collection communications. In general, the FDCPA also prohibits the use of debt collection communications to cause debtors to incur more debt. Many states impose additional requirements on debt collection communications, including limits on the frequency of debt collection calls, and some of those requirements may be more stringent than the comparable federal requirements. Moreover, debt collection communications are subject to new regulations, as well as changing regulatory interpretations that may be inconsistent among different jurisdictions. For example, in February 2012 the Federal Communications Commission, or FCC, modified its rules to require opt-in for all prerecorded calls made to mobile phones, which limits our clients’ ability to use our services to call a mobile phone for the purposes of collections without having prior written consent from a customer. Our business, financial position and operating results could be substantially harmed by the adoption or interpretation of U.S. federal or state laws or regulations that make our services either unavailable or less attractive for debt collection communications by existing and potential clients.
30
Table of Contents
We provide our services for use by creditors and debt collectors, but we do not believe that we are a debt collector for purposes of these U.S. federal or state regulations. An allegation by one or more jurisdictions that we are a debt collector for purposes of their regulations could cause existing or potential clients not to use our services, harm our reputation, subject us to administrative proceedings, or result in our incurring significant legal fees and other costs. If it were to be determined that we are a debt collector for purposes of the regulations of one or more jurisdictions, we could be exposed to government enforcement actions and regulatory penalties and would be subject to additional rules, including licensing and bonding requirements. The costs of complying with these rules could be substantial, and we might be unable to continue to offer our services for debt collection communications in those jurisdictions, which would have a material adverse effect on our business, financial condition and operating results. In addition, if clients use our services in violation of limits on the content, timing and frequency of their debt collection communications, we could be subject to claims by consumers that result in costly legal proceedings and that lead to civil damages, fines or other penalties.
We could be subject to significant penalties or damages if our clients violate U.S. federal or state restrictions on the use of artificial or prerecorded messages to contact wireless telephone numbers, and our business and operating results could be substantially harmed if those restrictions make our service unavailable or less attractive.
Under the TCPA, it is unlawful to use an automatic telephone dialing system or an artificial or prerecorded message to contact any cellular or other wireless telephone number, unless the recipient previously has consented to receiving this type of communication. In February 2012 the FCC modified its rules to require opt-in for all autodialed or prerecorded calls made to mobile phones, which limits our clients’ ability to use our service to call a mobile phone for the purposes of information, customer care or telemarketing without having prior written consent from a customer. Many states have enacted restrictions on using automatic dialing systems and artificial and prerecorded messages to contact wireless telephone numbers, and some of those state requirements may be more stringent than the comparable federal requirements.
Our services provide our clients with the capability to transmit artificial and prerecorded messages. Although our services are designed to enable a client to screen a contact list to remove wireless telephone numbers, a client may determine that autodialed or prerecorded communication to certain wireless telephone numbers are permitted because the recipients previously have consented to receiving such communication. We cannot ensure that, in using our services for a campaign, a client removes from its contact list the names of all persons who are associated with wireless telephone numbers and who have not consented to receiving artificial or prerecorded communication. On January 11, 2012, a class action litigation, which we refer to as the Sager Litigation, was filed against Bank of America and us as co-defendants. The Sager Litigation alleges that we and Bank of America sent text massages to the plaintiff without the plaintiff’s prior express consent, in violation of the TCPA. Plaintiff is seeking confirmation of a class of individuals who received unauthorized text message solicitations from us. We intend to defend vigorously against the claims in the Sager Litigation that allege we violated provisions of the TCPA in delivering text messages. We are continuing to investigate this matter. At this time it is not possible for us to estimate the amount of damages, losses, fees and other expenses that we will incur as the result of the Sager Litigation, but such an amount could have a material adverse effect on our business, financial condition and operating results. Even if we succeed in defending against the Sager Litigation, we are likely to incur substantial costs and our management’s attention will be diverted from our operations.
In May 2008, a federal district court in California held that the Telemarketing and Consumer Fraud and Abuse Prevention Act prohibits any autodialed or prerecorded telephone call to a consumer’s cell phone unless the consumer had specifically consented to such calls. The same provision of such Act also applies to the sending of commercial text messages to cell phones. The ruling overturned an earlier FCC interpretation that permitted autodialed and prerecorded calls to the cell phone of any consumer who had provided the cell phone number in connection with requesting a product or service. The ruling applied only in California and was subsequently overturned but, as a result of the initial decision, some existing or potential clients may decide to limit their use of our service to reach consumers on wireless numbers, which could materially adversely affect our revenues and other operating results.
31
Table of Contents
If clients use our services in a manner that violates any of these governmental regulations, federal or state authorities may seek to subject us to regulatory fines or other penalties, even if the violation did not result from a failure of our service. If clients use our services to screen for wireless telephone numbers and our screening mechanisms fail, we may be subject to regulatory fines or other penalties as well as contractual claims by clients for damages, and our reputation may be harmed.
Regulatory restrictions on the use of artificial and prerecorded messages present particular problems for businesses in the accounts receivable management industry. These third-party accounts receivable management agencies and debt buyers do not have direct relationships with the consumer debtors and therefore typically do not have the ability to obtain from a debtor the consent required to permit the use of autodialed or prerecorded messages in contacting a debtor at a wireless telephone number. These businesses’ lack of a direct relationship with debtors also makes it more difficult for them to evaluate whether a debtor has provided such consent. For example, a accounts receivable management agency frequently must evaluate whether past actions taken by a debtor, such as providing a cellular telephone number in a loan application, constitute consent sufficient to permit the agency to contact the debtor using autodialed or prerecorded messages. Moreover, a significant period of time elapses between the time at which a loan is made and the time at which a accounts receivable management agency or debt buyer seeks to contact the debtor for repayment, which further complicates the determination of whether the accounts receivable management agency or debt buyer has the required consent to use an automatic telephone dialing system or prerecorded messages. The difficulties encountered by these third-party accounts receivable management businesses are becoming increasingly problematic as the percentage of U.S. consumers using cellular telephones continues to increase. If these third-party accounts receivable management businesses are unable to use an automatic telephone dialing system or prerecorded messages to contact a substantial portion of their debtors, our services will be less useful to them. If our clients in the accounts receivable management industry significantly decrease their use of our services, our business, financial position and operating results would be substantially harmed.
We could be subject to penalties if we or our clients violate U.S. federal or state telemarketing restrictions due to a failure of our services or otherwise, which could harm our financial position and operating results.
The use of our services for marketing communications is affected by extensive federal and state telemarketing regulation. The Telemarketing and Consumer Fraud and Abuse Prevention Act and the TCPA, among other U.S. federal laws, empower both the Federal Trade Commission, or FTC, and the FCC to regulate interstate telephone sales calling activities. The FTC’s Telemarketing Sales Rule and analogous FCC rules require us to, for example, transmit Caller ID information, disclose certain information to call recipients, and retain certain business records. FTC and FCC rules proscribe misrepresentations, prohibit the abandonment of telemarketing calls and limit the timing of calls to consumers. Both the FTC and FCC also prohibit telemarketing calls to persons who have placed their numbers on the national Do-Not-Call Registry, except for calls made with an existing business relationship, or EBR, or subject to other limited exceptions. If we fail to comply with applicable FTC and FCC telemarketing regulations, we may be subject to substantial regulatory fines or other penalties as well as contractual claims by clients for damages, and our reputation may be harmed. The FTC’s Telemarketing Sales Rule, for example, imposes fines of up to $16,000 per violation. The FCC may also impose forfeitures of up to $16,000 per violation of its telemarketing rules. If clients use our services in a manner that violates any of these telemarketing regulations, the FTC or FCC may seek to subject us to regulatory fines or other penalties, even if the violation did not result from a failure of our services.
In addition, in 2008 the FTC adopted an amendment to the Telemarketing Sales Rule requiring that “express written consent” be obtained for all pre-recorded sales calls that are delivered as of September 1, 2009. Thus, a business that attempts to sell goods or services through the use of prerecorded messages will need to take the extra step to obtain “opt-in” from consumers before pre-recorded sales calls can be delivered, even with respect to consumers with whom the business has an EBR. We cannot ensure that, in using our services for a campaign, a client will obtain appropriate “opt-in” authorization before placing prerecorded telemarketing calls or that the client properly interprets and applies the “opt-in” requirement. If clients use our services to place unauthorized
32
Table of Contents
calls or in a manner that otherwise violates FTC or FCC restrictions on prerecorded telemarketing calls, U.S. federal or state authorities may seek to subject us to substantial regulatory fines or other penalties, even if the violation did not result from a failure of our screening mechanisms.
Many states have enacted prohibitions or restrictions on telemarketing calls into their states, specifically covering the use of automatic dialing system and predictive dialing techniques. Some of those state requirements are more stringent than the comparable federal requirements. If clients use our services in a manner that violates any of these telemarketing regulations, state authorities may seek to subject us to regulatory fines or other penalties, even if the violation did not result from a failure of our services.
To the extent that our services are used to send text or email messages, our clients will be, and we may be, affected by regulatory requirements in the United States. Businesses may determine not to use these channels because of prior consent, or opt-in, requirements or other regulatory restrictions, which could harm our future business growth.
Our failure to comply with numerous and overlapping information security and privacy requirements could subject us to fines and other penalties as well as claims by our clients for damages, any of which could harm our reputation and business.
Our collection, use and disclosure of personal information are affected by numerous privacy, security and data protection regulations. We are subject to the Gramm-Leach-Bliley Privacy Act when we receive nonpublic personal information from clients that are treated as financial institutions under those rules. These rules restrict disclosures of consumer information and limit uses of such information to certain purposes that are disclosed to consumers. The related Gramm-Leach-Bliley Safeguards Rule requires our financial institution clients to impose administrative, technical and physical data security measures in their contracts with us. Compliance with these contractual requirements can be costly, and our failure to satisfy these requirements could lead to regulatory penalties or contractual claims by clients for damages.
In some instances our services require us to receive consumer information that is protected by the Fair Credit Reporting Act, which defines permissible uses of consumer information furnished to or obtained from consumer reporting agencies. We generally rely on our clients’ assurances that any such information is requested and used for permissible purposes, but we cannot be certain that our clients comply with these restrictions. We could incur costs or could be subject to fines or other penalties if the FTC determines that we have mishandled protected information.
Many jurisdictions, including the majority of states, have data security laws including data security breach notification laws. When our clients operate in industries that have specialized data privacy and security requirements, they may be subject to additional data protection restrictions. For example, the federal Health Insurance Portability and Accountability Act, or HIPAA, regulates the maintenance, use and disclosure of personally identifiable health information by certain health care-related entities. States may adopt privacy and security regulations that are more stringent than federal rules, and we may be required by such regulations to establish comprehensive data security programs that could be costly. If we experience a breach of data security, we could be subject to costly legal proceedings that could lead to civil damages, fines or other penalties. We or our clients could be required to report such breaches to affected consumers or regulatory authorities, leading to disclosures that could damage our reputation or harm our business, financial position and operating results.
Since 2007 we have been certified as compliant with the Payment Card Industry, or PCI, Data Security Standard, which mandates a set of comprehensive requirements for protecting payment account data. Our continuing PCI compliance is essential for many of our customer communication offerings, such as fully-automated payment transactions and payment authorizations, and is particularly important for financial institutions, credit card issuers and retailers. We must seek and receive certification of PCI compliance on an annual basis. PCI compliance measures are rigorous and subject to change, and our implementation of new customer communication platform technology and solutions could adversely affect our ability to be re-certified. As a
33
Table of Contents
result, we cannot assure you that we will be able to maintain our certification for PCI compliance. Our loss of PCI certification could make our customer communication solutions less attractive to potential customers, particularly those in the financial and retail industries, which in turn could have an adverse effect on our revenue and other operating results.
We may record certain of our calls for quality assurance, training or other purposes. Many states require both parties to consent to such recording, and may adopt inconsistent standards defining what type of consent is required. Violations of these rules could subject us to fines or other penalties, criminal liability, or claims by clients for damages, any of which could hurt our reputation or harm our business, financial position and operating results.
It may be impossible for us to comply with the different data protection regulations that affect us in different jurisdictions. For example, the USA PATRIOT Act provides U.S. law enforcement authorities certain rights to obtain personal information in the control of U.S. persons and entities without notifying the affected individuals. Some foreign laws, including some in the European Union, prohibit such disclosures. Such conflicts could subject us and clients to costs, liabilities or negative publicity that could impair our ability to expand our operations into some countries and therefore limit our future growth.
The expansion of our business into international markets requires us to comply with additional debt collection, telemarketing, data privacy or similar regulations, which may make it costly or difficult to operate in these markets.
Although historically we have targeted substantially all of our sales and marketing efforts principally to businesses located in the United States, more recently we have begun focusing more resources on businesses located in Europe. In April 2010, for example, we formed a subsidiary under UK law to target businesses located in the United Kingdom. Countries other than the United States have laws and regulations governing debt collection, telemarketing, data privacy or other communications activities comparable in purpose to the U.S. and state laws and regulations described above. Compliance with these requirements may be costly and time consuming, and may limit our ability to operate successfully in one or more foreign jurisdictions.
Many of the regulations governing our activities in the European Union result from EU legislation on privacy and data protection. As a result, the principal lawmakers for our purposes are European institutions – the European Commission, the European Parliament and the Council of Ministers. We take into account developments in the European Union as well as developments in the United Kingdom. Because our primary international business is driven from the United Kingdom, our regulatory due diligence to date has been focused on this member State. In terms of enforcement, the UK regulators of primary importance to us are:
| Ÿ | Ofcom, the independent regulator and competition authority for the UK communications industry; |
| Ÿ | the Information Commissioner, an independent authority whose role is to uphold information rights in the public interest, promoting openness by public bodies and data privacy for individuals; and |
| Ÿ | the Office of Fair Trading, an independent authority that enforces consumer protection and competition laws and reviews proposed mergers. |
The Communications Act of 2003 gives Ofcom the power to issue and enforce notifications when it has reasonable grounds to believe a person has persistently misused an electronic communications network or service in such a manner, or otherwise engage in conduct that has either the effect, or likely effect, of causing another person unnecessarily to suffer annoyance, inconvenience or anxiety. The other sector-specific legislation governing our UK operations consists of The Privacy and Electronic Communications (EC Directive) (Amendment) Regulations (2003) as amended in 2011 to implement the new e-privacy EU Directive. These regulations contain marketing rules governing businesses that send marketing and advertising by electronic means such as telephone,
34
Table of Contents
fax, email, text message and picture (including video) message and by using an automated calling system. These regulations also cover related areas such as telephone directories, traffic and location data, and the use of cookies.
Risks Related to Ownership of Our Common Stock
If equity research analysts do not publish research or reports about our business or if they issue unfavorable commentary or downgrade our common stock, the price of our common stock could decline.
The trading market for our common stock depends in part on the research and reports that equity research analysts publish about our company and business. The price of our common stock could decline if one or more equity research analysts downgrade our common stock or if those analysts issue other unfavorable commentary or cease publishing reports about our company and business.
Future sales of our common stock by existing stockholders could cause our stock price to decline.
If our existing stockholders sell substantial amounts of our common stock in the public market, the market price of our common stock could decrease significantly. The perception in the public market that our stockholders might sell shares of common stock could also depress the market price of our common stock. The market price of shares of our common stock could drop significantly if our officers, directors or other stockholders decide to sell shares of our common stock into the market.
Our directors, executive officers and their affiliated entities will continue to have substantial control over us and could limit the ability of other stockholders to influence the outcome of key transactions, including changes of control.
As of March 1, 2012, our executive officers and directors and their affiliated entities, in the aggregate, beneficially owned 41% of our common stock. In particular, affiliates of North Bridge Ventures Partners, including James A. Goldstein, one of our directors, in the aggregate, beneficially owned 29% of our common stock. Our executive officers, directors and their affiliated entities, if acting together, are able to control or significantly influence all matters requiring approval by our stockholders, including the election of directors and the approval of mergers or other significant corporate transactions. These stockholders may have interests that differ from those of other investors, and they might vote in a way with which other investors disagree. The concentration of ownership of our common stock could have the effect of delaying, preventing, or deterring a change of control of our company, could deprive our stockholders of an opportunity to receive a premium for their common stock as part of a sale of our company, and could negatively affect the market price of our common stock.
Our corporate documents and Delaware law make a takeover of our company more difficult, which could prevent certain changes in control and limit the market price of our common stock.
Our charter and by-laws and Section 203 of the Delaware General Corporation Law contain provisions that could enable our management to resist a takeover of our company. These provisions could discourage, delay, or prevent a change in the control of our company or a change in our management. They could also discourage proxy contests and make it more difficult for stockholders to elect directors and take other corporate actions. The existence of these provisions could limit the price that investors are willing to pay in the future for shares of our common stock. Some provisions in our charter and by-laws could deter third parties from acquiring us, which could limit the market price of our common stock.
We do not intend to pay dividends on our common stock in the foreseeable future.
We have never declared or paid any cash dividends on our common stock. We currently intend to retain any future earnings and do not expect to pay any dividends in the foreseeable future. Accordingly, investors are not
35
Table of Contents
likely to receive any dividends on their common stock in the foreseeable future, and their ability to achieve a return on their investment will therefore depend on appreciation in the price of our common stock.
| Item 1B. | Unresolved Staff Comments |
None.
| Item 2. | Properties |
In May 2007 we entered into a lease for 37,000 square feet of office space for our headquarters in Bedford, Massachusetts. The term of the lease commenced as of September 17, 2007 and will expire in September 2013. We have the option to extend the lease term through September 2018 by providing written notice. In addition, in May 2008 we entered into a lease for a single sales office in Grapevine, Texas. This lease is for a seven month term and automatically renews for an additional seven months unless written notification is made at least 60 days prior to the expiration of the renewal. In connection with the SmartReply asset acquisition in June 2011, we entered into a lease for office space in Irvine, California. This lease will expire in April 2012. We are not opting to extend this lease and are currently evaluating other lease options. In connection with the 2ergo Americas acquisition in February 2012, we became party to a lease for office space in Arlington, Virginia. This lease will expire in April 2012. We expect to extend the lease for a three year term.
We serve our clients from five third-party hosting facilities. One facility is located in Ashburn, Virginia, and is leased under an agreement that expires in March 2012. Another facility is located in Somerville, Massachusetts, and is leased under an agreement that expires in May 2012. Our agreements for these two facilities automatically renew for one-month periods under current terms unless written notification is made by either party 90 days prior to renewal. Our third hosting facility is located in Slough, United Kingdom and leased under an agreement that automatically renews for twelve-month periods unless written notification is made by either party three months prior to the expiration date. Our fourth facility is located in Las Vegas, Nevada and is leased under an agreement that automatically renews for monthly periods unless written notification is made 30 days prior to the expiration date. Our fifth facility, which also is located in Ashburn, Virginia, is leased by 2ergo Americas under an agreement that expires in 2014.
| Item 3. | Legal Proceedings |
Indemnification Regarding Karayan Litigation
Over the past several months, class action litigation has been initiated against a number of banks and retailers, including some of our clients, alleging that “mobile termination” text messages violate the U.S. Telephone Consumer Protection Act or TCPA, which seeks to protect the privacy interests of residential telephone subscribers. When a business receives a text message indicating that the sender wishes to “opt out” of further text communications from the business, a mobile termination text message may be transmitted automatically in order to confirm that the business received the opt-out message and will not send any additional text messages.
On October 21, 2011, we received a notice from GameStop Corp. and GameStop Inc., which together we refer to as GameStop, requesting indemnification in connection with a class action litigation entitled Karayan v. GameStop Corp. and GameStop Inc., which we refer to as the Karayan Litigation, which had been initiated against GameStop based in part on mobile termination text messages. We are not a named defendant or other party in the Karayan Litigation.
On January 6, 2012, we delivered a letter agreement to GameStop, in which we agreed to indemnify GameStop in relation to the Karayan Litigation. After investigation, we determined to deliver the letter agreement dated January 6, 2012 in order to, pursuant to the provisions of our Master Pricing Agreement with GameStop, (a) indemnify GameStop for damages, losses and fees resulting from the aspects of the Karayan Litigation relating to mobile termination text messages and (b) confirm that we will take sole control over the defense, and any settlement, of those aspects of the Karayan Litigation. In addition to claims relating to mobile
36
Table of Contents
termination text messages, the Karayan Litigation also asserts claims alleging that GameStop is liable to certain of its customers because it failed to obtain prior express consent to the delivery of text messages. In the letter agreement, we reserved our rights concerning any argument that we may have as to our obligation to indemnify GameStop with respect to the aspects of the Karayan Litigation relating to the alleged lack of prior express consent.
We intend to defend vigorously against the claims in the Karayan Litigation that allege GameStop violated provisions of the TCPA in delivering mobile termination text messages. We are continuing to investigate this matter. At this time it is not possible for us to estimate the amount of damages, losses, fees and other expenses that we will incur as the result of our indemnification obligations to GameStop, but such an amount could have a material adverse effect on our business, financial condition and operating results. Even if we succeed in defending against the Karayan Litigation, we are likely to incur substantial costs and our management’s attention will be diverted from our operations.
See “Item 1A. Risk Factors – We could be subject to substantial damages and expenses if our clients violate U.S. Telephone Consumer Protection Act restrictions as the result of the use of mobile termination text messages.”
Sager Litigation
On January 11, 2012, a class action litigation, which we refer to as the Sager Litigation, was filed against Bank of America and us as co-defendants. The Sager Litigation alleges that we and Bank of America sent text massages to the plaintiff without the plaintiff’s prior express consent, in violation of the TCPA. Plaintiff is seeking confirmation of a class of individuals who received unauthorized text message solicitations from us. We intend to defend vigorously against the claims in the Sager Litigation that allege we violated provisions of the TCPA in delivering text messages. We are continuing to investigate this matter. At this time it is not possible for us to estimate the amount of damages, losses, fees and other expenses that we will incur as the result of the Sager Litigation, but such an amount could have a material adverse effect on our business, financial condition and operating results. Even if we succeed in defending against the Sager Litigation, we are likely to incur substantial costs and our management’s attention will be diverted from our operations.
See “Item 1A. Risk Factors – We could be subject to significant penalties or damages if our clients violate U.S. federal or state restrictions on the use of artificial or prerecorded messages to contact wireless telephone numbers, and our business and operating results could be substantially harmed if those restrictions make our service unavailable or less attractive.”
Other Proceedings
The customer communications industry is characterized by frequent claims and litigation, including claims regarding patent and other intellectual property rights as well as improper hiring practices. As a result, we may be involved in various legal proceedings from time to time.
| Item 4. | Mine Safety Disclosures |
Not applicable.
37
Table of Contents
| Item 5. | Market for Registrant’s Common Equity, Related Stockholder Matters and Issuer Purchases of Equity Securities |
Market Price of Common Stock
Our common stock has been traded on The NASDAQ Global Market under the symbol “SDBT” since November 6, 2007. Prior to that time, there was no established public trading market for our common stock. The following table presents the high and low sale prices of our common stock as reported by The NASDAQ Global Market, for the periods indicated.
| Fiscal year ended December 31, 2011 |
High | Low | ||||||
| First quarter |
$ | 2.96 | $ | 2.45 | ||||
| Second quarter |
$ | 2.67 | $ | 2.36 | ||||
| Third quarter |
$ | 2.83 | $ | 2.25 | ||||
| Fourth quarter |
$ | 2.64 | $ | 2.10 | ||||
| Fiscal year ended December 31, 2010 |
High | Low | ||||||
| First quarter |
$ | 3.01 | $ | 2.81 | ||||
| Second quarter |
$ | 2.88 | $ | 2.86 | ||||
| Third quarter |
$ | 2.72 | $ | 2.60 | ||||
| Fourth quarter |
$ | 2.85 | $ | 2.79 | ||||
The last sale price of the common stock on March 1, 2012, as reported by The NASDAQ Global Market, was $3.10 per share. As of March 1, 2012, there were 42 holders of record of the common stock.
We have never declared or paid any cash dividends on our common stock and currently expect to retain future earnings for use in our business for the foreseeable future.
Purchases of Equity Securities by the Issuer
The following table sets forth, for the month indicated, our purchases of common stock in the fourth quarter of fiscal 2011:
Issuer Purchases of Equity Securities
| Period |
(a) Total Number of Shares Purchased(1) |
(b) Average Price Paid per Share |
(c) Total Number of Shares Purchased as Part of Publicly Announced Program(2) |
(d) Approximate Dollar Value of Shares that May Yet Be Purchased Under the Program |
||||||||||||
| October 1 to 31, 2011 |
3,100 | $ | 2.37 | 3,100 | ||||||||||||
| November 1 to 30, 2011 |
15,800 | $ | 2.35 | 15,800 | ||||||||||||
| December 1 to 31, 2011 |
28,900 | $ | 2.28 | 28,900 | ||||||||||||
|
|
|
|
|
|||||||||||||
| Total |
47,800 | $ | 2.30 | 47,800 | $ | 2,359,000 | ||||||||||
|
|
|
|
|
|||||||||||||
| (1) | As of December 31, 2011, we had repurchased an aggregate of 60,394 shares of our common stock pursuant to the repurchase program that we publicly announced in March 2010. |
| (2) | The board of directors approved our repurchase of shares of common stock having a value of up to $2,500,000 in the aggregate pursuant to the program announced in March 2010. |
38
Table of Contents
| Item 6. | Selected Financial Data |
The following table summarizes selected financial data for our business and is derived from our historical consolidated financial statements. You should read the selected financial data in conjunction with “Item 7. Management’s Discussion and Analysis of Financial Condition and Results of Operations” below and our consolidated financial statements and related notes included elsewhere herein.
| Years Ended December 31, | ||||||||||||||||||||
| 2011 | 2010 | 2009 | 2008 | 2007 | ||||||||||||||||
| (In thousands, except per share data) | ||||||||||||||||||||
| Statement of Operations Data: |
||||||||||||||||||||
| Revenues |
$ | 41,653 | $ | 39,494 | $ | 40,183 | $ | 43,211 | $ | 39,492 | ||||||||||
| Cost of revenues |
17,018 | 15,955 | 15,899 | 16,695 | 14,258 | |||||||||||||||
|
|
|
|
|
|
|
|
|
|
|
|||||||||||
| Gross profit |
24,635 | 23,539 | 24,284 | 26,516 | 25,234 | |||||||||||||||
|
|
|
|
|
|
|
|
|
|
|
|||||||||||
| Operating expenses: |
||||||||||||||||||||
| Research and development |
6,114 | 5,886 | 5,628 | 5,151 | 3,913 | |||||||||||||||
| Sales and marketing |
14,084 | 14,171 | 14,784 | 17,974 | 14,702 | |||||||||||||||
| General and administrative |
6,835 | 6,799 | 7,836 | 9,977 | 5,999 | |||||||||||||||
| Impairment of goodwill |
— | — | 121 | 248 | — | |||||||||||||||
|
|
|
|
|
|
|
|
|
|
|
|||||||||||
| Total operating expenses |
27,033 | 26,856 | 28,369 | 33,350 | 24,614 | |||||||||||||||
|
|
|
|
|
|
|
|
|
|
|
|||||||||||
| Operating (loss) income |
(2,398 | ) | (3,317 | ) | (4,085 | ) | (6,834 | ) | 620 | |||||||||||
|
|
|
|
|
|
|
|
|
|
|
|||||||||||
| Other income (expense): |
||||||||||||||||||||
| Interest income |
25 | 9 | 70 | 936 | 476 | |||||||||||||||
| Interest expense |
— | — | — | — | (222 | ) | ||||||||||||||
| Warrant charge for change in fair value |
— | — | — | — | (352 | ) | ||||||||||||||
| Gain on litigation settlement |
— | — | — | 4,600 | — | |||||||||||||||
| Other, net |
(25 | ) | (7 | ) | — | — | — | |||||||||||||
|
|
|
|
|
|
|
|
|
|
|
|||||||||||
| Total other income (expense), net |
0 | 2 | 70 | 5,536 | (98 | ) | ||||||||||||||
|
|
|
|
|
|
|
|
|
|
|
|||||||||||
| (Loss) income before provision for income taxes |
(2,398 | ) | (3,315 | ) | (4,015 | ) | (1,298 | ) | 522 | |||||||||||
| (Benefit) provision for income taxes |
(891 | ) | (30 | ) | 16 | 21 | 56 | |||||||||||||
|
|
|
|
|
|
|
|
|
|
|
|||||||||||
| Net (loss) income |
(1,507 | ) | (3,285 | ) | (4,031 | ) | (1,319 | ) | 466 | |||||||||||
| Accretion of preferred stock |
— | — | — | — | (37 | ) | ||||||||||||||
|
|
|
|
|
|
|
|
|
|
|
|||||||||||
| Net (loss) income attributable to common stockholders |
$ | (1,507 | ) | $ | (3,285 | ) | $ | (4,031 | ) | $ | (1,319 | ) | $ | 429 | ||||||
|
|
|
|
|
|
|
|
|
|
|
|||||||||||
| (Loss) income per common share: |
||||||||||||||||||||
| Basic: |
||||||||||||||||||||
| Net (loss) income attributable to common stockholders |
$ | (0.09 | ) | $ | (0.20 | ) | $ | (0.25 | ) | $ | (0.09 | ) | $ | 0.15 | ||||||
| Diluted: |
||||||||||||||||||||
| Net (loss) income attributable to common stockholders |
$ | (0.09 | ) | $ | (0.20 | ) | $ | (0.25 | ) | $ | (0.09 | ) | $ | 0.03 | ||||||
| Weighted average common shares outstanding: |
||||||||||||||||||||
| Basic |
16,436 | 16,344 | 15,961 | 15,369 | 2,860 | |||||||||||||||
| Diluted |
16,436 | 16,344 | 15,961 | 15,369 | 12,778 | |||||||||||||||
39
Table of Contents
| As of December 31, | ||||||||||||||||||||
| 2011 | 2010 | 2009 | 2008 | 2007 | ||||||||||||||||
| (In thousands) | ||||||||||||||||||||
| Balance Sheet Data: |
||||||||||||||||||||
| Cash and cash equivalents |
$ | 17,706 | $ | 34,157 | $ | 36,322 | $ | 37,425 | $ | 35,674 | ||||||||||
| Short-term investments |
10,976 | — | — | — | — | |||||||||||||||
| Working capital |
33,491 | 37,553 | 40,359 | 41,665 | 39,920 | |||||||||||||||
| Total assets |
46,785 | 45,975 | 47,754 | 49,830 | 50,489 | |||||||||||||||
| Total stockholders’ equity |
$ | 40,769 | $ | 41,190 | $ | 43,032 | $ | 45,754 | $ | 46,165 | ||||||||||
| Item 7. | Management’s Discussion and Analysis of Financial Condition and Results of Operations |
You should read the following discussion in conjunction with our financial statements and related notes appearing elsewhere in this annual report. In addition to historical information, this discussion contains forward-looking statements that involve risks, uncertainties and assumptions that could cause our actual results to differ materially from our expectations. Factors that could cause such differences include those described in “Item 1A. Risk Factors” and elsewhere in this annual report.
Overview
We provide cloud-based, multi-channel services that enable businesses to design, execute and measure customer communication campaigns for a variety of marketing, customer care, payment and collection processes. Clients use the SoundBite Engage and SoundBite Insight platforms to communicate proactively with their customers through automated voice messaging, predictive dialing, emails, text messaging and web communications that are relevant, timely, personalized and engaging.
Our services are provided using a multi-tenant, cloud-based architecture that enables us to serve all of our clients cost-effectively. “Cloud-based” refers to the delivery of technology services through the Internet, which includes delivery of software as a service or SaaS. Because our services are cloud-based, businesses using our services do not need to invest in or maintain new hardware or to hire and manage additional dedicated information technology staff. In addition, we are able to implement new features on our platforms that become part of our services automatically and can benefit all clients immediately. Our secure platforms are designed to serve increasing numbers of clients and growing demand from existing clients, enabling the platforms to scale reliably and cost-effectively.
We serve two global markets: hosted contact centers and mobile marketing. Our hosted contact center services are used primarily by companies in the accounts receivable management (or collections), energy and utilities, financial services, retail, and telecommunications and media industries. Our mobile marketing client base consists principally of companies in the consumer package goods, retail, and telecommunications and media industries.
In 2011 our services were used by more than 400 businesses located in the United States and Europe. We use our direct sales channel principally to target large business-to-consumer companies, and we leverage our partnership channel to offer our services more broadly within our target markets, to enter new vertical markets, to augment our international expansion and to sell to smaller businesses cost effectively.
We derive, and expect to continue to derive for the foreseeable future, a substantial majority of our revenues from the hosted contact center market. Our strategy for achieving long-term, sustained growth in our revenues and net income is focused on building upon our leadership position in the hosted contact center market and executing on our key initiatives. For example, one of our strategic initiatives is targeted on the high growth area of mobile marketing, which leverages our text capabilities. In line with this strategy, in June 2011 we acquired
40
Table of Contents
key assets and assumed certain liabilities of SmartReply, a mobile marketing company located in Irvine, California. Additionally, in February 2012, we acquired 2ergo Americas, the U.S. operations of 2ergo Group plc, a mobile business and marketing solutions company located in Arlington, Virginia.
Key Components of Results of Operations
Revenues
We currently derive a substantial portion of our revenues by providing our services for use by clients in communicating with their customers through voice, text and email messages. We provide our services under a combination of usage and subscription-based models. Under our usage-based model, prices are calculated on a per-message or per-minute basis in accordance with the terms of pricing agreements with clients. We primarily invoice our clients on a monthly basis.
Our pricing agreements with a substantial majority of our clients either do not require any minimum usage or payments, or require only an immaterial level of usage or payments. Each executed message represents a transaction from which we derive revenues, and we therefore recognize revenue based on actual usage within a calendar month. We do not recognize revenue until we can determine that persuasive evidence of an arrangement exists, delivery has occurred, the fee is fixed or determinable and we deem collection to be probable.
Cost of Revenues
Cost of revenues consist primarily of telephony and text message charges, compensation expense for our operations personnel, depreciation and maintenance expense for our platforms and lease costs for our data center facilities. As we continue to grow our business and add features to our platforms, we expect cost of revenues will continue to increase on an absolute dollar basis. Our annual gross margin was 59.1% in 2011, 59.6% in 2010 and 60.4% in 2009. We currently are targeting a gross margin of 59% to 61% for the foreseeable future. Our gross margin may vary significantly from our target range for a number of reasons, including revenue levels, the mix of types of messaging campaigns executed, as well as the extent to which we build our infrastructure through, for example, significant acquisitions of hardware or material increases in leased data center facilities.
Operating Expenses
Research and Development. Research and development expenses consist primarily of compensation expenses and depreciation expense of certain equipment related to the development of our services. We have historically focused our research and development efforts on improving and enhancing our platforms, as well as developing new features and offerings.
Sales and Marketing. Sales and marketing expenses consist primarily of compensation for our sales and marketing personnel, including sales commissions, as well as the costs of our marketing programs. We expect to further invest in developing our marketing strategy and activities to extend brand awareness and generate additional leads for our sales staff.
General and Administrative. General and administrative expenses consist of compensation expenses for executive, finance, accounting, administrative and management information systems personnel, accounting and legal professional fees and other corporate expenses.
Recent Developments
Cost Saving Activities. In May 2011, we eliminated two research and development positions, five sales and marketing positions, and one general and administrative position in order to lower our cost of operations. In addition to these reductions, we also reduced the use of external contracting resources. These actions resulted in cost savings of approximately $500,000 in 2011.
41
Table of Contents
SmartReply Asset Acquisition. As a result of our acquisition of key assets of SmartReply in June 2011, we incurred an additional $2.2 million in operating expenses in 2011, excluding costs related to the purchase price. The additional operating expenses incurred during 2011 included $688,000 of amortization expense related to the acquisition of intangible assets, primarily customer lists. We estimate this expense will be $907,000 for 2012 and $569,000 for 2013.
2ergo Americas Acquisition. In February 2012, we acquired 2ergo Americas, the U.S. operations of 2ergo Group plc, for a cash purchase price of $3.8 million (subject to post closing adjustment). 2ergo Americas is a mobile business and marketing solutions company located in Arlington, Virginia and has a current annualized revenue run rate of approximately $3.5 million.
Additional Key Measures of Financial Performance
We present information below with respect to cash flow from operating activities and free cash flow. Free cash flow is a measure of financial performance calculated as cash flow from operating activities plus proceeds from the sale of equipment, less payments of contingent purchase price, investments in capitalized software and purchases of property and equipment.
Management uses these metrics to track business performance. Due to the current economic environment, management decisions are based in part, on a goal of maintaining positive cash flow from operating activities and free cash flow. We believe these metrics are useful measures of the performance of our business because, in contrast to statement of operations metrics that rely principally on revenue and profitability, cash flow from operating activities and free cash flow capture the changes in operating assets and liabilities during the year and the effect of noncash items such as depreciation and stock-based compensation. We believe that, for similar reasons, these metrics are often used by security analysts, investors and other interested parties in the evaluation of SaaS and other software companies.
The term “free cash flow” is not defined under U.S. generally accepted accounting principles, or GAAP, and is not a measure of operating income, operating performance or liquidity presented in accordance with GAAP. All or a portion of free cash flow may be unavailable for discretionary expenditures. Free cash flow has limitations as an analytical tool and when assessing our operating performance, you should not consider free cash flow in isolation from or as a substitute for data, such as net income (loss), derived from financial statements prepared in accordance with GAAP.
| As of December 31, | ||||||||||||
| 2011 | 2010 | 2009 | ||||||||||
| (In thousands) | ||||||||||||
| Cash flows (used in) generated from operating activities |
$ | (701 | ) | $ | 313 | $ | (294 | ) | ||||
| Proceeds from sale of equipment |
3 | 2 | — | |||||||||
| Contingent purchase price payments to Mobile Collect |
(691 | ) | (503 | ) | (256 | ) | ||||||
| Investments in capitalized software |
— | (500 | ) | — | ||||||||
| Purchases of property and equipment |
(842 | ) | (1,567 | ) | (885 | ) | ||||||
|
|
|
|
|
|
|
|||||||
| Free cash flow (non-GAAP) |
$ | (2,231 | ) | $ | (2,255 | ) | $ | (1,435 | ) | |||
|
|
|
|
|
|
|
|||||||
Our operating activities used net cash in the amount of $701,000 for the year ended December 31, 2011 reflecting a net loss of $1.5 million, which was offset in part by non-cash charges and changes in working capital of $806,000. Those charges and changes consisted primarily of (a) depreciation and amortization expense of $2.2 million and (b) stock-based compensation expense of $1.2 million, partially offset by (c) an increase in accrued expenses and accounts payable of $786,000, (d) an increase in accounts receivable and prepaid expenses of $1.1 million, and (e) a deferred income tax benefit of $905,000. The increase in accrued expenses and accounts payable was due to the timing of payments, and the increase in accounts receivable and prepaid expenses reflected the timing of receipts from our clients, as well as advance payments of certain operating costs.
42
Table of Contents
Our operating activities generated net cash in the amount of $313,000 for the year ended December 31, 2010 reflecting a net loss of $3.3 million, which was offset by non-cash charges and changes in working capital of $3.5 million consisting primarily of (a) depreciation expense of $1.8 million, (b) stock-based compensation expense of $1.4 million, and (c) a decrease in accounts receivable, prepaid expenses and other assets of $302,000 due to the timing of receipts from our clients and the advance payments of certain operating costs.
Our operating activities used net cash in the amount of $294,000 for the year ended December 31, 2009 reflecting a net loss of $4.0 million and an increase in accounts receivable, prepaid expenses and other assets of $460,000, mainly due to the timing of receipts from our clients. These changes were partially offset by non-cash charges of $3.8 million, which consisted primarily of depreciation expense of $2.5 million, as well as an increase in accrued expenses and accounts payable of $429,000 due to the timing of payments to our vendors.
Free cash flow in each of the years presented reflects, in addition to the factors driving cash flow from operating activities, our purchases of property and equipment, which consists primarily of computer equipment and software, investments in capitalized software, proceeds from the sale of our equipment and our payments of contingent purchase price in connection with our acquisition of the assets of Mobile Collect in 2008.
Critical Accounting Policies
Our financial statements are prepared in accordance with GAAP. The preparation of our financial statements requires us to make estimates and assumptions that affect the reported amounts of assets, liabilities, revenues, costs and expenses and related disclosures. On an ongoing basis, we evaluate our estimates and assumptions. Our actual results may differ from these estimates under different assumptions or conditions.
We believe that of our significant accounting policies, which are described in the notes to our financial statements, the following accounting policies involve a greater degree of judgment and complexity. A critical accounting policy is one that both is material to the presentation of our financial statements and requires us to make difficult, subjective or complex judgments for uncertain matters that could have a material effect on our financial condition and results of operations. Accordingly, these are the policies we believe are the most critical to aid in fully understanding and evaluating our financial condition and results of operations.
Valuation of Goodwill
We have recognized goodwill from our February 2008 acquisition of the assets of Mobile Collect, in which a significant portion of the consideration was contingent on the future revenues of the acquired assets. Because of the accounting rules in effect at the time of the acquisition and the uncertainties with respect to future revenues, the contingent consideration was recognized as additional purchase price as the consideration was determined and became payable. We expect the final payment for this asset acquisition, approximating $200,000, will come due in 2012. As of December 31, 2011, we have recognized $1.6 million of goodwill from this acquisition. In addition, we have recognized $2.7 million of goodwill from our June 2011 acquisition of key assets of Smart Reply.
Recorded goodwill at December 31, 2011 totaled $4.3 million. Goodwill is not amortized, but instead is reviewed for impairment annually or more frequently if impairment indicators arise. We evaluate goodwill on an annual basis for impairment and have selected November 1 as the annual impairment testing date. We operate as a single operating segment and have concluded that our Company is comprised of one reporting unit.
As a result of the economic environment impacting our business and operating results coupled with a material decline of our stock price, we determined impairment triggering events had occurred that required interim impairment evaluations, which resulted in impairment charges totaling $121,000 for the year ended December 31, 2009.
43
Table of Contents
At November 1, 2011, the last impairment testing date, the fair value of the reporting unit was determined using a market approach, which utilized our market capitalization as a basis for estimating fair value and we applied a control premium of 40%.
Our fair market value exceeded our carrying value by approximately 34% at November 1, 2011, our most recent annual impairment assessment date. As such, no indications of impairment were noted. Our stock price is volatile, however, and future changes in the quoted price of our stock or in other judgments that underlie the fair value estimates, including an estimated control premium, may indicate that the fair value of our reporting unit is less than the carrying value, which may result in future impairment charges.
Valuation of Contingent Consideration
For the June 2011 Smart Reply asset acquisition, we recorded contingent consideration at its fair value on the acquisition date. Each reporting period thereafter, we remeasure the fair value of this obligation and record increases or decreases in their fair value as an adjustment to contingent consideration expense within the consolidated statement of operations. Changes in the fair value of the contingent consideration obligations can result from adjustments to the discount rates and passage of time, as well as updates in the assumed achievement or timing of any performance targets. These fair value measurements represent Level 3 measurements as they are based on significant inputs not observable in the market (for a discussion of the fair value hierarchy, including Level 3, see Note 10 to our consolidated financial statements included elsewhere herein).
Significant judgment is employed in determining the appropriateness of these assumptions as of the acquisition date and for each subsequent period. Accordingly, changes in the assumptions could have a material impact on the amount of contingent consideration expense we record in any given period.
As a result of the June 2011 acquisition of SmartReply assets, we recognized a liability totaling $1.2 million, representing the present value of the probability-weighted estimate of the future payments that arose from a contingent consideration arrangement in the form of an earn-out. The earn-out requires cash payments that we estimated will be $1.7 million, but the arrangement provides for up to a maximum of $8.9 million, which may become payable annually over three years based upon year-over-year revenue growth from the acquired mobile marketing business and enhancements to our select legacy customer revenues. As actual mobile marketing revenues are recognized, the liability for the contingent consideration will periodically be adjusted to reflect our best estimate of the ultimate payout under this arrangement. The adjustments to the fair value from the acquisition date to December 31, 2011 were not material.
Income Taxes
We are subject to federal and various state income taxes in the United States, and we use estimates in determining our provision for these income taxes. In addition, we are subject to Canadian and UK taxes for profits generated from our wholly owned subsidiaries. Deferred tax assets, related valuation allowances, current tax liabilities and deferred tax liabilities are determined separately by tax jurisdiction. At December 31, 2011, our deferred tax assets consisted primarily of federal net operating loss carryforwards and state research and development credit carryforwards. We assess the likelihood that deferred tax assets will be realized, and we recognize a valuation allowance if it is more likely than not that some portion of the deferred tax assets will not be realized. This assessment requires judgment as to the likelihood and amounts of future taxable income by tax jurisdiction. At December 31, 2011, we had a full valuation allowance against our deferred tax assets, which totaled approximately $10.1 million, due to the current uncertainty related to when, if ever, these assets will be realized. In the event that we determine in the future that we will be able to realize all or a portion of our net deferred tax asset, an adjustment to the deferred tax valuation allowance would increase earnings in the period in which such a determination is made. In 2011, we recorded deferred tax liabilities of $905,000, primarily related to the intangible assets acquired with SmartReply, and released a corresponding amount of deferred tax asset valuation allowance. The $905,000 release of the valuation allowance was recognized as a benefit for income taxes during the year ending December 31, 2011.
44
Table of Contents
Results of Operations
The following table sets forth selected statements of operations data for 2011, 2010 and 2009 indicated as percentages of revenues.
| Years Ended December 31, | ||||||||||||
| 2011 | 2010 | 2009 | ||||||||||
| Statement of Operations Data: |
||||||||||||
| Revenues |
100.0 | % | 100.0 | % | 100.0 | % | ||||||
| Cost of revenues |
40.9 | 40.4 | 39.6 | |||||||||
|
|
|
|
|
|
|
|||||||
| Gross margin |
59.1 | 59.6 | 60.4 | |||||||||
|
|
|
|
|
|
|
|||||||
| Operating expenses: |
||||||||||||
| Research and development |
14.7 | 14.9 | 14.0 | |||||||||
| Sales and marketing |
33.8 | 35.9 | 36.8 | |||||||||
| General and administrative |
16.4 | 17.2 | 19.5 | |||||||||
| Impairment of goodwill |
0.0 | 0.0 | 0.3 | |||||||||
|
|
|
|
|
|
|
|||||||
| Total operating expenses |
64.9 | 68.0 | 70.6 | |||||||||
|
|
|
|
|
|
|
|||||||
| Operating loss |
(5.8 | ) | (8.4 | ) | (10.2 | ) | ||||||
| Total other income |
0.0 | 0.0 | 0.2 | |||||||||
|
|
|
|
|
|
|
|||||||
| Loss before provision for income taxes |
(5.8 | ) | (8.4 | ) | (10.0 | ) | ||||||
| (Benefit) provision for income taxes |
(2.2 | ) | (0.1 | ) | 0.0 | |||||||
|
|
|
|
|
|
|
|||||||
| Net loss |
(3.6 | )% | (8.3 | )% | (10.0 | )% | ||||||
|
|
|
|
|
|
|
|||||||
Comparison of Years Ended December 31, 2011 and 2010
Revenues
| 2011 | 2010 | Year-to-Year Change | ||||||||||||||||||||||
| Amount | Percentage
of Revenues |
Amount | Percentage
of Revenues |
Amount | Percentage Change |
|||||||||||||||||||
| (Dollars in thousands) | ||||||||||||||||||||||||
| Revenues |
$ | 41,653 | 100.0 | % | $ | 39,494 | 100.0 | % | $ | 2,159 | 5.5 | % | ||||||||||||
The $2.2 million increase in revenues in 2011 as compared to 2010 was mainly due to the acquisition of SmartReply assets in June 2011. Revenues from legacy clients of SmartReply totaled $3.1 million. Revenues from new clients, excluding legacy clients of SmartReply, totaled $814,000, which was offset by a $1.7 million decrease in revenues attributable to clients from which we derived revenue during 2010. Non-voice revenues increased $3.0 million, which was offset by a decrease in voice revenues of $819,000. Non-voice revenues as a percentage of total revenues were 25.2% in 2011 and 19.5% in 2010. The growth of non-voice revenues is a trend we expect to continue.
Cost of Revenues and Gross Profit
| 2011 | 2010 | Year-to-Year Change | ||||||||||||||||||||||
| Amount | Percentage
of Revenues |
Amount | Percentage
of Revenues |
Amount | Percentage Change |
|||||||||||||||||||
| (Dollars in thousands) | ||||||||||||||||||||||||
| Cost of revenues |
$ | 17,018 | 40.9 | % | $ | 15,955 | 40.4 | % | $ | 1,063 | 6.7 | % | ||||||||||||
| Gross profit |
24,635 | 59.1 | 23,539 | 59.6 | 1,096 | 4.7 | ||||||||||||||||||
45
Table of Contents
The $1.1 million increase in cost of revenues in 2011 as compared to 2010 reflected a $698,000 increase in telephony expense mainly due to higher delivery costs, a $444,000 increase in text and email costs primarily due to higher client usage, a $113,000 increase in co-location costs due to the opening of a data center in the United Kingdom in the fourth quarter of 2010 and a $139,000 increase in amortization expense relating to our internal use software. These increases were partially offset by a $378,000 decrease in depreciation expense due to a lower depreciable base of our property and equipment. The decrease in gross margin in 2011 as compared to 2010 reflected lower price structure agreements entered into with some of our clients and changes in industry, service and geographic mix.
Operating Expenses
| 2011 | 2010 | Year-to-Year Change | ||||||||||||||||||||||
| Amount | Percentage
of Revenues |
Amount | Percentage
of Revenues |
Amount | Percentage Change |
|||||||||||||||||||
| (Dollars in thousands) | ||||||||||||||||||||||||
| Research and development |
$ | 6,114 | 14.7 | % | $ | 5,886 | 14.9 | % | $ | 228 | 3.9 | % | ||||||||||||
| Sales and marketing |
14,084 | 33.8 | 14,171 | 35.9 | (87 | ) | (0.6 | ) | ||||||||||||||||
| General and administrative |
6,835 | 16.4 | 6,799 | 17.2 | 36 | 0.5 | ||||||||||||||||||
|
|
|
|
|
|
|
|
|
|
|
|||||||||||||||
| Total operating expenses |
$ | 27,033 | 64.9 | % | $ | 26,856 | 68.0 | % | $ | 177 | 0.7 | % | ||||||||||||
|
|
|
|
|
|
|
|
|
|
|
|||||||||||||||
Research and Development. The $228,000 increase in research and development expenses in 2011 as compared to 2010 was primarily attributable to a $127,000 increase in personnel related costs and a $96,000 increase in occupancy related costs.
Sales and Marketing. The $87,000 decrease in sales and marketing expenses in 2011 as compared to 2010 resulted primarily from a $358,000 decrease in personnel related costs, a $208,000 decrease in marketing costs and a $145,000 decrease in travel and entertainment costs. These decreases were partially offset by $637,000 increase in amortization expense mainly related to customer lists from the acquisition of intangible assets from SmartReply in June 2011.
General and Administrative. The $36,000 increase in general and administrative expenses in 2011 as compared to 2010 reflected a $566,000 increase in professional service costs related to merger and acquisition activities and a $152,000 increase in consulting fees, partially offset by a $333,000 decrease in personnel related costs, a $175,000 decrease in professional service costs and a $120,000 decrease in depreciation expense.
Operating Loss and Other Income
| 2011 | 2010 | Year-to-Year Change | ||||||||||||||||||||||
| Amount | Percentage
of Revenues |
Amount | Percentage
of Revenues |
Amount | Percentage Change |
|||||||||||||||||||
| (Dollars in thousands) | ||||||||||||||||||||||||
| Operating loss |
$ | (2,398 | ) | (5.8 | )% | $ | (3,317 | ) | (8.4 | )% | $ | 919 | 27.7 | % | ||||||||||
| Interest and other income |
0 | 0.0 | 2 | 0.0 | (2 | ) | (100.0 | ) | ||||||||||||||||
|
|
|
|
|
|
|
|
|
|
|
|||||||||||||||
| Loss before provision for income taxes |
$ | (2,398 | ) | (5.8 | )% | $ | (3,315 | ) | (8.4 | )% | $ | 917 | 27.7 | % | ||||||||||
|
|
|
|
|
|
|
|
|
|
|
|||||||||||||||
Interest and other income was substantially unchanged from 2010 to 2011.
46
Table of Contents
Income Taxes and Net Loss
We recognized a net loss of $1.5 million in 2011 compared to $3.3 million in 2010. This difference principally reflected a decrease in our 2011 operating loss and an income tax benefit of $891,000 recorded in 2011 as compared to $30,000 in 2010. The 2011 tax benefit primarily related to the release of valuation allowance against our deferred tax assets due to the recognition of deferred tax liabilities associated with the acquisition of intangible assets of SmartReply in June 2011. Because of our history of losses, we have provided a full valuation allowance against all deferred tax assets.
Comparison of Years Ended December 31, 2010 and 2009
Revenues
| 2010 | 2009 | Year-to-Year Change | ||||||||||||||||||||||
| Amount | Percentage
of Revenues |
Amount | Percentage
of Revenues |
Amount | Percentage Change |
|||||||||||||||||||
| (Dollars in thousands) | ||||||||||||||||||||||||
| Revenues |
$ | 39,494 | 100.0 | % | $ | 40,183 | 100.0 | % | $ | (689 | ) | (1.7 | )% | |||||||||||
The $689,000 decrease in revenues in 2010 as compared to 2009 reflected a decrease in voice revenues of $3.8 million, which was partially offset by an increase in non-voice revenues of $3.1 million. The decrease in voice revenues was mainly due to lower calling volume in the large business to consumer market. Revenues from clients from which we derived revenue in both periods decreased $1.8 million, which was partially offset by revenues from new clients of $1.1 million.
Cost of Revenues and Gross Profit
| 2010 | 2009 | Year-to-Year Change | ||||||||||||||||||||||
| Amount | Percentage
of Revenues |
Amount | Percentage
of Revenues |
Amount | Percentage Change |
|||||||||||||||||||
| (Dollars in thousands) | ||||||||||||||||||||||||
| Cost of revenues |
$ | 15,955 | 40.4 | % | $ | 15,899 | 39.6 | % | $ | 56 | 0.4 | % | ||||||||||||
| Gross profit |
23,539 | 59.6 | 24,284 | 60.4 | (745 | ) | (3.1 | ) | ||||||||||||||||
The $56,000 increase in cost of revenues in 2010 as compared to 2009 reflected a $759,000 increase in text and email costs, as well as increased telephony expense of $254,000 due to higher client usage, increased equipment related costs of $176,000, and increased co-location costs of $140,000. These increases were partially offset by a $732,000 decrease in telephony expense related to lower delivery and circuit costs and a $573,000 decrease in depreciation expense due to a lower depreciable base of our property and equipment infrastructure. The decrease in gross margin in 2010 as compared to the same period in 2009 reflected lower price structure agreements entered into with some of our clients, as well as the vertical market and services mix.
Operating Expenses
| 2010 | 2009 | Year-to-Year Change | ||||||||||||||||||||||
| Amount | Percentage
of Revenues |
Amount | Percentage
of Revenues |
Amount | Percentage Change |
|||||||||||||||||||
| (Dollars in thousands) | ||||||||||||||||||||||||
| Research and development |
$ | 5,886 | 14.9 | % | $ | 5,628 | 14.0 | % | $ | 258 | 4.6 | % | ||||||||||||
| Sales and marketing |
14,171 | 35.9 | 14,784 | 36.8 | (613 | ) | (4.1 | ) | ||||||||||||||||
| General and administrative |
6,799 | 17.2 | 7,836 | 19.5 | (1,037 | ) | (13.2 | ) | ||||||||||||||||
| Impairment of goodwill |
— | 0.0 | 121 | 0.3 | (121 | ) | (100.0 | ) | ||||||||||||||||
|
|
|
|
|
|
|
|
|
|
|
|||||||||||||||
| Total operating expenses |
$ | 26,856 | 68.0 | % | $ | 28,369 | 70.6 | % | $ | (1,513 | ) | (5.3 | )% | |||||||||||
|
|
|
|
|
|
|
|
|
|
|
|||||||||||||||
47
Table of Contents
Research and Development. The $258,000 increase in research and development expenses in 2010 as compared to 2009 was primarily attributable to a $171,000 increase in personnel related costs and a $41,000 increase in consulting services.
Sales and Marketing. The $613,000 decrease in sales and marketing expenses in 2010 as compared to 2009 resulted primarily from a $420,000 decrease in personnel related costs, a $344,000 decrease in travel and entertainment costs, partially offset by a $131,000 increase in consulting and professional service costs.
General and Administrative. The $1.0 million decrease in general and administrative expenses in 2010 as compared to 2009 reflected a $500,000 decrease in professional service costs, as well as a $462,000 decrease in personnel related costs, primarily as a result of executive separation pay due to the resignation of our president and chief executive officer during the second quarter of 2009.
Impairment of Goodwill. The $121,000 decrease in impairment of goodwill in 2010 as compared to 2009 resulted from no impairment related charges in 2010 versus 2009.
Operating Loss and Other Income
| 2010 | 2009 | Year-to-Year Change | ||||||||||||||||||||||
| Amount | Percentage
of Revenues |
Amount | Percentage
of Revenues |
Amount | Percentage Change |
|||||||||||||||||||
| (Dollars in thousands) | ||||||||||||||||||||||||
| Operating loss |
$ | (3,317 | ) | (8.4 | )% | $ | (4,085 | ) | (10.2 | )% | $ | 768 | 18.8 | % | ||||||||||
| Interest and other income |
2 | 0.0 | 70 | 0.2 | (68 | ) | (97.1 | ) | ||||||||||||||||
|
|
|
|
|
|
|
|
|
|
|
|||||||||||||||
| Loss before provision for income taxes |
$ | (3,315 | ) | (8.4 | )% | $ | (4,015 | ) | (10.0 | )% | $ | 700 | 17.4 | % | ||||||||||
|
|
|
|
|
|
|
|
|
|
|
|||||||||||||||
The $68,000 decrease in other income in 2010 as compared to 2009 primarily resulted from a decrease in interest income due to a decline in the interest rates on the funds in which we invested our cash balance.
Net Loss
We recognized a net loss of $3.3 million in 2010 and $4.0 million in 2009. This difference principally reflects a decrease in our operating expenses of $1.5 million, partially offset by a decrease in revenues of 689,000. An income tax benefit of $30,000 was recorded in 2010 as compared to a tax provision of $16,000 in 2009. Our tax benefit relates primarily to the carryback of net operating losses to recover prior-year alternative minimum tax from the federal government. Because of our history of losses, we have provided a full valuation allowance against all deferred tax assets.
Liquidity and Capital Resources
Resources
Since our inception, we have funded our operations primarily with proceeds from private placements of preferred stock and our initial public offering of common stock, borrowings under credit facilities and, more recently, cash flow from operations.
We believe our existing cash and cash equivalents and short-term investments, our projected cash flow from operating activities, and our borrowings available under our existing credit facility will be sufficient to meet our anticipated cash needs for at least the next twelve months. Our future working capital requirements will depend on many factors, including the rates of our revenue growth, our introduction of new features for our multi-
48
Table of Contents
channel services, and our expansion of research and development and sales and marketing activities. To the extent our cash and cash equivalents and cash flow from operating activities are insufficient to fund our future activities, we may need to raise additional funds through bank credit arrangements or public or private equity or debt financings. We also may need to raise additional funds in the event we determine in the future to effect one or more acquisitions of businesses, technologies and products. If additional funding is required, we may not be able to obtain bank credit arrangements or to effect an equity or debt financing on terms acceptable to us or at all.
Credit Facility Borrowings
In February 2011 we renewed a credit facility with Silicon Valley Bank that provides a working capital line of credit at an interest rate of 4.5% per annum for up to the lesser of (a) $1.5 million or (b) 80% of eligible accounts receivable, subject to specified adjustments. Accounts receivable serve as collateral for any borrowings under the credit facility. There are certain financial covenant requirements as part of the facility, including an adjusted quick ratio and certain minimum quarterly revenue requirements, none of which are restrictive to our overall operations. The credit facility will expire by its terms on February 18, 2013 and any amounts outstanding must be repaid on that date.
As of December 31, 2011, no amounts were outstanding under the existing credit agreement and letters of credit totaling $426,000 had been issued in connection with our facility leases.
Operating Cash Flow
For a discussion of our cash flow from operating activities, please see “— Additional Key Elements of Financial Performance.”
Working Capital
The following table sets forth selected working capital information:
| As of December 31, | ||||||||||||
| 2011 | 2010 | 2009 | ||||||||||
| (In thousands) | ||||||||||||
| Cash and cash equivalents |
$ | 18,356 | $ | 34,157 | $ | 36,322 | ||||||
| Short-term investments |
10,326 | — | — | |||||||||
| Accounts receivable, net of allowance for doubtful accounts |
8,163 | 6,577 | 6,878 | |||||||||
| Working capital |
$ | 33,491 | $ | 37,553 | $ | 40,359 | ||||||
Our cash and cash equivalents at December 31, 2011 were unrestricted and held for working capital purposes. They were invested primarily in money market funds. We do not enter into investments for trading or speculative purposes.
Our short-term investments are comprised of commercial paper, certificate of deposits and U.S. government agency bonds.
Our accounts receivable balance fluctuates from period to period, which affects our cash flow from operating activities. Fluctuations vary depending on cash collections, client mix and the volume of monthly usage of our services. We use days’ sales outstanding, or DSO, calculated on an annual basis, as a measurement of the quality and status of our receivables. We define DSO as (a) accounts receivable, net of allowance for doubtful accounts, divided by revenues for the most recent year, multiplied by (b) the number of days in the year. Our DSO was 72 days at December 31, 2011, 61 days at December 31, 2010 and 63 days at December 31, 2009. The increase in DSO at December 31, 2011 was primarily due to a delay in certain large customer payments until January 2012.
49
Table of Contents
Requirements
Capital Expenditures
In recent years, we have made capital expenditures primarily to acquire computer hardware and software and, to a lesser extent, furniture and leasehold improvements, to support the growth of our business. Our capital expenditures approximated $800,000 in 2011, $1.6 million in 2010 and $900,000 in 2009. Internally capitalized software totaled $500,000 in 2010. We intend to continue to invest in our infrastructure to ensure our continued ability to enhance our platforms, introduce new features and maintain the reliability of our network. We also intend to make investments in computer equipment and systems, as well as fixed assets as we continue to grow our business and add additional personnel. We expect our capital expenditures for these purposes will approximate $1.5 million in 2012. We are not currently party to any purchase contracts related to future capital expenditures.
Contractual Obligations and Requirements
The following table sets forth our commitments to settle contractual obligations as of December 31, 2011:
| Less Than 1 Year |
1 to 3 Years |
3 to 5 Years |
More Than 5 Years |
Total | ||||||||||||||||
| (in thousands) | ||||||||||||||||||||
| Operating leases – office space |
$ | 893 | $ | 690 | $ | — | $ | — | $ | 1,583 | ||||||||||
| Operating leases – hosting facilities |
645 | — | — | — | 645 | |||||||||||||||
|
|
|
|
|
|
|
|
|
|
|
|||||||||||
| Total |
$ | 1,538 | $ | 690 | $ | — | $ | — | $ | 2,228 | ||||||||||
|
|
|
|
|
|
|
|
|
|
|
|||||||||||
Our operating leases include a lease for our headquarters in Bedford, Massachusetts. A majority of our leases related to hosting facilities are cancelable upon sixty days’ notice.
Acquisition
In February 2012, we acquired 2ergo Americas for a cash purchase price of $3.8 million. See also Note 13 Subsequent Events of the Notes to Consolidated Financial Statements included elsewhere in this Annual Report on Form 10-K.
Contingent Payments
In February 2008, we acquired substantially all of the assets of Mobile Collect, a privately held company that provided text messaging and mobile communications solutions. The acquisition price included cash payments of $500,000 upon closing and requires contingent cash payments of up to $2.0 million payable quarterly through 2013 in the event that certain established financial targets are satisfied through the operation of the acquired assets. As of December 31, 2011, $271,000 of contingent cash payments were payable to the stockholders of Mobile Collect. We expect the balance of contingent cash payments, approximating $200,000, will become payable in 2012.
In June 2011, we acquired key assets and assumed certain liabilities of SmartReply, a mobile marketing company located in Irvine, California. The acquisition price included cash payments of $3.2 million upon closing and requires contingent cash payments estimated at $1.7 million, but up to a maximum of $8.9 million, in the form of an earn-out, which may be payable annually over three years based upon year-over-year revenue growth in our mobile marketing business.
50
Table of Contents
Stock Repurchase Program
In March 2010, we announced that the board of directors had authorized the repurchase of up to $2.5 million of common stock from time to time on the open market or in privately negotiated transactions. We will determine the timing and amount of any shares repurchased based on an evaluation of market conditions and other factors. Repurchases may be made under a Rule 10b5-1 plan, which would permit shares to be repurchased when we might otherwise be precluded from doing so under insider trading laws. The repurchase program may be suspended or discontinued at any time.
As of December 31, 2011, we had repurchased 60,394 shares of our common stock at a cost of $141,000 under the program. For additional information, see Part II, “Item 5. Market for Registrant’s Common Equity, Related Stockholder Matters and Issuer Purchases of Equity Securities.”
Effects of Inflation
Inflation and changing prices have not had a material effect on our business and we do not expect that inflation or changing prices will materially affect our business in the foreseeable future. However, the impact of inflation on replacement costs of equipment, cost of revenues and operating expenses, primarily employee compensation costs, may not be readily recoverable in the pricing of our services.
Off-Balance-Sheet Arrangements
As of December 31, 2011, we did not have any significant off-balance-sheet arrangements, as defined in Item 303(a)(4)(ii) of Regulation S-K of the SEC.
| Item 7A. | Quantitative and Qualitative Disclosures about Market Risk |
Market risk represents the risk of loss that may impact our financial position due to adverse changes in financial market prices and rates. Our market risk exposure is primarily the result of fluctuations in interest rates. We do not hold or issue financial instruments for trading purposes.
At December 31, 2011, we had unrestricted cash and cash equivalents totaling $18.4 million. These amounts were invested primarily in money market funds. The unrestricted cash and cash equivalents were held for working capital purposes. At December 31, 2011, we also had short-term investments of $10.3 million, consisting primarily of commercial paper, certificate of deposits and U.S. government agency bonds, which were all classified as available-for-sale. Due to the short-term nature of these investments, we believe that we do not have any material exposure to changes in the fair value of our investment portfolio as a result of changes in interest rates and a hypothetical ten-percent change in interest rates would not have a material effect on our financial statements. Declines in interest rates, however, would reduce future investment income.
| Item 8. | Financial Statements and Supplementary Data |
The information required by this item is presented beginning at page F-1 appearing immediately after “Signatures” below.
| Item 9. | Changes in and Disagreements with Accountants on Accounting and Financial Disclosure |
None.
51
Table of Contents
| Item 9A. | Controls and Procedures |
Management’s Evaluation of Disclosure Controls and Procedures
Our management, with the participation of our chief executive officer and chief financial officer, evaluated the effectiveness of our disclosure controls and procedures as of December 31, 2011. The term “disclosure controls and procedures,” as defined in Rules 13a-15(e) and 15d-15(e) under the Securities Exchange Act, means controls and other procedures of a company that are designed to ensure that information required to be disclosed by a company in the reports that it files or submits under the Securities Exchange Act is recorded, processed, summarized and reported within the time periods specified in the SEC’s rules and forms. Disclosure controls and procedures include, without limitation, controls and procedures designed to ensure that information required to be disclosed by a company in the reports that it files or submits under the Exchange Act is accumulated and communicated to the company’s management, including its principal executive and principal financial officers, as appropriate to allow timely decisions regarding required disclosure. Our management recognizes that any controls and procedures, no matter how well designed and operated, can provide only reasonable assurance of achieving their objectives and management necessarily applies its judgment in evaluating the cost-benefit relationship of possible controls and procedures. Our disclosure controls and procedures are designed to provide reasonable assurance of achieving their objectives as described above. Based on this evaluation, our management, including our chief executive officer and chief financial officer, concluded that as of December 31, 2011, our disclosure controls and procedures were effective at the reasonable assurance level.
Management’s Annual Report on Internal Control over Financial Reporting
Our management is responsible for establishing and maintaining adequate internal control over our financial reporting. Internal control over financial reporting is defined in Rule 13a-15(f) or 15d-15(f) under the Securities Exchange Act as a process designed by, or under the supervision of, a company’s principal executive and principal financial officers and effected by a company’s board of directors, management and other personnel to provide reasonable assurance regarding the reliability of financial reporting and the preparation of financial statements in accordance with U.S. generally accepted accounting principles and includes those policies and procedures that:
| Ÿ | pertain to the maintenance of records that, in reasonable detail, accurately and fairly reflect the transactions and dispositions of the assets of a company; |
| Ÿ | provide reasonable assurance that transactions are recorded as necessary to permit preparation of financial statements in accordance with U.S. generally accepted accounting principles and that receipts and expenditures of a company are being made only in accordance with authorizations of management and directors of a company; and |
| Ÿ | provide reasonable assurance regarding prevention or timely detection of unauthorized acquisition, use, or disposition of a company’s assets that could have a material effect on the financial statements. |
Our internal control system was designed to provide reasonable assurance to our management and board of directors regarding the preparation and fair presentation of published financial statements. All internal control systems, no matter how well designed, have inherent limitations which may not prevent or detect misstatements. Therefore, even those systems determined to be effective can provide only reasonable assurance with respect to financial statement preparation and presentation. Projections of any evaluation of effectiveness to future periods are subject to the risk that controls may become inadequate because of changes in conditions, or that the degree of compliance with the policies or procedures may deteriorate.
Our management assessed the effectiveness of our internal control over financial reporting as of December 31, 2011. In making this assessment, management used the criteria set forth by the Committee of Sponsoring Organizations of the Treadway Commission in Internal Control-Integrated Framework.
52
Table of Contents
Based on this assessment, management concluded that, as of December 31, 2011, our internal control over financial reporting was effective based on those criteria.
Changes in Internal Control over Financial Reporting
No change in our internal control over financial reporting occurred during the fiscal quarter ended December 31, 2011, that has materially affected, or is reasonably likely to materially affect, our internal control over financial reporting.
| Item 9B. | Other Information |
None.
| Item 10. | Directors, Executive Officers and Corporate Governance |
The information required under this Item will be incorporated by reference to our definitive proxy statement for our 2012 annual meeting of stockholders.
| Item 11. | Executive Compensation |
The information required under this Item will be incorporated by reference to our definitive proxy statement for our 2012 annual meeting of stockholders.
| Item 12. | Security Ownership of Certain Beneficial Owners and Management and Related Stockholder Matters |
The information required under this Item will be incorporated by reference to our definitive proxy statement for our 2012 annual meeting of stockholders.
| Item 13. | Certain Relationships and Related Transactions, and Director Independence |
The information required under this Item will be incorporated by reference to our definitive proxy statement for our 2012 annual meeting of stockholders.
| Item 14. | Principal Accounting Fees and Services |
The information required under this Item will be incorporated by reference to our definitive proxy statement for our 2012 annual meeting of stockholders.
53
Table of Contents
| Item 15. | Exhibits and Financial Statement Schedules |
All schedules are omitted because they are not required or the required information is shown in the consolidated financial statements or notes thereto.
| Exhibit |
Description of Exhibit |
Filed Herewith |
Form | Filing Date |
Exhibit Number | |||||||
| 3.1 | Restated Certificate of Incorporation of the Registrant | 10-Q | November 14, 2007 |
3.1 | ||||||||
| 3.2 | Amended and Restated By-Laws of the Registrant | S-1 | October 15, 2007 |
3.4 | ||||||||
| 4.1 | Specimen certificate for shares of common stock of the Registrant | S-1 | October 15, 2007 |
4.1 | ||||||||
| 10.1 | Lease dated May 18, 2007 between RAR2-Crosby Corporate Center QRS, Inc. and the Registrant | S-1 | October 15, 2007 |
10.19 | ||||||||
| 10.2 | Agreement dated as of August 29, 2003, as amended, between the Registrant and Internap Network Services Corporation | S-1 | October 15, 2007 |
10.3 | ||||||||
| 10.3 | Agreement dated as of October 9, 2004, between the Registrant and ColoSpace, Inc. | S-1 | October 15, 2007 |
10.4 | ||||||||
| 10.4 | Loan and Security Agreement dated as of November 2, 2009 between Silicon Valley Bank and the Registrant | 10-Q | November 6, 2009 |
10.1 | ||||||||
| 10.4a | Amendment dated as of March 2, 2010 to Loan and Security Agreement dated as of November 2, 2009 between Silicon Valley Bank and the Registrant | 10-Q | May 7, 2010 |
10.1 | ||||||||
| 10.4b | Amendment dated as of February 18, 2011 to Loan and Security Agreement dated as of November 2, 2009 between Silicon Valley Bank and the Registrant | 10-K | March 1, 2011 |
10.4b | ||||||||
| 10.5 | Investors’ Rights Agreement dated as of June 17, 2005, among the Registrant, the Investors named therein, John McDonough and David Parker, as amended | S-1 | October 15, 2007 |
4.2 | ||||||||
| 10.6† | 2007 Stock Incentive Plan of the Registrant | S-1 | October 15, 2007 |
10.12 | ||||||||
| 10.7† | Form of Incentive Stock Option Grant Notice and Incentive Stock Option Agreement under the 2007 Stock Incentive Plan of the Registrant | 8-K | March 8, 2010 |
10.1 | ||||||||
| 10.8† | Form of Nonstatutory Stock Option Grant Notice and Nonstatutory Stock Option Agreement under the 2007 Stock Incentive Plan of the Registrant | 8-K | March 8, 2010 |
10.2 | ||||||||
| 10.9† | Form of Restricted Stock Unit Grant Notice and Restricted Stock Unit Agreement under the 2007 Stock Incentive Plan of the Registrant | 8-K | March 8, 2010 |
10.3 | ||||||||
54
Table of Contents
| Exhibit |
Description of Exhibit |
Filed Herewith |
Form | Filing Date |
Exhibit Number | |||||||
| 10.10† | Employment Offer Letter entered into as of April 21, 2009 between the Registrant and James A. Milton | 8-K | April 21, 2009 |
10.1 | ||||||||
| 10.10a† | Amendment dated as of May 6, 2010 to Employment Offer Letter entered into as of April 21, 2009 between the Registrant and James A. Milton | 10-Q | May 7, 2010 |
10.1 | ||||||||
| 10.11† | Form of Executive Retention Agreement entered into as of May 1, 2009 between the Registrant and James A. Milton | 8-K | April 21, 2009 |
10.2 | ||||||||
| 10.12† | Form of Executive Retention Agreement entered into as of November 28, 2008 between the Registrant and each of Mark D. Friedman, Robert C. Leahy and Timothy R. Segall | 8-K | November 28, 2008 |
99.1 | ||||||||
| 10.13† | Form of Executive Retention Agreement, dated as of March 29, 2010, entered into by and between SoundBite Communications, Inc. and Diane Albano | 8-K | March 29, 2010 |
10.1 | ||||||||
| 10.14† | Form of Change in Control Agreement entered into as of May 1, 2009 between the Registrant and James A. Milton | 8-K | April 21, 2009 |
10.3 | ||||||||
| 10.15† | Form of Change in Control Agreement entered into as of November 28, 2008 between the Registrant and each of Mark D. Friedman, Robert C. Leahy and Timothy R. Segall | 8-K | November 28, 2008 |
99.2 | ||||||||
| 10.16† | Form of Change in Control Agreement, dated as of March 29, 2010, entered into by and between the Registrant and Diane Albano | 8-K | March 29, 2010 |
10.1 | ||||||||
| 10.17† | Form of Indemnification Agreement entered into (or to be entered into) between the Registrant and each of its executive officers and directors from time to time | S-1 | October 15, 2007 |
10.17 | ||||||||
| 10.18† | 2010 Management Cash Compensation Plan (Amended and Restated as of May 6, 2010) | 10-Q | May 7, 2010 |
10.1 | ||||||||
| 10.19† | Compensation Arrangements with Outside Directors (Amended and Restated as of March 17, 2010) | 8-K | March 29, 2010 |
10.1 | ||||||||
| 10.20† | 2010 Management Cash Compensation Plan | 8-K | December 11, 2009 |
10.1 | ||||||||
| 10.21† | 2011 Management Cash Compensation Plan | 8-K | May 20, 2011 |
10.1 | ||||||||
| 10.22† | 2011 Management Cash Compensation Plan (Amended and Restated as of May 18, 2011) | 8-K/A | May 24, 2011 |
10.1 | ||||||||
| 10.23† | Amendment to 2011 Management Cash Compensation Plan | 8-K | July 14, 2011 |
10.1 | ||||||||
55
Table of Contents
| Exhibit |
Description of Exhibit |
Filed Herewith |
Form | Filing Date |
Exhibit Number | |||||||||
| 10.24† | Amendment to 2011 Management Cash Compensation Plan (Amended and Restated as of July 8, 2011) | 8-K/A | July 15, 2011 |
10.1 | ||||||||||
| 10.25† | Compensation Arrangements with Outside Directors (Amended and Restated as of December 9, 2009) | 8-K | December 11, 2009 |
10.2 | ||||||||||
| 10.26 | Letter Agreement dated January 6, 2012 from Registrant to GameStop Corp. and GameStop Inc. | 8-K | January 9, 2012 |
10.1 | ||||||||||
| 21.1 | List of subsidiaries of Registrant. | X | ||||||||||||
| 23.1 | Consent of Deloitte & Touche LLP. | X | ||||||||||||
| 31.1 | Certification of principal executive officer pursuant to Section 302 of the Sarbanes-Oxley Act of 2002 | X | ||||||||||||
| 31.2 | Certification of principal financial officer pursuant to Section 302 of the Sarbanes-Oxley Act of 2002 | X | ||||||||||||
| 32.1 | Certification of principal executive officer and principal financial officer pursuant to Section 906 of the Sarbanes-Oxley Act of 2002, 18 U.S.C. 1350 | X | ||||||||||||
| 101.INS# | XBRL Instance Document | |||||||||||||
| 101.SCH# | XBRL Taxonomy Extension Schema Document | |||||||||||||
| 101.CAL# | XBRL Taxonomy Calculation Linkbase Document | |||||||||||||
| 101.LAB# | XBRL Taxonomy Label Linkbase Document | |||||||||||||
| 101.PRE# | XBRL Taxonomy Extension Presentation Linkbase Document | |||||||||||||
| # | Pursuant to Rule 406T of Regulation S-T, XBRL (Extensible Business Reporting Language) information is deemed not filed or a part of a registration statement or prospectus for purposes of sections 11 or 12 of the Securities Act of 1933, is deemed not filed for purposes of section 18 of the Securities Exchange Act of 1934 and otherwise is not subject to liability under these sections. |
| † | Management contracts or compensatory plans or arrangements required to be filed as an exhibit hereto pursuant to Item 15(a) of Form 10-K. |
56
Table of Contents
Pursuant to the requirements of Section 13 or 15(d) of the Securities Exchange Act of 1934, the registrant has duly caused this report to be signed on its behalf by the undersigned, thereunto duly authorized.
| SOUNDBITE COMMUNICATIONS, INC. | ||||
| By: | /s/ James A. Milton | |||
| James A. Milton | ||||
| President and Chief Executive Officer | ||||
Date: March 14, 2012
Pursuant to the requirements of the Securities Exchange Act of 1934, this annual report on Form 10-K has been signed below by the following persons as of March 1, 2011 on behalf of the registrant in the capacities indicated.
| Signature |
Title | |
| /s/ James A. Milton James A. Milton |
President and Chief Executive Officer (Principal Executive Officer) | |
| /s/ Robert C. Leahy Robert C. Leahy |
Chief Operating Officer and Chief Financial Officer (Principal Financial and Accounting Officer) | |
| /s/ Eric R. Giler Eric R. Giler |
Director | |
| /s/ James A. Goldstein James A. Goldstein |
Director | |
| /s/ Vernon F. Lobo Vernon F. Lobo |
Director | |
| /s/ Justin J. Perreault Justin J. Perreault |
Director | |
| /s/ Eileen Rudden Eileen Rudden |
Director | |
| /s/ Regina O. Sommer Regina O. Sommer |
Director | |
57
Table of Contents
SOUNDBITE COMMUNICATIONS, INC.
INDEX TO CONSOLIDATED FINANCIAL STATEMENTS
| Page | ||
| F-2 | ||
| Financial Statements: |
||
| F-3 | ||
| F-4 | ||
| F-5 | ||
| F-6 | ||
| F-7 | ||
F-1
Table of Contents
REPORT OF INDEPENDENT REGISTERED PUBLIC ACCOUNTING FIRM
To the Board of Directors and Stockholders of SoundBite Communications, Inc.
Bedford, Massachusetts
We have audited the accompanying consolidated balance sheets of SoundBite Communications, Inc. and subsidiaries (the “Company”) as of December 31, 2011 and 2010, and the related consolidated statements of operations, stockholders’ equity, and cash flows for each of the three years in the period ended December 31, 2011. These financial statements are the responsibility of the Company’s management. Our responsibility is to express an opinion on these financial statements based on our audits.
We conducted our audits in accordance with the standards of the Public Company Accounting Oversight Board (United States). Those standards require that we plan and perform the audit to obtain reasonable assurance about whether the financial statements are free of material misstatement. The Company is not required to have, nor were we engaged to perform, an audit of its internal control over financial reporting. Our audits included consideration of internal control over financial reporting as a basis for designing audit procedures that are appropriate in the circumstances, but not for the purpose of expressing an opinion on the effectiveness of the Company’s internal control over financial reporting. Accordingly, we express no such opinion. An audit also includes examining, on a test basis, evidence supporting the amounts and disclosures in the financial statements, assessing the accounting principles used and significant estimates made by management, as well as evaluating the overall financial statement presentation. We believe that our audits provide a reasonable basis for our opinion.
In our opinion, such consolidated financial statements present fairly, in all material respects, the financial position of SoundBite Communications, Inc. and subsidiaries as of December 31, 2011 and 2010, and the results of their operations and their cash flows for each of the three years in the period ended December 31, 2011, in conformity with accounting principles generally accepted in the United States of America.
/s/ Deloitte & Touche LLP
Boston, Massachusetts
March 14, 2012
F-2
Table of Contents
SOUNDBITE COMMUNICATIONS, INC. AND SUBSIDIARIES
| December 31, | ||||||||
| 2011 | 2010 | |||||||
| (in thousands, except share and per share amounts) |
||||||||
| ASSETS |
| |||||||
| Current assets: |
||||||||
| Cash and cash equivalents |
$ | 17,706 | $ | 34,157 | ||||
| Short-term investments |
10,976 | — | ||||||
| Accounts receivable, net of allowance for doubtful accounts of $166 and $197 at December 31, 2011 and 2010 |
8,163 | 6,577 | ||||||
| Prepaid expenses and other current assets |
1,419 | 1,183 | ||||||
|
|
|
|
|
|||||
| Total current assets |
38,264 | 41,917 | ||||||
| Property and equipment, net |
2,081 | 2,550 | ||||||
| Intangible assets, net |
2,036 | 517 | ||||||
| Goodwill |
4,286 | 762 | ||||||
| Other assets |
118 | 229 | ||||||
|
|
|
|
|
|||||
| Total assets |
$ | 46,785 | $ | 45,975 | ||||
|
|
|
|
|
|||||
| LIABILITIES AND STOCKHOLDERS’ EQUITY |
| |||||||
| Current liabilities: |
||||||||
| Accounts payable |
$ | 767 | $ | 1,067 | ||||
| Accrued expenses |
3,445 | 3,297 | ||||||
| Other current liabilities |
561 | — | ||||||
|
|
|
|
|
|||||
| Total current liabilities |
4,773 | 4,364 | ||||||
| Long-term contingent consideration payable |
966 | — | ||||||
| Other liabilities |
277 | 421 | ||||||
|
|
|
|
|
|||||
| Total liabilities |
6,016 | 4,785 | ||||||
|
|
|
|
|
|||||
| Commitments and contingencies (note 6) |
||||||||
| Stockholders’ equity: |
||||||||
| Common stock, $0.001 par value — 75,000,000 shares authorized; 16,666,206 and 16,576,701 shares issued at December 31, 2011 and 2010; 16,410,427 and 16,381,316 shares outstanding at December 31, 2011 and 2010 |
17 | 17 | ||||||
| Additional paid-in capital |
70,681 | 69,454 | ||||||
| Treasury stock, at cost — 255,779 shares at December 31, 2011 and 195,385 shares at December 31, 2010 |
(273 | ) | (132 | ) | ||||
| Accumulated other comprehensive loss |
(72 | ) | (72 | ) | ||||
| Accumulated deficit |
(29,584 | ) | (28,077 | ) | ||||
|
|
|
|
|
|||||
| Total stockholders’ equity |
40,769 | 41,190 | ||||||
|
|
|
|
|
|||||
| Total liabilities and stockholders’ equity |
$ | 46,785 | $ | 45,975 | ||||
|
|
|
|
|
|||||
F-3
Table of Contents
SOUNDBITE COMMUNICATIONS, INC. AND SUBSIDIARIES
Consolidated Statements of Operations
| Years Ended December 31, | ||||||||||||
| 2011 | 2010 | 2009 | ||||||||||
| (in thousands, except share and per share amounts) |
||||||||||||
| Revenues |
$ | 41,653 | $ | 39,494 | $ | 40,183 | ||||||
| Cost of revenues |
17,018 | 15,955 | 15,899 | |||||||||
|
|
|
|
|
|
|
|||||||
| Gross profit |
24,635 | 23,539 | 24,284 | |||||||||
|
|
|
|
|
|
|
|||||||
| Operating expenses: |
||||||||||||
| Research and development |
6,114 | 5,886 | 5,628 | |||||||||
| Sales and marketing |
14,084 | 14,171 | 14,784 | |||||||||
| General and administrative |
6,835 | 6,799 | 7,836 | |||||||||
| Impairment of goodwill |
— | — | 121 | |||||||||
|
|
|
|
|
|
|
|||||||
| Total operating expenses |
27,033 | 26,856 | 28,369 | |||||||||
|
|
|
|
|
|
|
|||||||
| Operating loss |
(2,398 | ) | (3,317 | ) | (4,085 | ) | ||||||
| Interest and other income |
— | 2 | 70 | |||||||||
|
|
|
|
|
|
|
|||||||
| Loss before provision for income taxes |
(2,398 | ) | (3,315 | ) | (4,015 | ) | ||||||
| (Benefit) provision for income taxes |
(891 | ) | (30 | ) | 16 | |||||||
|
|
|
|
|
|
|
|||||||
| Net loss |
$ | (1,507 | ) | $ | (3,285 | ) | $ | (4,031 | ) | |||
|
|
|
|
|
|
|
|||||||
| Loss per common share: |
||||||||||||
| Basic and diluted |
$ | (0.09 | ) | $ | (0.20 | ) | $ | (0.25 | ) | |||
| Weighted average common shares outstanding: |
||||||||||||
| Basic and diluted |
16,435,737 | 16,344,213 | 15,961,491 | |||||||||
F-4
Table of Contents
SOUNDBITE COMMUNICATIONS, INC. AND SUBSIDIARIES
Consolidated Statements of Stockholders’ Equity
| Common Stock | Additional Paid-In Capital |
Treasury Stock | Accumulated Other Comprehensive Loss |
Accumulated Deficit |
Total Shareholders’ Equity |
|||||||||||||||||||||||||||
| Shares | Amount | Shares | Amount | |||||||||||||||||||||||||||||
| (in thousands, except share and per share amounts) | ||||||||||||||||||||||||||||||||
| Balance, January 1, 2009 |
15,701,644 | $ | 16 | $ | 66,703 | 195,385 | $ | (132 | ) | $ | (72 | ) | $ | (20,761 | ) | $ | 45,754 | |||||||||||||||
| Issuance of common stock for option exercises |
805,086 | 1 | 331 | — | — | — | — | 332 | ||||||||||||||||||||||||
| Stock-based compensation expense |
— | — | 977 | — | — | — | — | 977 | ||||||||||||||||||||||||
| Net loss and total comprehensive loss |
— | — | — | — | — | — | (4,031 | ) | (4,031 | ) | ||||||||||||||||||||||
|
|
|
|
|
|
|
|
|
|
|
|
|
|
|
|
|
|||||||||||||||||
| Balance, December 31, 2009 |
16,506,730 | 17 | 68,011 | 195,385 | (132 | ) | (72 | ) | (24,792 | ) | 43,032 | |||||||||||||||||||||
| Issuance of common stock for option exercises |
60,563 | — | 90 | — | — | — | — | 90 | ||||||||||||||||||||||||
| Issuance of common stock for restricted stock units |
9,408 | — | — | — | — | — | — | — | ||||||||||||||||||||||||
| Stock-based compensation expense |
— | — | 1,353 | — | — | — | — | 1,353 | ||||||||||||||||||||||||
| Net loss and total comprehensive loss |
— | — | — | — | — | — | (3,285 | ) | (3,285 | ) | ||||||||||||||||||||||
|
|
|
|
|
|
|
|
|
|
|
|
|
|
|
|
|
|||||||||||||||||
| Balance, December 31, 2010 |
16,576,701 | 17 | 69,454 | 195,385 | (132 | ) | (72 | ) | (28,077 | ) | 41,190 | |||||||||||||||||||||
| Issuance of common stock for option exercises |
70,774 | — | 52 | — | — | — | — | 52 | ||||||||||||||||||||||||
| Issuance of common stock for restricted stock units, net of 6,398 shares withheld for taxes |
18,731 | — | — | — | — | — | — | — | ||||||||||||||||||||||||
| Repurchase of common stock for treasury |
— | — | — | 60,394 | (141 | ) | — | — | (141 | ) | ||||||||||||||||||||||
| Stock-based compensation expense |
— | — | 1,175 | — | — | — | — | 1,175 | ||||||||||||||||||||||||
| Net loss and total comprehensive loss |
— | — | — | — | — | — | (1,507 | ) | (1,507 | ) | ||||||||||||||||||||||
|
|
|
|
|
|
|
|
|
|
|
|
|
|
|
|
|
|||||||||||||||||
| Balance, December 31, 2011 |
16,666,206 | $ | 17 | $ | 70,681 | 255,779 | $ | (273 | ) | $ | (72 | ) | $ | (29,584 | ) | $ | 40,769 | |||||||||||||||
|
|
|
|
|
|
|
|
|
|
|
|
|
|
|
|
|
|||||||||||||||||
F-5
Table of Contents
SOUNDBITE COMMUNICATIONS, INC. AND SUBSIDIARIES
Consolidated Statements of Cash Flows
| Years Ended December 31, | ||||||||||||
| 2011 | 2010 | 2009 | ||||||||||
| (in thousands) | ||||||||||||
| Cash flows from operating activities: |
||||||||||||
| Net loss |
$ | (1,507 | ) | $ | (3,285 | ) | $ | (4,031 | ) | |||
| Adjustments to reconcile net loss to net cash (used in) provided by operating activities: |
||||||||||||
| Depreciation of property and equipment |
1,338 | 1,836 | 2,486 | |||||||||
| Amortization of intangible assets |
839 | 62 | 126 | |||||||||
| Amortization of premiums paid on short-term investments |
5 | — | — | |||||||||
| Adjustment to contingent consideration |
98 | — | — | |||||||||
| Provision for bad debts |
52 | 60 | 33 | |||||||||
| Stock-based compensation |
1,175 | 1,353 | 977 | |||||||||
| Deferred taxes |
(905 | ) | — | — | ||||||||
| Impairment of goodwill |
— | — | 121 | |||||||||
| (Gain) loss on disposal of property and equipment |
(3 | ) | (2 | ) | 25 | |||||||
| Change in operating assets and liabilities, net of effect of acquisition: |
||||||||||||
| Accounts receivable |
(957 | ) | 241 | (270 | ) | |||||||
| Prepaid expenses and other current assets |
(161 | ) | 161 | (123 | ) | |||||||
| Other assets |
111 | (100 | ) | (67 | ) | |||||||
| Accounts payable |
(586 | ) | 64 | 370 | ||||||||
| Accrued expenses and other liabilities |
(200 | ) | (77 | ) | 59 | |||||||
|
|
|
|
|
|
|
|||||||
| Net cash (used in) provided by operating activities |
(701 | ) | 313 | (294 | ) | |||||||
|
|
|
|
|
|
|
|||||||
| Cash flows from investing activities: |
||||||||||||
| Cash paid related to Mobile Collect acquisition |
(691 | ) | (503 | ) | (256 | ) | ||||||
| Cash paid related to Smart Reply acquisition |
(3,150 | ) | — | — | ||||||||
| Investments in capitalized software |
— | (500 | ) | — | ||||||||
| Proceeds received from sale of equipment |
3 | 2 | — | |||||||||
| Purchases of short-term investments |
(10,981 | ) | — | — | ||||||||
| Purchases of property and equipment |
(842 | ) | (1,567 | ) | (885 | ) | ||||||
|
|
|
|
|
|
|
|||||||
| Net cash used in investing activities |
(15,661 | ) | (2,568 | ) | (1,141 | ) | ||||||
|
|
|
|
|
|
|
|||||||
| Cash flows from financing activities: |
||||||||||||
| Proceeds from exercise of stock options |
52 | 90 | 332 | |||||||||
| Treasury stock purchases |
(141 | ) | — | — | ||||||||
|
|
|
|
|
|
|
|||||||
| Net cash (used in) provided by financing activities |
(89 | ) | 90 | 332 | ||||||||
|
|
|
|
|
|
|
|||||||
| Net (decrease) increase in cash and cash equivalents |
(16,451 | ) | (2,165 | ) | (1,103 | ) | ||||||
|
|
|
|
|
|
|
|||||||
| Cash and cash equivalents, beginning of year |
34,157 | 36,322 | 37,425 | |||||||||
|
|
|
|
|
|
|
|||||||
| Cash and cash equivalents, end of year |
$ | 17,706 | $ | 34,157 | $ | 36,322 | ||||||
|
|
|
|
|
|
|
|||||||
| Supplemental disclosure of cash flow information: |
||||||||||||
| Cash paid during the period for income taxes |
$ | 46 | $ | 7 | $ | 20 | ||||||
|
|
|
|
|
|
|
|||||||
| Supplemental disclosure of non-cash investing activities: |
||||||||||||
| Property and equipment, included in accounts payable |
$ | 150 | $ | 173 | $ | 139 | ||||||
|
|
|
|
|
|
|
|||||||
| Contingent cash payment to Mobile Collect included in other current liabilities |
$ | 271 | $ | 163 | $ | 118 | ||||||
|
|
|
|
|
|
|
|||||||
| Contingent consideration and consideration payable, included in other current liabilities and long-term contingent consideration payable |
$ | 1,256 | $ | — | $ | — | ||||||
|
|
|
|
|
|
|
|||||||
F-6
Table of Contents
SOUNDBITE COMMUNICATIONS, INC. AND SUBSIDIARIES
Notes to Consolidated Financial Statements
1. NATURE OF BUSINESS
SoundBite Communications, Inc. (the Company) provides cloud-based, multi-channel services that enable businesses to design, execute and measure customer communication campaigns for a variety of marketing, customer care, payment and collection processes. Clients use the SoundBite Engage and SoundBite Insight platforms to communicate proactively with their customers through automated voice messaging, predictive dialing, emails, text messaging and web communications. The Company was incorporated in Delaware in 2000, and its principal operations are located in Bedford, Massachusetts. The Company’s clients are located in the United States and Europe.
2. SUMMARY OF SIGNIFICANT ACCOUNTING POLICIES
Subsequent Events
In preparing the accompanying financial statements and related disclosures, the Company has evaluated subsequent events through the date of issuance of these financial statements.
Use of Estimates
The preparation of financial statements in conformity with accounting principles generally accepted in the United States of America requires management to make estimates and assumptions that affect the reported amount of assets and liabilities and disclosure of contingent liabilities at the date of the financial statements and the reported amounts of revenues and expenses during the reporting period. Actual results could differ from those estimates.
Principles of Consolidation
The consolidated financial statements include the accounts of SoundBite Communications, Inc. and its wholly owned subsidiaries, SoundBite Communications Canada, Inc., which was incorporated in August 2007, SoundBite Communications Security Corporation, which was incorporated in December 2007, and SoundBite Communications UK, LTD., which was incorporated in August 2010. All intercompany accounts and transactions have been eliminated in consolidation.
Foreign Currency
The functional currency of the Company’s foreign operations is the U.S. dollar. Transaction gains and losses are recognized in the statement of operations and have not been material for the periods presented.
Segment Data
The Company manages its operations on a consolidated, single segment basis for purposes of assessing performance and making operating decisions. Accordingly, the Company has only one operating and reporting segment.
Cash and Cash Equivalents
The Company invests its cash in money market accounts, debt securities of U.S. government agencies and repurchase agreements with maturities of less than 90 days. All highly liquid instruments with a remaining maturity of 90 days or less when purchased are considered cash equivalents.
F-7
Table of Contents
Notes to Consolidated Financial Statements—(Continued)
Short-term Investments
The Company invests any excess cash balances in short-term marketable securities, including high-grade corporate notes and bonds. These investments are classified as available-for-sale. The average remaining maturity of the marketable securities as of December 31, 2011 was four months. Gains or losses on the sale of investments classified as available-for-sale, if any, are recognized on the specific identification method. Unrealized gains or losses are included in accumulated other comprehensive income (loss) as a separate component of stockholders’ deficit until the security is sold or until a decline in fair value is determined to be other than temporary. No unrealized gain or loss was recorded as of December 31, 2011.
Accounts Receivable and Allowance for Doubtful Accounts
Accounts receivable are stated at the amount management expects to collect from outstanding balances. Management reviews accounts receivable on a periodic basis to determine if any receivables will potentially be uncollectible. Estimates are used to determine the amount of the allowance for doubtful accounts necessary to reduce accounts receivable to its estimated net realizable value. These estimates are made by analyzing the status of significant past due receivables and by establishing provisions for estimated losses by analyzing current and historical bad debt trends. Actual collection experience has not varied significantly from estimates. Receivables that are ultimately deemed uncollectible are charged off as a reduction of receivables and the allowance for doubtful accounts.
Activity in the allowance for doubtful accounts was as follows (in thousands):
| Years Ended December 31, | ||||||||||||
| 2011 | 2010 | 2009 | ||||||||||
| Balance, beginning |
$ | 197 | $ | 152 | $ | 218 | ||||||
| Provision for bad debts |
52 | 60 | 33 | |||||||||
| Net uncollectible accounts written off |
(83 | ) | (15 | ) | (99 | ) | ||||||
|
|
|
|
|
|
|
|||||||
| Balance, end |
$ | 166 | $ | 197 | $ | 152 | ||||||
|
|
|
|
|
|
|
|||||||
Concentration of Credit Risk
Financial instruments that potentially subject the Company to significant concentration of credit risk consist primarily of cash, cash equivalents, short-term investments and accounts receivable. The only significant concentrations of liquid investments as of December 31, 2011 relate to cash and cash equivalents held on deposit with two global banks and two “Triple A” rated money market funds which management considers to be large, highly rated investment grade institutions. As of December 31, 2011, our cash and cash equivalent balance was $17.7 million, including money market funds amounting to $16.3 million. A substantial portion of these money market funds are invested in U.S. treasuries. At December 31, 2011 and 2010, the Company had cash balances at certain financial institutions in excess of federally insured limits. However, the Company does not believe that it is subject to unusual credit risk beyond the normal credit risk associated with commercial banking relationships.
Accounts receivable are typically uncollateralized and are derived from revenues earned from clients primarily located in the United States. As of December 31, 2011 and 2010, three clients in the aggregate accounted for 30% and 29% of the outstanding accounts receivable balance, respectively. In each of 2011, 2010 and 2009, the Company had two customers that accounted for more than 10% of revenues. Revenues from one customer, as a percentage of total revenue, were 12% in 2011, 11% in 2010 and 13% in 2009. Revenues from a second customer were 11% of revenue in 2011, 12% of revenue in 2010 and 16% of revenue in 2009.
F-8
Table of Contents
Notes to Consolidated Financial Statements—(Continued)
Development of Software for Internal Use
The Company capitalizes the direct and incremental cost of materials, consultants, payroll and payroll related costs for employees incurred in developing internal-use software after certain capitalization criteria are met. Amounts capitalized related to internal use software totaled $0 for the year ended December 31, 2011, $500,000 for the year ended December 31, 2010 and $0 for the year ended December 31, 2009. Internal-use software is carried at cost and depreciated over the estimated useful life, generally three years, using the straight-line method.
Property and Equipment
Property and equipment are carried at cost and are depreciated over the assets estimated useful life, generally three years, using the straight-line method. Depreciation of leasehold improvements is recorded over the shorter of the estimated useful life of the leasehold improvement or the remaining lease term. Expenditures for maintenance and repairs are charged to operations when incurred, while additions and betterments are capitalized. When assets are retired or disposed, the asset’s original cost and related accumulated depreciation are eliminated from the accounts and any gain or loss is reflected in the statement of operations.
Goodwill
Goodwill is not amortized, but instead is reviewed for impairment annually or more frequently if impairment indicators arise. The Company evaluates goodwill on an annual basis for impairment and has selected November 1 as the annual impairment testing date. The Company operates as a single operating segment and has concluded that the Company is comprised of one reporting unit.
Long-lived Assets
The Company evaluates the possible impairment of long-lived assets, including property and equipment as well as intangible assets, whenever events and circumstances indicate the carrying value of the assets may not be recoverable. Intangible assets consist of customer relationships, trade names, non-compete agreements, developed acquired technology and capitalized software (see note 9). These assets are carried at cost less accumulated amortization and are amortized over their estimated useful lives of two to five years using methods that most closely relate to the depletion of these assets. No impairments related to long-lived assets have been recognized in the periods presented.
Valuation of Contingent Consideration
For acquisitions completed after January 1, 2009, the Company records contingent consideration at fair value on the acquisition date. Each reporting period thereafter, the Company re-measures these obligations and records increases or decreases in fair value as an adjustment to contingent consideration expense within the consolidated statement of operations. Changes in the fair value of the contingent consideration obligations can result from adjustments to the discount rates and passage of time as well as updates in the assumed achievement or timing of any performance targets. These fair value measurements represent Level 3 measurements as they are based on significant inputs not observable in the market.
Significant judgment is employed in determining the appropriateness of these assumptions as of the acquisition date and for each subsequent period. Accordingly, changes in the assumptions could have a material impact on the amount of contingent consideration expense the Company records in any given period.
F-9
Table of Contents
Notes to Consolidated Financial Statements—(Continued)
Revenues
The Company derives substantially all of its revenues by providing its service for use by clients in communicating with their customers through voice, text/SMS and email messages. The Company provides its service principally under a usage-based pricing model, with prices calculated on a per-message or per-minute basis in accordance with the terms of its pricing agreements with clients. The Company primarily invoices its clients on a monthly basis. The substantial majority of the pricing agreements do not require minimum levels of usage or payments.
The Company recognizes revenue when all of the following conditions are satisfied: (1) there is persuasive evidence of an arrangement; (2) the service has been provided to the client; (3) the amount of fees to be paid by the client is fixed or determinable; and (4) the collection of fees from the client is reasonably assured. Generally, this occurs when the services are performed.
The Company’s client management organization provides ancillary services to assist clients in selecting service features and adopting best practices that help clients make the best use of the Company’s on-demand service. The Company provides varying levels of support through these ancillary services, from managing an entire campaign to supporting self-service clients. In some cases, ancillary services may be billed to clients based upon a fixed fee or, more typically, a fixed hourly rate. Revenue from these arrangements are measured using management’s estimated selling price, as determined from a standard rate card. These services typically are of short duration, typically less than one month, and do not involve future obligations. The Company recognizes revenue from these services within the calendar month in which the ancillary services are completed if the four criteria set forth above are satisfied. Revenues attributable to ancillary services are not material and accordingly were not presented as a separate line item in the statements of operations.
Research and Development Costs
Research and development costs are expensed as incurred. Nonrefundable advance payments, if any, for goods or services used in research and development are recognized as an expense as the related goods are delivered or services are performed. Research and development expenses include labor, materials and supplies and overhead.
Accounting for Stock-Based Compensation
Stock-based compensation expense is recognized based on the grant-date fair value using the Black-Scholes valuation model. The Company is recognizing compensation costs only for those stock-based awards expected to vest after considering expected forfeitures. Cumulative compensation expense is at least equal to the compensation expense for vested awards. Stock-based compensation is recognized on a straight-line basis over the service period of each award.
Income Taxes
The Company recognizes deferred tax liabilities and assets for the expected future tax consequences of events that have been included in the financial statements or tax returns. Under this method, deferred tax liabilities and assets are determined based upon the temporary differences between the financial reporting and tax bases of liabilities and assets and for loss and credit carryforwards, using enacted tax rates in effect in the years in which the differences are expected to reverse. Valuation allowances are provided to the extent that realization of net deferred tax assets is not considered to be more likely than not. Realization of the Company’s net deferred tax assets is contingent upon generation of future taxable income. Due to the uncertainty of realization of the tax benefits, the Company has provided a valuation allowance for the full amount of its net deferred tax assets.
F-10
Table of Contents
Notes to Consolidated Financial Statements—(Continued)
The Company provides reserves for potential payments of tax to various tax authorities related to uncertain tax positions and other issues. Tax benefits are based on a determination of whether and how much of a tax benefit taken by the Company in its tax filings or positions is more likely than not to be realized following resolution of any potential contingencies present related to the tax benefit. Potential interest and penalties associated with such uncertain tax positions would be recorded as a component of income tax expense. At December 31, 2011 and 2010, the Company had not identified any significant uncertain tax positions.
Basic and Diluted Loss Per Common Share
Net loss per common share attributable to common stockholders has been computed using the weighted average number of shares of common stock outstanding during each period. Basic and diluted shares outstanding were the same for the periods presented as the impact of all potentially dilutive securities outstanding was anti dilutive. The following table presents the potentially dilutive securities outstanding that were excluded from the computation of diluted net loss per common share because their inclusion would have had an anti dilutive effect:
| Years Ended December 31, | ||||||||||||
| 2011 | 2010 | 2009 | ||||||||||
| Stock options |
3,447,450 | 3,298,369 | 2,764,267 | |||||||||
| Unvested stock |
44,413 | 69,542 | — | |||||||||
| Warrants to purchase common stock |
— | — | 33,686 | |||||||||
Comprehensive Loss
Comprehensive loss was equal to net loss in all periods presented.
3. PROPERTY AND EQUIPMENT
Property and equipment as of December 31, 2011 and 2010 consisted of the following (in thousands):
| As of December 31, | ||||||||
| 2011 | 2010 | |||||||
| Computer equipment |
$ | 10,075 | $ | 9,854 | ||||
| Computer software |
4,068 | 3,881 | ||||||
| Furniture and fixtures |
556 | 556 | ||||||
| Office equipment & machinery |
402 | 402 | ||||||
| Leasehold improvements |
561 | 561 | ||||||
|
|
|
|
|
|||||
| Total |
15,662 | 15,254 | ||||||
| Less — accumulated depreciation and amortization |
(13,581 | ) | (12,704 | ) | ||||
|
|
|
|
|
|||||
| Property and equipment, net |
$ | 2,081 | $ | 2,550 | ||||
|
|
|
|
|
|||||
Depreciation expense for the years ended December 31, 2011, 2010 and 2009 was $1.3 million, $1.8 million and $2.5 million, respectively.
4. LINE OF CREDIT
On February 18, 2011, the Company renewed an existing credit facility with Silicon Valley Bank that provides a working capital line of credit at an interest rate of 4.5% per annum for up to the lesser of (a) $1.5 million or (b) 80% of eligible accounts receivable, subject to specified adjustments. Accounts receivable serve as
F-11
Table of Contents
Notes to Consolidated Financial Statements—(Continued)
collateral for any borrowings under the credit facility. There are certain financial covenant requirements as part of the facility, including an adjusted quick ratio and certain minimum quarterly revenue requirements, none of which are restrictive to the Company’s operations. The credit facility will expire by its terms on February 18, 2013 and any amounts outstanding must be repaid on that date.
As of December 31, 2011, no amounts were outstanding under the existing credit agreement. As of December 31, 2011, letters of credit totaling $426,000 had been issued in connection with the Company’s facility leases.
5. ACCRUED EXPENSES
Accrued expenses consisted of the following (in thousands):
| December 31, | ||||||||
| 2011 | 2010 | |||||||
| Payroll related items |
$ | 1,089 | $ | 946 | ||||
| Sales and use tax |
510 | 437 | ||||||
| Telephony |
503 | 632 | ||||||
| Professional fees |
247 | 362 | ||||||
| Other |
1,096 | 920 | ||||||
|
|
|
|
|
|||||
| Total accrued expenses |
$ | 3,445 | $ | 3,297 | ||||
|
|
|
|
|
|||||
6. COMMITMENTS AND CONTINGENCIES
The Company has various non-cancelable operating leases related to its office space and hosting facilities that expire through 2013. Certain leases have fixed rent escalations clauses and renewal options, which are accounted for on a straight-line basis over the life of the lease. Future minimum lease payments under non-cancelable operating leases at December 31, 2011 were as follows (in thousands):
| 2012 |
$ | 1,538 | ||
| 2013 |
690 | |||
|
|
|
|||
| Total future minimum lease payments |
$ | 2,228 | ||
|
|
|
Total rent expense for office space charged to operations was $865,000, $758,000 and $759,000 for the years ended December 31, 2011, 2010 and 2009, respectively. Total rent expense for hosting sites charged to cost of revenues was $1.6 million, $1.5 million and $1.4 million for the years ended December 31, 2011, 2010 and 2009, respectively.
Litigation and Claims
Indemnification Regarding Karayan Litigation
Over the past several months, class action litigation has been initiated against a number of banks and retailers, including some of the Company’s clients, alleging that “mobile termination” text messages violate the U.S. Telephone Consumer Protection Act (the TCPA), which seeks to protect the privacy interests of residential telephone subscribers. When a business receives a text message indicating that the sender wishes to “opt out” of further text communications from the business, a mobile termination text message may be transmitted automatically in order to confirm that the business received the opt-out message and will not send any additional text messages.
F-12
Table of Contents
Notes to Consolidated Financial Statements—(Continued)
On October 21, 2011, the Company received a notice from GameStop Corp. and GameStop Inc. (together, GameStop) requesting indemnification in connection with a class action litigation entitled Karayan v. GameStop Corp. and GameStop Inc. (the Karayan Litigation), which had been initiated against GameStop based in part on mobile termination text messages. The Company is not a named defendant or other party in the Karayan Litigation. On January 6, 2012, the Company delivered a letter agreement to GameStop, in which the Company agreed to indemnify GameStop in relation to the Karayan Litigation.
The Company intends to defend vigorously against the claims in the Karayan Litigation that allege GameStop violated provisions of the TCPA in delivering mobile termination text messages. The Company is continuing to investigate this matter. At this time it is not possible for the Company to estimate the amount of damages, losses, fees and other expenses that it will incur as the result of its indemnification obligations to GameStop, but such an amount could have a material adverse effect on the Company’s financial condition, operating results and cash flows. Substantial costs are likely to be incurred to defend this matter.
Sager Litigation
On January 11, 2012, a class action litigation (the Sager Litigation) was filed against Bank of America and the Company as co-defendants. The Sager Litigation alleges that Bank of America and the Company sent text massages to the plaintiff without the plaintiff’s prior express consent, in violation of the TCPA. Plaintiff is seeking confirmation of a class of individuals who received unauthorized text message solicitations from the Company. The Company intends to defend vigorously against the claims in the Sager Litigation that allege the Company violated provisions of the TCPA in delivering text messages. The Company is continuing to investigate this matter. At this time it is not possible for the Company to estimate the amount of damages, losses, fees and other expenses that it will incur as the result of the Sager Litigation but such an amount could have a material adverse effect on the Company’s financial condition, operating results and cash flows. Substantial costs are likely to be incurred to defend this matter.
Other Proceedings
From time to time and in the ordinary course of business, the Company is subject to various claims, charges, investigations and litigation. At December 31, 2011, the Company did not have any pending claims, charges, investigations or litigation other than as described above.
7. STOCK-BASED COMPENSATION
2000 Stock Incentive Plan
Under the Company’s 2000 Stock Option Plan (the 2000 Plan), the Company was permitted to grant incentive stock options and nonqualified stock options to purchase up to 2,749,083 shares of common stock. The options generally vest ratably over four years and expire no later than ten years after the date of grant. Upon completion of the Company’s initial public offering, no further stock options could be granted under the 2000 Plan.
2007 Stock Incentive Plan
In August 2007, the Company’s Board of Directors approved the SoundBite Communications, Inc. 2007 Stock Incentive Plan (the 2007 Plan). The 2007 Plan provides for the grant of incentive stock options, nonstatutory stock options, restricted stock, restricted stock units, stock appreciation rights and other stock-based awards. The 2007 Plan provides for an annual increase in the number of shares available for issuance under the
F-13
Table of Contents
Notes to Consolidated Financial Statements—(Continued)
2007 Plan on the first day of each year from 2008 through 2017 equal to the least of a) 1.5 million shares of common stock, b) 5% of the outstanding shares on such date and c) an amount determined by the Board. Outstanding options generally vest ratably over four years, and no options may expire later than ten years after the date of grant.
At December 31, 2011, there were 1,279,373 shares available for grant under the 2007 Plan. Stock option activity during the year ended December 31, 2011 was as follows:
| Year Ended December 31, 2011 | ||||||||||||||||
| Number of Options |
Weighted Average Exercise Price |
Weighted Average Remaining Contractual Term (in years) |
Aggregate Intrinsic Value (in 000’s) |
|||||||||||||
| Outstanding — January 1, 2011 |
3,298,369 | $ | 2.51 | |||||||||||||
| Granted |
399,250 | 2.38 | ||||||||||||||
| Exercised |
(70,774 | ) | 0.85 | |||||||||||||
| Forfeited or expired |
(179,395 | ) | 3.15 | |||||||||||||
|
|
|
|||||||||||||||
| Outstanding — December 31, 2011 |
3,447,450 | $ | 2.50 | 6.7 | $ | 1,428 | ||||||||||
|
|
|
|||||||||||||||
| Exercisable — end of year |
2,356,592 | $ | 2.55 | 6.0 | $ | 1,262 | ||||||||||
|
|
|
|||||||||||||||
| Vested & expected to vest — end of year |
3,304,926 | $ | 2.50 | 6.7 | $ | 1,418 | ||||||||||
|
|
|
|||||||||||||||
The weighted average grant date fair value of options granted during the years ended December 31, 2011, 2010 and 2009 was $1.40, $1.87 and $1.21, respectively. The intrinsic value of options exercised during the years ended December 31, 2011, 2010 and 2009 was $111,000, $86,000 and $1.3 million, respectively.
For the years ended December 31, 2011, 2010 and 2009, the Company used the Black-Scholes option pricing model to value option grants and determine the related compensation expense. As of December 31, 2011 the total compensation cost related to stock-based awards granted to employees and directors but not yet recognized was $1.2 million, net of estimated forfeitures. These costs will be recognized on a straight-line basis over a weighted average period of 2.1 years.
The following table provides the assumptions used in determining the fair value of the share-based awards:
| Year Ended December 31, | ||||||
| 2011 |
2010 |
2009 | ||||
| Risk Free Rate |
1.38 - 3.10% | 2.42 - 3.04% | 1.81 - 3.40% | |||
| Expected Life |
6.02 - 6.25 years | 6.02 - 6.25 years | 6.02 - 6.25 years | |||
| Expected Volatility |
62.8 - 67.7% | 65.6 - 74.9% | 61.0 - 64.3% | |||
| Weighted Average Volatility |
62.9% | 66.0% | 63.8% | |||
| Expected Dividend Yield |
0% | 0% | 0% | |||
The Company estimates expected volatility based on that of the Company’s publicly traded peer companies and expects to continue to do so until such time as the Company has adequate historical data related to the trading of the Company’s own stock. The comparable peer companies selected are publicly traded companies with similar operations as determined by the Company’s Board of Directors.
The risk-free interest rate used within the Black Scholes model for each grant is equal to the U.S. Treasury securities interest rate for the expected life of the option.
F-14
Table of Contents
Notes to Consolidated Financial Statements—(Continued)
The expected term of options granted was determined based on the simplified method, in which the expected term is equal to the midpoint of the vesting term and the original contractual term. The Company’s stock has been publicly traded for slightly more than four years, and therefore, there is not sufficient historical share option experience to estimate the expected term using company specific data.
The Company recognizes compensation expense for only the portion of options that are expected to vest. The estimated forfeiture rate was based upon an analysis of the Company’s historical data and future expectations. If the actual number of forfeitures differs from those estimated by management, additional adjustments to compensation expense may be required in future periods.
During 2010, the Company granted restricted stock units to certain employees. The restricted stock units settle in shares of the Company’s common stock when vested. These awards vest quarterly over four years. Activity related to restricted stock units for the year ended December 31, 2011 was as follows:
| Number of Units |
Grant Date Fair Value |
|||||||
| Outstanding — January 1, 2011 |
69,542 | $ | 3.04 | |||||
| Granted |
— | — | ||||||
| Vested |
(25,129 | ) | 3.04 | |||||
|
|
|
|
|
|||||
| Outstanding — December 31, 2011 |
44,413 | $ | 3.04 | |||||
|
|
|
|
|
|||||
| Expected to vest — end of year |
44,413 | $ | 3.04 | |||||
|
|
|
|
|
|||||
The fair value of restricted stock units that vested during 2011 and 2010 totaled $46,000 and $26,000, respectively.
The following table presents stock-based compensation expense included in the consolidated statements of operations (in thousands):
| Year Ended December 31, | ||||||||||||
| 2011 | 2010 | 2009 | ||||||||||
| Cost of revenues |
$ | 42 | $ | 41 | $ | 22 | ||||||
| Research and development |
218 | 241 | 101 | |||||||||
| Sales and marketing |
459 | 476 | 352 | |||||||||
| General and administrative |
456 | 595 | 502 | |||||||||
|
|
|
|
|
|
|
|||||||
| Total stock-based compensation |
$ | 1,175 | $ | 1,353 | $ | 977 | ||||||
|
|
|
|
|
|
|
|||||||
8. ACQUISITIONS
In June 2011, the Company acquired key assets and assumed certain liabilities of SmartReply, a mobile marketing company located in Irvine, California. SmartReply had been delivering mobile marketing solutions to approximately 40 companies, including many of the top retail brands in North America. The purchase of SmartReply was consistent with the Company’s strategy to expand its capabilities and customer base in mobile marketing. The excess of the purchase price over the net assets acquired represented potential revenue enhancements and synergies from the Company’s existing customer base and the assembled workforce of SmartReply. The purchase price was allocated to the tangible and identifiable intangible assets acquired and liabilities assumed based on their estimated fair values on the closing date. The excess of purchase price over the aggregate
F-15
Table of Contents
Notes to Consolidated Financial Statements—(Continued)
fair values was recognized as goodwill. Revenues generated from clients acquired as part of the SmartReply asset acquisition during the year ended December 31, 2011 were $3.1 million and operating loss was $133,000, which includes amortization expense totaling $688,000.
The acquisition included cash payments of $3.2 million. Approximately $1.0 million of the purchase price was deposited in escrow to secure the seller’s representations and indemnifications and, subject to claims for damages, is expected to be distributed to the seller in installments over the two years following the acquisition. Contingent consideration arrangements in the form of an earn-out, which requires cash payments estimated at $1.7 million but up to a maximum of $8.9 million, may become payable annually over the three years following the acquisition, based upon year-over-year revenue growth in the Company’s mobile marketing business.
The Company recognized a liability totaling $1.2 million, representing the present value of the probability-weighted estimate of the future payments. As actual revenues from our mobile marketing business are recognized, the liability for the contingent consideration will periodically be adjusted to reflect management’s best estimate of the ultimate payout under this arrangement. Accordingly, changes in the assumptions could have a material impact on the amount of contingent consideration expense we record in any given period.
Transaction costs related to the SmartReply asset acquisition totaled $550,000 and have been reported in the Consolidated Statement of Operations within general and administrative expenses for the year ended December 31, 2011. The acquisition has been accounted for under the purchase method of accounting and accordingly, the results of operations of the SmartReply business have been included in the accompanying financial statements in the period following the date of acquisition. The Company recorded deferred tax liabilities of $905,000, primarily related to the intangible assets acquired from SmartReply and released a corresponding amount of its deferred tax asset valuation allowance. The $905,000 release of the valuation allowance was recognized as a benefit for income taxes for the year ended December 31, 2011. Pro forma results of SmartReply’s operations have not been presented because the effect of this acquisition was not material to the Consolidated Statement of Operations.
The purchase price has been allocated to the assets acquired and liabilities assumed based on fair value, with any excess recorded as goodwill. None of the acquired intangible assets, including goodwill, are deductible for tax purposes. The components of the purchase price allocation are as follows (in thousands):
| Purchase Price: |
||||
| Cash paid |
$ | 3,150 | ||
| Contingent consideration |
1,158 | |||
|
|
|
|||
| Total |
$ | 4,308 | ||
|
|
|
|||
| Allocations: |
||||
| Customer receivables and other current assets |
$ | 756 | ||
| Property and equipment |
50 | |||
| Intangible assets: |
||||
| Customer relationships (3 years) |
2,330 | |||
| Trade name (2 years) |
28 | |||
| Deferred tax liability |
(905 | ) | ||
| Goodwill |
2,726 | |||
|
|
|
|||
| Total assets acquired |
4,985 | |||
| Current liabilities assumed |
(677 | ) | ||
|
|
|
|||
| Total net assets acquired |
$ | 4,308 | ||
|
|
|
F-16
Table of Contents
Notes to Consolidated Financial Statements—(Continued)
The Company is amortizing the identifiable intangible assets acquired from SmartReply over the weighted average useful life of 1.7 years using methods that most closely relate to the depletion of these assets.
9. GOODWILL AND INTANGIBLES
In February 2008, the Company acquired substantially all of the assets of Mobile Collect, Inc (Mobile Collect). Mobile Collect was a privately held company that provided text messaging and mobile communications solutions. The Company acquired these assets with the goal of supplementing the Company’s service capabilities to include Free-To-End-User text messaging. The acquisition included cash payments of $500,000 upon closing and contingent cash payments of up to $2 million payable through 2013 upon Mobile Collect achieving certain established financial targets. The contingent cash payments are recognized as additions to goodwill as the consideration is determined and becomes payable. As of December 31, 2011, the Company had remaining contingent consideration related to the acquisition of approximately $200,000.
In June 2011, the Company acquired key assets and assumed certain liabilities of SmartReply. Refer to Note 8 for further details of the transaction.
As a result of the economic environment impacting the Company’s business and operating results coupled with a material decline of the Company’s stock price, the Company determined that impairment triggering events had occurred that would require interim impairment evaluations, which resulted in impairment charges totaling $121,000 for the year ended December 31, 2009. The fair value of the reporting unit was determined using a market approach, which utilized the Company’s market capitalization as a basis for estimating fair value. The fair value of the Company’s assets and liabilities used in Step 2 includes certain identifiable intangible assets, for which fair value is typically measured using an analysis of discounted cash flows.
The fair market value of the Company exceeded its carrying value by approximately 34% at November 1, 2011, the Company’s most recent annual impairment assessment date. As such, no indications of impairment were noted.
The changes in the carrying amount of the Company’s goodwill for each of the three years in the period ended December 31, 2011 are as follows (in thousands):
| Goodwill | Accumulated Impairments |
Net Balance |
||||||||||
| Balance at January 1, 2009 |
$ | 248 | $ | (248 | ) | $ | — | |||||
| Add: Mobile Collect contingent consideration |
334 | — | 334 | |||||||||
| Less: Impairment recognized |
— | (121 | ) | (121 | ) | |||||||
|
|
|
|
|
|
|
|||||||
| Balance at December 31, 2009 |
582 | (369 | ) | 213 | ||||||||
| Add: Mobile Collect contingent consideration |
549 | — | 549 | |||||||||
|
|
|
|
|
|
|
|||||||
| Balance at December 31, 2010 |
1,131 | (369 | ) | 762 | ||||||||
| Add: SmartReply asset acquisition (Note 8) |
2,726 | — | 2,726 | |||||||||
| Mobile Collect contingent consideration |
798 | — | 798 | |||||||||
|
|
|
|
|
|
|
|||||||
| Balance at December 31, 2011 |
$ | 4,655 | $ | (369 | ) | $ | 4,286 | |||||
|
|
|
|
|
|
|
|||||||
F-17
Table of Contents
Notes to Consolidated Financial Statements—(Continued)
Intangible assets consisted of the following (in thousands):
| December 31, 2011 |
Gross Value |
Accumulated Amortization |
Net Carrying Value |
|||||||||
| Technology |
$ | 10 | $ | 10 | $ | — | ||||||
| Non-compete agreements |
20 | 15 | 5 | |||||||||
| Customer relationships |
2,650 | 1,000 | 1,650 | |||||||||
| Tradenames |
28 | 8 | 20 | |||||||||
| Internal-use software |
500 | 139 | 361 | |||||||||
|
|
|
|
|
|
|
|||||||
| $ | 3,208 | $ | 1,172 | $ | 2,036 | |||||||
|
|
|
|
|
|
|
|||||||
| December 31, 2010 |
||||||||||||
| Technology |
$ | 10 | $ | 10 | $ | — | ||||||
| Non-compete agreements |
20 | 11 | 9 | |||||||||
| Customer relationships |
320 | 312 | 8 | |||||||||
| Internal-use software |
500 | — | 500 | |||||||||
|
|
|
|
|
|
|
|||||||
| $ | 850 | $ | 333 | $ | 517 | |||||||
|
|
|
|
|
|
|
|||||||
The Company is amortizing the SmartReply and Mobile Collect identifiable intangible assets, as well as its internal-use software, over their estimated useful lives of two to five years using methods that most closely relate to the depletion of these assets. Amortization expense for the years ended December 31, 2011, 2010 and 2009 was $839,000, $62,000 and $126,000, respectively. Estimated annual amortization expense related to the intangible assets is as follows (in thousands):
| Year Ending December 31, |
Amount | |||
| 2012 |
$ | 1,078 | ||
| 2013 |
736 | |||
| 2014 |
222 | |||
|
|
|
|||
| Total |
$ | 2,036 | ||
|
|
|
|||
10. FAIR VALUE
The fair value hierarchy requires an entity to maximize the use of observable inputs and minimize the use of unobservable inputs when measuring fair value. Observable inputs are obtained from independent sources and can be validated by a third party, whereas unobservable inputs reflect assumptions regarding what a third party would use in pricing an asset or liability. The fair value hierarchy is based upon the lowest level of input that is significant to the fair value measurement. There are three levels of inputs that may be used to measure fair value as follows:
Level 1 — Quoted prices in active markets for identical assets or liabilities
Level 2 — Other inputs that are directly or indirectly observable in the marketplace
Level 3 — Unobservable inputs that are supported by little or no market activity
The carrying value of the Company’s financial instruments, including cash, short-term investments, accounts receivable and accounts payable, approximate their fair value because of their short-term nature. The
F-18
Table of Contents
Notes to Consolidated Financial Statements—(Continued)
Company measures cash equivalents, which are comprised of money market fund deposits, short-term investments, which are comprised of commercial paper, certificate of deposits and U.S. government agency bonds, and a contingent liability at fair value.
At December 31, 2011 and 2010, the money market funds and U.S. government agency bonds were valued based upon quoted prices for the specific securities in an active market and therefore classified as Level 1. At December 31, 2011, the commercial paper and certificate of deposits were valued on the basis of valuations provided by third-party pricing services, as derived from such services’ pricing models. Inputs to the models may include, but are not limited to, reported trades, executable bid and asked prices, broker/dealer quotations, prices or yields of securities with similar characteristics, benchmark curves or information pertaining to the issuer, as well as industry and economic events. The pricing services may use a matrix approach, which considers information regarding securities with similar characteristics to determine the valuation for a security, and are therefore classified as Level 2.
The Level 3 liability consists of contingent consideration related to the SmartReply acquisition in the form of an earn-out for a maximum of $8.9 million that may become payable in annual installments over the three years following the acquisition, based upon year-over-year revenue growth in the Company’s mobile marketing business. The fair value of the contingent consideration was estimated by applying an income approach. The measure is based on significant inputs that are unobservable in the market. Key assumptions include a discount rate of 18.5% and probability weighted estimates of future revenues of the acquired business.
Assets and liabilities measured at fair value on a recurring basis consisted of the following types of instruments as of December 31, 2011 and 2010 (in thousands):
| Fair Value Measurements at Reporting Date Using | ||||||||||||||||
| Quoted Prices in Active Markets for Identical Instruments (Level 1) |
Significant Other Observable Inputs (Level 2) |
Significant Unobservable Inputs (Level 3) |
Total Balance |
|||||||||||||
| December 31, 2011 |
||||||||||||||||
| Assets: |
||||||||||||||||
| Money market fund deposits |
$ | 16,273 | $ | — | $ | — | $ | 16,273 | ||||||||
| Short-term investments: |
||||||||||||||||
| Commercial paper |
— | 5,594 | — | 5,594 | ||||||||||||
| U.S. government agency bonds |
4,583 | — | — | 4,583 | ||||||||||||
| Certificate of deposit |
— | 799 | — | 799 | ||||||||||||
| Liabilities: |
||||||||||||||||
| Liability for contingent consideration |
— | — | 1,256 | 1,256 | ||||||||||||
| December 31, 2010 |
||||||||||||||||
| Assets: |
||||||||||||||||
| Money market fund deposits |
$ | 33,134 | $ | — | $ | — | $ | 33,134 | ||||||||
The liability for contingent consideration increased $98,000 from the date of the SmartReply asset acquisition through December 31, 2011 due to a fair value adjustment based upon the passage of time and present value considerations. This amount was recognized in the statement of operations within general and administrative expenses.
F-19
Table of Contents
Notes to Consolidated Financial Statements—(Continued)
11. INCOME TAXES
The Company’s (benefit) provision for income taxes for the years ended December 31, 2011, 2010 and 2009 totaled $(891,000), $(30,000) and $16,000, respectively The 2010 amount includes the benefit of the carryback of net operating losses to recover prior-year alternative minimum tax. The 2011 benefit includes the release of $905,000 of valuation allowance that resulted from the recognition of the deferred tax liabilities in the June 2011 SmartReply asset acquisition, which provided evidence to support the recoverability of the deferred tax asset totaling $905,000.
Deferred income taxes reflect the net tax effects of temporary differences between the carrying amount of assets and liabilities for financial reporting purposes and the amounts used for income tax purposes. Significant components of the Company’s net deferred income taxes were as follows (in thousands):
| As of December 31, | ||||||||
| 2011 | 2010 | |||||||
| Deferred tax assets: |
||||||||
| Net operating loss carryforwards |
$ | 8,068 | $ | 7,600 | ||||
| Accounts receivable |
65 | 79 | ||||||
| Intangibles amortization and goodwill |
— | 13 | ||||||
| Accrued expenses |
284 | 227 | ||||||
| Research and development credits |
1,802 | 1,573 | ||||||
| Deferred revenue |
97 | 88 | ||||||
| Stock compensation |
424 | 312 | ||||||
| Depreciation |
— | 238 | ||||||
|
|
|
|
|
|||||
| Total deferred tax assets |
10,740 | 10,130 | ||||||
|
|
|
|
|
|||||
| Deferred tax liabilities: |
||||||||
| Intangibles amortization and goodwill |
(633 | ) | — | |||||
| Depreciation |
(50 | ) | — | |||||
|
|
|
|
|
|||||
| Total deferred tax liabilities |
(683 | ) | — | |||||
|
|
|
|
|
|||||
| Net deferred tax assets before valuation allowance |
10,057 | 10,130 | ||||||
| Valuation allowance |
(10,057 | ) | (10,130 | ) | ||||
|
|
|
|
|
|||||
| Total deferred tax assets |
$ | — | $ | — | ||||
|
|
|
|
|
|||||
A reconciliation of the U.S. federal taxes at the statutory rate to the Company’s recorded tax provision for the years ended December 31, 2011, 2010 and 2009 is as follows:
| December 31, | ||||||||||||
| 2011 | 2010 | 2009 | ||||||||||
| Tax at U.S. federal statutory rate |
$ | (815 | ) | $ | (1,140 | ) | $ | (1,365 | ) | |||
| State taxes, net of federal benefit |
(124 | ) | 7 | 9 | ||||||||
| Research and development and other credits generated |
(5 | ) | (217 | ) | (292 | ) | ||||||
| Nondeductible transaction costs |
191 | — | — | |||||||||
| Nondeductible stock options |
271 | 319 | 223 | |||||||||
| State tax operating losses and other |
51 | (178 | ) | 28 | ||||||||
| Change in valuation allowance |
(460 | ) | 1,179 | 1,413 | ||||||||
|
|
|
|
|
|
|
|||||||
| $ | (891 | ) | $ | (30 | ) | $ | 16 | |||||
|
|
|
|
|
|
|
|||||||
F-20
Table of Contents
Notes to Consolidated Financial Statements—(Continued)
A valuation allowance is recorded to reduce the deferred tax assets reported if, based on the weight of the evidence, it is more likely than not that some portion or all of the deferred tax assets will not be realized. After consideration of all the evidence, both positive and negative, including that the Company has not achieved a history of profitable operations, management has determined that a full valuation allowance at December 31, 2011, 2010 and 2009 is necessary to reduce the deferred tax assets to the amount that will more likely than not be realized.
At December 31, 2011, the Company had available federal and state net operating loss carryforwards of approximately $24.0 million and $6.0 million, respectively, which will expire between 2013 and 2031. The operating loss carryforwards included $1.4 million in income tax deductions related to stock options, the benefit of which will be reflected as a credit to additional paid-in capital if realized. In addition, the Company had federal and state research and development tax credits of approximately $1.3 million and $489,000, respectively, at December 31, 2011. All of these credits expire between 2018 and 2031.
Ownership changes, as defined by the Internal Revenue Code, may substantially limit the amount of net operating loss and tax credit carryforwards that can be utilized annually to offset future taxable income. The Company believes that ownership changes occurred in 2000, 2001 and 2007. The ownership change in 2007 resulted in an annual limitation amount of approximately $8.0 million for the net operating losses generated between 2002 and 2007. Subsequent ownership changes could further affect the limitation in future years. Such annual limitations could result in the expiration of net operating loss and tax credit carryforwards before utilization.
The tax years 2000 through 2011 remain open to examination by major taxing jurisdictions to which the Company is subject, which are primarily in the United States, as carryforward attributes generated in years past may still be adjusted upon examination by the Internal Revenue Service or state tax authorities if they have or will be used in a future period. Tax years from inception in Canada (2008) and UK (2010) remain open to examination by the tax authorities. The Company is currently not under examination by the Internal Revenue Service or any other tax authority for any tax years. The Company recognizes both accrued interest and penalties related to unrecognized benefits in income tax expense. The Company has not recorded any interest or penalties on any unrecognized tax benefits since its inception. The Company does not believe material uncertain tax positions have arisen to date, and as a result, no reserves for these matters have been recorded.
The Company continues to maintain its permanent reinvestment assertion with regard to the unremitted earnings of its foreign subsidiaries. As such, it does not accrue U.S. tax for the possible future repatriation of these unremitted foreign earnings. As of December 31, 2011, the amount of foreign earnings, which represent earnings in Canada and the United Kingdom, that are expected to remain invested outside the U.S. indefinitely and for which no U.S. tax cost has been provided, were not material. If the Company were to repatriate these earnings, it expects to utilize existing tax attributes (U.S. net operating losses) and expects any taxes to be paid to repatriate these earnings will be minimal.
12. BENEFIT PLAN
The Company has a retirement savings plan under Section 401(k) of the Internal Revenue Code. Participants may contribute up to a maximum percentage of their annual compensation to this plan as determined by the Company, limited to a maximum annual amount set by the Internal Revenue Service. The Company did not make any matching contributions to this plan during the years ended December 31, 2011, 2010 and 2009.
13. SUBSEQUENT EVENT
On February 24, 2012, the Company acquired 2ergo Americas, the U.S. operations of 2ergo Group plc, for a cash purchase price of $3.8 million. 2ergo Americas is a mobile marketing business and marketing solutions
F-21
Table of Contents
Notes to Consolidated Financial Statements—(Continued)
company located in Arlington, Virginia. The Company purchased 2ergo Americas in order to extend its client base to include leading companies in the telecom, media and consumer packaged goods industries while enhancing its existing mobile marketing offering. The Company has not presented pro forma information or the purchase price allocation as the accounting for the acquisition is not yet finalized. The Company is in the process of valuing the assets acquired and obtaining historical GAAP based financial statements of 2ergo Americas. The results of operations of 2ergo Americas are not expected to have a significant impact on the Company’s consolidated financial statements.
14. SELECTED QUARTERLY FINANCIAL DATA (UNAUDITED)
| Mar. 31, 2011 |
June 30, 2011 |
Sept. 30, 2011 |
Dec. 31, 2011 |
|||||||||||||
| (in thousands, except per share data) | ||||||||||||||||
| Revenues |
$ | 9,163 | $ | 9,552 | $ | 10,956 | $ | 11,982 | ||||||||
| Cost of revenues |
3,762 | 4,070 | 4,532 | 4,654 | ||||||||||||
| Gross profit |
5,401 | 5,482 | 6,424 | 7,328 | ||||||||||||
| Net (loss) income |
(1,466 | ) | (236 | ) | (196 | ) | 391 | |||||||||
| Basic and diluted (loss) earnings per share |
$ | (0.09 | ) | $ | (0.01 | ) | $ | (0.01 | ) | $ | 0.02 | |||||
| Mar. 31, 2010 |
June 30, 2010 |
Sept. 30, 2010 |
Dec. 31, 2010 |
|||||||||||||
| Revenues |
$ | 9,872 | $ | 9,752 | $ | 9,723 | $ | 10,147 | ||||||||
| Cost of revenues |
4,016 | 3,931 | 3,961 | 4,047 | ||||||||||||
| Gross profit |
5,856 | 5,821 | 5,762 | 6,100 | ||||||||||||
| Net (loss) income |
(1,065 | ) | (1,108 | ) | (1,183 | ) | 71 | |||||||||
| Basic and diluted (loss) earnings per share |
$ | (0.07 | ) | $ | (0.07 | ) | $ | (0.07 | ) | $ | 0.00 | |||||
F-22