Attached files
| file | filename |
|---|---|
| EX-32.1 - EX-32.1 - Nuveen Diversified Commodity Fund | d282129dex321.htm |
| EX-31.2 - EX-31.2 - Nuveen Diversified Commodity Fund | d282129dex312.htm |
| EX-32.2 - EX-32.2 - Nuveen Diversified Commodity Fund | d282129dex322.htm |
| EX-31.1 - EX-31.1 - Nuveen Diversified Commodity Fund | d282129dex311.htm |
| EXCEL - IDEA: XBRL DOCUMENT - Nuveen Diversified Commodity Fund | Financial_Report.xls |
Table of Contents
UNITED STATES
SECURITIES AND EXCHANGE COMMISSION
Washington, D.C. 20549
Form 10-K
(Mark One)
| x | ANNUAL REPORT PURSUANT TO SECTION 13 OR 15(d) OF THE SECURITIES EXCHANGE ACT OF 1934 |
For the fiscal year ended December 31, 2011
Or
| ¨ | TRANSITION REPORT PURSUANT TO SECTION 13 OR 15(d) OF THE SECURITIES EXCHANGE ACT OF 1934 |
For the transition period from to
Commission File Number 001-34879
Nuveen Diversified Commodity Fund
(Exact name of registrant as specified in its charter)
| Delaware | 27-2048014 | |
| (State or other jurisdiction of incorporation or organization) |
(I.R.S. Employer Identification No.) | |
| 333 West Wacker Drive Chicago Illinois |
60606 | |
| (Address of principal executive offices) | (Zip Code) | |
(877) 827-5920
(Registrant’s telephone number, including area code)
Securities registered pursuant to Section 12(b) of the Act:
| Title of Each Class |
Name of Each Exchange on Which Registered | |
| Common Units of Beneficial Interest | NYSE Amex |
Securities registered pursuant to Section 12(g) of the Act: None
Indicate by check mark if the Registrant is a well-known seasoned issuer, as defined in Rule 405 of the Securities Act. Yes ¨ No x
Indicate by check mark if the Registrant is not required to file reports pursuant to Section 13 or Section 15(d) of the Act. Yes ¨ No x
Indicate by check mark whether the registrant (1) has filed all reports required to be filed by Section 13 or 15(d) of the Securities Exchange Act of 1934 during the preceding 12 months (or for such shorter period that the registrant was required to file such reports), and (2) has been subject to such filing requirements for the past 90 days. Yes x No ¨
Indicate by check mark whether the registrant has submitted electronically and posted on its corporate Website, if any, every Interactive Data File required to be submitted and posted pursuant to Rule 405 of Regulation S-T (§229.405 of this chapter) during the preceding 12 months (or for such shorter period that the registrant was required to submit and post such files). Yes x No ¨
Indicate by check mark whether the registrant is a large accelerated filer, an accelerated filer, a non-accelerated file, or a smaller reporting company. See the definitions of “large accelerated filer,” “accelerated filer” and “smaller reporting company” in Rule 12b-2 of the Exchange Act. (Check one):
| Large accelerated filer | ¨ | Accelerated filer | x | |||||
| Non-accelerated filer | ¨ | (Do not check if smaller reporting company) | Smaller reporting company | ¨ | ||||
Indicate by check mark whether the registrant is a shell company (as defined in Rule 12b-2 of the Exchange Act). Yes ¨ No x
As of March 12, 2012, the registrant had 9,219,240 shares outstanding.
Table of Contents
NUVEEN DIVERSIFIED COMMODITY FUND
UNITED STATES SECURITIES AND EXCHANGE COMMISSION
Washington, D.C. 20549
FORM 10-K
| Page No. | ||||||
| Part I |
||||||
| Item 1. | 2 | |||||
| Item 1A. | 8 | |||||
| Item 1B. | 20 | |||||
| Item 2. | 20 | |||||
| Item 3. | 20 | |||||
| Item 4. | 20 | |||||
| Part II | ||||||
| Item 5. | Market for Registrant’s Common Equity, Related Stockholder Matters and Issuer Purchases of Equity Securities | 21 | ||||
| Item 6. | 23 | |||||
| Item 7. | Management’s Discussion and Analysis of Financial Condition and Results of Operations | 24 | ||||
| Item 7A. | 33 | |||||
| Item 8. | 37 | |||||
| Item 9. | Changes in and Disagreements with Accountants on Accounting and Financial Disclosure | 62 | ||||
| Item 9A. | 62 | |||||
| Item 9B. | 63 | |||||
| Part III |
||||||
| Item 10. | 64 | |||||
| Item 11. | 68 | |||||
| Item 12. | Security Ownership of Certain Beneficial Owners and Management and Related Stockholder Matters | 68 | ||||
| Item 13. | Certain Relationships and Related Transactions, and Director Independence |
68 | ||||
| Item 14. | 69 | |||||
| Part IV | ||||||
| Item 15. | 70 | |||||
| Signatures | 71 | |||||
Table of Contents
CAUTIONARY STATEMENT CONCERNING FORWARD-LOOKING INFORMATION
This annual report on Form 10-K (the “Annual Report”) includes forward-looking statements within the meaning of Section 27A of the Securities Act of 1933, as amended, and Section 21E of the Securities Exchange Act of 1934, as amended (the “Exchange Act”), that involve substantial risks and uncertainties. In some cases, you can identify forward-looking statements by terminology such as “may,” “will,” “should,” “expect,” “plan,” “anticipate,” “believe,” “estimate,” “predict,” “potential” or the negative of these terms or other comparable terminology. These forward-looking statements are based on current expectations, estimates and projections and are subject to a number of risks, uncertainties and other factors, both known (such as those described in “Risk Factors” and elsewhere in this Annual Report) and unknown, that could cause the actual results, performance, prospects or opportunities of the registrant to differ materially from those expressed in, or implied by, these forward-looking statements.
You should not place undue reliance on any forward-looking statements. Except as expressly required by the federal securities laws or otherwise, the registrant undertakes no obligation to publicly update or revise any forward-looking statements or the risks, uncertainties or other factors described in this Annual Report, as a result of new information, future events or changed circumstances or for any other reason after the date of this Annual Report.
1
Table of Contents
PART I
Organization
The Nuveen Diversified Commodity Fund (the “Fund”) was organized as a Delaware statutory trust on December 7, 2005, to operate as a commodity pool and commenced operations on September 27, 2010, with the public offering of 8,550,000 shares. The Fund operates pursuant to an Amended and Restated Trust Agreement (“Trust Agreement”). The Fund’s shares represent units of fractional undivided beneficial interest in, and ownership of, the Fund. Fund shares trade on the New York Stock Exchange Amex (“NYSE Amex”) under the ticker symbol “CFD.” The Fund is not a mutual fund, a closed-end fund, or any other type of “investment company” within the meaning of the Investment Company Act of 1940, as amended (the “1940 Act”), and is not subject to regulation thereunder.
Prior to its initial public offering, the Fund had no operations other than those related to organizational matters and the recording of organizational expenses ($597,000) and their reimbursement by Nuveen Investments, LLC, an affiliate of the Manager and a wholly-owned subsidiary of Nuveen Investments, Inc. (“Nuveen”). Effective April 30, 2011, Nuveen Investments, LLC changed its name to Nuveen Securities, LLC. On May 11, 2010, the Fund received a $20,055 initial capital contribution from, and issued 840 shares to, Nuveen Commodities Asset Management, LLC, the Fund’s manager (“NCAM” or the “Manager”), a wholly-owned subsidiary of Nuveen. NCAM is a Delaware limited liability company registered as a commodity pool operator and commodity trading advisor with the Commodity Futures Trading Commission (the “CFTC”) and is a member of the National Futures Association (“NFA”). The Manager has the power and authority, without shareholder approval, to cause the Fund to issue shares from time to time as it deems necessary or desirable. The number of shares authorized is unlimited.
The Manager has selected Gresham Investment Management LLC (“Gresham” or the “Commodity Sub-advisor”) to manage the Fund’s commodity investment strategy and its options strategy. Gresham is a Delaware limited liability company, the successor to Gresham Investment Management, Inc., formed in July 1992. Gresham is registered with the CFTC as a commodity trading advisor and commodity pool operator, is a member of the NFA and is registered with the Securities and Exchange Commission (“SEC”) as an investment adviser. On December 31, 2011, Nuveen completed its acquisition of a 60% stake in Gresham. As part of the acquisition, Gresham’s management and investment teams will maintain a significant minority ownership stake in the firm, and will continue to operate independently while levering the strengths of Nuveen’s shared resources. Gresham remains the Fund’s Commodity Sub-advisor and there have been no changes in the Fund’s investment objectives, strategies or expenses.
The Manager has selected its affiliate, Nuveen Asset Management, LLC (“Nuveen Asset Management” or the “Collateral Sub-advisor”), an affiliate of the Manager and an indirect wholly-owned subsidiary of Nuveen, to invest the Fund’s collateral in short-term, high grade debt securities. Nuveen Asset Management is a Delaware limited liability company and is registered with the SEC as an investment adviser.
Investment Objective and Investment Strategy
The Fund’s investment objective is to generate higher risk-adjusted total return than leading commodity market benchmarks, specifically the Dow Jones-UBS Commodity Index® (“DJ-UBSCI”) and the S&P GSCI® Commodity Index (“GSCI”), and passively managed commodity funds. Risk-adjusted total return refers to the income and capital appreciation generated by a portfolio (the combination of which equals its total return) per
2
Table of Contents
unit of risk taken, with such risk measured by the volatility of the portfolio’s total returns over a specific period of time. In pursuing its investment objective, the Fund invests directly in a diversified portfolio of commodity futures and forward contracts to obtain broad exposure to all principal groups in the global commodity markets. The Fund’s investment strategy has three elements:
| • | An actively managed portfolio of commodity futures and forward contracts utilizing Gresham’s proprietary Tangible Asset Program (“TAP®”), a long-only rules-based commodity investment strategy designed to maintain consistent, fully collateralized exposure to commodities as an asset class; |
| • | An integrated program of writing commodity call options designed to enhance the risk-adjusted total return of the Fund’s commodity investments (TAP® and the options strategy are collectively referred to as TAP PLUSSM); and |
| • | A collateral portfolio of cash equivalents and short-term, high grade debt securities. |
Commodity Investments. The Fund invests in a diversified portfolio of commodity futures and forward contracts pursuant to TAP®, an actively managed, fully collateralized, long-only, rules-based commodity investment strategy. TAP® is designed to maintain consistent, fully collateralized exposure to commodities as an asset class. “Fully collateralized” means that the Fund maintains as collateral high grade debt securities in an aggregate amount corresponding to the full notional value of its commodity investments. “Long-only, rules-based” means that the Fund holds it futures contracts until just before expiration pursuant to a set of clearly defined rules.
The Fund makes commodity investments in the six principal commodity groups in the global commodities markets:
| • | energy; |
| • | industrial metals; |
| • | agriculturals; |
| • | precious metals; |
| • | foods and fibers; and |
| • | livestock. |
Except for certain limitations described herein, there are no restrictions or limitations on the specific commodity contracts in which the Fund may invest. The specific commodities in which the Fund invests, and the relative target weighting of those commodities, are determined annually by the Commodity Sub-advisor. The target weights are expected to remain unchanged until the next annual determination. The Fund’s portfolio concentration in any single commodity or commodity group will be limited in an attempt to moderate volatility. The Fund intends to limit the target weightings of each commodity group such that no group’s target weighting may constitute more than 35% of TAP®, no two groups’ combined target weightings may constitute more than 60% of TAP® and no single commodity’s target weighting can constitute more than 70% of its group. Under normal market circumstances, the Commodity Sub-advisor avoids exercising discretion between such annual determinations. However, the actual portfolio weights may vary during the year and may in certain circumstances be rebalanced subject to TAP®’s rule-based procedures. The Commodity Sub-advisor may change the TAP® rules at year end and as a result may change the commodities it invests in. During temporary defensive periods or during adverse market circumstances, the Fund may deviate from its investment policies and objective. For target weightings as of December 31, 2011, as well as TAP® weightings as of January 31, 2012, which reflect the 2012 annual determination, see Item 7 of this Annual Report.
Gresham believes that the relative performance of strategies that invest in exchange-traded commodity futures and forward contracts may be enhanced through active implementation. Generally, the Fund expects to invest in short-term commodity futures and forward contracts with terms of one to three months but may invest in commodity contracts with terms of up to six months. Gresham regularly purchases and subsequently sells,
3
Table of Contents
i.e. “rolls,” individual commodity futures and forward contracts throughout the year so as to maintain a fully invested position. As the commodity contracts near their expiration dates, Gresham rolls them over into new contracts. Gresham seeks to add value compared with leading commodity market benchmarks and passively managed commodity funds by actively managing the implementation of the rolls of the commodity contracts. As a result, the roll dates, terms and contract prices selected by Gresham may vary based upon Gresham’s judgment of the relative value of different contract terms. Gresham’s active management approach is market driven and opportunistic and is intended to minimize market impact and avoid market congestion during certain days of the trading month.
Because the nature of the Fund’s investments in commodity futures and forward contracts does not require significant outlays of principal, currently approximately 15% of the Fund’s net assets are committed to establishing those positions. In addition, the Fund expects that, if put options are purchased in the future, no more than 5% of the Fund’s net assets would be used to purchase commodity put options at any one time and that option premiums generated by the sale of call options on commodity futures and forward contracts would be sufficient to cover the premiums paid for those put options.
Most of the commodity futures and options contracts acquired to facilitate implementing the investment strategy are exchange listed and generally qualify as “Section 1256 Contracts” for tax purposes. Section 1256 Contracts held by the Fund at the end of a taxable year of the Fund will be treated for U.S. federal income tax purposes as if they were sold by the Fund at their fair market value on the last business day of the taxable year. The net gain or loss, if any, resulting from these deemed sales (known as “marking to market”), together with any gain or loss resulting from any actual sales of Section 1256 Contracts (or other termination of the Fund’s obligations under such contracts), must be taken into account by the Fund in computing its taxable income for the year. Capital gains and losses from Section 1256 Contracts generally are characterized as long-term capital gains or losses to the extent of 60% of the gains or losses and as short-term capital gains or losses to the extent of 40% of the gains or losses. Thus, shareholders of the Fund will generally take into account their pro rata share of the long-term capital gains and losses and short-term capital gains and losses from Section 1256 Contracts held by the Fund.
Options Strategy. Pursuant to the options strategy, the Fund writes “out-of-the-money” call options on individual futures and forward contracts held by it, and may write “out-of-the-money” call options on baskets of commodities or on broad-based commodity indices, such as the DJ-UBSCI or the GSCI, whose prices are expected to closely correspond to at least a substantial portion of the commodity futures and forward contracts held by the Fund. A call option gives its owner (buyer) the right but not the obligation to buy the underlying futures contract at a particular price, known as the strike price, at anytime between the purchase date and the expiration date of the option. The person who writes (sells) the option to the buyer is thus required to fulfill the contractual obligation (by selling the underlying futures contract to the buyer at the strike price) should the option be exercised. If the option is covered, the writer (seller) has an offsetting futures position. The Fund writes commodity call options that are U.S. exchange-traded and that are typically “American-style” (exercisable at any time prior to expiration). The Fund also writes commodity call options that are non-U.S. exchange traded and that are typically “European-style” (exercisable only at the time of expiration). The Fund may also write commodity call options on a continual basis on up to approximately 50% of the notional value of each of its commodity futures and forward contract positions that, in Gresham’s determination, have sufficient option trading volume and liquidity. The Fund may write commodity call options with terms up to one year and with strike prices that may be up to 20% “out-of-the-money.” Generally, the Fund expects to write commodity call options with terms of one to three months. Subject to the foregoing limitations, the implementation of the options strategy is within Gresham’s discretion. Over extended periods of time, the term and “out of-the-moneyness” of the commodity options may vary significantly. While generating option premiums for the Fund, the call options will cause the Fund to forgo the right to any appreciation above the exercise price of the call options on the percentage of the notional value of the Fund’s long commodity positions covered by the call options. The Fund’s risk-adjusted return over any particular period may be positive or negative.
Collateral Investments. The Fund’s investments in commodity futures and forward contracts and options on commodity futures and forward contracts generally do not require significant outlays of principal. Currently, in
4
Table of Contents
the normal course of business, approximately 15% of the Fund’s assets are committed as “initial” and “variation” margin to secure the Fund’s futures and forward contract positions. These assets are placed in one or more commodity futures accounts maintained by the Fund at Barclays Capital Inc. (“BCI”), the Fund’s clearing broker, and are held in cash or invested in U.S. Treasury bills and other direct or guaranteed debt obligations of the U.S. government maturing within less than one year at the time of investment. The remaining collateral (currently approximately 85%) is held in a separate collateral investment account managed by the Collateral Sub-advisor.
The Fund’s assets held in the Fund’s separate collateral account are invested in cash equivalents or short-term debt securities with final terms not exceeding one year at the time of investment. These collateral investments are rated at all times at the applicable highest short-term or long-term debt or deposit rating or money market fund rating as determined by at least one nationally recognized statistical rating organization (“NRSRO”) or, if unrated, are judged by the Collateral Sub-advisor to be of comparable quality. These collateral investments consist primarily of direct and guaranteed obligations of the U.S. Government and senior obligations of U.S. Government agencies and may also include, among others, money market funds and bank money market accounts invested in U.S. Government securities as well as repurchase agreements collateralized with U.S. Government securities.
Management of the Fund
Trustees
Wilmington Trust Company (the “Delaware Trustee”), a Delaware banking corporation, is the Delaware Trustee of the Fund. The Delaware Trustee is unaffiliated with the Manager. The Delaware Trustee’s duties and liabilities with respect to the Fund’s management are limited to its express obligations under the Trust Agreement. In particular, the Delaware Trustee will accept service of legal process on the Fund in the State of Delaware and will make certain filings as required under the Delaware Statutory Trust Act, as amended (the “Delaware Statutory Trust Act”). The rights and duties of the Delaware Trustee, the individual trustees, the Manager and the shareholders are governed by the provisions of the Delaware Statutory Trust Act and by the Trust Agreement. Except for the limited duties described herein and in the Trust Agreement, that are exercised by the Delaware Trustee and the individual trustees, all duties and responsibilities to manage the business and affairs of the Fund are vested in the Manager, pursuant to the Trust Agreement and Delaware Statutory Trust Act.
The individual trustees, all of whom are unaffiliated with the Manager, make up the audit committee and nominating committee of the Fund and meet the independent director requirements established by the NYSE Amex and the Sarbanes-Oxley Act of 2002, as amended. The individual trustees serve as the board of the Fund. Each of the individual trustees receives an annual retainer fee of $25,000 as well as reimbursement for travel and out of pocket expenses.
The board of the Fund has the right under limited circumstances to terminate the manager of the Fund only for cause. “Cause” consists of a statutory disqualification of the manager under Sections 8a(2) or 8a(3) of the Commodity Exchange Act, as amended (“CEA”), suspension or revocation of the manager’s commodity pool operator (“CPO”) or commodity trading advisor (“CTA”) registrations or the bankruptcy, insolvency or receivership of the manager. The audit committee is responsible for the appointment, compensation, retention and oversight of the work of the independent registered public accounting firm engaged by the Fund. The nominating committee is responsible for appointing individual trustees in the event of any vacancy caused by death, resignation or removal and determining their compensation. Other than the responsibilities mandated by the NYSE Amex, the individual trustees have limited authority and responsibilities, which are set forth under the Trust Agreement. The Manager is vested with authority under the Trust Agreement to manage the affairs of the Fund and to assure compliance by the Fund with its responsibilities under the CEA.
5
Table of Contents
Manager
NCAM is the manager of the Fund, and is responsible for determining the Fund’s overall investment strategy and its implementation, including:
| • | the selection and ongoing monitoring of: |
| (a) | the Commodity Sub-advisor, which invests the Fund’s assets pursuant to TAP PLUSSM; and |
| (b) | the Collateral Sub-advisor, which invests the Fund’s collateral in short-term, high grade debt securities; |
| • | assessment of performance and potential needs to modify strategy or change sub-advisors; |
| • | the management of the Fund’s business affairs; and |
| • | the provision of certain clerical, bookkeeping and other administrative services for the Fund. |
The Manager may change, or temporarily deviate from, the Fund’s investment strategy and the manner in which the strategy is implemented if the Manager determines that it is in the best interests of Fund shareholders to do so based on existing market conditions or otherwise. For instance, the Manager could change or deviate from the Fund’s investment strategy or the manner in which it is implemented if, among other things, the Manager determined to replace Gresham (in which case the Fund would no longer employ TAP® or TAP PLUSSM because TAP® and TAP PLUSSM are proprietary to Gresham), the commodity option markets experienced a lack of volatility or liquidity so that it was no longer in the best interest of the Fund and its shareholders for the Fund to employ the options strategy, or unforeseen circumstances arose that necessitated a change in the Fund’s strategy or its implementation.
In addition, the Manager has the rights and obligations with respect to the Fund as described under the Trust Agreement.
The Manager is a wholly-owned subsidiary of Nuveen, a Delaware corporation. Founded in 1898, Nuveen and its affiliates had approximately $220 billion of assets under management as of December 31, 2011. Nuveen is a principal of the Manager.
The Manager is registered with the CFTC as a CTA (effective date of registration January 4, 2006) and as a CPO (effective date of registration January 4, 2006) and is a member of the NFA. The Manager has complete responsibility to ensure that the Fund complies with all obligations under the CEA.
Commodity Sub-advisor
The Manager has selected Gresham to manage the assets of the Fund to be invested pursuant to TAP PLUSSM (TAP® plus the options strategy). Gresham is a Delaware limited liability company, the successor to Gresham Investment Management, Inc. formed in July 1992. Gresham is registered with the CFTC as a CTA (effective date of registration August 17, 1994) and as a CPO (effective date of registration August 17, 1994) and is a member of the NFA. Gresham is also registered with the SEC as an investment adviser. Gresham’s sole business activity is to render commodity investment advisory services and manage assets on behalf of its clients and in doing so it administers several commodity investment programs. On December 31, 2011, Nuveen completed its acquisition of a 60% stake in Gresham. As part of the acquisition, Gresham’s management and investment teams will maintain a significant minority ownership stake in the firm, and will continue to operate independently while levering the strengths of Nuveen’s shared resources. Gresham remains the Fund’s Commodity Sub-advisor and there have been no changes in the Fund’s investment objectives, strategies or expenses.
Gresham pursues the Fund’s investment objective by utilizing an actively-managed, fully collateralized, long-only, rules-based commodity investment strategy and an options strategy (together referred to as TAP PLUSSM).
6
Table of Contents
Gresham believes that commodities as an asset class are often under represented in the investment portfolios of individuals, and that maintaining consistent exposure to commodities may potentially add significant diversification benefits to an investor’s portfolio that is otherwise composed primarily of U.S equities and U.S. bonds.
Collateral Sub-advisor
The Manager has selected Nuveen Asset Management to invest the Fund’s collateral (excluding the initial and variation margin maintained at BCI) in short-term, high grade debt securities. Nuveen Asset Management is a Delaware limited liability company and is registered with the SEC as an investment adviser. Founded in 1898, Nuveen and its affiliates had approximately $220 billion in assets under management as of December 31, 2011, of which approximately $104 billion was managed by the Collateral Sub-advisor.
The Collateral Sub-advisor invests the Fund’s collateral not otherwise held in a margin account by BCI using a short-term, near-cash, fixed-income strategy. The Collateral Sub-advisor emphasizes current income, liquidity and preservation of capital. As a result, the Fund maintains significant collateral that is invested in short-term debt securities with maturities up to one year that, at the time of investment, are of high grade quality, including obligations issued or guaranteed by the U.S. government, its agencies and instrumentalities and corporate obligations. A debt instrument is considered of high grade quality if it is rated AA or better by at least one of the NRSROs that rate such instrument (even if rated lower by another), or it is unrated by any NRSRO but judged to be of comparable quality by the Collateral Sub-advisor.
Management Fees
For the services and facilities provided by the Manager, the Fund has agreed to pay the Manager an annual fee, payable monthly, based on the Fund’s average daily net assets, according to the following schedule:
| Average Daily Net Assets |
Management Fee | |||
| Up to $500 million |
1.250 | % | ||
| $500 million to $1 billion |
1.225 | % | ||
| $1 billion to $1.5 billion |
1.200 | % | ||
| $1.5 billion to $2 billion |
1.175 | % | ||
| $2 billion and over |
1.150 | % | ||
Pursuant to an agreement among the Manager, the Fund and the Commodity Sub-advisor, the Commodity Sub-advisor receives from the Manager a fee of .35% based on the Fund’s average daily net assets, payable on a monthly basis.
Pursuant to an agreement among the Manager, the Fund and the Collateral Sub-advisor, the Collateral Sub-advisor receives from the Manager a fee based on the Fund’s average daily net assets, payable on a monthly basis as follows:
| Average Daily Net Assets |
Management Fee | |||
| Up to $500 million |
.3000 | % | ||
| $500 million to $1 billion |
.2875 | % | ||
| $1 billion to $1.5 billion |
.2750 | % | ||
| $1.5 billion to $2 billion |
.2625 | % | ||
| $2 billion and over |
.2500 | % | ||
“Average daily net assets” means the total assets of the Fund, minus the sum of its liabilities.
In addition to the fee paid to the Manager, the Fund pays all routine and extraordinary costs and expenses of its operations, including brokerage expenses, custody fees, transfer agent expenses, professional fees, expenses of
7
Table of Contents
preparing, printing and distributing reports, notices, information statements, proxy statements, reports to governmental agencies, and taxes, if any.
The agreements with the Commodity Sub-advisor and the Collateral Sub-advisor (collectively, the “Sub-advisors”) may be terminated at any time, without penalty, by either the Manager or a sub-advisor upon 120 days written notice. Also, the agreement with the Commodity Sub-advisor can be terminated by the Commodity Sub-advisor in certain circumstances on 90 days notice. Each of the agreements provides that the sub-advisor will not be liable to the Fund in connection with the performance of its duties, and the Fund will indemnify the sub-advisor for losses and costs arising out of its status as a sub-advisor to the Fund if the sub-advisor acted in good faith and in a manner it reasonably believed to be in or not opposed to the best interests of the Fund, except, in each case, for a loss resulting from the sub-advisor’s willful misfeasance, bad faith or gross negligence or reckless disregard of its duties and obligations under the agreement. The sub-advisor will indemnify the Fund and the Manager for losses and costs attributable to such willful misfeasance, bad faith or gross negligence or reckless disregard.
If the Manager determines it is in the best interests of shareholders to select additional CTAs or replace a sub-advisor, the Manager will consider certain information with respect to each new CTA, including the following:
| • | general information including the identity of its affiliates and key personnel; |
| • | investment strategy and risk management of the CTA; |
| • | the CTA’s financial condition; |
| • | relevant performance history and the quality of services provided; |
| • | fees and expenses; and |
| • | capacity to take on new business. |
None of the foregoing agreements, or any extensions or replacements of such agreements, are subject to the approval of the Fund’s trustees or shareholders. As a result, the Manager may amend, extend or replace any such agreement in its sole discretion, and therefore may increase the fees of the Manager and either sub-advisor without any trustee or shareholder approval.
Employees
The Fund has no employees.
Available Information
The Fund files with or submits to the SEC annual and quarterly reports and other information meeting the information requirements pursuant to Section 13(a) and 15(d) of the Exchange Act. These reports are available on the Fund’s website at http://www.nuveen.com/CommodityInvestments. Investors may also inspect and copy any materials the Fund files with the SEC at the SEC’s Public Reference Room at 100 F Street, NE, Washington, D.C. 20549. Investors may obtain information on the operation of the Public Reference Room by calling the SEC at 1-800-SEC-0330. In addition, the SEC maintains an Internet site that contains reports, proxy and information statements and other information filed electronically with the SEC which are available on the SEC’s Internet site at http://www.sec.gov. The Fund also posts on its website an information statement and certain daily and monthly reports required by CFTC regulations.
An investment in the Fund involves a high degree of risk. Investors should be aware of the various risks, including those described below. Investors should consider carefully the risks described below before making an
8
Table of Contents
investment decision. Investors should also refer to the other information included in this Annual Report, including the Fund’s financial statements and the related notes and the Fund’s other filings with the SEC. Additional risks and uncertainties not presently known by the Fund or not presently deemed material by the Fund may also impair the Fund’s operations and performance. If any of the following events occur, the Fund’s performance could be materially and adversely affected. In such case, the Fund’s net asset value and the trading price of the Fund’s shares may decline and you may lose all or part of your investment.
Commodity Investment Strategy Risks
You may lose all of your investment—An investment in the Fund’s shares is subject to investment risk, including the possible loss of the entire amount that you invest. An investment in the Fund’s shares represents an indirect investment in the commodity futures and forward contracts owned by the Fund, the prices of which can be volatile, particularly over short time periods. Investments in individual commodity futures and forward contracts and options on futures contracts and forward contracts historically have had a high degree of price variability and may be subject to rapid and substantial price changes. These price changes may be magnified by computer-driven algorithmic trading, which is becoming more prevalent in the commodities market. The Fund could incur significant losses on its investments in those commodity futures and forward contracts. If the Fund experiences greater losses than gains during the period you hold shares, you will experience a loss for the period even if the Fund’s historical performance is positive. The Fund’s risk-adjusted returns over any particular period may be positive or negative. Movements in commodity investment prices are outside of the Fund’s control, are extremely difficult to predict and may not be anticipated by the Commodity Sub-advisor. Price movements may be influenced by, among other things:
| • | governmental, agricultural, trade, fiscal, monetary and exchange control programs and policies; |
| • | weather and climate conditions; |
| • | changing supply and demand relationships; |
| • | changes in international balances of payments and trade; |
| • | U.S. and international rates of inflation; |
| • | currency devaluations and revaluations; |
| • | U.S. and international political and economic events; |
| • | changes in interest and foreign currency/exchange rates; |
| • | market liquidity; and |
| • | changes in philosophies and emotions of market participants. |
The changing interests of investors, hedgers and speculators in the commodity markets may influence whether futures prices are above or below the expected future spot price—In order to induce investors or speculators to take the corresponding long side of a futures contract, commodity producers must be willing to sell futures contracts at prices that are below the present value of expected future spot prices. Conversely, if the predominant participants in the futures market are the ultimate purchasers of the underlying commodity futures contracts in order to hedge against a rise in prices, then speculators should only take the short side of the futures contract if the futures price is greater than the present value of the expected future spot price of the commodity. This can have significant implications for the Fund when it is time to reinvest the proceeds from a maturing futures contract into a new futures contract. If the interests of investors, hedgers and speculators in futures markets have shifted such that commodity purchasers are the predominant participants in the market, the Fund will be constrained to reinvest at higher futures prices which could have a negative effect on the Fund’s returns.
9
Table of Contents
Conversely, if commodity sellers are the predominant participants in the market, the Fund will be constrained to reinvest at lower prices which could have a negative effect on the Fund’s returns and may cause it to suffer losses on its long positions.
Regulatory developments could significantly and adversely affect the Fund—Commodity markets are subject to comprehensive statutes and regulations promulgated not only by the CFTC but also by self-regulatory organizations such as the NFA. Among others, the CFTC and the exchanges on which futures contracts are traded are authorized to take extraordinary actions in the event of a market emergency, including, for example, the retroactive implementation of speculative position limits or higher margin requirements, the establishment of daily limits and the suspension of trading. Any of these actions, if taken, could adversely affect the returns of the Fund by limiting or precluding investment decisions the Fund might otherwise make. The regulation of commodity transactions in the U.S. is a rapidly changing area of law and is subject to ongoing modification by government, self-regulatory and judicial action. In addition, various national governments have expressed concern regarding the disruptive effects of speculative trading in the currency markets and the need to regulate the derivatives markets in general. The effect of any future regulatory change on the Fund is impossible to predict, but could be substantial and adverse to the Fund.
Regulatory trading and exchange position limits may adversely affect the Fund—The CFTC and U.S. commodities exchanges limit the amount of fluctuation permitted in futures contract prices during a single trading day by regulations referred to as “daily price fluctuation limits” or “daily trading limits.” Once the daily trading limit has been reached in a particular futures contract, no trades may be made that day at a price beyond that limit or trading may be suspended for specified periods during the trading day. Futures contract prices could move to the limit for several consecutive trading days with little or no trading, thereby preventing prompt liquidation of futures positions and potentially disguising substantial losses the Fund may ultimately incur.
Separately, the CFTC and the U.S. commodities exchanges and certain non-U.S. exchanges have established limits referred to as “speculative position limits” or “accountability levels” on the maximum net long or short futures positions that any person may hold or control in contracts traded on such exchanges. The CFTC has recently withdrawn relief previously granted to Gresham concerning position limits with respect to certain agricultural commodities (soybeans, corn and wheat) in which Gresham invests under TAP®. The effect of such withdrawal is that, beginning January 15, 2010, Gresham became subject to the same position limit rules as other investors. Consistent with regulation, Gresham has taken steps to mitigate the potential risks associated with becoming subject to such limits (including expanding the number of exchanges on which it trades). In October 2011, the CFTC adopted final regulations pursuant to the Dodd-Frank Wall Street Reform and Consumer Protection Act of 2010 (the “Dodd-Frank Act”) that impose position limits on 28 physical commodity futures and options contracts and on physical commodity swaps that are economically equivalent to such contracts in order to prevent excessive speculation and manipulation in the commodity markets. The contracts include certain agricultural, metals and energy commodities to be traded by the Fund. Under such regulations, position limits would be set on the spot month, single month and all-months-combined across different trading venues for contracts based on the same underlying commodity. The position limits will be implemented in two phases: the first phase will be on spot month contracts for which position limits were established under prior regulations (i.e., certain agricultural contracts called “legacy contracts”) based on exchange data and existing limits. In the second phase, the CFTC will adjust the limits on spot month legacy contracts on a regular schedule, set to 25 percent of the CFTC’s determination of estimated deliverable supply for the commodity in normal cash marketing channels at the contract’s delivery point. The Fund does not intend to trade contracts in the spot month, which the final regulations define generally as the period commencing just before the first notice day for any delivery month and terminating at the end of the delivery period. Non-spot month limits for non-legacy contracts (agricultural contracts not subject to position limits before the final regulations and energy and metals contracts) will be set in the second phase based on a scaled percentage of the total open interest for a 12-month time period.
The final regulations require that a trader aggregate all positions in accounts in which the trader, directly or indirectly, holds an ownership or equity interest of 10 percent or more as well as accounts over which the trader controls trading. A trader would also be required to aggregate positions in multiple accounts or commodity pools, including passively-managed index funds, if those accounts or pools have identical trading strategies. The
10
Table of Contents
regulations provide for daily and monthly reporting of cash commodity transactions and corresponding hedge positions if limits are exceeded and an enhanced reporting regime for traders who hold or control positions in certain energy and metal contracts above a specified net long or net short position.
The compliance date for agricultural spot month and non-spot month legacy contracts is 60 days after the date of publication of the final regulations in the Federal Register. The aggregation of such limits will become effective 60 days after the CFTC adopts regulations further defining the term “swap” under the Dodd-Frank Act. For non-spot month non-legacy contracts the compliance date will be determined by the CFTC when it establishes limits expected to be in approximately 12 months after collection of swap positional data. Prior to this time, traders are required to comply with existing position limits and exchange accountability levels.
The final regulations are extremely complex and may require further guidance and interpretation by the CFTC to determine in all respects how they apply to the Fund.
Any deflation or unanticipated changes in inflation may negatively affect the expected future spot price of underlying commodities—Deflation or unanticipated changes in the rate of inflation may result in changes in the future spot price of the underlying commodities that could negatively affect the Fund’s profitability and result in potential losses. In addition, reduced economic growth may lead to reduced demand for the underlying commodities and put downward pressure on the future spot prices, adversely affecting the Fund’s operations and profitability. Although the Manager and the Commodity Sub-advisor believe that the Fund’s options strategy can provide the potential for current gains from option premiums, in up markets the Fund will forego potential appreciation in the value of the underlying contracts to the extent the price of those contracts exceeds the exercise price of options written by the Fund plus the premium collected by writing the call options.
Options Strategy Risks
There can be no assurance that the Fund’s options strategy will be successful—The Fund uses options on commodity futures and forward contracts to enhance the Fund’s risk-adjusted total returns. The Fund may seek to protect its commodity futures and forward contracts positions in the event of a market decline in those positions by purchasing commodity put options that are “out-of-the money.” The Fund’s use of options, however, may not provide any, or only partial, protection from adverse commodity price changes. Specific price movements of the commodities or futures contracts underlying an option cannot be accurately predicted. There may be imperfect correlation between the changes in the market value of the futures contracts and the corresponding options contracts held by the Fund. Accordingly, the return performance of the Fund’s commodity futures and forward contracts may not parallel the performance of the commodities or indices that serve as the basis for the options bought or sold by the Fund; this basis risk may reduce the Fund’s overall returns. Investing in options is volatile and requires an accurate assessment of the market and the underlying instrument. Factors such as increased or reduced volatility, limited dollar value traded and timing of placing and executing orders may preclude the Fund from achieving the desired results of the options strategy and could affect the Fund’s ability to generate income and gains and limit losses. Because of the volatile nature of the commodities markets, the writing (selling) of commodity options involves a high degree of risk.
The Fund may forego gains (i.e. capital appreciation) above the option exercise price on up to approximately 50% of its commodity futures and forward contracts as a result of selling “out-of-the-money” commodity call options—The Fund writes commodity call options with terms up to one year that may be up to 20% “out-of-the-money” on a continual basis on up to approximately 50% of the notional value of each of its commodity futures and forward contract positions that, in Gresham’s determination, have sufficient option trading volume and liquidity. As the writer of a call option, the Fund sells, in exchange for receipt of a premium, the right to any appreciation in the value of the futures or forward contract over a fixed price on or before a certain date in the future. Accordingly, the Fund is effectively limiting its potential for appreciation to the amount the option is “out-of-the-money” during the option term on up to approximately 50% of the notional value of its portfolio invested in commodity futures and forward contracts. As commodity prices change, an option that was “out-of-the-money” when written may subsequently become “in-the-money.”
11
Table of Contents
The Fund may incur put premium costs without benefiting from its investment in commodity put options—Although the Fund does not currently intend to do so, in the future the Fund may purchase commodity put options on all or substantially all of the notional value of its commodity futures and forward contract positions. As a holder of a put option, the Fund, in exchange for payment of a premium, has the right to receive from the seller of the commodity put option, if the current price is lower than the exercise price, the difference between the put exercise price and the current price of the underlying commodity futures or forward contract on or before a specified date (in the case of “American-style” options, on or before the expiration date or, in the case of “European-style” options, at the expiration date). If the price of the commodity futures or forward contract is greater than the exercise price of the put option upon expiration, then the Fund will have incurred the cost of the option but not have received any benefit from its purchase. In addition, because the Fund generally will purchase commodity put options that are substantially “out-of-the-money,” at the time of purchase, the Fund will not be protected against, and will bear the loss associated with, a market decline down to the exercise price of the option.
The Fund is subject to gap risk, which is the risk that a commodity price will change from one level to another with no trading in between—Usually such movements occur when there are adverse news announcements, which can cause a commodity price to drop substantially from the previous day’s closing price. In the event of an extreme market change or gap move in the price of a single commodity when Gresham is unable to trade, the Fund’s exposure to that commodity will increase in proportion to the Fund’s option exposure. The Fund’s option strategy increases the Fund’s gap risk and could adversely affect the Fund’s performance in the event that the price of an individual commodity futures contract drops substantially. Gap risk may also negatively impact the trading price of the Fund’s shares.
Risk that the Fund’s Shares May Trade at a Discount to Net Asset Value
There is a risk that the Fund’s shares may trade at prices other than the Fund’s net asset value per share—The net asset value of each share will change as fluctuations occur in the market value of the Fund’s portfolio. Investors should be aware that the public trading price of a share may be different from the net asset value of a share and that shares may trade at a discount from their net asset value (which could be significant). The price difference may be due to the fact that supply and demand forces at work in the secondary trading market for shares are not necessarily the same as the forces influencing the prices of the commodity futures and forward contracts and other instruments held by the Fund at any point in time.
Risks Related to an Exchange Listing
The NYSE Amex may halt trading in the shares which would adversely impact your ability to sell shares—The Fund’s shares are listed on the NYSE Amex under the market symbol CFD. Trading in shares may be halted due to market conditions or, in light of the NYSE Amex rules and procedures, for reasons that, in the view of the NYSE Amex, make trading in shares inadvisable. In addition, trading is subject to trading halts caused by extraordinary market volatility pursuant to “circuit breaker” rules that require trading to be halted for a specified period based on a specified market decline. There can be no assurance that the requirements necessary to maintain the listing of the shares will continue to be met or will remain unchanged.
The lack of an active trading market for shares may result in losses on your investment at the time of disposition of your shares—There can be no guarantee that an active trading market for the shares will be maintained. If you need to sell your shares at a time when no active market for them exists, the price you receive for your shares, assuming that you are able to sell them, likely will be lower than that you would receive if an active market did exist.
Commodity Sub-advisor Risks
Gresham utilizes a strategy for the Fund that differs from the strategy on which its historical performance record is based—Gresham’s historical performance record (as presented in the Fund’s information statement posted on its website) reflects the use of TAP® and TAP PLUSSM. Before the Fund’s initial public offering,
12
Table of Contents
Gresham had not previously employed TAP PLUSSM (TAP® plus the options strategy) for the accounts of clients and, as a result, its historical performance record for TAP® is not based on an investment approach that is identical to the investment approach used for the Fund. TAP PLUSSM is designed to enhance the Fund’s risk-adjusted total returns, which may have the effect of limiting the level of gains or losses that the Fund otherwise would achieve. Therefore, Gresham’s historical performance record for TAP® is not as relevant to investors in the Fund as it would be if Gresham were using only TAP® in investing for the Fund.
Past performance is no assurance of future results—Gresham bases its investment decisions on three inputs: (i) systematic calculations of the values of global commodity production; (ii) total U.S. dollar trading volume on commodity futures and forwards exchanges and (iii) global import/export trade values. Any subsequent commodity sub-advisor to the Fund may employ a different commodity investment strategy than Gresham. Neither Gresham’s proprietary methodology nor the investment methodology that may be used by any subsequent commodity sub-advisors take into account unanticipated world events that may cause losses to the Fund. Past performance does not assure future results.
Descriptions of the Commodity Sub-advisor’s strategies may not be applicable in the future—The Commodity Sub-advisor or any subsequent commodity sub-advisor may make material changes to the investment strategy it uses in investing the Fund’s assets with the consent of the Manager, who has the sole authority to authorize any material changes. If this happens, the descriptions in this document would no longer be accurate or useful. The Manager does not anticipate that this will occur frequently, if at all. You will be informed of any changes to the Commodity Sub-advisor’s strategy that the Manager deems to be material; however, you may not be notified until after a change occurs. Non-material changes may be made by the Commodity Sub-advisor or any subsequent commodity sub-advisor without the Manager’s consent. These changes may nevertheless affect the Fund’s performance.
Speculative position limits and daily trading limits may reduce profitability and result in substantial losses—All accounts owned or managed by a commodity trading advisor, such as the Commodity Sub-advisor, its principals and its affiliates are typically combined for speculative position limit purposes.
It is possible that the Commodity Sub-advisor will approach or reach position limits and, if so, will have a conflict of interest with respect to allocating limited positions among various accounts it manages. Further, the investment decisions of the Commodity Sub-advisor may be modified to avoid exceeding regulatory “position limits,” potentially subjecting the Fund to substantial losses and forcing the Fund to forego certain opportunities. The Commodity Sub-advisor may have to reduce the size of positions that would otherwise be taken for the Fund, liquidate commodity futures contracts at disadvantageous times or prices, or not trade in certain markets on behalf of the Fund in order to avoid exceeding such limits.
Modification of trades that would otherwise be made by the Fund, if required, could adversely affect the Fund’s operations and profitability. In addition, a violation of speculative position limits by the Commodity Sub-advisor could lead to regulatory or self-regulatory action resulting in mandatory liquidation of certain positions held by the Fund and other accounts of the Commodity Sub-advisor. There can be no assurance that the Commodity Sub-advisor will liquidate positions held on behalf of all the Commodity Sub-advisor’s accounts, including its own accounts, in a proportionate manner. In the event the Commodity Sub-advisor chooses to liquidate a disproportionate number of positions held on behalf of the Fund at unfavorable prices, the Fund may incur substantial losses.
Increased competition could adversely affect the Fund—The Commodity Sub-advisor believes that there has been, over time, an increase in interest in commodity investing. As Gresham’s capital under management increases, an increasing number of traders may attempt to initiate or liquidate substantial positions at or about the same time as the Commodity Sub-advisor, or otherwise alter historical trading patterns or affect the execution of trades, to the detriment of the Fund.
13
Table of Contents
Other Risks of the Fund’s Investment Strategy
There may be a loss on investments in short-term debt securities—When the Fund purchases a futures contract, the Fund is required to deposit with its futures commission merchant only a portion of the value of the contract. This deposit is known as “initial margin.” If and when the market moves against the position, the Fund is required to make additional deposits known as “variation margin.” The Fund invests its assets, other than the amount of margin required to be maintained by the Fund, in short-term, high grade debt securities. The value of these high grade debt securities generally moves inversely with movements in interest rates (declining as interest rates rise). The value of these high grade debt securities might also decline if the credit quality of the issuer deteriorates, or if the issuer defaults on its obligations. If the Fund is required to sell short-term debt securities before they mature when the value of the securities has declined, the Fund will realize a loss. This loss may adversely impact the price of the Fund’s shares.
Daily disclosure of portfolio holdings could allow replication of the Fund’s portfolio and could have a negative effect on the Fund’s holdings—Because the Fund’s total portfolio holdings are disclosed on a daily basis, other investors may attempt to replicate the Fund’s portfolio or otherwise use the information in a manner that could have a negative effect on the Fund’s individual portfolio holdings and the Fund’s portfolio as a whole.
Certain of the Fund’s investments may become illiquid—The Fund may not always be able to liquidate its investments at the desired price. It is difficult to execute a trade at a specific price when there is a relatively small volume of buy and sell orders in a market. A market disruption, such as a foreign government taking political actions that disrupt the market in its currency or in a major export, can also make it difficult to liquidate a position. Alternatively, limits imposed by futures exchanges or other regulatory organizations, such as speculative position limits and daily price fluctuation limits, may contribute to a lack of liquidity with respect to some commodity investments.
Unexpected market illiquidity may cause losses to investors. The large stated value of the investments that the Commodity Sub-advisor acquires for the Fund increases the risk of illiquidity by both making its investments more difficult to liquidate at favorable prices and increasing the losses while trying to do so.
An investment in the Fund may not necessarily diversify an investor’s overall portfolio—The investment performance of commodities has shown little long-term historical correlation to the performance of other asset classes such as U.S. equities and U.S. bonds. Little correlation means that there is a low statistical relationship between the performance of commodity investments, on the one hand, and U.S. equities and U.S. bonds, on the other hand. Because there is little long-term historical correlation, the Fund cannot be expected to be automatically profitable during unfavorable periods in the stock or bond markets, or vice versa. If, during a particular period of time, the Fund’s performance moves in the same general direction as the other financial markets or the Fund does not perform successfully relative to overall commodity markets, you may obtain little or no diversification benefits during that period from an investment in the Fund’s shares. In such a case, the Fund may have no gains to offset your losses from such other investments, and you may suffer losses on your investment in the Fund at the same time losses on your other investments are increasing.
Investments in futures contracts will expose the Fund to the risk of temporary aberrations or distortions in the commodity markets—The Fund is subject to the risk that temporary aberrations or distortions in the markets (such as war, strikes, geopolitical events and natural disasters) will occur that impact commodity prices and negatively impact the value of the Fund’s positions, thereby adversely affecting the value of your shares.
Because the futures contracts have no intrinsic value, the positive performance of your investment is wholly dependent upon an equal and offsetting loss—Futures trading is a risk transfer economic activity. For every gain there is an equal and offsetting loss rather than an opportunity to participate over time in general economic growth. Unlike most alternative investments, an investment in shares of the Fund does not involve acquiring any asset with intrinsic value. Overall stock and bond prices could rise significantly and the economy as a whole prosper while shares of the Fund trade unprofitably.
14
Table of Contents
Risk of Investing in Non-U.S. Markets
Investing in non-U.S. markets will expose the Fund to additional credit and regulatory risk—The Fund currently expects that up to 30% of its net assets invested in commodity futures and forward contracts and options on commodity futures and forward contracts may be in non-U.S. markets. Some non-U.S. markets present risks because they are not subject to the same degree of regulation as their U.S. counterparts. None of the SEC, CFTC, NFA, or any domestic exchange regulates activities of any foreign boards of trade or exchanges, including the execution, delivery and clearing of transactions, nor has the power to compel enforcement of the rules of a foreign board of trade or exchange or of any applicable non-U.S. laws. Similarly, the rights of market participants, such as the Fund, in the event of the insolvency or bankruptcy of a non-U.S. market or broker are also likely to be more limited than in the case of U.S. markets or brokers. As a result, in these markets, the Fund would have less legal and regulatory protection than it does when it invests domestically.
Investing through non-U.S. exchanges is subject to the risks presented by exchange controls, expropriation, increased tax burdens and exposure to local economic declines and political instability. An adverse development with respect to any of these variables could reduce the profit or increase the loss on investments of the Fund in the affected international markets.
The Fund’s non-U.S. investments may be exposed to losses resulting from non-U.S. exchanges that are less developed or less reliable than U.S. exchanges—Some non-U.S. commodity exchanges may be in a more developmental stage than U.S. exchanges, so that prior price histories may not be indicative of current price dynamics. In addition, the Fund may not have the same access to certain contracts on foreign exchanges as do local traders, and the historical market data on which the Commodity Sub-advisor bases its strategies may not be as reliable or accessible as it is in the U.S. All of these factors could adversely affect the performance of the Fund.
Regulatory and Operating Risks
The Fund is not a regulated investment company—Unlike other Nuveen-sponsored funds, the Fund is not a mutual fund, a closed-end fund, or any other type of investment company within the meaning of the 1940 Act. Accordingly, you do not have the protections afforded by that statute which, among other things, regulates the relationship between the investment company and its investment adviser and mandates certain authority to be held by the board of directors of an investment company.
The Fund’s operating history is limited—The Fund has a very brief operating history. Therefore, there is a limited performance history for the Fund to serve as a basis for you to evaluate an investment in the Fund.
Manager and Commodity Sub-advisor experience—Prior to the initial public offering of the Fund, the Manager had not previously operated a commodity pool or selected a commodity trading advisor. While the Commodity Sub-advisor has previously managed assets pursuant to TAP®, it had never employed TAP PLUSSM when managing assets for clients prior to the Fund’s initial public offering. Neither the Manager nor any of its trading principals has previously operated any other pools or traded any other accounts.
Conflicts of interest could adversely affect the Fund—There are conflicts of interest in the structure and operation of the Fund. The Manager has sole authority to manage the Fund, and its interests may conflict with those of Fund shareholders. For example, the Manager’s fees are based on the Fund’s net assets, which could provide an incentive for the Manager to reduce or suspend distributions by the Fund. In addition, the Collateral Sub-advisor and Commodity Sub-advisor are affiliates of the Manager. Each Sub-advisor may encounter conflicts between the interests of the Fund and its other clients. Further, a conflict of interest may also arise when the Commodity Sub-advisor approaches or reaches position limits with respect to futures positions established for the benefit of the Fund and fails to allocate limited contracts available among other accounts it manages or, alternatively, liquidates positions held by other accounts in a disproportionate manner. Although the Fund, the
15
Table of Contents
Manager, and the Sub-advisors have not established formal procedures to resolve potential conflicts of interest related to managing the investments and operations of the Fund, the Manager and the Sub-advisors have adopted codes of ethics in recognition of their fiduciary obligations to clients, including the Fund, and in accordance with applicable securities and commodities laws and regulations. Each of the Manager and the Sub-advisors resolve conflicts of interest as they arise based on its judgment and analysis of the particular issue and consistent with its code of ethics. Nonetheless, the Manager and/or the Sub-advisors could resolve a potential conflict in a manner that is not in the best interest of the Fund or its shareholders.
Departure of key personnel could adversely affect the Fund—In managing and directing the Fund’s day-to-day activities and affairs, the Manager relies heavily on Gresham and in particular on Jonathan S. Spencer, Douglas J. Hepworth and Dr. Henry G. Jarecki. If those individuals were to leave or be unable to carry out their present responsibilities, it may have an adverse effect on the Fund’s management. In addition, should market conditions deteriorate or for other reasons, Nuveen, NCAM, the Collateral Sub-advisor and the Commodity Sub-advisor may need to implement cost reductions in the future which could make the retention of qualified and experienced personnel more difficult and could lead to personnel turnover.
Reliance on affiliates of Nuveen—The Fund is dependent upon services and resources provided by its Manager and Collateral Sub-advisor and their parent Nuveen. Nuveen has a substantial amount of indebtedness. Nuveen, through its own business or the financial support of its affiliates, may not be able to generate sufficient cash flow from operations or ensure that future borrowings will be available in an amount sufficient to enable it to pay its indebtedness, with scheduled maturities beginning in 2014, or to fund its other liquidity needs. Nuveen’s failure to satisfy the terms of its indebtedness, including covenants therein, may generally have an adverse effect on the financial condition of Nuveen.
Shareholders have limited voting rights, and the individual trustees have limited duties and powers, and neither will be able to affect management of the Fund regardless of performance—Unlike the holder of capital stock in an investment company, Fund shareholders have limited voting rights or other means to control or affect the Fund’s business. In addition, the powers and duties of the individual trustees are very limited with respect to the Fund. The individual trustees’ sole powers are (i) to terminate for cause the Manager of the Fund (which, under the Trust Agreement, will automatically cause the Fund to terminate and be liquidated if at the time there is not a remaining manager and shareholders have not voted to elect a replacement manager), and (ii) to serve as the audit committee and nominating committee of the Fund. The individual trustees of the Fund, unlike the board of directors of an investment company, do not have the power to cause the Fund to change its investment objective or policies, effect changes to operations, approve the advisory fees of the Manager or replace the Manager or Sub-advisors. Rather, the power to determine the Fund’s policies and direct its operations is conferred on the Manager. Thus, Fund shareholders do not benefit from the protection of their interests afforded to registered investment companies under the 1940 Act through the existence of an independent board of directors with extensive powers to control the operations of the company. Therefore, the shareholders to a large extent are dependent on the abilities, judgment and good faith of the Manager in exercising its wide-ranging powers over the Fund, limited solely by the implied covenant of good faith and fair dealing applicable to the Manager in its relations with the Fund and its shareholders. If the Manager voluntarily withdraws or is removed by a vote of shareholders and shareholders have not voted to elect a replacement manager, the Fund will terminate and will liquidate its assets pursuant to the Trust Agreement.
The Manager may not be removed as manager by Fund shareholders except upon approval by the affirmative vote of the holders of over 50% of the outstanding shares (excluding shares owned by the Manager and its affiliates), subject to the satisfaction of certain conditions. Any removal of the Manager by Fund shareholders or by the individual trustees (upon 60 days written notice and under certain limited circumstances) will result in the liquidation of the Fund if at the time there is not a remaining manager unless a successor manager is appointed as provided in the Trust Agreement.
Thus, it is extremely unlikely that Fund shareholders will be able to make any changes in the management of the Fund, even if performance is poor.
16
Table of Contents
Fees and expenses are charged regardless of profitability and may result in depletion of assets—Regardless of its investment performance the Fund pays brokerage commissions, over-the-counter dealer spreads, management fees and operating and extraordinary expenses. A management fee will be paid by the Fund even if the Fund experiences a net loss for the year. Consequently, the expenses of the Fund could, over time, result in significant losses to your investment including the loss of all of your investment. You may not achieve profits, significant or otherwise.
The value of the shares may be adversely affected if the Fund is required to indemnify the individual trustees or the Manager—Under the Trust Agreement, each of the individual trustees and the Manager has the right to be indemnified for any liability or expense it incurs absent actual fraud or willful misconduct. That means that the Manager may require the assets of the Fund to be sold in order to cover losses or liability suffered by it or by the individual trustees. Any sale of that kind would reduce the net asset value of the Fund and the value of the shares.
The failure or bankruptcy of one of its clearing brokers could result in a substantial loss of Fund assets—Under CFTC regulations, a clearing broker maintains customers’ assets in a bulk segregated account. If a clearing broker fails to do so, or is unable to satisfy a substantial deficit in a customer account, its other customers may be subject to risk of loss of their funds in the event of that clearing broker’s bankruptcy (as recently experienced with respect to MF Global). In that event, the clearing broker’s customers, such as the Fund, are entitled to recover, even in respect of property specifically traceable to them, only a proportional share of all property available for distribution to all of that clearing broker’s customers. The Fund also may be subject to the risk of the failure of, or delay in performance by, any exchanges and their clearing organizations, if any, on which commodity interest contracts are traded.
The clearing brokers may be subject to legal or regulatory proceedings in the ordinary course of their business. A clearing broker’s involvement in costly or time-consuming legal proceedings may divert financial resources or personnel away from the clearing broker’s trading operations, which could impair the clearing broker’s ability to successfully execute and clear the Fund’s trades.
An investment in the shares may be adversely affected by competition from other methods of investing in commodities—The Fund constitutes a new, and thus untested, type of investment methodology. It competes with other financial vehicles, including other commodity pools, hedge funds, traditional debt and equity securities issued by companies in the commodities industry, other securities backed by or linked to such commodities, and direct investments in the underlying commodities or commodity futures contracts. Market and financial conditions, and other conditions beyond the Manager’s or Commodity Sub-advisor’s control, may make it more attractive to invest in other financial vehicles or to invest in such commodities directly, which could limit the market for the shares.
The commodity markets have volatility risk—The commodity markets have experienced periods of extreme volatility. General market uncertainty and consequent repricing risk have led to market imbalances of sellers and buyers, which in turn have resulted in significant reductions in values of a variety of commodities. Similar future market conditions may result in rapid and substantial valuation increases or decreases in the Fund’s holdings. In addition, volatility in the commodity and securities markets may directly and adversely affect the setting of distribution rates on the Fund’s shares.
The Fund has not been subject to independent review or review on your behalf—Shareholders do not have legal counsel representing them in connection with the Fund. Accordingly, a shareholder should consult its legal, tax and financial advisers regarding the desirability of investing in the Fund. As previously noted, you cannot predict the expected results of this Fund from the performance history of other accounts managed by the Commodity Sub-advisor.
Deregistration of the Manager or Sub-advisors could disrupt operations—The Manager and the Commodity Sub-advisor are registered commodity pool operators and registered commodity trading advisors. If the CFTC were to terminate, suspend, revoke or not renew the Manager’s registrations, the Manager would be compelled to
17
Table of Contents
withdraw as the Fund’s Manager. The shareholders would then determine whether to select a replacement manager or to dissolve the Fund. If the CFTC and/or the SEC were to terminate, suspend, revoke or not renew either of the Sub-advisor’s registrations, the Manager would terminate the management agreement with that sub-advisor. The Manager could choose to appoint a new sub-advisor or terminate the Fund. No action is currently pending or threatened against the Manager, the Commodity Sub-advisor or the Collateral Sub-advisor.
The Fund’s distribution policy may change at any time—Distributions paid by the Fund to its shareholders are derived from the current income and gains from the Fund’s portfolio investments and the options strategy, but to the extent such current income and gains are not sufficient to pay distributions, the Fund’s distributions may represent a return of capital. The total return generated by the Fund’s investments can vary widely over the short term and long term and the Fund may liquidate investments in order to make distributions. The timing and terms of any such liquidation could be disadvantageous to the Fund. The Fund reserves the right to change its distribution policy and the basis for establishing the rate of its monthly distributions, or may temporarily suspend or reduce distributions without a change in policy, at any time and may do so without prior notice to shareholders.
New regulatory developments may increase competition from other exchange-traded commodity funds that could limit the market for, and reduce the liquidity of, the shares—The CFTC recently adopted rules that, subject to certain conditions, permit the manager (commodity pool operator) of an exchange-traded commodity fund to claim relief from certain requirements relating to the delivery and acknowledgment of commodity pool disclosure documents, delivery of monthly account statements, and the requirement to keep the Fund’s books and records at the commodity pool operator’s main business office. In addition, those rules exempt the independent directors and trustees of an actively managed, exchange-traded commodity pool from having to register as commodity pool operators in their own right, where those persons are required to serve as such only for purposes of composing an audit or other committee under the Sarbanes-Oxley Act of 2002 and exchange listing requirements. These rules may increase the attractiveness of forming exchange-traded commodity funds similar to the Fund, relative to other investment vehicles, including hedge funds, other commodity pools, traditional debt and equity securities issued by companies in the commodities industry and securities backed by or linked to commodities. An increase in the number of such funds facilitated by the new rules could limit the market for, and reduce the liquidity of, the shares and/or make it more difficult for the Fund to implement its investment strategy.
Tax Risk
Your tax liability may exceed cash distributions—You will be taxed on your share of the Fund’s taxable income and gain each year, regardless of whether you receive any cash distributions from the Fund. Your share of such income or gain, as well as the tax liability generated by such income or gain, may exceed the distributions you receive from the Fund for the year.
You could owe tax on your share of the Fund’s ordinary income despite overall losses—Gain or loss on futures and forward contracts and options on futures and forward contracts will generally be taxed as capital gains or losses for U.S. federal income tax purposes. Interest income is ordinary income. In the case of an individual, capital losses can only be used to offset capital gains plus $3,000 ($1,500 in the case of a married taxpayer filing a separate return) of ordinary income each year. Therefore, you may be required to pay tax on your allocable share of the Fund’s ordinary income, even though the Fund incurs overall losses.
Certain Fund expenses may be treated as miscellaneous itemized deductions rather than as deductible ordinary and necessary business expenses—Certain expenses incurred by the Fund may be treated as miscellaneous itemized deductions for federal income tax purposes, rather than as deductible ordinary and necessary business expenses, with the result that shareholders who are individuals, trusts, or estates may be subject to limitations on the deductibility of their allocable share of such expenses.
18
Table of Contents
Tax-exempt investors may recognize unrelated business taxable income with respect to their investment in the Fund—Persons that are otherwise exempt from federal tax may be allocated unrelated business taxable income as a result of their investment in the Fund. In particular, for charitable remainder trusts, investment in the Fund may not be appropriate.
Non-U.S. investors may face U.S. tax consequences—Non-U.S. investors should consult their own tax advisors concerning the applicable foreign as well as the U.S. tax implications of an investment in the Fund. Non-U.S. investors may also be subject to special withholding tax provisions if they fail to furnish the Fund (or another appropriate person) with a timely and properly completed Form W-8BEN or other applicable form.
Changes in the Fund’s tax treatment could adversely affect distributions to shareholders—Based upon the continued accuracy of the representations of the Manager, the Fund believes that under current law and regulations it will be taxed as a partnership that is not subject to corporate income tax for federal income tax purposes. However, the Fund has not requested, nor will it request, any ruling from the Internal Revenue Service (“IRS”) as to this status. In addition, you cannot be sure that those representations will continue to be accurate. If the IRS were to challenge the federal income tax status of the Fund, such a challenge could result in (i) an audit of each shareholder’s entire tax return and (ii) adjustments to items on that return that are unrelated to the ownership of shares. In addition, each shareholder would bear the cost of any expenses incurred in connection with an examination of its personal tax return.
In addition, the Fund generally could be impacted adversely by proposed changes and future changes in tax laws or tax administration, including changes that might treat publicly traded partnerships like the Fund as taxable corporations.
If for any reason the Fund were taxable as a corporation for federal income tax purposes in any taxable year, its income, gains, losses and deductions would be reflected on its own tax return rather than being passed through (proportionately) to shareholders. Its net income would be subject to taxation, reducing cash available for distributions and resulting in distributions being treated as dividends to the extent of current or accumulated earnings and profits. Such a tax reclassification could materially reduce the overall performance and after-tax returns of the Fund, possibly causing a decline in the price of the Fund shares.
Items of income, gain, deduction, loss and credit with respect to Fund shares could be reallocated if the IRS does not accept the conventions used by the Fund in allocating Fund tax items—U.S. federal income tax rules applicable to partnerships are complex and often difficult to apply to widely held partnerships. The Fund will apply certain conventions in an attempt to comply with applicable rules and to report income, gain, deduction, loss and credit to Fund shareholders in a manner that reflects shareholders’ share of Fund items, but these conventions may not be in full technical compliance with applicable tax requirements. It is possible that the IRS will successfully assert that the conventions used by the Fund to allocate income to the shareholders do not satisfy the technical requirements of the U.S. tax law and could require that items of income, gain, deduction, loss or credit be reallocated in a manner that adversely affects you.
Tax rates and other features under current U.S. federal income tax law may be adversely affected in the future—Under current law, long-term capital gains and ordinary income are taxed to non-corporate investors at maximum U.S. federal income tax rates of 15% and 35%, respectively, through December 31, 2012. Absent further legislation, after December 31, 2012, the tax rate on non-corporate investors’ long-term capital gains will increase to 20% and the maximum tax rate for non-corporate investors’ ordinary income will increase to 39.6%. The tax treatment of the Fund or its shareholders under other provisions of the tax law can be adversely affected by future legislation at any time.
Increased Oversight of Foreign Financial Assets—Under the Foreign Account Tax Compliance Act (“FATCA”) enacted in 2010, foreign financial institutions and non-financial foreign entities and certain U.S. taxpayers holding foreign financial assets will be subject to an enhanced reporting, disclosure, certification,
19
Table of Contents
withholding, and enforcement regime. Among other things, foreign financial institutions will be required to enter into disclosure compliance agreements with the U.S. Treasury by June 30, 2013, and non-financial foreign entities will be required to certify their ownership. The general effective date of FATCA is January 1, 2014. Investors should consult their tax advisors concerning the potential impact of FATCA on them.
Investors will receive a Schedule K-1 and as a result may incur additional costs—Investors in the Fund receive a Schedule K-1 reporting their allocable portion of the tax items of the Fund. This form is expected to be available by the first week of March following the taxable year it relates to. If there were a delay in making Schedule K-1’s available, it could be more difficult for investors to complete their tax returns in a timely fashion. Investors who seek advice from tax advisors with respect to their Schedule K-1 may incur additional costs in the form of fees.
Shareholders are strongly urged to consult their own tax advisors and counsel with respect to the possible tax consequences to them of an investment in the shares. The tax consequences may differ in respect of different shareholders.
Item 1B. Unresolved Staff Comments
None.
Not applicable.
None.
Item 4. Mine Safety Disclosures
Not applicable.
20
Table of Contents
PART II
Item 5. Market for Registrant’s Common Equity, Related Stockholder Matters and Issuer Purchases of Equity Securities
a) On September 27, 2010, the shares of the Fund began trading on the NYSE Amex under the ticker symbol “CFD.”
The following table sets forth, for the calendar quarters indicated, the high and low intra-day market prices per share.
| Share Price | ||||||||
| Quarter Ended |
High | Low | ||||||
| December 31, 2011 |
$ | 23.46 | $ | 18.59 | ||||
| September 30, 2011 |
$ | 27.39 | $ | 20.41 | ||||
| June 30, 2011 |
$ | 29.40 | $ | 24.55 | ||||
| March 31, 2011 |
$ | 28.90 | $ | 25.16 | ||||
| December 31, 2010 |
$ | 28.00 | $ | 22.54 | ||||
| September 30, 2010* |
$ | 25.13 | $ | 24.85 | ||||
| * | This period covers the time from the Fund’s commencement of operations (September 27, 2010) to the end of the quarter. |
The Fund’s shares will likely trade at a market price that is different from the daily computed net asset value of a share of the Fund. This is due, in large part, to the fact that supply and demand forces at work in the secondary trading market for shares of the Fund, which may be related to, but not identical to, the forces influencing the prices of the commodity futures and forward contracts and other instruments held by the Fund that affect the net asset value of the Fund’s shares. When the Fund’s shares are trading on the NYSE Amex at a price above the net asset value, the shares are referred to as trading at a “premium,” and conversely when the Fund’s shares are trading on the exchange at a price below the net asset value, the shares are referred to as trading at a “discount.” The following table sets forth, for the calendar quarters indicated, the high and low end of day premium and/or discount, as applicable.
| Quarter Ended |
High | Low | ||
| December 31, 2011 |
(4.42%) | (17.60%) | ||
| September 30, 2011 |
1.65% | (11.31%) | ||
| June 30, 2011 |
3.02% | (3.40%) | ||
| March 31, 2011 |
3.65% | (4.05%) | ||
| December 31, 2010 |
5.42% | (4.82%) | ||
| September 30, 2010* |
5.37% | 4.71% |
| * | This period covers the time from the Fund’s commencement of operations (September 27, 2010) to the end of the quarter. |
As of December 31, 2011, the Fund had approximately 9,200 shareholders.
21
Table of Contents
The following graph presents the relationship between the Fund’s net asset value per share and its market price per share during the period September 27, 2010 through December 31, 2011.
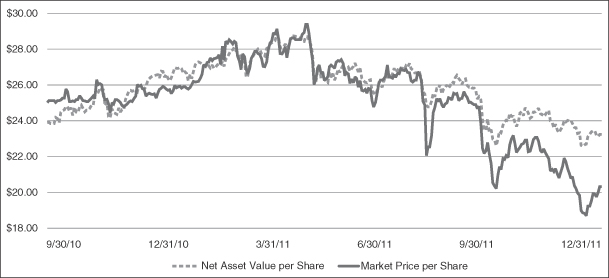
During the fiscal years ended December 31, 2011 and December 31, 2010, the Fund declared distributions per share as set forth in the following table:
| Ex Date |
Record Date | Payable Date | Amount | |||||
| December 27, 2011 |
December 29, 2011 | December 30, 2011 | $ | 0.145 | ||||
| November 28, 2011 |
November 30, 2011 | December 1, 2011 | $ | 0.145 | ||||
| October 27, 2011 |
October 31, 2011 | November 1, 2011 | $ | 0.145 | ||||
| September 28, 2011 |
September 30, 2011 | October 3, 2011 | $ | 0.145 | ||||
| August 29, 2011 |
August 31, 2011 | September 1, 2011 | $ | 0.145 | ||||
| July 27, 2011 |
July 29, 2011 | August 1, 2011 | $ | 0.145 | ||||
| June 28, 2011 |
June 30, 2011 | July 1, 2011 | $ | 0.145 | ||||
| May 26, 2011 |
May 31, 2011 | June 1, 2011 | $ | 0.145 | ||||
| April 27, 2011 |
April 29, 2011 | May 2, 2011 | $ | 0.145 | ||||
| March 29, 2011 |
March 31, 2011 | April 1, 2011 | $ | 0.145 | ||||
| February 24, 2011 |
February 28, 2011 | March 1, 2011 | $ | 0.145 | ||||
| January 27, 2011 |
January 31, 2011 | February 1, 2011 | $ | 0.145 | ||||
| December 28, 2010 |
December 30, 2010 | December 31, 2010 | $ | 0.145 | ||||
| November 26, 2010 |
November 30, 2010 | December 1, 2010 | $ | 0.145 | ||||
| October 27, 2010 |
October 31, 2010 | November 1, 2010 | $ | 0.145 | ||||
The Fund intends to make regular monthly distributions to its shareholders based on the past and projected performance of the Fund. Among other factors, the Fund seeks to establish a distribution rate that roughly corresponds to the Manager’s projections of the total return that could reasonably be expected to be generated by the Fund over an extended period of time. As market conditions and portfolio performance may change, the rate of distributions on the shares and the Fund’s distribution policy could change.
b) Since the Fund’s initial public offering, as detailed on the Fund’s registration statement on Form S-1 (No.333-130360), which was declared effective on September 27, 2010, no new share offerings have taken place. Proceeds from the Fund’s initial public offering (including the shares sold upon exercise of the over-allotment option) were invested in short-term, high-grade debt securities which serve as collateral for the Fund’s investments in commodity futures and forward contracts and options on commodity futures and forward contracts, in accordance with the Fund’s investment objectives.
22
Table of Contents
On April 15, 2011, the Fund filed a Registration Statement on Form S-1with the SEC to register additional shares of the Fund for future issuance. On June 8, 2011, the Fund filed Pre-Effective Amendment No. 1 to Form S-1 with the SEC. The Fund has not yet determined the size or timing of any potential future offering.
c) On December 21, 2011 the Fund announced the approval of an open-market share repurchase program, where the Fund was authorized to repurchase an aggregate of up to 10% of its outstanding common shares (approximately 920,000 shares) in open-market transactions. Transactions in share repurchases were as set forth in the following table:
| Period |
Total Number of Shares Repurchased |
Weighted Average Price per Share Repurchased |
Maximum Number of Shares that may yet be Repurchased |
|||||||||
| 12/21/11 to 12/31/11 |
38,000 | $ | 19.68 | Approximately 882,000 | ||||||||
No shares have been repurchased outside of the program described above.
Item 6. Selected Financial Data
The following table sets forth selected financial data for the Fund. The selected financial data as of and for the fiscal years ended December 31, 2011, 2010, 2009 and 2008 have been derived from the audited financial statements. The table also presents selected financial data for the quarters within the last two fiscal years. The selected financial data as of and for the fiscal year ended December 31, 2007, as well as the quarterly financial data presented, has been derived from unaudited financial data which, in the opinion of management, presents fairly, in all material respects, the financial position of the Fund. Prior to the Fund’s initial public offering on September 27, 2010, the Fund had no operations other than those related to organizational matters. The selected financial data presented herein should be read in conjunction with the Fund’s financial statements, including the notes thereto, which are included in this Annual Report.
| December 31, 2011 |
December 31, 2010 |
December 31, 2009 |
December 31, 2008 |
December 31, 2007 (unaudited) |
||||||||||||||||
| Total assets |
$ | 220,582,524 | $ | 251,985,626 | $ | 956,000 | $ | 859,000 | $ | 836,000 | ||||||||||
| Total liabilities |
$ | 6,402,395 | $ | 4,227,878 | $ | 956,000 | $ | 859,000 | $ | 836,000 | ||||||||||
| Net assets |
$ | 214,180,129 | $ | 247,757,748 | $ | - | $ | - | $ | - | ||||||||||
| Net increase (decrease) in cash |
$ | (16 | ) | $ | 16 | $ | - | $ | - | $ | - | |||||||||
| Shares outstanding |
9,229,040 | 9,267,040 | - | - | - | |||||||||||||||
| Net asset value per share outstanding |
$ | 23.21 | $ | 26.74 | $ | - | $ | - | $ | - | ||||||||||
| Total distributions per share |
$ | 1.7400 | $ | 0.4350 | $ | - | $ | - | $ | - | ||||||||||
| Total investment income |
$ | 309,181 | $ | 80,235 | $ | - | $ | - | $ | - | ||||||||||
| Net investment income (loss) |
$ | (3,612,955 | ) | $ | (1,185,458 | ) | $ | - | $ | - | $ | - | ||||||||
| Net realized gain (loss) and change in net unrealized appreciation (depreciation) |
$ | (13,093,466 | ) | $ | 32,187,099 | $ | - | $ | - | $ | - | |||||||||
| Net income (loss) |
$ | (16,706,421 | ) | $ | 31,001,641 | $ | - | $ | - | $ | - | |||||||||
| Net income (loss) per weighted-average share |
$ | (1.80 | ) | $ | 3.43 | $ | - | $ | - | $ | - | |||||||||
23
Table of Contents
Selected Quarterly Financial Data (Unaudited)
| For the Three Months Ended March 31, 2011 |
For the Three Months Ended June 30, 2011 |
For the Three Months Ended September 30, 2011 |
For the Three Months Ended December 31, 2011 |
|||||||||||||
| Total investment income |
$ | 110,343 | $ | 73,513 | $ | 60,406 | $ | 64,919 | ||||||||
| Net investment income (loss) |
$ | (893,397) | $ | (931,243) | $ | (974,722) | $ | (813,593) | ||||||||
| Net realized gain (loss) and change in net unrealized appreciation (depreciation) |
$ | 16,794,070 | $ | (13,994,970) | $ | (22,936,840) | $ | 7,044,274 | ||||||||
| Net income (loss) |
$ | 15,900,673 | $ | (14,926,213) | $ | (23,911,562) | $ | 6,230,681 | ||||||||
| Increase (decrease) in net asset value |
$ | 11,869,510 | $ | (18,957,376) | $ | (27,942,725) | $ | 1,452,972 | ||||||||
| Net income (loss) per weighted average share |
$ | 1.72 | $ | (1.61) | $ | (2.58) | $ | 0.67 | ||||||||
| For the Three Months Ended March 31, 2010 |
For the Three Months Ended June 30, 2010 |
For the Three Months Ended September 30, 2010 |
For the Three Months Ended December 31, 2010 |
|||||||||||||
| Total investment income |
$ | - | $ | - | $ | - | $ | 80,235 | ||||||||
| Net investment income (loss) |
$ | - | $ | - | $ | (16,549) | $ | (1,168,909) | ||||||||
| Net realized gain (loss) and change in net unrealized appreciation (depreciation) |
$ | - | $ | - | $ | - | $ | 32,187,099 | ||||||||
| Net income (loss) |
$ | - | $ | - | $ | (16,549) | $ | 31,018,190 | ||||||||
| Increase (decrease) in net asset value |
$ | - | $ | 20,055 | $ | 203,687,201 | $ | 44,070,547 | ||||||||
| Net income (loss) per weighted average share |
N/A | (2) | $ | - | $ | - | (1) | $ | 3.42 | |||||||
| (1) | Rounds to zero per share. |
| (2) | Not applicable; there were no shares outstanding during the period. |
Item 7. Management’s Discussion and Analysis of Financial Condition and Results of Operations
This information should be read in conjunction with the financial statements and notes included in this Annual Report. The discussion and analysis includes forward-looking statements that generally relate to future events or future performance. In some cases, you can identify forward-looking statements by terminology such as “may,” “will,” “should,” “expect,” “plan,” “anticipate,” “believe,” “estimate,” “predict,” “potential” or the negative of these terms or other comparable terminology. These forward-looking statements are based on information currently available to the Manager, Gresham and the Collateral Sub-advisor and are subject to a number of risks, uncertainties and other factors, both known (such as those described in “Item 1A. Risk Factors” and elsewhere in this Annual Report) and unknown, that could cause the actual results, performance, prospects or opportunities of the Fund to differ materially from those expressed in, or implied by, these forward-looking statements.
You should not place undue reliance on any forward-looking statements. Except as expressly required by the federal securities laws or otherwise, the Fund and the Manager undertake no obligation to publicly update or revise any forward-looking statements or the risks, uncertainties or other factors described in this Annual Report, as a result of new information, future events or changed circumstances or for any other reason after the date of this Annual Report.
24
Table of Contents
Introduction
The Fund is a commodity pool which was organized as a Delaware statutory trust on December 7, 2005 and completed its initial public offering on September 30, 2010. Prior to the initial public offering, the Fund was inactive except for matters relating to its organization and registration. The Fund’s investment objective is to generate higher risk-adjusted total return than leading commodity market benchmarks, specifically the DJ-UBSCI and the GSCI indexes, and passively managed commodity funds. In pursuing its investment objective, the Fund invests directly in a diversified portfolio of commodity futures and forward contracts to obtain broad exposure to all principal groups in the global commodity markets. The Fund is unleveraged, and the Fund’s commodity contract positions are fully collateralized with cash equivalents and short-term, high grade debt securities. The Fund also writes commodity call options seeking to enhance the Fund’s risk-adjusted total return. The Manager focuses on the DJ-UBSCI when evaluating the commodity futures, forwards, and options positions (the commodity portfolio) in the Fund’s portfolio.
During the fiscal year ended December 31, 2010, the Fund completed its initial public offering, and its shares trade on the NYSE Amex. Since the Fund’s initial public offering the Fund has used the proceeds from its share issuance as collateral, with the balance that is not maintained at BCI as initial and variation margin invested in short-term, high grade debt securities. The collateral supports various investments in futures contracts and call options on futures contracts in accordance with the Fund’s investment objectives.
Results of Operations
The Year Ended December 31, 2011 – Fund Share Price
The Fund’s shares traded on the NYSE Amex at a price of $20.30 on the close of business on December 31, 2011. This represents a decrease of 21.32% in share price (not including the effect of distributions) from the $25.80 price at which the shares of the Fund traded on the close of business on December 31, 2010. The high and low intra-day share prices for the year were $29.40 (April 29) and $18.59 (December 19), respectively. During the year, the Fund paid distributions totaling $1.740 per share to shareholders. The total return on market value for the Fund, including distributions for the period, was -15.59%. At December 31, 2011, the shares of the Fund traded at a 12.54% discount to the Fund’s net asset value of $23.21.
The Year Ended December 31, 2011 – Net Assets of the Fund
The Fund’s net assets decreased from $247.8 million at December 31, 2010, to $214.2 million at December 31, 2011, a decrease of $33.6 million. The decrease in the Fund’s net assets was due to $7.9 million in net realized gains and $21.0 million in net unrealized depreciation on the Fund’s commodity portfolio during the year, a net investment loss of $3.6 million, $16.1 million of distributions declared to shareholders, and $0.8 million decrease in net assets due to share repurchases.
The Fund’s commodity and options portfolio finished 2011 on a positive note gaining 3.3% in the fourth quarter before considering the expenses of the Fund. The overall commodities market, as measured by the DJ-UBSCI, gained 0.3% during the fourth quarter, and the GSCI, which has greater energy-related exposure than the DJ-UBSCI (71% versus 34%, respectively), gained 9.0% over the quarter. The Fund’s commodity and options portfolio finished the full calendar year 2011 down 6.1% before considering expenses of the Fund, while its benchmarks, the DJ-UBSCI finished down 13.3% and the GSCI lost 1.2%. Commodity markets were relatively volatile during the majority of 2011, with issues such as the European sovereign debt crisis and unrest in the Middle East remaining unresolved and affecting the market’s expectations for global growth.
Individual commodity markets were mixed in 2011 with three of the six principal commodity groups in the Fund’s commodity portfolio finishing higher. Livestock led the way with an increase of more than 2%, while the energy and the precious metals groups each finished approximately 1% higher. These groups were led by
25
Table of Contents
unleaded gas (RBOB), gold, and feeder cattle sub-groups, which gained approximately 16%, 11%, and 7% respectively. The three groups that declined in 2011 were industrial metals, which decreased approximately 20% as each individual commodity within the sector posted negative returns, agriculture, which decreased approximately 13%, and foods & fibers, which declined approximately 9% over the year. At the sub-group level, the significant detractors were natural gas, cocoa, wheat, and zinc, which declined approximately 38%, 32%, 25%, and 23% respectively.
The Fund’s portfolio outperformed the DJ-UBSCI by approximately 7.2% for the year, before considering the expenses of the Fund. This resulted from the Fund’s commodity weighting differences versus the DJ-UBSCI and the trading strategy employed. Five of the six commodity groups in which the Fund trades outperformed the benchmark, led by the portfolio’s holdings in the energy group, which outperformed the DJ-UBSCI mainly because of the underweight in natural gas, along with the overweight in crude oil, when compared to the index. The Fund’s investments in the agriculture group also significantly outperformed the DJ-UBSCI, as the Fund’s smaller allocations to soybeans and wheat, along with the selection of specific wheat contracts, contributed to the positive relative returns. The Fund’s livestock, industrial metals, and foods & fibers groups also outperformed the DJ-UBSCI for the year. The precious metals group was the sole detractor from relative performance mostly due to the inclusion of platinum and palladium in the Fund’s portfolio. Contracts in these metals, which declined in value during 2011, are not part of the DJ-UBSCI.
The commodity call option component of the Fund’s portfolio was generally successful over the period as it served to limit volatility without significant impact on the commodity futures contracts. The Commodity Sub-advisor utilizes a quantitatively driven strategy to set the call option strike prices it writes (sells) at various levels out-of-the money. Typically, the more out-of-the-money a written call option strike price is, the more upside potential remains, though this is balanced by less premium received for selling the options. During the year, several of the commodity portfolio’s call options expired without being exercised. This allowed the Fund to earn the call option premium offsetting some of the Fund’s losses without sacrificing any appreciation depending on the contract and time period, which benefited the Fund’s performance. In certain cases during the year, including during the fourth quarter where the futures price appreciation was significant (for example West Texas Intermediate (WTI) crude oil futures), the options the Fund wrote were exercised, which limited the Fund’s full participation in that commodity contract’s gains. In November, while WTI crude oil futures prices rose almost 8%, the commodity portfolio’s futures and options performance was up approximately 6% over the same period, reflecting the impact of the forgone futures contract appreciation due to the option contracts being in-the-money.
During the year ended December 31, 2011, the Fund’s collateral investments generated interest income of $309,181.
The net asset value per share on December 31, 2011, was $23.21. This represents a decrease of 13.20% in net asset value (not including the effect of distributions) from the $26.74 net asset value per share as of December 31, 2010. The Fund paid distributions totaling $1.740 per share to shareholders during the year. When these distributions are taken into account, the total return for the Fund on net asset value was -7.16% for the year ended December 31, 2011.
The Fund generated a net loss of $16.7 million for the year ended December 31, 2011, resulting from interest income of $0.3 million, net expenses of $3.9 million, net realized gains of $7.9 million, and net unrealized depreciation of $21.0 million.
The Year Ended December 31, 2010 – Fund Share Price
The Fund’s shares were initially offered on September 27, 2010, at a price of $25.00 per share. Since the initial offering, the NYSE Amex exchange share price increased 3.20% (not including the effect of distributions) to $25.80 at December 31, 2010. The high and low share prices for the year were $28.00 (October 13) and $22.54 (October 1), respectively. During the year, the Fund paid distributions totaling $0.435 per share to shareholders. The cumulative total return on market value for the Fund, including the distributions paid during the period, was 4.99%. At December 31, 2010, the shares of the Fund traded at a 3.52% discount to the Fund’s net asset value.
26
Table of Contents
The Year Ended December 31, 2010 – Net Assets of the Fund
The Fund’s net assets increased from zero at December 31, 2009, to $247.8 million at December 31, 2010. The increase in the Fund’s net assets was primarily due to the initial public offering of the Fund on September 27, 2010, which generated net proceeds of $203.7 million, the exercise of an option granted by the Fund to the underwriters of the Fund’s initial public offering to purchase additional shares of the Fund, which was exercised in October for 716,200 shares and generated net proceeds of $17.1 million after underwriting commissions and offering expenses, and the increase in value of the Fund’s futures and options portfolio (the commodity portfolio) which the Fund began trading on October 1, 2010.
The Fund’s commodity portfolio, which the Fund began trading on October 1, rose slightly more than 15% during the period before considering the expenses of the Fund. The overall commodities market, as measured by the DJ-UBSCI rose 15.8% and using the GSCI the market gained 13.4% over the period. Commodity market performance was driven in part by the continuing recovery of global economic growth and the expectation of rising inflation. In addition, global supply forces such as weather-related concerns including drought in Russia and floods in Australia combined with strong demand from emerging markets to increase commodity prices.
The Fund’s commodity portfolio performed well in this environment as it generated positive returns in all six principal commodity groups and all sub-groups in which it trades. Among the six principal commodity groups in which the Fund trades, foods and fibers, agriculture and precious metals led the commodity portfolio’s results and experienced an increase in value of approximately 28%, 26% and 13%, respectively. The remaining commodity groups, energy, industrial metals, and livestock, experienced increases of nearly 11%, over 11% and more than 5%, respectively. The commodity portfolio’s largest futures holding was crude oil, which represented about one-fifth of the futures and options portfolio at year end and generated a return of approximately 11.3% versus the DJ-UBSCI return of 9.7%. Crude oil, like gold and copper, continued to behave like a “risk asset,” performing well when equities performed well and poorly when U.S. Treasury securities performed well. With the anticipation of further quantitative easing building around the U.S. Federal Reserve’s November 3, 2010 meeting, investors continued to focus on assets tied to inflation and dollar weakness. Crude oil prices rose sharply at the end of October, with strong buying interest in the near term futures contracts coupled with producer hedging driving the demand for long-term futures contracts. Other areas of relative strength versus the DJ-UBSCI included soy bean meal, feeder cattle, platinum, cocoa, lead and palladium, all of which generated positive returns for the portfolio but are not represented in the index. Despite modest overweight positions in high-performing cotton and sugar, the commodity portfolio underperformed the DJ-UBSCI results in the foods and fibers group by about 10 percentage points or 28% versus 38% for the index over the period. This was largely due to the hedging impacts of the call options component which, while reducing the volatility of the portfolio, effectively limited the price appreciation otherwise experienced on the underlying futures contracts over and above call premiums received. The portfolio’s underweight holdings in strongly performing agricultural commodities, specifically corn, wheat and soybeans, also negatively impacted performance relative to the DJ-UBSCI.
During the year ended December 31, 2010, the Fund’s collateral investments generated interest income of $80,235.
The net asset value per share on September 27, 2010 was $23.88, which by the end of the year increased to $26.74, an increase of 12.00% before distributions. The Fund also paid total distributions of $0.435 per share to shareholders during the period. When these distributions are taken into account, the total cumulative return for the Fund on a net asset value basis was 13.92% for the period beginning on September 27, 2010, and ending on December 31, 2010.
The Fund generated net income for the year ended December 31, 2010, of $31.0 million, resulting from $80,235 of interest income, net realized gains of $15.2 million, change in net unrealized appreciation of $17.0 million and net expenses of $1.3 million.
27
Table of Contents
Fund Total Returns
The following table presents selected total returns for the Fund as of December 31, 2011. Total returns based on net asset value and market value are based on the change in net asset value and market value, respectively, for a share during the period presented. The total returns presented assume the reinvestment of distributions at net asset value on the distribution payment date for returns based on net asset value, and at market value on the distribution payment date for returns based on market value.
| Cumulative | Annualized | |||||||||||||||
| 1 Month | 3 Month | 1 Year | Since Inception | |||||||||||||
| Market Value |
-6.60 | % | 0.95 | % | -15.59 | % | -9.12 | % | ||||||||
| Net Asset Value |
-2.61 | % | 2.95 | % | -7.16 | % | 4.53 | % | ||||||||
“Since inception” returns present performance for the period since the Fund’s commencement of operations on September 27, 2010.
Returns represent past performance, which is no guarantee of future performance.
28
Table of Contents
Commodity Weightings
The table below presents the composition of the Fund’s TAP PLUSSM strategy and the DJ-UBSCI as of December 31, 2011 and January 31, 2012. The December 31, 2011 composition serves as a guide to how the composition of the Fund’s TAP PLUSSM investment strategy compared to that of the DJ-UBSCI, a leading commodity market benchmark. During the month of January 2012 Gresham made its annual determination for commodity weights for the TAP PLUSSM strategy. The January 31, 2012 composition is presented to illustrate the change in the commodity weightings as a result of the annual determination.
| December 31, 2011 | January 31, 2012 | |||||||||||||||||
| Commodity Group | Commodity | TAP PLUSSM | DJ-UBSCI | TAP PLUSSM | DJ-UBSCI | |||||||||||||
| Energy |
Crude Oil | 25.71 | % | 17.52 | % | 19.07 | % | 14.32 | % | |||||||||
| Heating Oil | 5.66 | % | 4.43 | % | 4.76 | % | 3.36 | % | ||||||||||
| Natural Gas | 2.79 | % | 8.33 | % | 5.87 | % | 9.25 | % | ||||||||||
| Unleaded Gas | 3.98 | % | 4.08 | % | 3.36 | % | 3.47 | % | ||||||||||
|
|
|
|
|
|||||||||||||||
| 38.14 | % | 34.36 | % | 33.06 | % | 30.40 | % | |||||||||||
|
|
|
|
|
|||||||||||||||
| Industrial Metals |
Aluminum | 4.82 | % | 4.40 | % | 5.23 | % | 6.33 | % | |||||||||
| Copper | 8.46 | % | 6.28 | % | 9.88 | % | 7.72 | % | ||||||||||
| Nickel | 1.68 | % | 1.78 | % | 1.82 | % | 2.87 | % | ||||||||||
| Zinc | 1.26 | % | 2.27 | % | 1.46 | % | 3.50 | % | ||||||||||
| Lead | 0.73 | % | 0.00 | % | 0.90 | % | 0.00 | % | ||||||||||
|
|
|
|
|
|||||||||||||||
| 16.95 | % | 14.73 | % | 19.29 | % | 20.42 | % | |||||||||||
|
|
|
|
|
|||||||||||||||
| Agriculturals |
Corn | 4.65 | % | 7.92 | % | 4.53 | % | 6.42 | % | |||||||||
| Soybean | 4.39 | % | 7.31 | % | 4.60 | % | 6.88 | % | ||||||||||
| Wheat | 3.69 | % | 4.03 | % | 3.76 | % | 5.02 | % | ||||||||||
| Soybean Meal | 1.75 | % | 0.00 | % | 1.56 | % | 0.00 | % | ||||||||||
| Soybean Oil | 1.22 | % | 2.82 | % | 1.34 | % | 3.25 | % | ||||||||||
|
|
|
|
|
|||||||||||||||
| 15.70 | % | 22.08 | % | 15.79 | % | 21.57 | % | |||||||||||
|
|
|
|
|
|||||||||||||||
| Precious Metals |
Gold | 8.99 | % | 12.57 | % | 10.77 | % | 10.32 | % | |||||||||
| Silver | 2.67 | % | 3.30 | % | 3.71 | % | 3.18 | % | ||||||||||
| Platinum | 0.88 | % | 0.00 | % | 0.76 | % | 0.00 | % | ||||||||||
| Palladium | 0.40 | % | 0.00 | % | 0.44 | % | 0.00 | % | ||||||||||
|
|
|
|
|
|||||||||||||||
| 12.94 | % | 15.87 | % | 15.68 | % | 13.50 | % | |||||||||||
|
|
|
|
|
|||||||||||||||
| Foods and Fibers |
Cotton | 1.73 | % | 1.39 | % | 2.29 | % | 1.93 | % | |||||||||
| Sugar | 3.40 | % | 2.77 | % | 3.51 | % | 3.78 | % | ||||||||||
| Coffee | 2.09 | % | 2.43 | % | 2.62 | % | 2.46 | % | ||||||||||
| Cocoa | 0.78 | % | 0.00 | % | 0.62 | % | 0.00 | % | ||||||||||
|
|
|
|
|
|||||||||||||||
| 8.00 | % | 6.59 | % | 9.04 | % | 8.17 | % | |||||||||||
|
|
|
|
|
|||||||||||||||
| Livestock |
Live Cattle | 4.76 | % | 4.12 | % | 4.18 | % | 3.79 | % | |||||||||
| Lean Hogs | 2.26 | % | 2.25 | % | 2.04 | % | 2.15 | % | ||||||||||
| Feeder Cattle | 1.25 | % | 0.00 | % | 0.92 | % | 0.00 | % | ||||||||||
|
|
|
|
|
|||||||||||||||
| 8.27 | % | 6.37 | % | 7.14 | % | 5.94 | % | |||||||||||
|
|
|
|
|
|||||||||||||||
|
|
||||||||||||||||||
| Total |
100.00 | % | 100.00 | % | 100.00 | % | 100.00 | % | ||||||||||
|
|
||||||||||||||||||
29
Table of Contents
Liquidity and Capital Resources
The Fund pursues its investment objectives by taking long positions in commodity futures contracts pursuant to Gresham’s long-only rules-based investment strategy designed to maintain consistent, fully collateralized exposure to commodities as an asset class (Tangible Asset Program or TAP®) and its integrated program of writing commodity call options designed to enhance the risk-adjusted total return of the Fund’s commodity investments (collectively referred to as TAP PLUSSM). The Fund’s investment activities in futures contracts and writing commodity call options do not require a significant outlay of capital. The Fund does not intend to utilize leverage and its commodity contract positions are fully collateralized. Ordinary expenses and distributions are met by cash on hand, although distributions may at times consist of return of capital and may require that the Fund liquidate investments. The Fund earns interest on its continuing investments in short-term, high grade debt securities with any remaining cash balance on deposit with the custodian earning custody fee credits. The Fund also generates cash from the premiums it receives when writing call options on the Fund’s futures contracts.
The Fund’s investments in commodity futures contracts and options on commodity futures contracts may be subject to periods of illiquidity because of market conditions, regulatory considerations and other reasons. For example, commodity exchanges limit fluctuations in certain commodity futures contract prices during a single day by regulations referred to as “daily limits.” During a single day, no trades may be executed at prices beyond the daily limit. Once the price of a futures contract for a particular commodity has increased or decreased by an amount equal to the daily limit, positions in the futures contract can neither be taken nor liquidated unless the traders are willing to effect trades at or within the limit. Commodity futures prices have occasionally moved to the daily limit for several consecutive days with little or no trading. Such market conditions could prevent the Fund from promptly liquidating its commodity futures positions.
In regards to shareholder transactions, the Fund’s shares trade on the NYSE Amex and shares are not redeemed by the Fund in the normal course of business (although the Manager may decide to do so at its discretion), thereby alleviating the need for the Fund to have liquidity available for possible shareholder redemptions. On April 15, 2011, the Fund filed a Registration Statement on Form S-1 with the SEC to register additional shares of the Fund for future issuance. On June 8, 2011, the Fund filed Pre-Effective Amendment No. 1 to Form S-1 with the SEC. The Fund has not yet determined the size or timing of any potential future offering. On December 21, 2011 the Fund announced the approval of an open-market share repurchase program, where the Fund was authorized to repurchase an aggregate of up to 10% of its outstanding common shares in open-market transactions. Refer to “Item 5. Market for Registrant’s Common Equity, Related Stockholder Matters and Issuer Purchases of Equity Securities” in this Annual Report for details of repurchase activity during the fiscal year.
The Fund is unaware of any other trends, demands, conditions or events that are reasonably likely to result in material changes to the Fund’s liquidity needs.
Because the Fund invests in commodity futures contracts, its capital is at risk from changes in the value of these contracts (market risk) or the inability of counterparties to perform under the terms of the contracts (credit risk).
Market Risk
Investing in commodity futures and forward contracts involves the Fund entering into contractual commitments to purchase or sell a particular commodity at a specified date and price. The market risk associated with the Fund’s commitments to purchase commodities will be limited to the gross or face amount of the contracts held.
The Fund’s exposure to market risk may be influenced by a number of factors, including changes in international balances of payments and trade, currency devaluations and revaluations, changes in interest and foreign currency exchange rates, price volatility of commodity futures and forwards contracts and market liquidity, weather, geopolitical events and other factors. These factors also affect the Fund’s investments in options on commodity futures and forward contracts. The inherent uncertainty of the Fund’s investments as well as the development of drastic market occurrences could ultimately lead to a loss of all or substantially all of investors’ capital.
30
Table of Contents
Credit Risk
The Fund may be exposed to credit risk from its investments in commodity futures and forward contracts and options on commodity futures and forward contracts resulting from the clearing house associated with a particular exchange failing to meet its obligations to the Fund. In general, clearing houses are backed by their corporate members who may be required to share in the financial burden resulting from the nonperformance of one of their members, which should significantly reduce this credit risk. In cases where the clearing house is not backed by the clearing members (i.e., as in some foreign exchanges), it may be backed by a consortium of banks or other financial institutions. There can be no assurance that any counterparty, clearing member or clearing house will meet its obligations to the Fund.
The Fund’s investment strategy attempts to moderate these market risks, and the Commodity Sub-advisor attempts to minimize credit risks, by requiring the Fund to abide by various investment limitations and policies, which include limiting margin accounts, investing only in liquid markets and permitting the use of stop-loss orders. The Commodity Sub-advisor implements procedures which include, but are not limited to:
| • | Employing the options strategy to reduce directional risk (although there is no guarantee that the Fund’s options strategy will be successful); |
| • | Executing and clearing trades only with creditworthy counterparties; |
| • | Limiting the amount of margin or premium required for any one commodity contract or all commodities contracts combined; and |
| • | Generally limiting transactions to contracts which are traded in sufficient volume to permit the efficient taking and liquidating of positions. |
The commodity broker, when acting as the Fund’s futures commission merchant in accepting orders for the purchase or sale of domestic commodity futures contracts, is required by CFTC regulations to separately account for, and segregate as belonging to the Fund, all assets of the Fund relating to domestic futures investments. The commodity broker is not allowed to commingle such assets with other assets of, or held by, the commodity broker. In addition, CFTC regulations also require the commodity broker, when acting as the Fund’s futures commission merchant, to hold in a separate account the assets of the Fund related to foreign commodity futures investments and not commingle such assets with others assets of, or held by, the commodity broker.
If the Fund purchases over-the-counter (“OTC”) commodity put options, the Fund will be exposed to credit risk that the counterparty to the contract will not meet its obligations. In cases where the Fund purchases OTC commodity put options with a counterparty, the sole recourse of the Fund will be the financial resources of the counterparty to the transaction since there is no clearing house to assume the obligations of the counterparty.
As it relates to the Fund’s assets held as collateral for its investments in commodity futures and forwards contracts, there is credit risk present in the securities used to invest the Fund’s cash. While these consist of the highest quality short-term U.S. treasury and corporate debt instruments, like any investment, these too would be affected by any credit difficulties that might be experienced by the U.S. government or top quality issuers.
Off-Balance Sheet Arrangements
As of December 31, 2011, the Fund has not utilized, nor does it expect to utilize in the future, special purpose entities to facilitate off-balance sheet financing arrangements and has no loan guarantee arrangements or off-balance sheet arrangements of any kind other than agreements entered into in the normal course of business, which may include indemnification provisions related to certain risks service providers undertake in performing services which are in the best interests of the Fund. While the Fund’s exposure under such indemnification provisions cannot be estimated, these general business indemnifications are not expected to have a material impact on the Fund’s financial position.
31
Table of Contents
Contractual Obligations
The Fund’s contractual obligations are with the Manager, the Sub-advisors, the custodian, the transfer agent, the commodity broker and, to the extent that the Fund enters into OTC transactions, broker-dealers. Management fee payments made to the Manager are calculated as a fixed percentage of the Fund’s net assets. The custodian fee is calculated based on the Fund’s assets. The transfer agent fee is calculated based on the total number of registered accounts. Commission payments to the commodity broker are on a contract-by-contract, or round-turn basis, and payments to forward contract dealers are usually based on a fee or percentage of the notional value of the contract. The Manager cannot anticipate the amount of payments that will be required under these arrangements for future periods, as these payments are based on figures which are not known until a future date. Additionally, these agreements may be terminated by either party for various reasons.
Critical Accounting Policies
The Fund’s critical accounting policies are as follows:
| • | Preparation of the financial statements and related disclosures in conformity with accounting principles generally accepted in the United States of America requires the application of appropriate accounting rules and guidance, as well as the use of estimates. The Fund’s application of these policies involves judgments and actual results may differ from the estimates used. |
| • | The Fund holds a significant portion of its assets in options and futures contracts, and high quality debt instruments, all of which are recorded on a trade date basis and at fair value, with changes in fair value recognized on the Statements of Operations as changes in net unrealized appreciation (depreciation). |
| • | The use of fair value to measure financial instruments, with related unrealized appreciation (depreciation) recognized in earnings in each period, is fundamental to the Fund’s financial statements. The fair value of a financial instrument is the amount that would be received to sell an asset or paid to transfer a liability in an orderly transaction between market participants at the measurement date. |
| • | Generally, commodity futures and forward contracts and options on commodity futures and forward contracts traded on an exchange will be valued at the final settlement price or official closing price as determined by the principal exchange on which the instruments are traded as supplied by independent pricing services. OTC commodity futures and forward contracts and options on commodity futures and forward contracts not traded on an exchange will be valued, in order of hierarchy, by independent pricing services, price quotations obtained from counterparty broker-dealers, or through fair valuation methodologies as determined by the Manager. |
| • | Market quotations for exchange-traded commodity futures and forward contracts and options on commodity futures and forward contracts may not be readily available as a result of significant events, which can include, but are not limited to: trading halts or suspensions, market disruptions, or the absence of market makers willing to make a market in such instruments. In addition, events may occur after the close of the market, but prior to the determination of the Fund’s net asset value, which may affect the values of the Fund’s investments. In such circumstances, the Manager will determine a fair valuation for such investments that in its opinion is reflective of fair market value. |
| • | Realized gains (losses) are determined on a specific identification basis and recognized in the Statements of Operations in the period in which the contract is closed. |
| • | Interest income, which reflects the amortization of premiums and includes accretion of discounts for financial reporting purposes, is recorded on an accrual basis. |
32
Table of Contents
Item 7A. Quantitative and Qualitative Disclosures About Market Risk
Quantitative Disclosure
The Fund is exposed to commodity price risk through the futures and forward contracts and the options on futures and forward contracts that the Fund invests in as part of its investment strategy. These instruments have been entered into for trading purposes. The following table provides information about the Fund’s futures contracts and options on futures contracts, which are sensitive to changes in commodity prices as of December 31, 2011. The Fund expects to invest only in long futures contracts. Some short futures positions may be taken in futures contracts traded on the London Metal Exchange (“LME”) solely for the purpose of closing existing long LME futures positions. For every short LME futures contract held by the Fund, the Fund had previously entered into an offsetting long futures contract. As of December 31, 2011, the Fund has not invested in forward contracts.
Futures Contracts
| Commodity Group |
Contract |
Contract |
Contract |
Number of Contracts |
Valuation Price |
Contract Multiplier |
Notional Amount at Value |
|||||||||||||||
| Energy |
Crude Oil | |||||||||||||||||||||
| ICE Brent Crude Oil Futures Contract | Long | February 2012 | 81 | $ | 107.3800 | 1,000 | $ | 8,697,780 | ||||||||||||||
| ICE Brent Crude Oil Futures Contract | Long | March 2012 | 80 | 106.8700 | 1,000 | 8,549,600 | ||||||||||||||||
| NYMEX Crude Oil Futures Contract | Long | February 2012 | 203 | 98.8300 | 1,000 | 20,062,491 | ||||||||||||||||
| NYMEX Crude Oil Futures Contract | Long | March 2012 | 180 | 99.0000 | 1,000 | 17,820,000 | ||||||||||||||||
| Heating Oil | ||||||||||||||||||||||
| ICE Gas Oil Futures Contract | Long | February 2012 | 24 | 918.0000 | 100 | 2,203,200 | ||||||||||||||||
| ICE Gas Oil Futures Contract | Long | March 2012 | 11 | 912.0000 | 100 | 1,003,200 | ||||||||||||||||
| NYMEX Heating Oil Futures Contract | Long | February 2012 | 51 | 2.9142 | 42,000 | 6,242,216 | ||||||||||||||||
| NYMEX Heating Oil Futures Contract | Long | March 2012 | 22 | 2.9059 | 42,000 | 2,685,052 | ||||||||||||||||
| Natural Gas | ||||||||||||||||||||||
| NYMEX Natural Gas Futures Contract | Long | February 2012 | 101 | 2.9890 | 10,000 | 3,018,890 | ||||||||||||||||
| NYMEX Natural Gas Futures Contract | Long | March 2012 | 98 | 3.0160 | 10,000 | 2,955,680 | ||||||||||||||||
| Unleaded Gas | ||||||||||||||||||||||
| NYMEX Gasoline RBOB Futures Contract | Long | February 2012 | 39 | 2.6574 | 42,000 | 4,352,821 | ||||||||||||||||
| NYMEX Gasoline RBOB Futures Contract | Long | March 2012 | 25 | 2.6552 | 42,000 | 2,787,960 | ||||||||||||||||
| NYMEX Gasoline RBOB Futures Contract | Long | May 2012 | 12 | 2.7626 | 42,000 | 1,392,350 | ||||||||||||||||
| Industrial Metals |
Aluminum | |||||||||||||||||||||
| LME Primary Aluminum Futures Contract | Long | January 2012 | 211 | 1,997.0000 | 25 | 10,534,175 | ||||||||||||||||
| LME Primary Aluminum Futures Contract | Short | January 2012 | (4 | ) | 1,997.0000 | 25 | (199,700 | ) | ||||||||||||||
| Copper | ||||||||||||||||||||||
| CEC Copper Futures Contract | Long | March 2012 | 95 | 3.4360 | 25,000 | 8,160,500 | ||||||||||||||||
| CEC Copper Futures Contract | Long | May 2012 | 10 | 3.4475 | 25,000 | 861,875 | ||||||||||||||||
| LME Copper Futures Contract | Long | January 2012 | 48 | 7,595.0000 | 25 | 9,114,000 | ||||||||||||||||
| Nickel | ||||||||||||||||||||||
| LME Nickel Futures Contract | Long | January 2012 | 16 | 18,731.0000 | 6 | 1,798,176 | ||||||||||||||||
| LME Nickel Futures Contract | Long | March 2012 | 16 | 18,715.0000 | 6 | 1,796,640 | ||||||||||||||||
| Zinc | ||||||||||||||||||||||
| LME Zinc Futures Contract | Long | January 2012 | 61 | 1,830.7500 | 25 | 2,791,894 | ||||||||||||||||
| LME Zinc Futures Contract | Short | January 2012 | (30 | ) | 1,830.7500 | 25 | (1,373,063 | ) | ||||||||||||||
| LME Zinc Futures Contract | Long | March 2012 | 30 | 1,843.7500 | 25 | 1,382,813 | ||||||||||||||||
| LME Zinc Futures Contract | Short | March 2012 | (2 | ) | 1,843.7500 | 25 | (92,188 | ) | ||||||||||||||
| Lead | ||||||||||||||||||||||
| LME Lead Futures Contract | Long | January 2012 | 32 | 2,017.7500 | 25 | 1,614,200 | ||||||||||||||||
| LME Lead Futures Contract | Short | January 2012 | (1 | ) | 2,017.7500 | 25 | (50,444 | ) | ||||||||||||||
33
Table of Contents
Futures Contracts (Continued)
| Commodity Group |
Contract |
Contract |
Contract |
Number of Contracts |
Valuation Price |
Contract Multiplier |
Notional Amount at Value |
|||||||||||||||
| Agriculturals |
Corn | |||||||||||||||||||||
| CBOT Corn Futures Contract | Long | March 2012 | 283 | $ | 6.4650 | 5,000 | $ | 9,147,975 | ||||||||||||||
| CBOT Corn Futures Contract | Long | May 2012 | 25 | 6.5475 | 5,000 | 818,438 | ||||||||||||||||
| Soybean | ||||||||||||||||||||||
| CBOT Soybean Futures Contract | Long | March 2012 | 156 | 12.0775 | 5,000 | 9,420,450 | ||||||||||||||||
| Wheat | ||||||||||||||||||||||
| CBOT Wheat Futures Contract | Long | March 2012 | 110 | 6.5275 | 5,000 | 3,590,125 | ||||||||||||||||
| CBOT Wheat Futures Contract | Long | May 2012 | 10 | 6.7125 | 5,000 | 335,625 | ||||||||||||||||
| KCBT Wheat Futures Contract | Long | March 2012 | 111 | 7.1700 | 5,000 | 3,979,350 | ||||||||||||||||
| Soybean Meal | ||||||||||||||||||||||
| CBOT Soybean Meal Futures Contract | Long | March 2012 | 120 | 313.1000 | 100 | 3,757,200 | ||||||||||||||||
| Soybean Oil | ||||||||||||||||||||||
| CBOT Soybean Oil Futures Contract | Long | March 2012 | 73 | 0.5242 | 60,000 | 2,295,996 | ||||||||||||||||
| CBOT Soybean Oil Futures Contract | Long | May 2012 | 10 | 0.5278 | 60,000 | 316,680 | ||||||||||||||||
| Precious Metals |
Gold | |||||||||||||||||||||
| CEC Gold Futures Contract | Long | February 2012 | 123 | 1,566.8000 | 100 | 19,271,640 | ||||||||||||||||
| Silver | ||||||||||||||||||||||
| CEC Silver Futures Contract | Long | March 2012 | 41 | 27.9150 | 5,000 | 5,722,575 | ||||||||||||||||
| Platinum | ||||||||||||||||||||||
| NYMEX Platinum Futures Contract | Long | April 2012 | 27 | 1,404.9000 | 50 | 1,896,615 | ||||||||||||||||
| Palladium | ||||||||||||||||||||||
| NYMEX Palladium Futures Contract | Long | March 2012 | 13 | 656.1500 | 100 | 852,995 | ||||||||||||||||
| Food and Fibers |
Cotton | |||||||||||||||||||||
| ICE Cotton Futures Contract | Long | March 2012 | 81 | 0.9180 | 50,000 | 3,717,900 | ||||||||||||||||
| Sugar | ||||||||||||||||||||||
| ICE Sugar Futures Contract | Long | March 2012 | 279 | 0.2330 | 112,000 | 7,280,784 | ||||||||||||||||
| Coffee | ||||||||||||||||||||||
| ICE Coffee C Futures Contract | Long | March 2012 | 43 | 2.2685 | 37,500 | 3,657,956 | ||||||||||||||||
| LIFFE Coffee Robusta Futures Contract | Long | March 2012 | 45 | 1,810.0000 | 10 | 814,500 | ||||||||||||||||
| Cocoa | ||||||||||||||||||||||
| ICE Cocoa Futures Contract | Long | March 2012 | 79 | 2,109.0000 | 10 | 1,666,110 | ||||||||||||||||
| Livestock |
Live Cattle | |||||||||||||||||||||
| CME Live Cattle Futures Contract | Long | February 2012 | 178 | 1.2145 | 40,000 | 8,647,240 | ||||||||||||||||
| CME Live Cattle Futures Contract | Long | April 2012 | 9 | 1.2545 | 40,000 | 451,620 | ||||||||||||||||
| CME Live Cattle Futures Contract | Long | June 2012 | 22 | 1.2458 | 40,000 | 1,096,260 | ||||||||||||||||
| Lean Hogs | ||||||||||||||||||||||
| CME Lean Hog Futures Contract | Long | February 2012 | 95 | 0.8430 | 40,000 | 3,203,400 | ||||||||||||||||
| CME Lean Hog Futures Contract | Long | April 2012 | 38 | 0.8770 | 40,000 | 1,333,040 | ||||||||||||||||
| CME Lean Hog Futures Contract | Long | June 2012 | 8 | 0.9550 | 40,000 | 305,600 | ||||||||||||||||
| Feeder Cattle | ||||||||||||||||||||||
| CME Feeder Cattle Futures Contract | Long | March 2012 | 36 | 1.4880 | 50,000 | 2,678,400 | ||||||||||||||||
Commodity Call Options Written
| Commodity Group |
Contract |
|
Contract |
Number of Contracts |
Strike Price |
|
Value | |||||||||||||
| Energy |
Crude Oil | |||||||||||||||||||
| NYMEX Crude Oil Futures Options | January 2012 | (191 | ) | $ | 107.0 | $ | (103,140 | ) | ||||||||||||
| ICE Brent Crude Oil Futures Options | February 2012 | (81 | ) | 119.0 | (12,960 | ) | ||||||||||||||
| Heating Oil | ||||||||||||||||||||
| NYMEX Heating Oil Futures Options | January 2012 | (50 | ) | 3.5 | (1,890 | ) | ||||||||||||||
| Natural Gas | ||||||||||||||||||||
| NYMEX Natural Gas Futures Options | January 2012 | (100 | ) | 3,450.0 | (19,000 | ) | ||||||||||||||
| Unleaded Gas | ||||||||||||||||||||
| NYMEX Gasoline RBOB Futures Options | January 2012 | (38 | ) | 29,000.0 | (26,015 | ) | ||||||||||||||
34
Table of Contents
Commodity Call Options Written (Continued)
| Commodity Group |
Contract |
|
Contract |
Number of Contracts |
Strike Price |
|
Value | |||||||||||||
| Industrial Metals |
Aluminum | |||||||||||||||||||
| LME Primary Aluminum Futures Options | January 2012 | (103 | ) | $ | 2,300.0 | $ | - | |||||||||||||
| Copper | ||||||||||||||||||||
| LME Copper Futures Options | January 2012 | (48 | ) | 8,400.0 | (684 | ) | ||||||||||||||
| Nickel | ||||||||||||||||||||
| LME Nickel Futures Options | January 2012 | (16 | ) | 20,100.0 | (2,330 | ) | ||||||||||||||
| Zinc | ||||||||||||||||||||
| LME Zinc Futures Options | January 2012 | (30 | ) | 2,200.0 | - | |||||||||||||||
| Lead | ||||||||||||||||||||
| LME Lead Futures Options | January 2012 | (16 | ) | 2,300.0 | (16 | ) | ||||||||||||||
| Agriculturals |
Corn | |||||||||||||||||||
| CBOT Corn Futures Options | February 2012 | (154 | ) | 740.0 | (71,225 | ) | ||||||||||||||
| Soybean | ||||||||||||||||||||
| CBOT Soybean Futures Options | February 2012 | (78 | ) | 1,260.0 | (112,613 | ) | ||||||||||||||
| Wheat | ||||||||||||||||||||
| CBOT Wheat Futures Options | February 2012 | (60 | ) | 720.0 | (49,125 | ) | ||||||||||||||
| KCBT Wheat Futures Options | February 2012 | (56 | ) | 770.0 | (44,450 | ) | ||||||||||||||
| Soybean Meal | ||||||||||||||||||||
| CBOT Soybean Meal Futures Options | February 2012 | (56 | ) | 320.0 | (51,240 | ) | ||||||||||||||
| CBOT Soybean Meal Futures Options | February 2012 | (4 | ) | 360.0 | (720 | ) | ||||||||||||||
| Soybean Oil | ||||||||||||||||||||
| CBOT Soybean Oil Futures Options | February 2012 | (42 | ) | 560.0 | (22,554 | ) | ||||||||||||||
| Precious Metals |
Gold | |||||||||||||||||||
| CEC Gold Futures Options | January 2012 | (62 | ) | 2,010.0 | (1,240 | ) | ||||||||||||||
| Silver | ||||||||||||||||||||
| CEC Silver Futures Options | February 2012 | (21 | ) | 3,800.0 | (5,250 | ) | ||||||||||||||
| Foods and Fibers |
Cotton | |||||||||||||||||||
| ICE Cotton Futures Options | February 2012 | (41 | ) | 1,110.0 | (4,100 | ) | ||||||||||||||
| Sugar | ||||||||||||||||||||
| ICE Sugar Futures Options | February 2012 | (126 | ) | 330.0 | (2,822 | ) | ||||||||||||||
| ICE Sugar Futures Options | February 2012 | (14 | ) | 282.5 | (1,568 | ) | ||||||||||||||
| Coffee | ||||||||||||||||||||
| ICE Coffee C Futures Options | February 2012 | (27 | ) | 265.0 | (9,315 | ) | ||||||||||||||
| Cocoa | ||||||||||||||||||||
| ICE Cocoa Futures Options | February 2012 | (33 | ) | 3,150.0 | (330 | ) | ||||||||||||||
| ICE Cocoa Futures Options | February 2012 | (4 | ) | 2,600.0 | (200 | ) | ||||||||||||||
| ICE Cocoa Futures Options | February 2012 | (3 | ) | 2,900.0 | (30 | ) | ||||||||||||||
| Livestock |
Live Cattle | |||||||||||||||||||
| CME Live Cattle Futures Options | February 2012 | (70 | ) | 133.0 | (3,500 | ) | ||||||||||||||
| CME Live Cattle Futures Options | February 2012 | (62 | ) | 132.0 | (3,720 | ) | ||||||||||||||
| Lean Hogs | ||||||||||||||||||||
| CME Lean Hogs Futures Options | February 2012 | (71 | ) | 96.0 | (1,420 | ) | ||||||||||||||
The Fund also invests the assets held as collateral for its investments in commodity futures and forward contracts in short-term, high grade debt securities, which exposes the Fund to interest rate risk. These instruments are deemed to be entered into for non-trading purposes, with an emphasis on current income, liquidity and preservation of capital. As of December 31, 2011, the Fund held agency notes, agency discount notes, and U.S. Treasury bills and notes worth $174,425,536 with a total par value of $173,552,000, and repurchase agreements worth $1,201,417.
Qualitative Disclosure
The Fund’s primary trading risk exposure is commodity price risk, which affects the futures contracts and options on futures contracts in which the Fund invests. There are numerous uncertainties, contingencies and risks associated with these investments (as discussed in “Item 1A. Risk Factors” and elsewhere in this Annual Report). These include, but are not limited to, government interventions, defaults and expropriations, adverse weather
35
Table of Contents
conditions, commodity supply factors, illiquid markets, the emergence of dominant fundamental factors, political upheavals, changes in historical price relationships, an influx of new market participants, and increased regulation. Investors may lose all or substantially all of their investment in the Fund.
To help manage the commodity price risk mentioned above, the Fund uses its options strategy in an attempt to enhance the Fund’s risk-adjusted total returns relative to the returns of leading commodity market benchmarks. In up markets, the portion of the Fund on which call options have been sold will forego potential appreciation in the value of the underlying contracts to the extent the price of those contracts exceeds the exercise price of options written plus the premium collected by writing the call options. In flat or sideways markets, the portion of the Fund on which call options have been sold will generate current gains from the premium collected by writing the call options. In down markets, the Fund will experience declines in value of the underlying contracts to the extent that the amount of the decline in the value of the underlying contracts exceeds the option premium collected by writing the call options. There can be no assurance that the Fund’s options strategy will be successful. The Fund’s risk-adjusted returns over any particular period may be positive or negative. Furthermore, the Fund invests in a diversified portfolio of commodity futures and forward contracts to obtain broad exposure to all principal groups in the global commodity markets, thereby limiting its exposure to the commodity price risk of any one futures contract or any specific commodity group.
The Fund’s primary non-trading risk exposure is interest rate risk as it relates to its collateral investments in short-term, high grade debt securities which is mitigated due to the short-term nature of these debt securities, as well as by ensuring that the collateral investments are rated at the highest rating applicable for the type of investment as determined by at least one NRSRO or, if unrated, judged by the Collateral Sub-advisor to be of comparable quality.
36
Table of Contents
| Item 8. | Financial Statements and Supplementary Data |
Report of Independent Registered Public Accounting Firm
To the Trustees and Shareholders of
Nuveen Diversified Commodity Fund:
In our opinion, the accompanying statements of financial condition, including the schedule of investments, and the related statements of operations, of changes in shareholders’ capital and of cash flows present fairly, in all material respects, the financial position of Nuveen Diversified Commodity Fund (the “Company”) at December 31, 2011 and December 31, 2010, and the results of its operations, the changes in its shareholders’ capital, and its cash flows for each of the three years in the period ended December 31, 2011 in conformity with accounting principles generally accepted in the United States of America. Also in our opinion, the Company maintained, in all material respects, effective internal control over financial reporting as of December 31, 2011, based on criteria established in Internal Control—Integrated Framework issued by the Committee of Sponsoring Organizations of the Treadway Commission (COSO). The Company’s management is responsible for these financial statements, for maintaining effective internal control over financial reporting and for its assessment of the effectiveness of internal control over financial reporting, included in the accompanying Management’s Annual Report on Internal Control over Financial Reporting. Our responsibility is to express opinions on these financial statements, and on the Company’s internal control over financial reporting based on our audits (which was an integrated audit in 2011). We conducted our audits in accordance with the standards of the Public Company Accounting Oversight Board (United States). Those standards require that we plan and perform the audits to obtain reasonable assurance about whether the financial statements are free of material misstatement and whether effective internal control over financial reporting was maintained in all material respects. Our audits of the financial statements included examining, on a test basis, evidence supporting the amounts and disclosures in the financial statements, assessing the accounting principles used and significant estimates made by management, and evaluating the overall financial statement presentation. Our audit of internal control over financial reporting included obtaining an understanding of internal control over financial reporting, assessing the risk that a material weakness exists, and testing and evaluating the design and operating effectiveness of internal control based on the assessed risk. Our audits also included performing such other procedures as we considered necessary in the circumstances. We believe that our audits provide a reasonable basis for our opinions.
A company’s internal control over financial reporting is a process designed to provide reasonable assurance regarding the reliability of financial reporting and the preparation of financial statements for external purposes in accordance with generally accepted accounting principles. A company’s internal control over financial reporting includes those policies and procedures that (i) pertain to the maintenance of records that, in reasonable detail, accurately and fairly reflect the transactions and dispositions of the assets of the company; (ii) provide reasonable assurance that transactions are recorded as necessary to permit preparation of financial statements in accordance with generally accepted accounting principles, and that receipts and expenditures of the company are being made only in accordance with authorizations of management and directors of the company; and (iii) provide reasonable assurance regarding prevention or timely detection of unauthorized acquisition, use, or disposition of the company’s assets that could have a material effect on the financial statements.
Because of its inherent limitations, internal control over financial reporting may not prevent or detect misstatements. Also, projections of any evaluation of effectiveness to future periods are subject to the risk that controls may become inadequate because of changes in conditions, or that the degree of compliance with the policies or procedures may deteriorate.
PricewaterhouseCoopers LLP
Chicago, IL
March 12, 2012
37
Table of Contents
NUVEEN DIVERSIFIED COMMODITY FUND
STATEMENTS OF FINANCIAL CONDITION
| December 31, 2011 | December 31, 2010 | |||||||
| ASSETS | ||||||||
| Short-term investments, at value (cost $175,594,508 and $182,130,272, respectively) |
$ | 175,626,953 | $ | 182,158,211 | ||||
| Cash |
— | 16 | ||||||
| Deposits with brokers |
44,193,777 | 50,972,757 | ||||||
| Interest receivable |
561,049 | 3 | ||||||
| Unrealized appreciation on futures contracts, net |
— | 18,854,639 | ||||||
| Other assets |
200,745 | — | ||||||
|
|
|
|
|
|||||
| Total assets |
220,582,524 | 251,985,626 | ||||||
|
|
|
|
|
|||||
| LIABILITIES | ||||||||
| Call options written, at value (premiums received $1,428,047 and $1,629,313, respectively) |
551,457 | 3,494,305 | ||||||
| Unrealized depreciation on futures contracts, net |
4,921,830 | — | ||||||
| Payable for shares repurchased |
315,845 | — | ||||||
| Accrued expenses: |
||||||||
| Management fees |
229,634 | 254,641 | ||||||
| Other |
383,629 | 478,932 | ||||||
|
|
|
|
|
|||||
| Total liabilities |
6,402,395 | 4,227,878 | ||||||
|
|
|
|
|
|||||
| SHAREHOLDERS’ CAPITAL | ||||||||
| Paid-in capital, unlimited number of shares authorized, 9,229,040 shares issued and outstanding at December 31, 2011 and 9,267,040 shares issued and outstanding at December 31, 2010 |
220,038,837 | 220,787,270 | ||||||
| Accumulated undistributed earnings (deficit) |
(5,858,708 | ) | 26,970,478 | |||||
|
|
|
|
|
|||||
| Total shareholders’ capital (Net assets) |
214,180,129 | 247,757,748 | ||||||
|
|
|
|
|
|||||
| Total liabilities and shareholders’ capital |
$ | 220,582,524 | $ | 251,985,626 | ||||
|
|
|
|
|
|||||
| Net assets |
$ | 214,180,129 | $ | 247,757,748 | ||||
| Shares outstanding |
9,229,040 | 9,267,040 | ||||||
|
|
|
|
|
|||||
| Net asset value per share outstanding (net assets divided by shares outstanding) |
$ | 23.21 | $ | 26.74 | ||||
|
|
|
|
|
|||||
| Market value per share outstanding |
$ | 20.30 | $ | 25.80 | ||||
|
|
|
|
|
|||||
See accompanying notes to financial statements.
38
Table of Contents
NUVEEN DIVERSIFIED COMMODITY FUND
SCHEDULE OF INVESTMENTS
December 31, 2011
Investments
| Principal Amount (000) |
Description | Coupon | Maturity | Ratings(1) | Value | |||||||||||||
| Short-Term Investments | ||||||||||||||||||
| U.S. Government and Agency Obligations | ||||||||||||||||||
| $ 30,000 | Federal Home Loan Mortgage Corporation | 0.000 | % | 8/07/12 | Aaa | $ | 29,989,140 | |||||||||||
| 18,860 | Federal Home Loan Mortgage Corporation | 1.000 | % | 8/28/12 | Aaa | 18,958,430 | ||||||||||||
| 20,692 | Federal National Mortgage Association | 6.125 | % | 3/15/12 | Aaa | 20,939,932 | ||||||||||||
| 20,000 | Federal National Mortgage Association | 0.000 | % | 4/02/12 | Aaa | 19,999,000 | ||||||||||||
| 30,000 | U.S. Treasury Bills | 0.000 | % | 4/5/12 | Aaa | 29,998,440 | ||||||||||||
| 15,000 | U.S. Treasury Bills | 0.000 | % | 8/23/12 | Aaa | 14,993,205 | ||||||||||||
| 10,000 | U.S. Treasury Bills | 0.000 | % | 11/15/12 | Aaa | 9,992,300 | ||||||||||||
| 29,000 | U.S. Treasury Notes | 4.750 | % | 5/31/12 | Aaa | 29,555,089 | ||||||||||||
|
|
|
|
|
|||||||||||||||
| 173,552 | Total U.S. Government And Agency Obligations (cost $174,393,091) | 174,425,536 | ||||||||||||||||
|
|
|
|
|
|||||||||||||||
| Repurchase Agreements | ||||||||||||||||||
| 1,201 | Repurchase Agreement with State Street Bank, dated 12/30/11, repurchase price $1,201,418, collateralized by $1,215,000 U.S. Treasury Notes, 1.000%, due 8/31/16, value $1,230,188 | 0.010 | % | 1/03/12 | N/A | 1,201,417 | ||||||||||||
|
|
|
|||||||||||||||||
| Total Repurchase Agreements (cost $1,201,417) | 1,201,417 | |||||||||||||||||
|
|
|
|||||||||||||||||
| Total Short-Term Investments (cost $175,594,508) | $ | 175,626,953 | ||||||||||||||||
|
|
|
|
||||||||||||||||
39
Table of Contents
NUVEEN DIVERSIFIED COMMODITY FUND
SCHEDULE OF INVESTMENTS (Continued)
December 31, 2011
Investments in Derivatives
Futures Contracts outstanding:
| Commodity Group | Contract | Contract Position(2) |
Contract Expiration |
Number of Contracts |
Notional Amount at Value |
Unrealized Appreciation (Depreciation) |
||||||||||||||||
| Energy |
Crude Oil | |||||||||||||||||||||
| ICE Brent Crude Oil Futures Contract | Long | February 2012 | 81 | $ | 8,697,780 | $ | 25,920 | |||||||||||||||
| ICE Brent Crude Oil Futures Contract | Long | March 2012 | 80 | 8,549,600 | 105,303 | |||||||||||||||||
| NYMEX Crude Oil Futures Contract | Long | February 2012 | 203 | 20,062,491 | 747,040 | |||||||||||||||||
| NYMEX Crude Oil Futures Contract | Long | March 2012 | 180 | 17,820,000 | 748,150 | |||||||||||||||||
|
|
|
|
||||||||||||||||||||
| Total Crude Oil | 1,626,413 | |||||||||||||||||||||
|
|
|
|
||||||||||||||||||||
| Heating Oil | ||||||||||||||||||||||
| ICE Gas Oil Futures Contract | Long | February 2012 | 24 | 2,203,200 | 30,075 | |||||||||||||||||
| ICE Gas Oil Futures Contract | Long | March 2012 | 11 | 1,003,200 | (3,700 | ) | ||||||||||||||||
| NYMEX Heating Oil Futures Contract | Long | February 2012 | 51 | 6,242,216 | (186,384 | ) | ||||||||||||||||
| NYMEX Heating Oil Futures Contract | Long | March 2012 | 22 | 2,685,052 | 10,435 | |||||||||||||||||
|
|
|
|
||||||||||||||||||||
| Total Heating Oil | (149,574 | ) | ||||||||||||||||||||
|
|
|
|
||||||||||||||||||||
| Natural Gas | ||||||||||||||||||||||
| NYMEX Natural Gas Futures Contract | Long | February 2012 | 101 | 3,018,890 | (149,190 | ) | ||||||||||||||||
| NYMEX Natural Gas Futures Contract | Long | March 2012 | 98 | 2,955,680 | (293,290 | ) | ||||||||||||||||
|
|
|
|
||||||||||||||||||||
| Total Natural Gas | (442,480 | ) | ||||||||||||||||||||
|
|
|
|
||||||||||||||||||||
| Unleaded Gas | ||||||||||||||||||||||
| NYMEX Gasoline RBOB Futures Contract | Long | February 2012 | 39 | 4,352,821 | 156,920 | |||||||||||||||||
| NYMEX Gasoline RBOB Futures Contract | Long | March 2012 | 25 | 2,787,960 | 103,988 | |||||||||||||||||
| NYMEX Gasoline RBOB Futures Contract | Long | May 2012 | 12 | 1,392,350 | 2,121 | |||||||||||||||||
|
|
|
|
||||||||||||||||||||
| Total Unleaded Gas | 263,029 | |||||||||||||||||||||
|
|
|
|
||||||||||||||||||||
| Total Energy | 1,297,388 | |||||||||||||||||||||
|
|
|
|
||||||||||||||||||||
40
Table of Contents
NUVEEN DIVERSIFIED COMMODITY FUND
SCHEDULE OF INVESTMENTS (Continued)
December 31, 2011
Investments in Derivatives (Continued)
Futures Contracts outstanding (Continued):
| Commodity Group | Contract | Contract Position(2) |
Contract Expiration |
Number of Contracts |
Notional Amount at Value |
Unrealized Appreciation (Depreciation) |
||||||||||||||||
| Industrial Metals |
Aluminum | |||||||||||||||||||||
| LME Primary Aluminum Futures Contract | Long | January 2012 | 211 | $ | 10,534,175 | $ | (886,063 | ) | ||||||||||||||
| LME Primary Aluminum Futures Contract | Short | January 2012 | (4 | ) | (199,700 | ) | 21,725 | |||||||||||||||
|
|
|
|
||||||||||||||||||||
| Total Aluminum | (864,338 | ) | ||||||||||||||||||||
|
|
|
|
||||||||||||||||||||
| Copper | ||||||||||||||||||||||
| CEC Copper Futures Contract | Long | March 2012 | 95 | 8,160,500 | (244,762 | ) | ||||||||||||||||
| CEC Copper Futures Contract | Long | May 2012 | 10 | 861,875 | (28,350 | ) | ||||||||||||||||
| LME Copper Futures Contract | Long | January 2012 | 48 | 9,114,000 | (316,800 | ) | ||||||||||||||||
|
|
|
|
||||||||||||||||||||
| Total Copper | (589,912 | ) | ||||||||||||||||||||
|
|
|
|
||||||||||||||||||||
| Nickel | ||||||||||||||||||||||
| LME Nickel Futures Contract | Long | January 2012 | 16 | 1,798,176 | (95,232 | ) | ||||||||||||||||
| LME Nickel Futures Contract | Long | March 2012 | 16 | 1,796,640 | 38,112 | |||||||||||||||||
|
|
|
|
||||||||||||||||||||
| Total Nickel | (57,120 | ) | ||||||||||||||||||||
|
|
|
|
||||||||||||||||||||
| Zinc | ||||||||||||||||||||||
| LME Zinc Futures Contract | Long | January 2012 | 61 | 2,791,894 | (243,856 | ) | ||||||||||||||||
| LME Zinc Futures Contract | Long | March 2012 | 30 | 1,382,813 | (12,938 | ) | ||||||||||||||||
| LME Zinc Futures Contract | Short | January 2012 | (30 | ) | (1,373,063 | ) | 14,438 | |||||||||||||||
| LME Zinc Futures Contract | Short | March 2012 | (2 | ) | (92,188 | ) | — | |||||||||||||||
|
|
|
|
||||||||||||||||||||
| Total Zinc | (242,356 | ) | ||||||||||||||||||||
|
|
|
|
||||||||||||||||||||
| Lead | ||||||||||||||||||||||
| LME Lead Futures Contract | Long | January 2012 | 32 | 1,614,200 | (82,200 | ) | ||||||||||||||||
| LME Lead Futures Contract | Short | January 2012 | (1 | ) | (50,444 | ) | — | |||||||||||||||
|
|
|
|
||||||||||||||||||||
| Total Lead | (82,200 | ) | ||||||||||||||||||||
|
|
|
|
||||||||||||||||||||
| Total Industrial Metals | (1,835,926 | ) | ||||||||||||||||||||
|
|
|
|
||||||||||||||||||||
| Agriculturals |
Corn | |||||||||||||||||||||
| CBOT Corn Futures Contract | Long | March 2012 | 283 | 9,147,975 | (136,663 | ) | ||||||||||||||||
| CBOT Corn Futures Contract | Long | May 2012 | 25 | 818,438 | 4,100 | |||||||||||||||||
|
|
|
|
||||||||||||||||||||
| Total Corn | (132,563 | ) | ||||||||||||||||||||
|
|
|
|
||||||||||||||||||||
| Soybean | ||||||||||||||||||||||
| CBOT Soybean Futures Contract | Long | March 2012 | 156 | 9,420,450 | 591,843 | |||||||||||||||||
|
|
|
|
||||||||||||||||||||
| Wheat | ||||||||||||||||||||||
| CBOT Wheat Futures Contract | Long | March 2012 | 110 | 3,590,125 | 16,700 | |||||||||||||||||
| CBOT Wheat Futures Contract | Long | May 2012 | 10 | 335,625 | 6,325 | |||||||||||||||||
| KCBT Wheat Futures Contract | Long | March 2012 | 111 | 3,979,350 | (28,999 | ) | ||||||||||||||||
|
|
|
|
||||||||||||||||||||
| Total Wheat | (5,974 | ) | ||||||||||||||||||||
|
|
|
|
||||||||||||||||||||
| Soybean Meal | ||||||||||||||||||||||
| CBOT Soybean Meal Futures Contract | Long | March 2012 | 120 | 3,757,200 | 148,690 | |||||||||||||||||
|
|
|
|
||||||||||||||||||||
| Soybean Oil | ||||||||||||||||||||||
| CBOT Soybean Oil Futures Contract | Long | March 2012 | 73 | 2,295,996 | (16,692 | ) | ||||||||||||||||
| CBOT Soybean Oil Futures Contract | Long | May 2012 | 10 | 316,680 | 13,710 | |||||||||||||||||
|
|
|
|
||||||||||||||||||||
| Total Soybean Oil | (2,982 | ) | ||||||||||||||||||||
|
|
|
|
||||||||||||||||||||
| Total Agriculturals | 599,014 | |||||||||||||||||||||
|
|
|
|
||||||||||||||||||||
41
Table of Contents
NUVEEN DIVERSIFIED COMMODITY FUND
SCHEDULE OF INVESTMENTS (Continued)
December 31, 2011
Investments in Derivatives (Continued)
Futures Contracts outstanding (Continued):
| Commodity Group | Contract | Contract Position(2) |
Contract Expiration |
Number of Contracts |
Notional Amount at Value |
Unrealized Appreciation (Depreciation) |
||||||||||||||||
| Precious Metals |
Gold | |||||||||||||||||||||
| CEC Gold Futures Contract | Long | February 2012 | 123 | $ | 19,271,640 | $ | (1,552,260 | ) | ||||||||||||||
|
|
|
|
||||||||||||||||||||
| Silver | ||||||||||||||||||||||
| CEC Silver Futures Contract | Long | March 2012 | 41 | 5,722,575 | (852,390 | ) | ||||||||||||||||
|
|
|
|
||||||||||||||||||||
| Platinum | ||||||||||||||||||||||
| NYMEX Platinum Futures Contract | Long | April 2012 | 27 | 1,896,615 | (25,015 | ) | ||||||||||||||||
|
|
|
|
||||||||||||||||||||
| Palladium | ||||||||||||||||||||||
| NYMEX Palladium Futures Contract | Long | March 2012 | 13 | 852,995 | (12,545 | ) | ||||||||||||||||
|
|
|
|
||||||||||||||||||||
| Total Precious Metals | (2,442,210 | ) | ||||||||||||||||||||
|
|
|
|
||||||||||||||||||||
| Foods and Fibers |
Cotton | |||||||||||||||||||||
| ICE Cotton Futures Contract | Long | March 2012 | 81 | 3,717,900 | (233,343 | ) | ||||||||||||||||
|
|
|
|
||||||||||||||||||||
| Sugar | ||||||||||||||||||||||
| ICE Sugar Futures Contract | Long | March 2012 | 279 | 7,280,784 | (1,371,187 | ) | ||||||||||||||||
|
|
|
|
||||||||||||||||||||
| Coffee | ||||||||||||||||||||||
| ICE Coffee C Futures Contract | Long | March 2012 | 43 | 3,657,956 | (187,463 | ) | ||||||||||||||||
| LIFFE Coffee Robusta Futures Contract | Long | March 2012 | 45 | 814,500 | (41,850 | ) | ||||||||||||||||
|
|
|
|
||||||||||||||||||||
| Total Coffee | (229,313 | ) | ||||||||||||||||||||
|
|
|
|
||||||||||||||||||||
| Cocoa | ||||||||||||||||||||||
| ICE Cocoa Futures Contract | Long | March 2012 | 79 | 1,666,110 | (379,520 | ) | ||||||||||||||||
|
|
|
|
||||||||||||||||||||
| Total Foods and Fibers | (2,213,363 | ) | ||||||||||||||||||||
|
|
|
|
||||||||||||||||||||
| Livestock |
Live Cattle | |||||||||||||||||||||
| CME Live Cattle Futures Contract | Long | February 2012 | 178 | 8,647,240 | (133,377 | ) | ||||||||||||||||
| CME Live Cattle Futures Contract | Long | April 2012 | 9 | 451,620 | (7,090 | ) | ||||||||||||||||
| CME Live Cattle Futures Contract | Long | June 2012 | 22 | 1,096,260 | 20,640 | |||||||||||||||||
|
|
|
|
||||||||||||||||||||
| Total Live Cattle | (119,827 | ) | ||||||||||||||||||||
|
|
|
|
||||||||||||||||||||
| Lean Hogs | ||||||||||||||||||||||
| CME Lean Hog Futures Contract | Long | February 2012 | 95 | 3,203,400 | (189,807 | ) | ||||||||||||||||
| CME Lean Hog Futures Contract | Long | April 2012 | 38 | 1,333,040 | (59,209 | ) | ||||||||||||||||
| CME Lean Hog Futures Contract | Long | June 2012 | 8 | 305,600 | (1,140 | ) | ||||||||||||||||
|
|
|
|
||||||||||||||||||||
| Total Lean Hogs | (250,156 | ) | ||||||||||||||||||||
|
|
|
|
||||||||||||||||||||
| Feeder Cattle | ||||||||||||||||||||||
| CME Feeder Cattle Futures Contract | Long | March 2012 | 36 | 2,678,400 | 43,250 | |||||||||||||||||
|
|
|
|
||||||||||||||||||||
| Total Livestock | (326,733 | ) | ||||||||||||||||||||
|
|
|
|
||||||||||||||||||||
| Total Futures Contracts outstanding | $ | (4,921,830 | ) | |||||||||||||||||||
|
|
|
|
||||||||||||||||||||
42
Table of Contents
NUVEEN DIVERSIFIED COMMODITY FUND
SCHEDULE OF INVESTMENTS (Continued)
December 31, 2011
Investments in Derivatives (Continued)
Call Options Written outstanding:
| Commodity Group | Contract | Contract Expiration |
Number of Contracts |
Strike Price |
Value | |||||||||||||
| Energy |
Crude Oil | |||||||||||||||||
| NYMEX Crude Oil Futures Options | January 2012 | (191 | ) | $ | 107.0 | $ | (103,140 | ) | ||||||||||
| ICE Brent Crude Oil Futures Options | February 2012 | (81 | ) | 119.0 | (12,960 | ) | ||||||||||||
|
|
|
|
||||||||||||||||
| Total Crude Oil |
(116,100 | ) | ||||||||||||||||
|
|
|
|
||||||||||||||||
| Heating Oil |
||||||||||||||||||
| NYMEX Heating Oil Futures Options | January 2012 | (50 | ) | 3.5 | (1,890 | ) | ||||||||||||
|
|
|
|
||||||||||||||||
| Natural Gas |
||||||||||||||||||
| NYMEX Natural Gas Futures Options | January 2012 | (100 | ) | 3,450.0 | (19,000 | ) | ||||||||||||
|
|
|
|
||||||||||||||||
| Unleaded Gas |
||||||||||||||||||
| NYMEX Gasoline RBOB Futures Options | January 2012 | (38 | ) | 29,000.0 | (26,015 | ) | ||||||||||||
|
|
|
|
||||||||||||||||
| Total Energy |
(163,005 | ) | ||||||||||||||||
|
|
|
|
||||||||||||||||
| Industrial Metals |
Aluminum | |||||||||||||||||
| LME Primary Aluminum Futures Options(3) | January 2012 | (103 | ) | 2,300.0 | — | |||||||||||||
|
|
|
|
||||||||||||||||
| Copper |
||||||||||||||||||
| LME Copper Futures Options(3) | January 2012 | (48 | ) | 8,400.0 | (684 | ) | ||||||||||||
|
|
|
|
||||||||||||||||
| Nickel |
||||||||||||||||||
| LME Nickel Futures Options(3) | January 2012 | (16 | ) | 20,100.0 | (2,330 | ) | ||||||||||||
|
|
|
|
||||||||||||||||
| Zinc |
||||||||||||||||||
| LME Zinc Futures Options(3) | January 2012 | (30 | ) | 2,200.0 | — | |||||||||||||
|
|
|
|
||||||||||||||||
| Lead |
||||||||||||||||||
| LME Lead Futures Options(3) | January 2012 | (16 | ) | 2,300.0 | (16 | ) | ||||||||||||
|
|
|
|
||||||||||||||||
| Total Industrial Metals |
(3,030 | ) | ||||||||||||||||
|
|
|
|
||||||||||||||||
| Agriculturals |
Corn | |||||||||||||||||
| CBOT Corn Futures Options | February 2012 | (154 | ) | 740.0 | (71,225 | ) | ||||||||||||
|
|
|
|
||||||||||||||||
| Soybean |
||||||||||||||||||
| CBOT Soybean Futures Options | February 2012 | (78 | ) | 1,260.0 | (112,613 | ) | ||||||||||||
|
|
|
|
||||||||||||||||
| Wheat |
||||||||||||||||||
| CBOT Wheat Futures Options | February 2012 | (60 | ) | 720.0 | (49,125 | ) | ||||||||||||
| KCBT Wheat Futures Options | February 2012 | (56 | ) | 770.0 | (44,450 | ) | ||||||||||||
|
|
|
|
||||||||||||||||
| Total Wheat |
(93,575 | ) | ||||||||||||||||
|
|
|
|
||||||||||||||||
| Soybean Meal |
||||||||||||||||||
| CBOT Soybean Meal Futures Options | February 2012 | (56 | ) | 320.0 | (51,240 | ) | ||||||||||||
| CBOT Soybean Meal Futures Options | February 2012 | (4 | ) | 360.0 | (720 | ) | ||||||||||||
|
|
|
|
||||||||||||||||
| Total Soybean Meal |
(51,960 | ) | ||||||||||||||||
|
|
|
|
||||||||||||||||
| Soybean Oil |
||||||||||||||||||
| CBOT Soybean Oil Futures Options | February 2012 | (42 | ) | 560.0 | (22,554 | ) | ||||||||||||
|
|
|
|
||||||||||||||||
| Total Agriculturals |
(351,927 | ) | ||||||||||||||||
|
|
|
|
||||||||||||||||
43
Table of Contents
NUVEEN DIVERSIFIED COMMODITY FUND
SCHEDULE OF INVESTMENTS (Continued)
December 31, 2011
Investments in Derivatives (Continued)
Call Options Written outstanding (Continued):
| Commodity Group | Contract | Contract Expiration |
Number of Contracts |
Strike Price |
Value | |||||||||||||
| Precious Metals |
Gold | |||||||||||||||||
| CEC Gold Futures Options | January 2012 | (62 | ) | $ | 2,010.0 | $ | (1,240 | ) | ||||||||||
|
|
|
|
||||||||||||||||
| Silver |
||||||||||||||||||
| CEC Silver Futures Options | February 2012 | (21 | ) | 3,800.0 | (5,250 | ) | ||||||||||||
|
|
|
|
||||||||||||||||
| Total Precious Metals |
(6,490 | ) | ||||||||||||||||
|
|
|
|
||||||||||||||||
| Foods and Fibers |
Cotton | |||||||||||||||||
| ICE Cotton Futures Options | February 2012 | (41 | ) | 1,110.0 | (4,100 | ) | ||||||||||||
|
|
|
|
||||||||||||||||
| Sugar |
||||||||||||||||||
| ICE Sugar Futures Options | February 2012 | (126 | ) | 330.0 | (2,822 | ) | ||||||||||||
| ICE Sugar Futures Options | February 2012 | (14 | ) | 282.5 | (1,568 | ) | ||||||||||||
|
|
|
|
||||||||||||||||
| Total Sugar |
(4,390 | ) | ||||||||||||||||
|
|
|
|
||||||||||||||||
| Coffee |
||||||||||||||||||
| ICE Coffee C Futures Options | February 2012 | (27 | ) | 265.0 | (9,315 | ) | ||||||||||||
|
|
|
|
||||||||||||||||
| Cocoa |
||||||||||||||||||
| ICE Cocoa Futures Options | February 2012 | (33 | ) | 3,150.0 | (330 | ) | ||||||||||||
| ICE Cocoa Futures Options | February 2012 | (4 | ) | 2,600.0 | (200 | ) | ||||||||||||
| ICE Cocoa Futures Options | February 2012 | (3 | ) | 2,900.0 | (30 | ) | ||||||||||||
|
|
|
|
||||||||||||||||
| Total Cocoa |
(560 | ) | ||||||||||||||||
|
|
|
|
||||||||||||||||
| Total Foods and Fibers |
(18,365 | ) | ||||||||||||||||
|
|
|
|
||||||||||||||||
| Livestock |
Live Cattle | |||||||||||||||||
| CME Live Cattle Futures Options | February 2012 | (70 | ) | 133.0 | (3,500 | ) | ||||||||||||
| CME Live Cattle Futures Options | February 2012 | (62 | ) | 132.0 | (3,720 | ) | ||||||||||||
|
|
|
|
||||||||||||||||
| Total Live Cattle |
(7,220 | ) | ||||||||||||||||
|
|
|
|
||||||||||||||||
| Lean Hogs |
||||||||||||||||||
| CME Lean Hogs Futures Options | February 2012 | (71 | ) | 96.0 | (1,420 | ) | ||||||||||||
|
|
|
|
||||||||||||||||
| Total Livestock |
(8,640 | ) | ||||||||||||||||
|
|
|
|
||||||||||||||||
| Total Call Options Written outstanding (premiums received $1,428,047) | (1,657 | ) | $ | (551,457 | ) | |||||||||||||
|
|
|
|
|
|
||||||||||||||
| (1) | Ratings (not covered by the report of independent registered public accounting firm): Using the highest of Standard & Poor’s Group, Moody’s Investor Service, Inc. or Fitch, Inc. rating. | |
| (2) | The Fund expects to invest only in long futures contracts. Some short futures positions arise in futures contracts traded on the London Metal Exchange (“LME”) solely as the result of closing existing long LME futures positions. For every short LME futures contract outstanding, the Fund had previously entered into a long LME futures contract. The London Clearing House is the counterparty for both the long and short position. | |
| (3) | For fair value measurement disclosure purposes, Call Options Written are categorized as Level 2. See Notes to Financial Statements, Footnote 2 - Summary of Significant Accounting Policies, Fair Value Measurements and Investment Valuation for more information. | |
| N/A | Not applicable. | |
| CBOT | Chicago Board of Trade | |
| CEC | Commodities Exchange Center |
44
Table of Contents
NUVEEN DIVERSIFIED COMMODITY FUND
SCHEDULE OF INVESTMENTS (Continued)
December 31, 2011
| CME | Chicago Mercantile Exchange | |
| ICE | Intercontinental Exchange | |
| KCBT | Kansas City Board of Trade | |
| LIFFE | London International Financial Futures Exchange | |
| LME | London Metal Exchange | |
| NYMEX | New York Mercantile Exchange | |
| RBOB | Reformulated Gasoline Blendstock for Oxygen Blending |
See accompanying notes to financial statements.
45
Table of Contents
NUVEEN DIVERSIFIED COMMODITY FUND
STATEMENTS OF OPERATIONS
| Year Ended December 31, | ||||||||||||
| 2011 | 2010 | 2009 | ||||||||||
| Investment Income: |
||||||||||||
| Interest |
$ | 309,181 | $ | 80,235 | $ | — | ||||||
|
|
|
|
|
|
|
|||||||
| Total Investment Income |
309,181 | 80,235 | — | |||||||||
|
|
|
|
|
|
|
|||||||
| Expenses: |
||||||||||||
| Management fees |
3,009,310 | 721,784 | — | |||||||||
| Brokerage commissions |
151,701 | 46,371 | — | |||||||||
| Custodian’s fees and expenses |
99,353 | 18,541 | — | |||||||||
| Organization expenses |
— | 141,000 | 97,000 | |||||||||
| Trustees’ fees and expenses |
123,125 | — | — | |||||||||
| Professional fees |
361,351 | 438,393 | — | |||||||||
| Shareholder reporting expense |
137,148 | 37,188 | — | |||||||||
| Other expenses |
40,148 | 4,508 | — | |||||||||
|
|
|
|
|
|
|
|||||||
| Total expenses before custodian fee credit and expense reimbursement |
3,922,136 | 1,407,785 | 97,000 | |||||||||
| Custodian fee credit |
— | (1,092 | ) | — | ||||||||
| Expense reimbursement |
— | (141,000 | ) | (97,000 | ) | |||||||
|
|
|
|
|
|
|
|||||||
| Net expenses |
3,922,136 | 1,265,693 | — | |||||||||
|
|
|
|
|
|
|
|||||||
| Net investment income (loss) |
(3,612,955 | ) | (1,185,458 | ) | — | |||||||
|
|
|
|
|
|
|
|||||||
| Net realized gain (loss) from: |
||||||||||||
| Short-term investments |
21,761 | 832 | — | |||||||||
| Futures contracts |
(2,120,418 | ) | 13,688,473 | — | ||||||||
| Call options written |
10,035,572 | 1,480,208 | — | |||||||||
| Change in net unrealized appreciation (depreciation) of: |
||||||||||||
| Short-term investments |
4,506 | 27,939 | — | |||||||||
| Futures contracts |
(23,776,469 | ) | 18,854,639 | — | ||||||||
| Call options written |
2,741,582 | (1,864,992 | ) | — | ||||||||
|
|
|
|
|
|
|
|||||||
| Net realized gain (loss) and change in net unrealized appreciation (depreciation) |
(13,093,466 | ) | 32,187,099 | — | ||||||||
|
|
|
|
|
|
|
|||||||
| Net income (loss) |
$ | (16,706,421 | ) | $ | 31,001,641 | $ | — | |||||
|
|
|
|
|
|
|
|||||||
| Net income (loss) per weighted-average share |
$ | (1.80 | ) | $ | 3.43 | (2) | $ | N/A | (1) | |||
| Weighted-average shares outstanding |
9,266,606 | 9,035,767 | (2) | N/A | (1) | |||||||
| (1) | Not applicable; there were no shares outstanding during the period. |
| (2) | For the period September 27, 2010 (commencement of operations) through December 31, 2010 |
See accompanying notes to financial statements.
46
Table of Contents
NUVEEN DIVERSIFIED COMMODITY FUND
STATEMENTS OF CHANGES IN SHAREHOLDERS’ CAPITAL
| Year Ended December 31, | ||||||||||||
| 2011 | 2010 | 2009 | ||||||||||
| Shareholders’ capital—beginning of period |
$ | 247,757,748 | $ | — | $ | — | ||||||
| Issuance of shares, net of offering costs |
— | 220,787,270 | — | |||||||||
| Repurchase of shares |
(748,433 | ) | — | — | ||||||||
|
|
|
|
|
|
|
|||||||
| Net increase (decrease) in shareholders’ capital resulting from operations: |
||||||||||||
| Net investment income (loss) |
(3,612,955 | ) | (1,185,458 | ) | — | |||||||
| Net realized gain (loss) from: |
||||||||||||
| Short-term investments |
21,761 | 832 | — | |||||||||
| Futures contracts |
(2,120,418 | ) | 13,688,473 | — | ||||||||
| Call options written |
10,035,572 | 1,480,208 | — | |||||||||
| Change in net unrealized appreciation (depreciation) of: |
||||||||||||
| Short-term investments |
4,506 | 27,939 | — | |||||||||
| Futures contracts |
(23,776,469 | ) | 18,854,639 | — | ||||||||
| Call options written |
2,741,582 | (1,864,992 | ) | — | ||||||||
|
|
|
|
|
|
|
|||||||
| Net income (loss) |
(16,706,421 | ) | 31,001,641 | — | ||||||||
|
|
|
|
|
|
|
|||||||
| Distributions to shareholders |
(16,122,765 | ) | (4,031,163 | ) | — | |||||||
|
|
|
|
|
|
|
|||||||
| Shareholders’ capital—end of period |
$ | 214,180,129 | $ | 247,757,748 | $ | — | ||||||
|
|
|
|
|
|
|
|||||||
| Shares—beginning of period |
9,267,040 | — | — | |||||||||
| Issuance of shares |
— | 9,267,040 | — | |||||||||
| Repurchase of shares |
(38,000 | ) | — | — | ||||||||
|
|
|
|
|
|
|
|||||||
| Shares—end of period |
9,229,040 | 9,267,040 | — | |||||||||
|
|
|
|
|
|
|
|||||||
See accompanying notes to financial statements.
47
Table of Contents
NUVEEN DIVERSIFIED COMMODITY FUND
STATEMENTS OF CASH FLOWS
| Year Ended December 31, | ||||||||||||
| 2011 | 2010 | 2009 | ||||||||||
| Cash flows from operating activities: |
||||||||||||
| Net income (loss) |
$ | (16,706,421 | ) | $ | 31,001,641 | $ | — | |||||
| Adjustments to reconcile net income (loss) to net cash provided by (used in) operating activities: |
||||||||||||
| Purchases of short-term investments |
(2,200,786,302 | ) | (493,814,008 | ) | — | |||||||
| Proceeds from sales and maturities of short-term investments |
2,205,322,308 | 311,764,641 | — | |||||||||
| Premiums paid for call options written |
(964,085 | ) | (160,091 | ) | — | |||||||
| Premiums received for call options written |
10,798,390 | 3,269,612 | — | |||||||||
| Amortization (Accretion) |
2,021,520 | (80,073 | ) | — | ||||||||
| Unrealized appreciation on futures contracts, net |
— | (18,854,639 | ) | — | ||||||||
| Unrealized depreciation on futures contracts, net |
23,776,469 | — | — | |||||||||
| (Increase) Decrease in: |
||||||||||||
| Deposits with brokers |
6,778,980 | (50,972,757 | ) | — | ||||||||
| Interest receivable |
(561,046 | ) | (3 | ) | — | |||||||
| Receivable from Manager |
— | 456,000 | (97,000 | ) | ||||||||
| Other assets |
(200,745 | ) | — | — | ||||||||
| Increase (Decrease) in: |
||||||||||||
| Payable for organization expenses |
— | (456,000 | ) | 97,000 | ||||||||
| Accrued management fees |
(25,007 | ) | 254,641 | — | ||||||||
| Other accrued expenses |
(95,303 | ) | 478,932 | — | ||||||||
| Net realized (gain) loss from: |
||||||||||||
| Short-term investments |
(21,761 | ) | (832 | ) | — | |||||||
| Call options written |
(10,035,572 | ) | (1,480,208 | ) | — | |||||||
| Change in net unrealized (appreciation) depreciation of: |
||||||||||||
| Short-term investments |
(4,506 | ) | (27,939 | ) | — | |||||||
| Call options written |
(2,741,582 | ) | 1,864,992 | — | ||||||||
|
|
|
|
|
|
|
|||||||
| Net cash provided by (used in) operating activities |
16,555,337 | (216,756,091 | ) | — | ||||||||
|
|
|
|
|
|
|
|||||||
| Cash flows from financing activities: |
||||||||||||
| Proceeds from issuance of shares |
— | 221,250,580 | — | |||||||||
| Cash paid for shares repurchased |
(432,588 | ) | — | — | ||||||||
| Offering costs |
— | (463,310 | ) | — | ||||||||
| Cash distributions paid to shareholders |
(16,122,765 | ) | (4,031,163 | ) | — | |||||||
|
|
|
|
|
|
|
|||||||
| Net cash provided by (used in) financing activities |
(16,555,353 | ) | 216,756,107 | — | ||||||||
|
|
|
|
|
|
|
|||||||
| Net increase (decrease) in cash |
(16 | ) | 16 | — | ||||||||
| Cash—beginning of period |
16 | — | — | |||||||||
|
|
|
|
|
|
|
|||||||
| Cash—end of period |
$ | — | $ | 16 | $ | — | ||||||
|
|
|
|
|
|
|
|||||||
See accompanying notes to financial statements.
48
Table of Contents
NUVEEN DIVERSIFIED COMMODITY FUND
NOTES TO FINANCIAL STATEMENTS
December 31, 2011
1. Organization
The Nuveen Diversified Commodity Fund (the “Fund”) was organized as a Delaware statutory trust on December 7, 2005, to operate as a commodity pool. On May 11, 2010, the Fund issued 840 shares to Nuveen Commodities Asset Management, LLC, the Fund’s manager (“NCAM” or the “Manager”), a wholly-owned subsidiary of Nuveen Investments, Inc. (“Nuveen”). NCAM is a Delaware limited liability company registered as a commodity pool operator and commodity trading advisor with the Commodity Futures Trading Commission (the “CFTC”) and is a member of the National Futures Association (“NFA”). The Fund commenced operations on September 27, 2010, with its initial public offering of 8,550,000 shares. The Fund settled the shares from its initial public offering on September 30, 2010. During October 2010, the Fund, upon exercise of the over-allotment option granted to the underwriters in connection with the Fund’s initial public offering, issued an additional 716,200 shares. The Fund operates pursuant to an Amended and Restated Trust Agreement (“Trust Agreement”). The Fund’s shares represent units of fractional undivided beneficial interest in, and ownership of, the Fund. The Fund’s shares trade on the NYSE Amex under the ticker symbol “CFD.” The Fund is not a mutual fund, a closed-end fund, or any other type of “investment company” within the meaning of the Investment Company Act of 1940, as amended (the “1940 Act”), and is not subject to regulation thereunder.
Prior to its initial public offering, the Fund had no operations other than those related to organizational matters. The Fund received an initial capital contribution of $20,055 from the Manager, and recorded organizational expenses that were reimbursed by Nuveen Investments, LLC, an affiliate of the Manager and a wholly-owned subsidiary of Nuveen. Effective April 30, 2011, Nuveen Investments, LLC changed its name to Nuveen Securities, LLC.
The Manager has selected Gresham Investment Management LLC (“Gresham” or the “Commodity Sub-advisor”) to manage the Fund’s commodity investment strategy and its options strategy. Gresham is a Delaware limited liability company, the successor to Gresham Investment Management, Inc., formed in July 1992. Gresham is registered with the CFTC as a commodity trading advisor and commodity pool operator, is a member of the NFA and is registered with the Securities and Exchange Commission (“SEC”) as an investment adviser. On December 31, 2011, Nuveen completed its acquisition of a 60% stake in Gresham. As part of the acquisition, Gresham’s management and investment teams will maintain a significant minority ownership stake in the firm, and will continue to operate independently while levering the strengths of Nuveen’s shared resources. Gresham remains the Fund’s Commodity Sub-advisor and there have been no changes in the Fund’s investment objectives, strategies or expenses.
The Manager has selected Nuveen Asset Management, LLC (“Nuveen Asset Management” or the “Collateral Sub-advisor”), an affiliate of the Manager and an indirect wholly-owned subsidiary of Nuveen, to invest the Fund’s collateral in short-term, high grade debt securities. Nuveen Asset Management now serves as the Fund’s Collateral Sub-advisor. Nuveen Asset Management is a Delaware limited liability company and is registered with the SEC as an investment adviser.
49
Table of Contents
NUVEEN DIVERSIFIED COMMODITY FUND
NOTES TO FINANCIAL STATEMENTS (Continued)
December 31, 2011
1. Organization (Continued)
The Fund’s investment objective is to generate higher risk-adjusted total return than leading commodity market benchmarks, specifically the Dow Jones-UBS Commodity Index® (“DJ-UBSCI”) and the S&P GSCI® Commodity Index (“GSCI”), and passively managed commodity funds. Risk-adjusted total return refers to the income and capital appreciation generated by a portfolio (the combination of which equals its total return) per unit of risk taken, with such risk measured by the volatility of the portfolio’s total returns over a specific period of time. In pursuing its investment objective, the Fund invests directly in a diversified portfolio of commodity futures, forward and options contracts to obtain broad exposure to all principal groups in the global commodity markets. The Fund’s investment strategy has three elements:
| • | An actively managed portfolio of commodity futures and forward contracts utilizing Gresham’s proprietary Tangible Asset Program®, or TAP®, a long-only rules-based commodity investment strategy designed to maintain consistent, fully collateralized exposure to commodities as an asset class; |
| • | An integrated program of writing commodity call options designed to enhance the risk-adjusted total return of the Fund’s commodity investments (TAP® and the options strategy are collectively referred to as TAP PLUSSM); and |
| • | A collateral portfolio of cash equivalents and short-term, high grade debt securities. |
2. Summary of Significant Accounting Policies
The following is a summary of significant accounting policies followed by the Fund in the preparation of its financial statements in accordance with accounting principles generally accepted in the United States (“U.S. GAAP”).
Basis of Accounting
The accompanying financial statements have been prepared in conformity with U.S. GAAP. The preparation of financial statements in conformity with U.S. GAAP requires management to make certain estimates and assumptions that affect the reported amounts of assets and liabilities and disclosures of contingent assets and liabilities at the date of the financial statements and the reported amounts of increases and decreases in net assets from operations during the reporting period. Actual results could differ from those estimates.
Futures Contracts
The Fund invests in commodity futures contracts. Upon entering into a futures contract, the Fund is required to deposit with the broker an amount of cash or liquid securities equal to a specified percentage of the contract amount. This is known as the “initial margin.” Cash held by the broker to cover initial margin requirements on open futures contracts, if any, is recognized as “Deposits with brokers” on the Statements of Financial Condition. During the period the futures contract is open, changes in the value of the contract are recognized as an unrealized gain or loss by “marking-to-market” on a daily basis to reflect the changes in market value of the contract, which are recognized as a component of “Unrealized appreciation or depreciation on futures contracts, net” on the Statements of Financial Condition and “Change in net unrealized appreciation (depreciation) of futures contracts” on the Statements of Operations. When the contract is closed or expired, the Fund records a realized gain or loss equal to the difference between the value of the contract on the closing date and the value of the contract when originally entered into, which is recognized as a component of “Net realized gain (loss) from futures contracts” on the Statements of Operations.
50
Table of Contents
NUVEEN DIVERSIFIED COMMODITY FUND
NOTES TO FINANCIAL STATEMENTS (Continued)
December 31, 2011
2. Summary of Significant Accounting Policies (Continued)
The Fund expects to invest only in long futures contracts. Some short futures positions may arise in futures contracts traded on the London Metal Exchange (“LME”) solely as the result of closing existing long LME futures positions. For every short LME futures contract outstanding, the Fund had previously entered into a long futures contract. The LME Clearing House is the counterparty for both the long and short positions.
Risks of investments in commodity futures contracts include possible adverse movement in the price of the commodities underlying the contracts, the possibility that there may not be a liquid secondary market for the contracts and the possibility that a change in the value of the contract may not correlate with a change in the value of the underlying commodities.
The average number of futures contracts outstanding during the fiscal year ended December 31, 2011, was 3,636. The average number of futures contracts outstanding during the period October 1, 2010 (date on which the Fund began entering into futures contracts) through December 31, 2010, was 3,838.
Refer to Footnote 3 – Derivative Instruments and Hedging Activities for further details on futures contract activity.
Options Contracts
The Fund may write (sell) and purchase options on commodity futures and forward contracts to enhance the Fund’s risk-adjusted total return. When the Fund writes an option, an amount equal to the premium received is recognized as a component of “Call options written, at value” on the Statements of Financial Condition and is subsequently adjusted to reflect the current value of the written option until the option expires or the Fund enters into a closing purchase transaction. The changes in value of the options written during the reporting period are recognized as a component of “Change in net unrealized appreciation (depreciation) of call options written” on the Statements of Operations. When an option is exercised or expires or the Fund enters into a closing purchase transaction, the difference between the net premium received and any amount paid at expiration or on executing a closing purchase transaction is recognized as a component of “Net realized gain (loss) from call options written” on the Statements of Operations. The Fund, as writer of an option, has no control over whether the underlying instrument may be sold (called) and as a result bears the risk of an unfavorable change in the market value of the instrument underlying the written option. There is also the risk the Fund may not be able to enter into a closing transaction because of an illiquid market. During the fiscal years ended December 31, 2011 and December 31, 2010, the Fund wrote call options on futures contracts.
The purchase of options involves the risk of loss of all or part of the cash paid for the options (the premium). The market risk associated with purchasing options is limited to the premium paid. The counterparty credit risk of purchasing options, however, needs to take into account the current value of the option, as this is the performance expected from the counterparty. The Fund did not purchase options on futures or forward contracts during the fiscal years ended December 31, 2011 or December 31, 2010.
51
Table of Contents
NUVEEN DIVERSIFIED COMMODITY FUND
NOTES TO FINANCIAL STATEMENTS (Continued)
December 31, 2011
2. Summary of Significant Accounting Policies (Continued)
Transactions in call options written were as follows:
| Year Ended December 31, 2011 |
Year Ended December 31, 2010 |
|||||||||||||||
| Number of Contracts |
Premiums Received |
Number of Contracts |
Premiums Received |
|||||||||||||
| Outstanding, beginning of period |
1,813 | $ | 1,629,313 | — | $ | — | ||||||||||
| Options written |
13,702 | 10,798,390 | 4,670 | 3,227,880 | ||||||||||||
| Options terminated in closing purchase transactions |
(9,895 | ) | (8,022,605 | ) | (1,761 | ) | (975,129 | ) | ||||||||
| Options expired |
(3,963 | ) | (2,977,051 | ) | (1,096 | ) | (623,438 | ) | ||||||||
|
|
|
|
|
|
|
|
|
|||||||||
| Outstanding, end of the period |
1,657 | $ | 1,428,047 | 1,813 | $ | 1,629,313 | ||||||||||
|
|
|
|
|
|
|
|
|
|||||||||
The average number of outstanding call option contracts written during the fiscal year ended December 31, 2011, was 1,712. The average number of outstanding call option contracts written during the period October 1, 2010 (date on which the Fund began entering into options contracts) through December 31, 2010, was 907.
Refer to Footnote 3 – Derivative Instruments and Hedging Activities for further details on options activity.
Forward Contracts
The Fund may enter into forward contracts. A forward contract is an agreement between two parties to purchase or sell a specified quantity of a commodity at or before a specified date in the future at a specified price. Forward contracts are typically traded in the over-the-counter (“OTC”) markets and all details of the contract are negotiated between the counterparties to the agreement. Accordingly, the forward contracts are valued by reference to the contracts traded in the OTC markets.
The contractual obligations of a buyer or seller may generally be satisfied by taking or making physical delivery of the underlying commodity, establishing an opposite position in the contract and recognizing the profit or loss on both positions simultaneously on the delivery date or, in some instances, paying a cash settlement before the designated date of delivery. The forward contracts are adjusted by the daily fluctuation of the underlying commodity or currency and any gains or losses are recognized on the Statements of Operations as unrealized appreciation or depreciation until the contract settlement date.
Forward contracts are, in general, not cleared or guaranteed by a third party. The Fund may collateralize forward commodity contracts with cash and/or certain securities as indicated on its Statements of Financial Condition or Schedule of Investments, when applicable, and such collateral is held for the benefit of the counterparty in a segregated account at the custodian to protect the counterparty against non-payment by the Fund. In the event of a default by the counterparty, the Fund will seek return of this collateral and may incur certain costs exercising its right with respect to the collateral.
The Fund remains subject to credit risk with respect to the amount it expects to receive from counterparties, as those amounts are not similarly collateralized by the counterparty. If a counterparty becomes bankrupt or
52
Table of Contents
NUVEEN DIVERSIFIED COMMODITY FUND
NOTES TO FINANCIAL STATEMENTS (Continued)
December 31, 2011
2. Summary of Significant Accounting Policies (Continued)
otherwise fails to perform its obligations due to financial difficulties, the Fund may experience significant delays in obtaining any recovery in a bankruptcy or other reorganization proceeding. The Fund may obtain only limited recovery or may obtain no recovery in such circumstances.
Participants in trading foreign exchange forward contracts often do not require margin deposits, but rely upon internal credit limitations and their judgments regarding the creditworthiness of their counterparties.
The Fund will enter into forward contracts only with large, well-capitalized and well-established financial institutions. The creditworthiness of each of the firms, which is a party to a forward contract is monitored by the Manager. The Fund did not enter into any forward contracts during the fiscal years ended December 31, 2011 or December 31, 2010.
Collateral Investments
Currently, in the normal course of business, approximately 15% of the Fund’s assets are committed to secure the Fund’s futures and forward contract positions. These assets will be placed in a commodity futures account maintained by the Fund’s clearing broker, and will be held in cash or invested in U.S. Treasury bills and other direct or guaranteed debt obligations of the U.S. government maturing within less than one year at the time of investment.
The remaining assets are held in a separate collateral investment account managed by the Collateral Sub-advisor. The Fund’s assets held in the separate collateral account are invested in cash equivalents or short-term debt securities with final terms not exceeding one year at the time of investment. These collateral investments are rated at the applicable highest short-term or long-term debt or deposit rating or money market fund rating as determined by at least one nationally recognized statistical rating organization (“NRSRO”), or if unrated, are judged by the Collateral Sub-advisor to be of comparable quality.
Fair Value Measurements
Fair value is defined as the price that the Fund would receive upon selling an investment or transferring a liability in an orderly transaction to an independent buyer in the principal or most advantageous market for the investment. A three-tier hierarchy is used to maximize the use of observable market data and minimize the use of unobservable inputs and to establish classification of fair value measurements for disclosure purposes. Observable inputs reflect the assumptions market participants would use in pricing the asset or liability. Observable inputs are based on market data obtained from sources independent of the reporting entity. Unobservable inputs reflect the reporting entity’s own assumptions about the assumptions market participants would use in pricing the asset or liability. Unobservable inputs are based on the best information available in the circumstances. The three-tier hierarchy of inputs is summarized in the three broad levels listed below:
Level 1—Quoted prices in active markets for identical securities.
Level 2—Other significant observable inputs (including quoted prices for similar securities, interest rates, prepayment speeds, credit risk, etc.).
Level 3—Significant unobservable inputs (including management’s assumptions in determining the fair value of investments).
53
Table of Contents
NUVEEN DIVERSIFIED COMMODITY FUND
NOTES TO FINANCIAL STATEMENTS (Continued)
December 31, 2011
2. Summary of Significant Accounting Policies (Continued)
The inputs or methodologies used for valuing securities are not an indication of the risk associated with investing in those securities. The following is a summary of the Fund’s fair value measurements as of December 31, 2011 and December 31, 2010:
| December 31, 2011 | ||||||||||||||||
| Level 1 | Level 2 | Level 3 | Total | |||||||||||||
| Investments: |
||||||||||||||||
| Short-Term Investments |
$ | — | $ | 175,626,953 | $ | — | $ | 175,626,953 | ||||||||
| Derivatives: |
||||||||||||||||
| Futures Contracts* |
(4,921,830 | ) | — | — | (4,921,830 | ) | ||||||||||
| Call Options Written** |
(548,427 | ) | (3,030 | ) | — | (551,457 | ) | |||||||||
|
|
|
|
|
|
|
|
|
|||||||||
| Total |
$ | (5,470,257 | ) | $ | 175,623,923 | $ | — | $ | 170,153,666 | |||||||
|
|
|
|
|
|
|
|
|
|||||||||
| December 31, 2010 | ||||||||||||||||
| Level 1 | Level 2 | Level 3 | Total | |||||||||||||
| Investments: |
||||||||||||||||
| Short-Term Investments |
$ | — | $ | 182,158,211 | $ | — | $ | 182,158,211 | ||||||||
| Derivatives: |
||||||||||||||||
| Futures Contracts* |
18,854,639 | — | — | 18,854,639 | ||||||||||||
| Call Options Written |
(2,903,405 | ) | (590,900 | ) | — | (3,494,305 | ) | |||||||||
|
|
|
|
|
|
|
|
|
|||||||||
| Total |
$ | 15,951,234 | $ | 181,567,311 | $ | — | $ | 197,518,545 | ||||||||
|
|
|
|
|
|
|
|
|
|||||||||
| * | Represents net unrealized appreciation (depreciation) as reported in the Schedule of Investments. |
| ** | Refer to the Schedule of Investments for breakdown of Call Options Written classified as Level 2. |
During the fiscal years ended December 31, 2011 and December 31, 2010, the Fund recognized no significant transfers to or from Level 1, Level 2 or Level 3.
Investment Valuation
Commodity futures and forward contracts and options on commodity futures and forward contracts traded on an exchange will be valued at the final settlement price or official closing price as determined by the principal exchange on which the instruments are traded as supplied by independent pricing services. These securities are generally classified as Level 1 for fair value measurement purposes. OTC commodity futures and forward contracts and options on commodity futures and forward contracts not traded on an exchange will be valued, in order of hierarchy, by independent pricing services, price quotations obtained from counterparty broker-dealers, or through fair valuation methodologies as determined by the Manager. These securities are generally classified as Level 2.
Market quotations for exchange-traded commodity futures and forward contracts and options on commodity futures and forward contracts may not be readily available as a result of significant events, which can include, but are not limited to: trading halts or suspensions, market disruptions, or the absence of market makers willing to make a market in such instruments. In addition, events may occur after the close of the market, but prior to the determination of the Fund’s net asset value, that may affect the values of the Fund’s investments. In such circumstances, the Manager will determine a fair valuation for such investments that in its opinion is reflective of fair market value. These securities are generally classified as Level 2 or Level 3 depending on the priority of the significant inputs.
54
Table of Contents
NUVEEN DIVERSIFIED COMMODITY FUND
NOTES TO FINANCIAL STATEMENTS (Continued)
December 31, 2011
2. Summary of Significant Accounting Policies (Continued)
In the event the Fund utilizes independent pricing services to value any of its commodity futures and forward contracts, options on commodity futures and forward contracts and OTC commodity options, the pricing services typically will value such commodity futures and forward contracts, options on commodity futures and forward contracts and OTC commodity options using a range of market data and other information and analysis, including reference to transactions in other comparable investments, if available. The procedures of any independent pricing service provider will be reviewed by the Manager on a periodic basis.
Prices of fixed-income securities, including highly rated zero coupon fixed-income securities, like U.S. Treasury Bills, issued with maturities of one year or less, are provided by a pricing service approved by the Fund’s Manager. These securities are generally classified as Level 2. When price quotes are not readily available, the pricing service establishes a security’s fair value using methods that may include consideration of the following: yields or prices of investments of comparable quality, type of issue, coupon, maturity and rating, market quotes or indications of value from security dealers, evaluations of anticipated cash flows or collateral, general market conditions and other information and analysis, including the obligor’s credit characteristics considered relevant. These securities are generally classified as Level 2 or Level 3 depending on the priority of the significant inputs.
Repurchase agreements are valued at contract amount plus accrued interest, which approximates market value. These securities are generally classified as Level 2.
Investment Transactions
Investment transactions are recorded on a trade date basis. Realized gains and losses from investment transactions are determined on the specific identification method, which is the same for federal income tax purposes.
Investment Income
Interest income, which reflects the amortization of premiums and includes accretion of discount for financial reporting purposes, is recorded on an accrual basis.
Brokerage Commissions and Fees
The Fund pays its respective brokerage commissions, including applicable clearing costs, exchange fees, NFA fees, give-up fees, pit brokerage fees and other transaction-related fees and expenses charged in connection with trading activities for the Fund’s investment in CFTC regulated investments.
Income Taxes
No provision for federal, state, and local income taxes has been made in the accompanying financial statements because the Fund has elected to be classified as a partnership for U.S. federal income tax purposes. Each owner of the Fund’s shares will be required to take into account its allocable share of the Fund’s income, gains, losses, deductions and other items for the Fund’s taxable year.
55
Table of Contents
NUVEEN DIVERSIFIED COMMODITY FUND
NOTES TO FINANCIAL STATEMENTS (Continued)
December 31, 2011
2. Summary of Significant Accounting Policies (Continued)
For all open tax years and all major taxing jurisdictions, the Manager of the Fund has concluded that there are no significant uncertain tax positions that would require recognition in the financial statements. Open tax years are those that are open for examination by taxing authorities (i.e., generally the last four tax year ends and the interim tax period since then). Furthermore, the Manager of the Fund is also not aware of any tax positions for which it is reasonably possible that the total amounts of unrecognized tax benefits will significantly change in the next twelve months.
Management Fees
For the services and facilities provided by the Manager, the Fund has agreed to pay the Manager an annual management fee, payable monthly, based on the Fund’s average daily net assets, according to the following schedule:
| Average Daily Net Assets |
Management Fee | |||
| Up to $500 million |
1.250 | % | ||
| $500 million to $1 billion |
1.225 | % | ||
| $1 billion to $1.5 billion |
1.200 | % | ||
| $1.5 billion to $2 billion |
1.175 | % | ||
| $2 billion and over |
1.150 | % | ||
“Average daily net assets” means the total assets of the Fund, minus the sum of its total liabilities.
The Manager and the Fund have entered into sub-advisory agreements with the Commodity Sub-advisor and the Collateral Sub-advisor. Both the Commodity Sub-advisor and Collateral Sub-advisor (collectively, the “Sub-advisors”) are compensated for their services to the Fund from the management fees paid to the Manager.
Expense Recognition
All expenses of the Fund are recognized on an accrual basis. The Fund pays all routine and extraordinary costs and expenses of its operations, brokerage expenses, custody fees, transfer agent expenses, professional fees, expenses of preparing, printing and distributing reports, notices, information statements, proxy statements, reports to governmental agencies, and taxes, if any.
Custodian Fee Credit
The Fund has an arrangement with its custodian bank, State Street Bank and Trust Company, whereby certain custodian fees and expenses are reduced by net credits earned on the Fund’s cash on deposit. Such deposit arrangements are an alternative to overnight investments. Credits for cash balances may be offset by charges for any days on which the Fund overdraws its account at the custodian bank.
Organization Expenses and Offering Costs
In connection with the Fund’s initial public offering, Nuveen Securities, LLC (i) reimbursed all organization expenses of the Fund and (ii) paid all offering costs (other than underwriting commissions) that exceeded $.05 per share. The Fund’s share of offering costs was recorded as a reduction of the proceeds from the sale of shares.
56
Table of Contents
NUVEEN DIVERSIFIED COMMODITY FUND
NOTES TO FINANCIAL STATEMENTS (Continued)
December 31, 2011
2. Summary of Significant Accounting Policies (Continued)
Calculation of Net Asset Value
The net asset value per share of the Fund on any given day is computed by dividing the value of all assets of the Fund (including any accrued interest), less all liabilities (including accrued expenses and distributions declared but unpaid), by the total number of shares outstanding.
Distributions
The Fund intends to make regular monthly distributions to its shareholders (stated in terms of a fixed cents per share distribution rate) based on the past and projected performance of the Fund. Among other factors, the Fund seeks to establish a distribution rate that roughly corresponds to the Manager’s projections of the total return that could reasonably be expected to be generated by the Fund over an extended period of time. Each monthly distribution is not solely dependent on the amount of income earned or capital gains realized by the Fund, and such distributions may from time to time represent a return of capital and may require that the Fund liquidate investments. As market conditions and portfolio performance may change, the rate of distribution on the shares and the Fund’s distribution policy could change. The Fund reserves the right to change its distribution policy and the basis for establishing the rate of its monthly distributions, or may temporarily suspend or reduce distributions without a change in policy, at any time and may do so without prior notice to shareholders.
Distributions to shareholders are recorded on the ex-dividend date.
Commitments and Contingencies
Under the Fund’s organizational documents, the Manager, Wilmington Trust Company (the Fund’s Delaware trustee) and the individual trustees are indemnified against certain liabilities arising out of the performance of their duties to the Fund. In addition, in the normal course of business, the Fund enters into contracts that provide general indemnifications to other parties. The Fund’s maximum exposure under these arrangements is unknown, as this would involve future claims that may be made against the Fund that have not yet occurred. However, the Fund has not had prior claims or losses pursuant to these contracts and expects the risk of loss to be immaterial.
Financial Instrument Risk
In the normal course of its business, the Fund is party to financial instruments with off-balance sheet risk. The term “off-balance sheet risk” refers to an unrecorded potential liability that, even though it does not appear on the Statements of Financial Condition, may result in a future obligation or loss. The financial instruments used by the Fund are commodity futures and options, whose values are based upon an underlying asset and generally represent future commitments that have a reasonable possibility of being settled in cash or through physical delivery. As of December 31, 2011 and December 31, 2010, the financial instruments held by the Fund are traded on an exchange and are standardized contracts.
Market risk is the potential for changes in the value of the financial instruments traded by the Fund due to market changes, including fluctuations in commodity prices. In entering into futures contracts, there exists a market risk that such futures contracts may be significantly influenced by adverse market conditions, resulting in such futures contracts being less valuable. If the markets should move against all of the futures contracts at the same time, the Fund could experience substantial losses.
57
Table of Contents
NUVEEN DIVERSIFIED COMMODITY FUND
NOTES TO FINANCIAL STATEMENTS (Continued)
December 31, 2011
2. Summary of Significant Accounting Policies (Continued)
Credit risk is the possibility that a loss may occur due to failure of a counterparty to perform according to the terms of the forwards, futures and option contracts. Credit risk with respect to exchange-traded instruments is reduced to the extent that an exchange or clearing organization acts as a counterparty to the transactions. The Fund’s risk of loss in the event of counterparty default is typically limited to the amounts recognized on the Statements of Financial Condition and not represented by the contract or notional amounts of the instruments.
3. Derivative Instruments and Hedging Activities
The Fund records derivative instruments at fair value, with changes in fair value recognized on the Statements of Operations, when applicable. For additional information on the derivative instruments in which the Fund invested during and at the end of the reporting period, refer to the Schedule of Investments and Footnote 2 – Summary of Significant Accounting Policies.
The following tables present the fair value of all derivative instruments held by the Fund, the location of these instruments on the Statements of Financial Condition and the primary underlying risk exposure.
| Year Ended December 31, 2011 Location on the Statements of Financial Condition |
||||||||||||||
| Underlying Risk Exposure |
Derivative Instrument |
Asset Derivatives |
Liability Derivatives |
|||||||||||
| Location | Value | Location | Value | |||||||||||
|
|
||||||||||||||
| Commodity |
Futures Contracts | Unrealized depreciation on futures contracts, net* | $ |
2,849,485 |
|
Unrealized depreciation on futures contracts, net* | $ | 7,771,315 | ||||||
| Commodity |
Options | — | — | Call options written, at value | 551,457 | |||||||||
| Total |
$ | 2,849,485 | $ | 8,322,772 | ||||||||||
| Year Ended December 31, 2010 Location on the Statements of Financial Condition |
||||||||||||||
| Underlying Risk Exposure |
Derivative Instrument |
Asset Derivatives |
Liability Derivatives |
|||||||||||
| Location | Value | Location | Value | |||||||||||
|
|
||||||||||||||
| Commodity |
Futures Contracts | Unrealized appreciation on futures contracts, net* | $ |
19,281,313 |
|
Unrealized appreciation on futures contracts, net* | $ | 426,674 | ||||||
| Commodity |
Options | — | — | Call options written, at value | 3,494,305 | |||||||||
| Total |
$ | 19,281,313 | $ | 3,920,979 | ||||||||||
| * | Value represents cumulative gross unrealized appreciation (depreciation) of futures contracts as reported in the Schedule of Investments and not the “Deposits with brokers” or the “Unrealized appreciation (depreciation) on futures contracts, net” as presented on the Statements of Financial Condition. |
58
Table of Contents
NUVEEN DIVERSIFIED COMMODITY FUND
NOTES TO FINANCIAL STATEMENTS (Continued)
December 31, 2011
3. Derivative Instruments and Hedging Activities (Continued)
The following table presents the amount of net realized gain (loss) and change in net unrealized appreciation (depreciation) recognized on derivative instruments and the primary underlying risk exposure.
| Commodity Risk Exposure | Year Ended December 31, 2011 |
Year Ended December 30, 2010 |
||||||
| Net Realized Gain (Loss) from: |
||||||||
| Futures Contracts Options Written |
$
|
(2,120,418 10,035,572 |
)
|
$
|
13,688,473 1,480,208 |
| ||
| Change in Net Unrealized Appreciation (Depreciation) of: |
||||||||
| Futures Contracts Options Written |
$
|
(23,776,469 2,741,582 |
)
|
$
|
18,854,639 (1,864,992 |
) | ||
4. Related Parties
The Manager, the Commodity Sub-advisor, as of December 31, 2011, the Collateral Sub-advisor and Nuveen Securities, LLC are considered to be related parties to the Fund.
5. Share Repurchase Program
On December 21, 2011, the Fund approved an open-market share repurchase program allowing the Fund to repurchase an aggregate of up to 10% of its outstanding common shares (approximately 920,000 shares) in open-market transactions at the Manager’s discretion.
Transactions in share repurchases were as follows:
| Year Ended December 31, 2011 |
Year Ended December 31, 2010 |
|||||||
| Shares repurchased |
(38,000 | ) | — | |||||
|
|
|
|
|
|||||
| Weighted average price per share repurchased |
$ | 19.68 | — | |||||
|
|
|
|
|
|||||
59
Table of Contents
NUVEEN DIVERSIFIED COMMODITY FUND
NOTES TO FINANCIAL STATEMENTS (Continued)
December 31, 2011
6. Financial Highlights
The following financial highlights relate to investment performance and operations for a Fund share outstanding during the fiscal year ended December 31, 2011 and the fiscal year ended December 31, 2010. The financial highlights for the fiscal year ended December 31, 2010, reflect only the ninety-six days of the Fund’s operations (from its commencement of operations on September 27, 2010 to December 31, 2010). The Net Asset Value presentation is calculated using average daily shares outstanding. The Ratios to Average Net Assets are calculated using average daily net assets and have been annualized for periods less than a full fiscal year. The Total Returns at Net Asset Value and Market Value are based on the change in net asset value and market value, respectively, for a share during the period. An investor’s return and ratios will vary based on the timing of purchasing and selling Fund shares.
| Year
Ended December 31, 2011 |
September 27,
2010 to December 31, 2010 |
|||||||
| Net Asset Value: |
||||||||
| Net asset value per share—beginning of period(a) |
$ | 26.74 | $ | 23.88 | ||||
| Net investment income (loss) |
|
(0.39 |
) |
(0.13 | ) | |||
| Net realized and unrealized gain (loss) |
(1.40 | ) | 3.48 | |||||
| Distributions |
(1.74 | ) | (0.44 | ) | ||||
| Offering costs |
|
— |
|
(0.05 | ) | |||
|
|
|
|
|
|||||
| Net asset value per share—end of period |
|
23.21 |
|
$ | 26.74 | |||
|
|
|
|
|
|||||
| Market Value: |
||||||||
| Market value per share—beginning of period(b) |
$ | 25.80 | $ | 25.00 | ||||
|
|
|
|
|
|||||
| Market value per share—end of period |
$ | 20.30 | $ | 25.80 | ||||
|
|
|
|
|
|||||
| Ratios to Average Net Assets:(c) |
||||||||
| Net investment income (loss) |
|
(1.50 |
)% |
(1.99 | )% | |||
|
|
|
|
|
|||||
| Expenses |
|
1.63 |
% |
2.13 | % | |||
|
|
|
|
|
|||||
| Total Returns:(d) |
||||||||
| Based on Net Asset Value |
|
(7.16 |
)% |
13.92 | % | |||
|
|
|
|
|
|||||
| Based on Market Value |
|
(15.59 |
)% |
4.99 | % | |||
|
|
|
|
|
|||||
| (a) | Represents initial offering proceeds per share before offering costs for the period September 27, 2010 to December 31, 2010. The Fund did not have a Net Asset Value per share prior to its initial offering and commencement of operations on September 27, 2010. |
| (b) | The Fund did not have a Market Value per share prior to its initial offering and commencement of operations on September 27, 2010. |
| (c) | Annualized for the period September 27, 2010 to December 31, 2010. |
| (d) | Total Return Based on Net Asset Value is the combination of changes in net asset value per share and the assumed reinvestment of distributions, if any, at net asset value per share on the distribution payment date. The last distribution declared in the period, which is typically paid on the first business day of the following month, is assumed to be reinvested at the net asset value per share at the end of the period. Total returns are not annualized. |
60
Table of Contents
NUVEEN DIVERSIFIED COMMODITY FUND
NOTES TO FINANCIAL STATEMENTS (Continued)
December 31, 2011
6. Financial Highlights (Continued)
Total Return Based on Market Value is the combination of changes in the market price per share and the assumed reinvestment of distributions, if any, at the ending market price per share on the distribution payment date. The last distribution declared in the period, which is typically paid on the first business day of the following month, is assumed to be reinvested at the ending market price per share at the end of the period. Total returns are not annualized.
7. New Accounting Pronouncements
Financial Accounting Standards Board (“FASB”) Transfers and Servicing (Topic 860): Reconsideration of Effective Control for Repurchase Agreements
On April 15, 2011, the FASB issued Accounting Standards Update (“ASU”) No. 2011-03 (“ASU No. 2011-03”). The guidance in ASU No. 2011-03 is intended to improve the accounting for repurchase agreements and other similar agreements. Specifically, ASU No. 2011-03 modifies the criteria for determining when these transactions would be accounted for as financing transactions (secured borrowings/lending agreements) as opposed to sale (purchase) transactions with commitments to repurchase (resell). The effective date of ASU No. 2011-03 is for interim and annual periods beginning on or after December 15, 2011. At this time, management is evaluating the implications of this guidance and the impact it will have to the financial statement amounts and footnote disclosures, if any.
Fair Value Measurements and Disclosures
On May 12, 2011, the FASB issued ASU No. 2011-04 modifying Topic 820, Fair Value Measurements and Disclosures. At the same time, the International Accounting Standards Board (“IASB”) issued International Financial Reporting Standard (“IFRS”) 13, Fair Value Measurement. The objective of the FASB and IASB is convergence of their guidance on fair value measurements and disclosures. Specifically, ASU No. 2011-04 requires reporting entities to disclose i) the amounts of any transfers between Level 1 and Level 2 and the reasons for the transfers and ii) for Level 3 fair value measurements, a) quantitative information about significant unobservable inputs used, b) a description of the valuation processes used by the reporting entity and c) a narrative description of the sensitivity of the fair value measurement to changes in unobservable inputs if a change in those inputs might result in a significantly higher or lower fair value measurement. The effective date of ASU No. 2011-04 is for interim and annual periods beginning after December 15, 2011. At this time, management is evaluating the implications of this guidance and the impact it will have on the financial statement amounts and footnote disclosures, if any.
61
Table of Contents
Item 9. Changes in and Disagreements with Accountants on Accounting and Financial Disclosure
None.
Item 9A. Controls and Procedures
Disclosure Controls and Procedures
Under the supervision and with the participation of the principal executive officer and principal financial officer of the Manager of the Fund, the Manager has evaluated the effectiveness of the Fund’s disclosure controls and procedures pursuant to Rules 13a-15(e) and 15d-15(e) under the Exchange Act. Based upon that evaluation, the principal executive officer and principal financial officer concluded that the Fund’s disclosure controls and procedures were effective as of the end of the period covered by this Annual Report to provide reasonable assurance that information required to be disclosed in the reports that the Fund files or submits to the SEC under the Exchange Act is recorded, processed, summarized and reported, within the time periods specified in the applicable rules and forms, and that it is accumulated and communicated to the management of the Manager as appropriate to allow timely decisions regarding required disclosure.
Management’s Annual Report on Internal Control Over Financial Reporting
The Manager is responsible for establishing and maintaining adequate internal control over financial reporting, as defined under Rules 13a-15(f) and 15d-15(f) of the Exchange Act, for the Fund. The Fund’s internal control over financial reporting is a process designed to provide reasonable assurance regarding the reliability of financial reporting and the preparation of financial statements for external purposes in accordance with accounting principles generally accepted in the United States of America. Internal control over financial reporting includes those policies and procedures that: (1) pertain to the maintenance of records that, in reasonable detail, accurately and fairly reflect the transactions and dispositions of the Fund’s assets; (2) provide reasonable assurance that transactions are recorded as necessary to permit preparation of financial statements in accordance with generally accepted accounting principles in the United States of America, and that the Fund’s receipts and expenditures are being made only in accordance with appropriate authorizations; and (3) provide reasonable assurance regarding prevention or timely detection of unauthorized acquisition, use, or dispositions of the Fund’s assets that could have a material effect on the financial statements.
Because of its inherent limitations, internal control over financial reporting may not prevent or detect misstatements, errors, or fraud. Also, projections of any evaluation of effectiveness to future periods are subject to the risk that controls may become ineffective because of changes in conditions, or that the degree of compliance with the policies or procedures may deteriorate.
The principal executive officer and principal financial officer of the Manager assessed the effectiveness of the Fund’s internal control over financial reporting as of December 31, 2011. Their assessment included an evaluation of the design of the Fund’s internal control over financial reporting and testing of the operational effectiveness of their internal control over financial reporting. In making its assessment, the Manager has utilized the criteria set forth by the Committee of Sponsoring Organizations of the Treadway Commission (COSO) in its report entitled Internal Control – Integrated Framework. Based on their assessment and those criteria, the principal executive officer and principal financial officer of the Manager concluded that the Fund maintained effective internal control over financial reporting as of December 31, 2011.
The effectiveness of the Fund’s internal control over financial reporting as of December 31, 2011, has been audited by PricewaterhouseCoopers LLP, the independent registered public accounting firm that audited and reported on the financial statements included in this Annual Report, as stated in their reports which are included herein.
62
Table of Contents
Changes in Internal Control over Financial Reporting
There were no changes in the Fund’s internal control over financial reporting (as defined in the Rules 13a-15(f) and 15d-15(f) of the Exchange Act) that occurred during the reporting period covered by this Annual Report that has materially affected, or is reasonably likely to materially affect, the Fund’s internal control over financial reporting.
None.
63
Table of Contents
PART III
Item 10. Directors, Executive Officers and Corporate Governance
The Fund has no executive officers and does not have any employees. The Fund is managed by the Manager and depends upon the Manager’s services and resources. The Delaware Trustee and the individual trustees have limited duties and responsibilities to the Fund, as described below.
Trustees
Wilmington Trust Company, a Delaware banking corporation, is the Delaware Trustee of the Fund. The Delaware Trustee is unaffiliated with the Manager. The Delaware Trustee’s duties and responsibilities with respect to the Fund’s management are limited to its express obligations under the Trust Agreement. In particular, the Delaware Trustee will accept service of legal process on the Fund in the State of Delaware and will make certain filings as required under the Delaware Statutory Trust Act, as amended. The rights and duties of the Delaware Trustee, the individual trustees, the Manager and the shareholders are governed by the provisions of the Delaware Statutory Trust Act and by the Trust Agreement. Except for the limited duties described herein and in the Trust Agreement, that are exercised by the Delaware Trustee and the individual trustees, all duties and responsibilities to manage the business and affairs of the Fund are vested in the Manager, pursuant to the Trust Agreement and the Delaware Statutory Trust Act.
The individual trustees, all of whom are unaffiliated with the Manager, make up the audit committee and nominating committee of the Fund and meet the independent director requirements established by the NYSE Amex and the Sarbanes-Oxley Act of 2002, as amended. The individual trustees serve as the board of the Fund.
The persons listed below have been appointed by the Manager as individual trustees of the Fund. The names of the individual trustees of the Fund, their principal occupations and other affiliations during the past five years, and other directorships they hold are set forth below. The individual trustees of the Fund are each directors or trustees, as the case may be, of 108 Nuveen-sponsored open-end funds (the “Nuveen Mutual Funds”) and 133 Nuveen-sponsored closed-end funds (collectively with the Nuveen Mutual Funds, the “Nuveen Funds”) as of December 31, 2011. The information listed below for each individual trustee includes the experiences, qualifications, attributes and skills that led to the conclusion that each individual trustee should serve as a trustee of the Fund.
Robert P. Bremner. Mr. Bremner (age 71) has been a private investor and management consultant in Washington, D.C. since 1997. His biography of William McChesney Martin, Jr., a former chairman of the Federal Reserve Board, was published by Yale University Press in November 2004. From 1994 to 1997, he was a Senior Vice President at Samuels International Associates, an international consulting firm specializing in governmental policies, where he served in a part-time capacity. Previously, Mr. Bremner was a partner in the LBK Investors Partnership and was chairman and majority stockholder of ITC Investors Inc., both private investment firms. He currently serves on the Board and as Treasurer of the Humanities Council of Washington D.C. and also serves on the Board of the Independent Directors Council affiliated with the Investment Company Institute. From 1984 to 1996, Mr. Bremner was an independent Trustee of the Flagship Funds, a group of municipal open-end funds. He began his career at the World Bank in Washington D.C. He graduated with a Bachelor of Science degree from Yale University and received his MBA from Harvard University.
David J. Kundert. Mr. Kundert (age 69) retired in 2004 as Chairman of JPMorgan Fleming Asset Management, and as President and CEO of Banc One Investment Advisors Corporation, and as President of One Group Mutual Funds. Prior to the merger between Bank One Corporation and JPMorgan Chase and Co., he was Executive Vice President, Bank One Corporation and, since 1995, the Chairman and CEO, Banc One Investment Management Group. From 1988 to 1992, he was President and CEO of Bank One Wisconsin Trust Company. Currently, Mr. Kundert is a Director of the Northwestern Mutual Wealth Management Company. He started his career as an
64
Table of Contents
attorney for Northwestern Mutual Life Insurance Company. Mr. Kundert has served on the Board of Governors of the Investment Company Institute and he is currently a member of the Wisconsin Bar Association. He is on the Board of the Greater Milwaukee Foundation and chairs its Investment Committee. He received his Bachelor of Arts degree from Luther College, and his Juris Doctor from Valparaiso University.
William J. Schneider. Mr. Schneider (age 67) is currently Chairman, formerly Senior Partner and Chief Operating Officer (retired, December 2004) of Miller-Valentine Partners Ltd., a real estate investment company. He is a Director and Past Chair of the Dayton Development Coalition. He was formerly a member of the Community Advisory Board of the National City Bank in Dayton as well as a former member of the Business Advisory Council of the Cleveland Federal Reserve Bank. Mr. Schneider is a member of the Business Advisory Council for the University of Dayton College of Business. Mr. Schneider was an independent Trustee of the Flagship Funds, a group of municipal open-end funds. He also served as Chair of the Miami Valley Hospital and as Chair of the Finance Committee of its parent holding company. Mr. Schneider has a Bachelor of Science in Community Planning from the University of Cincinnati and a Masters of Public Administration from the University of Dayton.
Carole E. Stone. Ms. Stone (age 64) retired from the New York State Division of the Budget in 2004, having served as its Director for nearly five years and as Deputy Director from 1995 through 1999. Ms. Stone is currently on the Board of Directors of the Chicago Board Options Exchange, CBOE Holdings, Inc. and C2 Options Exchange, Incorporated. She has also served as the Chair of the New York Racing Association Oversight Board, as Chair of the Public Authorities Control Board, a Commissioner on the New York State Commission on Public Authority Reform, and as a member of the Boards of Directors of several New York State public authorities. Ms. Stone has a Bachelor of Arts from Skidmore College in Business Administration.
Terence J. Toth. Mr. Toth (age 52) is a Director, Legal & General Investment Management America, Inc. (since 2008) and a Managing Partner, Promus Capital (since 2008). From 2004 to 2007, he was Chief Executive Officer and President of Northern Trust Global Investments, and Executive Vice President of Quantitative Management & Securities Lending from 2000 to 2004. He also formerly served on the Board of the Northern Trust Mutual Funds from 2005 to 2007. He joined Northern Trust in 1994 after serving as Managing Director and Head of Global Securities Lending at Bankers Trust (1986 to 1994) and Head of Government Trading and Cash Collateral Investment at Northern Trust from 1982 to 1986. He currently serves on the Boards of the Goodman Theatre, Chicago Fellowship, and University of Illinois Leadership Council, and was Chairman of the Board of Catalyst Schools of Chicago. Mr. Toth graduated with a Bachelor of Science degree from the University of Illinois, and received his MBA from New York University. In 2005, he graduated from the CEO Perspectives Program at Northwestern University.
The board of the Fund has the right under limited circumstances to terminate the Manager only for cause. The audit committee is responsible for the appointment, compensation, retention and oversight of the work of the independent registered public accounting firm engaged by the Fund. The nominating committee is responsible for appointing individual trustees in the event of any vacancy caused by death, resignation or removal and determining their compensation. In addition to the responsibilities mandated by the NYSE Amex, the individual trustees have the limited authority and responsibilities as set forth under the Trust Agreement.
The board of the Fund has determined that the Fund has at least one “audit committee financial expert” (as defined in Item 407(d)(5) of Regulation S-K) serving on its audit committee. The registrant’s audit committee financial expert is Ms. Stone, who meets the independent director requirements established by the NYSE Amex.
Manager
NCAM is the manager of the Fund, and is responsible for determining the Fund’s overall investment strategy and its implementation, including:
| • | the selection and ongoing monitoring of: |
| (a) | the Commodity Sub-advisor, which invests the Fund’s assets pursuant to TAP PLUSSM ; and |
| (b) | the Collateral Sub-advisor, which invests the Fund’s collateral in short-term, high grade debt securities; |
65
Table of Contents
| • | assessment of performance and potential needs to modify strategy or change sub-advisors; |
| • | the management of the Fund’s business affairs; and |
| • | the provision of certain clerical, bookkeeping and other administrative services for the Fund. |
The Manager may change, or temporarily deviate from, the Fund’s investment strategy and the manner in which the strategy is implemented if the Manager determines that it is in the best interests of Fund shareholders to do so based on existing market conditions or otherwise. In addition, the Manager has the rights and obligations with respect to the Fund as described in the Trust Agreement.
The Manager is a wholly-owned subsidiary of Nuveen, a Delaware corporation. Founded in 1898, Nuveen and its affiliates had approximately $220 billion of assets under management as of December 31, 2011. Nuveen is a listed principal of the Manager.
The Manager is registered with the CFTC as a CTA (effective date of registration January 4, 2006) and as a CPO (effective date of registration January 4, 2006) and is a member of the NFA. Except to the extent carried out by the Fund’s independent audit committee, the Manager has complete responsibility to ensure that the Fund complies with all obligations under the CEA.
The persons listed below serve as executive officers of the Manager. The names, positions and tenure with the Manager and its affiliates are included below.
William Adams IV (age 56) has served as President and principal executive officer of NCAM since August 30, 2011. He is the head of product development, managing product design and development of financial products that provide exposure to commodities and monitoring trends that indicate the need for new commodity products and services. Prior to August 30, 2011, Mr. Adams was a Managing Director of NCAM. Mr. Adams is also Executive Vice President, Global Structured Products of Nuveen since December 1999 where he is responsible for Nuveen’s closed-end fund business including the development and launch of new closed-end funds, and he is Co-President of Nuveen Fund Advisors, Inc. since January 2011. Prior thereto, Mr. Adams was Managing Director of Structured Investments effective September 1997 where he headed Nuveen’s closed-end fund and unit investment trust business units, and Vice President and Manager of Corporate Marketing effective August 1994 where he was responsible for the distribution of Nuveen’s investment products, including overseeing all sales and marketing activities. Mr. Adams was listed as a principal and registered as an associated person of the Manager on July 13, 2010.
Gifford R. Zimmerman (age 55), has served as Chief Administrative Officer and Chief Compliance Officer of NCAM since August 2006. He is responsible for adopting and implementing a compliance program and internal controls to ensure NCAM’s compliance with applicable regulatory requirements. Prior to August 30, 2011, Mr Zimmerman served as principal executive officer of NCAM. Mr. Zimmerman has been with Nuveen since May 1988. He is a Managing Director (since January 2002), Assistant Secretary and Associate General Counsel of Nuveen. Prior thereto, Mr. Zimmerman was a Vice President and Assistant General Counsel of Nuveen. Mr. Zimmerman also serves as a Managing Director (since May 2002), Co-General Counsel (since January 2011) and Assistant Secretary of Nuveen Fund Advisors, Inc. and Managing Director (since 2004) and Assistant Secretary of Nuveen Investments, Inc. and Nuveen Asset Management, LLC (since January 2011). Mr. Zimmerman’s duties for all three of these entities have included serving since January 1997 as the manager of the sub-unit of the Nuveen Legal Department that handles legal aspects of the Nuveen Fund family, as well as participating in the oversight of Fund operations, in Fund governance matters, and in product development activities. Mr. Zimmerman is a Chartered Financial Analyst charterholder. Mr. Zimmerman was listed as a principal and registered as an associated person of the Manager on August 30, 2006.
66
Table of Contents
Margo Cook (age 47) has been a Managing Director of NCAM since October 2011. Ms. Cook is the Head of Nuveen’s Investment Services, serving as the key liaison with Nuveen’s investment managers, including six asset management companies and seven sub-advisors. Ms. Cook’s responsibilities include investment oversight, valuation and risk management for all investment teams, as well as overseeing investment issues on behalf of Nuveen Fund Advisors, Inc. Ms. Cook is the chair of Nuveen Fund Advisors, Inc.’s Oversight Committee and a member of Nuveen’s Executive, Product Development, Operations and Valuation Committees. Ms. Cook is also responsible for the co-management of the Nuveen’s Institutional Sales effort, including the Consultant Relations, Taft Hartley and Client Service teams. Prior to joining Nuveen in October 2008, Ms. Cook served as Global Head of Bear Stearns Asset Management’s institutional asset management business, which included managing several equity and fixed income portfolio teams, and serving on the firm’s Executive and Management Committees. Prior to joining Bear Stearns in June 2007, Ms. Cook held a number of leadership roles, starting in September 1986, within The Bank of New York Mellon’s asset management business, including Chief Investment Officer and Head of Institutional Asset Management (2005-2007), Head of Institutional Fixed Income (1996-2005) and Senior Fixed Income Portfolio Manager (1988-1996). Ms. Cook is a Chartered Financial Analyst charterholder. Ms. Cook was listed as a principal of the manager on October 18, 2011.
Carl M. Katerndahl (age 48) has been a Managing Director of NCAM since May 2010. Mr. Katerndahl is the head of sales, identifying potential customers and financial intermediaries for distribution of NCAM’s commodity products and services. Mr. Katerndahl has also been Executive Vice President, Co-Head of Distribution for Nuveen since December 2007, where he has been responsible for all sales and client service, including key accounts for the firm. Mr. Katerndahl was Managing Director and Head of the Private Client Group for Nuveen since July 2002. Prior thereto, Mr. Katerndahl was a Managing Director and Head of Sales for NWQ, a registered investment adviser acquired by Nuveen in August 2002. Mr. Katerndahl was listed as a principal and registered as an associated person of the Manager on July 13, 2010.
Stephen D. Foy (age 57) has served as Chief Financial Officer and Principal Financial Officer of NCAM since February 2010. Mr. Foy supervises the records and accounting systems of NCAM and the preparation of the Fund’s financial reports. Mr. Foy, a certified public accountant, is a Senior Vice President (since May 2010) and Funds Controller (since May 1998) of Nuveen. In his capacity as Funds Controller, Mr. Foy is responsible for overseeing the relationships and operations of the third party fund accountant and custodian for each of the registered investment companies sponsored by Nuveen. In addition, Mr. Foy is responsible for managing the fund administration activities of the funds including shareholder reporting and periodic regulatory filings, preparation of tax returns and performance of tax compliance, preparation of the fund expense budgets and maintenance of accrued expenses. Mr. Foy is also responsible for oversight of the accounting, custody and administration services provided by third parties to certain collective trusts and investment partnerships. Mr. Foy is responsible for maintaining the relationships with the independent accountants and the audit committee of the Boards of Directors/Trustees of the Nuveen family of funds. He is also a Vice President (since May 2005) of Nuveen Fund Advisors, Inc. Mr. Foy was listed as a principal of the Manager on May 19, 2010.
Code of Ethics
The Fund has no officers or employees and is managed by NCAM. NCAM has adopted as a code of ethics a Senior Financial Officer Code of Conduct, which is available on the Fund’s website at http://www.nuveen.com/CommodityInvestments under the “Literature” tab.
Section 16(a) Beneficial Ownership Reporting Compliance
Section 16(a) of the Exchange Act requires the Fund’s trustees, the Manager’s executive officers, the Sub-advisors’ portfolio managers and persons who own more than 10% of the Fund’s shares to file reports of their ownership and changes in ownership of the Fund’s shares with the SEC. Employees of the Manager prepare these reports for the trustees and personnel of the Manager and Sub-advisors who request it on the basis of information obtained from them. Based on information available to us during the fiscal year ended December 31, 2011, the Manager believes that all applicable Section 16(a) filing requirements were met.
67
Table of Contents
Item 11. Executive Compensation
The Fund has no officers or employees and is managed by the Manager. None of the officers of the Manager receive compensation from the Fund. The individual trustees, who serve as the board of the Fund, receive an annual retainer fee of $25,000 each as well as reimbursement for travel and out of pocket expenses.
For the services and facilities provided by the Manager, the Fund has agreed to pay the Manager an annual fee of 1.25%, payable monthly, based on its average daily net assets. “Average daily net assets” means the total assets of the Fund, minus the sum of its liabilities.
The Fund incurred $3,009,310 in management fees for the fiscal year ended December 31, 2011, of which $229,634 was still payable to the Manager at the end of the period.
Item 12. Security Ownership of Certain Beneficial Owners and Management and Related Stockholder Matters
The Fund has no securities authorized for issuance under equity compensation plans.
The following table sets forth information regarding the beneficial ownership of shares of the Fund as of January 31, 2012, by the Manager and its executive officers and the individual trustees of the Fund. The address of each beneficial owner is c/o Nuveen Investments, 333 W. Wacker Dr., Chicago, IL 60606.
| Name and Address of Beneficial Owner |
Amount
of Beneficial Ownership |
Percent of Class |
||||||||||
| Nuveen Commodities Asset Management, LLC |
840 | Shares | 0.01 | % | ||||||||
|
|
|
|
|
|||||||||
| C/O Nuveen Investments |
||||||||||||
| 333 West Wacker Drive, Suite 2900 |
||||||||||||
| Chicago, IL 60606 |
||||||||||||
| Individual Trustees |
||||||||||||
| Terence J. Toth |
800 | Shares | 0.01 | % | ||||||||
|
|
|
|
|
|||||||||
| Individual Trustees of the Fund as a group |
800 | Shares | 0.01 | % | ||||||||
|
|
|
|
|
|||||||||
Other than as set forth in the previous table, no executive officer of the Manager, portfolio manager or principal of the Sub-advisors or trustee of the Fund owned shares of the Fund as of January 31, 2012. As of that date, no person was known by the Manager to own beneficially more than 5% of the outstanding shares of the Fund.
Item 13. Certain Relationships and Related Transactions, and Director Independence
See “Item 11. Executive Compensation” of this Annual Report.
68
Table of Contents
Item 14. Principal Accounting Fees and Services
The following table sets forth the fees for professional services rendered by the Fund’s independent registered public accountant, PricewaterhouseCoopers LLP (“PwC”), for the fiscal years ended December 31, 2011 and December 31, 2010.
| 2011 | 2010 | |||||||
| Audit Fees |
$ | 99,200 | $ | 51,000 | ||||
| Audit-Related Fees |
- | - | ||||||
| Tax Fees |
190,000 | 313,000 | ||||||
| All Other Fees |
10,000 | - | ||||||
|
|
|
|
|
|||||
| Total |
$ | 299,200 | $ | 364,000 | ||||
|
|
|
|
|
|||||
Audit fees consist of fees paid to PwC for the audits of the Fund’s December 31, 2011 and December 31, 2010 annual financial statements included on Form 10-K, as well as the June 30, 2010 financial statements included in the Fund’s Registration Statement on Form S-1 (No. 333-130360). Audit fees also include fees paid to PwC for the review of the Fund’s Form 10-Qs and services normally provided by independent registered public accountants in connection with statutory and regulatory filings of registration statements. The 2011 audit fee also covers PwC’s audit over the Fund’s internal control over financial reporting.
Tax fees cover certain tax compliance and reporting services to the Fund, including processing beneficial ownership information as it relates to the preparation of tax reporting packages and the subsequent delivery of related information to Fund shareholders and the IRS. Services also include assistance with tax reporting and related information using a web-based tax package product developed by PwC and a toll-free package support help line.
Other fees paid to PwC consist of reviews performed over the Fund’s eXtensible Business Reporting Language reporting during the fiscal year.
The individual trustees serve as the audit committee of the Fund. The audit committee is responsible for the appointment, compensation, retention and oversight of the work of the independent registered public accountant, currently PwC. All of the services provided by PwC were approved by the audit committee.
None of the hours expended on PwC’s engagement to audit the Fund’s financial statements for the fiscal year ended December 31, 2011 were attributable to work performed by persons other than the principal accountant’s full-time, permanent employees.
69
Table of Contents
PART IV
Item 15. Exhibits and Financial Statement Schedules
(a)(1) Financial Statements
See “Item 8. Financial Statements and Supplementary Data” of this Annual Report.
(a)(2) Financial Statement Schedules
No financial statement schedules are filed herewith because (i) such schedules are not required or (ii) the information required has been presented in the aforementioned financial statements.
(a)(3) Exhibits
| 4.1 | Amended and Restated Trust Agreement of the Fund.(1) | |
| 10.1 | Commodity Sub-Advisory Agreement.(2) | |
| 10.2 | Collateral Sub-Advisory Agreement.(2) | |
| 10.3 | Custodian Agreement.(2) | |
| 10.4 | Shareholder Transfer Agency and Service Agreement.(2) | |
| 10.5 | Subscription Agreement.(3) | |
| 10.6 | Investment Management Agreement.(2) | |
| 10.7 | Futures and Options Customer Account Agreement.(2) | |
| 31.1 | Certification of Principal Executive Officer Pursuant to Rule 13a-14(a) or Rule 15d-14(a), as adopted pursuant to Section 302 of the Sarbanes-Oxley Act of 2002. | |
| 31.2 | Certification of Principal Financial Officer Pursuant to Rule 13a-14(a) or Rule 15d-14(a), as adopted pursuant to Section 302 of the Sarbanes-Oxley Act of 2002. | |
| 32.1 | Certification of Principal Executive Officer Pursuant to 18 U.S.C. Section 1350, as adopted pursuant to Section 906 of the Sarbanes-Oxley Act of 2002. | |
| 32.2 | Certification of Principal Financial Officer Pursuant to 18 U.S.C. Section 1350, as adopted pursuant to Section 906 of the Sarbanes-Oxley Act of 2002. | |
| 101.INS | XBRL Instance Document. | |
| 101.SCH | XBRL Taxonomy Extension Schema Document. | |
| 101.CAL | XBRL Taxonomy Extension Calculation Linkbase Document. | |
| 101.LAB | XBRL Taxonomy Extension Label Linkbase Document. | |
| 101.PRE | XBRL Taxonomy Extension Presentation Linkbase Document. | |
| 101.DEF | XBRL Taxonomy Extension Definition Linkbase Document. | |
| (1) | Filed on September 23, 2010 as an exhibit to Amendment No. 8 to Registrant’s Registration Statement on Form S-1 (File No. 333-130360) and incorporated by reference herein. |
| (2) | Filed on November 12, 2010 as an exhibit to Registrant’s Quarterly Report on Form 10-Q for the quarter ended September 30, 2010 (Commission File No. 001-34789) and incorporated by reference herein. |
| (3) | Filed on August 31, 2010 as an exhibit to Amendment No. 7 to the Registrant’s Registration Statement on Form S-1 (File No. 333-130360) and incorporated by reference herein. |
70
Table of Contents
Pursuant to the requirements of Section 13 or 15(d) of the Securities Exchange Act of 1934, the Registrant has duly caused this report to be signed on its behalf by the undersigned, thereunto duly authorized, in the City of Chicago, State of Illinois, on March 14, 2012.
| Nuveen Diversified Commodity Fund | ||||
| By: | Nuveen Commodities Asset Management, LLC, its Manager |
|||
| By: /s/ William Adams, IV |
||||
| President (Principal Executive Officer) |
||||
Pursuant to the requirements of the Securities Exchange Act of 1934, this report has been signed below by the following persons on behalf of the Registrant and in the capacities and on the dates indicated.
Nuveen Commodities Asset Management, LLC
Manager of Registrant
| /s/ William Adams, IV |
||
| President (Principal Executive Officer) March 14, 2012 | ||
| /s/ Stephen D. Foy |
||
| Chief Financial Officer (Principal Financial and Accounting Officer) March 14, 2012 | ||
71