Attached files
| file | filename |
|---|---|
| 8-K - FORM 8-K - Exelis Inc. | d314383d8k.htm |
 J.P. Morgan
Aviation, Transportation & Defense Conference
Dave Melcher, Chief Executive Officer and President
March 13, 2012
Exhibit 99.1 |
 SAFE
HARBOR
STATEMENT
The Company undertakes no obligation to update any forward-looking statements, whether as
a result of new information, future events or otherwise, except as required by law. In
addition, forward-looking statements are subject to certain risks and uncertainties that could cause actual results to differ materially from
the Company’s historical experience and our present expectations or projections. These
risks and uncertainties include, but are not limited to, those described in Exelis
Inc.’s Annual Report on Form 10-K, and those described from time to time in our future reports filed with the Securities and Exchange Commission.
Our dependence on the defense industry and the business risks
peculiar to that industry, including changing priorities or reductions
in the U.S.
Government or international defense budgets;
Government regulations and compliance therewith, including
changes to the Department of Defense procurement process;
Our international operations, including sales to foreign customers;
Competition, industry capacity and production rates;
Misconduct of our employees, subcontractors, agents and business
partners;
The level of returns on postretirement benefit plan assets and
potential employee benefit plan contributions and other
employment and pension matters;
Changes
in
interest
rates
and
other
factors
that
affect
earnings
and
cash flows;
The mix of our contracts and programs, our performance, and our
ability to control costs;
Governmental investigations;
Our
level
of
indebtedness
and
our
ability
to
make
payments
on
or
service
our
indebtedness;
Subcontractor performance;
Economic and capital markets conditions;
The availability and pricing of raw materials and components;
Ability to retain and recruit qualified personnel;
Protection of intellectual property rights;
Changes in technology;
Contingencies related to actual or alleged environmental contamination,
claims and concerns;
Security breaches and other disruptions to our information technology and
operations; and
Unanticipated changes in our tax provisions or exposure to additional income
tax liabilities.
In addition, there are risks and uncertainties relating to the separation
including whether those transactions will result in any tax liability, the
operational and financial profile of the Company or any of its businesses after
giving effect to the separation, and the ability of the Company to operate as
an independent entity.
Safe Harbor Statement under the Private Securities Litigation Reform Act of 1995 (the
“Act”): Certain material presented herein includes forward-looking
statements intended to qualify for the safe harbor from liability established by the Private
Securities Litigation Reform Act of 1995. These forward-looking statements include,
but are not limited to, statements about the separation of the Company from ITT Corporation, the terms and the effect of the separation,
the nature and impact of such a separation, capitalization of the Company, future strategic
plans and other statements that describe the Company’s business strategy, outlook,
objectives, plans, intentions or goals, and any discussion of future operating or financial performance. Whenever used, words such as
“anticipate,” “estimate,” “expect,” “project,”
“intend,” “plan,” “believe,” “target” and other terms of similar meaning are intended to identify such forward-
looking statements. Forward-looking statements are uncertain and to some extent
unpredictable, and involve known and unknown risks, uncertainties and other important
factors that could cause actual results to differ materially from those expressed or implied in, or reasonably inferred from, such forward-
looking statements. Factors that could cause results to differ materially from those
anticipated include, but are not limited to: |
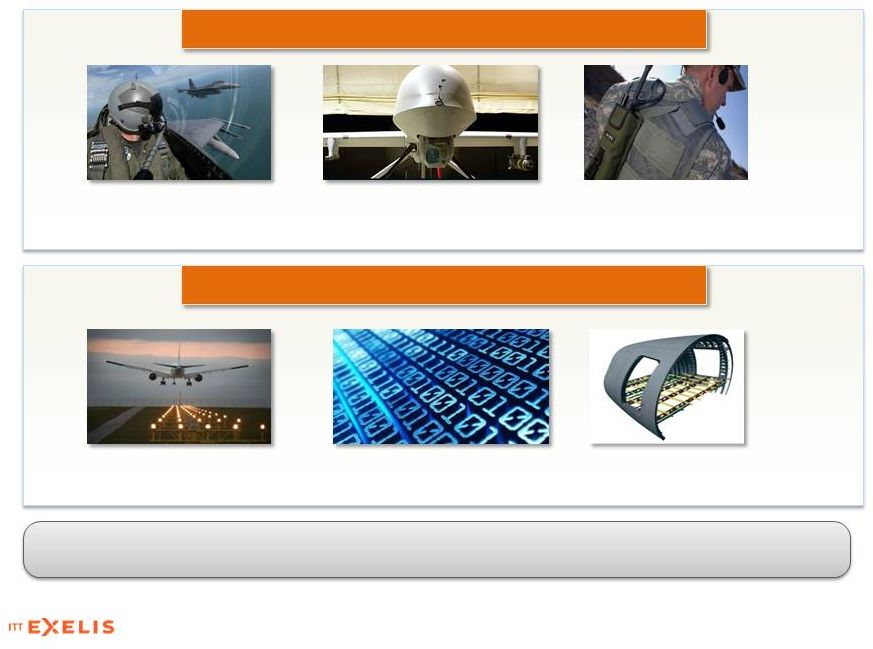
 Electronic
Warfare Force Protection
Networked
Communications
Radar
Composite Structures
Reconnaissance &
Surveillance
Undersea Acoustics
Global Base
Operations Support
Range Operations,
Sustainment, Upgrade
& Modernization
Battlefield Network
Communications
Support
Worldwide Logistics &
Deployment Support
Ground Vehicle &
Equipment
Maintenance
Airborne Situational
Awareness
Information
Exploitation
Space-Based Satellite
Imaging
Weather & Climate
Monitoring
GPS
Night Vision
Large-scale Network
Architecture &
Integration
Cyber Security
Air Traffic and Airport
Solutions
Space Communications
Network Services
Data Fusion
Engineering and
Professional Services
CBRNE Technologies
C4ISR Electronics & Systems
Information & Technical Services (I&TS)
3
Electronic Systems
Geospatial Systems
Information Systems
Mission Systems
A DIVERSIFIED PORTFOLIO AND A LEGACY OF PROGRAM PERFORMANCE… |
 …EVOLVING TO
ALIGN WITH ENDURING MARKETS AND CUSTOMER PRIORITIES Significant Mix Shift
in 2011:
Wind down on major
production contracts
offset by wins on Middle
East Programs, NASA
Future Pursuits Aligned
to Customer Needs:
Electronic Warfare
ISR
Data to Decisions
Air Traffic Modernization
Aerostructures
Preparing for Transition:
4% CAGR 2008-2010
exclusive of domestic
SINCGARS, CIED, Night
Vision
20% CAGR 2008-2010
International Sales
(1)
The 2012 and future guidance provided in this presentation are forward-looking statements,
which are based on the Company’s current expectations. Actual results may differ
materially from those projected. See the "Forward-Looking Statements" discussion contained in this presentation.
2010
(Actual)
2010
(Actual)
2012
(Est.)
(1)
Sales Mix Shift Accompanied by Portfolio Diversification |
 EVOLVING CONTRACT AND
CUSTOMER DIVERSITY… CUSTOMERS
CONTRACT TYPE
CONTRACT POSITION
2011 Revenue by Customer/Contract Type
2011 Revenue: $5.8B
2012(E) Revenue: $5.4B -
$5.5B
90% Growth in non-Defense/International 2009 -
2011
Sub
contractor
20%
Cost Plus
55%
Fixed Price
45%
Prime
Contractor
80%
DoD and U.S.
Intelligence
Agencies
69%
International
9%
FAA, NASA,
other U.S
Agencies
and U.S
Commercial
22% |
 …AND
ACTIVE
PORTFOLIO
MANAGEMENT
TO
ALIGN
TO
ENDURING
NEEDS
Core
Positions:
Extend
Leadership
Focused
Growth:
Invest
in
Capabilities
&
Scale
Creating Value by Leveraging Complementary Capabilities and Positions
ISR
Information & Cyber
Air Traffic Solutions
Aerostructures
Electronic Warfare
Networked
Communications |
 2011
YEAR
IN
REVIEW
•
Wind down on major production
contracts offset by wins on Middle East
Programs, NASA
•
Overall sales mix drove change in
Operating Margin
(1)
Adjusted operating income excludes separation costs resulting from Exelis 2011 spin-off
from ITT Corporation. See Appendix for non-GAAP reconciliations
(2)
2010 Full-year results as reported in the Company’s Registration Statement,
filed on October 5, 2011. $689
$583
$5,839
$5,891
(2)
(2)
Adj. Operating Income
(1)
($M)
Sales ($M)
C4ISR Electronics and Systems
Information and Technical Services
$3,022
$2,295
$2,817
$3,596
$168
$126
$415
$563
C4ISR Electronics and Systems
Information and Technical Services
2010, as Reported
2011 Actual
2010, as Reported
2011 Actual, as Adjusted
11.7%
10.0% |
 2012
GUIDANCE (1)
Sales:
Adj. Operating Margin
(2)
:
Adj. Earnings per Share
(2)
:
2012 Guidance
$5.4B -
$5.5B
10.6% –
10.8%
$1.80 –
$1.86
Guidance Mid-
Point vs. 2011
(7%)
60 –
80 bps
(8%)
10.0%
2011
Actual,
as
Adjusted
(2)
Sales Mix Shift Toward Increased
Services and Mix Shift within the
Products Portfolio
Pension Expense
2011 Restructuring Benefits
Productivity Improvements
10.6% –
10.8% 2012 Guidance
Sales
2011
2012E
Operating Margin
2011
2012E
$5.8B
2011 Actual
$300M
Production Contracts to
Sustainment level
$100M
Service Contracts Transition
from 2011 Ramp
$5.4B -
$5.5B 2012 Guidance
(1)
The Company notes that forward-looking statements of future performance made in this
presentation are based upon current expectations and are
subject
to
factors
that
could
cause
actual
results
to
differ
materially
from
those
suggested
here,
including
those
factors
set
forth
in
the
Forward Looking Statements in this presentation.
(2)
See Appendix for non-GAAP reconciliations.
Key Dynamics Influencing 2012 Guidance |
 Exelis
– Investment Highlights
Diversified Portfolio with Attractive Positions in Enduring Market
Segments
Mission-critical and Affordable Ready-now Solutions
Proven Record of Solid Program Performance and Operational
Excellence
Large Fielded Base and Platform-agnostic Solutions Drive Sustainable
Revenue
Strong Cash Generation and Attractive Dividend
9
Actively Managing Cash Flow Requirements to
Enable Investment and Shareholder Return |
 APPENDIX |
 RECONCILIATION OF
NON-GAAP MEASURES Management reviews key performance indicators including
revenue, segment operating income and margins, orders growth, and
backlog, among other metrics on a regular basis. In addition, we
consider certain additional measures to be useful to management
and investors evaluating our operating performance for the periods presented, and provide a
tool for evaluating our ongoing operations, liquidity and management of assets. This
information can assist investors in assessing our financial performance and
measures our ability to generate capital for deployment among competing strategic alternatives
and initiatives, including, but not limited to, acquisitions, and debt repayment. These
metrics, however, are not measures of financial performance under accounting principles
generally accepted in the United States of America (GAAP) and should not be considered
a substitute for sales, operating income, income from continuing operations, or net
cash from continuing operations as determined in accordance with GAAP. We consider the
following non-GAAP measure, which may not be comparable to similarly titled measures reported by
other companies, to be a key performance indicator:
“adjusted income from continuing operations”
defined as income from continuing operations, adjusted to exclude items that
include, but are not limited to significant charges or credits that impact current results,
but are not related to our ongoing operations, unusual and infrequent non-operating
items and non-operating tax settlements or adjustments. A reconciliation of
adjusted income from continuing operations is provided below.
Adjusted Income from Continuing Operations
(in millions, except per share amounts)
FY 2011
Q411
FY 2010
Q410
Income from Continuing Operations
326
$
64
$
448
$
141
$
Separation Costs, net of tax
29
14
-
-
APB 23 Repatriation of Foreign Earnings due to Separation, net of tax
16
16
-
-
Adjusted Income from Continuing Operations
371
94
448
141
Income from Continuing Operations per fully diluted share
$1.75
$0.34
$2.39
$0.75
Adjusted Income from Continuing Operations per fully diluted share
$1.99
$0.50
$2.39
$0.75
Weighted Average Shares Outstanding, Diluted
186.7
186.7
187.1
187.1 |
 RECONCILIATION OF
NON-GAAP MEASURES “segment operating income”
defined as income from continuing operations of our two segments, adjusted to exclude
items that include, but are not limited to significant charges or credits that impact current
results, but are not related to our ongoing operations, unusual and infrequent
non-operating items and non-operating tax settlements or adjustments. A
reconciliation of segment operating income is provided below.
“segment operating margin”
defined as segment operating income as defined above, divided by
sales. A reconciliation of
segment operating margin is provided below.
Segment Operating Income, Operating Margin
($ million)
FY 2011
Q411
FY 2010
Q410
Sales
5,839
$
1,480
$
5,891
$
1,635
$
C4ISR
2,817
709
3,596
1,062
I&TS
3,022
771
2,295
573
Segment Operating Income, as Reported
535
143
689
219
C4ISR
385
106
563
204
I&TS
150
37
126
15
Separation Costs
48
25
-
-
C4ISR
30
16
-
-
I&TS
18
9
-
-
Segment Operating Income, Adjusted
583
168
689
219
C4ISR
415
122
563
204
I&TS
168
46
126
15
Operating Margin, as Reported
9.2%
9.7%
11.7%
13.4%
Operating Margin, Adjusted
10.0%
11.4%
11.7%
13.4% |
 RECONCILIATION
OF
NON-GAAP
MEASURES
Operating Income, Operating Margin, & EPS Guidance Mid Point
(in millions, except per share amounts)
FY 2012
Sales, Guidance Mid Point Estimate
5,450
$
Operating Income , GAAP Estimate
566
Separation Costs
18
Operating Income , Guidance Mid Point Estimate
584
Operating Margin, GAAP Estimate
10.4%
Operating Margin, Guidance Mid Point Estimate
10.7%
Income from Continuing Operations, GAAP Estimate
331
Separation Costs, net of tax
11
Income from Continuing Operations, Guidance Mid Point Estimated
343
Income from Continuing Operations per fully diluted share, GAAP Estimate
$1.77
Income from Continuing Operations per fully diluted share, Guidance Mid Point Estimate
$1.83
Weighted Average Shares Outstanding, Diluted
187.5 |