Attached files
| file | filename |
|---|---|
| 8-K - FORM 8-K - MUFG Americas Holdings Corp | d313935d8k.htm |
| EX-2.1 - AGREEMENT AND PLAN OF MERGER - MUFG Americas Holdings Corp | d313935dex21.htm |
| EX-99.2 - PRESS RELEASE - MUFG Americas Holdings Corp | d313935dex992.htm |
 Acquisition of
Exhibit 99.1 |
 Safe
Harbor Statement 2
This document includes forward-looking statements that involve risks and uncertainties.
Forward-looking statements can be identified by the fact that they do not relate strictly
to historical or current facts. Often, they include the words “believe,”
“continue,” “expect,” “target,” “anticipate,”
“intend,” “plan,” “estimate,” “potential,” “project,” or words of similar
meaning, or future or conditional verbs such as “will,” “would,”
“should,” “could,” or “may.” There are numerous risks and
uncertainties that could and will cause actual results to differ materially from those
discussed in UNBC’s forward-looking statements. Many of these factors are beyond
UNBC’s ability to control or predict and could have a material adverse effect on
UNBC’s financial condition, results of operations and/or prospects. Such risks and
uncertainties include, but are not limited to uncertainties as to the timing of completion of the
proposed acquisition, the possibility that various closing conditions (including regulatory
approval) for the proposed transaction may not be satisfied at all or in a timely manner or
waived, UNBC’s ability to retain key employees and other risks and uncertainties discussed
in UNBC’s public filings with the SEC. All forward-looking statements included in
this document are based on information available at the time of such document, and UNBC assumes
no obligation to update any forward-looking statement. |
 Growing Our California Franchise
3
•
Acquiring the leading bank in attractive Santa Barbara market
•
Strengthens retail banking scale and distribution
•
Complementary service-oriented and relationship based model
–
Combines two community focused cultures
•
Significant revenue opportunities from expanded product offerings and
cross-sell in business
banking,
wealth
management
and
commercial
and
community
banking
•
Credit write-up and reversal of Deferred Tax Asset (DTA) valuation allowance
unlocks tangible book value
•
Leverages strong capital
•
Improves Union Bank funding mix by adding valuable, low-cost retail
deposits •
Significant operating synergies
–
Cost saves of approx. $80 million or approx. 40% of PCBC expenses
•
Exceeds internal financial hurdles
•
Balance sheet marked at time of recapitalization in August 2010
–
No credit write-down required
•
Strong pro forma capital position
•
Reviewed significant portion of loan files with Union Bank credit team
•
Recent track record of successful integrations
Strategic
Rationale
Financially
Attractive
Relatively
Low Risk |
 Transaction Assumptions
4
Consideration
100% Cash
Purchase Price Per Share
$46.00
Aggregate Value
$1.5Bn
Anticipated Closing
Q4 2012
Approvals
Regulatory (Pacific Capital majority
shareholder consent already obtained)
Due Diligence
Complete
|
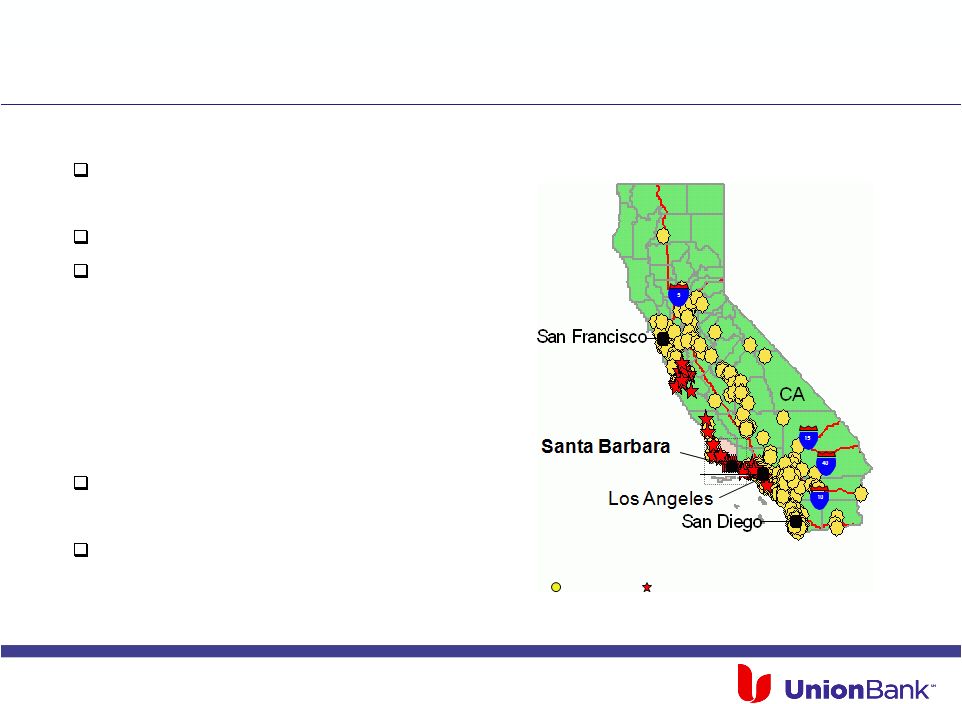 Building Branch Density in Attractive California Markets
5
Commenced operations in 1960
–
Headquartered in Santa Barbara, CA
$5.9Bn in assets; $4.6Bn in deposits
47 branches in Central Coast of California
–
Largest independent bank in Central Coast
–
#1 in Santa Barbara MSA
–
#4 in Oxnard-Thousand Oaks MSA
–
Median
household
income
of
$69K
(1)
for
Pacific
Capital
markets
compared
to
$54K
(1)
for entire U.S.
Recapitalization in August 2010
–
Ford Financial Fund L.P. owns 76%
Strong core deposit funding
–
Non-interest bearing deposits comprise
25.5% of total deposits
Overview of Pacific Capital
1. Source: SNL Financial. Weighted by total deposits in market
Union Bank
Pacific Capital Bancorp |
 Leading
Presence in Santa Barbara, Strengthened Position in Adjacent Markets
6
Institution
Market Share
(%)
1
Bank of America
26.3
2
Wells Fargo
20.0
3
JP Morgan
7.5
–
Union Bank / Pacific Capital
6.7
4
Union Bank
6.2
5
Citigroup
5.3
18
Pacific Capital
0.5
California
Institution
Market Share
(%)
–
Union Bank / Pacific Capital
23.7
1
Pacific Capital
22.4
2
Wells Fargo
17.6
3
Bank of America
13.5
4
Rabobank Nederland
10.1
5
Montecito Bancorp
8.1
15
Union Bank
1.3
Institution
Market Share
(%)
1
Wells Fargo
26.2
2
Bank of America
21.6
3
JP Morgan
11.9
–
Union Bank / Pacific Capital
8.1
4
Pacific Capital
6.2
5
Citigroup
6.0
12
Union Bank
1.9
Santa Barbara MSA
Oxnard MSA (Ventura)
Institution
Market Share
(%)
1
Wells Fargo
29.2
2
Bank of America
17.4
3
Rabobank Nederland
14.3
4
JP Morgan
13.3
–
Union Bank / Pacific Capital
12.6
5
Pacific Capital
9.3
6
Union Bank
3.3
Salinas MSA (Carmel / Monterey)
(Median HH Income: $60,992)
(Median HH Income: $61,338)
(Median HH Income: $77,837)
(Median HH Income: $62,850) |
 Pacific Capital: Significantly Strengthened Franchise
Improved Funding Base
Deposit Composition (%)
CDs
Money Market & Savings
Non-interest Bearing
Solid Credit Quality w/ Marked Balance Sheet
Nonperforming Assets (%)
Rebuilt Capital Position
Tier 1 Common Ratio (%)
Return to Profitability
Net Income ($MM)
7
(Pre-Ford Investment)
Cost of Deposits:
1.54%
1.06%
0.53%
(Pre-Ford Investment) |
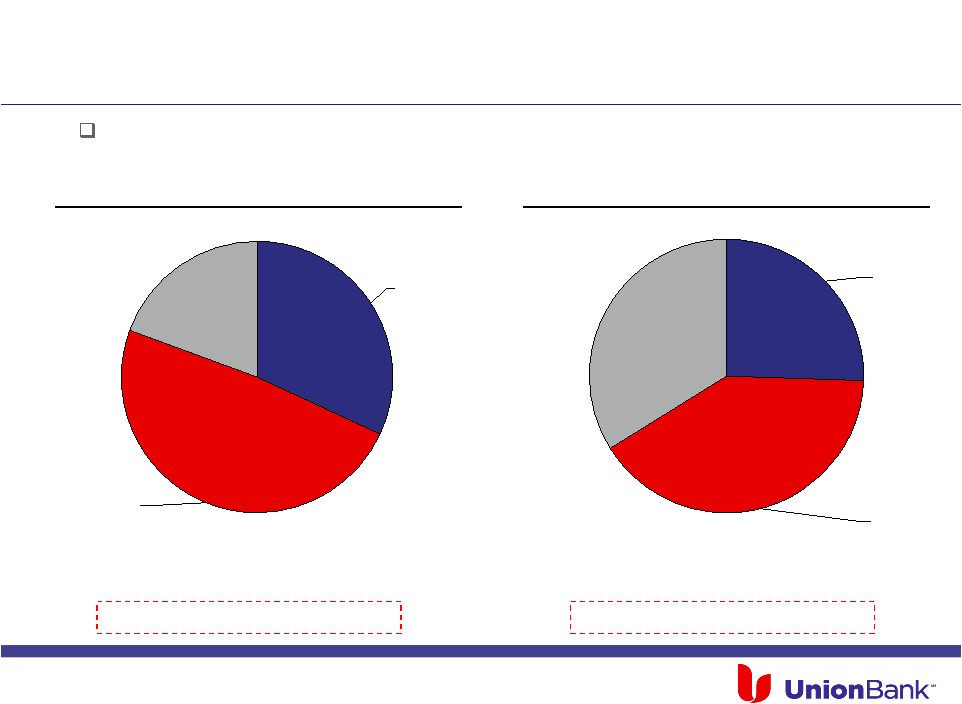 Combining Two Strong Core Deposit Bases
8
Money
Market
and
Savings
49%
CDs
19%
Non-
Interest
Bearing
32%
Union Bank
Money
Market
and
Savings
41%
CDs
34%
Non-
Interest
Bearing
25%
Pacific Capital
(1)
1. Includes interest-bearing transaction accounts
(1)
Pacific Capital’s cost of deposits is similar to Union Bank’s
12/31/2011 Total Deposits ($MM):
64,420
2011 Cost of Deposits:
0.36%
2011
Cost
of
Deposits
exl.
CDs:
0.14%
12/31/2011 Total Deposits ($MM):
4,617
2011 Cost of Deposits:
0.53%
2011 Cost of Deposits exl. CDs:
0.17% |
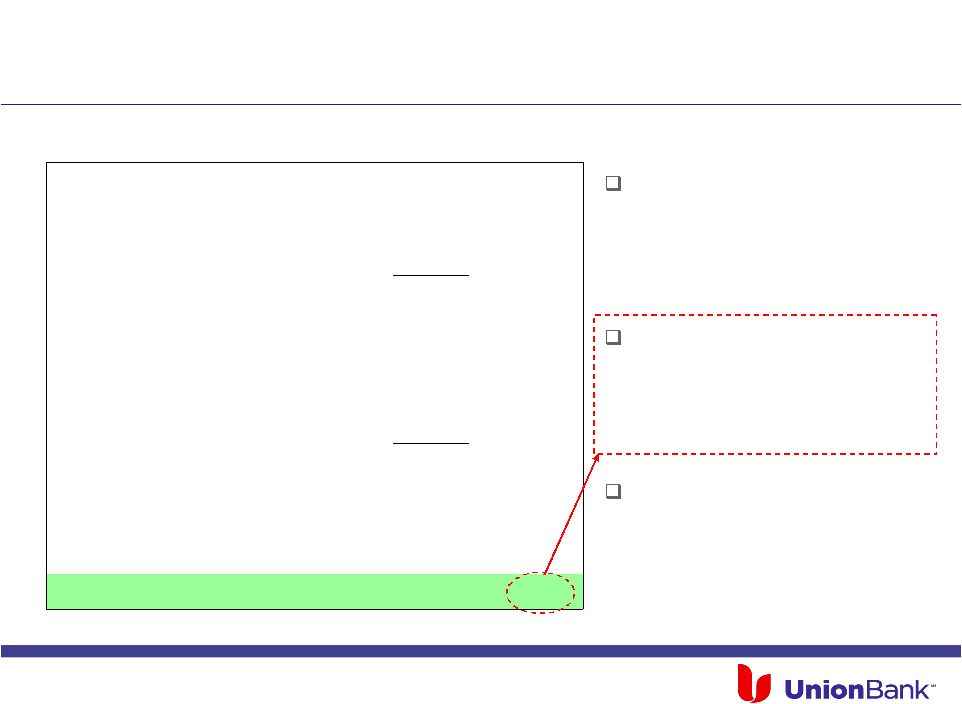 Significant Write-Ups to Tangible Book Value at Closing
9
Purchase Price
$1,517
Pacific Capital Shareholder Equity
762
Less: Goodwill and Intangibles
(89)
PCBC 12/31/2011 Tangible Book Value
$673
Adjustments
Reversal of DTA Valuation Allowance
248
Net Write-up of 2010 Credit Mark (After-Tax)
20
Total Adjustments
$268
Adjusted 12/31/2011 Tangible Book Value
$941
Price / Adjusted Tangible Book Value
1.6x
1.
Adjusted to reflect announced after-tax loan mark, net of reserves. Includes the
following transactions with deal values greater than $500MM: Prosperity /
American State, PNC / RBC Bank, Comerica / Sterling, Hancock / Whitney, BMO
Financial / M&I, and First Niagara / NewAlliance. 2.
As of 12/31/2011
3.
The net write-up of the 2010 credit mark is equal to the sum of the pre-tax
$27MM credit write-up ($17MM after-tax) as of 1/31/12 and the $5MM pre-tax
reserve balance ($3MM after-tax) as of 12/31/2011
Reversal of DTA valuation
allowance and recapturing a
portion of Ford Financial’s
original credit mark enhances
tangible book value
Price to adjusted tangible book
value of 1.6x compares
favorably with selected
comparable transactions
median of 2.1x
(1)
Acquiring strong core deposits
in attractive markets
(2)
(3) |
 1. As of 1/31/2012
2. Transactions with deal values greater than $500MM since January 1, 2010
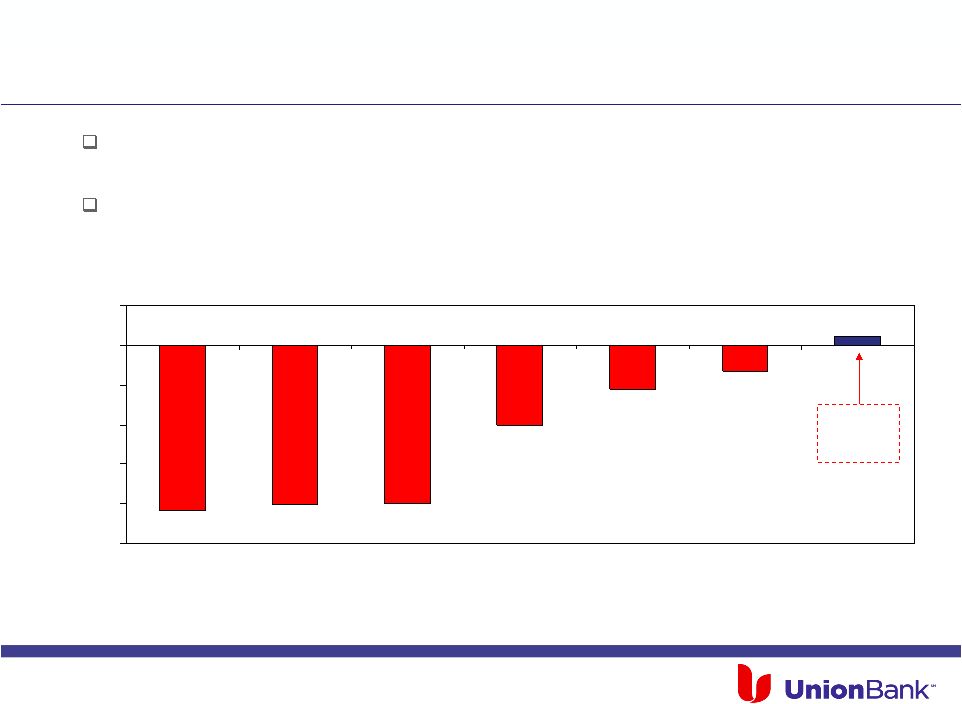
Pacific Capital’s Legacy Loan Portfolio Marked in 2010 Recapitalization
10
Credit mark of $440MM or 10.6% of principal balance results in a
pre-tax credit write-up of
$27MM, or ~0.7% of the current marked book value of the loan portfolio
(1)
Median credit mark for recent comparable transactions of 9.0%
Source: Investor Presentations
(15)
(12)
(9)
(6)
(3)
0
3
PNC / RBC Bank
BMO / M&I
Comerica /
Sterling
Hancock /
Whitney
First Niagara /
New Alliance
Prosperity /
American State
Union Bank /
Pacific Capital
(%)
Credit
Write-up
/
Write-down
for
Precedent
Transactions
(2)
Write-up
of Book
Value
(1) |
 Comprehensive Credit and Operational Due Diligence Completed
11
Due diligence completed, including all major business and functional areas
Reviewed Ford’s original mark in context of today’s market conditions and
recent and projected performance of loan portfolio
–
Union Bank’s analysis resulted in a pre-tax $27MM write-up of the
loan portfolio balance
Extensive
review
of
loan
portfolios
including
internal
loan
file
reviews,
thorough analysis of data provided, and discussions with management
–
Overall credit analysis and individual credit files reviewed onsite by senior
Union Bank banking and credit professionals to assess risk profile and
credit mark
–
On-site team conducted extensive review of commercial portfolio (over 300
loan files representing $1.1Bn of customer balances) providing coverage
across all major asset types
–
Detailed analysis of consumer portfolios completed, including selected file
reviews
Systems integration expected to occur in 1Q 2013
–
Dedicated integration team with deep transaction experience
|
 Continued Capital Strength and Flexibility
12
On a pro forma basis:
UNBC will continue to have the
highest Tier 1 Common ratio
among its peers
(1)
Estimated Pro forma 12/31/11 Tier
1 Common Ratio of ~12.4%
Quality of capital is very strong:
100% of Tier 1 consisting of
common equity
Capital strength provides flexibility
for further growth
Tier 1 Common Ratio at 12/31/11
Peer Median: 9.7%
(%)
(Pro Forma)
1.
Regional banks with assets > $50 billion |
 Strategically Compelling, Financially Attractive Combination
13
Combination creates leading market opportunity for business banking,
wealth management and commercial and community banking in Central
Coast region
Complementary relationship and service oriented business model, and
commitment to community
Financially attractive transaction which exceeds internal financial hurdles
Relatively low risk, highly diligenced transaction
Strong capital and liquidity post-transaction to fund future growth
|