Attached files
| file | filename |
|---|---|
| 8-K - 8-K - CubeSmart | a12-6944_18k.htm |
Exhibit 99.1
|
|
Investor Presentation March 2012 |
|
|
The forward-looking statements contained in this presentation are subject to various risks and uncertainties. Although the Company believes the expectations reflected in such forward-looking statements are based on reasonable assumptions, there can be no assurance that its expectations will be achieved. You should not rely on our forward-looking statements because the matters they describe are subject to known and unknown risks and uncertainties that could cause the Company’s future results, performance, or achievements to differ significantly from the results, performance, or achievements expressed or implied by such statements. Such risks are set forth under the captions “Item 1A. Risk Factors” and “Forward-Looking Statements” in our annual report on Form 10-K and under the caption “Item 2. Management’s Discussion and Analysis of Financial Condition and Results of Operations” (or similar captions) in our quarterly reports on Form 10-Q, and described from time to time in the Company’s filings with the SEC. Forward-looking statements are not guarantees of performance. For forward-looking statements herein, the Company claims the protection of the safe harbor for forward-looking statements contained in the Private Securities Litigation Reform Act of 1995. The Company assumes no obligation to update or supplement forward-looking statements that become untrue because of subsequent events. Safe Harbor Statement 2 |
|
|
3 Company Overview: A National Platform Owned Managed Self storage REIT with 480 facilities across the United States 376 owned facilities; 104 facilities managed on behalf of 3rd party owners An additional ~825 partner facilities in the CubeSmart Network CubeSmart Network facilities not shown. 1 |
|
|
4 The CubeSmart Story Attractive Industry Quality Portfolio Conservative Balance Sheet With Advantages for A Strong Platform Driving Internal Growth Supporting External Growth That Moves the Needle |
|
|
1 in 10 US households use self storage, up from 1 in 17 in 1995 Widely fragmented industry provides runway for consolidators Low variable cost level (operating leverage) fuels NOI growth Low maintenance cap-ex requirements Absence of tenant improvement requirements High operating margins Demand is driven by mobility, which benefits in both economic expansions and contractions, making storage recession resistant Sector revenue declines of only ~3% during 2009 5 Attractive Industry Characteristics Growth Opportunity Stability, Resilience Cash Flow Generation Source: Self Storage Association 2011 Fact Sheet, comparing 2007 to 1995. 1 |
|
|
6 Home Ownership Trends Support Growth Declining US Homeownership US homeownership rate. Source: US Census Bureau Housing Vacancy Survey, 4Q11. Renters move roughly three times more frequently than homeowners Fewer Owners = More Renters More Mobility Movers represent more than ½ of self storage customers More Demand 1 60.0% 62.0% 64.0% 66.0% 68.0% 70.0% 1981 1983 1985 1987 1989 1991 1993 1995 1997 1999 2001 2003 2005 2007 2009 2011 |
|
|
7 Extended Length of Stay Supporting Results Median Length of Stay +25% Widening lengths of stay offset soft rental activity during the recession and continue to support performance 1 CubeSmart same-store portfolio. 8 6 4 2 0 2008 1H2011 |
|
|
8 Limited New Supply to Absorb Demand New Self Storage Construction Starts - Nationwide -61% Source: Cushman & Wakefield, Inc., Self Storage Performance Quarterly, 4Q11. 1 50 45 40 35 30 25 20 15 10 5 0 4Q08 1Q09 2Q09 3Q09 4Q09 1Q10 2Q10 3Q10 4Q10 1Q11 2Q11 3Q11 4Q11 |
|
|
9 REITs Taking Market Share Year-Over-Year Occupancy Gains Source: Cushman & Wakefield, Inc., Self Storage Performance Quarterly. Source: CUBE, SSS, PSA, and EXR public filings. Average of year-over-year change in reported period-ending occupancies. 375 basis point average performance gap over past four quarters 1 2 3% 2% 1% 0% -1% -2% -3% -4% 1.8% 1.3% 1.7% 1.9% 0.1% (0.6%) (3.5%) (3.5%) 1Q11 2Q11 3Q11 4Q11 Industry 1 REITs2 |
|
|
10 Benefits of Scale and Sophistication Strategic Partnerships Enhanced Services Marketing & Internet Presence People Internal Resources Processes Customer Capture Relationships Quality Team Sales Center Store Managers Systems Leveraging these resources provides a significant competitive advantage over other operators |
|
|
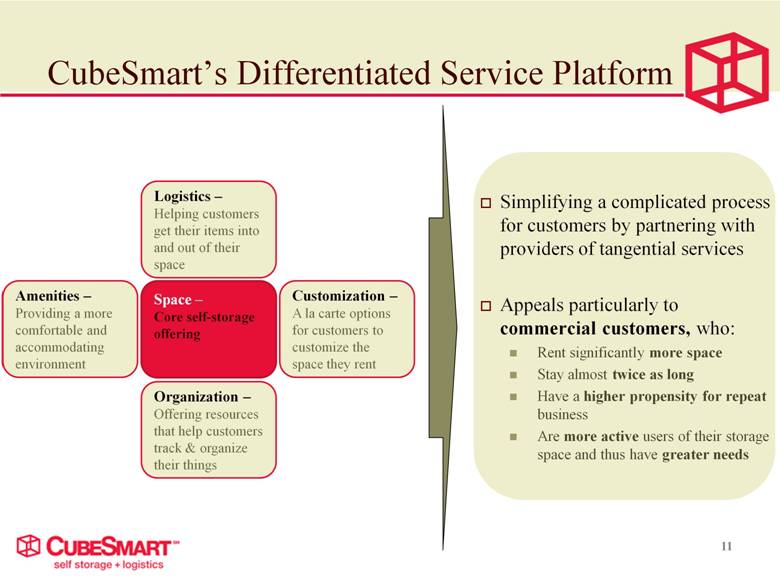
11 CubeSmart’s Differentiated Service Platform Organization – Offering resources that help customers track & organize their things Logistics – Helping customers get their items into and out of their space Amenities – Providing a more comfortable and accommodating environment Customization – A la carte options for customers to customize the space they rent Space – Core self-storage offering Simplifying a complicated process for customers by partnering with providers of tangential services Appeals particularly to commercial customers, who: Rent significantly more space Stay almost twice as long Have a higher propensity for repeat business Are more active users of their storage space and thus have greater needs |
|
|
Timeline More than 230 facilities rebranded to CubeSmart On track to convert substantially all remaining owned stores by April Cost Anticipate $2.0 million to $3.0 million capital investment in 2012 Total cost of rebranding to range from $4.5 million to $5.5 million – ahead of initial $8 million estimate 12 Rebranding Update – Ahead of Expectations |
|
|
13 The CubeSmart Story Attractive Industry Quality Portfolio Conservative Balance Sheet With Advantages for A Strong Platform Driving Internal Growth Supporting External Growth That Moves the Needle |
|
|
1) Arithmetic average of reported year-over-year same-store revenue growth for the 16 quarters ending December 31, 2011. Source: Company filings for CUBE, PSA, EXR, and SSS 14 Competitive Results From Historical Portfolio Same-Store Revenue Growth 1 Demonstrated resilience throughout recession. Competitive performance from historical portfolio. 1.1% 1.1% (6.0%) (4.0%) (2.0%) 0.0% 2.0% 4.0% 6.0% CubeSmart Storage REIT Average Average Reported Since First Quarter 2008 (6.0%) (4.0%) (2.0%) 0.0% 2.0% 4.0% 6.0% 1q08 2q08 3q08 4q08 1q09 2q09 3q09 4q09 1q10 2q10 3q10 4q10 1q11 2q11 3q11 4q11 CubeSmart , As Reported Quarterly, Year over Year |
|
|
Note: Bubbles sized by transaction value. All closed transactions as of 2/29/2012, including both stabilized and lease-up properties but excluding Storage Deluxe assets. Includes the second pool, the entirety of which is expected to close in 1Q12. 2012 projections are used for metric calculations. Realized annual rent per occupied square foot is computed by dividing rental income by the weighted occupied sq ft for the period. 15 Recent Repositioning Has Been Substantial Acquisitions Since 2008: $240 MM Dispositions Since 2008: $234 MM Storage Deluxe: $560 MM Capital Recycling 1 2 1 Redeploying disposition proceeds from low-growth, tertiary markets into superior assets competitively positioned in attractive “core” markets. Dotted Lines = Same-Store Portfolio 3 $0.00 $5.00 $10.00 $15.00 $20.00 $25.00 $30.00 $35.00 0 100,000 200,000 300,000 400,000 500,000 600,000 700,000 800,000 900,000 Realized Rent Per Occ Sq Ft 2010 Population (3 - Mile Radius, Weighted by Revenue) |
|
|
1) Realized annual rent per occupied square foot is computed by dividing rental income by the weighted occupied sq ft for the period. 2) Pro Forma, including all JV and wholly-owned assets as of 2/29/2012 as well as the entirety of the second pool of the Storage Deluxe portfolio, which is expected to close in 1Q12. 2012 projections are used for acquired Storage Deluxe assets. 16 A Markedly Improved Portfolio Realized Annual Rent per Occ Sq Ft 3-Mile 2010 Population (Weighted by Revenue) 1 2 2 High rents and population density are indicative of current portfolio quality and opportunity to drive pricing and demand in the future. |
|
|
Pro Forma, including all JV and wholly-owned assets as of 2/29/2012 as well as the entirety of the second pool of the Storage Deluxe portfolio, which is expected to close in 1Q12. 2012 projections are used for acquired Storage Deluxe NOI. 17 Now Positioned in Higher-Growth Markets Current Geographic Exposure (by NOI) Roughly 60% of portfolio NOI is generated from “core” markets – up from 40% four years ago January 2008 Geographic Exposure (by NOI) 1 Secondary Markets Major Texas Markets LA / San Diego / Orange Co. Miami/Ft./ Lauderdale Philadelphia/ Southern NJ Atlanta Boston San Francisco/ Oakland Baltimore/DC Boston San Francisco/ Oakland Philadelphia/ Southern NJ Atlanta LA / San Diego / Orange Co. Miami/Ft./ Lauderdale Chicago Markets Major Texas Markets Miami/Ft. |
|
|
Acquisitions: $75 to $125 million target Year to date, have closed on two assets in Houston and Atlanta for a total cost of $12.3 million Dispositions: $35 to $50 million target 18 Recent Activity – Continued Enhancement Acquisitions: $127 million (excluding Storage Deluxe) Focused on quality assets in high-rent, high-barrier-to-entry markets – including New York City, Houston, Atlanta, Miami, and Washington, DC. Dispositions: $45.2 million Concentrated in more tertiary markets in Ohio, Indiana, and Michigan. 2011 Investment Activity 2012 Investment Activity |
|
|
19 Transformational Storage Deluxe Transaction $560 million transaction 22 assets representing 1.6 million net rentable square feet, predominantly in the Greater New York City area Establishes CubeSmart as the largest owner of self-storage assets in New York City – one of the most attractive storage markets in the world Efficient execution Off-market, directly-sourced deal Inconspicuous due diligence process and efficient closing process further positions CubeSmart as the acquirer of choice for sellers Successful capital raising Financed with a combination of common and preferred equity, assumed debt, and new unsecured debt Approaching completion First pool, which included 16 facilities, closed on November 3, 2011 for $357.3 million Closed on four of the remaining six properties in February; expect to close on the remaining two assets in March 2012 |
|
|
20 The CubeSmart Story Attractive Industry Quality Portfolio Conservative Balance Sheet With Advantage for A Strong Platform Driving Internal Growth Supporting External Growth That Moves the Needle |
|
|
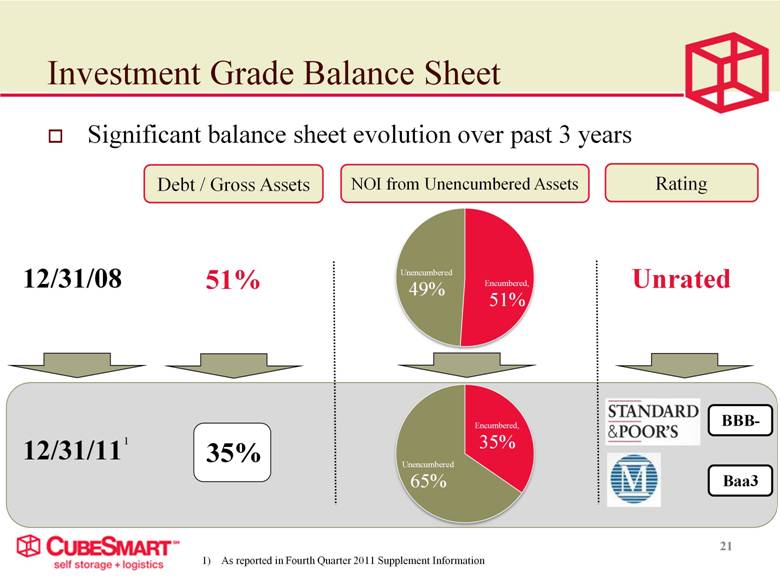
BBB- Significant balance sheet evolution over past 3 years 21 Investment Grade Balance Sheet NOI from Unencumbered Assets 12/31/11 12/31/08 Debt / Gross Assets Rating 51% 35% Unrated As reported in Fourth Quarter 2011 Supplement Information Baa3 1 Unencumbered 49% Encumbered, 51% Unencumbered 65% Encumbered, 35% 0,0 |
|
|
22 Balanced Maturity Profile December 31, 2008 Current (Pro Forma) Less than 22% maturing in any given year Assumes closing of the second pool of Storage Deluxe assets and therefore includes the full balance of the term loan maturing in March 2017 as well as the assumption of debt secured by the final six Storage Deluxe assets. 1 Weighted Average Maturity: 2.5 years Weighted Average Maturity: > 4.0 years $ - $100.0 $200.0 $300.0 $400.0 $500.0 $600.0 1 2 3 4 5 6 7 8+ Maturities ($million) Years to Maturity Secured Unsecured Maturities ($million) $600.0 $500.0 $400.0 $300.0 $200.0 $100.0 $- 1 2 3 4 5 6 7 8+ |
|
|
23 Host of Capital Sources to Support Growth Common Equity Preferred Equity Public Unsecured Debt Unsecured Bank Financing Joint Ventures Free Cash Flow Successfully sourced more than $1 billion of capital to support opportunistic growth in 2011. Strategic Dispositions CMBS / Secured Debt Private Placement of Unsecured Debt |
|
|
24 Opportunity for Meaningful External Growth Industry Fragmentation Runway for Consolidation in Both Ownership & Operations Acquisitions 3rd Party Mgmt Catalysts Significant levels of debt maturities in coming years on privately held storage assets. Operational advantages for large-scale platforms continuing to pressure smaller owners to sell or seek professional management. Large owners with access to a variety of capital sources will be well-positioned to take advantage of opportunities. 1 Top 5 self storage providers, including CubeSmart, Public Storage, Extra Space, Sovran, and U-Haul. Source: Self Storage Association 2011 Fact Sheet, as of 6/30/11. , 0, 0 Private Owner 90% |
|
|
25 Relationships Create Opportunity Source of 2011 Acquisitions, By Transaction Value Including Storage Deluxe1 Excluding Storage Deluxe2 Includes second pool of Storage Deluxe assets, all of which are expected to close 1Q12. Closed transactions. Nearly 2/3 of transaction value sourced through direct relationships Brokered, 7 % Direct - 3rd Party Mgmt, 8% Direct - Other, 85% Direct - Other, 18% Brokered, 36 % Direct - 3rd Party Mgmt, 46% |

|
|
26 The CubeSmart Story Attractive Industry Quality Portfolio Conservative Balance Sheet With Advantage for A Strong Platform Driving Internal Growth Supporting External Growth That Moves the Needle |
|
|
Investor Relations Contact Daniel Ruble, CFA Vice President, Finance 460 E. Swedesford Rd. Suite 3000 Wayne, PA 19087 610.293.5700 druble@cubesmart.com |