Attached files
| file | filename |
|---|---|
| EXCEL - IDEA: XBRL DOCUMENT - ODYSSEY MARINE EXPLORATION INC | Financial_Report.xls |
| EX-31.1 - SECTION 302 CEO CERTIFICATION - ODYSSEY MARINE EXPLORATION INC | d258164dex311.htm |
| EX-32.2 - SECTION 906 CFO CERTIFICATION - ODYSSEY MARINE EXPLORATION INC | d258164dex322.htm |
| EX-23.1 - CONSENT - ODYSSEY MARINE EXPLORATION INC | d258164dex231.htm |
| EX-31.2 - SECTION 302 CFO CERTIFICATION - ODYSSEY MARINE EXPLORATION INC | d258164dex312.htm |
| EX-32.1 - SECTION 906 CEO CERTIFICATION - ODYSSEY MARINE EXPLORATION INC | d258164dex321.htm |
Table of Contents
UNITED STATES
SECURITIES AND EXCHANGE COMMISSION
WASHINGTON, D.C. 20549
FORM 10-K
(Mark one)
| x | ANNUAL REPORT PURSUANT TO SECTION 13 OR 15(D) OF THE SECURITIES EXCHANGE ACT OF 1934 |
FOR THE FISCAL YEAR ENDED DECEMBER 31, 2011
| ¨ | TRANSITION REPORT UNDER SECTION 13 OR 15(D) OF THE SECURITIES EXCHANGE ACT OF 1934 |
Commission File Number 001-31895
ODYSSEY MARINE EXPLORATION, INC.
(Exact name of registrant as specified in its charter)
| Nevada | 84-1018684 | |
| (State or other jurisdiction of incorporation or organization) |
(I.R.S. Employer Identification No.) |
5215 W. Laurel Street, Tampa, Florida 33607
(Address of principal executive offices)
(813) 876-1776
(Registrant’s telephone number including area code)
Securities registered pursuant Section 12(b) of the Act:
| Title of each class | Name of each exchange on which registered | |
| Common Stock, $.0001 par value | NASDAQ Capital Market |
Securities registered pursuant to Section 12(g) of the Act:
None
Indicate by check mark if the registrant is a well-known seasoned issuer, as defined in Rule 405 of the Securities Act. Yes ¨ No x
Indicate by check mark if the registrant is not required to file reports pursuant to Section 13 or Section 15(d) of the Securities Act. Yes ¨ No x
Indicate by mark whether the registrant (1) has filed all reports required to be filed by Section 13 or 15(d) of the Securities Exchange Act of 1934 during the preceding 12 months (or for such shorter period that the registrant was required to file such reports), and (2) has been subject to such filing requirements for the past 90 days. Yes x No ¨
Indicate by check mark whether the registrant has submitted electronically and posted on its corporate Web site, if any, every Interactive Data File required to be submitted and posted pursuant to Rule 405 of Regulation S-T during the preceding 12 months (or for such shorter period that the registrant was required to submit and post such files). Yes ¨ No ¨
Indicate by check mark if disclosure of delinquent filers pursuant to Item 405 of Regulation S-K is not contained herein, and will not be contained, to the best of registrant’s knowledge, in definitive proxy or information statements incorporated by reference in Part III of this Form 10-K or any amendment to this Form 10-K. x
Indicate by check mark whether the registrant is a large accelerated filer, an accelerated filer, a non-accelerated filer, or a smaller reporting company. See definitions of “large accelerated filer,” “accelerated filer” and “smaller reporting company” in Rule 12b-2 of the Exchange Act. (Check one):
| Large accelerated filer | ¨ | Accelerated filer | x | |||
| Non-accelerated filer | ¨ (Do not check if a smaller reporting company) | Smaller reporting company | ¨ | |||
Indicate by check mark whether the registrant is a shell company (as defined in Rule 12b-2 of the Act). Yes ¨ No x
The aggregate market value of the 69 million shares of voting stock held by non-affiliates of Odyssey Marine Exploration, Inc. as of June 30, 2011 was approximately $215 million. As of February 23, 2012, the Registrant had 73,144,592 shares of Common Stock outstanding.
DOCUMENTS INCORPORATED BY REFERENCE
The information required by Part III of this Form 10-K is incorporated by reference to the Company’s Definitive Proxy Statement for the Registrant’s Annual Meeting of the Shareholders to be held on June 18, 2012.
Table of Contents

| Page | ||||||
| PART I | ||||||
| Item 1. | 1 | |||||
| Item 1A. | 10 | |||||
| Item 1B. | 12 | |||||
| Item 2. | 12 | |||||
| Item 3. | 12 | |||||
| PART II | ||||||
| Item 5. | 13 | |||||
| Item 6. | 14 | |||||
| Item 7. | Management’s Discussion and Analysis of Financial Condition and Results of Operations |
15 | ||||
| Item 7A. | 25 | |||||
| Item 8. | 25 | |||||
| Item 9. | Changes in and Disagreements With Accountants on Accounting and Financial Disclosure |
25 | ||||
| Item 9A. | 25 | |||||
| Item 9B. | 26 | |||||
| PART III | ||||||
| Item 10. | 26 | |||||
| Item 11. | 26 | |||||
| Item 12. | Security Ownership of Certain Beneficial Owners and Management and Related Stockholder Matters |
26 | ||||
| Item 13. | Certain Relationships and Related Transactions, and Director Independence |
26 | ||||
| Item 14. | 26 | |||||
| PART IV | ||||||
| Item 15. | 27 | |||||
| 63 | ||||||
| 64 | ||||||
Table of Contents
As used in this Annual Report on Form 10-K, “we,” “us,” “our company” and “Odyssey” mean Odyssey Marine Exploration, Inc. and our subsidiaries, unless the context indicates otherwise.
PART I
This Annual Report on Form 10-K contains forward-looking statements within the meaning of Section 27A of the Securities Act of 1933 and Section 21E of the Securities Act of 1934. The statements regarding Odyssey Marine Exploration, Inc. and its subsidiaries contained in this report that are not historical in nature, particularly those that utilize terminology such as “may,” “will,” “should,” “likely,” “expects,” “anticipates,” “estimates,” “believes,” “plans,” or comparable terminology, are forward-looking statements based on current expectations and assumptions, and entail various risks and uncertainties that could cause actual results to differ materially from those expressed in such forward-looking statements.
Important factors known to us that could cause such material differences are identified in this report and in our “RISK FACTORS” in Item 1A. Accordingly, readers of this Annual Report on Form 10-K should consider these factors in evaluating, and are cautioned not to place undue reliance on, the forward-looking statements contained herein. We undertake no obligation to update or revise publicly any forward-looking statements, whether as a result of new information, future events or otherwise, except as required by law.
| ITEM 1. | BUSINESS |
Overview
Odyssey Marine Exploration, Inc. is a world leader in deep-ocean shipwreck and mineral exploration, with expertise in innovative search technology and archaeological recovery operations on deep-ocean shipwrecks throughout the world. In 2011, we discovered two long-lost British commercial shipwrecks whose combined cargo could total over 7 million ounces of silver. In addition, we began to leverage our core business expertise and technology for exploration services for use in deep-ocean mineral exploration and our expeditions in partnership with Neptune Minerals and Chatham Rock Phosphate have resulted in the discovery of significant potentially valuable ore bodies and resource analyses. We also completed our first ever fully underwritten stock offering that featured participation by several large and respected investment funds.
We employ state-of-the-art technology, including side-scan sonar, magnetometers, remotely operated vehicles (ROVs), and other advanced equipment that enables us to locate shipwrecks and natural resource sites at depths that were previously unreachable in an economically feasible manner. Odyssey continues to build on a foundation of shipwreck research, government relationship development and the pioneering of techniques in deep-ocean exploration. Although we utilize technologies that have been developed at great expense in other fields, primarily the military, oil and telecommunications industries, we use our deep-ocean experience to modify and customize these technologies to create proprietary applications specific to our exploration and recovery needs.
Our shipwreck projects go through several phases, beginning with research of historical records and academic materials to establish potential target sites for search operations. Sites that meet our criteria are selected for exploratory search which may last as long as several years. If and when a target site is identified, we undertake an archaeological pre-disturbance survey and finally excavation of the site. The excavation phase is followed by conservation, recording, documentation and commercial monetization under established Admiralty Law or contract with sovereign nation governments.
The Odyssey team shares the knowledge gained through our expeditions with the world. We share this information through a variety of media including television, the Internet, books, research papers, periodicals, educational programs and traveling exhibits. We maintain several Internet sites including www.shipwreck.net, www.odysseysvirtualmuseum.com and www.shipwreckstore.com. We also allow collectors to own a piece of history from a shipwreck’s cargo by offering select duplicate items, artifact replicas and collectibles that provide an opportunity for everyone interested in shipwrecks to participate in Odyssey’s fascinating discoveries at the level of their choice. Information that is included on or linked to our Internet sites is not considered part of this Annual Report.
Project and Research Criteria
The United Nations Educational Scientific and Cultural Organization, or UNESCO, has estimated that there are approximately 3,000,000 shipwrecks contained within the oceans of the world. Historical records suggest that many were lost with verifiable cargoes of intrinsically valuable material. Odyssey’s research department maintains data on thousands of shipwrecks and continuously develops new potential projects.
Project research may focus on a particular search area where historical documents suggest recorded and unrecorded high-value targets may rest due to the proximity of shipping routes frequented by vessels carrying rich cargoes.
1
Table of Contents
Each project that targets a specific shipwreck begins with the research necessary to evaluate the potential value, location and likelihood of finding the wreck. Research is also necessary to establish the historical significance of the sunken ship and helps define the context in which the ship sank – essential for preparing an archaeological project plan and the complex logistics that precede excavation of a site.
Our marine research department continuously conducts research in an attempt to identify shipwreck projects that meet the following criteria:
| • | Documented Cargo Value – The research must indicate that the shipwreck was likely carrying enough intrinsically valuable cargo to cover the high costs associated with deep-ocean exploration and advanced archaeological recovery. Commercially viable cargo typically includes gold, silver, jewels, or other high-value items. Odyssey sometimes engages in the preliminary exploration of a shipwreck for purely scientific purposes, even if the value of the wreck is largely cultural, historical or educational. |
| • | Documented Navigation Information – The research must provide sufficient navigational information documenting the sinking location (or a particular area with potential for producing high-value targets) in order to minimize the search area, as well as the cost and time involved, and to provide a reasonable expectation that the shipwreck can be found. |
| • | Path to Ownership – The research must resolve or reasonably predict prior to recovery any issues relating to ownership of the shipwreck and its cargo. Questions pertaining to potential claimants, the location of the wreck inside or outside territorial waters, and the nature of the ship’s commercial or military mission are some of the important considerations that need to be understood in advance. |
Search Operations
Shipwreck search operations are conducted from a research vessel fitted with survey equipment and often with a Remotely Operated Vehicle (ROV). Odyssey’s ships can conduct deep-sea search operations 24 hours a day, seven days a week and have been deployed throughout the world – in the English Channel, the Mediterranean Sea, and the Atlantic and Pacific Oceans. A search typically begins with a side-scan sonar survey of the target area, which is typically paired with a magnetometer survey and multi-beam bathymetric surveys in some cases. The most interesting anomalies on the ocean floor are then inspected visually with an ROV, which sends real-time video images to monitors on the survey vessel for observation by the scientific and technical teams. These images are also downloaded and saved for additional evaluation ashore. Sometimes, it is immediately obvious whether the inspected site is of interest or not – as in the case of geology, modern debris, or when coins or valuables are readily apparent on the site. In other instances, it may take additional research and return visits to a site to arrive at probable or positive identity and to determine the next step forward.
Archaeological Excavation and Recovery
Archaeological excavation and recovery operations combine ROVs with sophisticated positioning systems, cameras and specialized computer hardware and software to carefully record the location of artifacts in situ and to document the entire archaeological process as the artifacts are recovered from a shipwreck site. As they conduct robotic archaeological operations at sites hundreds and sometimes thousands of feet below the ocean surface, Odyssey’s ROV pilots are directed by marine archaeologists aboard the recovery vessel.
The Odyssey Explorer, a 251-foot Class II dynamically positioning (DP) ship, serves as Odyssey’s principal state-of-the-art deep-ocean archaeological platform for shipwreck exploration. She carries fuel and stores for missions of up to 60 days, accommodates 42 crew members, including technicians, scientists and archaeologists, and has extensive onboard storage space for workshops, an archaeology laboratory, multiple cranes and a large A-frame for exceptional handling capability. When working on a project, operations are generally conducted 24 hours a day, seven days a week.
The centerpiece of Odyssey’s advanced robotic archaeology system is the ROV, which serves as the archaeologist’s eyes and hands in the deep ocean. Odyssey owns two work-class ROVs, nicknamed ZEUS and ZEUS II. The 200HP and 400 HP vehicles, respectively, are each approximately the size of a small truck; they stand about 10 feet high and weigh 8 tons. Driven by eight powerful hydraulic thrusters, they are rated to operate up to depths of 2,500 meters (8,200 ft.). Both ROVs have been custom-designed for deep-ocean archaeological survey and recovery operations, including visual inspection, pre-disturbance photographic and video documentation, scientific excavation and artifact recovery.
Conservation and Documentation
Shipwreck finds represent a diversity of objects made up of a variety of organic and inorganic materials, including metals, ceramics, glass, leather and other materials that are of cultural, historical, archaeological or educational value. Artifacts recovered from the ocean are generally impregnated with corrosive salts that can be very damaging to the object. In particular, a saltwater environment accelerates the corrosion processes of many metal artifacts. The salts must be removed and artifacts treated in a timely and judicious manner or they will deteriorate and lose their value as diagnostic specimens, museum display objects, or valuable collector’s pieces. Therefore, the conservation process is essential to maintaining the integrity of the artifacts as important relics of the past, and for what they may contribute to the historical record and offer to the general public through exhibits, private collections and publications. Every item recovered from a shipwreck site must go through a conservation process, which in some cases may require weeks, months, or even years depending on the artifact’s material make-up, the salinity of the water from where it was recovered, and the length of time it remained in the saltwater environment.
2
Table of Contents
Sharing the Story
Odyssey is committed to sharing with the public the thrill and adventure of deep-ocean exploration as well as the historical and scientific knowledge and artifacts acquired from each shipwreck project. We provide an opportunity for collectors and anyone interested in shipwreck exploration to participate in Odyssey’s fascinating discoveries by owning select duplicate shipwreck artifacts, artifact replicas or collectibles. Odyssey also shares this information through a variety of media including television, the Internet, books, research papers, periodicals, educational programs and traveling exhibits. A few of these are described as follows:
| • | Exhibits – All of the culturally and archaeologically significant artifacts recovered from our shipwreck projects remain in Odyssey’s permanent collection and are available for public exhibits and further study by researchers and academia. Odyssey’s SHIPWRECK! Pirates & Treasure, an interactive multi-media exhibit, features over 500 artifacts recovered from our deep-ocean shipwreck expeditions. Visitors also are immersed in the technology and process Odyssey uses to find and recover shipwreck treasures. The exhibit recently opened in February 2012 at the Mid America Science Museum in Hot Springs, Arkansas and will run through August 2012. In 2010 the exhibit was featured at two locations (Charlotte, North Carolina and Baltimore, Maryland). In 2011 the exhibit was featured at three locations (Baltimore, Maryland; Sarasota, Florida and San Antonio, Texas). We have a smaller exhibit at the New Orleans Mint and have had small displays at the Baldwin County Historical Museum in Alabama and the Museum of the History of Science at Oxford, England. |
| • | Television Programming – Discovery Channel’s 12-epsiode series, “TREASURE QUEST” premiered worldwide in 2009 and is available for unlimited rebroadcasts at Discovery Channel’s discretion. “TREASURE QUEST” showcases the Odyssey team as we searched for and discovered shipwrecks with unique stories to tell. Emmy® Award-winning JWM Productions was granted exclusive access to film Odyssey’s 2008 “Atlas” search expedition to produce this exciting high-definition series. Episodes include forensic analysis with stunning computer graphics as well as experts in cutting-edge laboratories laboring to analyze and conserve fragile artifacts recovered from the watery depths. During each episode, viewers are treated to spectacular underwater HD video of shipwreck discoveries through the cameras of Odyssey’s ROVs. Odyssey’s discovery of HMS Victory was captured during filming for the series and was showcased in two one-hour long episodes. Odyssey’s “Black Swan” discovery was also showcased in an episode. The SS Republic project was featured in two National Geographic shows, a one-hour special for PBS, “Civil War Gold” and as an episode of National Geographic Ultimate Explorer. Odyssey is currently finalizing an agreement for at least three one-hour specials based on 2012 operations which will air internationally. |
| • | Books and Other Publications – Shipwreck expeditions and projects are chronicled in various publications including books, newspaper articles, magazine features, archaeological reports, scientific articles, and professional journals. Our goal is to document thoroughly our shipwreck discoveries, while informing, entertaining and educating the general public as well as making our results accessible to the archaeological community. Two books have been published about the SS Republic shipwreck: “Lost Gold of the Republic” and “Bottles From the Deep.” Odyssey also developed and supports a number of educational programs, including shipwreck exploration and marine archaeology curriculum developed as an educational tool for our traveling exhibit, SHIPWRECK! Pirates & Treasure. The curriculum has also been used successfully as stand-alone lessons in both public and private schools. A variety of reports and publications are now available to the public, including 22 “Odyssey Papers” that are available on our website. Ten of our archaeological papers have been published by Oxbow books in a hard-cover book titled “Oceans Odyssey,” and an additional twelve papers are included in “Oceans Odyssey 2,” which became available in the second quarter of 2011. |
Sales and Marketing
Select artifacts considered “trade goods” (coins, bullion and other mass-produced cargo) are made available for sale to collectors only after conservation, thorough documentation and study. The cultural collection of artifacts is kept in our permanent collection for exhibit and further study or made available to museums or other institutions. Replicas are created of some of the permanent collection’s significant artifacts and are made available for sale.
The recovery of coins and artifacts from the SS Republic required us to create a marketing plan specifically to sell these coins and artifacts. Initially, coins were sold to independent coin dealers who sold them through direct marketing and television outlets. The SS Republic silver coin program was re-developed in the first quarter of 2008 to take advantage of emerging research on the silver coins from the SS Republic. This included the release of the 1861-O silver half dollar issued by the State of Louisiana in between the time it seceded from the Union and when it joined the Confederate States of America. Additionally, Odyssey continued to expand distribution channels in 2008 with a broader base of coin and collectible marketers, including opening markets overseas. In 2009, 2010 and 2011 we sold through several independent dealers of which two represented 72%, 83% and 90%, respectively, of total artifact sales. Artifact sales including coins were predominantly U.S. domestic-based even though we have distributors throughout the world.
3
Table of Contents
The availability of raw materials is primarily dependent on the success of finding intrinsically valuable cargoes from shipwrecks. We recovered over 51,000 coins (approximately 4,000 $10 and $20 gold coins and 47,000 silver half dollars) and approximately 14,000 non-coin artifacts from the SS Republic. As of December 31, 2011, we have a remaining inventory of approximately 27,000 silver coins.
During 2011 and 2010, our primary source of revenue was from expedition charter services. In 2011, two customers, Neptune Minerals, Inc. and Robert Fraser Partners LLP accounted for 97% or our charter services revenue. In 2010, two customers, Robert Fraser Partners LLP and Dorado Ocean Resources, accounted for 82% of our charter services revenue.
Archaeology and Science
Many of the shipwrecks we intend to pursue may have important historical and cultural characteristics. All historically or archaeologically significant projects undertaken will be subjected to stringent archaeological standards, thus adding to the body of knowledge of the people, the history and culture of the vessel’s time. Adherence to these principles is a core value of the Company, and in addition to satisfying professional international standards, will enhance shareholder value by increasing the economic value of the artifacts and intellectual property rights of each project.
Operational Projects and Status
We have numerous shipwreck and other deep-ocean projects in various stages of development around the world. In order to protect the targets of our planned search or recovery operations, in some cases we will defer disclosing specific information relating to our projects until we have located a shipwreck or other potentially valuable resources of interest and determined a course of action to protect our property rights.
“Atlas” Search Project
Between 2005 and 2011, we searched more than 5,000 square nautical miles of seabed in the western English Channel and the Western Approaches to the Channel, recording approximately 300 shipwrecks. The shipwrecks discovered include site “35-F,” the Marquise de Tornay, and HMS Victory (1744) as well as other identified and unidentified shipwrecks. Additional high-value targets are believed to be within the “Atlas” search area. Operations in the “Atlas” search area during 2011 included additional search, inspection and verification work on several targets.
HMS Victory Project
In 2008, Odyssey discovered HMS Victory and is, under international law, salvor-in-possession of the wreck. After a period of joint consultation between the UK Ministry of Defense and the UK Department for Culture, Media and Sport, and a public consultation period, the title to the HMS Victory was transferred to the Maritime Heritage Foundation in January 2012. The Foundation is a charity established to locate shipwrecks, investigate, recover and preserve artifacts to the highest archaeological standards and to promote knowledge and understanding of Britain’s maritime heritage, has now assumed responsibility for the future management of the wreck site. The Foundation has contracted with Odyssey to provide a full range of archaeological services.
Pursuant to an agreement with the Foundation, Odyssey has produced an extensive project design for the archaeological excavation of the site, including a complete plan for recording, documentation, conservation, publication and public education. The agreement calls for Odyssey’s project costs to be reimbursed and for Odyssey to be paid a percentage of the recovered artifacts’ fair value. The preferred option is for Odyssey to be compensated in cash. However, if the Foundation determines, based on the principles adopted for their collection management and curation policy, that it is in its best interest to de-accession certain artifacts, the Foundation may choose to compensate Odyssey with artifacts in lieu of cash.
Odyssey will receive the equivalent of 80% of the fair value of artifacts that were primarily used in trade or commerce or were private property and bear no direct connection to the construction, navigation, defense or crew of the ship, such as coins or other similar cargo. Odyssey will receive the equivalent of 50% of the fair value of all other recovered objects typically associated with the construction, crewing and sailing of ships including, but not limited to, the ship’s hull, fittings, fasteners, construction elements, clothing, organic remains, foodstuffs, cooking utensils, pottery, weapons, ammunition, ground tackle and navigational equipment. For any private property including coins or other cargo administered through the Receiver of Wreck, the Foundation has agreed that Odyssey shall receive 80% of the value.
4
Table of Contents
A Private Curatorship Program will be established for artifacts from the site considered by the Foundation to be suitable for de-accession to prevent their irretrievable dispersal and to allow ongoing scientific study.
We have recently completed an extensive non-intrusive preliminary survey of the Victory site, using several new advanced technologies which have provided a detailed three dimensional inspection of both the surface and sub-sedimentary portions of the site. We now have a detailed map which shows a total of at least 75 bronze cannon on the site, as well as differentiated deposits of both ferrous and non-ferrous metals. This data will be used to guide the preliminary excavation of the site, once the Foundation approves the commencement of this excavation. The Foundation has approved the Project Design which was required prior to the start of excavation, and it has been submitted to the Advisory Group chaired by the UK MOD for the purpose of opining as to whether the Project Design is consistent with the archaeological principles of the Rules of the UNESCO Convention. We are confident that the Research Design is consistent with these Rules, as they were followed precisely to conform with the archaeological principles as delineated.
“Gairsoppa” Project
On January 25, 2010, Odyssey was awarded the exclusive salvage contract for the cargo of the SS Gairsoppa by the United Kingdom (UK) Government Department for Transport. The contract was awarded after a competitive bid process.
The SS Gairsoppa was a 412-foot steel-hulled British cargo ship that was torpedoed by a German U-boat in February 1941 while enlisted in the service of the United Kingdom (UK) Ministry of War Transport. Contemporary research and official documents indicate that the ship was carrying £600,000 (1941 value) or up to 7 million total ounces of silver, including over 3 million ounces of private silver bullion insured by the UK government. The British Ministry of War Transport paid a War Risk Insurance Claim for £325,514 (in 1941 value) for 2,817 bars of silver that was reported to be on board the Gairsoppa when she sank.
Under the recovery contract, Odyssey assumes the risk, expense, and responsibility for the search, cargo recovery, documentation, and marketing of the cargo. Any monetary proceeds from the salvage will first be applied to reimbursement of Odyssey’s recovery and processing expenses. Any remaining monetary proceeds will next be divided with Odyssey retaining 80% of the net salved value, and 20% retained by the UK. This project aligns with our preferred strategy to focus our search and recovery activities on partnership projects with governments when appropriate, so as to provide straightforward legal contractual arrangements prior to our recovery efforts.
In June 2011, we executed a charter agreement to utilize the Russian Research Vessel Yuzhmorgeologiya to conduct search operations for the SS Gairsoppa. Search operations began in July 2011. On September 26, 2011, we announced confirmation of the identity and location of the SS Gairsoppa approximately 300 miles southwest of Galway, Ireland in waters approximately 4700 meters deep. We subsequently began acquiring and assembling the vessel, equipment, tools and team for the salvage. We anticipate salvage recovery operations will begin in late May to mid-June 2012.
Odyssey is planning a reconnaissance trip to the SS Gairsoppa site in March using an advanced ROV system which features a second miniature ROV similar to the one used to inspect the interior spaces on the Titanic. This system is capable of entering tiny spaces and sending high resolution video back to the ship in real time. This expedition may last up to a month and is designed to plan the recovery operations, including determination of the possible location of the silver cargo.
“Mantola” Project
Odyssey was also awarded the exclusive salvage contract for the cargo of the SS Mantola by the United Kingdom (UK) Government Department for Transport. On October 10, 2011, we announced the discovery of the SS Mantola, which sank on February 9, 1917, after being torpedoed by German submarine U-81. Odyssey discovered the shipwreck approximately 2,500 meters beneath the surface of the northern Atlantic Ocean, approximately 100 miles from the SS Gairsoppa shipwreck.
In 1917, the British Ministry of War Transport paid a War Risk Insurance Claim for £110,000 (in 1917 value) for silver that was reported to be on board the Mantola when she sank. This sum would equate to more than 600,000 ounces of silver based on silver prices in 1917. In September 2011, the UK Government Department for Transport awarded Odyssey a salvage contract for the cargo of the SS Mantola. The terms and conditions are similar to the SS Gairsoppa salvage contract. Under the agreement, Odyssey will retain 80% of the net salved silver value recovered.
We are planning to conduct the recovery expedition in conjunction with the SS Gairsoppa recovery.
5
Table of Contents
Robert Fraser Projects
Odyssey executed agreements in 2010 with clients of Robert Fraser & Partners LLP (RFP) for three shipwreck search projects code named “Firebrand,” “Shantaram” and “Enigma II.” In 2011, we also executed three additional projects, two of which were shipwrecks projects which provided additional work on projects of interest, and the other was for mineral exploration in the South Pacific.
In April 2010, we entered into agreements to provide project research and shipwreck search and survey services for a project code-named “Firebrand” to clients of RFP. Work has been completed in this area and the subject shipwreck has not been located.
In June 2010, we entered into agreements to provide project research and shipwreck search and survey services for a project code-named “Shantaram” with clients of RFP. The survey of the “Shantaram” search block was completed, and targets of interest have been inspected with a remotely operated vehicle. In March 2011, we entered into another agreement with RFP to provide the research vessel, equipment, technical and archaeological crew to conduct additional work on this site. The contract provides for cash payments totaling approximately U.S. $2.0 million to Odyssey, plus additional payments based upon revenue derived from the project. After the repayment of all recovery costs, Odyssey will receive 75% of net revenue until an additional £5.9 million (approximately U.S. $9.6 million) has been received and then will receive a minimum of 50% of further net revenue in accordance with the search contracts. This work has been completed, and while targets of interest were identified, including a portion of a shipwreck that bears the characteristics of the target shipwreck, the cargo of the project shipwreck was not identified. After analysis of the final data from this work is completed, a plan will be made regarding additional work on the project.
In September 2010, we executed agreements to provide supplementary project research and shipwreck search and survey services for a project code-named “Enigma II” with clients of RFP. (Our initial project with RFP, which began in November 2009 code-named “Enigma”, was completed in March 2010. Eight target sites were identified, including two sites that had some of the characteristics of the “Enigma” shipwreck. However, our subsequent analysis indicated that the sites were not the “Enigma.”) As part of the agreements for the “Enigma II” project, Odyssey furnished research related to the anticipated location of the “Enigma II” and agreed to provide the research vessel, equipment and crew to search a specified area and inspect targets in that area. Survey operations were completed in 2010. In January 2011, we executed agreements to provide additional marine archaeological excavation and related services on the “Enigma II” project to certain client companies of RFP. The work will be conducted on the shipwreck site that Odyssey discovered and inspected in order to verify the contents of the target shipwreck. The contract provides for cash payments totaling approximately U.S. $2.3 million to Odyssey (of which $2 million was received in 2011), plus additional payments based upon revenue derived from the project. After the repayment of all recovery costs, Odyssey will receive at least 50% of net revenue until an additional £1.9 million (approximately U.S. $3.0 million) has been received and then will receive a minimum of 50% of further net revenue in accordance with the search contracts. Subject to the verification of the shipwreck’s identity, the condition of the cargo and confirmation of jurisdiction for administering legal rights and title to the shipwreck and its cargo, Odyssey expects to enter into additional agreements for the complete archaeological excavation of the site and for the conservation and documentation of any artifacts recovered. Work on this project is anticipated to be conducted in 2012.
In April 2011, we executed an agreement to provide marine services including mining exploration and drilling operations to client companies of RFP in a tenement area controlled by Dorado Ocean Resources (now Neptune Minerals, Inc.). The drilling will be conducted on a Seafloor Massive Sulfide (SMS) deposit that was surveyed by the Odyssey and Dorado teams during the first 100 days of exploration in Dorado’s South Pacific concession areas in 2010. The contract provides for preliminary cash payments totaling approximately U.S. $1.4 million to Odyssey plus additional payments based upon revenue derived from the project. After the repayment of mining costs, Odyssey will receive 50.2% of net revenue until an additional £3.7 million (approximately U.S. $5.9 million) has been received. Work on this project is anticipated to be conducted in 2012.
Subsea Mineral Mining Exploration Projects
In November 2009, Odyssey acquired a 25% interest in SMM Project LLC, a company funded by a group of investors to bring together the licenses and skills of world renowned deep-ocean geologist Dr. Timothy McConachy of Bluewater Metals, the offshore coring and mining expertise of Robert Goodden and Subsea Minerals.
SMM Project LLC purchased a majority interest in Bluewater Metals Pty Ltd, an Australian company with licenses for mineral exploration of approximately 150,000 square kilometers of ocean floor in territorial waters controlled by four different countries in the South Pacific. A new business entity, Dorado Ocean Resources Ltd (DOR), a limited liability company organized in Hong Kong, was formed to focus on the exploration and monetization of gold, silver, zinc and copper-rich Seafloor Massive Sulfide (SMS) deposits. In April 2010, DOR acquired SMM Project LLC and the remaining interest in Bluewater.
In March 2010, Odyssey entered into a long-term charter agreement for a vessel, the Dorado Discovery, a 311-foot DP2 vessel which we mobilized with advanced mining and exploration equipment. Utilizing the vessel, equipment and proprietary expertise, we began subsea mineral exploration in the South Pacific in August 2010 under charter in areas covered by exploration permits held by DOR.
6
Table of Contents
In April 2010, we purchased 1,200 shares of DOR for a purchase price of U.S. $2.0 million. Under the terms of the Share Subscription Agreement, Odyssey had the option to pay for this investment in cash or by providing marine services to DOR over a three-year period. Odyssey also exchanged its five membership units in SMM Project, LLC for 450 DOR shares bringing Odyssey’s total ownership in DOR to approximately 41%.
The Dorado Discovery continued charter work conducting geological exploration services to Neptune Minerals, Inc. (NMI) to explore NMI’s tenements in the waters surrounding New Zealand in the first quarter 2011. This 50-day charter concluded in May 2011. Odyssey received $3.0 million in cash plus additional equity in Neptune for this charter.
In June 2011, NMI completed a share exchange with the stockholders of DOR whereby each one outstanding share of DOR was exchanged for 1,000 shares of NMI Class B non-voting common stock. Prior to the share exchange, Odyssey was a stockholder of DOR, and Odyssey received 1.65 million shares of NMI Class B non-voting common stock pursuant to the share exchange. In connection with the share exchange, NMI executed an assignment and assumption agreement, whereby NMI assumed $8.2 million of the outstanding debt of DOR owed to Odyssey. In addition, Odyssey executed a debt conversion agreement with NMI, whereby Odyssey converted $2.5 million of the debt for 2.5 million shares of NMI Class B non-voting common stock.
The vessel Dorado Discovery completed charter work conducting geological exploration services to NMI to explore NMI’s South Pacific tenement areas. The 100-day charter concluded in October 2011. The charter was valued at $6.9 million representing both cash and additional equity in Neptune. This expedition documented several new discoveries of SMS deposits with assay results indicating substantial incidence of high grade gold, silver, zinc and copper ore.
Odyssey is currently in negotiations to add advanced drilling and coring capabilities to the Dorado Discovery which will significantly enhance the ship’s ability to delineate and assess the potential value of ocean ore bodies. The company is currently in negotiations for a 120-day charter for drilling and coring which is expected to begin during the second quarter of 2012.
At December 31, 2011, we owned 6,216,500 shares (approximately 31% of NMI). To-date Neptune has been successful in attracting the investment capital required to fund mineral exploration expeditions and to facilitate its path to commercially viable ore extraction. Neptune’s most recent capital raise was for $12 per share of Class B common stock.
During December 2011, we chartered the Dorado Discovery vessel to Chatham Rock Phosphate, Ltd. for $1.2 million in relation to deep-ocean surveying. The charter permits Chatham to pay for services in either cash or common shares of their company. At December 31, 2011, Chatham was planning on a financing to pay for the charter. We did not record the revenue from this charter because of their liquidity and capital positions at that time. If and when Chatham completes their financing and remits payment to us, we will then recognize this revenue since all revenue accounting criteria will be satisfied. If the customer remits shares, this would relate to approximately 7.2 million shares which equates to an approximate 13% ownership based on their December 31, 2011 capital structure. We were informed in March 2012 that the capital raise is expected to be completed shortly that will pay us $4 million for work performed and additional charter services. Odyssey is planning on completing an additional second phase charter for Chatham Rock Phosphate by early April, 2012 assuming the financing has been completed. The first charter consisted of geophysical, environmental and sampling operations.
Other Syndication Projects
In February 2011, Odyssey closed on a project syndication deal with Galt Resources LLC (Galt). Odyssey received $7.5 million in cash from Galt to fund working capital of ongoing exploratory search operations for target projects. Odyssey elected not to increase the funding to $10 million which was permitted in the agreement. In return Galt received the rights to future revenues of the project(s) Galt was required to select prior to December 31, 2011. If the project(s) selected by Galt is successful and artifacts are sold by Odyssey, Galt will recoup their investment plus three times the investment. These amounts will be only be paid out of proceeds of the project. Galt will receive 50% of the proceeds until this amount is recouped. In addition, Galt will share in the future net proceeds of the project at the rate of 1% for every million invested. In January 2012, Odyssey and Galt agreed to bifurcate Galt’s selection between two projects, the SS Gairsoppa and HMS Victory. Galt will receive 50% of Odyssey’s net proceeds, if any, on the SS Gairsoppa project until Galt receives two times its initial investment of $7,512,500. Galt will also receive 50% of Odyssey’s net proceeds, if any, on the HMS Victory project until Galt receives two times its initial investment and thereafter will receive 7.5125% of Odyssey’s net proceeds from the HMS Victory project.
7
Table of Contents
HMS Sussex Project
On September 27, 2002, we entered into an agreement with the Government of the United Kingdom of Great Britain and Northern Ireland, which we refer to as Her Majesty’s Government (HMG), which allows us to conduct an archaeologically sensitive exploration of the shipwreck believed to be HMS Sussex and to recover artifacts from the shipwreck site. The agreement provided for us to submit a Project Plan to HMG concerning the equipment, personnel and methodologies we intend to use in the exploration of the shipwreck, and the conservation and documentation of any artifacts and cargo that may be recovered. This Plan was submitted and approved. We began exploration of the site during December 2005.
As a sovereign warship, HMS Sussex remains the property of HMG which, to our knowledge, has not been contested by the Spanish government or other entities. As part of the partnering agreement signed between Odyssey and HMG in 2002, the following sharing arrangements have been agreed upon with respect to the aggregate amount of the appraised values and/or selling prices of the artifacts, net of agreed selling expenses:
| Range |
British Government |
Odyssey | ||||||
| $0 – $45 million |
20 | % | 80 | % | ||||
| $45 million to $500 million |
50 | % | 50 | % | ||||
| Above $500 million |
60 | % | 40 | % | ||||
Our agreement with HMG is for a period of 20 years, and can only be terminated if:
| • | the shipwreck is not HMS Sussex; |
| • | we are in serious breach of our obligations under our agreement with HMG. |
The project has been delayed due to interference in Odyssey’s operations off the coast of Gibraltar by the Spanish Autonomous Region of Andalucía and the “Black Swan” project. See “Black Swan” in the next section.
Admiralty Legal Proceedings
“Black Swan”
On September 21, 2011, a panel of the Eleventh Circuit Court of Appeals upheld the dismissal of the case by the United States Federal District Court for the Middle District of Florida finding no subject matter jurisdiction under the Foreign Sovereign Immunities Act. Without concluding that the coins and artifacts recovered were owned by the Kingdom of Spain, the Court upheld the order to transfer all property to Spain based upon a finding that it was once carried aboard the Nuestra Senora de Las Mercedes, a Spanish naval vessel. The appeal had been argued before a panel of three judges. Odyssey and other claimants including the country of Peru filed Petitions for Rehearing En Banc, requesting that the entire Court hear the case. Those Motions were denied.
In an order issued January 31, 2012, the Eleventh Circuit Court of Appeals denied the company’s motion for a stay of mandate, which would have delayed execution of the order for release of the property to Spain. Odyssey then filed an Emergency Motion for Stay with the U.S. Supreme Court to stay the release until the high Court could consider the Company’s Petition for Writ of Certiorari in the case. Justice Clarence Thomas denied our request to stay the mandate, and subsequently, the Eleventh Circuit issued a mandate to the district court. On February 17, 2012 the district court held a hearing and entered its order to Odyssey to provide an inventory of artifacts and to release to Spain the artifacts within its jurisdiction to Spain by February 24, 2012. Odyssey complied with the Court order and the coins were taken by Spain to a local U.S. Air Force base for transport to Spain on February 23, 2012. Odyssey filed its Petition to the U.S. Supreme Court on February 27, 2012.
All of Odyssey’s significant filings to-date, including those made at the district court level, can be viewed at http://www.shipwreck.net/blackswanlegal.php.
Unidentified Shipwreck (Bray Case)
On March 31, 2011, the Eleventh Circuit Court of Appeals reversed the dismissal of the case ruling that an alleged oral agreement for purchase of research materials was a maritime contract. Upon remand to the district court, Plaintiff Bray filed an Amended Complaint seeking to rescind the written and fully performed contract, and adding yet more terms allegedly agreed upon over ten years ago prior to the written contract. Odyssey filed a Motion to Dismiss the Amended Complaint. On February 3, 2012, the district court entered an Order to Show Cause requesting Bray to explain why with no case or controversy, the Motion to Dismiss should not be granted. Bray’s response was due on or before February 24, 2012, but Bray filed a request for an extension of time to file. We will continue to vigorously defend against what we consider to be a frivolous claim.
8
Table of Contents
Legal and Political Issues
Odyssey works with a number of leading international maritime lawyers and policy experts to constantly monitor international legal initiatives that might affect our projects. As a matter of policy, we begin with the assumption that some entity, whether a government, private concern or insurance company, may have some rights to shipwrecks that are slated for search and recovery operations. Based on this assumption, a rigorous legal analysis is undertaken in order to ascertain which entities might be able to create roadblocks to a successful project. In some cases, such as that of HMS Sussex, it was determined that the most prudent mechanism for moving forward was to negotiate a contract with the owner of the vessel in order to manage the litigation risk.
In other cases, such as the SS Republic project, we entered into an agreement whereby we purchased the insurance company’s interest in the shipwreck and cargo, opening the way for an immediate grant of title to Odyssey by the federal court that had jurisdiction.
To the extent that we engage in shipwreck search and recovery activities in the territorial, contiguous or exclusive economic zones of countries, Odyssey intends to comply with verifiable applicable regulations and treaties. Prior to beginning operations for any project, the legal and political aspects are carefully researched to ascertain what effect these issues may have on the potential success of the operation.
These factors are taken into account in determining whether to proceed with a project as planned. Other factors, such as the UNESCO Convention for the Protection of Underwater Cultural Heritage are also taken into consideration. New political initiatives such as this Convention could require compliance with additional cultural resource management guidelines and regulations. Some of these will require adherence to strict archaeological practices and we intend to follow reasonable guidelines in all projects to which they are applicable. Greg Stemm, Odyssey’s Chief Executive Officer and co-founder, was a member of the United States delegation that negotiated the UNESCO Convention, and as such provides us with a thorough understanding of the underlying principles and ramifications of the Convention, and advance notice of other cultural resource management issues that might affect our projects.
The UNESCO Convention is not expected to impact operations in international waters, and the United States, the United Kingdom and other major maritime governments have already stated explicitly that they do not intend to sign the Convention. Nevertheless, some countries in whose waters we may consider working may sign or have already signed the Convention. While the UNESCO Convention states that artifacts may not be sold, it also states that this prohibition may not prevent the provision of archaeological services, and we intend to provide such services in contracts with governments.
We believe there will be increased interest in the protection of underwater cultural heritage throughout the oceans of the world. We are uniquely qualified to provide governments and international agencies with resources to help manage these resources while providing the public with educational, scientific, historical and entertainment initiatives that originate from our shipwreck exploration activities.
Competition
There are a number of companies that publicly identify themselves as engaged in aspects of the shipwreck business, but they do not compete directly with us as an established deep-ocean archaeological shipwreck exploration company. These entities include, but are not limited to Blue Water Ventures, Mel Fisher’s Treasures, Deep Blue Marine, Marine Exploration, Inc., Oceanic Research and Recovery, Seafarer Exploration, Deep6 Ltd., Sub Sea Research and UnderSea Recovery Corporation. It is possible that one of these companies or some currently unknown group may locate and recover a shipwreck on our project roster; however, due to the breadth of our historical and archival research, the already completed sonar and deep-water ROV inspection efforts, and the number of shipwreck projects in various stages of development, we do not believe that competition from one or more of these entities, known or unknown, would materially affect our operating plan or alter our current business strategy.
Cost of Environmental Compliance
With the exception of vessel operations and conservation activities, our general business operations do not expose us to environmental risks or hazards. We carry insurance that provides a layer of protection in the event of an environmental exposure resulting from the operation of our vessels. The cost of such coverage is minimal on an annual basis. We believe the risk associated with our conservation activities is minimal.
Executive Officers of the Registrant
The names, ages and positions of all the executive officers of the Company as of March 1, 2012 are listed below.
9
Table of Contents
Gregory P. Stemm (age 54) has served as Chief Executive Officer since January 3, 2008 and prior to June 2010 was also Chairman of the Board. Mr. Stemm previously served as Vice President, Research and Operations and as a member of the Board of Directors since May 1994. He served as Co-Chairman of the Board since February 24, 2006 until his present appointment.
Mark D. Gordon (age 51) has served as President and Chief Operating Officer since October 2007 and was appointed to the Board of Directors in January 2008. Previously Mr. Gordon served as Executive Vice President of Sales and Business Development since January 2007 after joining Odyssey as Director of Business Development in June 2005. Prior to joining Odyssey, Mr. Gordon owned and managed four different ventures (1987-2003).
Michael J. Holmes (age 62) has served as Chief Financial Officer since May 2004. Mr. Holmes joined Odyssey as Controller in March 2004 and had previously served in a variety of financial management positions with Anheuser-Busch Companies, Inc. including Vice President Finance, Sea World Orlando (1998-2003).
David A. Morris (age 61) has served as Secretary since August 1997 and Treasurer from August 1997 until May 2010.
Jay A. Nudi (age 48) has served as Principal Accounting Officer since January 2006 and joined Odyssey as Controller in May 2005. Mr. Nudi assumed the additional responsibilities of Treasurer in May 2010. Prior to joining Odyssey, Mr. Nudi served as Controller for The Axis Group in Atlanta (2003-2004). Previously he served as a consultant to various companies on specific value added engagements.
Laura L. Barton (age 49) was appointed Vice President of Communications in November 2007. Ms. Barton previously served as Director of Corporate Communications and Marketing for Odyssey since July 2003. Ms. Barton was previously President of LLB Communications, a marketing and communications consulting company whose customers included a variety of television networks, stations and distributors and the Company (1994-2003).
Melinda J. MacConnel (age 47) was appointed Vice President 2008. She joined Odyssey in March 2006 as a Legal Consultant and became Odyssey’s General Counsel in January 2007. Prior to joining the Company, Ms. MacConnel practiced law as a Litigation Consultant, providing counsel to attorneys in all areas of law.
Employees
As of December 31, 2011, we had 42 full-time employees, most working from our corporate offices in Tampa, Florida. Additionally, we contract personnel who operate our two vessels and technicians who perform marine survey and recovery operations on our vessels and from time to time we hire subcontractors and consultants to perform specific services.
Internet Access
Odyssey’s Forms 10-K, 10-Q, 8-K and all amendments to those reports are available without charge through Odyssey’s web site on the Internet as soon as reasonably practicable after they are electronically filed with, or furnished to, the Securities and Exchange Commission. They may be accessed as follows: www.shipwreck.net (SEC Filings Link).
You should carefully consider the following factors, in addition to the other information in this Annual Report on Form 10-K, in evaluating our company and our business. Our business, operations and financial condition are subject to various risks. The material risks are described below, and should be carefully considered in evaluating Odyssey or any investment decision relating to our securities. This section is intended only as a summary of the principal risks. If any of the following risks actually occur, our business, financial condition, or operating results could suffer. If this occurs, the trading price of our common stock could decline, and you could lose all or part of the money you paid to buy our common stock.
Our business involves a high degree of risk.
An investment in Odyssey is extremely speculative and of exceptionally high risk. Although we have access to a substantial amount of research and data which has been compiled regarding various shipwreck projects, the quality and reliability of such research and data is uncertain. Even if we are able to plan and obtain permits for our various projects, there is a possibility that the shipwrecks may have already been salvaged or may not be found, or may not have had anything valuable on board at the time of the sinking. Even if objects of value are located and recovered, there is the possibility that the excavation cost will exceed the value of the objects recovered or those others, including both private parties and governmental entities, will assert conflicting claims and challenge our rights to the recovered objects. Finally, even if we are successful in locating and retrieving objects from a shipwreck and establishing title to them, there are no assurances as to the value that such objects will bring at their sale, as the market for such objects is uncertain.
10
Table of Contents
The research and data we use may not be reliable.
The success of a shipwreck project is dependent to a substantial degree upon the research and data we have obtained. By its very nature, research and data regarding shipwrecks can be imprecise, incomplete and unreliable. It is often composed of or affected by numerous assumptions, rumors, legends, historical and scientific inaccuracies and misinterpretations which have become a part of such research and data over time.
Operations may be affected by natural hazards.
Underwater recovery operations are inherently difficult and dangerous and may be delayed or suspended by weather, sea conditions or other natural hazards. Further, such operations may be undertaken more safely during certain months of the year than others. We cannot guarantee that we, or the entities we are affiliated with, will be able to conduct search and recovery operations during favorable periods. In addition, even though sea conditions in a particular search location may be somewhat predictable, the possibility exists that unexpected conditions may occur that adversely affect our operations. It is also possible that natural hazards may prevent or significantly delay search and recovery operations.
We may be unable to establish our rights to any objects we recover.
Persons and entities other than Odyssey and entities we are affiliated with (both private and governmental) may claim title to the shipwrecks and/or valuable cargo that we may recover. Even if we are successful in locating and recovering shipwrecks and/or valuable cargo, we cannot assure we will be able to establish our right to property recovered if challenged by governmental entities, prior owners, or other attempted salvors claiming an interest therein. In such an event we could spend a great deal of time and money on a shipwreck project, and receive no salvage claim or revenue for our work.
The market for any objects we recover is uncertain.
Even if valuable items can be located and recovered in the future, it is difficult to predict the price that might be realized for such items. The value of recovered items will fluctuate with the precious metals market, which has been highly volatile in past years. In addition, the entrance on the market of a large supply of similar items from shipwrecks and/or valuable cargo located and recovered by others could depress the market.
We could experience delays in the disposition or sale of recovered objects.
The methods and channels that may be used in the disposition or sale of recovered items are uncertain at present and may include several alternatives. Ready access to buyers for any artifacts or other valuable items recovered cannot be guaranteed. Delays in the disposition of such items could adversely affect our cash flow.
Legal, political or civil issues could interfere with our recovery operations.
Legal, political or civil initiatives of countries and/or major maritime governments could restrict access to shipwrecks or interfere with our search and recovery operations.
Objects we recover could be stolen from us.
If we locate a shipwreck and assert a valid claim to items of value, there is a risk of theft of such items at sea by “pirates” or poachers before or after the recovery or while in transit to a safe destination as well as when stored in a secured location. Such thefts may not be adequately covered by insurance.
We may be unable to get permission to conduct salvage operations.
It is possible we will not be successful in obtaining title or permission to excavate certain wrecks. In addition, permits that are sought for the projects may never be issued, and if issued, may not be legal or honored by the entities that issued them.
Changes in our business strategy or restructuring of our businesses may increase our costs or otherwise affect the profitability of our businesses.
As changes in our business environment occur we may need to adjust our business strategies to meet these changes or we may otherwise find it necessary to restructure our operations or particular businesses or assets. When these changes or events occur, we may incur costs to change our business strategy and may need to write down the value of assets. In any of these events our costs may increase, and we may have significant charges associated with the write-down of assets.
We may be unsuccessful in raising the necessary capital to fund operations and capital expenditures.
Our ability to generate cash flow is dependent upon the success of our ability to recover and monetize high-value shipwrecks. However, we cannot guarantee that the sales of our products and other available cash sources will generate sufficient cash flow to meet our overall cash requirements. If cash flow is not sufficient to meet our business requirements, we will be required to raise additional capital through other financing activities. While we have been successful in raising the necessary funds in the past, there can be no assurance we can continue to do so in the future.
11
Table of Contents
We depend on key employees and face competition in hiring and retaining qualified employees.
Our employees are vital to our success, and our key management and other employees are difficult to replace. We currently do not have employment contracts with our key employees. We may not be able to retain highly qualified employees in the future which could adversely affect our business.
We may continue to experience significant losses from operations.
We have experienced a net loss in every fiscal year since our inception except for 2004. Our losses from operations were $16.2 million in 2011, $23.3 million in 2010 and $18.6 million in 2009. Even if we do generate operating income in one or more quarters in the future, subsequent developments in our industry, customer base, business or cost structure or an event such as significant litigation or a significant transaction may cause us to again experience operating losses. We may not become profitable for the long-term, or even for any quarter
Technological obsolescence of our marine assets or failure of critical equipment could put a strain on our capital requirements or operational capabilities.
We employ state-of-the-art technology including side-scan sonar, magnetometer, ROVs, and other advanced science and technology to locate and recover shipwrecks at depths previously unreachable in an economically feasible manner. Although we try to maintain redundancy on critical equipment and components, equipment failures may require us to delay or suspend operations. Also, while we endeavor to keep marine equipment in excellent working condition and current with all available upgrades, technological advances in new equipment may provide superior efficiencies than the capabilities of our existing equipment and this could require us to purchase new equipment which could require additional needs for capital.
We may not be able to contract with clients or customers for marine services or syndicated projects.
During 2011 and 2010 we recorded approximately $15 million and $21 million of revenue, respectively, by chartering vessels, equipment and crew and providing marine services to clients or customers. While the results of these syndicated projects were generally successful, the clients or customers may not be willing or financially able to continue with syndicated projects of this type in the future. Failure to secure such revenue producing contracts in the future would have a material impact on our revenue and operating cash flows.
ITEM 1B. UNRESOLVED STAFF COMMENTS
None.
We maintain our offices in Tampa, Florida where we purchased a 23,500 square-foot two story office building in 2004 to serve as our corporate and operations headquarters. In May 2008, we purchased a one story 8,100 square-foot commercial building in proximity to our corporate headquarters which is utilized by our conservation, research and archaeology departments. We believe these facilities are sufficient for our foreseeable needs.
See the information set forth under the heading “Admiralty Legal Proceedings” in Part I, Item 1 of this report for disclosure regarding certain admiralty legal proceedings in which Odyssey is involved. Such information is hereby incorporated by reference into this Part I, Item 3.
The Company is not currently a party to any material litigation other than the admiralty proceedings described in this Annual Report on Form 10-K. From time to time in the ordinary course of business, the Company may be subject to or may assert a variety of claims or lawsuits.
12
Table of Contents
PART II
ITEM 5. MARKET FOR REGISTRANT’S COMMON EQUITY, RELATED STOCKHOLDER MATTERS AND ISSUER PURCHASES OF EQUITY SECURITIES
Performance Graph
This performance graph shall not be deemed “filed” with the SEC or subject to Section 18 of the Exchange Act, nor shall it be deemed incorporated by reference in any of our filings under the Securities Act of 1933, as amended.
Assuming an investment of $100 on December 31, 2006, and reinvestment of all dividends, the graph below compares the cumulative total stockholder return on the Company’s Common Stock for the last five fiscal years with the cumulative return of the Standard & Poor’s 500 Market Index and the Russell 2000 Market Index.
COMPARISON OF FIVE-YEAR TOTAL RETURN AMONG ODYSSEY,
S&P 500 STOCK INDEX AND RUSSELL 2000 STOCK INDEX
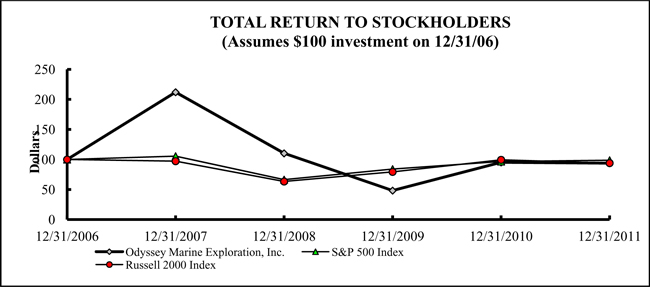
| Total Return Analysis |
12/31/2006 | 12/31/2007 | 12/31/2008 | 12/31/2009 | 12/31/2010 | 12/31/2011 | ||||||||||||||||||
| Odyssey Marine Exploration, Inc. |
$ | 100.00 | $ | 211.99 | $ | 110.27 | $ | 48.29 | $ | 95.21 | $ | 93.84 | ||||||||||||
| S&P 500 Index |
$ | 100.00 | $ | 105.49 | $ | 66.46 | $ | 84.04 | $ | 96.70 | $ | 98.68 | ||||||||||||
| Russell 2000 Index |
$ | 100.00 | $ | 97.25 | $ | 63.41 | $ | 79.40 | $ | 99.49 | $ | 94.07 | ||||||||||||
Price Range of Common Stock
On November 19, 2003, our common stock was listed on the American Stock Exchange and was traded under the symbol OMR. On July 10, 2007, trading of our common stock moved from the American Stock Exchange to the NASDAQ Capital Market under the symbol OMEX. The following table sets forth the high and low sale prices for our common stock during each quarter presented.
| Price | ||||||||
| High | Low | |||||||
| Quarter Ended |
||||||||
| March 31, 2010 |
$ | 1.56 | $ | 1.27 | ||||
| June 30, 2010 |
$ | 1.50 | $ | 0.94 | ||||
| September 30, 2010 |
$ | 1.95 | $ | 0.97 | ||||
| December 31, 2010 |
$ | 2.90 | $ | 1.73 | ||||
| Quarter Ended |
||||||||
| March 31, 2011 |
$ | 3.78 | $ | 2.32 | ||||
| June 30, 2011 |
$ | 4.43 | $ | 2.86 | ||||
| September 30, 2011 |
$ | 3.56 | $ | 1.80 | ||||
| December 31, 2011 |
$ | 3.06 | $ | 2.11 | ||||
13
Table of Contents
Approximate Number of Holders of Common Stock
The approximate number of record holders of our common stock at February 14, 2012 was 244. This does not include shareholders that hold their stock in accounts in street name with broker/dealers which approximate more than 11,000 shareholders.
Dividends
Holders of our common stock are entitled to receive such dividends as may be declared by our Board of Directors. No dividends have been declared with respect to our common stock or preferred stock and none are anticipated in the foreseeable future. Holders of our Series G 8% Convertible Preferred Stock accumulate dividends as described in NOTE Q of the financial statements. These dividends are not payable until declared by the Board of Directors.
Unregistered Sales of Equity Securities
There were no unregistered sales of equity securities during the year ended December 31, 2011 that have not been reported in a Current Report on Form 8-K.
Issuer Purchases of Equity Securities
There were no repurchases of shares of the Company’s common stock during the quarter ended December 31, 2011.
ITEM 6. SELECTED FINANCIAL DATA
The following table sets forth selected financial data, which should be read in conjunction with the Company’s Consolidated Financial Statements and the related notes to those statements included in “Item 8. Financial Statements and Supplementary Data” and with “Item 7. Management’s Discussion and Analysis of Financial Condition and Results of Operations” appearing elsewhere in this Form 10-K. The selected financial data have been derived from the Company’s audited financial statements.
| Years Ended December 31, | ||||||||||||||||||||
| Dollars in thousands except per share amounts | 2011 | 2010 | 2009 | 2008 | 2007 | |||||||||||||||
| Results of Operations |
||||||||||||||||||||
| Revenue |
$ | 15,727 | $ | 21,001 | $ | 4,347 | $ | 4,105 | $ | 6,147 | ||||||||||
| Net income (loss) |
(16,225 | ) | (23,343 | ) | (18,628 | ) | (24,841 | ) | (23,833 | ) | ||||||||||
| Earnings (loss) per share – basic |
(0.28 | ) | (0.36 | ) | (0.33 | ) | (0.50 | ) | (0.54 | ) | ||||||||||
| Earnings (loss) per share – diluted |
(0.28 | ) | (0.36 | ) | (0.33 | ) | (0.50 | ) | (0.54 | ) | ||||||||||
| Cash dividends per share |
— | — | — | — | — | |||||||||||||||
| Financial Position |
||||||||||||||||||||
| Assets |
$ | 23,414 | $ | 19,407 | $ | 20,256 | $ | 30,462 | $ | 38,558 | ||||||||||
| Long-term obligations |
5,690 | 2,776 | 2,950 | 3,123 | 2,601 | |||||||||||||||
| Shareholder’s equity (deficit) |
(9,775 | ) | (7,548 | ) | 7,562 | 18,125 | 30,199 | |||||||||||||
14
Table of Contents
ITEM 7. MANAGEMENT’S DISCUSSION AND ANALYSIS OF FINANCIAL CONDITION AND RESULTS OF OPERATIONS
The following discussion and analysis is intended to provide a narrative of our financial results and an evaluation of our financial condition and results of operations. The discussion should be read in conjunction with our consolidated financial statements and notes thereto. A description of our business is discussed in Item 1 of this report which contains an overview of our business as well as the status of our ongoing project operations.
Results of Operations
The dollar values discussed in the following tables, except as otherwise indicated, are approximations to the nearest $100,000 and therefore do not necessarily sum in columns or rows. For more detail refer to the Financial Statements and Supplementary Data in Item 8. The tables identify years 2011, 2010 and 2009, all of which included a twelve-month period fiscal year that ended December 31.
2011 Compared to 2010
| 2011 vs. 2010 | ||||||||||||||||
| (Dollars in millions) | 2011 | 2010 | $ | % | ||||||||||||
| Artifact sales and other |
$ | .9 | $ | .4 | $ | .5 | 118 | % | ||||||||
| Exhibit |
.2 | .1 | .1 | 48 | ||||||||||||
| Expedition charter |
14.7 | 20.5 | (5.8 | ) | (28 | ) | ||||||||||
|
|
|
|
|
|
|
|
|
|||||||||
| Total revenue |
$ | 15.7 | $ | 21.0 | $ | (5.3 | ) | (25 | )% | |||||||
|
|
|
|
|
|
|
|
|
|||||||||
| Cost of sales |
.4 | .2 | .2 | 117 | % | |||||||||||
| Operations and research |
21.3 | 19.6 | 1.7 | 8.8 | ||||||||||||
| Marketing, general and administrative |
9.4 | 9.2 | .2 | 3.0 | ||||||||||||
| Receivable reserves |
0 | 8.5 | (8.5 | ) | (100 | ) | ||||||||||
|
|
|
|
|
|
|
|
|
|||||||||
| Total operating expenses |
$ | 31.1 | $ | 37.4 | $ | (6.3 | ) | (17 | )% | |||||||
|
|
|
|
|
|
|
|
|
|||||||||
| Other income (expense) |
$ | (.9 | ) | $ | (6.9 | ) | $ | 6.1 | 88 | % | ||||||
|
|
|
|
|
|
|
|
|
|||||||||
Revenue
Revenue is generated through the sale of coins, artifacts and merchandise, the lease of our themed attraction exhibit and expedition charters.
Expedition charter revenue was $14.7 million in 2011 versus $20.5 million in 2010. In 2011, $2.9 million related to syndicated projects with the clients of Robert Fraser Partners LLP (RFP) that included two separate projects (Firebrand and Shantaram). In 2010, $9.0 million related to our syndicated projects with clients of RFP that included four separate projects (Enigma I and II, Firebrand and Shantaram). In 2011, revenue included $11.3 million which represented two separate charters with Neptune Minerals Inc. (NMI) for deep ocean mineral mining exploration. In 2010, $7.9 million represented charter services sold to Dorado Ocean Resources for deep ocean mineral mining exploration. RFP and NMI represented 97% of our expedition charter revenue in 2011. Other projects for 2011 included $.5 million for other miscellaneous commercial charters. In 2010, other miscellaneous charters included the ET 409 aircraft recovery and photomosaic project ($2.9 million) and $.7 million from other charter services.
Artifact sales and other revenues primarily include coin sales, but also include other artifacts, merchandise, commissions, and other miscellaneous revenue. Artifact and other revenues for 2011 and 2010 were $.9 million and $.4 million, respectively. The increase of $.5 million in artifact sales and other in 2011 was primarily due to several factors including the addition of a major new distributor in the first quarter 2011 and new marketing programs leveraging the 150th Anniversary of the Civil War. Additionally, authorized distributors invested in promoting the SS Republic product as it continued to be a collectible in high demand. Our artifact and other and exhibit revenue for 2011 and 2010 was predominantly U.S. domestic-based.
Exhibit revenue was $.2 million and $.1 million in 2011 and 2010, respectively. Odyssey’s SHIPWRECK! Pirates & Treasure is an interactive multi-media exhibit and features over 500 artifacts recovered from our deep-ocean shipwreck expeditions. The increase of $.1 million in 2011 was because Odyssey’s exhibit, SHIPWRECK! Pirates & Treasure, was on tour for four months in 2010 versus ten months on three separate tours in 2011. The non-booked months in 2010 were related to downtime for planned exhibit refurbishment after runs at five venues and over 600,000 visitors. The exhibit opened at the Witte Museum in San Antonio, Texas in October 2011 and ran through January 2012. In 2010 the exhibit was featured at two locations (Charlotte, North Carolina and Baltimore, Maryland). In 2011 the exhibit was featured at three locations (Baltimore, Maryland; Sarasota, Florida and San Antonio, Texas). The exhibit opened in February 2012 at the Mid America Science Museum in Hot Springs, Arkansas and will run through August 2012.
15
Table of Contents
Cost and Expenses
Cost of sales consists of shipwreck recovery costs, grading, conservation, packaging, and shipping costs associated with artifact and merchandise sales. The primary cost component is from the sale of coins. Cost of sales for coins increased 117% for 2011 versus 2010 primarily because we sold approximately 950 more coins in 2011 than in 2010. Actual cost as a percentage of coin sales was 49% and 49% in 2011 and 2010, respectively. There is no cost of sales component associated with the themed attraction and expedition charter revenues.
Operations and research expenses primarily include all costs within Archaeology, Conservation, Research, and Marine Operations, which include all vessel and charter operations. Operations and research expenses were $21.3 million in 2011, compared to $19.6 million in 2010. The unfavorable variance of $1.7 million was primarily due to vessel operations. The unfavorable variance of $2.5 million for the Dorado Discovery was the vessel only worked six months in 2010, but worked twelve months in 2011. The Odyssey Explorer was unfavorable $.6 million primarily due to repairs and maintenance. The Ocean Alert was favorable $.9 million (which is net of the $.6 million loss on the disposal of the asset) since it was not working in 2011 and was sold in September. The remaining favorable variance of $.5 million was due to the timing of project ship charters. In 2010, we chartered the Kommandor Stuart for seven months which worked on various shipwreck and commercial projects. In 2011, the Russian search vessel RV Yuzhmorgeologiya was chartered for approximately 70 days for work on the Gairsoppa and Mantola projects.
Marketing, general and administrative expenses primarily include all costs within the following departments: Executive, Finance & Accounting, Legal, Information Technology, Human Resources, Marketing & Communications, Sales and Business Development. Marketing, general and administrative expenses were $9.4 million in 2011 versus $9.2 million in 2010. The increase was primarily attributable to bank fees associated with renewal of our term loan in May 2011.
Odyssey did not have any additional receivable reserves in 2011. The receivable reserves of $8.5 million recognized in 2010 are discussed further in the section 2010 Compared to 2009 included within this section in Item 7.
Other Income or Expense
Other income and expense generally consists of interest income on investments offset by interest expense on our revolving credit facility and other loans. Beginning in the fourth quarter 2009, it also included the income or loss from our equity investment. Beginning in the fourth quarter 2010 it included the change in fair value of the derivatives related to our issuance of Series G preferred stock and the gain/(loss) on debt extinguishment. Beginning in the fourth quarter 2011 it also included the change in fair value of the derivatives related to the senior convertible notes and warrants issued in November 2011. Total other expense was $.9 million in 2011 and $6.9 million in 2010. The favorable difference of $6.1 million primarily represented the change in fair value of the financial derivative instruments of $8.6 million (see Note K of our Consolidated Financial Statements) offset by interest expense in connection with our senior convertible notes sold in November 2011 ($.2 million) and an increase in expense representing the loss on our equity investment ($2.3 million) in Neptune Minerals Inc. (See Note J of our Consolidated Financial Statements).
Income Taxes
We did not record any provision (benefit) for income taxes in 2011 or 2010. Due to the uncertainty surrounding the realization of deferred tax assets resulting from operating loss carryforwards, we recorded a full valuation allowance of $52.5 million against the deferred tax assets as of December 31, 2011 compared to $46.0 million as of December 31, 2010. As required by the Accounting for Income Taxes topic in the Accounting Standards Codification (“ASC”), we have evaluated whether it is more likely than not that the deferred tax assets will be realized. Based on the available evidence, we have concluded that it is more likely than not that those assets would not be realizable without the recovery of high-value shipwrecks and thus a valuation allowance has been recorded as of December 31, 2011. We anticipate that we will continue to incur net losses in 2012 pending any shipwreck cargo recoveries that could be quickly monetized (i.e., Gairsoppa or Victory projects). We will continue to reassess the need for a valuation allowance during each future reporting period.
16
Table of Contents
Liquidity and Capital Resources
| (Dollars in thousands) | 2011 | 2010 | ||||||
| Summary of Cash Flows: |
||||||||
| Net cash (used) by operating activities |
$ | (15,190 | ) | $ | (12,159 | ) | ||
| Net cash (used) by investing activities |
(489 | ) | (1,631 | ) | ||||
| Net cash provided by financing activities |
23,415 | 11,880 | ||||||
|
|
|
|
|
|||||
| Net increase in cash and cash equivalents |
$ | 7,736 | $ | (1,910 | ) | |||
| Beginning cash and cash equivalents |
236 | 2,145 | ||||||
|
|
|
|
|
|||||
| Ending cash and cash equivalents |
$ | 7,972 | $ | 236 | ||||
|
|
|
|
|
|||||
Discussion of Cash Flows
Net cash flow used in operating activities in 2011 was $15.2 million. This amount primarily reflected an operating loss of $16.2 million offset in part by non-cash items including depreciation and amortization ($1.9 million), share-based compensation ($1.6 million), change in fair value of derivatives liabilities primarily due to redemption of Series G preferred stock ($5.0 million), write down of vessel Ocean Alert of $.6 million based upon sale in 2011, and interest accretion and financing charge amortization on notes payable ($.7 million). Other working capital changes included a decrease in accounts payable and accrued expenses of $1.7 million, and an increase in deferred revenue of $2.8 million (representing cash receipts of $8.5 million offset by revenue recognized of $5.7 million on the “Firebrand,” “Enigma,” “Shantaram,” “Stanton A” and “Neptune” projects). The outstanding deferred revenue balance of $3.5 million represents work to be completed on the “Stanton A” and “Enigma” projects.
Net cash flow used in operating activities in 2010 was $12.2 million. This amount primarily reflected an operating loss of $23.3 million offset in part by non-cash items including depreciation and amortization ($2.2 million), share-based compensation ($2.1 million), loss from unconsolidated entity ($2.4 million), change in fair value of derivatives liabilities due to the issuance of Series G preferred stock ($3.6 million), and loss on extinguishment of debt and loan discount amortization related to the exchange of notes payable for Series G preferred stock ($.5 million). The overall net increase in accounts receivable, net of reserves of $8.5 million, is $1.8 million which primarily represents charter services for Dorado Ocean Resources. Other working capital changes included an increase in accounts payable and accrued expenses of $2.8 million ($2.1 million represents ship charter-related expenses), and a decrease in deferred revenue of $.5 million (representing cash receipts of $3.7 million offset by revenue recognized of $4.2 million on the “Firebrand,” “Enigma” and “Shantaram” projects).
Net cash flow used in investing activities for 2011 was $.5 million which primarily represented the purchase of marine property and equipment of $1.0 million offset by the proceeds for the sale of the Ocean Alert of $.5 million. Cash flows used in investing activities for 2010 of $1.6 million primarily represented marine property and equipment purchases for our business venture into subsea mineral mining and exploration.
Net cash flow provided by financing activities for 2011 was $23.4 million which primarily represented proceeds from the issuance of common stock ($15.6 million), an increase in deferred income from revenue participation rights on the Galt project ($7.5 million, see NOTE N), proceeds from the sale of convertible notes ($10.0 million), offset by payments of $1.0 million for dividends on the Series G convertible preferred stock and broker commissions on capital raises, $5.8 million on redemptions of Series G convertible preferred stock, and $2.9 million repayment of mortgage and notes payable. The deferred income increase represented the proceeds from the Galt project which will be amortized into revenue if, or when, the designated project is recovered and monetized.
Net cash flow provided by financing activities in 2010 was $11.9 million which included $6.2 million proceeds from the issuance and sale of common stock in January 2010 offset by fees related to the private offering of $.2 million, $1.9 million proceeds from the issuance of promissory notes in August 2010 (of which $1.0 million was exchanged for Series G preferred stock in October 2010), $5.1 million in proceeds from the sale of Series G preferred stock in October 2010, and repayment of $1.1 million of mortgage and loans payable ($.9 million of which related to the repayment of the promissory notes in October 2010).
17
Table of Contents
General Discussion 2011
At December 31, 2011, we had cash and cash equivalents of $8.0 million, an increase of $7.7 million from the December 31, 2010 balance of $.2 million.
In January 2011, we executed agreements to provide marine archaeological excavation and related services on an existing project to certain client companies of Robert Fraser & Partners LLP (RFP). The work was conducted on a shipwreck site that we discovered and inspected during a recently completed survey carried out under contract with the RFP client companies. The contract provides for cash payments totaling approximately $2.3 million to Odyssey (of which $2.1 million was received in the first quarter) plus additional payments based upon revenue derived from the project. We plan to begin work on this project later in 2012.
In February 2011, Odyssey closed on a project syndication deal with Galt Resources LLC. Odyssey has received approximately $7.5 million from Galt which represent rights to future revenues of the project Galt selects prior to December 31, 2011. If the project is successful, Galt will recoup their investment plus three times the investment. These amounts will be paid out of proceeds of the project. Galt will receive 50% of the proceeds until this amount is recouped. In addition they will share in the future net proceeds of the project at the rate of 1% for every million invested. In January 2012, Odyssey and Galt agreed to bifurcate Galt’s selection between two projects, the SS Gairsoppa and HMS Victory, subject to final executed agreements for the project. Galt will receive 50% of Odyssey’s net proceeds, if any, on the SS Gairsoppa project until Galt receives two (2) times its initial investment of $7,512,500. Galt will also receive 50% of Odyssey’s net proceeds, if any, on the HMS Victory project until Galt receives two (2) times its initial investment and thereafter will receive 7.5125% of Odyssey’s net proceeds from the HMS Victory project.
During February 2011, Odyssey entered into a charter agreement with Neptune Minerals PLC (a UK Company) and Neptune Minerals, Inc. (a Nevada Corp.) and Neptune Resources Ltd. (a New Zealand Company) for the Dorado Discovery to supply geological exploration services to Neptune Minerals to explore their tenements in the waters surrounding New Zealand in the first half of 2011. Odyssey received $3 million in cash for the charter services and also received a minority equity position in Neptune Minerals, Inc.
In March 2011, we executed an agreement with client companies of RFP to provide mining exploration and certain drilling operations in a tenement area controlled by Dorado Ocean Resources (now owned by Neptune Minerals, Inc.). The drilling operations would be conducted on a Seafloor Massive Sulfide (SMS) deposit that was surveyed by us during the first 100 days of exploration in Dorado’s South Pacific concession areas in 2010. We initially received $1.4 million with another $.1 million due at the start of the project plus additional payments based upon revenue derived from the project, if any. We plan to begin work on this project later in 2012.
Final payment of $.2 million was received in March 2011 for the Firebrand project which was completed in the second quarter 2011.
In March 2011, we executed agreements to expand a search and provide marine archaeological excavation and related services to certain client companies of RFP. Additional work was conducted on and around a site that we discovered and inspected during a recently completed survey carried out under contract with the RFP client companies. The contract provides for cash payments totaling approximately $2.0 million to Odyssey (of which $1.0 million was received in the first quarter and an additional $.8 million was received in April 2011), plus additional payments based upon revenue derived from the project. The work has been completed and the target shipwreck was not located.
In April 2011, we entered into separate agreements with two holders of our Series G 8% Convertible Preferred Stock. The two holders represented $5,250,000 of the original $6,000,000 Series G Convertible Preferred Stock issued on October 12, 2010. The Certificate of Designation relating to the Series G Convertible Preferred Stock includes (a) an option for the holders thereof to convert their shares of Series G Preferred Stock into shares of common stock that became exercisable on April 15, 2011, and (b) an option for the holders to redeem the shares of Series G Convertible Preferred Stock at any time after December 15, 2011, with the redemption price increasing by 1% per every month beginning April 1, 2011. In consideration of the issuance by Odyssey of warrants to purchase an additional 525,000 shares of common stock at an exercise price of $2.75 per share, the holders agreed to extend by six months the dates upon which the conversion option and the redemption option become exercisable and date upon which the redemption price begins to increase by 1% per month. The shares of Series G Convertible Preferred Stock held by the remaining holders, representing $750,000 of the offering, were redeemed in April 2011 in accordance with the Certificate of Designation (See NOTE Q to our Consolidated Financial Statements). Also, in October 2011, Odyssey redeemed the largest holder of the Series G Preferred Stock for $5.0 million plus accrued dividends. The amount of Series G Convertible Preferred Stock remaining to be either converted to common stock or redeemed is $.3 million plus accrued dividends.
18
Table of Contents
In June 2011, Neptune completed a share exchange with the stockholders of Dorado whereby each one outstanding share of DOR was exchanged for 1,000 shares of NMI Class B non-voting common stock. Prior to the share exchange, Odyssey was a stockholder of DOR, and we received 1.65 million shares of NMI Class B non-voting common stock pursuant to the share exchange. In connection with the share exchange, NMI executed an assignment and assumption agreement, whereby NMI assumed $8.2 million of the outstanding debt of DOR owed to us. In addition, we executed a debt conversion agreement with NMI, whereby we converted $2.5 million of the debt for 2.5 million shares of NMI Class B non-voting common stock (See NOTE J to our Consolidated Financial Statements).
In June 2011, our stockholders approved an amendment to our articles of incorporation to increase the number of shares of common stock, par value $0.0001 per share, from 100,000,000 to 150,000,000. We filed the amendment on June 6, 2011.
In June 2011, we entered into a charter agreement with Neptune, Bluewater Metals (South Pacific) Ltd., and Bluewater Metals (Solomon Islands) Ltd. for the Dorado Discovery to supply geological exploration services to Neptune Minerals to explore tenements in the waters of the South Pacific previously held by Dorado. We received $6.9 million for our services in a combination of cash and additional equity in Neptune. As of December 31, 2011, we had approximately a 32 % equity ownership in Neptune (See NOTE J to our Consolidated Financial Statements).
On June 21, 2011 Odyssey completed a public offering of 5,520,000 shares of common stock at a price to the public of $3.05 whereby Odyssey received $15.6 million in net proceeds. We intend to use the net proceeds from the offering for shipwreck exploration and recovery projects, other working capital and for general corporate purposes.
On June 27, 2011, we announced we were added to the Russell 3000® and Russell Global® Indexes as of close of trading on Friday, June 24, 2011, and will remain in place for the ensuing 12-month period. All Russell indexes are subindexes of the Global Index. The addition to the Russell 3000® and Russell Global® Indexes will expand awareness of our company among institutional investors as we continue to execute our growth strategy.
On November 8, 2011, we entered into a securities purchase agreement with one institutional investor pursuant to which Odyssey issued and sold a senior convertible note in the original principal amount of $10.0 million and a warrant to purchase up to 1,302,083 shares of Odyssey’s common stock for an aggregate purchase price of $10.0 million. Subject to the satisfaction of conditions set forth in the Purchase Agreement, Odyssey has the right to require the investor to purchase an additional senior convertible note in the original principal amount of up to $5.0 million on the six-month anniversary of the initial closing date. The indebtedness evidenced by the Notes bears interest at 8.0% percent per year, payable quarterly, and matures on the 30-month anniversary of the initial closing date. (See Note L to the Consolidated Financial Statements).
During December 2011, we chartered the Dorado Discovery vessel to Chatham Rock Phosphate, Ltd. for $1.2 million in relation to deep-ocean surveying. The charter permits Chatham to pay for services in either cash or common shares of their company. At December 31, 2011, Chatham was planning on a financing to pay for the charter. We did not record the revenue from this charter because of their liquidity and capital positions at that time. If and when Chatham completes their financing and remits payment to us, we will then recognize this revenue since all revenue accounting criteria will be satisfied. If the customer remits shares, this would relate to approximately 7.2 million shares which equates to an approximate 13% ownership based on their December 31, 2011 capital structure. We were informed in March 2012 that the capital raise is expected to be completed shortly that will pay us $4 million for work performed and additional charter services. Odyssey is planning on completing an additional second phase charter for Chatham Rock Phosphate by early April, 2012 assuming the financing has been completed. The first charter consisted of geophysical, environmental and sampling operations.
Bank Term Loan
On May 4, 2011, we amended our revolving credit facility to replace it with a $5 million term loan maturing on April 23, 2012. A principal payment of $2 million was due and paid by August 1, 2011 with the remainder due upon maturity. The facility bears a floating interest rate at the one month LIBOR rate according to the Wall Street Journal plus 500 basis points. Any prepayments made in full or in part are without premium or penalty. A commitment fee of $250,000 was payable at closing. No restricted cash payments will need to be kept on deposit. As a condition to the loan renewal, we were required to amend the mortgage loan whereby we are required to pay additional principal to meet an 80% loan-to-value (LTV) based upon an independent real estate appraisal. The additional principal payments will be at $100,000 per month until the loan balance meets the 80% LTV. Based on this condition, we commenced the repayment of $.6 million starting in July 2011. The amended term loan is secured by approximately 27,000 numismatic coins recovered from the SS Republic shipwreck, which amount will be reduced over the term by the amount of coins sold by the Company. The coins used as collateral are held by a custodian for the security of the Bank. The borrowing base is equal to forty percent (40%) of the eligible coin inventory valued on a rolling twelve-month wholesale average value ($16.3 million as of December 31, 2011). The Company is required to comply with a number of customary covenants. In March 2012, the bank provided Odyssey a term sheet which increases the term loan to $5 million (an additional $2 million) with similar terms and conditions as our existing term loan. We expect to close on this new term loan within the next month.
19
Table of Contents
Trends and Uncertainties
Our current 2012 business plan estimates positive cash flow from operating activities. The plan contains assumptions which include that several of our planned projects are funded through project debt-type financings, syndications or other partnership opportunities. The 2012 business plan expenses include a 90-day charter agreement which we recently executed with a company to provide a ship and equipment to conduct recovery operations on the Gairsoppa and Mantola projects (see Note W of the Consolidated Financial Statements). One or more of these projected project financing or partnership opportunities may not be realized which may require the need for additional cash. Based upon our current expectations, we believe our cash position will be sufficient to fund operating cash flows throughout the rest of 2012 taking into account our beginning cash balance, current cash flow expectations and revenues from multiple sources, including projected sales, syndicated projects and potential debt financing opportunities and the available $5 million convertible debt facility We have recently received a term sheet from Fifth Third Bank which will increase our existing term loan to $5 million through July 2013. We have experienced several years of net losses resulting in a stockholders’ deficit. Our capacity to generate net income in future periods is dependent upon our success in recovering and monetizing high-value shipwrecks, or to generate income from other projects. However, it is likely that we could monetize a significant portion of the Gairsoppa and Mantola projects in 2012 which could fund our operations for future periods. If cash flow is not sufficient to meet our projected business plan requirements, we will be required to raise additional capital or curtail expenses. While we have been successful in raising the necessary funds in the past, there can be no assurance that we can continue to do so in 2012.
2010 Compared to 2009
| 2010 vs. 2009 | ||||||||||||||||
| (Dollars in millions) | 2010 | 2009 | $ | % | ||||||||||||
| Artifact sales and other |
$ | .4 | $ | 1.6 | $ | (1.2 | ) | (76 | )% | |||||||
| Exhibit |
.1 | .6 | (.5 | ) | (76 | ) | ||||||||||
| Expedition charter |
20.5 | 2.1 | 18.4 | 867 | ||||||||||||
|
|
|
|
|
|
|
|
|
|||||||||
| Total revenue |
$ | 21.0 | $ | 4.3 | $ | 16.7 | 383 | % | ||||||||
|
|
|
|
|
|
|
|
|
|||||||||
| Cost of sales |
.2 | .7 | (.5 | ) | (72 | ) | ||||||||||
| Operations and research |
19.6 | 12.6 | 7.0 | 55 | ||||||||||||
| Marketing, general and administrative |
9.2 | 9.4 | (0.3 | ) | (3 | ) | ||||||||||
| Receivable reserves |
8.5 | — | 8.5 | na | ||||||||||||
|
|
|
|
|
|
|
|
|
|||||||||
| Total operating expenses |
$ | 37.4 | $ | 22.7 | $ | 14.7 | 65 | % | ||||||||
|
|
|
|
|
|
|
|
|
|||||||||
| Other income (expense) |
$ | (6.9 | ) | $ | (0.3 | ) | (6.7 | ) | (2,436 | )% | ||||||
|
|
|
|
|
|
|
|
|
|||||||||
Revenue
Expedition charter revenue was $20.5 million in 2010 versus $2.1 million in 2009. In 2010, $9.0 million related to our syndicated projects with clients of Robert Fraser Partners LLP (RFP) that included four separate projects (Enigma I and II, Firebrand and Shantaram). Also in 2010, $7.9 million represented charter services sold to Dorado Ocean Resources for deep ocean mineral mining exploration. These two customers represented 82% of our expedition charter revenue in 2010. Other projects for 2010 included the ET 409 aircraft recovery and photomosaic project ($2.9 million) and $.7 million from other charter services. During the fourth quarter 2009 we initiated the first RFP project ($2.0 million) for research, shipwreck search and survey services related to the “Enigma I” project.
Artifact and other revenues for 2010 and 2009 were $.4 million and $1.6 million, respectively. We believe the decrease of $1.2 million in artifact sales and other in 2010 primarily related to overall poor economic conditions and availability of new product offerings. Our artifact and other and exhibit revenue for 2010 and 2009 was predominantly U.S. domestic-based.
Exhibit revenue was $.1 million and $.6 million in 2010 and 2009, respectively. Odyssey’s SHIPWRECK! Pirates & Treasure is an interactive multi-media exhibit and features hundreds of artifacts recovered from our deep-ocean shipwreck expeditions. The decrease of $.5 million in 2010 because Odyssey’s exhibit, SHIPWRECK! Pirates & Treasure, was on tour for four months in 2010 versus eleven months on two separate tours in 2009. The non-booked months in 2010 were related to downtime for planned exhibit refurbishment after runs at five venues and over 600,000 visitors. The exhibit opened at the Maryland Science Center in Baltimore on October 1, 2010 and ran through January 31, 2011. In 2009 the exhibit was featured at two locations (Oklahoma City and Charlotte, North Carolina). Exhibit revenue varied dependent on the type of contract which was either a fixed rental or a per visitor basis.
20
Table of Contents
Cost and Expenses
The primary cost component is from the sale of coins. Cost of sales for coins decreased 72% for 2010 versus 2009 primarily because of fewer coins sold in 2010. Actual cost as a percentage of coin sales was 41% and 44% in 2010 and 2009, respectively. There is no cost of sales component associated with the themed attraction and expedition charter revenues.
Operations and research expenses were $19.6 million in 2010, compared to $12.6 million in 2009. The $7.0 million increase, or 55%, was primarily related to our two chartered vessels ($8.5 million). The Dorado Discovery vessel comprised $6.0 million of the increase and has completed its charter with Dorado Ocean Resources Ltd. in mid-December after a successful four month charter in the South Pacific. Our second chartered vessel, which comprised $2.5 million of the increase, was deployed during the second quarter 2010 to work on the “Shantaram” project and then was sub-chartered to a third party in the third quarter and went off-charter in the fourth quarter. The unfavorable charter variances were primarily offset by favorable variances for our two owned vessels, most of which represented the Ocean Alert which has been in port for the latter part of 2010. The Ocean Alert was sold in September 2011.
Marketing, general and administrative expenses were $9.2 million in 2010 versus $9.4 million in 2009. The decrease was primarily attributable to reduced corporate overhead of $.3 million including professional fees and expenses and depreciation.
Receivable reserves of $8.5 million in 2010 include approximately $1.5 million which related to the sale of research for the “Shantaram” project which has not been received. Since this amount was not paid, Odyssey will receive an additional percentage of approximately up to 11% of the net proceeds assuming the target project is located. The additional reserve of $6.9 million represents the net amount due from DOR for charter services (see Note E to the Consolidated Financial Statements). The DOR reserve does not include $2.0 million of receivables which can be offset against our subscription payable to DOR. We believe that we may receive the economic benefit of all or a portion of the receivable in 2012 that relates to the reserve that has been established and will continue to evaluate this asset accordingly in future periods.
Other Income or Expense
Other income and expense generally consists of interest income on investments offset by interest expense on our revolving credit facility and other loans. Beginning in the fourth quarter 2009, it also included the income or loss from our equity investment. Beginning in the fourth quarter 2010 it included the change in fair value of the derivatives related to our issuance of Series G preferred stock and the gain/(loss) on debt extinguishment. Total other expense was $6.9 million in 2010 and $.3 million in 2009. The unfavorable difference of $6.7 million primarily represented the change in fair value of the derivatives related to the Series G Redeemable Preferred Stock ($3.6 million) and loss on our equity investment in Dorado Ocean Resources ($2.4 million) which has been recorded pursuant to Accounting Standards Codifications. See Notes K and Q of our Consolidated Financial Statements for the discussion of the derivative loss and redeemable preferred stock and Note J for our loss on our equity investment. Other items included the loss on debt extinguishment of $.4 million which resulted from our exchange of notes payable for an investment in the Series G preferred stock (see Note Q of our Consolidated Financial Statements) and $.5 million for interest expense on our revolving line of credit and other loans.
Income Taxes
We did not record any provision (benefit) for income taxes in 2010 or 2009. Due to the uncertainty surrounding the realization of deferred tax assets resulting from operating loss carryforwards, we recorded a full valuation allowance of $45.9 million against the deferred tax assets as of December 31, 2010 compared to $39.7 million as of December 31, 2009. As required by the Accounting for Income Taxes topic in the Accounting Standards Codification (“ASC”), we have evaluated whether it is more likely than not that the deferred tax assets will be realized. Based on the available evidence, we have concluded that it is more likely than not that those assets would not be realizable without the recovery of high-value shipwrecks and thus a valuation allowance has been recorded as of December 31, 2010. We anticipate that net losses will be incurred in 2012 pending any shipwreck cargo recoveries that may be monetized (i.e., Gairsoppa, Mantola or Victory projects). We will continue to reassess the need for a valuation allowance during each future reporting period.
21
Table of Contents
Liquidity and Capital Resources
| (Dollars in thousands) | 2010 | 2009 | ||||||
| Summary of Cash Flows: |
||||||||
| Net cash (used) by operating activities |
$ | (12,159 | ) | $ | (12,597 | ) | ||
| Net cash (used) by investing activities |
(1,631 | ) | (1,650 | ) | ||||
| Net cash provided by financing activities |
11,880 | 5,652 | ||||||
|
|
|
|
|
|||||
| Net increase (decrease) in cash and cash equivalents |
$ | (1,910 | ) | $ | (8,595 | ) | ||
| Beginning cash and cash equivalents |
2,145 | 10,740 | ||||||
|
|
|
|
|
|||||
| Ending cash and cash equivalents |
$ | 236 | $ | 2,145 | ||||
|
|
|
|
|
|||||
Discussion of Cash Flows
Net cash used in operating activities in 2010 was $12.2 million. This amount primarily reflected an operating loss of $23.3 million offset in part by non-cash items including depreciation and amortization ($2.2 million), share-based compensation ($2.1 million), loss from unconsolidated entity ($2.4 million), change in fair value of derivatives liabilities due to the issuance of Series G preferred stock ($3.6 million), and loss on extinguishment of debt and loan discount amortization related to the exchange of notes payable for Series G preferred stock ($.5 million). The overall net increase in accounts receivable, net of reserves of $8.5 million, is $1.8 million which primarily represents charter services for DOR (see Item 7., Cost and Expenses discussion). Other working capital changes included an increase in accounts payable and accrued expenses of $2.8 million ($2.1 million represents ship charter-related expenses), and a decrease in deferred revenue of $.5 million (representing cash receipts of $3.7 million offset by revenue recognized of $4.2 million on the “Firebrand,” “Enigma” and “Shantaram” projects). Net cash used in operating activities in 2009 was $12.6 million. This amount primarily reflected an operating loss of $18.6 million offset in part by non-cash items including depreciation and amortization ($2.3 million), share-based compensation ($2.0 million), loss from equity investment ($.1 million), increase in accrued expenses and deferred revenue ($1.4 million) and accounts payable ($.6 million), a decrease in inventory ($.6 million), accounts receivable ($.2 million) and restricted cash ($.1 million) required by our credit facility and building mortgage with Fifth Third Bank.
Cash flows used in investing activities were $1.6 million and $1.6 million for the twelve months in 2010 and 2009, respectively. Cash flows used in investing activities for 2010 of $1.6 million primarily represented marine property and equipment purchases for our business venture into subsea mineral mining and exploration. Cash used in investing activities in 2009 included the purchase of $.8 million of vessel-related property and equipment, $.3 million of capitalized maintenance for major overhaul of the Ocean Alert tail shaft, and $.5 million for our equity investment in SMM Project LLC to pursue opportunities in the exploration of deep-ocean gold and copper deposits.
Cash flows provided by financing activities in 2010 were $11.9 million which included $6.2 million proceeds from the issuance and sale of common stock in January 2010 offset by fees related to the private offering of $.2 million, $1.8 million proceeds from the issuance of promissory notes in August 2010 (of which $1.0 million was exchanged for Series G preferred stock in October 2010), $5.1 million in proceeds from the sale of Series G preferred stock in October 2010, and repayment of $1.0 million of mortgage and loans payable ($.9 million of which related to the repayment of the promissory notes in October 2010). Cash flows provided by financing activities for 2009 were $5.7 million which primarily included $5.9 million from the issuance of common stock and exercise of warrants offset by loan repayments of $.2 million.
General Discussion 2010
At December 31, 2010, we had cash and cash equivalents of $.2 million, a decrease of $1.9 million from the December 31, 2009 balance of $2.1 million.
Equity-Related
During January 2010, we entered into individual purchase agreements with certain investors pursuant to which we sold an aggregate of 4,000,000 shares of Odyssey’s common stock and warrants to purchase up to 2,400,000 shares of common stock to such investors. The common stock and warrants were sold as units, with each unit consisting of one share of common stock and a warrant to purchase 0.6 shares of common stock. The purchase price for each unit was $1.565. The warrants have an exercise price of $2.25 per share of common stock and are exercisable in accordance with their terms at any time on or before the close of business on January 29, 2013. The net proceeds to us from the registered direct public offering, after deducting placement agent fees and its offering expenses, and excluding the proceeds from the exercise of the warrants issued in the offering, were $6.1 million.
22
Table of Contents
On February 12, 2010, we issued 500,000 shares of common stock to one institutional investor. The shares of common stock were issued upon conversion of 500,000 outstanding shares of our Series D Convertible Preferred Stock that were originally purchased in January 2007.
On March 18, 2010, we issued 600,000 shares of common stock to one institutional investor. The shares of common stock were issued upon conversion of 600,000 outstanding shares of the Odyssey’s Series D Convertible Preferred Stock that were originally purchased in May 2007.
On April 20, 2010, we issued 600,000 shares of common stock to one institutional investor. The shares of common stock were issued upon conversion of 600,000 outstanding shares of the Company’s Series D Convertible Preferred Stock that were originally purchased in May 2007.
On April 30, 2010, SMM Project LLC was acquired by Dorado Ocean Resources Ltd (DOR) through a stock exchange agreement. We were issued 450 DOR shares in exchange for our surrendered shares in SMM. Additionally, we invested $2 million dollars for 1,200 shares of DOR resulting in a 41.25% ownership of DOR. Under the terms of the Share Subscription Agreement, we have the option to pay for this investment in cash or by providing marine services to DOR over a three-year period.
On May 6, 2010, we issued 1,300,000 shares of common stock to one institutional investor. The shares of common stock were issued upon conversion of 13 outstanding shares of the Odyssey’s Series E Convertible Preferred Stock that were originally purchased in September 2007. The Series E Convertible Preferred Stock was convertible into 100,000 shares common for every one share of preferred. As a result of the conversion, there are no longer any shares of Series E Convertible Preferred Stock outstanding.
On June 3, 2010, shareholders approved the proposal at the annual meeting to amend the 2005 Incentive Stock Plan by adding 3,000,000 shares of common stock to the Plan. An S-8 Registration was filed in August 2010 for the additional shares.
On August 20, 2010, we entered into individual purchase agreements with certain investors to issue and sell promissory notes in the principal amount of $1.8 million and warrants to purchase an aggregate of 270,000 shares of common stock. The notes bear interest at a rate equal to 5.0% per annum, and all principal and accrued interest was due and payable on or before December 18, 2010. The warrants had an exercise price of $2.25 per share of common stock and will be exercisable in accordance with their terms at any time on or before the close of business on August 20, 2013. All the notes were paid in full as of October 18, 2010.
On October 6, 2010, we entered into separate purchase agreements with certain investors to sell 24 shares of Series G 8% Convertible Preferred Stock, par value $0.0001 per share, and warrants to purchase up to 1,800,000 shares of Odyssey’s common stock to such investors. The Series G Preferred stock and warrants were offered as units, with each unit consisting of one share of Preferred Stock and a Warrant to purchase 75,000 shares of common stock. The purchase price for each unit was $250,000. The transaction closed on October 12, 2010, and we sold 20 of the units for cash, and four of the units were issued upon tender of an aggregate of $1.0 million of principal amount of the promissory notes that Odyssey issued in August 2010 by the holders thereof. Accordingly, the net cash proceeds to Odyssey were approximately $5.0 million. See Note Q to the Consolidated Financial Statements for further information and the accounting for this transaction.
Bank Credit Facility
On April 23, 2010, we renewed our $5.0 million revolving credit facility with Fifth Third Bank (the “Bank”). The renewed credit facility has a floating interest rate equal to the “Prime Rate” plus one hundred and fifty basis points (1.50%), requires monthly payments of interest only, and is due in full April 23, 2011. The Company was also required to pay the Bank an unused line fee equal to 0.50% per annum of the unused portion of the credit line.
The line of credit is secured by approximately 27,000 numismatic coins recovered from the SS Republic shipwreck, which amount will be reduced over the term by the amount of coins sold by the Company. The coins used as collateral are held by a custodian for the security of the Bank. The borrowing base is equal to forty percent (40%) of the eligible coin inventory valued on a rolling twelve-month wholesale average value. The Company is required to comply with a number of customary covenants. At December 31, 2010, the credit line was fully extended. The revolving credit facility was renewed for $3 million into a term loan in May 2011.
Off Balance Sheet Arrangements
We do not engage in off-balance sheet financing arrangements. In particular, we do not have any interest in so-called limited purpose entities, which include special purpose entities (SPEs) and structured finance entities.
23
Table of Contents
Indemnification Provisions
Under our bylaws and certain consulting agreements, we have agreed to indemnify our officers and directors for certain events arising as a result of the officer’s or director’s serving in such capacity. Separate agreements may provide indemnification after term of service. The term of the indemnification agreement is as long as the officer or director remains in the employment of the company. The maximum potential amount of future payments we could be required to make under these indemnification agreements is unlimited. However, our director and officer liability insurance policy limits its exposure and enables us to recover a portion of any future amounts paid. As a result of our insurance policy coverage, we believe the estimated fair value of these indemnification agreements is minimal and no liabilities are recorded for these agreements as of December 31, 2011.
Critical Accounting Estimates
The discussion and analysis of our financial position and results of operations is based upon our financial statements, which have been prepared in accordance with accounting principles generally accepted in the U.S. The preparation of these financial statements requires us to make estimates and judgments that affect our financial position and results of operations. See Note A to the Consolidated Financial Statements for a description of our significant accounting policies. Critical accounting estimates are defined as those that are reflective of significant judgment and uncertainties, and potentially result in materially different results under different assumptions and conditions. We have identified the following critical accounting estimates. We have discussed the development, selection and disclosure of these policies with our audit committee.
Long-Lived Assets
As of December 31, 2011, we had approximately $6.5 million of property and equipment and related assets. Our policy is to recognize impairment losses relating to long-lived assets in accordance with the ASC topic for Property, Plant and Equipment. Impairment decisions are based on several factors, including, but not limited to, management’s plans for future operations, recent operating results and projected cash flows.
Realizability of Deferred Tax Assets
We have recorded a net deferred tax asset of $0 at December 31, 2011. As required by the Accounting for Income Taxes topic in the ASC, we have evaluated whether it is more likely than not that the deferred tax assets will be realized. Based on the available evidence, we have concluded that it is more likely than not that those assets would not be realizable without the recovery and rights of ownership or salvage rights of high value shipwrecks and thus a valuation allowance of $52.8million has been recorded as of December 31, 2011.
Artifact Inventory
The value of recovered artifacts in inventory includes the costs of recovery and conservation. The capitalized costs include direct costs of recovery such as vessel and related equipment operations and maintenance, crew and technical labor, fuel, provisions, supplies, port fees, depreciation and may even include fees paid to an insurer to relinquish the insurer’s claim to the recovered artifacts. Conservation costs include fees paid to conservators for cleaning and preserving the artifacts. We continually monitor the recorded aggregate costs of the artifacts in inventory to ensure these costs do not exceed the net realizable value. We use historical sales, publications or available public market data to assess market value.
Allowance for Doubtful Accounts
In determining the collectability of our accounts receivable, we need to make certain assumptions and estimates. Specifically, we may examine accounts and assess the likelihood of collection of particular accounts.
Derivative Financial Instruments
In evaluating fair value of derivative financial instruments, there are numerous assumptions which management must make that may influence the valuation of the derivatives as included in the financial statements.
24
Table of Contents
Contractual Obligations
At December 31, 2011, the Company’s contractual obligations including estimated payments due by period are as follows:
| (Dollars in thousands) | Payments due by period | |||||||||||||||||||
| Contractual Obligations |
Total | Less than 1 year |
1-3 years | 3-5 years | More than 5 years |
|||||||||||||||
| Long-term obligations |
$ | 12,177 | $ | 2,829 | $ | 8,806 | $ | 542 | $ | — | ||||||||||
| Interest on long-term obligations |
1,363 | 842 | 502 | 19 | — | |||||||||||||||
| Operating lease |
12,971 | 4,103 | 8,205 | 663 | — | |||||||||||||||
|
|
|
|
|
|
|
|
|
|
|
|||||||||||
| Total contractual obligations |
$ | 26,511 | $ | 7,774 | $ | 17,513 | $ | 1,224 | $ | — | ||||||||||
|
|
|
|
|
|
|
|
|
|
|
|||||||||||
Long-term obligations represent the amount due on our existing mortgages and convertible note. The operating lease represents our vessel charter. The vessel charter has a lease period March 2010 to February 2014 as well as a ninety-day termination notice clause. In January 2012, we entered into a 90-day firm time party charter agreement with a Norwegian company for a vessel and advanced technology for the recovery of silver from the Gairsoppa and Mantola sites. The charter is to commence around the May - June 2012 time frame, but the exact time will be mutually agreed to at a later time. The charter commitment is approximately 54 million NOK (Norwegian Kroner) which currently approximates $9.7 million. A payment of USD 3,000,000 is to be remitted 14 days prior to the start of the charter, and the charter will be billed in arrears after the initial payment. There are no bonuses to be paid in conjunction with this charter.
ITEM 7A. QUANTITATIVE AND QUALITATIVE DISCLOSURES ABOUT MARKET RISK
Market risk is the exposure to loss resulting from changes in interest rates, foreign currency exchange rates, commodity prices and equity prices. We do not believe we have material market risk exposure and have not entered into any market risk sensitive instruments to mitigate these risks or for trading or speculative purposes.
Our term loan bears a variable interest rate based on LIBOR and our primary mortgage bears interest at a variable rate based on the prime rate. See NOTE L for further detail on these instruments. Both of these instruments expose us to interest rate risk. On our primary mortgage, for an increase of every 100 basis points, our interest obligation increases, at most, by approximately $1,200 per month until maturity in July 2013. On our term loan, an increase of every 100 basis points to the interest rate increases our interest obligation, at most, by approximately $2,500 per month until maturity in April 2012. If an increase to the rates on these instruments occurs, it will have an adverse effect on our operating cash flows and financial condition but we believe it would not be material.
ITEM 8. FINANCIAL STATEMENTS AND SUPPLEMENTARY DATA
The information required by this item appears beginning on page 27.
ITEM 9. CHANGES IN AND DISAGREEMENTS WITH ACCOUNTANTS ON ACCOUNTING AND FINANCIAL DISCLOSURE
None.
ITEM 9A. CONTROLS AND PROCEDURES
Disclosure Controls and Procedures
We maintain a set of disclosure controls and procedures designed to ensure that information we are required to disclose in reports that we file with or furnish to the SEC is recorded, processed, summarized and reported within the time periods specified by the SEC. An evaluation was carried out under the supervision and with the participation of the Company’s management, including the Chief Executive Officer (“CEO”) and Chief Financial Officer (“CFO”), of the effectiveness of our disclosure controls and procedures as of the end of the period covered by this report. Based on that evaluation, the CEO and CFO have concluded that the Company’s disclosure controls and procedures are effective to ensure that we are able to collect process and disclose the information we are required to disclose in the reports we file with the SEC within required time periods.
Internal Controls over Financial Reporting
Management’s report on our internal controls over financial reporting can be found in the financial statement section of this report. The Independent Registered Public Accounting Firm’s attestation report on management’s assessment of the effectiveness of our internal control over financial reporting can also be found in the financial statement section of this report.
There have been no significant changes in the Company’s internal controls over financial reporting during the quarter ended December 31, 2011 that have materially affected, or are reasonably likely to materially affect, the Company’s internal control over financial reporting.
25
Table of Contents
On March 7, 2012, the Board of Directors, upon the recommendation of the Compensation Committee, approved annual incentive awards/bonuses for the year 2011 in accordance with the 2011 executive compensation plan. The awards were paid 50% in cash and 50% in stock of the Company for all officers. Annual incentive awards/bonuses are intended to provide a component of total compensation that represents an award for meeting key corporate performance objectives or for achievement of individual strategic objectives. Annual incentive awards are expressed as target amounts that can be earned as a percentage of base salary. For all named executive officers, except for Mr. Nudi, the annual incentive targets are weighted 75% toward the ability to meet key performance indicators of the Company and 25% toward attainment of individual strategic objectives. Mr. Nudi’s annual incentive targets are weighted 50% toward the ability to meet key performance indicators and 50% toward the attainment of individual strategic objectives. Company key performance indicators are based upon four separate categories that include revenue, recovered cargo, earnings per share and overall cash flow. The Compensation Committee’s expectation is to follow the incentive award guidelines, however, the Committee has the discretion to increase or decrease the amounts based upon extenuating or unforeseen circumstances, or to deny the awards/bonuses whether or not performance targets or objectives are achieved. The Compensation Committee also recommended that the annual incentive awards/bonuses be paid 50% in cash and 50% in stock. The number of shares was determined by dividing the cash award value by the closing price of the company stock on March 6, 2012. The following table shows the amounts paid:
| Cash Award | Stock Award | |||||||
| Gregory P. Stemm, CEO |
$ | 58,513 | 20,039 | |||||
| Mark D. Gordon, President/COO |
$ | 28,313 | 9,696 | |||||
| Michael J. Holmes, CFO |
$ | 26,991 | 9,244 | |||||
| David A. Morris, Corporate Secretary |
$ | 19,819 | 6,787 | |||||
| Jay A. Nudi, Principal Accounting Officer/Treasurer |
$ | 16,815 | 5,759 | |||||
PART III
ITEM 10. DIRECTORS, EXECUTIVE OFFICERS AND CORPORATE GOVERNANCE
Information concerning Directors and Executive Officers is hereby incorporated by reference to the information under the headings “Election of Directors” and “Executive Officers and Directors of the Company” in the Company’s Proxy Statement (the “Proxy Statement”) for the Annual Meeting of Stockholder to be held on June 18, 2012.
The Company has adopted a Code of Ethics that applies to all of its employees, including the principal executive officer, the principal financial officer and the principal accounting officer. The Code of Ethics and all committee charters are posted on the Company’s website (www.shipwreck.net). We will provide a copy of any of these documents to stockholders free of charge upon request to the Company.
ITEM 11. EXECUTIVE COMPENSATION
The information required by this Item is hereby incorporated by reference to the information under the heading “Executive Compensation” in the Proxy Statement.
ITEM 12. SECURITY OWNERSHIP OF CERTAIN BENEFICIAL OWNERS AND MANAGEMENT AND RELATED STOCKHOLDER MATTERS
A portion of the information required by this Item pursuant to Item 403 of Regulation S-K is hereby incorporated by reference to the information under the heading “Security Ownership of Certain Beneficial Owners and Management” in the Proxy Statement. The information required pursuant to Item 201(d) of Regulation S-K is hereby incorporated by reference to the information under the heading “Equity Compensation Plan Information” in the Proxy Statement.
ITEM 13. CERTAIN RELATIONSHIPS AND RELATED TRANSACTIONS, AND DIRECTOR INDEPENDENCE
The information required by this Item is hereby incorporated by reference to the information under the heading “Certain Relationships and Related Transactions” in the Proxy Statement.
ITEM 14. PRINCIPAL ACCOUNTANT FEES AND SERVICES
The information required by this Item is hereby incorporated by reference to the information under the heading “Independent Auditor Fees” in the Proxy Statement.
26
Table of Contents
PART IV
ITEM 15. EXHIBITS AND FINANCIAL STATEMENT SCHEDULES
The following documents are filed as part of this Annual Report on Form 10-K:
| 1. | (a) | Consolidated Financial Statements See “Index to Consolidated Financial Statements” on page 28. | ||
| (b) | Consolidated Financial Statement Schedules See “Index to Consolidated Financial Statements” on page 28. | |||
| All other schedules have been omitted because the required information is not significant or is included in the financial statements or notes thereto, or is not applicable. | ||||
| 2. | Exhibits | |||
| The Exhibits listed in the Exhibits Index, which appears immediately following the signature page and is incorporated herein by reference, are filed as part of this Annual Report on Form 10-K. | ||||
27
Table of Contents
INDEX TO CONSOLIDATED FINANCIAL STATEMENTS
ODYSSEY MARINE EXPLORATION, INC.
| PAGE | ||||
| Management’s Annual Report on Internal Control over Financial Reporting |
29 | |||
| 30 | ||||
| Report of Independent Registered Public Accounting Firm on Internal Control over Financial Reporting |
31 | |||
| Consolidated Financial Statements: |
||||
| 32 | ||||
| 33 | ||||
| Consolidated Statements of Changes in Stockholders’ Equity/(Deficit) |
34 | |||
| 35 | ||||
| 37 | ||||
| Consolidated Financial Statement Schedules: |
||||
| 62 | ||||
28
Table of Contents
MANAGEMENT’S ANNUAL REPORT ON INTERNAL CONTROL OVER FINANCIAL REPORTING
The Company’s management is responsible for establishing and maintaining adequate internal control over financial reporting for the Company. With the participation of the Chief Executive Officer and the Chief Financial Officer, management conducted an evaluation of the effectiveness of internal control over financial reporting based on the framework and the criteria established in Internal Control – Integrated Framework, issued by the Committee of Sponsoring Organizations of the Treadway Commission. Based on this evaluation, management has concluded that internal control over financial reporting was effective as of December 31, 2011.
The Company’s independent auditor, Ferlita, Walsh & Gonzalez, P.A., a registered public accounting firm, has issued an attestation report on management’s assessment of internal control over financial reporting, which is included herein.
29
Table of Contents
REPORT OF INDEPENDENT REGISTERED PUBLIC ACCOUNTING FIRM
The Board of Directors
Odyssey Marine Exploration, Inc. and Subsidiaries
We have audited the accompanying consolidated balance sheets of Odyssey Marine Exploration, Inc. and subsidiaries as of December 31, 2011 and 2010, and the related consolidated statements of operations, changes in stockholders’ equity (deficit) and cash flows for each of the years in the three-year period ended December 31, 2011, 2010, and 2009. Odyssey Marine Exploration, Inc. and subsidiaries’ management is responsible for these consolidated financial statements. Our responsibility is to express an opinion on these consolidated financial statements based on our audits.
We conducted our audits in accordance with the standards of the Public Company Accounting Oversight Board (United States). Those standards require that we plan and perform the audit to obtain reasonable assurance about whether the consolidated financial statements are free of material misstatement. An audit includes examining, on a test basis, evidence supporting the amounts and disclosures in the consolidated financial statements. An audit also includes assessing the accounting principles used and significant estimates made by management, as well as evaluating the overall financial statement presentation. We believe that our audits provide a reasonable basis for our opinion.
In our opinion, the consolidated financial statements referred to above present fairly, in all material respects, the financial position of Odyssey Marine Exploration, Inc. and subsidiaries as of December 31, 2011 and 2010, and the results of their operations and their cash flows for each of the years in the three-year period ended December 31, 2011, 2010, and 2009, in conformity with accounting principles generally accepted in the United States of America.
We also have audited, in accordance with the standards of the Public Company Accounting Oversight Board (United States), Odyssey Marine Exploration, Inc. and subsidiaries’ internal control over financial reporting as of December 31, 2011, based on criteria established in Internal Control – Integrated Framework issued by the Committee of Sponsoring Organizations of the Treadway Commission (COSO), and our report dated March 5, 2012 expressed an unqualified opinion on its internal control over financial reporting.
| /s/ Ferlita, Walsh & Gonzalez, P.A. |
| FERLITA, WALSH & GONZALEZ, P.A. |
| Certified Public Accountants |
| Tampa, Florida |
March 5, 2012
30
Table of Contents
REPORT OF INDEPENDENT REGISTERED PUBLIC ACCOUNTING FIRM ON
INTERNAL CONTROL OVER FINANCIAL REPORTING
The Board of Directors
Odyssey Marine Exploration, Inc. and Subsidiaries
We have audited Odyssey Marine Exploration, Inc. and subsidiaries’ internal control over financial reporting as of December 31, 2011, based on criteria established in Internal Control-Integrated Framework issued by the Committee of Sponsoring Organizations of the Treadway Commission (COSO). Odyssey Marine Exploration, Inc. and subsidiaries’ management is responsible for maintaining effective internal control over financial reporting and for its assessment of the effectiveness of internal control over financial reporting, included in the accompanying Management’s Annual Report on Internal Control over Financial Reporting. Our responsibility is to express an opinion on Odyssey Marine Exploration, Inc. and subsidiaries’ internal control over financial reporting based on our audit.
We conducted our audit in accordance with the standards of the Public Company Accounting Oversight Board (United States). Those standards require that we plan and perform the audit to obtain reasonable assurance about whether effective internal control over financial reporting was maintained in all material respects. Our audit of internal control over financial reporting included obtaining an understanding of internal control over financial reporting, assessing the risk that a material weakness exists, and testing and evaluating the design and operating effectiveness of internal control based on the assessed risk. Our audit also included performing such other procedures as we considered necessary in the circumstances. We believe that our audit provides a reasonable basis for our opinion.
A company’s internal control over financial reporting is a process designed to provide reasonable assurance regarding the reliability of financial reporting and the preparation of financial statements for external purposes in accordance with generally accepted accounting principles. A company’s internal control over financial reporting includes those policies and procedures that (1) pertain to the maintenance of records that, in reasonable detail, accurately and fairly reflect the transactions and dispositions of the assets of the company; (2) provide reasonable assurance that transactions are recorded as necessary to permit preparation of financial statements in accordance with generally accepted accounting principles, and that receipts and expenditures of the company are being made only in accordance with authorizations of management and directors of the company; and (3) provide reasonable assurance regarding prevention or timely detection of unauthorized acquisition, use, or disposition of the company’s assets that could have a material effect on the financial statements.
Because of its inherent limitations, internal control over financial reporting may not prevent or detect misstatements. Also, projections of any evaluation of effectiveness to future periods are subject to the risk that controls may become inadequate because of changes in conditions, or that degree of compliance with the policies or procedures may deteriorate.
In our opinion, Odyssey Marine Exploration, Inc and subsidiaries maintained, in all material respects, effective internal control over financial reporting as of December 31, 2011, based on criteria established in Internal Control-Integrated Framework issued by the Committee of Sponsoring Organizations of the Treadway Commission (COSO).
We also have audited, in accordance with the standards of the Public Company Accounting Oversight Board (United States), the consolidated balance sheets of Odyssey Marine Exploration, Inc. and subsidiaries as of December 31, 2011 and 2010, and the related consolidated statements of operations, changes in stockholders’ equity (deficit) and cash flows for each of the years in the three-year ended December 31, 2011, 2010, and 2009, and our report dated March 5, 2012 expressed an unqualified opinion.
| /s/ Ferlita, Walsh & Gonzalez, P.A. |
| FERLITA, WALSH & GONZALEZ, P.A. |
| Certified Public Accountants |
| Tampa, Florida |
March 5, 2012
31
Table of Contents
ODYSSEY MARINE EXPLORATION, INC. AND SUBSIDIARIES
CONSOLIDATED BALANCE SHEETS
| December 31, 2011 |
December 31, 2010 |
|||||||
| ASSETS |
||||||||
| CURRENT ASSETS |
||||||||
| Cash and cash equivalents |
$ | 7,971,794 | $ | 235,762 | ||||
| Restricted cash |
212,788 | 563,710 | ||||||
| Accounts receivable, net |
500,626 | 2,095,571 | ||||||
| Inventory |
557,151 | 409,613 | ||||||
| Other current assets |
779,478 | 467,180 | ||||||
|
|
|
|
|
|||||
| Total current assets |
10,021,837 | 3,771,836 | ||||||
|
|
|
|
|
|||||
| PROPERTY AND EQUIPMENT |
||||||||
| Equipment and office fixtures |
15,450,467 | 16,637,638 | ||||||
| Building and land |
4,703,359 | 4,671,231 | ||||||
| Accumulated depreciation |
(13,620,956 | ) | (12,979,576 | ) | ||||
|
|
|
|
|
|||||
| Total property and equipment |
6,532,870 | 8,329,293 | ||||||
|
|
|
|
|
|||||
| NON-CURRENT ASSETS |
||||||||
| Inventory |
5,501,808 | 6,020,699 | ||||||
| Restricted cash |
251,791 | 183,498 | ||||||
| Investment in unconsolidated entity |
— | — | ||||||
| Other non-current assets |
1,106,097 | 1,101,367 | ||||||
|
|
|
|
|
|||||
| Total other assets |
6,859,696 | 7,305,564 | ||||||
|
|
|
|
|
|||||
| Total assets |
$ | 23,414,403 | $ | 19,406,693 | ||||
|
|
|
|
|
|||||
| LIABILITIES AND STOCKHOLDERS’ EQUITY/(DEFICIT) |
||||||||
| CURRENT LIABILITIES |
||||||||
| Accounts payable |
$ | 1,105,902 | $ | 2,238,356 | ||||
| Accrued expenses and other |
2,061,974 | 2,766,672 | ||||||
| Deferred revenue |
3,545,140 | 730,098 | ||||||
| Subscription payable |
— | 1,998,800 | ||||||
| Derivative liabilities |
7,333,293 | 6,363,144 | ||||||
| Mortgage and loans payable |
4,802,930 | 5,174,537 | ||||||
|
|
|
|
|
|||||
| Total current liabilities |
18,849,239 | 19,271,607 | ||||||
|
|
|
|
|
|||||
| LONG-TERM LIABILITIES |
||||||||
| Mortgage and loans payable |
5,690,125 | 2,776,383 | ||||||
| Deferred income from revenue participation rights |
8,400,000 | 887,500 | ||||||
|
|
|
|
|
|||||
| Total long-term liabilities |
14,090,125 | 3,663,883 | ||||||
|
|
|
|
|
|||||
| Total liabilities |
32,939,364 | 22,935,490 | ||||||
|
|
|
|
|
|||||
| Commitments and contingencies (Note U) |
||||||||
| Redeemable Series G Convertible Preferred stock |
250,000 | 4,019,523 | ||||||
| STOCKHOLDERS’ DEFICIT |
||||||||
| Preferred stock – $.0001 par value; 9,361,176 shares authorized; none outstanding |
— | — | ||||||
| Preferred stock series D convertible – $.0001 par value; 448,800 shares authorized, respectively; 206,400 issued and outstanding, respectively |
21 | 21 | ||||||
| Common stock – $.0001 par value; 150,000,000 shares authorized; 73,095,384 and 67,082,835 issued and outstanding |
7,309 | 6,708 | ||||||
| Additional paid-in capital |
137,236,462 | 122,722,840 | ||||||
| Accumulated deficit |
(147,018,753 | ) | (130,277,889 | ) | ||||
|
|
|
|
|
|||||
| Total stockholders’ deficit |
(9,774,961 | ) | (7,548,320 | ) | ||||
|
|
|
|
|
|||||
| Total liabilities and stockholders’ deficit |
$ | 23,414,403 | $ | 19,406,693 | ||||
|
|
|
|
|
|||||
The accompanying notes are an integral part of these financial statements.
32
Table of Contents
ODYSSEY MARINE EXPLORATION, INC. AND SUBSIDIARIES
CONSOLIDATED STATEMENTS OF INCOME
| 12 Month Period Ended December 31, 2011 |
12 Month Period Ended December 31, 2010 |
12 Month Period Ended December 31, 2009 |
||||||||||
| REVENUE |
||||||||||||
| Artifact sales and other |
$ | 853,627 | $ | 391,189 | $ | 1,636,042 | ||||||
| Exhibit |
207,289 | 140,000 | 593,798 | |||||||||
| Expedition |
14,666,316 | 20,469,506 | 2,117,625 | |||||||||
|
|
|
|
|
|
|
|||||||
| Total revenue |
15,727,232 | 21,000,695 | 4,347,465 | |||||||||
|
|
|
|
|
|
|
|||||||
| OPERATING EXPENSES |
||||||||||||
| Cost of sales – artifacts and other |
414,993 | 191,091 | 680,530 | |||||||||
| Operations and research |
21,288,476 | 19,570,672 | 12,594,834 | |||||||||
| Marketing, general and administrative |
9,392,465 | 9,151,502 | 9,426,775 | |||||||||
| Receivable reserves |
— | 8,494,672 | — | |||||||||
|
|
|
|
|
|
|
|||||||
| Total operating expenses |
31,095,934 | 37,407,937 | 22,702,139 | |||||||||
|
|
|
|
|
|
|
|||||||
| LOSS FROM OPERATIONS |
(15,368,702 | ) | (16,407,242 | ) | (18,354,674 | ) | ||||||
| OTHER INCOME OR (EXPENSE) |
||||||||||||
| Interest income |
3,875 | 3,903 | 38,255 | |||||||||
| Interest expense |
(1,155,072 | ) | (515,878 | ) | (334,364 | ) | ||||||
| Change in derivative liabilities fair value |
4,980,138 | (3,638,112 | ) | — | ||||||||
| (Loss) on debt extinguishment |
— | (383,023 | ) | — | ||||||||
| (Loss) from unconsolidated entity |
(4,733,100 | ) | (2,447,471 | ) | (52,529 | ) | ||||||
| Other |
47,553 | 44,757 | 75,114 | |||||||||
|
|
|
|
|
|
|
|||||||
| Total other income or (expense) |
(856,606 | ) | (6,935,824 | ) | (273,524 | ) | ||||||
|
|
|
|
|
|
|
|||||||
| LOSS BEFORE INCOME TAXES |
(16,225,308 | ) | (23,343,066 | ) | (18,628,198 | ) | ||||||
| Income tax (provision) benefit |
— | — | — | |||||||||
|
|
|
|
|
|
|
|||||||
| NET LOSS |
$ | (16,225,308 | ) | $ | (23,343,066 | ) | $ | (18,628,198 | ) | |||
|
|
|
|
|
|
|
|||||||
| LOSS PER SHARE |
||||||||||||
| Basic and diluted |
$ | (.28 | ) | $ | (.36 | ) | $ | (.33 | ) | |||
| Weighted average number of common shares outstanding |
||||||||||||
| Basic and diluted |
70,179,935 | 65,633,382 | 56,211,952 | |||||||||
The accompanying notes are an integral part of these financial statements.
33
Table of Contents
ODYSSEY MARINE EXPLORATION, INC. AND SUBSIDIARIES
CONSOLIDATED STATEMENTS OF CHANGES IN STOCKHOLDERS’ EQUITY / (DEFICIT)
| 12 Month Period Ended December 31, 2011 |
12 Month Period Ended December 31, 2010 |
12 Month Period Ended December 31, 2009 |
||||||||||
| Preferred Stock, Series D – Shares |
||||||||||||
| At beginning of year |
206,400 | 1,906,400 | 6,900,000 | |||||||||
| Preferred stock issued for cash |
— | — | 197,600 | |||||||||
| Preferred stock converted to common |
— | (1,700,000 | ) | (5,191,200 | ) | |||||||
|
|
|
|
|
|
|
|||||||
| At end of year |
206,400 | 206,400 | 1,906,400 | |||||||||
|
|
|
|
|
|
|
|||||||
| Preferred Stock, Series E – Shares |
||||||||||||
| At beginning of year |
— | 13 | 13 | |||||||||
| Preferred stock issued for cash |
— | (13 | ) | — | ||||||||
|
|
|
|
|
|
|
|||||||
| At end of year |
— | — | 13 | |||||||||
|
|
|
|
|
|
|
|||||||
| Common Stock – Shares |
||||||||||||
| At beginning of year |
67,082,835 | 59,425,947 | 52,410,248 | |||||||||
| Common stock issued on convertible instruments |
102,000 | 3,000,000 | 5,191,200 | |||||||||
| Common stock issued for cash |
5,520,000 | 4,000,000 | 1,722,500 | |||||||||
| Common stock issued for services |
390,549 | 656,888 | 101,999 | |||||||||
|
|
|
|
|
|
|
|||||||
| At end of year |
73,095,384 | 67,082,835 | 59,425,947 | |||||||||
|
|
|
|
|
|
|
|||||||
| Preferred Stock, Series D |
||||||||||||
| At beginning of year |
$ | 21 | $ | 191 | $ | 690 | ||||||
| Preferred stock issued for cash |
— | — | 20 | |||||||||
| Preferred stock converted to common |
— | (170 | ) | (519 | ) | |||||||
|
|
|
|
|
|
|
|||||||
| At end of year |
$ | 21 | $ | 21 | $ | 191 | ||||||
|
|
|
|
|
|
|
|||||||
| Preferred Stock, Series E |
||||||||||||
| At beginning of year |
$ | — | $ | — | $ | — | ||||||
| Preferred stock issued for cash |
— | — | — | |||||||||
|
|
|
|
|
|
|
|||||||
| At end of year |
$ | — | $ | — | $ | — | ||||||
|
|
|
|
|
|
|
|||||||
| Common Stock |
||||||||||||
| At beginning of year |
$ | 6,708 | $ | 5,943 | $ | 5,241 | ||||||
| Common stock issued on convertible instruments |
10 | 300 | 519 | |||||||||
| Common stock issued for cash |
552 | 400 | 172 | |||||||||
| Common stock issued for services |
39 | 65 | 11 | |||||||||
|
|
|
|
|
|
|
|||||||
| At end of year |
$ | 7,309 | $ | 6,708 | $ | 5,943 | ||||||
|
|
|
|
|
|
|
|||||||
| Paid-in Capital |
||||||||||||
| At beginning of year |
$ | 122,722,840 | $ | 114,490,556 | $ | 106,425,370 | ||||||
| Series D Preferred stock issued for cash |
— | — | 790,380 | |||||||||
| Accretion of Series G Preferred stock |
(1,987,977 | ) | (383,050 | ) | — | |||||||
| Fair value of warrants issued to Series G Preferred stock shareholders |
(906,150 | ) | — | — | ||||||||
| Warrants issued in connection with short term funding |
— | 150,892 | — | |||||||||
| Common stock issued for cash |
15,397,144 | 6,056,346 | 5,106,078 | |||||||||
| Share-based compensation |
1,781,115 | 2,408,226 | 2,168,728 | |||||||||
| Common stock issued on convertible instruments |
229,490 | (130 | ) | — | ||||||||
|
|
|
|
|
|
|
|||||||
| At end of year |
$ | 137,236,462 | $ | 122,722,840 | $ | 114,490,556 | ||||||
|
|
|
|
|
|
|
|||||||
| Accumulated Deficit |
||||||||||||
| At beginning of year |
$ | (130,277,889 | ) | $ | (106,934,823 | ) | $ | (88,306,625 | ) | |||
| Net loss |
(16,225,308 | ) | (23,343,066 | ) | (18,628,198 | ) | ||||||
| Dividends |
(515,556 | ) | — | — | ||||||||
|
|
|
|
|
|
|
|||||||
| At end of year |
(147,018,753 | ) | (130,277,889 | ) | (106,934,823 | ) | ||||||
|
|
|
|
|
|
|
|||||||
| Total stockholders’ equity/(deficit) |
$ | (9,774,961 | ) | $ | (7,548,320 | ) | $ | 7,561,867 | ||||
|
|
|
|
|
|
|
|||||||
The accompanying notes are an integral part of these financial statements.
34
Table of Contents
ODYSSEY MARINE EXPLORATION, INC. AND SUBSIDIARIES
CONSOLIDATED STATEMENTS OF CASH FLOWS
| 12 Month Period Ended December 31, 2011 |
12 Month Period Ended December 31, 2010 |
12 Month Period Ended December 31, 2009 |
||||||||||
| CASH FLOWS FROM OPERATING ACTIVITIES: |
||||||||||||
| Net loss |
$ | (16,225,308 | ) | $ | (23,343,066 | ) | $ | (18,628,198 | ) | |||
| Adjustments to reconcile net loss to net cash used by operating activity: |
||||||||||||
| Amortization of financing costs |
272,998 | — | — | |||||||||
| Interest accretion on notes payable |
405,465 | — | — | |||||||||
| Share based compensation |
1,551,589 | 2,137,136 | 2,027,340 | |||||||||
| Depreciation |
1,892,969 | 2,162,194 | 2,276,353 | |||||||||
| Write down of long-lived asset |
593,966 | — | — | |||||||||
| Loan discount amortization |
— | 129,375 | — | |||||||||
| Loss on extinguishment of debt |
— | 383,023 | — | |||||||||
| Change in derivatives liabilities fair value |
(4,980,138 | ) | 3,638,112 | — | ||||||||
| Loss from unconsolidated entity |
4,733,100 | 2,447,471 | 52,529 | |||||||||
| Investment in unconsolidated entity |
(4,733,100 | ) | — | — | ||||||||
| Accounts receivable - reserve |
— | 8,494,672 | — | |||||||||
| (Increase) decrease in: |
||||||||||||
| Accounts receivable |
(403,856 | ) | (10,343,976 | ) | 222,530 | |||||||
| Restricted cash |
282,629 | 3,368 | 91,215 | |||||||||
| Inventory |
371,353 | 158,045 | 605,418 | |||||||||
| Other assets |
(93,110 | ) | (167,315 | ) | 13,518 | |||||||
| Increase (decrease) in: |
||||||||||||
| Accounts payable |
(1,132,454 | ) | 1,873,327 | (623,377 | ) | |||||||
| Accrued expenses and other |
(541,356 | ) | 796,166 | 108,079 | ||||||||
| Deferred revenue |
2,815,042 | (527,355 | ) | 1,257,453 | ||||||||
|
|
|
|
|
|
|
|||||||
| NET CASH (USED) IN OPERATING ACTIVITIES |
(15,190,211 | ) | (12,158,824 | ) | (12,597,140 | ) | ||||||
|
|
|
|
|
|
|
|||||||
| CASH FLOWS FROM INVESTING ACTIVITIES: |
||||||||||||
| Purchase of property and equipment |
(973,764 | ) | (1,630,108 | ) | (1,149,981 | ) | ||||||
| Investment in unconsolidated entity |
— | (1,200 | ) | (500,000 | ) | |||||||
| Proceeds from disposal of long-lived asset |
485,000 | — | — | |||||||||
|
|
|
|
|
|
|
|||||||
| NET CASH (USED) IN INVESTING ACTIVITIES |
(488,764 | ) | (1,631,308 | ) | (1,649,981 | ) | ||||||
|
|
|
|
|
|
|
|||||||
| CASH FLOWS FROM FINANCING ACTIVITIES: |
||||||||||||
| Proceeds from issuance of common stock |
15,627,196 | 6,243,000 | 5,106,250 | |||||||||
| Proceeds from issuance of loan payable |
10,000,000 | 1,872,714 | — | |||||||||
| Proceeds from issuance of preferred stock |
— | 5,050,000 | — | |||||||||
| Proceeds from warrants exercise |
— | — | 790,400 | |||||||||
| Broker commissions and fees on capital raises |
(545,000 | ) | (186,254 | ) | — | |||||||
| Deferred income from revenue participation rights |
7,512,500 | — | — | |||||||||
| Dividends |
(515,556 | ) | — | — | ||||||||
| Redemption of Series G Preferred stock |
(5,757,500 | ) | — | — | ||||||||
| Repayment of mortgage and loans payable |
(2,906,633 | ) | (1,099,015 | ) | (244,438 | ) | ||||||
|
|
|
|
|
|
|
|||||||
| NET CASH PROVIDED BY FINANCING ACTIVITIES |
23,415,007 | 11,880,445 | 5,652,212 | |||||||||
|
|
|
|
|
|
|
|||||||
| NET INCREASE (DECREASE) IN CASH AND CASH EQUIVALENTS |
7,736,032 | (1,909,687 | ) | (8,594,909 | ) | |||||||
| CASH AND CASH EQUIVALENTS AT BEGINNING OF YEAR |
235,762 | 2,145,449 | 10,740,358 | |||||||||
|
|
|
|
|
|
|
|||||||
| CASH AND CASH EQUIVALENTS AT END OF YEAR |
$ | 7,971,794 | $ | 235,762 | $ | 2,145,449 | ||||||
|
|
|
|
|
|
|
|||||||
| SUPPLEMENTARY INFORMATION: |
||||||||||||
| Interest paid |
$ | 736,915 | $ | 410,350 | $ | 338,283 | ||||||
| Income taxes paid |
$ | — | $ | — | $ | — | ||||||
| NON-CASH TRANSACTIONS: |
||||||||||||
| Accrued compensation paid by equity instruments |
$ | 229,564 | $ | 561,594 | $ | 117,804 | ||||||
| Building and equipment purchased with financing |
$ | 198,660 | $ | 186,762 | $ | — | ||||||
| Series G Preferred Stock accretion |
$ | 1,987,977 | — | — | ||||||||
| Offset account receivable with subscription payable (See NOTE E) |
$ | 1,998,800 | — | — | ||||||||
| Accounts receivable converted to stock in unconsolidated entity (See NOTE E) |
$ | — | — | — | ||||||||
| Acquired non-controlling interest of Dorado Ocean Resources, Ltd. with the assumption of a subscription payable of an equal amount (See NOTE J) |
$ | — | $ | 1,998,800 | $ | — | ||||||
35
Table of Contents
Summary of Significant Non-Cash Transactions
On October 6, 2010, we and certain investors entered into separate purchase agreements pursuant to which we agreed to sell an aggregate of 24 shares of Odyssey’s Series G 8% Convertible Preferred Stock, par value $0.0001 per share, and warrants to purchase up to 1,800,000 shares of Odyssey’s common stock to such investors. The Series G preferred stock and warrants were offered as units, with each unit consisting of one share of Preferred Stock and a Warrant to purchase 75,000 shares of common stock. The purchase price for each unit was $250,000 for a total offering of $6,000,000. Of the $6,000,000, $5,050,000 was received in cash and $950,000 was converted from our $1,800,000 of promissory notes that were issued on August 20, 2010. See NOTE Q.
The accompanying notes are an integral part of these financial statements.
36
Table of Contents
ODYSSEY MARINE EXPLORATION, INC. AND SUBSIDIARIES
NOTES TO THE CONSOLIDATED FINANCIAL STATEMENTS
NOTE A – ORGANIZATION AND SUMMARY OF SIGNIFICANT ACCOUNTING POLICIES
Organization
Odyssey Marine Exploration, Inc. and subsidiaries (the “Company,” “Odyssey,” “us,” “we” or “our”) is engaged in the archaeologically sensitive exploration and recovery of deep-ocean shipwrecks throughout the world. Our corporate headquarters are located in Tampa, Florida.
Summary of Significant Accounting Policies
This summary of significant accounting policies of the Company is presented to assist in understanding our financial statements. The financial statements and notes are representations of the Company’s management who are responsible for their integrity and objectivity and have prepared them in accordance with our customary accounting practices.
Principles of Consolidation
The consolidated financial statements include the accounts of the Company and its wholly owned subsidiaries, Odyssey Marine, Inc., Odyssey Marine Services, Inc., OVH, Inc., Odyssey Retriever, Inc. and Odyssey Marine Entertainment, Inc. Equity investments in which we exercise significant influence but do not control and are not the primary beneficiary are accounted for using the equity method. All significant inter-company and intra-company transactions and balances have been eliminated.
Shipwreck Heritage Press, LLC was created during 2005 to publish and distribute print media. The entity does not have activity and has not been capitalized, and therefore, it is not consolidated.
Use of Estimates
Management uses estimates and assumptions in preparing these financial statements in accordance with generally accepted accounting principles. Those estimates and assumptions affect the reported amounts of assets and liabilities, the disclosure of contingent assets and liabilities, and the reported revenues and expenses. Actual results could vary from the estimates that were used.
Revenue Recognition and Accounts Receivable
Revenue from product sales is recognized at the point of sale when legal title transfers. Legal title transfers when product is shipped or is available for shipment to customers. In accordance with Topic A.1. in SAB 13: Revenue Recognition, exhibit and expedition charter revenue is recognized ratably when realized and earned as time passes throughout the contract period as defined by the terms of the agreement. Bad debts are recorded as identified and, from time to time, a specific reserve allowance will be established when required. A return allowance is established for sales which have a right of return. Accounts receivable is stated net of any recorded allowances.
Cash and Cash Equivalents
Cash and cash equivalents include cash on hand and cash in banks. We also consider all highly liquid investments with a maturity of three months or less when purchased to be cash equivalents.
Inventory
Our inventory consists of artifacts recovered from the SS Republic shipwreck, general branded merchandise and related packaging material. Inventoried costs of recovered artifacts include the costs of recovery, conservation and administrative costs to obtain legal title to the artifacts. Administrative costs are generally legal fees or insurance settlements required in order to obtain clean title. The capitalized recovery costs include direct costs such as vessel and related equipment operations and maintenance, crew and technical labor, fuel, provisions, supplies, port fees and depreciation. Conservation costs include fees paid to conservators for cleaning and preserving the artifacts. We continually monitor the recorded aggregate costs of the artifacts in inventory to ensure these costs do not exceed the net realizable value. Historical sales, publications or available public market data are used to assess market value.
The packaging materials and merchandise are recorded at average cost. We record our inventory at the lower of cost or market.
37
Table of Contents
Long-Lived Assets
Our policy is to recognize impairment losses relating to long-lived assets in accordance with the Accounting Standards Codification (“ASC”) topic for Property, Plant and Equipment. Decisions are based on several factors, including, but not limited to, management’s plans for future operations, recent operating results and projected cash flows. Due to a planned sale of our vessel, the Ocean Alert, at salvage value subsequent to September 30, 2011, management decided to charge the difference of $593,966 to Operations and research in the period ended September 30, 2011.
Comprehensive Income
Securities with a maturity greater than three months from purchase date are deemed available-for-sale and carried at fair value. Unrealized gains and losses on these securities are excluded from earnings and reported as a separate component of stockholders’ equity. At December 31, 2011, we did not own securities with a maturity greater than three months.
Property and Equipment and Depreciation
Property and equipment is stated at historical cost. Depreciation is provided using the straight-line method at rates based on the assets’ estimated useful lives which are normally between three and ten years. Leasehold improvements are amortized over their estimated useful lives or lease term, if shorter. Major overhaul items (such as engines or generators) that enhance or extend the useful life of vessel related assets qualify to be capitalized and depreciated over the useful life or remaining life of that asset, whichever is shorter. Certain major repair items required by industry standards to ensure a vessel’s seaworthiness also qualify to be capitalized and depreciated over the period of time until the next scheduled planned major maintenance for that item. All other repairs and maintenance are accounted for under the direct-expensing method and are expensed when incurred.
Earnings Per Share
Basic earnings per share (EPS) is computed by dividing income available to common stockholders by the weighted-average number of common shares outstanding for the period. In periods when the Company generates income, the Company calculates basic earnings per share (“EPS”) using the two-class method pursuant to ASC 260 Earnings Per Share. The two-class method is required effective with the issuance of the Senior Convertible Note disclosed in Note L because the note qualifies as participating security, giving the holder the right to receive dividends should dividends be declared on common stock. Under the two-class method, earnings for the period are allocated on a pro-rata basis to the common stockholders and to the holders of Convertible Notes based on the weighted average number of common shares outstanding and number of shares that could be converted. The Company does not use the two-class method in periods when it generates a loss as the holders of the Convertible Notes do not participate in losses.
Diluted EPS reflects the potential dilution that would occur if dilutive securities and other contracts to issue Common Stock were exercised or converted into Common Stock or resulted in the issuance of Common Stock that then shared in our earnings. We use the treasury stock method to compute potential common shares from stock options and warrants and the if-converted method to compute potential common shares from Preferred Stock, Convertible Notes or other convertible securities. As it relates solely to the Senior Convertible Note, for diluted earnings per share, the Company uses the more dilutive of the if-converted method or two-class method. When a net loss occurs, potential common shares have an anti-dilutive effect on earnings per share and such shares are excluded from the Diluted EPS calculation.
At December 31, 2011, 2010 and 2009 weighted average common shares outstanding were 70,179,935, 65,633,382 and 56,211,952, respectively. For the periods ending December 31, 2011, 2010 and 2009 in which net losses occurred, all potential common shares were excluded from Diluted EPS because the effect of including such shares would be anti-dilutive.
The potential common shares, in the table following, represent potential common shares calculated using the treasury stock method from outstanding options and warrants that were excluded from the calculation of Diluted EPS:
| 2011 | 2010 | 2009 | ||||||||||
| Average market price during the period |
$ | 2.98 | $ | 1.56 | $ | 2.48 | ||||||
| In the money potential common shares from options excluded |
129,793 | — | — | |||||||||
| In the money potential common shares from warrants excluded |
959,521 | — | — | |||||||||
38
Table of Contents
Potential common shares from out-of-the-money options and warrants were also excluded from the computation of diluted earnings per share because calculation of the associated potential common shares has an anti-dilutive effect. The following table lists options and warrants that were excluded from diluted EPS.
| 2011 | 2010 | 2009 | ||||||||||
| Out of the money options and warrants excluded: |
||||||||||||
| Stock Options with an exercise price of $1.74 per share |
— | 71,500 | — | |||||||||
| Stock Options with an exercise price of $2.25 per share |
— | 200,000 | — | |||||||||
| Stock Options with an exercise price of $2.50 per share |
— | — | 33,000 | |||||||||
| Stock Options with an exercise price of $3.50 per share |
495,000 | 1,266,666 | 1,417,916 | |||||||||
| Stock Options with an exercise price of $3.51 per share |
984,670 | 984,670 | 1,003,170 | |||||||||
| Stock Options with an exercise price of $3.53 per share |
211,900 | 211,900 | 212,500 | |||||||||
| Stock Options with an exercise price of $4.00 per share |
52,500 | 52,500 | 315,250 | |||||||||
| Stock Options with an exercise price of $5.00 per share |
650,000 | 650,000 | 650,000 | |||||||||
| Stock Options with an exercise price of $7.00 per share |
100,000 | 100,000 | 100,000 | |||||||||
| Warrants with an exercise price of $2.25 per share |
— | 2,670,000 | — | |||||||||
| Warrants with an exercise price of $2.50 per share |
— | 1,800,000 | — | |||||||||
| Warrants with an exercise price of $4.32 per share |
1,302,083 | — | — | |||||||||
| Warrants with an exercise price of $5.25 per share |
100,000 | 100,000 | 100,000 | |||||||||
|
|
|
|
|
|
|
|||||||
| Total anti-dilutive warrants and options excluded from EPS |
3,896,153 | 8,107,236 | 3,831,836 | |||||||||
|
|
|
|
|
|
|
|||||||
Potential common shares from outstanding Convertible Preferred Stock calculated per the if-converted basis having an anti-dilutive effect on diluted earnings per share were excluded from potential common shares as follows:
| 2011 | 2010 | 2009 | ||||||||||
| Potential common shares from Preferred Stock excluded from computation of diluted earnings per share |
346,400 | 3,566,400 | 3,206,400 | |||||||||
The weighted average equivalent common shares relating to our unvested restricted stock awards that were excluded from potential common shares used in the earning per share calculation due to having an anti-dilutive effect are:
| 2011 | 2010 | 2009 | ||||||||||
| Excluded unvested restricted stock awards |
90,033 | 256,315 | 81,662 | |||||||||
The following is a reconciliation of the numerators and denominators used in computing basic and diluted net income per share:
| 12 Month Period Ended December 31, 2011 |
12 Month Period Ended December 31, 2010 |
12 Month Period Ended December 31, 2009 |
||||||||||
| Net loss |
$ | (16,225,308 | ) | $ | (23,343,066 | ) | $ | (18,628,198 | ) | |||
| Accretion of Series G Preferred Stock |
(1,987,977 | ) | (383,050 | ) | — | |||||||
| Cumulative dividends on Series G Preferred Stock |
(409,035 | ) | — | — | ||||||||
| Fair market value of warrants issued to Series G Preferred Stock stockholders |
(906,150 | ) | — | — | ||||||||
| Undecleared cumulative dividends on Series G Preferred Stock in arrears |
(5,000 | ) | (106,521 | ) | — | |||||||
|
|
|
|
|
|
|
|||||||
39
Table of Contents
| 12 Month Period Ended December 31, 2011 |
12 Month Period Ended December 31, 2010 |
12 Month Period Ended December 31, 2009 |
||||||||||
| Numerator, basic and diluted net loss available to stockholders |
$ | (19,533,470 | ) | $ | (23,832,637 | ) | $ | (18,628,198 | ) | |||
|
|
|
|
|
|
|
|||||||
| Denominator: |
||||||||||||
| Shares used in computation – basic: |
||||||||||||
| Weighted average common shares outstanding |
70,179,935 | 65,633,382 | 56,211,952 | |||||||||
|
|
|
|
|
|
|
|||||||
| Shares used in computation – diluted: |
||||||||||||
| Weighted average common shares outstanding |
70,179,935 | 65,633,382 | 56,211,952 | |||||||||
| Dilutive effect of options, warrants and convertible instruments outstanding |
— | — | — | |||||||||
|
|
|
|
|
|
|
|||||||
| Shares used in computing diluted net loss per share |
70,179,935 | 65,633,382 | 56,211,952 | |||||||||
|
|
|
|
|
|
|
|||||||
| Net loss per share – basic and diluted |
$ | (0.28 | ) | $ | (0.36 | ) | $ | (0.33 | ) | |||
|
|
|
|
|
|
|
|||||||
Income Taxes
Income taxes are accounted for using an asset and liability approach that requires the recognition of deferred tax assets and liabilities for the expected future tax consequences attributable to differences between financial statement carrying amounts of existing assets and liabilities and their respective tax bases. A valuation allowance is provided when it is more likely than not that some portion or the entire deferred tax asset will not be realized.
Stock-based compensation
Our stock-based compensation is recorded in accordance with the guidance in the ASC topic for Stock-Based Compensation (See NOTE R).
Fair Value of Financial Instruments
Financial instruments consist of cash, evidence of ownership in an entity, and contracts that both (i) impose on one entity a contractual obligation to deliver cash or another financial instrument to a second entity, or to exchange other financial instruments on potentially unfavorable terms with the second entity, and (ii) conveys to that second entity a contractual right (a) to receive cash or another financial instrument from the first entity, or (b) to exchange other financial instruments on potentially favorable terms with the first entity. Accordingly, our financial instruments consist of cash and cash equivalents, accounts receivable, accounts payable, accrued liabilities, derivative financial instruments, mortgage and loans payable, and redeemable preferred stock. We carry cash and cash equivalents, accounts payable and accrued liabilities, and mortgage and loans payable at the approximate fair market value, and, accordingly, these estimates are not necessarily indicative of the amounts that we could realize in a current market exchange. We carry derivative financial instruments at fair value as is required under current accounting standards. We carry redeemable preferred stock at historical cost and accrete carrying values to estimated redemption values over the term of the financial instrument.
Derivative financial instruments consist of financial instruments or other contracts that contain a notional amount and one or more underlying variables (e.g. interest rate, security price or other variable), require no initial net investment and permit net settlement. Derivative financial instruments may be free-standing or embedded in other financial instruments. Further, derivative financial instruments are initially, and subsequently, measured at fair value and recorded as liabilities or, in rare instances, assets. See NOTE K for additional information. We generally do not use derivative financial instruments to hedge exposures to cash-flow, market or foreign-currency risks. However, we have entered into certain other financial instruments and contracts, such as our sale and issuance of redeemable preferred stock and freestanding warrants during October 2010 with features that are either (i) not afforded equity classification, (ii) embody risks not clearly and closely related to host contracts, or (iii) may be net-cash settled by the counterparty. As required by ASC 815 – Derivatives and Hedging, these instruments are required to be carried as derivative liabilities, at fair value, in our financial statements with changes in fair value reflected in our income.
40
Table of Contents
Fair Value Hierarchy Fair Value Hierarchy
The three levels of inputs that may be used to measure fair value are as follows:
Level 1. Quoted prices in active markets for identical assets or liabilities.
Level 2. Observable inputs other than Level 1 prices, such as quoted prices for similar assets or liabilities, quoted prices in markets with insufficient volume or infrequent transactions (less active markets), or model-derived valuations in which all significant inputs are observable or can be derived principally from or corroborated with observable market data for substantially the full term of the assets or liabilities. Level 2 inputs also include non-binding market consensus prices that can be corroborated with observable market data, as well as quoted prices that were adjusted for security-specific restrictions.
Level 3. Unobservable inputs to the valuation methodology that is significant to the measurement of the fair value of assets or liabilities. Level 3 inputs also include non-binding market consensus prices or non-binding broker quotes that we were unable to corroborate with observable market data.
Redeemable Preferred Stock
Redeemable preferred stock (and, if ever, any other redeemable financial instrument we may enter into) is initially evaluated for possible classification as liabilities in instances where redemption is certain to occur pursuant to ASC 480 – Distinguishing Liabilities from Equity. Redeemable preferred stock classified as liabilities is recorded and carried at fair value. Redeemable preferred stock that does not, in its entirety, require liability classification is evaluated for embedded features that may require bifurcation and separate classification as derivative liabilities. In all instances, the classification of the redeemable preferred stock host contract that does not require liability classification is evaluated for equity classification or mezzanine classification based upon the nature of the redemption features. Generally, mandatory redemption requirements or any feature that could require cash redemption for matters not within our control, irrespective of probability of the event occurring, requires classification outside of stockholders’ equity. Redeemable preferred stock that is recorded in the mezzanine section is accreted to its redemption value through charges to stockholders’ equity when redemption is probable using the effective interest method. See Note Q for further disclosures about our redeemable preferred stock.
Subsequent Events
We have evaluated subsequent events for recognition or disclosure through the date this Form 10-K is filed with the Securities and Exchange Commission.
NOTE B – CONCENTRATION OF CREDIT RISK
We maintain our cash at one financial institution. From December 31, 2010 to December 31, 2012, all noninterest-bearing transaction accounts are fully insured by the Federal Deposit Insurance Corporation, regardless of the balance of the account, at all insured institutions. At December 31, 2011, our uninsured cash balance was approximately $6.8 million.
Our term loan bears a variable interest rate based on LIBOR and our primary mortgage bears interest at a variable rate based on the prime rate. See NOTE L for further detail on these instruments. Both of these instruments expose us to interest rate risk. On our primary mortgage, for an increase of every 100 basis points, our interest obligation increases, at most, by approximately $1,200 per month until maturity in July 2013. On our term loan, an increase of every 100 basis points to the interest rate increases our interest obligation, at most, by approximately $2,500 per month until maturity in April 2012. If an increase to the rates on these instruments occurs, it will have an adverse effect on our operating cash flows and financial condition but we believe it would not be material.
NOTE C – CASH AND CASH EQUIVALENTS
Cash and cash equivalents include cash on hand and United States Treasury Bills maturing in less than ninety days from the date of purchase. At December 31, 2011, we did not own any United States Treasury Bills with a maturity of ninety days or longer.
NOTE D – RESTRICTED CASH
As required by the mortgage loan entered into with the Bank on July 11, 2008, $500,000 was deposited into an additional interest-bearing account from which principal and interest payments were made for the first one-year period. On each anniversary of the mortgage, we deposit or will deposit into the account an amount sufficient to ensure a balance of $500,000 for principal and interest payments for the subsequent year of the mortgage. The balance in this restricted cash account is held as additional collateral by the Bank and is not available for operations. Any funds remaining in this account at the end of the mortgage term will be returned to the Company. The balance in this account at December 31, 2011, was $464,579.
41
Table of Contents
NOTE E – ACCOUNTS RECEIVABLE
The accounts receivable balances at December 31, 2011 and 2010 were $500,626 and $2,095,571, respectively, which are net of reserves for doubtful accounts of $6,390,593 and $8,494,672, respectively. The December 31, 2010 balance included $2,000,000 related to 2010 charter activity with Dorado Ocean Resources, Ltd. (“DOR”). During 2011, we exercised our contractual right to offset our subscription payable of $1,998,800 owed to DOR against their $2,000,000 account receivable balance. As described in NOTE J, Neptune Minerals, Inc. (“NMI”) completed a share exchange with DOR shareholders and assumed complete control of DOR. In connection with the share exchange, NMI executed an assignment and assumption agreement, whereby NMI assumed $8,227,675 of the outstanding debt of DOR owed to us. In addition, we executed a debt conversion agreement with NMI, whereby we converted $2,500,000 of the debt for 2,500,000 shares of NMI Class B non-voting common stock. The $6,390,593 reserve at December 31, 2011 is comprised of the $1,570,000 “Shantaram” reserve noted below and $4,820,593 reserve for the remaining Neptune Minerals, Inc. (“NMI”) accounts receivable assumed from DOR. The $8,494,672 reserve at December 31, 2010 was comprised of the $1,570,000 “Shantaram” and $6,924,672 for the DOR receivable that was assumed by NMI in 2011 and discussed in NOTE J.
During December 2011, we chartered the Dorado Discovery vessel to Chatham Rock Phosphate, Ltd. for $1,200,000 in relation to deep-ocean surveying. The charter permits Chatham to pay for services in either cash or common shares of their company. ASC 605 states collectability is to be reasonably assured, persuasive evidence of an arrangement exists, delivery has occurred or services have been rendered and there is a fixed or determinable sales price must all be present in order to recognize revenue. Chatham is listed on the New Zealand Stock Exchange and they do not yet have sufficient liquidity to settle this outstanding debt with cash, however, they are currently attempting a capital raise. If they are successful, there may be sufficient funds to pay us for the services rendered. At December 31, 2011, we do not believe the customer’s liquidity and capital positions are sufficient enough to permit us to recognize this revenue at this time. If and when Chatham completes their financing and remits payment to us, we will then recognize this revenue since all revenue accounting criteria will be satisfied.
We have an established reserve for the “Shantaram” receivable of $1,570,000 owed according to the terms of sale of research for the “Shantaram” project. According to our agreement, we have the right to receive additional participation amounts, if any, up to approximately 11% from the first £100 million and approximately 7% thereafter from recovery distributions after recovery costs.
NOTE F – INVENTORY
Our inventory consists of the following:
| 2011 | 2010 | |||||||
| Artifacts |
$ | 5,879,137 | $ | 6,203,813 | ||||
| Packaging |
159,160 | 219,101 | ||||||
| Merchandise |
412,865 | 486,857 | ||||||
| Merchandise reserve |
(392,203 | ) | (479,459 | ) | ||||
|
|
|
|
|
|||||
| Total Inventory |
$ | 6,058,959 | $ | 6,430,312 | ||||
|
|
|
|
|
|||||
Based on our estimates of the timing of future sales, $5,501,808 and $6,020,699 of artifact inventory for the fiscal years ended 2011 and 2010 were classified as non-current.
We have capitalized deferred recovery costs of approximately $2.6 million related to the “Black Swan” project that have been reserved for at 100 %. The reserve and capitalized deferred recovery costs will be eliminated once we exhaust all potential to secure ownership rights.
42
Table of Contents
NOTE G – OTHER CURRENT ASSETS
Our other current assets consist of the following:
| 2011 | 2010 | |||||||
| Prepaid expenses |
$ | 677,621 | $ | 408,108 | ||||
| Deposits |
101,857 | 59,072 | ||||||
|
|
|
|
|
|||||
| Total other current assets |
$ | 779,478 | $ | 467,180 | ||||
|
|
|
|
|
|||||
For the period ended December 31, 2011, prepaid expenses consisted of $192,602 of prepaid insurance premiums, $81,081 for vessel fuel not yet consumed, $310,335 of deferred financing fees, $101,857 of purchase deposits and $93,603 of other operating prepaid costs. For the period ended December 31, 2010, prepaid expenses consisted of $144,242 of prepaid insurance premiums, $266,184 for vessel fuel not yet consumed and $56,754 of other operating prepaid costs. All prepaid expenses, except fuel, are amortized on a straight-line basis over the term of the underlying agreements. Fuel is expensed based on actual usage. Deposits are held by various entities for equipment, services, and in accordance with agreements in the normal course of business.
NOTE H – PROPERTY AND EQUIPMENT
Property and equipment consist of the following:
| 2011 | 2010 | |||||||
| Building, improvements and land |
$ | 4,703,360 | $ | 4,506,347 | ||||
| Computers and peripherals |
1,148,971 | 1,015,974 | ||||||
| Furniture and office equipment |
1,455,250 | 1,257,383 | ||||||
| Vessels and equipment |
11,072,854 | 12,757,379 | ||||||
| Exhibits and related |
1,773,391 | 1,771,786 | ||||||
|
|
|
|
|
|||||
| 20,153,826 | 21,308,869 | |||||||
| Less: Accumulated depreciation |
(13,620,956 | ) | (12,979,576 | ) | ||||
|
|
|
|
|
|||||
| Property and equipment, net |
$ | 6,532,870 | $ | 8,329,293 | ||||
|
|
|
|
|
|||||
NOTE I – OTHER LONG-TERM ASSETS
Other long-term assets consist of the following:
| 2011 | 2010 | |||||||
| Artifacts |
$ | 557,494 | $ | 559,777 | ||||
| Deposits |
541,590 | 541,590 | ||||||
| Image use rights, net |
7,013 | — | ||||||
|
|
|
|
|
|||||
| Total other long-term assets |
$ | 1,106,097 | $ | 1,101,367 | ||||
|
|
|
|
|
|||||
The artifact balances for both years consist of artifacts conserved specifically for the Company and are not for resale. Deposits include $432,500 on account with the United Kingdom’s Ministry of Defense relating to the expense deposits for HMS Sussex as well as a $100,000 deposit to fund conservation and documentation of any artifacts recovered. These deposits are refundable from proceeds the United Kingdom would receive if HMS Sussex is discovered and its artifacts monetized. If HMS Sussex is not discovered, the Company is at risk for the expense deposit portion. Other deposits are held by various vendors for equipment, services, and in accordance with agreements in the normal course of business. Image use rights are amounts paid to utilize, for a period up to five years, copyrighted images in our themed attractions.
43
Table of Contents
NOTE J – INVESTMENT IN UNCONSOLIDATED ENTITY
During the quarter ended December 31, 2009, we invested $500,000 for a 25% interest (five membership units) in SMM Project, LLC (“SMM”) to pursue opportunities in the exploration of deep-ocean gold and copper deposits. SMM purchased a majority interest in Bluewater Metals Pty, Ltd. (“Bluewater”), an Australian company with licenses for mineral exploration of approximately 150,000 square kilometers of ocean floor in territorial waters controlled by four different countries in the South Pacific. In April 2010, SMM was acquired by Dorado Ocean Resources, Ltd. (“DOR”) through a share exchange. At that time, DOR also acquired the remaining interest in Bluewater. We were issued 450 DOR shares in exchange for our surrendered units in SMM. We also acquired an additional 1,200 shares of DOR valued at $2,000,000 that resulted in a 41.25% ownership of DOR. Ultimately we held a 40.8% ownership of DOR. Under the terms of the Share Subscription Agreement (subscription payable), we had the option to pay for this investment in cash, provide marine services to DOR over a three-year period commencing April 2010 or exercise our contractual right to offset against the $2,000,000 marine services accounts receivable owed to us. See NOTE E for the disposition of this subscription payable. The focus of DOR was on the exploration and monetization of gold- and copper-rich Seafloor Massive Sulfide (“SMS”) deposits.
During the year ended December 31, 2011, we were engaged by Neptune Minerals, Inc. (“NMI”) and its affiliates to perform marine services relating to deep-sea mining on two separate charter agreements. The agreements provided for payments to us in cash and Class B shares of non-voting common stock of Neptune Minerals, LLC. During the year ended December 31, 2011, we earned 2,066,600 shares of the Class B non-voting common stock from these engagements. During this same period, NMI completed a share exchange with DOR shareholders whereby each one outstanding share of DOR was exchanged for 1,000 shares of NMI Class B non-voting common stock. We received 1,650,000 shares of NMI Class B non-voting common stock for our 1,650 DOR shares pursuant to the share exchange. In connection with this share exchange, NMI executed an assignment and assumption agreement, whereby NMI assumed $8,227,675 of the outstanding debt DOR owed to us. In addition, we executed a debt conversion agreement with NMI, whereby we converted $2,500,000 of the debt owed to us for 2,500,000 shares of NMI Class B non-voting common stock. At December 31, 2011, we have a net share position in NMI of 6,216,600 shares, which represents an approximate 31% ownership before any further dilution of the NMI stock.
Based on guidance in ASC 323: Equity Method and Joint Ventures, management has determined we are able to exert significant influence and, therefore, management believes it is appropriate to apply the equity method of accounting to this investment. Additionally, we do not have any requirements to provide any additional financial support to DOR or NMI. The original $2,500,000 accounts receivable related to the 2,500,000 share conversion was fully reserved and maintained a net book value of zero. The 1,650 shares related to the original DOR investment had a net book value of zero because DOR accounting was on the equity method and the entire investment was written down to zero. These stock conversions were viewed as contribution of non-cash assets with a carrying basis of zero. Therefore, we believe the carry-over basis is more appropriate to measure the investment than fair value. Accordingly, no gain or loss was recorded on these transactions.
At September 30, 2011, there was approximately $1,200,000 of outstanding DOR (NMI) losses allocable to us that we have not recognized in our income statement because these losses exceeded our investment. Based on the NMI and DOR transaction described above, we believe it is appropriate to allocate these losses to any incremental investment recognized on our balance sheet in NMI. During the three-month period ended December 31, 2011, we earned an additional $245,000 worth of the Class B non-voting common stock from our NMI marine services charter. Accordingly, we applied this amount against the unrecognized loss noted above. However, NMI has not provided their financial statements for the period ending December 31, 2011 so we are unable to accurately quantify their loss for the respective period. Since our investment carrying basis is zero at December 31, 2011, the remaining cumulative and outstanding losses of approximately $950,000, exclusive of NMI’s results for the three-months ended December 31, 2011, are not yet recognized in our financial statements.
NOTE K – DERIVATIVE FINANCIAL INSTRUMENTS
The following tables summarize the components of our derivative liabilities and linked common shares as of December 31, 2011 and 2010 and the amounts that were reflected in our income related to our derivatives for the years then ended:
| December 31, | ||||||||
| 2011 | 2010 | |||||||
| Derivative liabilities: |
||||||||
| Embedded derivatives derived from: |
||||||||
| Senior Convertible Notes |
$ | 2,521,422 | $ | — | ||||
| Series G Convertible Preferred Stock |
158,711 | 4,075,344 | ||||||
|
|
|
|
|
|||||
| 2,680,133 | 4,075,344 | |||||||
| Warrant derivatives |
||||||||
| Senior Convertible Notes |
1,898,785 | — | ||||||
| Series G Convertible Preferred Stock |
2,754,375 | 2,287,800 | ||||||
|
|
|
|
|
|||||
| Warrant derivatives |
4,653,160 | 2,287,800 | ||||||
|
|
|
|
|
|||||
| Total derivative liabilities |
$ | 7,333,293 | $ | 6,363,144 | ||||
|
|
|
|
|
|||||
44
Table of Contents
| December 31, | ||||||||
| 2011 | 2010 | |||||||
| Common shares linked to derivative liabilities: |
||||||||
| Embedded derivatives: |
||||||||
| Senior Convertible Notes |
2,673,797 | — | ||||||
| Series G Convertible Preferred Stock |
140,000 | 3,360,000 | ||||||
|
|
|
|
|
|||||
| 2,813,797 | 3,360,000 | |||||||
|
|
|
|
|
|||||
| Warrant derivatives |
||||||||
| Senior Convertible Notes |
1,302,083 | — | ||||||
| Series G Convertible Preferred Stock |
2,325,000 | 1,800,000 | ||||||
|
|
|
|
|
|||||
| 3,627,083 | 1,800,000 | |||||||
|
|
|
|
|
|||||
| Total common shares linked to derivative liabilities |
6,440,880 | 5,160,000 | ||||||
|
|
|
|
|
|||||
| Years ended December 31, | ||||||||
| 2011 | 2010 | |||||||
| Derivative income (expense): |
||||||||
| Unrealized gains (losses) from fair value changes: |
||||||||
| Senior Convertible Notes |
$ | 468,115 | $ | — | ||||
| Series G Convertible Preferred Stock |
(738,606 | ) | (2,424,912 | ) | ||||
| Warrant derivatives |
595,391 | (1,213,200 | ) | |||||
|
|
|
|
|
|||||
| 324,900 | (3,638,112 | ) | ||||||
| Redemptions of Series G Convertible Preferred Stock |
4,655,239 | — | ||||||
|
|
|
|
|
|||||
| Total derivative income (expense) |
$ | 4,980,139 | $ | (3,638,112 | ) | |||
|
|
|
|
|
|||||
Our Series G Convertible Preferred Stock and Warrant Financing Transaction on October 11, 2010, Series G Convertible Preferred Stock and Warrant Settlement Transaction during April 2011, and Senior Convertible Note and Warrant Financing Transaction on November 8, 2011 gave rise to derivative financial instruments. As more fully discussed in Note Q, we entered into the Series G Convertible Preferred Stock and Warrant Financing Transaction and the Series G Convertible Preferred Stock and Warrant Settlement Transaction on October 11, 2010 and April 14, 2011, respectively. The Series G Convertible Preferred Stock embodied certain terms and features that both possessed all of the conditions of derivative financial instruments and were not clearly and closely related to the host preferred contract in terms of economic risks and characteristics. These terms and features consist of the embedded conversion option and the related down-round anti-dilution protection provision, the Company’s redemption privilege and the holder’s redemption privilege. Each of the redemption features also embodies the redemption premium payments. Warrants issued with this transaction and the subsequent Settlement Transaction embodied down-round anti-dilution protection and, accordingly, were not afforded equity classification. As more fully discussed in Note L, we entered into the Senior Convertible Note and Warrant Financing Transaction on November 8, 2011. The Senior Convertible Note embodied certain terms and conditions that were not clearly and closely related to the host debt agreement in terms of economic risks and characteristics. These terms and features consist of the embedded conversion options, certain redemption features and a conversion price reset feature. Warrants issued with this transaction embodied reset price protection and, accordingly, were not afforded equity classification.
Current accounting principles that are provided in ASC 815 - Derivatives and Hedging require derivative financial instruments to be classified in liabilities and carried at fair value with changes recorded in income. In addition, the standards do not permit an issuer to account separately for individual derivative terms and features embedded in hybrid financial instruments that require bifurcation and liability classification as derivative financial instruments. Rather, such terms and features must be bundled together and fair valued as a single, compound embedded derivative. We have selected the Monte Carlo Simulations valuation technique to fair value the compound embedded derivative because we believe that this technique is reflective of all significant assumption types, and ranges of assumption inputs, that market participants would likely consider in transactions involving compound embedded derivatives. Such assumptions include, among other inputs, interest risk assumptions, credit risk assumptions and redemption behaviors in addition to traditional inputs for option models such as market trading volatility and risk free rates. We have selected Binomial Lattice to fair value our warrant derivatives because we believe this technique is reflective of all significant assumption types market participants would likely consider in transactions involving freestanding warrants derivatives. The Monte Carlo Simulations technique is a level three valuation technique because it requires the development of significant internal assumptions in addition to observable market indicators.
45
Table of Contents
Significant inputs and results arising from the Monte Carlo Simulations process are as follows for the compound embedded derivative that has been bifurcated from our Senior Convertible Note and classified in liabilities:
| December 31, 2011 |
November 8, 2011 (Issuance) | |||
| Quoted market price on valuation date |
$2.74 | $2.90 | ||
| Contractual conversion rate |
$3.74 | $3.74 | ||
| Range of effective contractual conversion rates |
$2.74 - $2.89 | $2.94 - $3.08 | ||
| Contractual term to maturity |
2.33 Years | 2.48 Years | ||
| Implied expected term to maturity |
2.06 Years | 2.09 Years | ||
| Market volatility: |
||||
| Range of volatilities |
55.6% - 101.8% | 52.1% - 133.9% | ||
| Range of equivalent volatilities |
78.9% - 84.3% | 84.5% - 94.7% | ||
| Contractual interest rate |
8.0% | 8.0% | ||
| Range of equivalent market risk adjusted interest rates |
8.0% - 8.1% | 8.0% | ||
| Range of equivalent credit risk adjusted yields |
3.1% - 3.5% | 3.4% - 4.0% | ||
| Risk-free rates |
0.01% - 0.25% | 0.01% - 0.25% |
The effective contractual conversion rates give effect to the impending conversion price reset on May 8, 2012 and were derived using a Random-Walk Brownian Motion Stochastic Process. In this process, the expected mean selling price of the Company’s common stock on the reset date was estimated at a range of $2.49 - $2.63 as of December 31, 2011 and $2.67 - $2.80 as of November 8, 2011. The mean prices derived from the stochastic process were multiplied by 110% which is a contractual provision for computing the reset price on May 8, 2012.
Significant inputs and results arising from the Monte Carlo Simulations process are as follows for the compound embedded derivative that has been bifurcated from our Series G Convertible Preferred Stock and classified in liabilities:
| December 31, | October 11, | |||||
| 2011 | 2010 | 2010 (Issuance) | ||||
| Quoted market price on valuation date |
$2.74 | $2.78 | $1.78 | |||
| Contractual conversion rate |
$1.78 | $1.78 | $1.78 | |||
| Implied expected term |
0.46 Years | 0.81 Years | 1.19 Years | |||
| Market volatility: |
||||||
| Range of volatilities |
49.5% - 101.8% | 57.6% - 73.2% | 53.7% - 73.8% | |||
| Equivalent volatility |
74.1% | 61.5% | 58.2% | |||
| Market risk adjusted interest rate: |
||||||
| Range of rates |
13.0% - 32.0% | 8.0% - 33.0% | 8.0% - 32.2% | |||
| Equivalent market risk adjusted interest rate |
15.3% | 13.5% | 12.7% | |||
| Credit risk adjusted yield rate: |
||||||
| Range of rates |
3.1% - 3.7% | 3.4% - 4.8% | 3.9% - 4.8% | |||
| Equivalent credit-risk adjusted yield rate |
3.1% | 3.5% | 4.0% | |||
| Risk free rates using zero coupon US Treasury Security rates: |
||||||
| Range of rates |
0.12% - 0.25% | 0.29% - 0.64% | 0.27% - 0.64% | |||
During the period April 4-8, 2011 and on October 14, 2011, investors redeemed $750,000 and $2,800,000, respectively, stated value of our Series G Convertible Preferred Stock. On the redemption dates, the compound embedded derivatives were adjusted to their fair values of $676,718 and $3,978,521, respectively, which amounts were recorded in income. The following table reflects the issuances of compound embedded derivatives, redemptions and changes in fair value inputs and assumptions related to the compound embedded derivatives during the years ended December 31, 2011 and 2010.
| Years ended December 31, | ||||||||
| 2011 | 2010 | |||||||
| Balances at January 1, 2011 |
$ | 4,075,344 | $ | — | ||||
| Issuances: |
||||||||
| Series G Convertible Preferred Stock Financing |
— | 1,650,432 | ||||||
| Senior Convertible Note Financing |
2,989,537 | — | ||||||
| Expirations from redemptions of Series G Convertible Preferred Stock |
(4,655,239 | ) | — | |||||
| Changes in fair value inputs and assumptions reflected in income |
270,491 | 2,424,912 | ||||||
|
|
|
|
|
|||||
| Balances at December 31, 2011 |
$ | 2,680,133 | $ | 4,075,344 | ||||
|
|
|
|
|
|||||
46
Table of Contents
The fair value of the compound embedded derivative is significantly influenced by our trading market price, the price volatility in trading and the interest components of the Monte Carlo Simulation technique.
On October 11, 2010, we also issued warrants to acquire 1,800,000 of our common shares in connection with the Series G Convertible Preferred Stock Financing. During April 4-8, 2011, we issued warrants to acquire 525,000 of our common shares in connection the Series G Convertible Preferred Stock and Warrant Settlement Transaction. Finally, on November 8, 2011, we issued warrants to acquire 1,302,083 of our common shares in connection with the Senior Convertible Note Financing Transaction. These warrants required liability classification as derivative financial instruments because certain down-round anti-dilution protection or price protection features included in the warrant agreements are not consistent with the concept of equity. We applied the Binomial Lattice valuation technique in estimating the fair value of the warrants because we believe that this technique is most appropriate and reflects all of the assumptions that market participants would likely consider in transactions involving the warrants, including the potential incremental value associated with the down-round anti-dilution protections.
The Binomial Lattice technique is a level three valuation technique because it requires the development of significant internal assumptions in addition to observable market indicators. Significant assumptions and utilized in the Binomial Lattice process are as follows for both the issuance dates of the warrants and December 31, 2011 and 2010:
| December 31, | October 11, | |||||
| 2011 | 2010 | 2010 (Issuance) | ||||
| Linked common shares |
1,800,000 | 1,800,000 | 1,800,000 | |||
| Quoted market price on valuation date |
$2.74 | $2.78 | $1.78 | |||
| Contractual exercise rate |
$2.50 | $2.50 | $2.50 | |||
| Term (years) |
1.78 | 2.78 | 3.00 | |||
| Range of market volatilities |
56.8% - 101.6% | 57.6% - 73.2% | 54.3% - 74.6% | |||
| Risk free rates using zero coupon US Treasury Security rates |
0.02% - 0.25% | 0.12% - 1.02% | 0.12% - 0.54% | |||
| December 31, 2011 |
April 14, 2011 2011 (Issuance) | |||
| Linked common shares |
525,000 | 525,000 | ||
| Quoted market price on valuation date |
$2.74 | $3.36 | ||
| Contractual exercise rate |
$2.75 | $2.75 | ||
| Term (years) |
2.28 | 3.00 | ||
| Range of market volatilities |
56.9% - 94.0% | 59.5% - 73.0% | ||
| Risk free rates using zero coupon US Treasury Security rates |
0.02% - 0.25% | 0.07% - 1.27% |
| December 31, 2011 |
November 8, 2011 (Issuance) | |||
| Linked common shares |
1,302,083 | 1,302,083 | ||
| Quoted market price on valuation date |
$2.74 | $2.90 | ||
| Contractual exercise rate |
$4.32 | $4.32 | ||
| Term (years) |
5.35 | 5.50 | ||
| Range of volatilities |
67.2% - 87.5% | 67.7% - 95.1% | ||
| Risk free rates using zero coupon US Treasury Security rates |
0.02% - 0.83% | 0.01% - 0.92% | ||
| Custom lattice variable: Probability of exercisability (434,027 linked common shares) |
60.0% | 60.0% |
47
Table of Contents
Of the 1,302,083 common shares accessible from the warrant issued on November 8, 2011, 434,027 of those common shares are accessible only based upon the Company’s election to require the lender to provide the additional financing. The lattice custom variable is the probability that management will elect to receive this funding. Based upon all current facts and circumstances, that probability is 60%.
The following table reflects the issuances of derivative warrants and changes in fair value inputs and assumptions related to the derivative warrants during the year ended December 31, 2011 and 2010.
| Years ended December 31, | ||||||||
| 2011 | 2010 | |||||||
| Balances at January 1, 2011 |
$ | 2,287,800 | $ | — | ||||
| Issuances: |
||||||||
| Series G Convertible Preferred Stock Financing |
906,150 | 1,074,600 | ||||||
| Senior Convertible Note Financing |
2,054,601 | — | ||||||
| Changes in fair value inputs and assumptions reflected in income |
(595,391 | ) | 1,213,200 | |||||
|
|
|
|
|
|||||
| Balances at December 31, 2011 |
$ | 4,653,160 | $ | 2,287,800 | ||||
|
|
|
|
|
|||||
The fair value of all warrant derivatives is significantly influenced by our trading market price, the price volatility in trading and the risk free interest components of the Binomial Lattice technique.
NOTE L – MORTGAGE AND LOANS PAYABLE
The Company’s consolidated mortgages and notes payable consisted of the following at December 31, 2011 and 2010:
| 2011 | 2010 | |||||||
| Term loan |
$ | 3,000,000 | $ | 5,000,000 | ||||
| Face value $10,000,000, 8% Convertible Senior Note payable |
5,316,328 | — | ||||||
| Mortgages payable |
2,176,727 | 2,950,920 | ||||||
|
|
|
|
|
|||||
| $ | 10,493,055 | $ | 7,950,920 | |||||
|
|
|
|
|
|||||
Term Loan
On May 4, 2011, we amended our revolving credit facility with Fifth Third Bank (the “Bank”) to replace it with a $5 million term loan maturing on April 23, 2012. A principal payment of $2 million was due and paid prior to August 1, 2011, and the remainder is due by maturity. The facility bears floating interest at the one-month LIBOR rate according to the Wall Street Journal plus 500 basis points. Any prepayments made in full or in part are without premium or penalty. A commitment fee of $250,000 was paid at closing. Restricted cash amounts are not required to be kept on deposit. As a condition to the loan renewal, we were required to amend the Loan Agreement (mortgage payable) for our corporate real estate facility, which is due to mature on July 11, 2013, whereby we were required to pay additional principal to meet an 80% loan-to-value (LTV) based upon an independent real estate appraisal. The additional monthly principal payments were $100,000 per month until the loan balance met the 80% LTV. Based on this condition, we remitted $600,000 in 2011 and the final $ $43,750 in January 2012. In March 2012, the bank provided a term sheet which increases this term loan to $5 million (an additional $2 million) and will extend the maturity to mid-2013. Terms and conditions are similar to the terms and conditions of our current term loan. We expect to close on this new term loan within the next month.
The amended term loan is secured by approximately 27,000 numismatic coins which had a carrying value of $5,879,137 that were recovered from the SS Republic shipwreck, which amount will be reduced over the term by the amount of coins sold by the Company. The coins used as collateral are held by a custodian for the security of the Bank. The borrowing base is equal to forty percent (40%) of the eligible coin inventory valued on a rolling twelve-month wholesale average value which was $16.3 million at December 31, 2011. The Company is required to comply with a number of customary covenants.
Revolving Credit Facility
On February 7, 2008, we entered into a $5 million revolving credit facility with Fifth Third Bank (the “Bank”). The credit facility had a floating interest rate equal to the “Prime Rate” plus fifty basis points (.50%), required monthly payments of interest only and was originally due in full February 7, 2010, with a 90-day extension granted until May 7, 2010. On April 23, 2010, the Bank renewed the credit facility which became due in full on April 23, 2011. The facility required us to pay the Bank an unused line fee equal to one-half percent (0.50%) per annum of the unused portion of the credit line. The line of credit was originally secured by a restricted cash balance (See NOTE D) as well as approximately 28,500 coins recovered from the SS Republic shipwreck. The coin inventory balance that secured the debt was to be reduced over the term by the amount of coins sold. The modified borrowing base was equal to forty percent (40%) of the eligible coin inventory calculated on a rolling twelve-month wholesale average value. Odyssey was required to comply with a number of customary affirmative and negative covenants. The significant covenants included: maintaining insurance on the inventory; ensuring the collateral is free from encumbrances and without the consent of the Bank, the Company cannot merge or consolidate with or into any other corporation or entity nor can the Company enter into a material debt agreement with a third party.
48
Table of Contents
Senior Convertible Note
During November 2011, we entered into a securities purchase agreement (the “Purchase Agreement”) with one institutional investor pursuant to which we issued and sold a Senior Convertible Note in the original principal amount of $10.0 million (the “Initial Note”) and a warrant (the “Warrant”) to purchase up to 1,302,083 shares of our common stock. Subject to the satisfaction of conditions set forth in the Purchase Agreement, we have the right to require the investor to purchase an additional senior convertible note in the original principal amount of up to $5.0 million on the six-month anniversary of the initial closing date (the “Additional Note” and, collectively “Notes”). Aggregate direct finance costs amounted to $545,000 of which $45,000 related to costs of the lender and, accordingly, were included in the original issue discount on the Initial Note.
The indebtedness evidenced by the Note bears interest at 8.0% percent per year (15% under default conditions, if ever). Interest is compounded monthly and payable quarterly at the beginning of each calendar quarter. The Note is amortized with equal monthly principal installments of $434,783 commencing on July 8, 2012. Prepayment is not allowed. Further, the Note may be converted into our common stock, at the option of the holder, at any time following issuance, with respect to the Initial Note, or at any time following six months after the date of issuance, with respect to the Additional Note. The initial conversion price of the Initial Note is $3.74, subject to adjustment on the six-month anniversary of the initial closing date as follows: The reset conversion price applicable to the Initial Note will be adjusted to the lesser of (a) the then current conversion price and (b) the greater of (i) $1.44 and (ii) 110.0% of the market price of our common stock on the six-month anniversary of the initial closing date (as applicable, the “Conversion Price”). The conversion price is also subject to adjustment for stock splits, stock dividends, recapitalizations, and similar transactions. We have agreed to pay each amortization payment in shares of our common stock, if certain conditions are met; provided, that we may, at our option, elect to pay such amortization payments in cash. The conversion rate applicable to any amortization payment that we make in shares of our common stock will be the lower of (a) the Conversion Price and (b) a price equal to 85.0% of the volume-weighted average price of our shares of common stock for a ten-day period immediately prior to the applicable amortization date.
The Note provides for redemption upon the occurrence of an event of default. Default conditions include non-servicing of the debt and certain other credit risk related conditions. Default conditions also include certain equity indexed events including failures to file public information documents, non-conversion or insufficient share authorizations to effect conversion and failure obtain and maintain an effective registration statement covering the underlying common shares. The remedies to the investor for events of default include acceleration of payment at 125% of the remaining face value in certain circumstances. In the event the default redemption is not paid, the investor would have the right to elect conversion of the note at an adjusted conversion price approximating 75% of quoted market prices. A change in control would also result in a redemption requirement at 125% of the face value.
The Notes extend no voting rights to the investors. However, the Notes extend participation rights in dividend payments, if any, made to the holders of the Company’s common or other class of stock, except our Series G Preferred Stock.
Under the terms of the Warrant, the holder is entitled to exercise the Warrant to purchase up to 1,302,083 shares of our common stock at an initial exercise price of $4.32 per share, during the five-year period beginning on the six-month anniversary of the initial closing date; provided, that 434,027 shares of our common stock issuable upon exercise of the Warrant may not be exercised unless the investor has purchased the Additional Note. On the six-month anniversary of the initial closing date, the exercise price applicable to the Warrant will be adjusted to the lesser of (a) the then current exercise price and (b) 125.0% of the market price of our common stock on the six-month anniversary of the initial closing date (as applicable, the “Exercise Price”). The Exercise Price is also subject to adjustment for stock splits, stock dividends, recapitalizations, and similar transactions. We are generally prohibited from issuing shares of common stock upon exercise of the Warrant if such exercise would cause us to breach our obligations under the rules or regulations of the stock market on which the common stock is traded.
49
Table of Contents
In connection with the financing, we entered into a registration rights agreement pursuant to which we agreed to file a registration statement with the Securities and Exchange Commission (with the “SEC”) relating to the offer and sale by the investor of the shares of common stock issuable upon conversion of the Notes and the exercise of the Warrant. Pursuant to the agreement, we are required to file the registration statement within six months of the initial closing date and to use its best efforts for the registration statement to be declared effective 90 days thereafter (or 120 days thereafter if the registration statement is subject to review by the SEC).
We have accounted for the Initial Note and Warrants issued for cash as a financing transaction, wherein the net proceeds that we received were allocated to the financial instruments issued. Prior to making the above accounting allocation, we evaluated the Initial Note and the Warrants for proper classification under ASC 480 Distinguishing Liabilities from Equity (“ASC 480”) and ASC 815 Derivatives and Hedging (“ASC 815”).
ASC 815 generally requires the analysis embedded terms and features that have characteristics of derivatives to be evaluated for bifurcation and separate accounting in instances where their economic risks and characteristics are not clearly and closely related to the risks of the host contract. The material embedded derivative features consisted of the conversion option and related conversion reset price protection, the Company’s redemption privilege, and certain redemption rights that were indexed to equity risks. The conversion option and conversion reset price protection, along with the redemption features bearing risks of equity, were not clearly and closely related host debt agreement and required bifurcation. Current accounting principles that are also provided in ASC 815 do not permit an issuer to account separately for individual derivative terms and features that require bifurcation and liability classification. Rather, such terms and features must be and were bundled together and fair valued as a single, compound embedded derivative.
The Warrants had terms of five and one-half years and an exercise price of $4.32. The contractual exercise price is subject to adjustment for both traditional recapitalization events as is also subject to reset on the sixth month anniversary of issuance. Although the warrants did not fall within the scope of ASC 480, the warrants required derivative liability accounting because the conversion price reset protection terms are not consistent with the definition for financial instruments indexed to a company’s own stock.
Based on the previous conclusions, we allocated the cash proceeds first to the derivative components at their fair values (see NOTE K) with the residual allocated to the host debt contract, as follows:
| Allocation | ||||
| Initial Note |
$ | 4,910,862 | ||
| Compound embedded derivative |
2,989,537 | |||
| Derivative warrants |
2,054,601 | |||
|
|
|
|||
| $ | 9,955,000 | |||
|
|
|
|||
The basis that was subject to allocation included the gross proceeds of $10,000,000, less costs of the investor paid out of proceeds that amounted to $45,000. We also allocated the direct financing costs of $500,000 to the note payable and the derivative components based upon the relative fair values of these financial instruments. As a result of this allocation, $246,653 was recorded in deferred costs and $253,347 was recorded as expense.
The financing basis allocated to the notes payable and the deferred asset arising from direct finance costs are subject to amortization with periodic charges to interest expense using the effective interest method. Amortization of these components included in interest expense during the year ended December 31, 2011 amounted to $425,116. The derivative components are subject to re-measurement to fair value at the end of each reporting period with the change reflected in income. See Note K for information about our derivatives.
Mortgages Payable
On July 11, 2008, we entered into a mortgage loan with Fifth Third Bank. Pursuant to the Loan Agreement, we borrowed $2,580,000. The loan bears interest at a variable rate equal to the prime rate plus three-fourths of one percent (0.75%) per annum. The loan matures on July 11, 2013, and requires us to make monthly principal payments in the amount of $10,750 plus accrued interest. This loan is secured by a restricted cash balance (See NOTE D) as well as a first mortgage on our corporate office building which has a carrying value of $2,539,259. This loan contains customary representations and warranties, affirmative and negative covenants, conditions, and other provisions.
50
Table of Contents
During May 2008, we entered into a mortgage loan in the principal amount of $679,000 with The Bank of Tampa to purchase our conservation lab and storage facility. This obligation has monthly payment of $5,080 and a maturity date of May 14, 2015. Principal and interest payments are payable monthly. Interest is at a fixed annual rate of 6.45%. This debt is secured by the related real property which has a carrying value of $926,873. The seller is carrying a second mortgage for $100,000 with interest due monthly and $25,000 of principal due each May. The first principal payment was made in May 2009. The interest is at a variable rate of 1.0% above the prime interest rate stated by BB&T, formerly Colonial Bank of Tampa. This obligation has a maturity date of May 14, 2012 and is secured by the related real property.
Long-Term Obligation Maturities:
| Total | 2012 | 2013 | 2014 | 2015 | 2016 | More than 5 years |
||||||||||||||||||||||
| Long term obligations |
$ | 12,176,727 | $ | 2,828,553 | $ | 6,607,466 | $ | 2,199,055 | $ | 541,653 | $ | — | $ | — | ||||||||||||||
| Operating leases |
8,868,261 | 4,102,554 | 4,102,554 | 663,153 | — | — | — | |||||||||||||||||||||
| Interest on obligations |
1,363,560 | 841,997 | 436,335 | 65,897 | 19,331 | — | — | |||||||||||||||||||||
|
|
|
|
|
|
|
|
|
|
|
|
|
|
|
|||||||||||||||
| Total obligations |
$ | 22,408,548 | $ | 7,773,104 | $ | 11,146,355 | $ | 2,928,105 | $ | 560,984 | $ | — | $ | — | ||||||||||||||
|
|
|
|
|
|
|
|
|
|
|
|
|
|
|
|||||||||||||||
Long-term obligations represent the amount due on our existing mortgages and convertible note as described above. The operating lease represents our vessel charter. The vessel charter has a lease period March 2010 to February 2014 as well as a ninety-day termination notice clause.
NOTE M – ACCRUED EXPENSES
Accrued expenses consist of following:
| 2011 | 2010 | |||||||
| Compensation and bonuses |
$ | 891,136 | $ | 1,027,911 | ||||
| Customer deposits |
57,175 | — | ||||||
| Vessel operations |
959,857 | 1,392,909 | ||||||
| Professional services |
— | 129,676 | ||||||
| Other operating expenses |
153,806 | 216,176 | ||||||
|
|
|
|
|
|||||
| Total accrued expenses |
$ | 2,061,974 | $ | 2,766,672 | ||||
|
|
|
|
|
|||||
Vessel operations relates to expenditures required to operate our ships such as fuel, repair and maintenance, port fees and charter related. Professional fees are mainly attributable to legal fees and other professional services in support of operations. Other operating expenses contain general items related to, but not limited to marketing, insurance and the exhibit.
NOTE N – DEFERRED REVENUE
Since 2009, we entered into several marine search services contracts associated with the Robert Frasier Marine, Ltd. projects. For each contract, revenue is recognized over the contractual period when services are performed as defined by the contract. The period of time a search project remains active varies but usually extends over several months and may be accelerated or extended depending upon operational factors. At December 31, 2011, we have a $3,545,140 service obligation on two service contracts that will be recognized as revenue over the period of time the contractual services are provided. At December 31, 2010, we had deferred revenue related to a specific contract of $730,098 which was earned in 2011. For the years ended December 31, 2011 and 2010, we earned charter expedition revenue, exclusive of the sale of research, of $2,708,947 and $5,846,793, respectively, relating to these contracts.
51
Table of Contents
NOTE O – RELATED PARTY TRANSACTIONS
On December 9, 2002, a Georgia limited liability company acquired rights from an unrelated third party through a foreclosure sale to receive 5% of post-finance cost proceeds, if any, from shipwrecks that we may recover within a predefined search area of the Mediterranean Sea. The shipwreck we believe to be HMS Sussex is located within this search area. Two of our officers and directors at the time owned a 58% interest in the limited liability company until they sold their interests to an unrelated third party in 2005. If, at any time, Odyssey is forced to cancel or abandon the project due to political interference, the officers may be required to buy back their interests.
NOTE P – REVENUE PARTICIPATION RIGHTS
The Company’s participating revenue rights consisted of the following at December 31, 2011 and 2010:
| December 31, 2011 |
December 31, 2010 |
|||||||
| “Cambridge” project |
$ | 825,000 | $ | 825,000 | ||||
| “Republic” (now “Seattle”) project |
62,500 | 62,500 | ||||||
| Galt Resources, LLC |
7,512,500 | — | ||||||
|
|
|
|
|
|||||
| Total participating revenue rights |
$ | 8,400,000 | $ | 887,500 | ||||
|
|
|
|
|
|||||
We previously sold Revenue Participation Certificates (“RPCs”) that represent the right to share in our future revenues derived from the “Cambridge” project, which is now referred to as the HMS Sussex shipwreck project. We also sold RPCs related to a project formerly called the “Republic” project which we now call the “Seattle” project. The “Seattle” project refers to a shipwreck which we have not yet located. The “Cambridge” RPC units constitute restricted securities.
Each $50,000 convertible “Cambridge” RPC entitles the holder to receive a percentage of the gross revenue received by us from the “Cambridge” project, which is defined as all cash proceeds payable to us as a result of the “Cambridge” project, less any amounts paid to the British Government or their designee(s); provided, however, that all funds received by us to finance the project are excluded from gross revenue. The “Cambridge” project holders are entitled to 100% of the first $825,000 of gross revenue, 24.75% of gross revenue from $4 - 35 million, and 12.375% of gross revenue above $35 million generated by the project.
In a private placement that closed in September 2000, we sold “units” consisting of “Republic” Revenue Participation Certificates and Common Stock. Each $50,000 “unit” entitled the holder to 1% of the gross revenue generated by the “Seattle” project (formerly referred to as the “Republic” project), and 100,000 shares of Common Stock. Gross revenue is defined as all cash proceeds payable to us as a result of the “Seattle” project, excluding funds received by us to finance the project.
The participating rights balance will be amortized under the units of revenue method once management can reasonably estimate potential revenue for each of these projects. The RPCs for the “Cambridge” and “Republic” projects do not have a termination date, therefore these liabilities will be carried on the books until revenue is recognized from these projects or we permanently abandon either project.
In February 2011, we entered into a project syndication deal with Galt Resources LLC (“Galt”) for which they invested $7,512,500 representing rights to future revenues of any project Galt selects prior to December 31, 2011. If the project is successful, Galt will recoup their investment plus three times the investment. These amounts will be paid out of proceeds of the project. Galt will receive 50% of the proceeds until this amount is recouped. Thereafter, they will share in additional net proceeds of the project at the rate of 1% for every million invested. The agreement originally allowed Galt to select only one project but an agreement was subsequently reached permitting Galt to bifurcate their selection between two projects, the SS Gairsoppa and HMS Victory. Galt will receive 50% of our net proceeds, if any, on the SS Gairsoppa project until they receive two times its initial investment of $7,512,500. Galt will also receive 50% of our net proceeds, if any, on the HMS Victory project until they receive two times its initial investment and thereafter will receive 7.5125% of our net proceeds from the HMS Victory project. The Galt invested balance will be amortized to revenue over the expected revenue stream of the selected project.
52
Table of Contents
NOTE Q – REDEEMABLE SERIES G PREFERRED STOCK
During October 2010, we designated and issued 24 shares of our authorized preferred stock as Series G 8% Convertible Preferred Stock, par value $0.0001 per share (the “Series G Preferred”) as further discussed below. In April 2011 and October 2011, we redeemed 3 and 20 shares, respectively, from certain holders of the Series G Preferred for cash of $757,500 and $5,065,556, respectively, under the terms and conditions of the Series G Preferred Certificate of Designation. At the time of redemption, the carrying value of these shares of Series G Preferred amounted to $558,926 and $5,000,000, respectively. We have recorded the difference between the redemption values paid and the carrying values amounting to $198,574 and $65,556, respectively, as a deemed dividend in paid-in capital. See NOTE K for our accounting for the associated compound embedded derivative that had been bifurcated and classified in liabilities. As of December 31, 2011, 1 share of Series G Convertible Preferred Stock remains outstanding.
Significant terms and conditions of the Series G Preferred are as follows:
Dividends. The holders of the Series G Preferred will generally be entitled to receive cash dividends at a rate of $20,000 per share per year (or 8%), payable semi-annually on April 1 and October 1 of each year, commencing April 1, 2011. The dividends will be cumulative and shall accrue, whether or not earned or declared, from and after the date of issue.
Liquidation Preference. In the event of any liquidation, dissolution, or winding up of Odyssey’s affairs, each holder of the Series G Preferred then outstanding will be entitled to receive, before any payment or distribution will be made on Odyssey’s common stock or any capital stock of Odyssey ranking junior to the Series G Preferred as to the payment of dividends or the distribution of assets, an amount per share of Series G Preferred equal to the sum of (a) $250,000 plus (b) any accrued but unpaid dividends.
Voting Rights. The holders of Series G Preferred will be entitled to one vote for each share of common stock into which the Series G Preferred is convertible and will be entitled to notice of meetings of stockholders. The holders of Series G Preferred will also be entitled to vote as a separate class with respect to certain matters. However, no holder may exercise its voting rights if doing so would result in the holder beneficially owning in excess of 9.9% of the outstanding common stock, unless waived by the holder.
Conversion Rights. At any time on or after April 15, 2011, any holder of shares of Series G Preferred may convert any or all of the shares into shares of common stock. Each share of Series G preferred will be convertible into the number of shares determined by dividing $250,000 by $1.785714, which we refer to as the conversion price. The number of shares of common stock issuable upon conversion of the Series G Preferred is subject to adjustment in certain events, as discussed in the next paragraph.
Adjustments to Conversion Rights. If Odyssey pays a dividend or makes a distribution on its common stock in shares of common stock, subdivides its outstanding common stock into a greater number of shares, or combines its outstanding common stock into a smaller number of shares, or if there is a reorganization, or a merger or consolidation of Odyssey with or into any other entity which results in a conversion, exchange, or cancellation of the common stock, or a sale of all or substantially all of Odyssey’s assets, then the conversion rights described above will be adjusted appropriately so that each holder of Series G Preferred will receive the securities or other consideration the holder would have received if the holder’s Series G Preferred had been converted before the happening of the event. The conversion price in effect from time to time is also subject to downward adjustment if we issue or sell shares of common stock for a purchase price less than the conversion price or if we issue or sell shares convertible into or exercisable for shares of common stock with a conversion price or exercise price less than the conversion price for the Series G Preferred.
Limitations Upon Conversion Rights. No holder may convert shares of Series G Preferred if such conversion would result in the holder beneficially owning in excess of 9.9% of the outstanding common stock, unless waived by the holder. In addition, we will not issue any shares of common stock upon conversion of shares of Series G Preferred if the issuance of such shares of common stock would exceed the aggregate number of shares of common stock that we may issue upon conversion of all outstanding shares of Series G Preferred and the outstanding warrants offered hereby without breaching our obligations under the listing rules of the NASDAQ Stock Market relating to stockholder approval of certain issuances of securities.
Redemption. Odyssey has the option to redeem the Series G Preferred, in whole or in part, at any time after December 15, 2010 at a redemption price of 100% of the liquidation value. Commencing after March 31, 2011, the redemption price increases 1.0% each month without cap. Each holder will have the option to require Odyssey to redeem the Series G Preferred, in whole or in part, at any time after December 15, 2011 at a redemption price commencing at 109% of the liquidation value, which increases 1.0% each without cap such that, after December 15, 2011, the holder’s and Odyssey’s redemption prices will equal. In either case, the redemption price to be paid by Odyssey for each share of Series G Preferred will be the redemption prices referred to above plus accrued dividends. There is no sinking fund requirement for redemption of the Series G preferred stock.
53
Table of Contents
On October 11, 2010, we issued (i) 20 shares of Series G Preferred, plus warrants to purchase 1,530,000 shares of our common stock for cash of $5,050,000 and (ii) 4 shares of Series G Preferred, plus warrants to purchase 270,000 shares of our common stock to settle certain promissory notes with a carrying value of $928,481. We have accounted for the Series G Preferred and warrants issued for cash as a financing transaction, wherein the net proceeds that we received was allocated to the financial instruments issued. We have accounted for the Series G Preferred and warrants issued in settlement of the promissory notes as an exchange, wherein we have recorded the financial instruments issued at their fair values and extinguished the promissory notes resulting in an extinguishment loss.
The following table summarizes the allocation for each of these transactions as of October 11, 2010:
| Financing | Exchange | Total | ||||||||||
| Redeemable preferred stock (1) |
$ | 2,747,476 | $ | 888,997 | $ | 3,636,473 | ||||||
| Compound embedded derivatives (2) |
1,389,114 | 261,318 | 1,650,432 | |||||||||
| Warrant derivatives (2) |
913,410 | 161,190 | 1,074,600 | |||||||||
| Extinguishment loss |
— | (383,023 | ) | (383,023 | ) | |||||||
|
|
|
|
|
|
|
|||||||
| $ | 5,050,000 | $ | 928,482 | $ | 5,978,482 | |||||||
|
|
|
|
|
|
|
|||||||
| (1) | The fair value of the redeemable preferred stock was estimated based upon its forward cash flow value, at a credit-risk adjusted market interest rate, as enhanced by the fair value of the conversion feature. Credit-risk adjusted rates used to discount the cash flow component ranged from 3.98% to 4.89% over our estimated period to redemption, which is October 2013.The fair value of the conversion feature is reflected in the compound embedded derivative line of the table. |
| (2) | See NOTE K for information related to the valuation of these financial instruments both on the inception date of the transactions and at December 31, 2010. |
Prior to making the above accounting allocation, we evaluated the Series G Preferred and the warrants for proper classification under ASC 480 - Distinguishing Liabilities from Equity and ASC 815 - Derivatives and Hedging.
Series G Preferred:
ASC 480 generally requires liability classification for financial instruments that are certain to be redeemed, represent obligations to purchase shares of stock or represent obligations to issue a variable number of common shares. We concluded that the Series G Preferred was not within the scope of ASC 480 because none of the three conditions for liability classification was present.
ASC 815 generally requires the analysis embedded terms and features that have characteristics of derivatives to be evaluated for bifurcation and separate accounting in instances where their economic risks and characteristics are not clearly and closely related to the risks of the host contract. However, in order to perform this analysis we were first required to evaluate the economic risks and characteristics of the Series G Preferred in its entirety as being either akin to equity or akin to debt. Our evaluation concluded that the Series G was more akin to a debt-like contract largely due to the fact that the financial instrument is mandatorily redeemable for cash at the option of the holder and has a return in the form of a dividend that operates similarly with an interest rate on debt. Other features of the Series G Preferred that operate like equity, such as the conversion option and voting feature, did not afford sufficient evidence, in our view, to offset the weight of the primary debt-like features; that is, the redemption feature and the dividend feature. Accordingly, based upon this conclusion the clear and close relationship of embedded derivative features was made relative to a debt-like contract.
The material embedded derivative features consisted of the conversion option and related down-round anti-dilution protection, the Company’s redemption privilege, and the holder’s redemption privilege. The conversion option and related anti-dilution protection, bearing risks of equity, were not clearly and closely related to the debt-like Series G Preferred and required bifurcation. The redemption features, although generally bearing risks of debt, such as credit and interest risk, were not clearly and closely related to the Series G Preferred because the Series G Preferred was deemed to be issued at a substantial discount and there are scenarios, however improbable or remote, that the redemption features as designed could double the investor’s initial rate of return. Current accounting principles that are also provided in ASC 815 do not permit an issuer to account separately for individual derivative terms and features that require bifurcation and liability classification. Rather, such terms and features must be and were bundled together and fair valued as a single, compound embedded derivative.
54
Table of Contents
Redeemable preferred stock represents preferred stock that is either redeemable for cash on a specific date or contingently redeemable for cash for events that are not within the control of management. Redeemable preferred stock is required to be classified outside of stockholders’ equity (in the mezzanine section). Because the Series G Preferred is redeemable at the holder’s option, we are required to record the residual from our allocation to the mezzanine section. This amount is further subject to accretion to the redemption value over the term to the earliest redemption date using the effective method. Accretion for the period from the inception date of the transactions to December 31, 2010 amounted to $383,050. Accretion during the year ended December 31, 2011 amounted to $1,789,403.
Dividends on the Series G Preferred are recorded when they are declared. Cumulative dividends from the inception date of the transactions to December 31, 2011 amounted to $520,556 of which $5,000 is in arrears on December 31, 2011.
Warrants:
The warrants issued in the financing and exchange transactions have terms of three years and an exercise price of $2.50. The contractual exercise price is subject to adjustment for both traditional recapitalization events and sales of common stock or other common stock linked contracts below the contractual exercise price. The latter is referred to as down-round anti-dilution protections. The warrants did not fall within the scope of ASC 480 under any of the three conditions referred to above. However, the warrants required derivative liability accounting because certain down-round anti-dilution protections are terms that are not consistent with the definition for financial instruments indexed to a company’s own stock.
NOTE R – STOCKHOLDERS’ DEFICIT
Common Stock
During June 2011, we completed a public offering of 5,520,000 shares of our common stock at $3.05 per share, before underwriting discounts and commissions. This offering was conducted pursuant to an effective shelf registration statement, which is on file with the Securities and Exchange Commission.
During the three-month period ended June 30, 2011, we issued 46,000 shares of common stock to two accredited investors upon conversion of 46,000 outstanding warrants.
During our annual meeting of stockholders on June 1, 2011, an amendment to our Articles of Incorporation to increase the number of authorized shares of common stock from 100,000,000 to 150,000,000 was approved by the stockholders.
During the three-month period ended March 31, 2011, we issued 56,000 shares of common stock to two accredited investors upon exercise of 56,000 outstanding warrants.
On May 6, 2010, we issued 1,300,000 shares of common stock to one institutional investor upon conversion of 13 outstanding shares of our Series E Convertible Preferred Stock. This conversion was completed in accordance with the original terms of the Series E Convertible Preferred Stock.
On April 20, 2010, we issued 600,000 shares of common stock to one institutional investor upon conversion of 600,000 outstanding shares of our Series D Convertible Preferred Stock. This conversion was completed in accordance with the original terms of the Series D Convertible Preferred Stock.
On March 18, 2010, we issued 600,000 shares of common stock to one institutional investor upon conversion of 600,000 outstanding shares of our Series D Convertible Preferred Stock. This conversion was completed in accordance with the original terms of the Series D Convertible Preferred Stock.
On February 12, 2010, we issued 500,000 shares of common stock to one institutional investor upon conversion of 500,000 outstanding shares of our Series D Convertible Preferred Stock. This conversion was completed in accordance with the original terms of the Series D Convertible Preferred Stock.
During January 2010, we entered into individual purchase agreements with certain investors pursuant to which we sold an aggregate of 4,000,000 shares of Odyssey’s common stock and warrants to purchase up to 2,400,000 shares of common stock to such investors. The common stock and warrants were sold as units, with each unit consisting of one share of common stock and a warrant to purchase 0.6 shares of common stock. The purchase price for each unit was $1.565. The warrants have an exercise price of $2.25 per share of common stock and are exercisable in accordance with their terms at any time on or before the close of business on January 29, 2013. The net proceeds to us from the registered direct public offering, after deducting placement agent fees and offering expenses were approximately $6.1 million.
55
Table of Contents
Convertible Preferred Stock
We have 206,400 shares of Series D Convertible Preferred Stock issued and outstanding as well as the 1 share of Series G Preferred Stock described in Note Q. Series D is convertible into common stock at a ratio of 1 to 1. The liquidation preference for Series D is $3.50 per share of common stock into which the Series D could then be converted. There are no other rights attached to these convertible instruments.
Stock-Based Compensation
We have two active stock incentive plans, the 1997 Stock Incentive Plan and the 2005 Stock Incentive Plan. The 1997 Stock Incentive Plan expired on August 17, 2007. As of that date, options cannot be granted from that Plan but any granted and unexercised options will continue to exist until exercised or they expire. The 2005 Stock Incentive Plan provides for the grant of incentive stock options, non-qualified stock options, restricted stock awards, restricted stock units and stock appreciation rights. We initially reserved 2,500,000 of our authorized but unissued shares of common stock for issuance under the Plan, and, at the time the Plan was adopted, not more than 500,000 of these shares could be used for restricted stock awards and restricted stock units. On January 16, 2008, the Board of Directors approved amendments to the Plan to add 2,500,000 shares of common stock to the Plan, to allow any number of shares to be used for restricted stock awards, to clarify certain other provisions in the Plan and to submit the amended Plan for stockholder approval. The amended Plan was approved at the annual meeting of stockholders on May 7, 2008. On June 3, 2010, the shareholders’ approved an amendment to the 2005 Stock Incentive Plan which resulted in the addition of 3,000,000 shares of common stock to the Plan. Any incentive option and non-qualified option granted under the Plan must provide for an exercise price of not less than the fair market value of the underlying shares on the date of grant, but the exercise price of any incentive option granted to an officer, director or eligible employee owning more than 10% of our outstanding common stock must not be less than 110% of fair market value on the date of the grant.
Share-based compensation expense recognized during the period is based on the value of the portion of share-based payment awards that is ultimately expected to vest. As share-based compensation expense recognized in the statement of operations is based on awards ultimately expected to vest, it can be reduced for estimated forfeitures. The ASC topic Stock Compensation requires forfeitures to be estimated at the time of grant and revised, if necessary, in subsequent periods if actual forfeitures differ from those estimates.
The share based compensation charged against income for the periods ended December 31, 2011, 2010 and 2009 was $1,796,628, $2,137,136 and $2,027,340, respectively.
The weighted average estimated fair value of stock options granted during the fiscal years ended December 31, 2011, 2010 and 2009 were $2.74, $0.92 and $1.53, respectively. These amounts were determined using the Black-Scholes option-pricing model, which values options based on the stock price at the grant date, the expected life of the option, the estimated volatility of the stock, the expected dividend payments, and the risk-free interest rate over the life of the option. The assumptions used in the Black-Scholes model were as follows for stock options granted in the years ended December 31, 2011, 2010 and 2009:
| 2011 | 2010 | 2009 | ||||
| Risk-free interest rate |
1.51-1.89% | .56-.67% | 1.1-2.0% | |||
| Expected volatility of common stock |
69.0-70.0% | 68.8-70.5% | 61-63% | |||
| Dividend yield |
0% | 0% | 0% | |||
| Expected life of options |
3.0-4.1 years | 3-3.3 years | 3-4 years |
The Black-Scholes option valuation model was developed for estimating the fair value of traded options that have no vesting restrictions and are fully transferable. Because option valuation models require the use of subjective assumptions, changes in these assumptions can materially affect the fair value of the options. Our options do not have the characteristics of traded options; therefore, the option valuation models do not necessarily provide a reliable measure of the fair value of our options.
Additional information with respect to both plans stock option activity is as follows:
| Number of Shares |
Weighted Average Exercise Price |
|||||||
| Outstanding at December 31, 2008 |
2,528,666 | $ | 4.25 | |||||
| Granted |
1,546,420 | $ | 3.53 | |||||
| Exercised |
(2,500 | ) | $ | 2.50 | ||||
| Cancelled |
(340,750 | ) | $ | 4.86 | ||||
|
|
|
|||||||
| Outstanding at December 31, 2009 |
3,731,836 | $ | 3.89 | |||||
| Granted |
271,500 | $ | 2.12 | |||||
| Exercised |
— | $ | — | |||||
| Cancelled |
(466,100 | ) | $ | 3.87 | ||||
|
|
|
|||||||
| Outstanding at December 31, 2010 |
3,537,236 | $ | 3.78 | |||||
| Granted |
633,835 | $ | 2.74 | |||||
| Exercised |
— | $ | — | |||||
| Cancelled |
(771,666 | ) | $ | 3.50 | ||||
|
|
|
|||||||
| Outstanding at December 31, 2011 |
3,399,405 | $ | 3.65 | |||||
|
|
|
|||||||
| Options exercisable at December 31, 2009 |
2,669,844 | $ | 3.87 | |||||
|
|
|
|||||||
| Options exercisable at December 31, 2010 |
3,032,194 | $ | 3.78 | |||||
|
|
|
|||||||
| Options exercisable at December 31, 2011 |
2,926,930 | $ | 3.79 | |||||
|
|
|
|||||||
56
Table of Contents
The aggregate intrinsic values of options exercisable for the fiscal years ended December 31, 2011, 2010 and 2009 were $133,750, $106,000 and $0, respectively. The aggregate intrinsic values of options outstanding for the fiscal years ended December 31, 2011, 2010 and 2009 were $169,500, $180,360 and $0, respectively. The aggregate intrinsic values of options exercised during the fiscal years ended December 31, 2011, 2010 and 2009 are $0, $0 and $4,625, respectively, determined as of the date of the option exercise. Aggregate intrinsic value represents the positive difference between our closing stock price at the end of a respective period and the exercise price multiplied by the number of relative options. The total fair value of shares vested during the fiscal years ended December 31, 2011, 2010 and 2009 was $1,145,112, $1,286,522 and $1,914,702, respectively.
As of December 31, 2011, there was $711,574 of total unrecognized compensation cost related to unvested share-based compensation awards granted to employees under the option plans. That cost is expected to be recognized over a weighted-average period of 1.86 years.
The following table summarizes information about stock options outstanding at December 31, 2011:
Stock Options Outstanding
| Range of Exercise Prices |
Number of Shares Outstanding |
Weighted
Average Remaining Contractual Life in Years |
Weighted Average Exercise Price |
|||||||||
| $1.00 - $3.00 |
905,335 | 3.49 | $ | 2.55 | ||||||||
| $3.01 - $4.00 |
1,744,070 | 1.77 | $ | 3.52 | ||||||||
| $4.01 - $7.00 |
750,000 | .91 | $ | 5.27 | ||||||||
|
|
|
|
|
|
|
|||||||
| 3,399,405 | 2.04 | $ | 3.65 | |||||||||
|
|
|
|
|
|
|
|||||||
The estimated fair value of each restricted stock award is calculated using the share price at the date of the grant. A summary of the status of the restricted stock awards as of December 31, 2011 and changes during the year ended December 31, 2011 is presented as follows:
| Number of Shares |
Weighted Average Grant Date Fair Value |
|||||||
| Unvested at December 31, 2010 |
279,799 | $ | 1.50 | |||||
| Granted |
338,277 | $ | 2.67 | |||||
| Vested |
(508,536 | ) | $ | 2.03 | ||||
| Cancelled |
— | $ | — | |||||
|
|
|
|||||||
| Unvested at December 31, 2011 |
109,540 | $ | 2.65 | |||||
|
|
|
|||||||
57
Table of Contents
The fair value of restricted stock awards vested during the years ended December 31 2011, 2010 and 2009 was $1,329,573, $1,234,465 and $178,290, respectively. The fair value of unvested restricted stock awards remaining at the periods ended December 31, 2011, 2010 and 2009 is $300,139, $777,839 and $115,143, respectively. The weighted-average grant date fair value of restricted stock awards granted during the periods ended December 31, 2011, 2010 and 2009 were $2.67, $1.45 and $2.72, respectively. The weighted-average remaining contractual term of these restricted stock awards at the periods ended December 31, 2011, 2010 and 2009 are 1.0, .98 and 1.0 years, respectively. As of December 31, 2011, there was a total of $290,281 unrecognized compensation cost related to unvested restricted stock awards.
The following table summarizes our common stock warrants outstanding at December 31, 2011:
| Common Stock Warrants |
Exercise Price |
Termination Date |
||||||||
| 100,000 | $ | 5.25 | — | (A) | ||||||
| 2,298,000 | $ | 2.25 | 1/31/2013 | |||||||
| 270,000 | $ | 2.25 | 8/20/2013 | |||||||
| 1,800,000 | $ | 2.50 | 10/11/2013 | (B) | ||||||
| 525,000 | $ | 2.75 | 4/13/2014 | |||||||
| 1,302,083 | $ | 4.32 | 11/9/2016 | |||||||
|
|
|
|||||||||
| 6,295,083 | ||||||||||
|
|
|
|||||||||
| (A): | There were 100,000 Common Stock Warrants outstanding at December 31, 2009. These warrants were issued during the quarter ended September 30, 2005 at an exercise price of $5.25 per share to a vendor for services relating to a marketing program. These warrants become vested and earned based upon future performance of the program, and may not be exercised until vested and earned, therefore expense will not be recorded until the warrants are vested and earned. The warrants have a two-year exercise period commencing on the date when the warrants would be vested and earned. At December 31, 2010 these warrants have not been earned nor have they commenced with vesting. |
| (B): | See NOTE Q. |
NOTE S – INCOME TAXES
As of December 31, 2011, we had consolidated income tax net operating loss (“NOL”) carryforwards for federal income tax purposes of approximately $123,000,000. The federal NOL carryforward will expire in various years ending through the year 2031. From 2017 through 2021, approximately $4 million of the NOL will expire, from 2022 through 2026, approximately $42 million of the NOL will expire and from 2027 through 2031, approximately $76 million of the NOL will expire.
The components of the provision for income taxes (benefits) are attributable to continuing operations as follows:
| 12 Month Period Ended December 31, 2011 |
12 Month Period Ended December 31, 2010 |
12 Month Period Ended December 31, 2009 |
||||||||||
| Current |
||||||||||||
| Federal |
$ | — | $ | — | $ | — | ||||||
| State |
— | — | — | |||||||||
|
|
|
|
|
|
|
|||||||
| $ | — | $ | — | $ | — | |||||||
|
|
|
|
|
|
|
|||||||
| Deferred |
||||||||||||
| Federal |
$ | — | $ | — | $ | — | ||||||
| State |
— | — | — | |||||||||
|
|
|
|
|
|
|
|||||||
| $ | — | $ | — | $ | — | |||||||
|
|
|
|
|
|
|
|||||||
58
Table of Contents
Deferred income taxes reflect the net tax effects of the temporary differences between the carrying amounts of assets and liabilities for financial reporting purposes and the amounts used for income tax purposes. Significant components of the Company’s deferred tax assets and liabilities are as follows:
| Deferred tax assets: |
||||
| Net operating loss carryforwards |
$ | 44,047,299 | ||
| Accrued expenses |
62,829 | |||
| Reserve for accounts receivable |
2,748,005 | |||
| Reserve for inventory return |
137,663 | |||
| Stock option and restricted stock awards |
1,383,376 | |||
| Start-up costs |
107,422 | |||
| Excess of book over tax depreciation |
1,078,584 | |||
| Investment – unconsolidated entity |
3,117,958 | |||
| Less: valuation allowance |
(52,515,797 | ) | ||
|
|
|
|||
| 167,339 | ||||
|
|
|
|||
| Deferred tax liability: |
||||
| Prepaid expenses |
97,854 | |||
| Property and equipment basis |
69,485 | |||
|
|
|
|||
| 167,339 | ||||
|
|
|
|||
| Net deferred tax asset |
$ | — | ||
|
|
|
As reflected above, we have recorded a net deferred tax asset of $0 at December 31, 2011. As required by the Accounting for Income Taxes topic in the ASC, we have evaluated whether it is more likely than not that the deferred tax assets will be realized. Based on the available evidence, we have concluded that it is more likely than not that those assets would not be realizable without the recovery and rights of ownership or salvage rights of high value shipwrecks and thus a valuation allowance has been recorded as of December 31, 2011.
The change in the valuation allowance is as follow:
| December 31, 2011 |
$ | 52,515,797 | December 31, 2010 |
$ | 45,983,926 | |||||
| December 31, 2010 |
$ | 45,983,926 | December 31, 2009 |
$ | 39,693,015 | |||||
|
|
|
|
|
|||||||
| Change in valuation allowance |
$ | 6,531,871 | Change in valuation allowance |
$ | 6,290,911 | |||||
|
|
|
|
|
Income taxes for the twelve month periods ended December 31, 2011, 2010 and 2009 differ from the amounts computed by applying the effective income tax rate of 34.0% to income taxes as a result of the following:
| 12 Month Period Ended December 31, 2011 |
12 Month Period Ended December 31, 2010 |
12 Month Period Ended December 31, 2009 |
||||||||||
| Expected benefit |
$ | (5,516,605 | ) | $ | (7,936,643 | ) | $ | (6,333,587 | ) | |||
| Effects of: |
||||||||||||
| State income taxes net of federal benefits |
(205,521 | ) | (190,311 | ) | (277,292 | ) | ||||||
| Nondeductible expenses |
17,657 | 15,606 | 17,428 | |||||||||
| Stock options and restricted stock awards |
833,749 | 627,684 | 4,584 | |||||||||
| Derivatives |
(1,693,247 | ) | 1,367,186 | — | ||||||||
| Change in valuation allowance |
6,531,871 | 6,290,911 | 6,483,692 | |||||||||
| Change in net operating loss |
3,564 | — | — | |||||||||
| Inventory capitalization |
— | — | — | |||||||||
| Change in rate estimate |
23,798 | (174,913 | ) | 105,267 | ||||||||
| Other, net |
4,734 | 480 | (92 | ) | ||||||||
|
|
|
|
|
|
|
|||||||
| Income tax provision (benefit) |
$ | — | $ | — | $ | — | ||||||
|
|
|
|
|
|
|
|||||||
During the twelve-month periods ended December 31, 2011 and 2010, we recognized certain tax benefits and (liabilities), prior to any valuation allowances, related to stock option plans in the amount of $860,721 and $(647,841), respectively. If we did not have a full valuation allowance, such benefits would be recorded as an increase in the deferred tax asset and an increase in additional paid-in capital.
59
Table of Contents
We have not recognized a material adjustment in the liability for unrecognized tax benefits and do not need to record any provision for accrued interest and penalties related to uncertain tax positions.
The earliest tax year still subject to examination by a major taxing jurisdiction is 2008.
NOTE T – MAJOR CUSTOMERS
During the fiscal year ended December 31, 2011, we had two customers who accounted for 18.4% and 71.6% of our total revenue. For the fiscal year ended December 31, 2010, we had three customers who accounted for 12.9%, 41.4% and 41.2% of our total revenue.
NOTE U – COMMITMENTS AND CONTINGENCIES
Rights to Future Revenues, If Any
We have sold the rights to share in future revenues, if any, with respect to the “Seattle” (formerly “Republic”) and “Cambridge” projects and have recorded $887,500 as Deferred Income from Revenue Participation Rights (See NOTE P). We are contingently liable to share the future revenue of these projects only if revenue is derived from these specific projects.
To date, the only income derived from these projects resulted in a one-time revenue distribution payment of $12,986 to the holders of the “Cambridge” RPC’s.
Revenue from the SS Republic shipwreck or its cargo is not subject to revenue sharing.
In addition, on May 26, 1998, we signed an agreement with a subcontractor that entitled it to receive 5% of the post finance cost proceeds from any shipwrecks in a predefined search area of the Mediterranean Sea. A shipwreck we have found, which we believe to be HMS Sussex, is located within the specified search area and we will be responsible to share future revenues, if any, from this shipwreck. On December 9, 2002, a Georgia limited liability company acquired the 5% interest from the subcontractor through a foreclosure sale (see NOTE O).
In February 2011, we entered into a project syndication deal with Galt Resources LLC (“Galt”) for which they can invest up to $10,000,000 representing rights to future revenues of any project of Galt’s choosing. See NOTE P for further detail.
Legal Proceedings
The Company may be subject to a variety of claims and suits that arise from time to time in the ordinary course of business. Management currently believes that these claims and suits will not have a material adverse impact on its financial position or its results of operations.
Other commitments and contingencies
In January 2012, we entered into a 90 day firm time party charter agreement with a Norwegian company for a vessel to assist in the excavation of the Gairsoppa and Mantola sites. The charter is to commence around the May - June 2012 time frame, but the exact time will be mutually agreed to at a later time. The charter commitment is approximately 54 million NOK (Norwegian Kroner) which currently approximates $9.7 million. A payment of USD 3,000,000 is to be remitted 14 days prior to the start of the charter.
Trends and Uncertainties
Our current 2012 business plan estimates positive cash flow from operating activities. The plan contains assumptions which include that several of our planned projects are funded through project debt-type financings, syndications or other partnership opportunities. The 2012 business plan expenses include a 90-day charter agreement which we recently executed with a company to provide a ship and equipment to conduct recovery operations on the Gairsoppa and Mantola projects (see Note U of the Consolidated Financial Statements). One or more of these projected project financing or partnership opportunities may not be realized which may require the need for additional cash. Based upon our current expectations, we believe our cash position will be sufficient to fund operating cash flows throughout the rest of 2012 taking into account our beginning cash balance, current cash flow expectations and revenues from multiple sources, including projected sales, syndicated projects and potential debt financing opportunities and the available $5 million convertible debt facility We have recently received a term sheet from Fifth Third Bank which will increase our existing term loan to $5 million through July 2013. We have experienced several years of net losses resulting in a stockholders’ deficit. Our capacity to generate net income in future periods is dependent upon our success in recovering and monetizing high-value shipwrecks, or to generate income from other projects. However, it is likely that we could monetize a significant portion of the Gairsoppa and Mantola projects in 2012 which could fund our operations for future periods. If cash flow is not sufficient to meet our projected business plan requirements, we will be required to raise additional capital or curtail expenses. While we have been successful in raising the necessary funds in the past, there can be no assurance that we can continue to do so in 2012.
60
Table of Contents
NOTE V – QUARTERLY FINANCIAL DATA – UNAUDITED
The following tables present certain unaudited consolidated quarterly financial information for each of the past eight quarters ended December 31, 2011 and 2010. This quarterly information has been prepared on the same basis as the Consolidated Financial Statements and includes all adjustments necessary to state fairly the information for the periods presented.
| Fiscal Year Ended December 31, 2011 | ||||||||||||||||
| Quarter Ending | ||||||||||||||||
| March 31 | June 30 | September 30 | December 31 | |||||||||||||
| Revenue - net |
$ | 2,094,103 | $ | 6,744,569 | $ | 5,939,873 | $ | 948,687 | ||||||||
| Gross profit |
1,920,527 | 6,692,008 | 5,842,755 | 856,959 | ||||||||||||
| Net loss |
(5,174,035 | ) | (1,930,553 | ) | (5,137,997 | ) | (3,982,723 | ) | ||||||||
| Basic and diluted net income per share |
$ | (0.09 | ) | $ | (0.07 | ) | $ | (0.07 | ) | $ | (0.05 | ) | ||||
| Fiscal Year Ended December 31, 2010 | ||||||||||||||||
| Quarter Ending | ||||||||||||||||
| March 31 | June 30 | September 30 | December 31 | |||||||||||||
| Revenue - net |
$ | 2,928,425 | $ | 4,334,708 | $ | 9,829,768 | $ | 3,907,794 | ||||||||
| Gross profit |
2,883,780 | 4,239,970 | 9,798,787 | 3,887,067 | ||||||||||||
| Net loss |
(3,118,750 | ) | (3,491,246 | ) | (1,307,313 | ) | (15,425,757 | ) | ||||||||
| Basic and diluted net income per share |
$ | (0.05 | ) | $ | (0.05 | ) | $ | (0.02 | ) | $ | (0.24 | ) | ||||
NOTE W – SUBSEQUENT EVENTS
In January 2012, we entered into a 90 day firm time party charter agreement with a Norwegian company for a vessel to assist in the excavation of the Gairsoppa and Mantola sites. The charter is to commence around the May - June 2012 time frame, but the exact time will be mutually agreed to at a later time. The charter commitment is approximately 54 million NOK (Norwegian Kroner) which currently approximates $9.7 million. A payment of USD 3,000,000 is to be remitted 14 days prior to the start of the charter.
61
Table of Contents
SCHEDULE II – VALUATION and QUALIFYING ACCOUNTS
For the Fiscal Years of 2009, 2010 and 2011
ODYSSEY MARINE EXPLORATION, INC. AND SUBSIDIARIES
| Balance at Beginning of Year |
Charged (Credited) to Expenses |
Charged (Credited) to Other Accounts |
Deductions | Balance at End of Year |
||||||||||||||||
| Deferred recovery cost reserve |
||||||||||||||||||||
| 2009 |
2,358,063 | 170,217 | — | — | 2,528,280 | |||||||||||||||
| 2010 |
2,528,280 | 28,869 | — | — | 2,557,149 | |||||||||||||||
| 2011 |
2,557,149 | — | — | — | 2,557,149 | |||||||||||||||
| Inventory reserve |
||||||||||||||||||||
| 2009 |
598,273 | — | — | 114,566 | 483,707 | |||||||||||||||
| 2010 |
483,707 | — | — | 4,248 | 479,459 | |||||||||||||||
| 2011 |
479,459 | — | — | 87,256 | 392,203 | |||||||||||||||
| Accounts receivable reserve |
||||||||||||||||||||
| 2009 |
— | — | — | — | — | |||||||||||||||
| 2010 |
— | 8,494,672 | — | — | 8,494,672 | |||||||||||||||
| 2011 |
8,494,672 | — | — | 2,104,079 | 6,390,593 | |||||||||||||||
62
Table of Contents
Pursuant to the requirements of Section 13 or 15(d) of the Securities Exchange Act of 1934, the Registrant has duly caused this Report to be signed on its behalf by the undersigned thereunder duly authorized.
| ODYSSEY MARINE EXPLORATION, INC. | ||||
| Dated: March 12, 2012 | By: | /S/ GREGORY P. STEMM | ||
| Chief Executive Officer | ||||
Pursuant to the requirements of the Securities Exchange Act of 1934, this Report has been signed by the following persons on behalf of the Registrant and in the capacities and on the dates indicated:
| SIGNATURE |
TITLE |
DATE | ||
| /S/ GREGORY P. STEMM |
Chief Executive Officer (Principal Executive Officer) | March 12, 2012 | ||
| Gregory P. Stemm | ||||
| /S/ MICHAEL J. HOLMES |
Chief Financial Officer (Principal Financial Officer) | March 12, 2012 | ||
| Michael J. Holmes | ||||
| /S/ MARK D. GORDON |
President and Chief Operating Officer | March 12, 2021 | ||
| Mark D. Gordon | ||||
| /S/ JAY A. NUDI |
Controller & Treasurer (Principal Accounting Officer) | March 12, 2012 | ||
| Jay A. Nudi | ||||
| /S/ BRADFORD B. BAKER |
Chairman of the Board | March 12, 2012 | ||
| Bradford B. Baker | ||||
| /S/ DAVID J. SAUL |
Director | March 12, 2012 | ||
| David J. Saul | ||||
| /S/ MAX H. COHEN |
Director | March 12, 2012 | ||
| Max H. Cohen | ||||
| /S/ JON D. SAWYER |
Director | March 12, 2012 | ||
| Jon D. Sawyer | ||||
63
Table of Contents
| Exhibit |
Description | |
| 3.1 | Articles of Incorporation, as amended (incorporated by reference to Exhibit 3.1 to the Company’s Annual Report on Form 10-KSB for the year ended February 28, 2001) | |
| 3.2 | Bylaws (incorporated by reference to Exhibit 3.1 to the Company’s Report on Form 8-K dated February 28, 2006) | |
| 3.3 | Certificate of Designation of Series D Convertible Preferred Stock (incorporated by reference to Exhibit 3.1 to the Company’s Report on Form 8-K dated March 13, 2006) | |
| 3.4 | Certificate of Amendment to Certificate of Designation of Series D Convertible Preferred Stock (incorporated by reference to Exhibit 3.1 to the Company’s Report on Form 8-K dated January 22, 2007) | |
| 3.5 | Certificate of Designation of Series E Convertible Preferred Stock (incorporated by reference to Exhibit 3.1 to the Company’s Report on Form 8-K dated September 14, 2007) | |
| 3.6 | Certificate of Amendment filed with the Nevada Secretary of State on June 6, 2011 (incorporated by reference to Exhibit 3.1 to the Company’s Report on Form 8-K filed June 7, 2011) | |
| 3.7 | Certificate of Designation of Series G Convertible Preferred Stock (incorporated by reference to Exhibit 3.1 to the Company’s Quarterly Report on Form 10-Q for the quarter ended September 30, 2010) | |
| 3.8 | Amendment to Certificate of Designation of Series G Convertible Preferred Stock (incorporated by reference to Exhibit 3.2 to the Company’s Quarterly Report on Form 10-Q for the quarter ended September 30, 2010) | |
| 3.9 | Certificate of Correction to Amendment to Certificate of Designation of Series G Convertible Preferred Stock (incorporated by reference to Exhibit 3.3 to the Company’s Quarterly Report on Form 10-Q for the quarter ended September 30, 2010) | |
| 3.10 | Certificate of Withdrawal of Certificate of Designation of Series E Convertible Preferred Stock (incorporated by reference to Exhibit 3.1 to the Company’s Report on Form 8-K dated July 22, 2010) | |
| 4.1 | Warrant to Purchase Series D Convertible Preferred Stock (D1) (incorporated by reference to Exhibit 10.12 to the Company’s Annual Report on Form 10-K For the year ended December 31, 2006) | |
| 4.2 | Warrant to Purchase Series D Convertible Preferred Stock (D2) (incorporated by reference to Exhibit 10.13 to the Company’s Annual Report on Form 10-K For the year ended December 31, 2006) | |
| 4.3 | Form of Warrant to Purchase Common Stock (incorporated by reference to Exhibit 4.1 to the Company’s Report on Form 8-K filed January 26, 2010) | |
| 4.4 | Reference is hereby made to Exhibit 10.19 | |
| 4.5 | Form of Warrant to Purchase Common Stock 5% Notes (incorporated by reference to Exhibit 4.2 to the Company’s Quarterly Report on Form 10-Q for the quarter ended September 30, 2010) | |
| 4.6 | Form of Warrant to Purchase Common Stock - Modification to Series G Convertible Preferred Stock (incorporated by reference to Exhibit 99.2 to the Company’s Report on Form 8-K dated April 20, 2011) | |
| 10.1 | 1997 Stock Option Plan (incorporated by reference to Exhibit 10.5 to the Company’s Annual Report on Form 10-KSB for the year ended February 28, 2001) | |
| 10.2 | Partnering Agreement Memorandum Concerning the Shipwreck of HMS Sussex, dated September 27, 2002 (incorporated by reference to Exhibit 10.9 to the Company’s Quarterly Report on Form 10-QSB For the quarter ended August 31, 2002) | |
| 10.3 | 2005 Equity Incentive Plan (incorporated by reference to Exhibit 10.14 to the Company’s Report on Form 8-K dated August 3, 2005) | |
| 10.4 | Series D Convertible Preferred Stock Purchase Agreement (incorporated by reference to Exhibit 10.11 to the Company’s Annual Report on Form 10-K for the year ended December 31, 2006) | |
| 10.5 | Series E Convertible Preferred Stock Purchase Agreement (incorporated by reference to Exhibit 10.1 to the Company’s Report on Form 8-K dated September 14, 2007) | |
| 10.6 | Revolving Credit Loan and Security Agreement with Fifth Third Bank dated February 7, 2008 (incorporated by reference to Exhibit 10.1 to the Company’s Report on Form 8-K dated February 8, 2008) | |
64
Table of Contents
| Exhibit |
Description | |
| 10.7 | Revolving Credit Note with Fifth Third Bank dated February 7, 2008 (incorporated by reference to Exhibit 10.2 to the Company’s Report on Form 8-K dated February 8, 2008) | |
| 10.8 | Loan Agreement with Fifth Third Bank dated July 11, 2008 (incorporated by reference to Exhibit 10.1 to the Company’s Report on Form 8-K dated July 17, 2008) | |
| 10.9 | Commercial Promissory Note with Fifth Third Bank dated July 11, 2008 (incorporated by reference to Exhibit 10.1 to the Company’s Report on Form 8-K dated July 17, 2008) | |
| 10.10 | Mortgage and Security Agreement with Fifth Third Bank dated July 11, 2008 (incorporated by reference to Exhibit 10.1 to the Company’s Report on Form 8-K dated July 17, 2008) | |
| 10.11 | Stock Purchase Agreement dated May 22, 2009 (incorporated by reference to Exhibit 10.1 to the Company’s Report on Form 8-K dated May 26, 2009) | |
| 10.12 | Sale of Research File Relating to Project “Enigma” (incorporated by reference to Exhibit 10.1 to the Company’s Quarterly Report on Form 10-Q For the quarter ended September 30, 2009) | |
| 10.13 | Uniform Time Charter (incorporated by reference to Exhibit 10.2 to the Company’s Quarterly Report on Form 10-Q For the quarter ended September 30, 2009) | |
| 10.14 | “Enigma” Completion Agreement (incorporated by reference to Exhibit 10.3 to the Company’s Quarterly Report on Form 10-Q For the quarter ended September 30, 2009) | |
| 10.15 | Form of Stock Purchase Agreement (incorporated by reference to Exhibit 10.1 to the Company’s Report on Form 8-K filed January 26, 2010) | |
| 10.16 | First Amendment to Revolving Credit Loan and Security Agreement with Fifth Third Bank dated April 20, 2010 (incorporated by reference to Exhibit 10.1 to the Company’s Report on Form 8-K dated April 26, 2010) | |
| 10.17 | Renewal to Revolving Credit with Fifth Third Bank dated April 20, 2010 (incorporated by reference to Exhibit 10.2 to the Company’s Report on Form 8-K dated April 26, 2010) | |
| 10.18 | Share Subscription Agreement – Dorado Ocean Resources dated April 28, 2010 (incorporated by reference to Exhibit 10.1 to the Company’s Report on Form 8-K filed May 4, 2010) | |
| 10.19 | Form of Securities Purchase Agreement 5% Notes and Warrants dated August 20, 2010 (incorporated by reference to Exhibit 10.1 to the Company’s Quarterly Report on Form 10-Q for the quarter ended September 30, 2010) | |
| 10.20 | Form of Purchase Agreement of Series G Convertible Preferred Stock dated October 6, 2011 (incorporated by reference to Exhibit 10.1 to the Company’s Quarterly Report on Form 10-Q for the quarter ended September 30, 2010) | |
| 10.21 | Shipwreck Project Agreement with Gault Resources LLC dated February 11, 2011 (incorporated by reference to Exhibit 10.26 to the Company’s Annual Report on Form 10-K For the year ended December 31, 2010) | |
| 10.22 | Second Amendment to Revolving Credit Loan and Security Agreement dated May 4, 2011 (incorporated by reference to Exhibit 10.1 to the Company’s Quarterly Report on Form 10-Q for the quarter ended March 31, 2011) | |
| 10.23 | Amendment to Real Estate Loan Agreement dated May 4, 2011 (incorporated by reference to Exhibit 10.2 to the Company’s Quarterly Report on Form 10-Q for the quarter ended March 31, 2011) | |
| 10.24 | Form of Agreement – Modification to Purchase Agreement of Series G Convertible Preferred Stock (incorporated by reference to Exhibit 99.1 to the Company’s Report on Form 8-K filed April 20, 2011) | |
| 10.25 | Form of Share Exchange Agreement between Neptune Minerals, Inc. and the stockholders of Dorado Ocean Resources Limited (incorporated by reference to Exhibit 3.1 to the Company’s Report on Form 8-K filed June 7, 2011) | |
| 10.26 | Debt Conversion Agreement between Odyssey Marine Exploration, Inc. and Neptune Minerals, Inc. (incorporated by reference to Exhibit 10.2 to the Company’s Report on Form 8-K filed June 7, 2011) | |
| 10.27 | Securities Purchase Agreement dated November 8, 2011 (incorporated by reference to Exhibit 10.1 to the Company’s Report on Form 8-K filed November 11, 2011) | |
| 10.28 | Form of Senior Convertible Note (incorporated by reference to Exhibit 10.2 to the Company’s Report on Form 8-K filed November 11, 2011) | |
| 10.29 | Warrant to Purchase Common Stock dated November 8, 2011 (incorporated by reference to Exhibit 10.3 to the Company’s Report on Form 8-K filed November 11, 2011) | |
| 10.30 | Registration Rights Agreement dated November 8, 2011 (incorporated by reference to Exhibit 10.4 to the Company’s Report on Form 8-K filed November 11, 2011) | |
65
Table of Contents
| Exhibit |
Description | |
| 21.1 | Subsidiaries of the Registrant (incorporated by reference to Exhibit 21 to the Company’s Annual Report on Form 10-K For the year ended December 31, 2005) | |
| 23.1 | Consent of Ferlita, Walsh & Gonzalez, P.A., Independent Accountants (filed herewith electronically) | |
| 31.1 | Certification of Chief Executive Officer pursuant to Section 302 of the Sarbanes-Oxley Act of 2002 (filed herewith electronically) | |
| 31.2 | Certification of Chief Financial Officer pursuant to Section 302 of the Sarbanes-Oxley Act of 2002 (filed herewith electronically) | |
| 32.1 | Certification of Chief Executive Officer pursuant to 18 U.S.C. Section 1350 (filed herewith electronically) | |
| 32.2 | Certification of Chief Financial Officer pursuant to 18 U.S.C. Section 1350 (filed herewith electronically) | |
| 101.1 | XBRL Interactive Data File | |
66