Attached files
| file | filename |
|---|---|
| EX-23.1 - EX-23.1 - Elevance Renewable Sciences, Inc. | d231495dex231.htm |
Table of Contents
As filed with the Securities and Exchange Commission on March 9, 2012
No. 333-176933
UNITED STATES SECURITIES AND EXCHANGE COMMISSION
Washington, D.C. 20549
AMENDMENT NO. 3
TO
FORM S-1
REGISTRATION STATEMENT
UNDER
THE SECURITIES ACT OF 1933
Elevance Renewable Sciences, Inc.
(Exact name of registrant as specified in its charter)
| Delaware | 2860 | 26-1340859 | ||
| (State or other jurisdiction of incorporation or organization) |
(Primary Standard Industrial Classification Code Number) |
(I.R.S. Employer Identification No.) |
2501 Davey Road
Woodridge, Illinois 60517
(866) 625-7103
(Address, including zip code, and telephone number, including area code, of registrant’s principal executive offices)
K’Lynne Johnson
Chief Executive Officer
Elevance Renewable Sciences, Inc.
2501 W. Davey Road
Woodridge, Illinois 60440
(866) 625-7103
(Name, address, including zip code, and telephone number, including area code, of agent for service)
Copies of all communications, including communications sent to agent for service, should be sent to:
| R. Henry Kleeman Christopher P. Bennett Kirkland & Ellis LLP 300 North LaSalle Chicago, Illinois 60654 (312) 862-2000 |
Richard D. Truesdell, Jr. Davis Polk & Wardwell LLP 450 Lexington Avenue New York, New York 10017 (212) 450-4000 |
Approximate date of commencement of proposed sale to the public: As soon as practicable after this Registration Statement becomes effective.
If any of the securities being registered on this Form are to be offered on a delayed or continuous basis pursuant to Rule 415 under the Securities Act, check the following box. ¨
If this Form is filed to register additional securities for an offering pursuant to Rule 462(b) under the Securities Act, please check the following box and list the Securities Act registration statement number of the earlier effective registration statement for the same offering. ¨
If this Form is a post-effective amendment filed pursuant to Rule 462(c) under the Securities Act, check the following box and list the Securities Act registration statement number of the earlier effective registration statement for the same offering. ¨
If this Form is a post-effective amendment filed pursuant to Rule 462(d) under the Securities Act, check the following box and list the Securities Act registration statement number of the earlier effective registration statement for the same offering. ¨
Indicate by check mark whether the registrant is a large accelerated filer, an accelerated filer, a non-accelerated filer, or a smaller reporting company. See the definitions of “large accelerated filer,” “accelerated filer” and “smaller reporting company” in Rule 12b-2 of the Exchange Act (Check one):
| Large accelerated filer |
¨ |
Accelerated filer | ¨ | |||||
| Non-accelerated filer |
þ |
(Do not check if a smaller reporting company) | Smaller reporting company | ¨ |
CALCULATION OF REGISTRATION FEE
|
| ||||
| Title of Each Class of Securities to be Registered | Proposed Maximum Aggregate Offering Price(1)(2) |
Amount of Registration Fee(2)(3) | ||
| Common Stock, $0.0001 par value per share |
$100,000,000 | $11,610 | ||
|
| ||||
|
| ||||
| (1) | Includes the offering price of shares of common stock that may be sold if the over-allotment option granted by us to the underwriters is exercised. |
| (2) | Estimated solely for the purpose of calculating the registration fee pursuant to Rule 457(o) under the Securities Act. |
| (3) | Previously paid. |
The registrant hereby amends this Registration Statement on such date or dates as may be necessary to delay its effective date until the registrant shall file a further amendment which specifically states that this Registration Statement shall thereafter become effective in accordance with Section 8(a) of the Securities Act of 1933 or until this Registration Statement shall become effective on such date as the Commission, acting pursuant to said Section 8(a), may determine.
Table of Contents
The information in this prospectus is not complete and may be changed. We may not sell these securities until the registration statement filed with the Securities and Exchange Commission is effective. This prospectus is not an offer to sell these securities and we are not soliciting offers to buy these securities in any state where the offer and sale is not permitted.
PROSPECTUS (Subject to completion)
Issued March 9, 2012
Shares

COMMON STOCK
Elevance Renewable Sciences, Inc. is offering shares of its common stock. This is our initial public offering and no public market exists for our shares. We anticipate that the initial public offering price will be between $ and $ per share.
We have applied for listing of our common stock on The NASDAQ Global Market under the symbol “ERSI.”
Investing in our common stock involves risks. See “Risk Factors” beginning on page 11.
PRICE $ A SHARE
| Price to |
Underwriting and |
Proceeds to Elevance, | ||||
| Per Share |
$ | $ | $ | |||
| Total |
$ | $ | $ |
We have granted the underwriters a 30-day option to purchase up to additional shares of common stock to cover over-allotments.
The Securities and Exchange Commission and state securities regulators have not approved or disapproved these securities, or determined if this prospectus is truthful or complete. Any representation to the contrary is a criminal offense.
The underwriters expect to deliver the shares on or about , 2012.
| MORGAN STANLEY | J.P. MORGAN | JEFFERIES |
| PIPER JAFFRAY | RAYMOND JAMES |
, 2012
Table of Contents
We and the underwriters have not authorized anyone to provide any information other than that contained in this prospectus or in any free writing prospectus prepared by or on behalf of us or to which we have referred you. We take no responsibility for, and can provide no assurance as to the reliability of, any other information that others may give you. We are offering to sell, and seeking offers to buy, shares of our common stock only in jurisdictions where such offers and sales are permitted.
For investors outside the United States: We have not, and the underwriters have not, done anything that would permit this offering or possession or distribution of this prospectus in any jurisdiction where action for that purpose is required, other than in the United States. Persons outside the United States who come into possession of this prospectus must inform themselves about, and observe any restrictions relating to, the offering of the shares of common stock and the distribution of this prospectus outside of the United States. The information in this prospectus or a free writing prospectus is accurate as of the date of this prospectus or the applicable free writing prospectus, as the case may be, or as of the date or dates that are specified in those documents. Our business, financial condition, results of operations and prospects may have changed since those dates. We will update this prospectus as required by law.
Until , 2012 (25 days after the commencement of this offering), all dealers that effect transactions in these securities, whether or not participating in this offering, may be required to deliver a prospectus. This delivery requirement is in addition to the dealer’s obligation to deliver a prospectus when acting as an underwriter and with respect to unsold allotments or subscriptions.
i
Table of Contents
This prospectus includes our trademarks and service marks such as “Elevance,” “Elevance Renewable Sciences” and “NatureWax” which are protected under applicable intellectual property laws and are the property of Elevance Renewable Sciences, Inc. or its subsidiaries. This prospectus also contains trademarks, service marks, trade names and copyrights of other companies, which are the property of their respective owners. Solely for convenience, trademarks and trade names referred to in this prospectus may appear without the ® or ™ symbols, but such references are not intended to indicate, in any way, that we will not assert, to the fullest extent under applicable law, our rights or the right of the applicable licensor to these trademarks and trade names.
ii
Table of Contents
This summary highlights information contained elsewhere in this prospectus. This summary does not contain all of the information that you should consider in making your investment decision. You should read this summary together with the entire prospectus, including the more detailed information regarding our company, the common stock being sold in this offering and our consolidated financial statements and the related notes thereto appearing elsewhere in this prospectus. You should carefully consider, among other things, our consolidated financial statements and the related notes thereto included elsewhere in this prospectus and the matters discussed in the sections entitled “Risk Factors” and “Management’s Discussion and Analysis of Financial Condition and Results of Operations” in this prospectus before deciding to invest in our common stock. Some of the statements in this summary constitute forward-looking statements, with respect to which you should review the section of this prospectus entitled “Forward-Looking Statements.” Except where the context otherwise requires or where otherwise indicated, the terms “ERS,” “we,” “us,” “our,” “our company” and “our business” refer to Elevance Renewable Sciences, Inc., together with its consolidated subsidiaries as a combined entity.
ELEVANCE RENEWABLE SCIENCES, INC.
Company Overview
We produce high performance specialty chemicals and intermediate chemicals from renewable natural oils. The specialty chemicals that we currently produce and intend to produce address a potential market size that we estimate to be $176 billion. We produce these chemicals using our proprietary, low-cost, capital efficient production process, which utilizes Nobel Prize-winning innovations in metathesis catalysis. Our process uses a highly efficient and selective metathesis catalyst to break down the complex molecules found in natural oils and recombine the fragments to produce high value chemicals. We can produce these chemicals at lower cost and with lower capital investment than conventional processes positioning us to deliver attractive returns on capital. We are building what we believe will be the world’s largest integrated biorefinery in Gresik, Indonesia, as part of a 50/50 joint venture with Wilmar International Limited, the largest global processor and merchandiser of palm, palm kernel and coconut oils. We plan to begin commercial operations at this facility by the second quarter of 2012. We are also repurposing an existing facility in Natchez, Mississippi into an integrated biorefinery. We expect construction of our first two facilities to cost $215 to $535 per metric tonne ($0.10 to $0.25 per pound) of annual production capacity compared to $920 to $2,300 per metric tonne ($0.42 to $1.04 per pound) of annual production capacity for conventional facilities. We have established strategic partnerships with market leaders to accelerate the commercialization and rapid deployment of our technology.
Our specialty chemicals have unique and desirable functional attributes previously unavailable in the marketplace. We believe these products will be key performance ingredients and building blocks used in large end markets including detergents, lubricants, personal care products, coatings and plastics. Our intermediate chemicals, namely olefins and oleochemicals, can directly replace critical molecules in large, attractive markets. We expect that prevailing market dynamics, such as the desire for new and increasingly demanding performance characteristics, changing regulatory requirements and structural supply shortages will support rapid adoption of our specialty chemicals and market penetration of our intermediate chemicals. We are in discussions with existing partners and potential new customers for long-term purchasing or offtake agreements for the entirety of our projected 2013 production.
1
Table of Contents
Our Manufacturing Plan
We expect to have three world-scale facilities across three continents by the end of 2014, with combined annual production capacity of approximately one million metric tonnes (2.2 billion pounds). We have entered into the 50/50 joint venture (the “Wilmar JV”) with a subsidiary of Wilmar International Limited (“Wilmar”) to build an integrated biorefinery in Gresik, Indonesia (the “Indonesia facility”), our first world-scale biorefinery. The Indonesia facility, at a total construction cost of approximately $40 million, is fully funded and currently under construction. The Indonesia facility will have an annual production capacity of 185,000 metric tonnes (400 million pounds), with an option to expand the annual production capacity to 370,000 metric tonnes (810 million pounds). We plan to be operating a 280,000 metric tonne (610 million pound) biorefinery in Natchez, Mississippi (the “Mississippi facility”) in the second half of 2013 at a site we have acquired. By the end of 2014, we expect to be operating an additional world-scale facility in South America. We plan to rapidly deploy our technology using a combination of modular facility design and repurposing of or integration into existing industrial sites. All of our products are currently manufactured using tolling facilities, which are facilities owned and operated by third parties with whom we contract for such production. We have produced our chemicals at commercial scale through multiple production campaigns ranging in size from 23 metric tonnes (50,000 pounds) to 450 metric tonnes (one million pounds), including two production campaigns that utilized our proprietary biorefinery process, the first of which was completed in November 2010. Our use of tolling facilities has enabled us to validate the target cost of production for our biorefineries because these tolling facilities are similar in size and have similar process conditions as the commercial scale facilities we are designing and constructing. We plan to continue to use tolling facilities to a limited extent after we complete construction of our biorefineries.
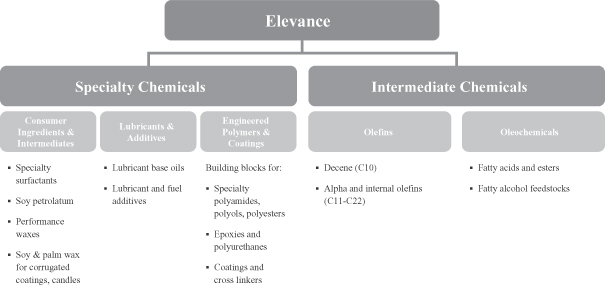
Our Product Portfolio
Our products will include both specialty chemicals and intermediate chemicals. Our novel di-functional specialty chemicals enable the development of products that are both innovative and high value. Our customers are encouraged by our ability to produce specialty chemicals that allow them to manufacture products with enhanced functional attributes that can be sold at competitive prices. Our intermediate chemicals, which include olefins and oleochemicals, will be direct replacements for both olefins and oleochemicals produced using conventional processes. The following chart sets forth our intended product portfolio.
2
Table of Contents
To date, our revenues have been primarily derived from product sales in the performance waxes and candles markets and in the personal care markets, which utilize our specialty chemicals. The sales into these markets constituted approximately 91% and 96% of our revenue in the nine months ended September 30, 2011 and 2010, respectively.
Our Feedstocks
Our primary feedstocks will include palm, soy and rapeseed oils, all of which we have used in our pilot plant to produce an array of specialty chemicals and intermediate chemicals. These natural oils are available in liquid form in industrial quantities from a variety of geographic regions. These characteristics allow for low-cost transportation and storage compared to other renewable feedstocks such as industrial sugars, biomass and waste. Our ability to adjust our inputs in real time allows us to take advantage of changes in feedstock prices and product demand. We have used multiple natural oils to produce our products to date. Palm oil was used in commercial-scale toll production runs mirroring our biorefinery process. Soy oil has been used in multiple toll production runs using our metathesis process to produce material for cosmetics, polymer modification and industrial applications. Canola and mustard oils have been used to produce products in our pilot plant. We have also tested other oils at lab scale including algae, camelina, pennycress, jatropha and waste oils.
Our Partnerships
Our collaborative business model is designed to accelerate the commercialization and rapid deployment of our technology. We have established strategic partnerships with market leaders in the specialty chemical and intermediate chemical value chains, including: Cargill, Incorporated, one of the world’s largest agribusinesses (“Cargill”); Clariant International AG, a leading global specialty chemicals company (“Clariant”); Dow Corning Corporation, a global leader in silicone-based technology and innovation (“Dow Corning”); Royal DSM N.V., a global science-based company (“DSM”); Stepan Company, a leading producer of surfactants (“Stepan”); and Wilmar. These partners provide us with sales and marketing expertise, established distribution channels, technical know-how, product and application development expertise and manufacturing infrastructure.
Our Industry
We develop applications that will go into several large segments of the specialty chemical industry. Our primary target markets in the specialty chemical industry include surfactants, lubricants and additives and polymers. In addition, our manufacturing platform will produce two key categories of intermediate chemicals: olefins and oleochemicals.
Specialty Chemicals
We believe the size of the global specialty chemical industry was approximately $706 billion in 2010. Specialty chemicals are sold based on the additional value their unique and tailored performance characteristics deliver versus intermediate chemicals or commodity chemicals, which must only meet general specifications. As a result, demand for specialty chemicals is generally driven by customer-specific requirements to enable product performance.
A number of key challenges currently impact the specialty chemical industry, including the following: (1) demand for improved performance characteristics driven by evolving consumer preferences or changing regulatory requirements; (2) limited availability of certain critical feedstocks and intermediate chemicals; (3) feedstock price levels and volatility; and (4) increasing demand for products made from non-toxic, environmentally friendly and renewable sources.
Intermediate Chemicals
As the building blocks for most of the finished products in the industry, intermediate chemicals have higher margins per unit than commodity chemical feedstocks. We estimate that the total size of the oleochemical market
3
Table of Contents
was $38 billion in 2010. We estimate that the total size of the intermediate olefin market was $7 billion in 2008. This intermediate olefin market, on which we focus our olefin production, consists of higher value olefins, specifically linear alpha olefins (“LAOs”) or linear internal olefins (“LIOs”) with ten or more carbon atoms (“intermediate olefins”).
A number of key challenges are affecting the market for intermediate chemicals, including the following: (1) increasing cost, volatility and scarcity of certain key feedstocks leading to uncertain profitability; (2) limited flexibility to produce higher value chemicals without also producing other lower value chemicals given that conventional processes produce a largely fixed product mix; (3) need for new regional supply to meet increasing emerging market demand; and (4) increasing demand for products made from renewable sources.
Our Solution
Our proprietary process technology and the catalyst that we exclusively license and source from Materia, Inc., a leading- edge catalyst technology company (“Materia”) enable us to produce both unique specialty chemicals with desirable functional attributes previously unavailable in the marketplace, as well as key intermediate chemicals that are in limited supply. For more information regarding our license with Materia, including a discussion of its duration, see “Business—Intellectual Property.”
We combine the performance attributes of both oleochemicals and olefins into di-functional specialty chemicals that we believe cannot be economically produced by either the oleochemical or olefin industry, providing our customers new solutions to address their performance challenges. We believe we will be able to produce these specialty chemicals economically through our biorefineries and to sell them at competitive prices. We expect our product characteristics to drive rapid adoption by customers looking for solutions to their product performance needs.
Our intermediate chemicals are produced from renewable feedstocks and are direct replacements for olefins and oleochemicals produced using conventional processes for which demand is growing and supply is constrained. Our ability to use a wide variety of natural oil feedstocks and to produce our intermediate chemicals in several regions can help our customers mitigate input cost volatility and reduce supply concerns.
Our Competitive Strengths
Our business model benefits from a number of competitive strengths, including the following:
| • | Proprietary technology. Our proprietary metathesis technology platform utilizes Nobel Prize-winning innovations in metathesis catalysis. Our platform enables us to produce high-value specialty chemicals and direct replacement intermediate chemicals that are cost-advantaged compared to those available from conventional production methods. |
| • | High performance products. Our specialty chemicals have unique and desirable functional attributes previously unavailable in the marketplace. We are currently commercializing products such as fuel additives and personal care products that have enhanced performance features. In addition, we have demonstrated our ability to secure a premium price for certain high performance specialty chemicals. |
| • | Low capital requirements. Our biorefinery design requires less capital per unit of production than conventional technologies because of the following characteristics: (1) fewer major process steps; (2) lower operating temperatures and pressures; (3) limited production of hazardous and toxic by-products; and (4) the ability to integrate our process into existing industrial sites. |
| • | Low operating costs. Conversion using our process achieves lower unit-level production costs than alternative routes to comparable products because of the following characteristics: (1) more direct process, resulting in fewer conversion steps; (2) highly efficient and selective catalyst; (3) feedstock flexibility; and (4) lower operating temperatures and pressures, resulting in greater energy efficiency. |
4
Table of Contents
| • | Established partnerships with industry leaders. We have developed strategic partnerships which provide us with sales and marketing expertise, established distribution channels, technical know-how, product and application development expertise and manufacturing infrastructure. |
| • | Feedstock flexibility. Our primary feedstocks will include palm, soy and rapeseed oils, all of which we have used in our pilot plant to produce an array of specialty chemicals and intermediate chemicals. Our ability to adjust our inputs in real time allows us to take advantage of changes in feedstock prices and product demand. |
| • | Large and well-established end markets. Our technology enables us to target a wide variety of end markets. We currently estimate our addressable specialty chemical markets represent $176 billion in annual commercial opportunity. |
| • | Rapid deployment of commercial production. We can rapidly deploy our technology because of: (1) our ability to repurpose or integrate into existing industrial sites; (2) our low capital requirement per unit of capacity; (3) existing and available large markets for our products; and (4) our relatively short engineering, procurement and construction cycle. |
Our Strategy
Our goal is to become the global market leader in the design and production of specialty chemicals. The key elements for accomplishing our goal are:
| • | Complete rapid deployment of multiple world-scale facilities. We expect to have three world-scale facilities across three continents by the end of 2014, with combined annual production capacity of approximately one million metric tonnes (2.2 billion pounds). |
| • | Develop new and existing market partnerships to accelerate growth and maximize profitability. To accelerate growth, we plan to continue cultivating strategic partnerships with industry leaders. These partners provide us with sales and marketing expertise, established distribution channels, technical know-how, product and application development expertise and manufacturing infrastructure. |
| • | Invest in research and development to enhance product performance characteristics. We intend to leverage our extensive intellectual property portfolio to target unique solutions for customers demanding higher performance chemicals than those offered today. We plan to continue to develop new specialty chemicals with increased functional attributes, such as highly concentrated detergents and lubricants that enable better fuel economy. |
| • | Leverage feedstock flexibility to maximize margins. We continuously monitor the costs of various feedstock alternatives to take advantage of their imperfect price correlations to each other and to our selling prices. |
Summary Risk Factors
We are subject to a number of risks, including risks that may prevent us from achieving our business objectives or may adversely affect our business, financial condition, results of operations, cash flows and prospects. You should carefully consider these risks, including those highlighted in the section entitled “Risk Factors,” before investing in our common stock. Risks relating to our business include, among others, the following:
| • | we have a limited operating history and have incurred significant losses to date, anticipate continuing to incur losses for a period of time, and may never achieve or sustain profitability; |
| • | we may be unable to continue our business or may be prevented from operating our business as it is currently conducted if we are unsuccessful in defending against any claims by competitors or others that we or Materia are infringing upon their intellectual property rights; |
5
Table of Contents
| • | if either the Indonesia facility or the Mississippi facility is not completed in a timely manner for any reason, our ability to produce specialty chemicals and intermediate chemicals could be materially adversely affected; |
| • | we lack direct experience operating world-scale commercial biorefineries, and may encounter substantial difficulties operating such biorefineries or expanding our business; |
| • | we may be unable to produce specialty chemicals and intermediate chemicals that meet our customers’ needs or specifications; |
| • | our specialty chemicals may not be accepted by the market; and |
| • | we are dependent on our partners, and our failure to successfully manage these relationships could delay or prevent us from developing and commercializing many of our products and achieving or sustaining profitability. |
Corporate Information
We were incorporated in the State of Delaware on October 17, 2007, to pursue work started in 2004 in a collaboration between Cargill and Materia. Our corporate headquarters are located at 2501 Davey Road, Woodridge, Illinois 60517. Our telephone number is (866) 625-7103. Our website address is www.elevance.com. The information on our website is not deemed, and you should not consider such information, to be part of this prospectus.
6
Table of Contents
THE OFFERING
| Common stock offered |
shares. | |
| Common stock to be outstanding immediately after this offering |
shares. | |
| Option to purchase additional shares |
shares. | |
| Use of proceeds |
We estimate that the net proceeds from this offering will be approximately $ million, or approximately $ million if the underwriters exercise their over-allotment option in full, assuming an initial public offering price of $ per share, which is the midpoint of the price range set forth on the cover of this prospectus, after deducting underwriting discounts and commissions and estimated offering expenses payable by us. We expect to use substantially all of the net proceeds from this offering for general corporate purposes, including funding capital expenditures, research and development, working capital, product development and operating expenses. For additional information, see “Use of Proceeds.” | |
| Risk factors |
Investing in shares of our common stock involves a high degree of risk. For additional information, see “Risk Factors” beginning on page 10 of this prospectus for a discussion of factors you should carefully consider before investing in shares of our common stock. | |
| NASDAQ Global Market symbol |
“ERSI” | |
Unless otherwise indicated, all information in this prospectus relating to the number of shares of common stock to be outstanding immediately after this offering:
| • | gives effect to the -for- split of our common stock, which was effective , 2012 (the “ -for- stock split”); |
| • | gives effect to the issuance of shares of our common stock upon the automatic conversion of all of our outstanding shares of preferred stock upon consummation of this offering pursuant to the terms of our Fourth Amended and Restated Certificate of Incorporation (our “certificate of incorporation”); |
| • | gives effect to the issuance of shares of our common stock to holders of our outstanding preferred stock as a dividend payment pursuant to our certificate of incorporation; |
| • | gives effect to the issuance of shares of our common stock upon the conversion of each outstanding warrant to purchase shares of our preferred stock into a warrant to purchase shares of our common stock pursuant to the terms of such existing warrant and the exercise thereof (together with the three bullets above, the “IPO Share Adjustments”); |
| • | gives effect to the issuance of shares of our common stock in this offering; |
| • | excludes (1) 2,304,484 shares of common stock that will be issuable upon the exercise of outstanding stock options as of September 30, 2011 at a weighted average exercise price of $2.14 per share; and (2) an aggregate of shares of our common stock reserved for future grants under the 2012 |
7
Table of Contents
| Incentive Compensation Plan (the “2012 Plan”) that we intend to adopt in connection with this offering, which will amend and restate our 2007 Equity Incentive Plan (the “2007 Plan”); |
| • | assumes no exercise by the underwriters of their over-allotment option to purchase up to additional shares of our common stock from us; and |
| • | assumes the effectiveness of our Fifth Amended and Restated Certificate of Incorporation (the “amended and restated certificate of incorporation”) and amended and restated bylaws, which we will adopt in connection with the consummation of this offering. |
8
Table of Contents
SUMMARY HISTORICAL CONSOLIDATED FINANCIAL DATA
The following tables summarize our financial data as of the dates and for the periods indicated. We have derived the summary consolidated financial data for the fiscal years ended December 31, 2008, 2009 and 2010 from our audited consolidated financial statements for such fiscal years included elsewhere in this prospectus. We have derived the summary consolidated financial data as of September 30, 2011 and for the nine months ended September 30, 2010 and 2011 from our unaudited condensed consolidated financial statements included elsewhere in this prospectus. The summary historical and consolidated data presented below should be read in conjunction with the sections entitled “Risk Factors,” “Selected Historical Consolidated Financial Data,” “Management’s Discussion and Analysis of Financial Condition and Results of Operations” and the consolidated financial statements and the related notes thereto and other financial data included elsewhere in this prospectus. Our unaudited condensed consolidated financial statements have been prepared on the same basis as our audited combined financial statements, and in our opinion, include all adjustments, consisting of normal and recurring adjustments that we consider necessary for a fair presentation of our financial position and results of operations for such periods. Operating results for the nine months ended September 30, 2010 and 2011 are not necessarily indicative of results for a full year or for any other period.
| Years Ended December 31, | For the Nine Months Ended September 30, |
|||||||||||||||||||
| 2008 | 2009 | 2010 | 2010 | 2011 | ||||||||||||||||
| (unaudited) | ||||||||||||||||||||
| (in thousands, except per share data) | ||||||||||||||||||||
| Statement of Operations Data: |
||||||||||||||||||||
| Product sales |
$ | 18,913 | $ | 12,186 | $ | 20,227 | $ | 13,303 | $ | 16,319 | ||||||||||
| Other revenue |
— | — | — | — | 903 | |||||||||||||||
| Grants |
— | — | 961 | 732 | 604 | |||||||||||||||
|
|
|
|
|
|
|
|
|
|
|
|||||||||||
| Total revenues |
18,913 | 12,186 | 21,188 | 14,035 | 17,826 | |||||||||||||||
| Operating expenses: |
||||||||||||||||||||
| Cost of product sales |
14,425 | 11,860 | 17,824 | 11,603 | 16,751 | |||||||||||||||
| Cost of other revenue |
— | — | — | — | 628 | |||||||||||||||
| Selling, general and administrative |
8,086 | 8,168 | 11,356 | 8,457 | 15,260 | |||||||||||||||
| Research and development |
5,539 | 7,760 | 8,896 | 6,728 | 6,383 | |||||||||||||||
| Intangible asset amortization |
1,506 | 1,506 | 1,506 | 1,129 | 1,129 | |||||||||||||||
|
|
|
|
|
|
|
|
|
|
|
|||||||||||
| Total operating expenses |
29,556 | 29,294 | 39,582 | 27,917 | 40,151 | |||||||||||||||
|
|
|
|
|
|
|
|
|
|
|
|||||||||||
| Loss from operations |
(10,643 | ) | (17,108 | ) | (18,394 | ) | (13,882 | ) | (22,325 | ) | ||||||||||
| Gain (loss) on change in fair value of warrants |
1,787 | 652 | (4,506 | ) | (3,172 | ) | (98,823 | ) | ||||||||||||
| Interest expense |
— | (437 | ) | (4,415 | ) | (3,289 | ) | — | ||||||||||||
| Other income, net |
636 | 56 | 14 | 4 | 21 | |||||||||||||||
|
|
|
|
|
|
|
|
|
|
|
|||||||||||
| Loss before income taxes |
(8,220 | ) | (16,837 | ) | (27,301 | ) | (20,339 | ) | (121,127 | ) | ||||||||||
| Income taxes |
— | — | — | — | — | |||||||||||||||
|
|
|
|
|
|
|
|
|
|
|
|||||||||||
| Net loss |
(8,220 | ) | (16,837 | ) | (27,301 | ) | (20,339 | ) | (121,127 | ) | ||||||||||
| Less net loss attributable to the noncontrolling interest |
— | — | 10 | 1 | 82 | |||||||||||||||
|
|
|
|
|
|
|
|
|
|
|
|||||||||||
| Net loss attributable to the company |
(8,220 | ) | (16,837 | ) | (27,291 | ) | (20,338 | ) | (121,045 | ) | ||||||||||
| Less accretion on Series A and B preferred stock and cumulative dividends on Series B, C and D preferred stock |
(6,689 | ) | (6,876 | ) | (6,349 | ) | (4,409 | ) | (10,731 | ) | ||||||||||
|
|
|
|
|
|
|
|
|
|
|
|||||||||||
| Net loss available to our common shareholders |
$ | (14,909 | ) | $ | (23,713 | ) | $ | (33,640 | ) | $ | (24,747 | ) | $ | (131,776 | ) | |||||
|
|
|
|
|
|
|
|
|
|
|
|||||||||||
| Net loss per share attributable to our common shareholders, basic and diluted |
$ | (99.39 | ) | $ | (33.08 | ) | $ | (14.64 | ) | $ | (10.83 | ) | $ | (54.96 | ) | |||||
|
|
|
|
|
|
|
|
|
|
|
|||||||||||
| Pro forma net loss per share attributable to our common shareholders(1) |
||||||||||||||||||||
|
|
|
|
|
|||||||||||||||||
| (1) | Gives effect to the IPO Share Adjustments, but not this offering. |
9
Table of Contents
| As of September 30, 2011 | ||||||||
| Actual | Pro Forma(1) |
Pro
Forma As Adjusted(2) | ||||||
| (unaudited) | ||||||||
| (in thousands) | ||||||||
| Balance Sheet Data: |
||||||||
| Cash, cash equivalents and short-term investments |
$ | 90,402 | ||||||
| Working capital |
2,598 | |||||||
| Total assets |
146,197 | |||||||
| Total debt |
107 | |||||||
| Preferred stock |
215,335 | |||||||
| Total company shareholders’ deficit |
(200,483 | ) | ||||||
| (1) | Gives effect to the IPO Share Adjustments, but not this offering. |
| (2) | Gives effect to the IPO Share Adjustments and this offering. |
10
Table of Contents
Investing in our common stock involves a high degree of risk. You should carefully consider the risks described below, together with the financial and other information contained in this prospectus, before you decide to purchase shares of our common stock. If any of the following risks actually occurs, our business, financial condition, results of operations, cash flow and prospects could be materially and adversely affected. As a result, the trading price of our common stock could decline and you could lose all or part of your investment in our common stock.
Risks Related to Our Business
We have a limited operating history and have incurred significant losses to date, anticipate continuing to incur losses for a period of time, and may never achieve or sustain profitability.
We are an early stage company with a limited operating history and have incurred substantial net losses since our inception, including net losses attributable to our common stockholders of $14.9 million, $23.7 million and $33.6 million for the years ended December 31, 2008, 2009 and 2010, respectively. We expect these losses to continue for a period of time as we continue to invest in research and development, expand our manufacturing capacity and build out our product pipeline. As of September 30, 2011, we had an accumulated deficit of $200.5 million. For the foreseeable future, we expect to incur additional costs and expenses related to the continued development and expansion of our business, including: research and development; construction and operation of the Indonesia facility and the Mississippi facility; and management of operations as a public company. As a result, our annual operating losses will likely increase in 2011. Any assessments you make about our current business and predictions you make about our future success or viability may not be as accurate as they would be if we had a longer operating history.
We, along with our development and commercialization partners, will need to be successful developing additional products, producing them in commercial quantities cost effectively and marketing and selling them profitably. We and our partners will also need to obtain any necessary regulatory approvals. If we fail to become profitable, or if we are unable to fund our continuing losses, we may be unable to continue our business operations. There can be no assurance that we will ever achieve or sustain profitability.
We have generated limited revenues from the sale of our products and we face significant challenges to developing our business.
To date, we have had only modest sales of several products and have not commenced operations of our biorefineries. If we are not successful in constructing and operating our biorefineries or otherwise increasing our manufacturing capacity, developing products that meet our customers’ specifications and further advancing our existing commercial arrangements with strategic partners, we will be unable to generate meaningful revenues from our products. Consequently, we are subject to the substantial risk of failure facing businesses seeking to develop products based on a new technology. Certain factors that could, alone or in combination, prevent us from successfully commercializing our products include:
| • | our ability to defend against any claims by competitors or others that we or Materia are infringing upon their intellectual property rights; |
| • | the completion of construction, and successful operation of, the Indonesia facility and the Mississippi facility; |
| • | our ability to develop, commercialize and manufacture new specialty chemicals that meet customer needs and specifications on a cost-effective basis, in a timely manner and in significant volumes; |
| • | our ability to manage our growth; |
11
Table of Contents
| • | our ability to gain market acceptance of our specialty chemicals and to establish and maintain relationships with our customers; |
| • | our ability to reliably secure sufficient volumes of feedstock at commercially viable prices; |
| • | actions of direct or indirect competitors that may seek to enter (or preserve their position in) the markets in which we expect to compete or that may seek to impose or maintain barriers to one or more of those markets; |
| • | our ability to adequately protect our proprietary technologies, including our ability to enforce our intellectual property rights around the world; |
| • | our ability to maintain our exclusive license with Materia; |
| • | our dependence on our feedstock, manufacturing and commercialization partners; |
| • | our reliance on our toll manufacturers; |
| • | our ability to retain key personnel; |
| • | our ability to secure and maintain necessary regulatory approvals for the production, distribution and sale of our products and to comply with applicable laws and regulations; and |
| • | public concerns about the legal, environmental and social ramifications of the use of our feedstocks in light of concerns regarding the diversion of resources from food production and the deforestation of tropical rainforests. |
We may be unable to continue our business or may be prevented from operating our business as it is currently conducted if we are unsuccessful in defending against any claims by competitors or others that we or Materia are infringing upon their intellectual property rights.
The specialty chemical markets in which we operate are subject to litigation regarding patents and other intellectual property rights. In addition, many companies in intellectual property-dependent industries, including the chemical industry, have employed intellectual property litigation as a means to gain an advantage over their competitors. As a result, we may be required to defend against claims of intellectual property infringement that may be asserted by our competitors against us or Materia, from whom we license our proprietary catalyst. If the outcome of any such litigation is adverse to us or Materia, it may affect our ability to compete effectively or may prevent us from operating our business as it is currently conducted.
Our involvement in litigation, interferences, opposition proceedings or other intellectual property proceedings inside and outside of the United States could divert our management from focusing on business operations or cause us to spend significant amounts of money. Such involvement in litigation has no guarantee of success. Any current and potential intellectual property litigation also could force us to do one or more of the following:
| • | stop selling, incorporating, manufacturing or using our products that use the intellectual property that is the subject of such litigation, including our proprietary licensed catalyst; |
| • | obtain a license to sell or use the relevant intellectual property from any third party asserting its intellectual property rights (including Evonik Degussa GmbH (“Evonik Degussa”) (as discussed below in “—If Materia is unsuccessful in defending against a lawsuit filed by Evonik Degussa or if our related license expires prior to the resolution of such litigation in favor of Materia, we may experience a material adverse effect on our business, financial condition or results of operations.”), which license may not be available on commercially reasonable terms, or at all; |
| • | redesign those products or processes that use any allegedly infringing or misappropriated catalyst or technology, which may result in significant cost or delay to us, or which redesign could be technically infeasible; or |
12
Table of Contents
| • | pay damages, including the possibility of treble damages in a patent case, if a court finds us to have willfully infringed certain intellectual property rights. |
We are aware of a number of patents and patent applications relating to aspects of our technologies or those which we license from Materia filed by, and issued to, third parties, including, but not limited to Evonik Degussa. We cannot assure you that we or Materia will ultimately prevail if any third parties assert intellectual property claims against us or Materia, as applicable, or in the current patent infringement lawsuit recently filed by Evonik Degussa discussed above. If we or Materia do not prevail, such litigation could have a material adverse effect on our business, financial condition or results of operations.
If either the Indonesia facility or the Mississippi facility is not completed in a timely manner for any reason, our ability to produce specialty chemicals and intermediate chemicals could be materially adversely affected.
Our business plan contemplates bringing significant commercial capacity online over the next few years. We will need to complete construction of the Indonesia facility and the Mississippi facility, in a timely manner in order to commercialize our products in accordance with our business plans.
In June 2010, we entered into the Wilmar JV to construct a world-scale biorefinery. The Indonesia facility will be located within Wilmar’s new integrated manufacturing complex now under construction. Construction of the Indonesia facility commenced in November 2010. The Wilmar JV plans to complete construction of the Indonesia facility in the second quarter of 2012. Once construction is complete, we anticipate that the Indonesia facility will have an annual production capacity of 185,000 metric tonnes (400 million pounds), and the Wilmar JV will have the ability to expand annual production capacity to 370,000 metric tonnes (810 million pounds).
In June 2011, we acquired a former biodiesel facility, which we intend to repurpose into the Mississippi facility. We have commenced engineering design for the facility and are currently negotiating a related engineering, procurement and construction contract. We are also in discussions with petrochemical and agricultural processors to evaluate partnership and offtake opportunities for the Mississippi facility. Prior to the completion of construction, we will need to complete the design and related plans and secure the requisite permits, licenses and governmental approvals. We expect to begin commercial operations at the Mississippi facility in 2013, with annual production capacity of 280,000 metric tonnes (610 million pounds).
We may encounter significant delays, cost overruns, engineering problems, equipment supply constraints or other unexpected difficulties which could cause construction to cost more than we currently anticipate. These increased costs could require that we secure additional funding. Such funds may be unavailable when we need them or on terms that are acceptable to us. Furthermore, we may not be able to obtain the necessary regulatory approvals to complete construction of the biorefineries or operate either the Indonesia facility or the Mississippi facility in accordance with our business forecasts, including those approvals set forth below as further risks.
The Indonesia facility and the Mississippi facility may not perform as expected. For example, production rates may vary from our expectations. We may need to install additional equipment to achieve desired specifications, which could delay operations and increase costs. We may encounter these or other operational challenges and may be unable to devise workable and cost effective solutions, which could delay or prevent our ability to provide specialty chemicals or intermediate chemicals to our customers and could have a material adverse effect on our business, financial condition or results of operations.
We lack direct experience operating world-scale commercial biorefineries, and may encounter substantial difficulties operating such biorefineries or expanding our business.
We have never operated a world-scale commercial biorefinery. We have only completed two commercial-scale toll production runs of specialty chemicals and intermediate chemicals utilizing our proprietary biorefinery technology using palm oil. Our future success depends on our ability to produce commercial quantities of a broad
13
Table of Contents
range of our specialty chemicals and intermediate chemicals using a variety of natural oils with our proprietary biorefinery technology. While we have successfully completed demonstration size production runs using soy and other oils, we may not be able to successfully increase the scale of production to commercial quantities using these oils in a timely or economic manner or at all. Accordingly, we may encounter significant difficulties operating a world-scale biorefinery. Even after construction is completed at the Indonesia facility and the Mississippi facility, we will continue producing specialty chemicals and intermediate chemicals through toll manufacturing arrangements. We will need to successfully administer and manage this production while we complete construction of our other facilities and transition production to these new facilities. Additionally, the skills and knowledge gained in operating our pilot facility in Illinois and managing our toll manufacturers may prove insufficient for successful operation of a world-scale biorefinery and we may be required to expend significant time and money to enhance our capabilities in commercial biorefinery operation, which could have a material adverse effect on our business, financial condition or results of operations.
We may be unable to produce specialty chemicals and intermediate chemicals that meet our customers’ needs or specifications, which may have a material adverse effect on our business, financial condition or results of operations.
A key component of our business strategy is to develop and market our specialty chemicals. We may be unable to produce specialty chemicals that meet customers’ needs or specifications even if we produce specialty chemicals at our targeted rates. If we fail to meet specific product or volume specifications contained in a supply agreement, the customer may have the right to seek an alternate supply of chemicals or to terminate the agreement. A failure to successfully meet the specifications of our potential customers could decrease demand or otherwise significantly hinder market adoption of our products and may have a material adverse effect on our business, financial condition or results of operations.
Our intermediate chemicals may fail to meet established product or customer specifications. If one of our intermediate chemicals fails to meet established specifications, our customer may reject the product. We may need to reduce the price of the product in order to find a replacement buyer or to sell it on the spot market, or we may be unable to sell the product. Even if we were able to sell the rejected intermediate chemical for an identical price, our costs may increase if we are required to store the intermediate chemical longer or transport it farther than originally anticipated.
Our facilities and process may fail to produce specialty chemicals or intermediate chemicals at the volumes, rates and costs we expect.
The facilities we repurpose or construct for chemical production may fail to perform as expected. When we repurpose an existing biorefinery, the equipment and subsystems installed during the repurposing may never operate as planned. Our systems may prove incompatible with the original facility or require additional modification after installation. Similarly, a newly constructed facility may not operate as we expect it to operate. Our proprietary catalyst may perform less efficiently than it did at any of our toll manufacturers or at our pilot facility in Illinois. Contamination of biorefinery equipment may reduce the efficiency of the catalyst and may require us to replace the catalyst more often than expected. Likewise, if we were to experience routine feedstock contamination from contaminants such as peroxide and water, it could reduce the purity of the chemicals that we produce and require us to invest in more costly separation or transesterification processes or equipment. Unexpected problems may force us to cease or delay production and the time and costs involved with such delays may prove prohibitive to commercial operation. Any or all of these risks could prevent us from achieving the production necessary to achieve our target annualized production run rates. Failure to achieve these rates, or achieving them only after significant additional expenditures, may have a material adverse effect on our business, financial condition or results of operations.
14
Table of Contents
We have limited experience in structuring arrangements with customers for the purchase of our products and we may not be successful in this essential aspect of our business.
Because we currently only sell a limited number of products and have not yet completed development of many planned products, we have limited experience operating in many of our customers’ industries and interacting with the customers that we intend to target. Developing that expertise may take longer than we expect and may require that we expand and improve our sales and marketing infrastructure. These activities could delay our ability to capitalize on the opportunities that our technology and products present, and may prevent us from achieving commercialization of our specialty chemicals. The companies with which we expect to have customer arrangements are generally much larger than we are and have substantially longer operating histories and more experience in our target industries. As a result, we may not be effective in negotiating or managing the terms of our relationships with these companies, which may have a material adverse effect on our business, financial condition and results of operations.
Our specialty chemicals may not be accepted by the market.
Obtaining market acceptance in the chemical industry is complicated by the fact that many potential chemical industry customers have invested substantial amounts of time and money in developing established production channels. These potential customers generally have well-developed manufacturing processes and arrangements with suppliers of chemical components and may display substantial resistance to changing these processes. Preexisting contractual commitments, unwillingness to invest in new infrastructure, distrust of new production methods and long-standing relationships with current suppliers may all slow market acceptance of our products. To be successful, we must effectively demonstrate the commercial advantages of our specialty chemicals in lieu of other established chemicals. We must also demonstrate our ability to produce specialty chemicals reliably on a commercial scale and be able to sell them at a competitive price, or, we may experience a material adverse effect on our business, financial condition and results of operations.
We face substantial competition, which could adversely affect our performance and growth.
We face substantial competition in the specialty chemical and intermediate chemical markets. Our products will compete with traditional chemicals, petrochemicals and oleochemicals that serve our targeted markets, as well as products from emerging companies that have targeted the production of substitutes or replacements for existing products. The traditional chemical companies benefit from large, established production capabilities and business relationships. The incumbents’ greater resources and financial strength provide significant competitive advantages that we may not be able to overcome in a timely manner.
If any of our competitors succeed in producing competing specialty chemicals or intermediate chemicals more efficiently, in higher volumes or that offer performance superior to our chemicals, our financial performance may suffer. Furthermore, if our competitors have more success marketing their competing products or reach development or supply agreements with major customers or partners, our competitive position may also be harmed.
Our ability to compete successfully will depend on our ability to develop proprietary, high-performance products that reach the market in a timely manner and are priced competitively. Some of our competitors have substantially greater production, financial, research and development, personnel and marketing resources than we do. In addition, certain of our competitors may also benefit from local government subsidies and other incentives that are not available to us. As a result, our competitors may be able to develop competing or superior technologies and processes, and compete more aggressively and sustain that competition over a longer period of time than we could. Our technologies and products may be rendered obsolete or uneconomical by technological advances or entirely different approaches developed by one or more of our competitors. As more companies develop new intellectual property in our markets, we face the increased possibility of a competitor acquiring patent or other rights that may limit our ability to freely develop and sell our products. In order to secure
15
Table of Contents
purchase agreements from certain customers, we may be required to enter into exclusive supply contracts, which could limit our ability to further expand our sales to new customers. Potential customers may be locked into long-term, exclusive agreements with our competitors, which could inhibit our ability to compete for their business.
Our limited resources relative to many of our competitors may cause us to fail to anticipate or respond adequately to new developments and other competitive pressures. This failure could reduce our competitiveness and market share, adversely affect our results of operations and financial position and prevent us from obtaining or maintaining profitability.
Fluctuations in the availability or price of our feedstocks may affect our cost structure and cause delayed production, reduced output and reduced revenues if the cost or availability of feedstocks or other factors requires us to change feedstocks.
Our business is dependent on ready access to feedstocks, which are the largest component of our cost of product sales. We cannot be sure that our suppliers (including Cargill, the current supplier of the majority of our feedstocks) will be able to supply them in sufficient quantities or in a timely manner. A decrease in the availability of feedstocks or an increase in their price, which cannot be offset by an increase in our product selling prices, may have a material adverse effect on our financial condition and operating results. If locally produced feedstocks are unavailable, we may elect to use alternative feedstocks, which may be more expensive to acquire or deliver. General market conditions might also cause increases in feedstock prices, which could increase our production costs. At certain levels, feedstock prices may make our products uneconomical to use and produce, as we may be unable to pass all or any amount of feedstock cost increases on to our customers.
We also face risks related to unexpected reductions in feedstock prices. If feedstock prices fall, then the prices that we will be able to charge for our products may similarly fall. Additionally, we will likely have a supply of feedstock which we acquired prior to the reduction in feedstock prices (or products produced with more expensive feedstocks) for a period of time. Until such time as we have depleted our inventory of the more expensive feedstocks and products produced with such inventory, our margins may be reduced when compared to those we would have been able to secure had we used a less expensive feedstock in our production.
The price and availability of our feedstocks may be influenced by general economic, market and regulatory factors and may be cyclical or volatile. The supply of feedstocks may be interrupted by growing season disruptions, low crop yields, crop disease, droughts, floods, infestations, natural disasters, farming decisions or governmental policies and subsidies. In particular, weather conditions have historically caused volatility in certain portions of the agricultural industry by causing crop failures or reduced harvests. Excessive rainfall can adversely affect the supply of certain feedstocks. Crop disease and pestilence can adversely affect growth, potentially rendering unusable all or a substantial portion of affected harvests. We cannot predict the future availability of such feedstocks or whether any replacement or substitute feedstocks will be successfully developed at commercial scale. Our product mix differs from feedstock to feedstock, so prices of various feedstocks may prevent us from optimizing our product mix. Inability to obtain feedstocks at commercially viable prices could materially adversely affect our results of operations and financial position and prevent us from obtaining or maintaining profitability.
Our current business is dependent on the supply of the appropriate catalyst.
At present, the only catalyst that has been proven to be technically viable and cost effective is one that we obtain from Materia. We have a license for this particular catalyst and other technology from Materia that is important to our business. Materia may not comply with all of the terms of the license. We also have a catalyst supply agreement with Materia. Although we are allowed to produce or obtain catalyst from third parties in the event of a breach of the license agreement by Materia, we would need to find, retain and certify (in accordance with the terms of the license agreement) an alternative production source and may not be able to do so quickly, in a cost-effective manner or at all. Any dispute over this license agreement or this supply agreement could, even if
16
Table of Contents
successfully resolved, result in significant legal fees and other expenses, diversion of management time and efforts and disruption to our business created by any time between a breach of the license agreement by Materia and our being able to acquire acceptable catalyst from an alternative source. In addition, intellectual property suits against Materia, including the current suit filed by Evonik Degussa GmbH (“Evonik Degussa”), could disrupt our supply of catalyst from Materia if such suits are not favorably resolved. See “—If Materia is unsuccessful in defending against a lawsuit filed by Evonik Degussa or if our related license expires prior to the resolution of such litigation in favor of Materia, we may experience a material adverse effect on our business, financial condition or results of operations.” There may also be other technical or economic factors that could disrupt our supply of catalyst, which could have a material adverse effect on our business, financial condition and results of operations.
Materia’s catalyst uses ruthenium, which is only available in limited quantities. The limited availability of ruthenium can result in cost volatility.
Ruthenium can only be obtained from a limited number of producers in a limited number of geographic sites. If worldwide demand for ruthenium increases, it could take significant time for production of ruthenium to be increased to meet demand. If we are unable to improve the efficiency of our metathesis catalysis process, economically recycle our catalyst, develop alternatives to our ruthenium-based catalyst or if annual ruthenium production does not increase, we will require a material percentage of the annual supply of ruthenium in order to support our annual biorefinery production. As a result, we could experience shortages of or increases in the cost to obtain Materia’s catalyst, which could have a material adverse effect on our business, financial condition and results of operations.
Our ability to compete may be adversely affected if we do not obtain adequate intellectual property protection for our proprietary technologies or if we lose some of our intellectual property rights through costly litigation or administrative proceedings.
Our success will depend in part on our ability to obtain patents and maintain adequate protection of our intellectual property covering our technologies and products and potential products in the United States and other countries. We have adopted a strategy of seeking patent protection in the United States and in certain foreign countries with respect to certain of the technologies used in or relating to our products and processes. As such, as of September 30, 2011, we have exclusive license rights to Materia’s portfolio of 85 U.S. Patents, six published U.S. Patent Applications and 47 published Patent Cooperation Treaty (“PCT”) applications, together with the corresponding foreign patents and patent applications. The first of our licensed patents will expire as early as April 3, 2012. When and if issued, patents would expire at the end of their term and any patent would only provide us commercial advantage for a limited period of time, if at all. Our patent applications are directed to our enabling technologies and to our methods and products that support our business in the specialty chemical and intermediate chemical markets. We intend to continue to apply for patents relating to our technologies, methods and products as we deem appropriate.
A filed patent application does not guarantee a patent will be issued and a patent issuing does not guarantee it will never be invalidated, nor does it give us the right to practice the patented technology or commercialize the patented product. Third parties may have or obtain rights to “blocking patents” that could be used to prevent us from commercializing our products or practicing our technology. The scope and validity of patents and success in prosecuting patent applications involve complex legal and factual questions and, therefore, issuance, coverage and validity cannot be predicted with any certainty. Patents issuing from our filed applications may be challenged, invalidated or circumvented. Moreover, third parties could practice our inventions in secret and in territories in which we do not have patent protection. Such third parties may then try to sell or import products made using our inventions in and into the United States or other territories and we may be unable to prove that such products were made using our inventions. Additional uncertainty may result from the passage of patent reform legislation by the U.S. Congress and from legal precedent as handed down by the U.S. Court of Appeals for the Federal Circuit and the U.S. Supreme Court, as they determine legal issues concerning the scope, validity and construction of patent claims.
17
Table of Contents
Because patent applications in the United States and many foreign jurisdictions are typically not published until 18 months after filing, or in some cases not at all, and because publication of discoveries in the scientific literature often lags behind the actual discoveries, there is additional uncertainty as to the validity of any patents that may issue and the potential for blocking patents coming into force at some future date. Accordingly, our currently filed or future patent applications may not result in issued patents, or even if related patents are issued, we cannot predict the scope of the claims that may issue in our and other companies’ patents.
The degree of future protection for our proprietary rights is uncertain because: (1) we may not have been the first to make the inventions covered by each of our filed applications; (2) we may not have been the first to file patent applications for these inventions; (3) the proprietary technologies we develop may not be patentable; (4) any patents issued may not be broad enough in scope to provide commercial advantage and prevent circumvention; and (5) competitors and other parties may have or may obtain patent protection that will block our development and commercialization activities. These concerns apply equally to patents we have licensed, which may likewise be challenged, invalidated or circumvented, and the licensed technologies may be obstructed from commercialization by competitors’ “blocking patents.”
In addition, unauthorized parties may attempt to copy or otherwise obtain and use our products or technology. Monitoring unauthorized use of our intellectual property is difficult, particularly where, as in our situation, the end products reaching the market generally do not reveal the processes used in their manufacture, and particularly in certain foreign countries where the local laws may not protect our proprietary rights as fully as in the United States. As such, we cannot be certain that the steps we have taken in obtaining intellectual property and other proprietary rights will prevent unauthorized use of our technology. If competitors are able to use our technology without our authorization, our ability to compete effectively could be adversely affected. Moreover, competitors and other parties such as universities may independently develop and obtain patents for technologies that are similar to or superior to our technologies. If that happens, the potential competitive advantages provided by our intellectual property may be adversely affected. We may then need to license these competing technologies, and we may not be able to obtain licenses on reasonable terms, if at all, which could cause material harm to our business. Accordingly, litigation may be necessary for us to assert claims of infringement, enforce patents we own or license, protect trade secrets or determine the enforceability, scope, validity and infringement of the intellectual property rights of others.
Under the provisions of some of our research, joint development and commercial agreements, ownership of certain intellectual property developed thereunder may be owned jointly by us and our contractual counterparty, or may be owned entirely by our counterparty. In addition, we may be restricted from using such developed intellectual property in certain fields or market areas or may be required to pay royalties to use such developed intellectual property in certain circumstances, either during the term of the applicable agreement or upon certain events of default or termination scenarios. Such provisions may limit our ability to exploit such jointly developed intellectual property in certain fields (or to do so without paying a royalty) and our ability to work with other parties in certain fields and may lead to costly and time-consuming inventorship or ownership disputes.
If any other party has filed patent applications or obtained patents that claim inventions also claimed by us, we may have to participate in interference proceedings declared by the U.S. Patent and Trademark Office to determine priority of invention and, thus, the right to the patents for these inventions in the United States. Even if successful, an interference may result in loss of certain patent claims, significant legal fees and other expenses, diversion of management time and efforts and disruption in our business. Uncertainties resulting from initiation and continuation of any patent or related litigation could harm our ability to compete and may have a material adverse effect on our business, financial condition or results of operations.
If we infringe the intellectual property rights of third parties, we might be required to obtain a license, redesign or forgo one or more of our current or future processes or products, rebrand our current or future products or services, pay damages or defend against litigation.
Patents that impact our technology may exist or may issue in the future in the United States or other countries. Trademark rights may exist or may come into existence in the United States or other countries which
18
Table of Contents
impact the marks that we use with our products and services. If our products, methods, processes, packaging or marketing infringe or are at least asserted to infringe the patents or trademarks of other parties, we could incur substantial costs and we might have to:
| • | obtain licenses, which might not be available on commercially reasonable terms, if at all; |
| • | abandon an infringing mark, process or product; |
| • | redesign, reformulate or rebrand our products or processes to avoid infringement; |
| • | stop using the mark or the subject matter claimed in the patents held by others; |
| • | pay damages; or |
| • | defend litigation or administrative proceedings, which might be costly whether we win or lose, and which could result in a substantial diversion of our financial and management resources. |
Any of these events may have a material adverse effect on our business, financial condition and results of operations.
As is commonplace in both the specialty chemical and intermediate chemical industries, some of our directors, employees and consultants are or have been employed at, or associated with, companies and universities that compete with us or have or will develop similar technologies and related intellectual property. While employed at these companies, these employees, directors and consultants may have been exposed to or involved in research and technology similar to the areas of research and technology in which we are engaged. Though we have not received such a complaint, we may be subject to allegations that we or our directors, employees or consultants have inadvertently or otherwise used, misappropriated or disclosed alleged trade secrets or confidential or proprietary information of those companies. Litigation may be necessary to defend against such allegations, and the outcome of any such litigation would be uncertain and could have a material adverse effect on our business, financial condition or results of operations.
If Materia is unsuccessful in defending against a lawsuit filed by Evonik Degussa or if our related license expires prior to the resolution of such litigation in favor of Materia, we may experience a material adverse effect on our business, financial condition or results of operations.
Currently, Materia is defending against a lawsuit filed by Evonik Degussa in which Evonik Degussa has alleged that Materia has infringed its U.S. patents relating to specific types of catalysts for olefin metathesis chemical reactions. Previously, we were a co-defendant with Materia in such litigation, but were dismissed as a party in connection with entering into the Confidential Settlement Agreement with Mutual Release and Patent License with Evonik Degussa on June 23, 2010 (the “Degussa Settlement Agreement”). The license to certain of its U.S. patents, which Evonik Degussa granted to us pursuant to the Degussa Settlement Agreement, is scheduled to expire on December 31, 2012. We may elect to extend the license for an additional year to December 31, 2013 for $300,000. We currently have no right to extend the license granted to us by Evonik Degussa past December 31, 2013 and may be unsuccessful in any attempt to extend this license beyond December 31, 2013, which may have a material adverse effect on our business, financial condition or results of operations if we are unable to successfully develop and produce a suitable replacement catalyst for use in commercial production of our specialty chemicals and intermediate chemicals.
Under our license with Materia, we must make certain exclusivity payments each year to preserve our license thereunder and any failure to make such payments (or portion thereof) could cause us to lose our rights under the license which would have a material adverse effect on our business.
Under our license agreement with Materia, we must make an annual exclusivity payment of $250,000 to Materia during the first five years of the license agreement in order to maintain our exclusive license thereunder. If we fail to make any such payment in accordance with the terms of the license agreement, our exclusive license shall be converted into a non-exclusive license upon one month’s prior notice from Materia. Additionally,
19
Table of Contents
commencing January 2013, we must pay a minimum of $8.0 million annually in consideration to Materia as a result of the combination of any work or materials procured under the license agreement, the related catalyst supply agreement and joint development agreement. If we fail to make the $8.0 million minimum annual payment in any such year, we must pay the related shortfall to Materia by February 1 of the following calendar year in order to maintain our exclusive license. If we fail to do so, our exclusive license will be converted into a nonexclusive license. The conversion of our license from an exclusive license to a nonexclusive license may have a material adverse effect on our business, financial condition or results of operations.
We are dependent on our partners, and our failure to successfully manage these relationships could delay or prevent us from developing and commercializing many of our products and achieving or sustaining profitability.
Our ability to maintain and manage partnerships in our markets is fundamental to the success of our business model. We currently have license agreements, research and development agreements, supply agreements and distribution agreements with various partners. We may have limited or no control over the amount or timing of resources that any collaborator is able or willing to devote to our partnered products or partnership efforts. Any of our partners may fail to perform their obligations as expected. These partners may breach or terminate their agreements with us or otherwise fail to conduct their partnership activities successfully and in a timely manner. Further, our partners may not develop products arising out of our partnership arrangements or devote sufficient resources to the development, manufacture, marketing, or sale of these products. Moreover, disagreements with a partner could develop and any conflict with a partner could reduce our ability to enter into future partnership agreements and negatively impact our relationships with one or more existing partners. If any of these events occur, or if we fail to maintain our agreements with our partners, we may not be able to commercialize our existing and potential products, grow our business or generate sufficient revenues to support our operations. Our partnership opportunities could be harmed if:
| • | we or our partners do not achieve our research and development objectives under our partnership agreements in a timely manner or at all; |
| • | we develop products and processes or enter into additional partnerships that conflict with the business objectives of our other partners; |
| • | we disagree with our partners as to their rights to intellectual property developed, their research programs or their commercialization activities; |
| • | we are unable to manage multiple simultaneous partnerships; |
| • | our partners become competitors of ours or enter into agreements with our competitors; |
| • | our partners become unable or less willing to expend their resources on research and development or commercialization efforts due to general market conditions, their financial condition or other circumstances beyond our control; or |
| • | consolidation in our target markets limits the number of potential partners. |
Additionally, our business, financial conditions and results of operations may be materially adversely affected if any of our partners or suppliers undergoes a change of control or were to otherwise assign the rights or obligations under any of our agreements.
Our relationship with Wilmar may not prove successful.
We have entered into the Wilmar JV for the purpose of constructing and operating the Indonesia facility with annual production capacity of up to 185,000 metric tonnes (400 million pounds) and to engage in certain related activities (including the manufacture of specialty chemicals and intermediate chemicals). Wilmar is the largest global processor and merchandiser of palm, palm kernel and coconut oils. Our ability to generate value from the Wilmar JV will depend, among other things, on our ability to work cooperatively with Wilmar to complete construction on the Indonesia facility and for the production and commercialization of the Wilmar JV’s
20
Table of Contents
products. For example, Wilmar is responsible for the construction of the Indonesia facility and may not be able to complete construction on time or on budget. In addition, the agreements governing the Wilmar JV are complex and cover a range of future activities, some of which require definitive agreements to be completed. Disputes may arise between us and Wilmar that could delay the completion of construction of the Indonesia facility and the development, commercialization and sale of the Wilmar JV’s products or cause the dissolution of the Wilmar JV, which could have a material adverse effect on our business, financial condition and results of operations. Furthermore, although expansion of the Indonesia facility is part of our expansion plans, the Wilmar JV must exercise its option to increase the Indonesia facility’s annual production capacity and cannot do so without Wilmar’s consent.
We may be unable to successfully negotiate final, binding agreements with our partners and customers, which could harm our commercial prospects.
We are engaged in negotiations with a number of companies regarding potential contracts for new specialty chemicals and certain intermediate chemicals. However, we may be unable to negotiate final terms in a timely manner, or at all, and there is no guarantee that the terms of any final agreement will be the same or similar to those currently contemplated in our preliminary discussions or as set forth in our existing customer and partnership agreements. Final terms may include less favorable pricing structures or volume commitments, more expensive delivery or purity requirements, reduced contract durations and other adverse changes. Delays in negotiating final contracts could slow our expansion plans, and failure to agree to definitive terms for sales of sufficient volumes of specialty chemicals or intermediate chemicals could prevent us from growing our business. Additionally, we have yet to produce or supply world-scale volumes of specialty chemicals or intermediate chemicals to any customer. If we increase production capacity more slowly than we expect, or if we encounter difficulties in successfully completing biorefinery constructions or asset repurposings, our potential customers, including those with whom we have current letters of intent, may be less willing to negotiate definitive supply agreements, or may demand terms less favorable to us, and together may have a material adverse effect on our business, financial condition or results of operations.
Our resources may be strained as we execute our growth and expansion plans.
We may face additional operational difficulties as we further expand our production capacity. Integrating the support required by our new locations into our facility in Illinois may prove difficult. Rapid growth, resulting from our operation of, or other involvement with, biorefineries or otherwise, may impose a significant burden on our administrative and operational resources. To effectively manage our growth and execute our expansion plans (including construction of the Indonesia facility and the Mississippi facility), we will need to expand our administrative and operational resources substantially and attract, train, manage and retain qualified management, technicians and other personnel. We may be unable to do so. Failure to meet the operational challenges of developing and managing increased chemical production, or failure to otherwise manage our growth, may have a material adverse effect on our business, financial condition and results of operations.
We may not successfully identify or acquire or otherwise gain access to facilities or sites suitable for repurposing or for the construction of new facilities.
Our strategy currently includes acquiring and repurposing, either independently or with potential development partners, existing facilities or constructing new facilities to produce large quantities of specialty chemicals and intermediate chemicals for distribution and sale. Other than the Indonesia facility and the Mississippi facility, we may not be able to obtain facilities through acquisition, lease or joint venture or find sites suitable for construction and development. Even if we successfully acquire a facility suitable for efficient repurposing or a site suitable for construction, we may be unable to acquire the rights to either repurpose the existing facility or construct a new facility. The owners of an existing facility or proposed site may reach an agreement with another party, refuse to consider an acquisition, lease or joint venture, or demand more or different consideration than we are willing to provide. Even if the owners of the facility or site are interested in reaching an agreement that grants us access to the facility or site, negotiations may take longer, or cost more,
21
Table of Contents
than we expect, and we may never achieve a final agreement. Failure to acquire access to sufficient capacity in a timely manner, or at all, may cause our business performance to suffer and may have a material adverse effect on our business, financial condition or results of operations.
When we acquire or construct facilities, we may be unable to repurpose or construct them successfully to produce specialty chemicals and intermediate chemicals, or we may not be able to repurpose or construct them in a timely and cost-effective manner.
When we acquire or construct facilities, we may be unable to repurpose or construct them successfully to produce specialty chemicals and intermediate chemicals, or we may be unable to repurpose or construct them in a timely and cost-effective manner. Constructing world-scale production facilities is a complex and lengthy undertaking that requires sophisticated, multi-disciplinary planning and precise execution.
Each facility will require individualized engineering and design work. There is no guarantee that we will be able to successfully design a commercially viable facility, or properly complete the construction once the engineering plans are completed. We have never built, through repurposing or otherwise, a world-scale commercial biorefinery. Our estimates of the capital costs that we will need to incur to repurpose or construct a world-scale commercial biorefinery are based upon comparable capital costs for similar industrial manufacturing process units and our own engineering modeling. These estimates may prove to be inaccurate, and each repurposing or new construction project may cost materially more to engineer and build than we currently anticipate. For example, our estimates assume that each biorefinery we construct or repurpose will be performing at full production capacity within six months of completion of construction, and we may need to expend substantial sums to repair underperforming facilities prior to the repurposing. Additionally, for each facility, we will be required to obtain numerous regulatory approvals and permits to repurpose or construct and operate the facility, including complex air and wastewater discharge permits. We may not be able to obtain these approvals and permits in a timely manner, or at all. International, federal, state and local governmental requirements (including environmental, health and safety requirements) may also substantially increase our costs or delay or prevent the completion of a repurposing or construction project. Any such cost increases or delay in or failure to complete our repurposing or construction could have a material adverse effect on our business, financial condition and results of operations.
Furthermore, the repurposing of acquired facilities or the construction of new facilities will be subject to the risks inherent in the build-out of any manufacturing facility. These include risks of delays and cost overruns as a result of factors (whether caused by us or beyond our control) such as increases in cost of construction materials, shortages of raw materials, poor workmanship, shortages of skilled construction labor, the difficulty or impossibility of obtaining necessary permits or approvals from governmental agencies, injuries sustained by workers on the jobsite, delays in the delivery of equipment and subsystems or the failure of such equipment to perform as expected once delivered. We may also encounter delays and attendant costs associated with requirements to conduct environmental assessment, investigation, remediation or cleanup work in connection with repurposing or constructing our biorefineries, including the Mississippi facility. In addition, we will depend on third-party relationships to expand our production capacity and such third parties may not fulfill their obligations to us under our arrangements with them. Delays, cost overruns or failures in the repurposing or construction process could slow our commercial production of specialty chemicals and intermediate chemicals and harm our performance. Furthermore, with respect to the Indonesia facility, each of these risks is beyond our control since Wilmar is responsible for the construction of the Indonesia facility.
We may require substantial additional financing to achieve our goals, and a failure to obtain funding when needed or on acceptable terms could force us to delay, limit, reduce or terminate our development and commercialization efforts.
Since our inception, most of our resources have been dedicated towards research and development, as well as demonstrating the effectiveness of our technology. We believe that we will continue to expend substantial resources for the foreseeable future on further developing our technologies and accessing facilities necessary for
22
Table of Contents
world-scale production of our specialty chemicals and intermediate chemicals. These expenditures will include costs associated with research and development and constructing the Indonesia facility, the Mississippi facility and our planned third facility. We will also incur costs related to obtaining government and regulatory approvals, acquiring or constructing storage facilities and negotiating partnership and supply agreements for the chemicals we produce. In addition, other unanticipated costs may arise. Because the costs of developing our technology are uncertain, we may not accurately estimate the amounts necessary to successfully commercialize our production.
To date, we have funded our operations primarily through private equity offerings and the issuance of convertible debt. We may need additional funds sooner than planned. We may also choose to seek additional capital sooner than required due to favorable market conditions or strategic considerations.
Our future capital requirements will depend on many factors, including:
| • | the timing of, and costs involved in developing our technologies for world-scale production of our specialty chemicals and intermediate chemicals; |
| • | the timing of, and costs involved in, completing construction of the Indonesia facility and the Mississippi facility; |
| • | the timing of, and costs involved in, constructing capacity subsequent to completing construction of the Indonesia facility (including its potential expansion) and the Mississippi facility; |
| • | the cost of operating and maintaining our biorefineries; |
| • | our ability to negotiate agreements for the supply of suitable feedstock to our biorefineries, and the timing and terms of those agreements; |
| • | the timing of, and the costs involved in, developing adequate storage facilities for the chemicals we produce; |
| • | our ability to negotiate supply and partnership agreements for the specialty chemicals and intermediate chemicals we produce, and the timing and terms of those agreements; |
| • | our ability to negotiate sales of specialty chemicals and intermediate chemicals and the timing and terms of those sales; |
| • | our ability to establish and maintain strategic partnerships, licensing or other arrangements and the timing and terms of those arrangements; and |
| • | the cost of preparing, filing, prosecuting, maintaining, defending and enforcing patent, trademark and other intellectual property claims, including litigation costs and the outcome of such litigation. |
These factors could have a material adverse affect on our business, financial condition and results of operations.
Additional funds may not be available when we need them, on terms that are acceptable to us, or at all. If needed funds are not available to us on a timely basis, we may be required to delay, limit, reduce or terminate:
| • | our research and development activities; |
| • | our plans to construct new facilities and repurpose existing facilities; or |
| • | our activities in developing storage capacity and negotiating supply and partnership agreements that may be necessary for the commercialization of our chemical production. |
Such delay, limitation, reduction or termination could materially adversely affect our business, financial condition and results of operations.
23
Table of Contents
Raising additional capital may cause dilution to our existing stockholders, restrict our operations or require us to relinquish rights to our technologies.
We may seek additional capital through a combination of public and private equity offerings, debt financings, strategic partnerships and licensing arrangements. To the extent that we raise additional capital through the sale or issuance of common or preferred stock, warrants or convertible debt securities, your ownership interest will be diluted, and the terms may include liquidation or other preferences that adversely affect your rights as a stockholder. If we raise capital through debt financing, it may involve agreements that include covenants limiting or restricting our ability to take certain actions, such as incurring additional debt, making capital expenditures or declaring dividends. If we raise additional funds through strategic partnerships and licensing agreements with third parties, we may have to relinquish valuable rights to our technologies, or grant licenses on terms that are not favorable to us. If we are unable to raise additional funds when needed, our business, financial condition and results of operations may be materially adversely affected.
If we engage in any acquisitions, we will incur a variety of costs and face numerous risks that could adversely affect our business and operations.
If appropriate opportunities become available, we may acquire businesses, assets, technologies or products to enhance our business in the future. In connection with any future acquisitions, we could:
| • | issue additional equity securities, which would dilute our current stockholders; |
| • | incur substantial debt; or |
| • | assume significant liabilities. |
Acquisitions involve numerous risks, including: problems integrating the purchased operations, technologies or products; unanticipated costs and other liabilities; diversion of management’s attention from our core business; adverse effects on existing business relationships with current or prospective partners, customers and suppliers; risks associated with entering markets in which we have no or limited prior experience; and potential loss of key employees. We may be unable to successfully integrate any businesses, assets, products, technologies or personnel that we might acquire in the future without a significant expenditure of operating, financial and management resources, and despite the allocation of additional resources the integration might not achieve our objectives. Moreover, the integration process could divert our management’s time and attention from focusing on operating our business, result in a decline in employee morale or cause retention issues to arise from changes in compensation, reporting relationships, future prospects or the direction of the business. Acquisitions may also require us to: record goodwill; record non-amortizable intangible assets that will be subject to impairment testing on a regular basis and potential periodic impairment charges; incur amortization expenses related to certain intangible assets; and incur large and immediate write-offs and restructuring expenses, all of which could harm our operating results and financial condition. If we fail in our integration efforts with respect to any of our acquisitions and are unable to efficiently operate as a combined organization, our business, financial condition and results of operations may be materially adversely affected.
We face risks associated with our international business.
Upon completion of the Indonesia facility, significant portions of our operations will be conducted outside of the United States, specifically in Indonesia, and we expect to continue to develop additional, significant foreign operations in the foreseeable future. International business operations are subject to a variety of risks, including:
| • | changes in or interpretations of foreign regulations that may adversely affect our ability to sell our products or repatriate profits to the United States; |
| • | the imposition of tariffs, trade protection measures and other regulatory requirements; |
| • | the imposition of limitations, or increase of withholding and other taxes, on remittances and other payments by foreign subsidiaries or joint ventures; |
24
Table of Contents
| • | the imposition of limitations on genetically engineered products or processes and the production or sale of those products or processes in foreign countries; |
| • | inability to protect intellectual property; |
| • | currency exchange rate fluctuations; |
| • | uncertainties relating to foreign laws and legal proceedings including tax and exchange control laws and environmental, health and safety laws; |
| • | government subsidies or other incentives that benefit competitors in their local markets that are not available to us; |
| • | economic or political instability in foreign countries; |
| • | difficulties in staffing and managing foreign operations; and |
| • | the need to comply with a variety of U.S. laws applicable to the conduct of overseas operations, including export control laws and the Foreign Corrupt Practices Act. |
Through the Wilmar JV, we have a substantial investment in Indonesia, a nation that since 1997 has undergone financial crises and devaluation of its currency, outbreaks of political and religious violence and acts of terrorism, changes in national leadership and the secession of East Timor, one of its former provinces. Consequently, the Wilmar JV is subject to substantial economic and political risks. In addition, changes in the national policy toward foreign investors could result in unilateral modification of concessions or contracts, increased taxation, denial of permits or permit renewals or expropriation of assets. Economic or political turmoil in Indonesia could have a material adverse effect on our business, financial condition and results of operations.
We may not be able to enforce our intellectual property rights throughout the world.
The laws of some foreign countries do not protect intellectual property rights to the same extent as federal and state laws in the United States. Many companies have encountered significant problems in protecting and enforcing intellectual property rights in certain foreign jurisdictions. The legal systems of certain countries, particularly certain developing countries, do not favor the enforcement of patents and other intellectual property protection. This could make it difficult for us to stop the infringement of our patents or misappropriation of our other intellectual property rights. Proceedings to enforce our patents and other proprietary rights in foreign jurisdictions could result in substantial costs and divert our efforts and attention from other aspects of our business. Accordingly, our efforts to enforce our intellectual property rights in such countries may be inadequate to obtain a significant commercial advantage from the intellectual property that we develop, which could have a material adverse effect on our business, financial condition and results of operations.
Our reliance on toll manufacturers to produce our products exposes us to risks relating to the price and availability of that toll manufacturing and could adversely affect our business.
We currently rely on a small number of toll manufacturers to manufacture all of our specialty chemicals and intermediate chemicals. We expect to continue to use toll manufacturers to a limited extent even after completion of our biorefineries. As we grow and begin commercial operations at our biorefineries, it is possible that there will be periods when the demand for our products exceeds our production capacity, in which case we will need to utilize toll manufacturers. If any of these manufacturers is unable to meet our volume or product specification requirements or if we or any such manufacturer terminates our relationship prematurely, we will need to contract with other suppliers. Toll manufacturers with the desired capacity may not be available when we need their services, they may not possess the operational expertise to meet desired specifications, they may not be willing to dedicate a portion of their production capacity to our products or we may not be able to reach acceptable price and other terms with them for the provision of their production services. Any such delay or inability to contract with other suppliers when and as needed could adversely affect our ability to commercialize our products or could harm our relationships with our customers and partners, which could have a material adverse effect on our business, financial condition and results of operations.
25
Table of Contents
Technological innovation may render our products and processes obsolete.
Our success will depend on our ability to maintain a competitive position with respect to technological change. Our technologies and products may be rendered obsolete or uneconomical by technological advances, more efficient and cost-effective catalysts or entirely different approaches developed by one or more of our competitors or others, which could have a material adverse effect on our business, financial condition and results of operations.
Confidentiality agreements with employees and others may not adequately prevent disclosures of trade secrets and other proprietary information.
We rely in part on trade secret protection to protect our confidential and proprietary information and processes. However, trade secrets can be difficult to protect. We have taken physical and electronic measures and have entered into agreements to protect our trade secrets and proprietary information, but these measures and agreements may not be effective. We require new employees and consultants to execute confidentiality agreements upon the commencement of an employment or consulting arrangement with us. These agreements generally require that all confidential information developed by the individual or made known to the individual by us during the course of the individual’s relationship with us be kept confidential and not be disclosed to third parties. These agreements also generally provide that know-how and inventions conceived by the individual in the course of rendering services to us shall be our exclusive property. These agreements may be unenforceable, our proprietary information may be disclosed, third parties may reverse engineer our proprietary catalysts and others may independently develop substantially equivalent proprietary information and techniques or otherwise gain access to our trade secrets. Costly and time-consuming litigation could be necessary to enforce and determine the scope of our proprietary rights, and failure to obtain or maintain trade secret protection may have a material adverse effect on our business, financial condition or results of operations.
We may face substantial delay and cost in obtaining regulatory approvals for the use, manufacture or distribution of our chemicals, which could substantially hinder our ability to commercialize our products.
Some of our chemical products and their registration, use, manufacture, processing and distribution are subject to government regulation in our target markets, including pursuant to, in the United States, the Toxic Substances Control Act (the “TSCA”) and, in the European Union, REACH (Registration, Evaluation, Authorisation, and Restriction of Chemical substances). Under the TSCA, before we can manufacture or distribute significant volumes of a chemical, we may need to file a pre-manufacture notice with the U.S. Environmental Protection Agency (the “EPA”) for a review period of up to 90 days excluding extensions. We may not be able to receive approval from the EPA, resulting in delays or significant increases in testing requirements. Under REACH, we are required to register some of our products with the European Chemicals Agency, and this process could cause significant delays or costs. To the extent that other nations, such as Australia, China, Japan, South Korea, Taiwan, the Philippines and other countries also require chemical registration, potential delays similar to those in the United States or Europe may delay our entry into these markets as well. We are in various stages of testing and regulatory approvals with the specialty chemicals that we currently develop at our pilot facility in Illinois. While the United States and Europe are the major targeted markets, other regulatory requirements are likely to exist for every country into which our products will be sold.
Renewable fuels (such as biodiesel) sold in the United States receive a “renewable identification number,” or RIN, under the Renewable Fuel Standard Program. For a RIN to be generated for our products, we must register our related facility with the EPA and our product must meet specified regulatory requirements established by the EPA. While we currently have a RIN registration for the Mississippi facility, any future delay or failure in generating the desired RIN for our products or loss of the RIN registration for the Mississippi facility could make our intermediate chemicals less attractive to our customers for use as a biofuel, which could harm our competitiveness.
In addition, any specialty chemicals developed using our technologies will need to meet a significant number of regulations and standards. In the United States, this will include regulations imposed by the U.S.
26
Table of Contents
Department of Transportation, the EPA, the Occupational Safety and Health Administration and various other federal and state agencies. Any failure to comply, or delay in compliance, with the various existing and evolving industry regulations and standards could prevent or delay the commercialization of any specialty chemicals developed using our technologies and subject us to fines and other penalties. We will also incur time and cost to comply with regulations in other countries in which we operate.
Any failure to obtain or delay in obtaining regulatory approvals for our chemical products or noncompliance with associated requirements could have a material adverse effect on our business, financial condition and results of operations.
We produce and use hazardous materials in our business and are subject to costs, liabilities and compliance obligations and to possible enforcement actions, cleanup obligations and third-party lawsuits with regard to environmental, health and safety matters. Any claims arising from the handling, storage or disposal of, or exposure to, hazardous materials or noncompliance with environmental, health and safety laws and regulations could be costly and time consuming and could adversely affect our business and results of operations.
Our research and development processes involve, and the construction, repurposing and operation of our biorefineries will entail, the production and use of hazardous materials (including Materia’s catalyst), the generation of hazardous waste, and the release of regulated air emissions and wastewater discharges. As a result of these and other activities, we are regulated by international, federal, state and local environmental, health and safety laws and regulations, including those that govern the use, manufacture, storage, handling and disposal of, contamination by, and human exposure to, hazardous materials. Pursuant to such laws and regulations, we are required to maintain regulatory authorizations and permits for certain of our operations and products. Compliance with applicable environmental laws, regulations, authorizations and permits may be expensive, and the failure to comply with such past, present, or future requirements could result in the imposition of fines, third-party property damage, product liability and personal injury claims, investigation and remediation costs, the suspension of production or a cessation of operations. There can be no assurance that violations of environmental, health and safety requirements will not occur in the future as a result of human error, accident, equipment failure or other causes. In addition, we cannot eliminate from our operations the risk of contamination or discharge of hazardous materials to the environment and any resultant injury or environmental harm. We may be held jointly and severally liable, without regard to fault, in connection with contamination at or emanating from our properties, or third-party waste disposal sites. In addition to incurring potentially significant investigation and remediation costs, as a result of such matters we may be sued for any injury or contamination that results from the use, release or disposal of hazardous materials, and our liability may exceed our total assets. Environmental, health and safety laws, regulations, authorizations and permits could become more stringent over time imposing greater liabilities and compliance costs and increasing risks and penalties associated with violations. Our costs, liabilities and obligations relating to environmental, health and safety matters could impair our research, development or production efforts and otherwise have a material adverse effect on our business, financial condition and results of operations.
Our operations are subject to operational hazards that could cause damage to property or injury to individuals.
Our operations are subject to operational hazards inherent in the manufacturing and distribution of our products. These hazards include explosions, fires, severe weather and natural disasters, mechanical failures, unscheduled downtimes, human error, spills, discharges (including of Materia’s catalyst) into the environment or other releases of toxic or hazardous substances or gases, storage tank leaks, and safety and security risks relating to the transport of a variety of hazardous and non-hazardous raw materials, intermediates and finished products. If any of these risks were to materialize and cause bodily injury or loss of life, severe damage to, or destruction of, property and equipment or environmental damage, we could be subject to fines assessed by federal and state
27
Table of Contents
agencies, our operations could be suspended and we could become subject to civil and criminal penalties and liabilities in connection with property damage or injury to our employees or third parties, which could have a material adverse effect on our business, results of operations and financial condition.
Climate change legislation, regulation and litigation could result in increased operating costs.
In recent years, the U.S. Congress has been considering legislation to restrict or regulate emissions of greenhouse gases (“GHGs”), such as carbon dioxide and methane, which are understood to contribute to global warming. In addition, almost half of the states in the United States, either through individual or multi-state regional initiatives, have begun to address GHG emissions. The EPA also regulates GHG emissions under its existing Clean Air Act authority, as a result of which certain large stationary sources and modification projects are subject to permitting and reporting requirements for GHG emissions.
International climate change regulations could also impact our business. The Kyoto Protocol to the United Nations Framework Convention on Climate Change entered into force in 2005 and attention is now focused on development of a post-2012 international policy framework to guide international action to address climate change when the Kyoto Protocol expires in 2012. Proposed and existing legislative efforts in international jurisdictions, including those under the European Union’s Emission Trading Scheme, to control or limit GHG emissions could not only increase the cost of compliance but could also adversely affect our energy source and supply choices and increase the cost of energy and raw materials derived from fossil fuels. These efforts could also increase our estimated capital and operating costs associated with the Indonesia facility.
Any future application to our business of GHG laws, regulations or permitting requirements, or litigation arising from GHG emissions, could restrict GHG emissions from our operations or require us to incur increased operating costs. The potential increase in the costs of our operations resulting from any such matters could include new or increased costs to operate and maintain our facilities, install new emission controls on our facilities, acquire allowances to authorize our GHG emissions, pay any taxes related to our GHG emissions and administer and manage a GHG emissions program. We cannot predict with any certainty at this time how current or future GHG requirements may affect our operations, but they could have a material adverse effect on our business, results of operations and financial condition.
Environmental, legal and social concerns about feedstocks grown on land that could be used for food production or extracted from trees grown in tropical rainforests could limit or prevent the use of our products, processes and technologies and limit our revenues.
Palm oil is extracted from the pulp of the fruit of the oil palm tree. The planting of oil palm trees subjects our palm oil sources to concerns regarding the deforestation of tropical rainforests. Our feedstocks may also be grown on land that could be used for food production. If we are not able to overcome the legal and social issues that may arise over land use or the industrial use of our feedstock oils, our access to feedstocks or customer acceptance of our products and processes may be materially impaired. Any of the risks discussed below could result in increased expenses, delays or other impediments to our programs or the public acceptance and commercialization of products and processes dependent on our technologies or inventions, which could have a material adverse effect on our business, financial condition and results of operations. Our ability to develop and commercialize one or more of our technologies, products, or processes could be limited by the following factors:
| • | public attitudes and ethical concerns surrounding production of feedstocks on land which could be used to grow food, which could influence public acceptance of our technologies, products and processes; |
| • | public attitudes and environmental concerns regarding the planting of oil palm trees, which may contribute to deforestation and sustainability issues; and |
| • | governmental reaction to negative publicity concerning feedstocks produced on land which could be used to grow food or feedstocks extracted from trees in tropical rainforests, which could result in greater government regulation of feedstock sources. |
28
Table of Contents
If we lose key personnel, including key management and scientific personnel, or are unable to attract additional personnel, it could delay our product development programs or harm our research and development efforts, making it more difficult for us to pursue partnerships or to develop products.
Our business is complex and we intend to target a variety of markets. Therefore, it is critical that our management team and employee workforce are knowledgeable in the areas in which we operate. The loss of any key member of our management, including our named executive officers, or the failure to attract or retain other key employees who possess the requisite expertise for the conduct of our business, could prevent us from developing and commercializing our products for our target markets and from entering into partnerships or licensing arrangements to execute our business strategy. In addition, the loss of any key scientific staff, or the failure to attract or retain other key scientific employees, could prevent us from developing and commercializing our products for our target markets and from entering into partnerships or licensing arrangements to execute our business strategy. We may not be able to attract or retain qualified employees in the future due to the intense competition for qualified personnel among chemical companies and other technology-based businesses or due to the limited availability of personnel with the qualifications or experience necessary for our specialty chemical and intermediate chemical business. If we are not able to attract and retain the necessary personnel to accomplish our business objectives, we may experience staffing constraints that will adversely affect our ability to meet the demands of our partners and customers in a timely fashion or to support our internal research and development programs. In particular, our product and process development programs are dependent on our ability to attract and retain highly skilled scientists and engineers. Competition for experienced scientists, engineers and other technical personnel from numerous companies and academic and other research institutions may limit our ability to do so on acceptable terms. All of our employees are at-will employees, which means that either the employee or we may terminate their employment at any time.
Our planned activities will require additional expertise in specific industries and areas applicable to the products and processes developed through our technology platform or acquired through strategic or other transactions, especially in the end markets that we seek to penetrate. These activities will require the addition of new personnel and the development of additional expertise by existing personnel. The inability to attract personnel with appropriate skills or to develop the necessary expertise may have a material adverse effect on our business, financial condition or results of operations.
We do not currently have a hedging strategy to mitigate the impact of foreign currency or feedstock price volatility. In the event we implement such a strategy, it may not effectively mitigate the impact of such volatility and our hedging activities could result in losses and may limit potential gains.
We have entered into supply and risk management agreements with Cargill, who currently supplies the majority of our feedstocks. Cargill uses its own risk management services, which we cannot direct, when acquiring the feedstocks it provides to us under our feedstock supply and risk management agreements. For feedstocks not provided by Cargill, we do not currently use derivative instruments or otherwise engage in hedging strategies to mitigate the impact of volatility in foreign currencies or feedstock prices for feedstock (including the feedstock to be provided by Wilmar to the Indonesia facility). In the future, we may elect to enter into hedging strategies or purchase derivatives. However, any hedging strategies that we enter into may not be successful, may not mitigate the impact of volatility in foreign currencies or feedstock prices and may result in losses or limit potential gains. Furthermore, the Wilmar JV would need to approve any hedging strategy adopted by the Wilmar JV, which would also require that Wilmar consent to any such strategy. In the future we may also elect to not hedge our exposures to foreign currencies or feedstock prices and volatility in such prices could have a material adverse effect on our business, results of operations or financial condition.
We may be sued for product liability.
The design, development, manufacture and sale of our products involve an inherent risk of product liability claims and the associated adverse publicity. We may be named directly in product liability suits relating to the chemicals we produce or products that are produced using our specialty chemicals or intermediate chemicals.
29
Table of Contents
These claims could be brought by various parties, including customers who purchase products directly from us, other companies who purchase products from our customers or by the end users of products produced using our chemicals. We could also be named as co-parties in product liability suits that are brought against our toll manufacturers who manufacture our specialty chemicals and intermediate chemicals. Insurance coverage is expensive and may be difficult to obtain, and may not be available in the future on acceptable terms, or at all. We cannot assure you that our toll manufacturers will have adequate insurance coverage to cover against potential claims. In addition, if the coverage limits of our insurance policies are not adequate, a claim brought against us, whether covered by insurance or not, may have a material adverse effect on our business, financial condition and results of operations. We have agreed to indemnify some of our customers for certain claims that may arise out of the use of our products, which could expose us to significant liabilities and have a material adverse effect on our business, financial condition and results of operations.
Business interruptions could delay us in the process of developing our products and could disrupt our sales.
We are vulnerable to events that could disrupt our operations, such as riots, civil disturbances, war, terrorist acts and other events beyond our control. We do not have a detailed disaster recovery plan. In addition, we may not carry sufficient business interruption insurance to compensate us for losses that may occur. Any losses or damages we incur would have a material adverse effect on our business, financial condition and results of operations.
The Indonesia facility and the Mississippi facility are located in regions that make us vulnerable to risks associated with damage or business interruptions from natural disasters.
We may be affected by delays or interruptions in constructing or repurposing, as applicable, and operating the biorefineries as a result of natural disasters, such as tropical cyclones, tsunamis, flooding and earthquakes. Such disturbances could in the future have any or all of the following adverse effects on our business:
| • | interruptions to our operations as we suspend construction or production in advance of rising river levels or approaching storms; |
| • | damage to our facilities and equipment, including damage that disrupts or delays our construction or production; |
| • | disruption to the transportation systems we rely upon to deliver our products to customers; and |
| • | damage to or disruption of the facilities of our customers or partners that prevents us from taking delivery of our products. |
Any of these could have a material adverse effect on our business, financial condition and results of operations.
We may be subject to interruptions or failures in our information technology systems.
We currently rely on information technology systems to run our business, and as we complete production of our manufacturing facilities, we will transition to and rely on sophisticated information technology systems and infrastructure to support our commercial production operations, including process control technology at our biorefineries. Any of these systems may be susceptible to outages due to fire, floods, power loss, telecommunications failures and similar events. The failure of any of our information technology systems may cause disruptions in our operations, adversely affecting our sales and profitability.
A terrorist attack or armed conflict could harm our business.
Terrorist activities, anti-terrorist efforts and other armed conflicts could adversely affect the global economy and could prevent us from meeting financial and other obligations. We could experience loss of business, delays or defaults in payments from payors or disruptions of fuel supplies and markets if pipelines, production facilities,
30
Table of Contents
processing plants or refineries are direct targets or indirect casualties of an act of terror or war. Such activities could reduce feedstock supplies or economic growth that drives demand for our products. Terrorist activities and the threat of potential terrorist activities and any resulting economic downturn could adversely affect our results of operations, impair our ability to raise capital or otherwise adversely impact our ability to realize certain business strategies.
If we fail to maintain an effective system of internal controls, we might not be able to report our financial results accurately or prevent fraud; in that case, our stockholders could lose confidence in our financial reporting, which would harm our business and could negatively impact the price of our stock.
Effective internal controls are necessary for us to provide reliable financial reports and prevent fraud. In addition, Section 404 of the Sarbanes-Oxley Act of 2002 (the “Sarbanes-Oxley Act”) will require us and, in the event we become an accelerated filer, our independent registered public accounting firm to evaluate and report on our internal control over financial reporting beginning with our Annual Report on Form 10-K for the year ending December 31, . The process of implementing our internal controls and complying with Section 404 will be expensive and time consuming, and will require significant attention of management. We cannot be certain that these measures will ensure that we implement and maintain adequate controls over our financial processes and reporting in the future. Even if we conclude, and our independent registered public accounting firm concurs, that our internal control over financial reporting provides reasonable assurance regarding the reliability of financial reporting and the preparation of financial statements for external purposes in accordance with generally accepted accounting principles, because of its inherent limitations, internal control over financial reporting may not prevent or detect fraud or misstatements. Failure to implement required new or improved controls, or difficulties encountered in their implementation, could harm our results of operations or cause us to fail to meet our reporting obligations. If we or our independent registered public accounting firm discover a material weakness, the disclosure of that fact, even if quickly remedied, could reduce the market’s confidence in our financial statements and harm our stock price. In addition, a delay in compliance with Section 404 could subject us to a variety of administrative sanctions, including Securities and Exchange Commission (“SEC”) action, ineligibility for short-form resale registration, the suspension or delisting of our common stock from the stock exchange on which it is listed and the inability of registered broker-dealers to make a market in our common stock, which would further reduce our stock price and could harm our business.
Risks Related to This Offering and Ownership of Our Common Stock
An active public market for our common stock may not develop following this offering, which could limit your ability to sell your shares of our common stock at an attractive price, or at all.
Prior to this offering, there has been no public market for our common stock. We cannot predict the extent to which investor interest in our company will lead to the development of an active trading market in our common stock or how liquid that market might become. An active public market for our common stock may not develop or be sustained after the offering. If an active public market does not develop or is not sustained, it may be difficult for you to sell your share of common stock at a price that is attractive to you, or at all.
Market volatility may affect our stock price and the value of your investment.
Following the completion of this offering, the market price for our common stock is likely to be volatile, in part because our shares have not been previously traded publicly. In addition, the market price of our common stock may fluctuate significantly in response to a number of factors, most of which we cannot predict or control, including:
| • | announcements of new product launches, commercial relationships, acquisitions or other events by us or our competitors; |
| • | failure of any of our products to achieve commercial success; |
| • | fluctuations in stock market prices and trading volumes of securities of similar companies; |
31
Table of Contents
| • | general market conditions and overall fluctuations in U.S. equity markets; |
| • | variations in our operating results, or the operating results of our competitors; |
| • | changes in our financial guidance or securities analysts’ estimates of our financial performance; |
| • | changes in accounting principles; |
| • | sales of large blocks of our common stock, including sales by our executive officers, directors and significant stockholders; |
| • | additions or departures of any of our key personnel; |
| • | announcements related to litigation; |
| • | changing legal or regulatory developments in the United States and other countries; and |
| • | discussion of us or our stock price by the financial press and in online investor communities. |
In addition, the stock market in general, and The NASDAQ Global Market (“NASDAQ”) in particular, have experienced substantial price and volume volatility that is often seemingly unrelated to the operating performance of particular companies. These broad market fluctuations may cause the trading price of our common stock to decline. In the past, securities class action litigation has often been brought against a company after a period of volatility in the market price of its common stock. We may become involved in this type of litigation in the future. Any securities litigation claims brought against us could result in substantial expenses and the diversion of our management’s attention from our business.
If you purchase shares of common stock sold in this offering, you will incur immediate and substantial dilution.
If you purchase shares of common stock in this offering, you will incur immediate and substantial dilution in the amount of $ per share, because the initial public offering price of $ is substantially higher than the pro forma net tangible book value per share of our outstanding common stock. This dilution is due in large part to the fact that our earlier investors paid substantially less than the initial public offering price when they purchased their shares. In addition, you may also experience additional dilution upon future equity issuances or the exercise of stock options to purchase common stock granted to our employees, directors and consultants under our stock option and equity incentive plans. For additional information, see “Dilution.”
Our quarterly operating results may fluctuate significantly in the future.
Our quarterly operating results may fluctuate significantly in the future. As a result of these fluctuations, we may fail to meet or exceed the expectations of research analysts covering the company or of investors, which could cause our stock price to decline.
Future quarterly fluctuations, many of which are beyond our control, may result from a number of factors, including:
| • | the timing and cost associated with the completion of our manufacturing facilities; |
| • | fluctuations in the prices of our feedstocks and our end products; |
| • | the degree of market acceptance of our products; |
| • | the timing associated with the launch of new products; |
| • | changes in demand for our products; |
| • | changes in product development costs due to the achievement of certain milestones under third-party development agreements; |
32
Table of Contents
| • | unanticipated regulatory delays in connection with the development of new products; |
| • | the level and timing of expenses for product development and sales, general and administrative expenses; |
| • | competition by existing competitors and new entrants to the markets for our products; |
| • | our continued commercial success with our existing products and success in identifying and sourcing new product opportunities; |
| • | our ability to control costs; |
| • | our ability to attract and retain qualified personnel; |
| • | changes in our strategy; |
| • | foreign exchange fluctuations; and |
| • | general economic conditions. |
Based on factors (including those listed above), we believe our future operating results will vary significantly from quarter to quarter and year to year. As a result, quarter-to-quarter and year-to-year comparisons of operating results are not necessarily meaningful nor do they indicate what our future performance will be.
Following this offering, investment funds managed by TPG Capital and Naxos Capital Partners S.C.A. SICAR will beneficially own a substantial percentage of our common stock, which may prevent new investors from influencing significant corporate decisions.
Upon completion of this offering, investment funds managed by TPG Capital and Naxos Capital Partners S.C.A. SICAR (“Naxos”) will beneficially own approximately shares, or %, and shares, or %, respectively, of our outstanding common stock. As a result, TPG Capital and Naxos will, for the foreseeable future, have significant influence over all matters requiring stockholder approval, including election of directors, adoption or amendments to equity-based incentive plans, amendments to our certificate of incorporation and certain mergers, acquisitions and other change-of-control transactions. The ownership by TPG Capital and Naxos of a large amount of our voting power may have an adverse effect on the price of our common stock. Following the completion of this offering, investment funds managed by TPG Capital and Naxos will continue to have representatives serving on our board of directors. The interests of TPG Capital and Naxos may not be consistent with your interests as a stockholder.
Future sales of our common stock, or the perception in the public markets that these sales may occur, may cause our stock price to decline.
Upon completion of this offering, there will be shares of our common stock outstanding. Of these, shares being sold in this offering will be freely tradable immediately after this offering (except for any shares purchased by affiliates, if any) and approximately shares may be sold upon expiration of lock-up agreements 180 days after the date of this prospectus (subject in some cases to volume limitations) and the remaining shares may be freely tradable. In addition, as of September 30, 2011, we had outstanding options to purchase 2,304,484 shares of common stock that, if exercised, will result in these additional shares becoming available for sale upon expiration of the lock-up agreements. A large portion of these shares and options are held by a small number of persons and investment funds. Sales by these stockholders or optionholders of a substantial number of shares, or the perception that such sales may occur, after this offering could significantly reduce the market price of our common stock. Moreover, certain holders of shares of common stock have rights, subject to some conditions, to require us to file registration statements covering the shares they currently hold, or to include these shares in registration statements that we may file for ourselves or other stockholders.
We also intend to register all common stock that we may issue under our 2007 Plan and the 2012 Plan. Upon the completion of this offering, an aggregate of shares of our common stock will be reserved for
33
Table of Contents
future issuance under our 2007 Plan and of shares of our common stock will be reserved for future issuance under our 2012 Plan. Once we register these shares, which we plan to do shortly after the completion of this offering, they can be freely sold in the public market upon issuance, subject to the lock-up agreements referred to above. If a large number of these shares are sold in the public market, the sales could reduce the trading price of our common stock.
We will have broad discretion in how we use the proceeds of this offering and we may not use these proceeds effectively. This could affect our profitability and cause our share price to decline.
Our officers and board of directors will have considerable discretion in the application of the net proceeds of this offering, and you will not have the opportunity, as part of your investment decision, to assess whether we are using the proceeds appropriately. We currently intend to use the net proceeds for general corporate purposes, which could include a variety of uses such as funding working capital, operating expenses, the continued development of our product pipeline and portfolio, the maintenance and expansion of our current collaboration arrangements, the strengthening of our existing commercial organization and the selective pursuit of business development opportunities in our focus segment areas. From time to time, for example, we will consider acquisitions or investments if a suitable opportunity arises, in which case a portion of the proceeds may be used to fund such an acquisition or investment. We have no commitments or understandings to make any such acquisition or investment. We may use the net proceeds for corporate purposes that do not improve our profitability or increase our market value, which could cause our share price to decline.
We will incur significantly increased costs as a result of operating as a public company, and our management will be required to divert attention from product development to devote substantial time to new compliance initiatives.
As a public company, we will incur significant legal, accounting and other expenses that we did not incur as a private company. In addition, the Sarbanes-Oxley Act, as well as rules subsequently implemented by the SEC and NASDAQ, have imposed various requirements on public companies, including establishment and maintenance of effective disclosure and financial controls and changes in corporate governance practices. Our management and other personnel will need to devote a substantial amount of time to these compliance initiatives. Moreover, these rules and regulations will increase our legal and financial compliance costs and will make some activities more time-consuming and costly. For example, we expect these rules and regulations to make it more difficult and more expensive for us to obtain director and officer liability insurance, and we may be required to accept reduced policy limits and coverage or incur substantially higher costs to obtain the same or similar coverage. As a result, it may be more difficult for us to attract and retain qualified people to serve on our board of directors, our board committees or as executive officers.
The Sarbanes-Oxley Act requires, among other things, that we maintain effective internal controls for financial reporting and disclosure. In particular, commencing in fiscal year , we must perform system and process evaluation and testing of our internal controls over financial reporting to allow management and our independent registered public accounting firm to report on the effectiveness of our internal controls over financial reporting, as required by Section 404 of the Sarbanes-Oxley Act. Our testing, or the subsequent testing by our independent registered public accounting firm, may reveal deficiencies in our internal controls over financial reporting that are deemed to be material weaknesses. We expect to incur significant expenses and devote substantial management effort toward ensuring compliance with Section 404. We currently do not have an internal audit function, and we will need to hire additional accounting and financial staff with appropriate public company experience and technical accounting knowledge. Moreover, if we are not able to comply with the requirements of Section 404 in a timely manner, or if we or our independent registered public accounting firm identifies deficiencies in our internal controls that are deemed to be material weaknesses, the market price of our stock could decline and we could be subject to sanctions or investigations by NASDAQ, the SEC or other regulatory authorities, which would entail expenditure of additional financial and management resources.
34
Table of Contents
Anti-takeover provisions in our charter documents and under Delaware corporate law might discourage or delay acquisition attempts for us that you might consider favorable.
Provisions in our amended and restated certificate of incorporation and bylaws, each of which we intend to adopt in connection with this offering, may make the acquisition of our company more difficult without the approval of our board of directors. These provisions include:
| • | establish a classified board of directors so that not all members of our board of directors are elected at one time; |
| • | authorize the issuance of undesignated preferred stock, the terms of which may be established and the shares of which may be issued without stockholder approval, and which may include super voting, special approval, dividend or other rights or preferences superior to the rights of the holders of common stock; |
| • | prohibit stockholder action by written consent, which requires all stockholder actions to be taken at a meeting of our stockholders, unless such action is recommended by all directors then in office; |
| • | establish advance notice requirements for nominations for elections to our board or for proposing matters that can be acted upon by stockholders at stockholder meetings; and |
| • | require at least 662/3% of the outstanding common stock to amend the amended and restated certificate of incorporation or the amended and restated bylaws. |
In addition, we are governed by the provisions of Section 203 of the Delaware General Corporation Law (the “DGCL”), which limits the ability of stockholders owning in excess of 15% of our outstanding voting stock to merge or combine with us. Although we believe these provisions collectively provide for an opportunity to obtain greater value for stockholders by requiring potential acquirers to negotiate with our board of directors, they would apply even if an offer rejected by our board were considered beneficial by some stockholders. In addition, these provisions may frustrate or prevent any attempts by our stockholders to replace or remove our current management by making it more difficult for stockholders to replace members of our board of directors, which is responsible for appointing the members of our management.
35
Table of Contents
This prospectus contains forward-looking statements that are subject to risks and uncertainties. All statements other than statements of historical fact included in this prospectus are forward-looking statements. Forward-looking statements give our current expectations and projections relating to our financial condition, results of operations, plans, objectives, future performance and business. You can identify forward-looking statements by the fact that they do not relate strictly to historical or current facts. These statements may include words such as “anticipate,” “estimate,” “expect,” “project,” “plan,” “intend,” “believe,” “may,” “will,” “should,” “can have,” “likely” and other words and terms of similar meaning in connection with any discussion of the timing or nature of future operating or financial performance or other events. For example, all statements we make relating to our estimated and projected costs, expenditures, cash flows, growth rates and financial results, our plans and objectives for future operations, growth or initiatives, strategies or the expected outcome or impact of pending or threatened litigation are forward-looking statements. All forward-looking statements are subject to risks and uncertainties that may cause actual results to differ materially from those that we expected, including:
| • | we have a limited operating history and have incurred significant losses to date, anticipate continuing to incur losses for a period of time, and may never achieve or sustain profitability; |
| • | we may be unable to continue our business or may be prevented from operating our business as it is currently conducted if we are unsuccessful in defending against any claims by competitors or others that we or Materia are infringing upon their intellectual property rights; |
| • | if either the Indonesia facility or the Mississippi facility is not completed in a timely manner for any reason, our ability to produce specialty chemicals and intermediate chemicals could be materially adversely affected; |
| • | we lack direct experience operating world-scale commercial biorefineries, and may encounter substantial difficulties operating such biorefineries or expanding our business; |
| • | we may be unable to produce specialty chemicals and intermediate chemicals that meet our customers’ needs or specifications; |
| • | our specialty chemicals may not be accepted by the market; and |
| • | we are dependent on our partners, and our failure to successfully manage these relationships could delay or prevent us from developing and commercializing many of our products and achieving or sustaining profitability. |
We derive many of our forward-looking statements from our operating budgets and forecasts, which are based upon many detailed assumptions. While we believe that our assumptions are reasonable, we caution that it is very difficult to predict the impact of known factors, and it is impossible for us to anticipate all factors that could affect our actual results. Important factors that could cause actual results to differ materially from our expectations, or cautionary statements, are disclosed under the sections entitled “Risk Factors” and “Management’s Discussion and Analysis of Financial Condition and Results of Operations” in this prospectus. All written and oral forward-looking statements attributable to us, or persons acting on our behalf, are expressly qualified in their entirety by the cautionary statements as well as other cautionary statements that are made from time to time in our other SEC filings and public communications. You should evaluate all forward-looking statements made in this prospectus in the context of these risks and uncertainties.
We caution you that the important factors referenced above may not be all of the factors that are important to you. In addition, we cannot assure you that we will realize the results or developments we expect or anticipate or, even if substantially realized, that they will result in the consequences or affect us or our operations in the way we expect. The forward-looking statements included in this prospectus are made only as of the date hereof. We undertake no obligation to publicly update or revise any forward-looking statement as a result of new information, future events or otherwise, except as otherwise required by law.
36
Table of Contents
Market data and certain industry data and forecasts included in this prospectus were obtained or derived from internal company surveys, market research, consultant surveys, publicly available information, reports of governmental agencies and industry publications and surveys, including ACME-Hardesty Co., The Freedonia Group, Inc., ICIS, The Jacobsen, the Organization for Economic Cooperation and Development (the “OECD”), and the United States Department of Agriculture (“USDA”). Industry surveys, publications, consultant surveys and forecasts generally state that the information contained therein has been obtained from sources believed to be reliable, but that the accuracy and completeness of such information is not guaranteed. We have not independently verified any of the data from third-party sources, nor have we ascertained the underlying economic assumptions relied upon therein. Similarly, internal surveys, market research, market definitions and industry forecasts, which we believe to be reliable based upon our management’s knowledge of the industry, have not been independently verified. We believe that the market opportunity and market size information included in this prospectus is generally reliable; however, these data involve a number of assumptions and limitations. In addition, projections, assumptions and estimates of our future performance and the future performance of the industry in which we operate are necessarily subject to a high degree of uncertainty and risk due to a variety of factors, including those described in “Risk Factors” and elsewhere in this prospectus. These and other factors could cause results to differ materially from those expressed in the estimates made by the independent parties and by us. This prospectus may only be used for the purpose for which it has been published.
37
Table of Contents
We estimate that the net proceeds from our issuance and sale of shares of common stock in this offering will be approximately $ million, assuming an initial public offering price of $ per share, which is the midpoint of the price range listed on the cover page of this prospectus, after deducting underwriting discounts and commissions and estimated offering expenses payable by us.
A $1.00 increase (decrease) in the assumed initial public offering price of $ per share would increase (decrease) our net proceeds from this offering by approximately $ million, assuming that the number of shares offered by us, as set forth on the cover page of this prospectus, remains the same, after deducting the underwriting discounts and commissions and estimated offering expenses payable by us.
If the underwriters exercise their over-allotment option in full, we estimate that the net proceeds from this offering will be approximately $ million, assuming an initial public offering price of $ per share, which is the midpoint of the price range listed on the cover page of this prospectus, after deducting underwriting discounts and commissions and estimated offering expenses payable by us.
We expect to use substantially all of the net proceeds for general corporate purposes, which we expect to include funding capital expenditures, research and development, working capital, product development and operating expenses. As a result, our management will retain broad discretion over the allocation of the net proceeds from this offering.
We have not paid any dividends on our common stock since our initial incorporation. We currently intend to retain all available funds and any future earnings to fund the development and growth of our business and therefore we do not anticipate paying any cash dividends in the foreseeable future. Any future determination to pay dividends will be at the discretion of our board of directors and will depend upon our results of operations, financial condition, capital requirements and other factors that our board of directors deems relevant.
38
Table of Contents
The following table sets forth our cash and cash equivalents and our consolidated capitalization as of September 30, 2011 on:
| • | an actual basis; |
| • | a pro forma basis to give effect to the IPO Share Adjustments, including the conversion of all of the outstanding shares of our preferred stock into shares of common stock; and |
| • | a pro forma as adjusted basis to give effect to the IPO Share Adjustments our issuance and sale of shares of common stock in this offering at an initial public offering price of $ per share, which is the midpoint of the price range listed on the cover page of this prospectus, after deducting underwriting discounts and commissions and estimated offering expenses payable by us. |
You should read the following table in conjunction with the sections entitled “Use of Proceeds,” “Selected Historical Consolidated Financial Data,” “Management’s Discussion and Analysis of Financial Condition and Results of Operations” and our consolidated financial statements and related notes thereto included elsewhere in this prospectus.
| As of September 30, 2011 | ||||||||||||
| Actual | Pro Forma | Pro Forma As Adjusted(1) |
||||||||||
| (unaudited) | ||||||||||||
| (in thousands, except share data) | ||||||||||||
| Cash, cash equivalents and short-term investments |
$ | 90,402 | $ | $ | ||||||||
|
|
|
|
|
|
|
|||||||
| Preferred stock: |
||||||||||||
| Series A preferred stock, $0.0001 par value per share, no shares authorized, actual; no shares issued and outstanding, actual; no shares authorized, issued and outstanding, pro forma and pro forma as adjusted |
$ | — | $ | — | $ | — | ||||||
| Series B preferred stock, $0.0001 par value per share, 18,600,000 shares authorized, actual; 8,830,640 shares issued and outstanding, actual; no shares authorized, issued and outstanding, pro forma and pro forma as adjusted |
92,315 | — | — | |||||||||
| Series C preferred stock, $0.0001 par value per share, 7,200,000 shares authorized, actual; 5,649,718 shares issued and outstanding, actual; no shares authorized, issued and outstanding, pro forma and pro forma as adjusted |
71,748 | — | — | |||||||||
| Series D preferred stock, $0.0001 par value per share, 3,100,000 shares authorized, actual; 2,556,238 shares issued and outstanding, actual; no shares authorized, issued and outstanding, pro forma and pro forma as adjusted |
51,272 | — | — | |||||||||
|
|
|
|
|
|
|
|||||||
| Total preferred stock |
215,335 | — | — | |||||||||
| Shareholders’ equity: |
||||||||||||
| Common stock, $0.0001 par value per share, 34,500,000 shares authorized; 2,437,820 shares issued and outstanding, actual; shares authorized, shares issued and outstanding, pro forma; shares authorized shares issued and outstanding, pro forma as adjusted |
— | |||||||||||
| Preferred stock, $0.0001 par value per share; 28,900,000 shares authorized, 17,054,096 shares issued and outstanding, actual; shares authorized, no shares issued and outstanding, pro forma and pro forma as adjusted |
— | — | — | |||||||||
| Additional paid-in capital |
— | |||||||||||
| Accumulated other comprehensive income |
17 | |||||||||||
| Accumulated deficit |
(200,483 | ) | ||||||||||
|
|
|
|
|
|
|
|||||||
| Total company shareholders’ deficit |
(200,466 | ) | ||||||||||
|
|
|
|
|
|
|
|||||||
| Noncontrolling interest |
10,353 | |||||||||||
|
|
|
|
|
|
|
|||||||
| Total capitalization |
$ | (190,113 | ) | $ | $ | |||||||
|
|
|
|
|
|
|
|||||||
| (1) | Each $1.00 increase or decrease in the initial public offering price would increase or decrease, respectively, the amounts of cash, cash equivalents and short-term investments, additional paid-in capital and total capitalization by approximately $ million, assuming the number of shares offered by us, as set forth on the cover page of this prospectus, remains the same, after deducting the estimated underwriting discounts and commissions and estimated offering costs payable by us. |
39
Table of Contents
The number of shares of common stock to be outstanding after this offering is based on shares of our common stock outstanding as of September 30, 2011, as adjusted to give effect to the IPO Share Adjustments and excludes:
| • | shares of our common stock issuable upon the exercise of outstanding stock options at a weighted average exercise price of $2.13 per share, as of September 30, 2011; and |
| • | an aggregate of shares of our common stock reserved for future issuance under the 2012 Plan that we intend to adopt in connection with this offering. |
40
Table of Contents
Our pro forma net tangible book value (deficit) as of September 30, 2011 was approximately $ million, or approximately $ per share. Pro forma net tangible book value (deficit) per share represents the amount of our total tangible assets less the amount of our total liabilities, divided by the number of shares of common stock outstanding at September 30, 2011 after giving effect to the IPO Share Adjustments, prior to the sale of shares of common stock offered in this offering. Dilution in pro forma net tangible book value per share represents the difference between the amount per share paid by investors in this offering and the net tangible book value per share of our common stock outstanding immediately after this offering.
After giving effect to the sale of shares of common stock in this offering, based upon an initial public offering price of $ per share, after deducting underwriting discounts and commissions and estimated expenses payable by us in connection with this offering, after giving effect to the IPO Share Adjustments, our pro forma as adjusted net tangible book value (deficit) as of September 30, 2011 would have been approximately $ million, or $ per share of common stock. This represents an immediate increase in pro forma net tangible book value (deficit) of $ per share to existing stockholders and immediate dilution of $ per share to new investors purchasing shares of common stock in this offering at the initial public offering price.
The following table illustrates this per share dilution:
| Initial public offering price per share |
$ | |||
| Pro forma net tangible book value (deficit) per share as of September 30, 2011 |
||||
| Increase in net tangible book value (deficit) per share attributable to new investors |
||||
|
|
|
|||
| Pro forma as adjusted net tangible book value per share as of September 30, 2011 (after giving effect to this offering) |
||||
|
|
|
|||
| Dilution per share to new investors |
$ | |||
|
|
|
The following table summarizes, as of September 30, 2011, on a pro forma as adjusted basis giving effect to the sale of shares of common stock in this offering, after giving effect to the IPO Share Adjustments, the number of shares of our common stock purchased from us, the aggregate cash consideration paid to us and the average price per share paid to us by existing stockholders and to be paid by new investors purchasing shares of our common stock from us in this offering at an initial public offering price of $ per share, after deducting estimated underwriting discounts and commissions and offering expenses payable by us in connection with this offering.
| Shares Purchased | Total Consideration | Average Price Per Share |
||||||||||||||||
| Number | Percentage | Amount | Percentage | |||||||||||||||
| Existing stockholders |
% | $ | % | $ | ||||||||||||||
| New investors |
||||||||||||||||||
|
|
|
|
|
|
|
|
||||||||||||
| Total |
100 | % | $ | 100 | % | |||||||||||||
|
|
|
|
|
|
|
|
||||||||||||
Except as otherwise indicated, the discussion and tables above assume no exercise of the underwriters’ option to purchase additional shares and no exercise of any outstanding options. If the underwriters’ option to purchase additional shares is exercised in full, our existing stockholders would own approximately % and our new investors would own approximately % of the total number of shares of our common stock outstanding after this offering.
41
Table of Contents
The tables and calculations above are based on shares of common stock outstanding as of September 30, 2011 (after giving effect to the IPO Share Adjustments) and exclude:
| • | shares of our common stock issuable upon the exercise of outstanding stock options at a weighted average exercise price of $ per share, as of September 30, 2011; and |
| • | an aggregate of shares of our common stock reserved for future issuance under the 2012 Plan that we intend to adopt in connection with this offering. |
To the extent that any outstanding options are exercised or if new options or other equity incentive grants are issued in the future with an exercise price or purchase price below the initial public offering price, new investors will experience further dilution.
42
Table of Contents
SELECTED HISTORICAL CONSOLIDATED FINANCIAL DATA
The following tables set forth our selected historical consolidated financial data as of and for the periods indicated. We have derived the selected historical consolidated financial data as of and for the period or fiscal years, as applicable, ended December 31, 2006, November 19, 2007 and December 31, 2007, 2008, 2009 and 2010 from our consolidated financial statements for such periods or fiscal years, as applicable, that are included elsewhere in this prospectus. We have derived the selected historical consolidated financial data as of September 30, 2011 and for the nine months ended September 30, 2010 and 2011 from our unaudited condensed consolidated financial statements included elsewhere in this prospectus. Our unaudited condensed consolidated financial statements have been prepared on the same basis as our audited combined financial statements, and in our opinion, include all adjustments, consisting of normal and recurring adjustments that we consider necessary for a fair presentation of our financial position and results of operations for such periods. Operating results for the nine months ended September 30, 2010 and 2011 are not necessarily indicative of results for a full year or for any other period.
We began operations on November 20, 2007 when we acquired (1) the NatureWax business line of Cargill’s Dressing Sauces and Oils Business on a carve-out basis and (2) the metathesis business operated by Cargill. The fiscal year ended December 31, 2006 and the period ended November 19, 2007 are referred to as the “Predecessor” periods and all other periods presented are referred to as the “Successor” periods in this prospectus. Due to our business being operated by Cargill during the Predecessor period, the financial statements for the Successor periods are not comparable to those of the Predecessor periods included in this prospectus. Our consolidated financial statements of and for the fiscal year ended December 31, 2006 and for the period ended November 19, 2007 were prepared on a carve-out basis from Cargill. The carve-out consolidated financial statements include allocations of certain costs from Cargill. In the Successor periods, we no longer incur these allocated costs, but we do incur certain expenses as a standalone company for similar functions. These allocated costs were based upon various assumptions and estimates and actual results may differ from these allocated costs, assumptions and estimates. Accordingly, the carve-out consolidated financial statements may not be a comparable presentation of our financial position or results of operations as if we had operated as a standalone entity during the Predecessor periods. For additional information, see “Risk Factors—Risks Related to Our Business—We have a limited operating history and have incurred significant losses to date, anticipate continuing to incur losses for a period of time, and may never achieve or sustain profitability.”
43
Table of Contents
The selected historical consolidated data presented below should be read in conjunction with the sections entitled “Management’s Discussion and Analysis of Financial Condition and Results of Operations” and the consolidated financial statements and the related notes thereto and other financial data included elsewhere in this prospectus.
| Predecessor | Successor | |||||||||||||||||||||||||||||||||
| Year Ended December 31, 2006 |
Period from January 1, 2007 to November 19, 2007 |
Period
from November 20, 2007 to December 31, 2007 |
||||||||||||||||||||||||||||||||
| Years Ended December 31, |
Nine Months
Ended September 30, |
|||||||||||||||||||||||||||||||||
| 2008 | 2009 | 2010 | 2010 | 2011 | ||||||||||||||||||||||||||||||
| (unaudited) | ||||||||||||||||||||||||||||||||||
| (in thousands, except per share data) | (in thousands, except per share data) | |||||||||||||||||||||||||||||||||
| Statement of Operations Data: |
||||||||||||||||||||||||||||||||||
| Product sales |
$ | 12,291 | $ | 16,285 | $ | 2,074 | $ | 18,913 | $ | 12,186 | $ | 20,227 | $ | 13,303 | $ | 16,319 | ||||||||||||||||||
| Other revenue |
— | — | — | — | — | — | — | 903 | ||||||||||||||||||||||||||
| Grants |
— | — | — | — | — | 961 | 732 | 604 | ||||||||||||||||||||||||||
|
|
|
|
|
|
|
|
|
|
|
|
|
|
|
|
|
|||||||||||||||||||
| Total revenues |
12,291 | 16,285 | 2,074 | 18,913 | 12,186 | 21,188 | 14,035 | 17,826 | ||||||||||||||||||||||||||
| Operating expenses: |
||||||||||||||||||||||||||||||||||
| Cost of product sales |
10,740 | 16,500 | 2,017 | 14,425 | 11,860 | 17,824 | 11,603 | 16,751 | ||||||||||||||||||||||||||
| Cost of other revenue |
— | — | — | — | — | — | — | 628 | ||||||||||||||||||||||||||
| Selling, general and administrative |
3,996 | 1,670 | 709 | 8,086 | 8,168 | 11,356 | 8,457 | 15,260 | ||||||||||||||||||||||||||
| Research and development |
4,095 | 1,379 | 10,153 | 5,539 | 7,760 | 8,896 | 6,728 | 6,383 | ||||||||||||||||||||||||||
| Intangible asset amortization |
— | — | 167 | 1,506 | 1,506 | 1,506 | 1,129 | 1,129 | ||||||||||||||||||||||||||
|
|
|
|
|
|
|
|
|
|
|
|
|
|
|
|
|
|||||||||||||||||||
| Total operating expenses |
18,831 | 19,549 | 13,046 | 29,556 | 29,294 | 39,582 | 27,917 | 40,151 | ||||||||||||||||||||||||||
|
|
|
|
|
|
|
|
|
|
|
|
|
|
|
|
|
|||||||||||||||||||
| Loss from operations |
(6,540 | ) | (3,264 | ) | (10,972 | ) | (10,643 | ) | (17,108 | ) | (18,394 | ) | (13,882 | ) | (22,325 | ) | ||||||||||||||||||
| Gain (loss) on change in fair value of warrants |
— | — | 199 | 1,787 | 652 | (4,506 | ) | (3,172 | ) | (98,823 | ) | |||||||||||||||||||||||
| Interest expense |
— | — | — | — | (437 | ) | (4,415 | ) | (3,289 | ) | — | |||||||||||||||||||||||
| Other income (expense), net |
— | — | (52 | ) | 636 | 56 | 14 | 4 | 21 | |||||||||||||||||||||||||
| Income taxes |
33 | 12 | (1,505 | ) | — | — | — | — | — | |||||||||||||||||||||||||
|
|
|
|
|
|
|
|
|
|
|
|
|
|
|
|
|
|||||||||||||||||||
| Net loss |
(6,573 | ) | (3,276 | ) | (9,320 | ) | (8,220 | ) | (16,837 | ) | (27,301 | ) | (20,339 | ) | (121,127 | ) | ||||||||||||||||||
| Less net loss attributable to noncontrolling interest |
— | — | — | — | — | 10 | 1 | 82 | ||||||||||||||||||||||||||
|
|
|
|
|
|
|
|
|
|
|
|
|
|
|
|
|
|||||||||||||||||||
| Net loss attributable to the company |
(6,573 | ) | (3,276 | ) | (9,320 | ) | (8,220 | ) | (16,837 | ) | (27,291 | ) | (20,338 | ) | (121,045 | ) | ||||||||||||||||||
| Less accretion on Series A and B preferred stock and cumulative dividends on Series B, C and D preferred stock |
— | — | (713 | ) | (6,689 | ) | (6,876 | ) | (6,349 | ) | (4,409 | ) | (10,731 | ) | ||||||||||||||||||||
|
|
|
|
|
|
|
|
|
|
|
|
|
|
|
|
|
|||||||||||||||||||
| Net loss available to our common shareholders |
$ | (6,573 | ) | $ | (3,276 | ) | $ | (10,033 | ) | $ | (14,909 | ) | $ | (23,713 | ) | $ | (33,640 | ) | $ | (24,747 | ) | $ | (131,776 | ) | ||||||||||
|
|
|
|
|
|
|
|
|
|
|
|
|
|
|
|
|
|||||||||||||||||||
| Net loss per share attributable to our common shareholders, basic and diluted |
$ | — | $ | — | $ | (66.89 | ) | $ | (99.39 | ) | $ | (33.08 | ) | $ | (14.64 | ) | $ | (10.83 | ) | $ | (54.96 | ) | ||||||||||||
|
|
|
|
|
|
|
|
|
|
|
|
|
|
|
|
|
|||||||||||||||||||
| Pro forma net loss per share attributable to our common shareholders(1) |
||||||||||||||||||||||||||||||||||
|
|
|
|
|
|||||||||||||||||||||||||||||||
| Predecessor | Successor | |||||||||||||||||||||||||||||||||
| December
31, 2006 |
November 19, 2007 |
December 31, | September 30, | |||||||||||||||||||||||||||||||
| 2007 | 2008 | 2009 | 2010 | 2010 | 2011 | |||||||||||||||||||||||||||||
| (unaudited) | ||||||||||||||||||||||||||||||||||
| (in thousands) | (in thousands) | |||||||||||||||||||||||||||||||||
| Balance Sheet Data: |
||||||||||||||||||||||||||||||||||
| Cash, cash equivalents and short term investments |
$ | — | $ | — | $ | 19,862 | $ | 14,946 | $ | 7,807 | $ | 77,358 | $ | 14,130 | $ | 90,402 | ||||||||||||||||||
| Working capital(2) |
904 | 646 | 1,476 | (1,326 | ) | 198 | 1,379 | 1,514 | 2,598 | |||||||||||||||||||||||||
| Total assets |
943 | 1,830 | 43,768 | 38,181 | 31,278 | 103,390 | 40,072 | 146,197 | ||||||||||||||||||||||||||
| Total debt |
— | — | — | — | 9,959 | 100 | 31,836 | 107 | ||||||||||||||||||||||||||
| Preferred stock |
— | — | 42,548 | 53,007 | 47,991 | 154,429 | 52,400 | 215,335 | ||||||||||||||||||||||||||
| Total company shareholders’ deficit |
— | — | (9,759 | ) | (24,340 | ) | (35,937 | ) | (67,775 | ) | (66,835 | ) | (200,483 | ) | ||||||||||||||||||||
| (1) | Gives effect to the IPO Share Adjustments, but not this offering. |
| (2) | Current assets (excluding cash, cash equivalents and short-term investments) less current liabilities (excluding current debt). |
44
Table of Contents
MANAGEMENT’S DISCUSSION AND ANALYSIS OF
FINANCIAL CONDITION AND RESULTS OF OPERATIONS
The following discussion summarizes the significant factors affecting the consolidated operating results, financial condition, liquidity and cash flows of our company as of and for the periods presented below. The following discussion and analysis should be read in conjunction with the consolidated financial statements and the related notes thereto included elsewhere in this prospectus. This discussion contains forward-looking statements that are based on the beliefs of our management, as well as assumptions made by, and information currently available to, our management. Actual results could differ materially from those discussed in or implied by forward-looking statements as a result of various factors, including those discussed below and elsewhere in this prospectus, particularly in the section entitled “Risk Factors.”
Overview
We produce high performance specialty chemicals and intermediate chemicals from renewable natural oils. The specialty chemicals that we currently produce and intend to produce address a potential market size that we estimate to be $176 billion. We produce these chemicals using our proprietary, low-cost, capital efficient production process, which utilizes Nobel Prize-winning innovations in metathesis catalysis. Our process uses a highly efficient and selective metathesis catalyst to break down the complex molecules found in natural oils and recombine the fragments to produce high value chemicals. We can produce these chemicals at lower cost and with lower capital investment than conventional processes positioning us to deliver attractive returns on capital. We have established strategic partnerships with market leaders to accelerate the commercialization and rapid deployment of our technology.
Our specialty chemicals have unique and desirable functional attributes previously unavailable in the marketplace. We believe these products will be key performance ingredients and building blocks used in large end markets including detergents, lubricants, personal care products, coatings and plastics. Our intermediate chemicals, namely olefins and oleochemicals, can directly replace critical molecules in large, attractive markets. We expect that prevailing market dynamics, such as the desire for new and increasingly demanding performance characteristics, changing regulatory requirements and structural supply shortages will support rapid adoption of our specialty chemicals and market penetration of our intermediate chemicals. We are in discussions with existing partners and potential new customers for long-term purchasing or offtake agreements for the entirety of our projected 2013 production.
In 2007, we were formed with $45.0 million of funding to pursue work started in 2004 in a collaboration between Cargill, one of the world’s largest agribusinesses, and Materia, a leading-edge catalyst technology company. Since our inception, we have been focused on bridging the renewable and chemical industries, transforming natural plant-based oils, such as palm, soy and rapeseed oil, into specialty high-performance, cost-effective commercial products.
To date, we have derived the majority of our revenue from product sales in the performance waxes and candle markets, often under the NatureWax brand and in the personal care markets. Since our inception, we have used metathesis of natural oils to produce specialty chemical products for cosmetic, polymer modification and industrial applications through multiple production runs ranging in size from 23 metric tonnes (50,000 pounds) to 450 metric tonnes (one million pounds). In November 2010, we completed our first commercial production of specialty chemicals and intermediate chemicals through our proprietary biorefinery process. In May 2011, we completed a toll production run utilizing our proprietary biorefinery technology, converting one million pounds (approximately 450 metric tonnes) of feedstock into specialty chemicals and intermediate chemicals.
45
Table of Contents
We have entered into joint development arrangements with several partners including Cargill, Clariant, Dow Corning, Materia, Stepan and Wilmar, to accelerate the commercialization of our specialty chemicals. To meet demand from our commercial partnerships, we are currently constructing the Indonesia facility, a biorefinery with annual production capacity of 185,000 metric tonnes (400 million pounds), as part of the Wilmar JV. We expect to begin commercial operations at the Indonesia facility in the second quarter of 2012. We will market the specialty chemicals produced at the Indonesia facility, and we and Wilmar will market the intermediate chemicals. We also purchased an 80 million gallon biodiesel facility in Natchez, Mississippi in 2011, which we expect to repurpose into the Mississippi facility, a biorefinery with annual production capacity of 280,000 metric tonnes (610 million pounds). We expect to begin commercial operations at the Mississippi facility in 2013. We are currently evaluating sites for the construction of a third biorefinery in South America and expect to begin commercial operations at this facility in 2014. As we begin commercial operations at our biorefineries, we plan to sell our products into the specialty chemical and intermediate chemical markets.
In the nine months ended September 30, 2011, we generated $17.8 million in revenues and incurred a net loss attributable to our common stockholders of $131.8 million. As of September 30, 2011, we had an accumulated deficit of $200.5 million. Since our inception, we have raised $169.1 million from the private placement of convertible preferred stock and $30.0 million from the private placement of convertible debt. In December 2010, the debt was converted into 3,768,772 shares of Series B preferred stock.
Key Milestones
Since our inception, we have been focused on bridging the renewable and chemical industries, transforming natural plant-based oils, such as palm, soy and rapeseed oil, into specialty high-performance, cost-effective commercial products. We have established, or are seeking to establish, partnerships with industry leading feedstock, technology and commercialization partners. Key milestones in our development include:
| • | In 2007 and 2008, we commenced operations and established the foundation of our business by: |
| • | acquiring Cargill’s NatureWax business and also acquiring intellectual property developed as part of a collaboration between Cargill and Materia; |
| • | raising $48.8 million of capital; |
| • | hiring key members of our executive team; |
| • | partnering with Tetramer Technologies, LLC to develop and commercialize renewable specialty chemicals; |
| • | partnering with Dow Corning to market naturally derived ingredients in personal care applications; and |
| • | opening our pilot facility in Illinois, including approximately 7,000 square feet of laboratory space. |
| • | In 2009, we established the commercial viability of our process by: |
| • | identifying, testing and completing initial engineering on our biorefinery concept; |
| • | completing multiple toll metathesis production runs for our personal care and performance waxes business; |
| • | meeting universally accepted compost specifications for certain coating applications when blended with paraffin; |
| • | demonstrating the viability of our fuel additive products and producing at pilot plant scale; |
| • | achieving a 50% reduction in catalyst usage in our metathesis reaction; |
46
Table of Contents
| • | filing a provisional patent application for our biorefinery process; and |
| • | refining and metathesizing drum quantities of mustard, palm and jatropha oils, demonstrating feasibility for biorefinery use. |
| • | In 2010, we made substantial progress in commercializing our technology by: |
| • | completing our first toll production run utilizing our proprietary biorefinery technology, involving the conversion of 40,000 pounds of feedstock into specialty chemicals and intermediate chemicals; |
| • | forming the Wilmar JV to construct what we believe will be the world’s largest integrated biorefinery; |
| • | having the Wilmar JV commence construction of the Indonesia facility; |
| • | entering into a joint development agreement with Stepan to evaluate and commercialize surfactants, antimicrobials and polyurethane polyols based on our specialty feedstocks; and |
| • | raising $100.0 million of capital, consisting of $70.0 million of equity and $30.0 million of debt (including $10.0 million face value of convertible notes issued on each of October 19, 2009, March 5, 2010 and August 6, 2010, all of which were converted into Series B preferred stock on December 6, 2010). |
| • | In 2011, we moved toward world-scale production and commercialization of our products by: |
| • | completing a toll production run utilizing our proprietary biorefinery technology, converting one million pounds (450 metric tonnes) of feedstock into specialty chemicals and intermediate chemicals; |
| • | acquiring an 80 million gallon per year biodiesel facility in Natchez, Mississippi and commencing engineering to repurpose the facility into a biorefinery; |
| • | entering into an agreement with Clariant; |
| • | selling commercial quantities of specialty chemicals to Clariant for the production of polymer additives; |
| • | announcing a collaboration with DSM to evaluate our unique monomers for production of specialty bio-based high performance thermoplastic materials for DSM’s engineering plastics portfolio; |
| • | filing eight patent applications on our lubricant and additive products; |
| • | refining our cold flow product and providing samples to a prospective partner for evaluation; |
| • | entering into a licensing agreement with XiMo Ltd, founded by Nobel laureate Dr. Richard Schrock and Dr. Amir Hoveyda (“XiMo”) to use XiMo’s proprietary molybdenum and tungsten metathesis catalysts in the field of natural oils; |
| • | announcing a collaboration with Hutchinson Worldwide, a global conglomerate, to evaluate the use of our renewable products as processing aids in Hutchinson’s rubber compounds; and |
| • | raising $50.3 million of capital. |
Significant Partner Agreements
We utilize our market partnerships to accelerate growth. We have entered into partnerships related to: sales, marketing and application development; manufacturing; technology; and feedstock supply. We currently have license agreements, joint development agreements, supply agreements and tolling agreements with various partners. We expect our commercialization partners to provide expanded distribution channels, product application testing, marketing expertise and long-term purchasing agreements. In order to accelerate our application development, we have, and plan to continue working with, partners to provide research and
47
Table of Contents
development activities. We use, and plan to continue using, partners to assist with the construction and operation of our biorefineries. Our current principal partnerships and strategic arrangements, listed chronologically, include the following:
Materia
In November 2007, we entered into a License Agreement with Materia, pursuant to which Materia granted us an exclusive license to a wide variety of patents and patent applications involving olefin metathesis catalyst compositions and their use in cross-metathesis that Materia either owns or licenses from third parties. Also in November 2007, we entered into a Catalyst Supply Agreement with Materia, whereby Materia has agreed to provide us with all of our supply of its proprietary catalyst.
In connection with both the License Agreement and the Catalyst Supply Agreement, we entered into a Joint Development Agreement with Materia (the “Materia JDA”). Pursuant to the Materia JDA, Materia will conduct research for the purpose of developing and commercializing chemicals and other materials derived from natural oils in return for us providing research funding to both Materia and Dr. Robert H. Grubbs.
Cargill
In November 2007, we entered into a Product Supply Agreement with Cargill through which we source the majority of our current requirements of (1) bulk vegetable- or animal-based oils and fats, including, but not limited to, vegetable-based oils that are otherwise a component of one or more NatureWax-related products and (2) modified vegetable- and animal-based oils and fats, including those that have been further formulated for use in or as paraffin replacer products that may or may not be further processed prior to sale by us or our customers. In connection with the Product Supply Agreement, we entered into a Risk Management Agreement with Cargill whereby Cargill provides natural oil risk management services to us. The risk management services that Cargill provides are used in connection with determining the price of the natural oil feedstock they provide to us under the Product Supply Agreement. As part of the Risk Management Agreement, we provide Cargill a 12-month rolling volume forecast that Cargill uses to determine how to manage the cost of supplying products to us over that period. Cargill utilizes futures contracts to which we are not a party. Under these contracts, Cargill is not allowed to hold futures or options positions in excess of 100% of our rolling 12-month forecast. Cargill provides us a price for purchasing soy oil for each quarter based upon these futures and option prices. Any gain compared to the current quarter benchmark futures price is split between us and Cargill. Any loss compared to the current quarter benchmark futures price is born solely by us through the price that we pay for the applicable soy oil. We are not obligated to purchase any specific quantity of products from Cargill during any given time period.
Dow Corning
In July 2008, we entered into a Joint Development Agreement (the “Dow Corning JDA”) and a Supply Agreement with Dow Corning. Pursuant to the Dow Corning JDA, we and Dow Corning collaborate to develop modified natural oil-based products to address unmet needs in the personal care industry. We have commercialized two products (Dow Corning HY 3050 and Dow Corning 3051) with Dow Corning under the Supply Agreement and are now commercializing a third product (Dow Corning HY 3200) developed under the Dow Corning JDA.
Wilmar
In June 2010, we entered into the Wilmar JV with a wholly owned subsidiary of Wilmar. The purpose of the Wilmar JV is to construct and operate a biorefinery based on our proprietary metathesis process and engage in manufacturing, distribution, sales and marketing of specialty chemicals, oleochemicals and olefins. The Wilmar JV will establish what we believe will be the world’s largest integrated biorefinery in Gresik, Indonesia, which will be operated by Wilmar. We expect that the Indonesia facility will be completed by the second quarter of 2012 with an initial annual production capacity of 185,000 metric tons (400 million pounds) and the ability to
48
Table of Contents
expand the annual production capacity to 370,000 metric tons (810 million pounds). Wilmar has committed to provide 50% of the capital and all natural oil feedstocks required by the Indonesia facility, including, among other things, palm, soy and rapeseed oils. We have agreed to provide 50% of the capital and our technological expertise and catalyst to the Wilmar JV. Pursuant to the terms of the Wilmar JV, we share with Wilmar the rights to market the olefins and oleochemicals that the Indonesia facility will produce. Pursuant to the terms of the Wilmar JV, we exclusively retain the right to market the specialty chemicals that the Indonesia facility will produce.
The Wilmar JV also grants to the joint venture company a 30-day right of first offer for any new Elevance project in the Asia Pacific region for an integrated biorefinery utilizing our cross-metathesis process in conjunction with transesterification or hydrolysis to convert certain natural oils, subject to the terms and conditions set forth in the Wilmar JV.
Stepan
In August 2010, we entered into a Joint Development Agreement with Stepan (the “Stepan JDA”) to collaborate on the development of new chemical derivatives of modified natural oil-based products for use in fields such as surfactants, polyurethanes and antimicrobials. The Stepan JDA defines terms for how license fees and royalties, as well as marketing and intellectual property rights, from the Stepan JDA will be shared.
XiMo
In January 2011, we entered into a Joint Development Agreement with XiMo (the “XiMo JDA”). We and XiMo entered into the XiMo JDA to collaborate in connection with research related to developing commercially viable early transition metal metathesis catalysts. We have identified the potential for these catalysts to produce molecules similar to those produced with ruthenium-based catalysts.
Clariant
In June 2011, we entered into a Commercialization and Supply Agreement with Clariant (the “Clariant CSA”). We and Clariant entered into the Clariant CSA to collaborate in connection with lubricants for chlorinated vinyl thermoplastics. Clariant has introduced a product based on our technology. Under the Clariant CSA, there are certain minimum volume requirements that Clariant must purchase from us.
Kolmar
In August 2011, we entered into a product conversion agreement with Kolmar Americas, Inc. (the “Kolmar Conversion Agreement”). Under the Kolmar Conversion Agreement, Kolmar provides feedstock to us, which we convert to biodiesel for a fee. The Kolmar Conversion Agreement expires December 31, 2011.
Factors Affecting Our Performance
Manufacturing Capacity
To date, we have utilized tolling facilities to manufacture our commercial products. The Indonesia facility is currently being constructed and is expected to begin commercial operations in the second quarter of 2012. The Indonesia facility is fully funded and is expected to have annual manufacturing capacity of 185,000 metric tonnes (400 million pounds). In June 2011, we purchased a biodiesel facility in Natchez, Mississippi that we intend to repurpose into the Mississippi facility. We expect this facility to have annual manufacturing capacity of 280,000 metric tonnes (610 million pounds). We have started the design and engineering of the Mississippi facility and expect it to begin commercial operation in 2013. We are also evaluating sites for construction of a third facility, which we expect to build in South America. We expect this third facility to begin commercial operations by the end of 2014. In addition, by the end of 2014, we expect that the combined annual production capacities of the
49
Table of Contents
three facilities will have reached approximately one million metric tonnes (2.2 billion pounds) through capacity additions and expansions. Our ability to successfully begin commercial operations at these facilities and produce at full capacity when and as planned could affect our revenues and operating expenses. We will continue to opportunistically use toll manufacturing as a means to scale additional manufacturing capacity and commercialize opportunities for new products after our biorefineries become operational.
Feedstock and Other Input Costs
Obtaining feedstocks in sufficient quantities and at a commercially viable price is critical to our business. We primarily have used soy oil to produce products for sale, but have demonstrated that our process can also use palm, rapeseed and many other natural oils. These feedstocks are available at industrial scale globally in liquid form. We currently source the majority of our feedstocks through Cargill. The Indonesia facility will source feedstocks through Wilmar. Feedstock availability and pricing can be affected by numerous factors outside of our control including weather conditions, government programs and regulations. Other important inputs to our process include catalysts, butene and methanol.
Rate of Commercialization of Our Specialty Chemicals
Our revenues will be impacted by the rate of adoption of our specialty chemicals. We expect our products’ functional attributes to drive adoption by customers looking for solutions to their product performance needs. Our ability to continue to identify and develop applications for our specialty chemicals will drive the rate of commercialization.
Intermediate Chemical Pricing
Our revenues will be impacted by the prices received for and volumes sold of our intermediate chemicals, which will be direct replacements for intermediate chemicals produced from conventional processes. Declines in these intermediate chemical prices, which may be driven by declines in commodity prices, the perception of a future decline in these prices, increased manufacturing capacity and declining consumer demand, among others, may adversely affect the prices we can obtain for our intermediate chemicals. By utilizing inputs whose costs are correlated with the prices of our intermediate chemicals, we benefit from a natural hedge on our profit margins. However, if the prices of our intermediate chemicals significantly decrease from current levels and the prices of our inputs do not have a corresponding decrease, our margins would be impacted adversely. Similarly, if our feedstock costs increase and we are unable to increase intermediate chemical selling prices, our margins would be impacted adversely.
Partnerships and Other Commercial Relationships
A key element of our strategy is to partner with industry leaders to accelerate commercialization and rapid deployment of our technology. In particular, we expect these partnerships to accelerate the commercial adoption of our specialty chemicals. Our ability to enter into, maintain and manage partnerships and strategic collaborations is important to the success of our business. These partnerships provide access to downstream markets, marketing expertise, infrastructure and feedstock supply.
Financial Operations Overview
Revenues
To date our revenues have been derived from products sales, several grants and other revenue. Product sales accounted for 95.5% of our revenue in 2010 and approximately 91% of our revenue in the nine months ended September 30, 2011.
50
Table of Contents
Product sales
To date our product sales have consisted primarily of global specialty chemical sales in the performance waxes and candle markets, often under our NatureWax brand, and in personal care markets. As we begin commercial operations at our biorefineries, we expect to sell our products into a variety of specialty chemical and intermediate chemical markets. The specialty chemical markets we are targeting have higher product prices per pound than those we have obtained on our sales to the performance waxes, candle and personal care markets. Our intermediate chemical sales are expected to have lower prices per pound and higher volumes than our sales into the specialty chemical markets.
Our Wilmar JV is consolidated in our consolidated financial statements included elsewhere in this prospectus. When the Indonesia facility begins commercial operations in 2012, we will recognize product sales and expenses for the entire Wilmar JV with noncontrolling interest recorded to offset the portion of the Wilmar JV that we do not own.
Other revenue
Other revenue consists of fees obtained from converting feedstock into biodiesel under the Kolmar Conversion Agreement.
Grants
Grant revenue consists of payments from governments or other agencies. The terms of these agreements generally provide us with reimbursement for research and development services. Revenues from grants are recognized in the period during which the related costs are incurred, provided that the conditions under which the grants were made have been met and only perfunctory obligations are outstanding.
Operating Expenses
Operating expenses consist of: the cost of product sales; sales, general and administrative; research and development; and intangible asset amortization expenses. Third-party toll manufacturing, research and development and personnel and related costs, including share-based compensation costs, comprise a majority of total operating expenses.
Cost of product sales
To date, cost of product sales primarily consist of third-party toll manufacturing, packaging and distribution costs for our products. When our biorefineries begin commercial operations, our cost of product sales will include costs related to the operation of the biorefineries, including feedstock and other inputs.
Cost of other revenue
Cost of other revenue consists of costs, except for feedstock costs, used to convert feedstock into biodiesel.
Sales, general and administrative
Sales, general and administrative expenses consist primarily of personnel and related costs including compensation of our executive management, corporate administration and sales and marketing functions, as well as facility and overhead expenses other than those associated with our research and development programs. We expect these expenses to increase as we expand our sales and administrative staffs in anticipation of our business’ growth. We will also incur higher legal, accounting, investor relations and governance expenses when we become a public company and are required to comply with securities laws applicable to public companies.
51
Table of Contents
Research and development
Research and development expenses consist of internal research costs and fees paid for contract research in conjunction with the research and development of our proprietary product portfolio as well as costs incurred for grant programs. These costs include salaries and other personnel-related expenses including: share-based compensation costs; travel costs; facility costs; piloting costs; supplies and depreciation of laboratory equipment; research consultant costs; and the cost of funding research at other research institutions. All such costs are expensed as they are incurred. We expect our research and development costs to continue to increase as we continue to invest in our technology platform.
Intangible asset amortization
Amortization expense of our intangible assets consists primarily of purchased technology and technology licenses, which are amortized using the straight-line method over their estimated useful lives.
Other Income (Expense), Net
Gain (loss) on change in fair value of warrants
Gains or losses due to the change in fair value of warrants result from the revaluation of our outstanding warrants at each balance sheet date. The redeemable convertible preferred warrants that were outstanding prior to the closing of this offering were classified as a liability and the change in value of these warrants varied based on multiple factors, but generally increased as the estimated fair value of our common stock increased. We estimated the fair value of these warrants by using the Black-Scholes model and recognized any change in fair value resulting from changes in estimated business enterprise value. We expect the warrants to be exercised upon the consummation of this offering.
Interest expense
Interest expense consists of interest related to our convertible debt securities. This debt was converted in December 2010 to Series B preferred stock.
Other income, net
Other income consists primarily of interest income earned on investments, cash balances and miscellaneous income. Our interest income will vary for each period depending on our average investment balances during the period and market interest rates.
Critical Accounting Policies and Estimates
Our discussion and analysis of our financial condition and results of operations is based upon our consolidated financial statements, which have been prepared in accordance with accounting principles generally accepted in the United States. The preparation of our consolidated financial statements requires us to make estimates, assumptions and judgments that affect the reported amounts of assets, liabilities, revenues, expenses and related disclosures. The results of our analysis form the basis for making assumptions about the carrying values of assets and liabilities that are not readily apparent from other sources. Our actual results may differ from these estimates under different assumptions or conditions. We evaluate our estimates, assumptions and judgments on an ongoing basis.
We believe the following critical accounting policies involve significant areas of management’s judgments and estimates in the preparation of our consolidated financial statements.
52
Table of Contents
Revenue Recognition
We currently recognize revenues from the sale of products, converting feedstocks provided by third parties and from grants. Revenues are recognized when all of the following criteria are met: persuasive evidence of an arrangement exists; delivery has occurred or services have been rendered; the fee is fixed or determinable; and collectability is reasonably assured.
For each source of revenues, we apply the above revenue recognition criteria in the following manner:
Product sales
We sell specialty chemicals under short-term agreements and in spot transactions at prevailing market prices. Revenues are recognized, net of discounts and allowances, once passage of title and risk of loss have occurred and contractually specified acceptance criteria have been met, provided all other revenue recognition criteria have also been met. Shipping and handling costs charged to customers are recorded as revenues. Shipping costs are included in cost of product sales. Such charges were not significant in any of the periods presented.
Other revenue
We convert feedstock into biodiesel at the Mississippi facility under the Kolmar Conversion Agreement. Revenues are recognized once conversion has been completed and specified acceptance criteria have been met.
Grants
Grants are made pursuant to agreements that generally provide cost reimbursement for certain types of expenditures in return for research and development activities over a contractually defined period. Revenues from grants are recognized in the period during which the related costs are incurred, provided that the conditions under which the grants were provided have been met and only perfunctory obligations are outstanding.
Cost of Product Sales
We currently toll produce a majority of our products through a supply agreement with Cargill. In connection with the Product Supply Agreement, we entered into a Risk Management Agreement with Cargill whereby Cargill provides natural oil risk management services to us. The risk management services that Cargill provides are used in connection with determining the price of the natural oil feedstock they provide to us under the Product Supply Agreement. ASC 815 requires a company to evaluate contracts to determine whether the contracts are derivatives. Certain contracts that meet the literal definition of a derivative may be exempted as normal purchases or normal sales. Normal purchases and normal sales are contracts that provide for the purchase or sale of something other than a financial instrument or derivative instrument that will be delivered in quantities expected to be used or sold over a reasonable period in the normal course of business. Our contracts under the Risk Management Agreement with Cargill meet the requirements of normal purchases and are documented as normal and are not subject to the accounting and reporting requirements of ASC 815.
Cost of Other Revenue
We currently convert feedstock into biodiesel at the Mississippi facility under the Kolmar Conversion Agreement. We provide raw materials, except for feedstock, and utilities for the conversion process, which we record in cost of other revenue.
Convertible Preferred Warrants
We have issued 5,680,541 warrants on various dates to acquire up to an equivalent number of shares of the Series B preferred stock for $8.89 per share. The warrants are exercisable from the date of issuance and expire on August 6, 2018. We accounted for all issued warrants to purchase our preferred stock as liabilities on our consolidated balance sheets at fair value because the warrants could have obligated us to redeem the underlying convertible preferred stock. The warrants were subject to remeasurement at each balance sheet date, and any change in fair value was recognized as gain (loss) on change in fair value of warrants in the consolidated
53
Table of Contents
statement of operations. We estimated the fair value of these warrants at the respective balance sheet dates utilizing the Black-Scholes model to allocate an estimated business enterprise value to the various classes of our equity stock and related warrants. The Black-Scholes pricing model requires a number of variables that require management judgment including the estimated price of the underlying instrument, the risk-free interest rate, the expected volatility, the expected dividend yield and the expected exercise period of the warrants. Our Black-Scholes assumptions are discussed in greater detail in “—Share-Based Compensation” below.
The warrants were marked to market at each balance sheet date using the following values per warrant:
| Value Per Warrant |
||||
| December 31, 2008 |
$ | 1.45 | ||
| December 31, 2009 |
1.32 | |||
| December 31, 2010 |
2.14 | |||
| September 30, 2011 |
19.54 | |||
The valuation of the warrants at September 30, 2011 was performed using a hybrid method which consisted of both an Option Pricing Model (“OPM”) and Probability-Weighted Expected Return Method (“PEWERM”) as described in the AICPA Practice Aid. Three scenarios were considered under the hybrid method, with the resulting share values under each scenario weighted by their respective likelihood of occurrence. Two different sale/merger scenarios using the OPM were considered. The first scenario considered the total equity value based on an income approach using projected future cash flows discounted at 60%. The second scenario involved using a back-solve method based on the $50 million sale of preferred stock in June 2011 to derive the total equity value. Additionally, the value of the share classes under an initial public offering scenario based on the expected pricing and timing of the potential initial public offering was considered.
The increase in the warrant liability as of September 30, 2011 considered:
| • | the signing of multiple commercial agreements during 2011, which further confirmed our ability to place our specialty chemicals; |
| • | the purchase of the former biodiesel plant in Natchez, Mississippi, which demonstrated our commitment to operate in multiple regions of the world; |
| • | the sale of $50 million of preferred stock; and |
| • | potential valuations in an initial public offering, which was considered a potential financing option in 2011 and had not previously been considered. |
In the nine months ended September 30, 2011, and 2010, we recorded a charge of $98.8 million and $3.2 million, respectively. Gain (loss) on fair value of warrants in 2010, 2009 and 2008 were $(4.5) million, $0.7 million and $1.8 million, respectively.
Share-Based Compensation
Our share-based compensation expense for options is as follows.
| Years Ended December 31, |
Nine Months Ended September 30, |
|||||||||||||||||||
| 2008 | 2009 | 2010 | 2010 | 2011 | ||||||||||||||||
| (unaudited) | ||||||||||||||||||||
| (in thousands) | ||||||||||||||||||||
| Sales, general and administrative |
$ | 290 | $ | 172 | $ | 252 | $ | 170 | $ | 270 | ||||||||||
| Research and development |
38 | 46 | 41 | 33 | 22 | |||||||||||||||
|
|
|
|
|
|
|
|
|
|
|
|||||||||||
| Total share-based compensation expense |
$ | 328 | $ | 218 | $ | 293 | $ | 204 | $ | 292 | ||||||||||
|
|
|
|
|
|
|
|
|
|
|
|||||||||||
In future periods, our share-based compensation expense is expected to increase as a result of unrecognized share-based compensation still to be recognized due to options currently outstanding and as we issue additional share-based awards in order to attract and retain employees and nonemployee consultants.
54
Table of Contents
The following table summarizes the options granted from January 1, 2009 through the date of this prospectus.
| Number of Options Granted |
Exercise Price Per Share |
Estimated Fair Value Per Share |
||||||||||
| January 1, 2009 |
25,197 | $ | 2.12 | $ | 1.45 | |||||||
| March 15, 2009 |
94,911 | 2.12 | 1.22 | |||||||||
| April 20, 2009 |
2,000 | 2.12 | 1.22 | |||||||||
| July 20, 2009 |
15,000 | 2.12 | 1.22 | |||||||||
| January 20, 2010 |
560,751 | 2.12 | 0.98 | |||||||||
| May 10, 2010 |
50,000 | 2.12 | 0.98 | |||||||||
| June 21, 2010 |
71,086 | 2.12 | 0.98 | |||||||||
| March 24, 2011 |
888,892 | 2.14 | 2.14 | |||||||||
All stock options were granted with exercise prices at or above the then-current fair market value of our common stock. We believe that the estimates of the value of our common stock were fair and reasonable at the time they were made. We utilized methodologies, approaches and assumptions consistent with the American Institute of Certified Public Accountants (“AICPA”) Practice Guide entitled Valuation of Privately-Held-Company Equity Securities Issued as Compensation.
We estimated the fair value of our share-based compensation awards using the Black-Scholes option pricing model, which requires several inputs such as those outlined in the table below. Our expected dividend yield was assumed to be zero, as we have not paid, nor do we anticipate paying, cash dividends on our shares of common stock. Our risk-free interest rate is based on the U.S. Treasury yield curve in effect at the time of grant for zero coupon U.S. Treasury notes with maturities similar to the option’s expected term. We calculate our expected volatility rate from the historical volatilities of several comparable public companies in our industry over a period equal to the expected term of our options because we do not have any trading history to use for calculating the volatility of our own common stock. Due to our limited history of grant activity, we calculate our expected term utilizing the “simplified method” permitted by the SEC, which is calculated as the average of the total contractual term of the option and its vesting period. We estimate our forfeiture rate based on an analysis of our actual forfeitures and will continue to evaluate the appropriateness of the forfeiture rate based on actual forfeiture experience, analysis of employee turnover and other factors.
The fair value of employee stock options was estimated using the following weighted average assumptions (except for share price).
| Years Ended December 31, | ||||
| 2009 | 2010 | |||
| Expected dividend yield |
0.0% | 0.0% | ||
| Risk-free interest rate |
2.0% | 2.8% | ||
| Expected volatility |
65.0% | 56.0% | ||
| Expected term (in years) |
6.1 | 6.1 | ||
| Forfeiture rate |
0.0% | 0.0% | ||
| Common stock valuation |
$1.22 - $1.45 | $0.98 - $2.14 | ||
We will continue to use judgment in evaluating the expected term, volatility and forfeiture rate related to our share-based compensation on a prospective basis and incorporating these factors into the Black-Scholes option pricing model.
Significant factors, assumptions and methodologies used in estimating fair value
We have regularly conducted valuations to assist us in estimating the fair value of our common stock for each stock option grant. Our board of directors was regularly apprised that each valuation was being conducted
55
Table of Contents
and considered the relevant objective and subjective factors in each valuation conducted. Our board of directors also concluded that the assumptions and inputs used in connection with such valuations reflected the best estimates of our business condition, prospects and operating performance at each valuation date.
Our board of directors considered the results of common stock valuations performed as of the dates provided below in estimating the grant date fair value of common stock. The estimates at each valuation date considered numerous objective and subjective factors at each option grant date including, but not limited to:
| • | the absence of a public market for our common stock; |
| • | progress and milestones attained in our business; |
| • | projected sales and earnings for multiple future periods; |
| • | the probabilities of various financing and liquidation events, including winding up and dissolution; |
| • | prices of preferred stock issued by us to outside investors in arm’s-length transactions; |
| • | the rights, preferences and privileges of the preferred stock relative to the common stock; |
| • | our performance and the status of research and product development efforts; |
| • | our stage of development and business strategy; and |
| • | the likelihood of achieving a liquidity event such as an initial public offering or sale of our company, given then-prevailing market conditions. |
Using these valuations, we made the following estimates of fair value of our common stock.
| Valuation Date |
Fair Value Per Share | |||
| December 31, 2008 |
$ | 1.45 | ||
| March 31, 2009 |
1.22 | |||
| October 19, 2009 |
1.41 | |||
| March 5, 2010 |
0.98 | |||
| December 6, 2010 |
2.14 | |||
The valuation of the common stock began with estimating a business enterprise value using one or more of three generally accepted approaches: discounted cash flow; comparable public company; or comparable acquisition. For each valuation we prepared financial forecasts that took into account our past experience and future expectations. There is inherent uncertainty in these estimates because the assumptions used are highly subjective and subject to changes as a result of new operating data and economic and other conditions that impact our business. We balanced the uncertainty associated with achieving the forecast through the selection of a discount rate. We then allocated the equity value among the securities that comprise the capital structure of the company using the Option-Pricing Method, as described in the AICPA Practice Aid entitled Valuation of Privately-Held-Company Equity Securities Issued as Compensation.
The aggregate value of the common stock derived was then divided by the number of shares of common stock outstanding to arrive at the per share value.
We granted stock options with exercise prices of $2.12 per share during 2010 and 2009 and $2.14 per share in 2011. The common stock valuation at each valuation date reflected a combination of facts and circumstances as described below.
The valuations related to the stock options granted on March 24, 2011 considered:
| • | The business enterprise value as of December 6, 2010 was estimated to be $107.0 million based on an income approach using a discount rate of 85% and implied value from recent financing rounds. |
56
Table of Contents
| • | We used volatility of 50% based on data from a comparable group of companies. We estimated a time until liquidity of 2.1 years, applying a risk free interest rate of 0.42%. We estimated a fair market value of $2.14 per common share. |
| • | The impact of entering into the Wilmar JV to demonstrate our technology through construction of our first world-scale biorefinery. |
| • | The impact of entering into a joint development agreement with Stepan to evaluate and commercialize surfactants, antimicrobials, and polyurethane polyols based on our specialty feedstocks. |
| • | Raising $100.0 million of capital, consisting of $70.0 million of equity and $30.0 million of debt. |
The valuation related to the stock options granted on January 20, 2010, May 10, 2010 and June 21, 2010 considered:
| • | The business enterprise value as of March 5, 2010 was estimated to be $56.1 million based on an income approach using a discount rate of 85%. |
| • | We used volatility of 49% based on data from a comparable group of companies. We estimated a time until liquidity event of 2.3 years, applying a risk-free interest rate of 2.8%. We estimated a fair market value of $0.98 per common share. |
| • | Forming a partnership with Trent University to develop new biomaterials, biochemicals and bioproducts from natural oils. |
| • | The issuance of $10.0 million of convertible redeemable preferred notes which closed on March 5, 2010. |
The valuation related to the stock options granted on March 15, 2009, April 20, 2009, and July 20, 2009, considered:
| • | The business enterprise value as of March 31, 2009 was estimated to be $41.1 million based on an income approach and assuming a discount rate of 85%. |
| • | We used volatility of 65% based on data from a comparable group of companies. We estimated a time until liquidity event of 2.75 years, applying a risk-free interest rate of 1.2%. We estimated a fair market value of $1.22 per common share. |
| • | Demonstrating a 50% reduction in catalyst used in our metathesis reaction. |
| • | Identifying testing and completing initial engineering on our biorefinery concept. |
The valuations related to the stock options granted on January 1, 2009 considered:
| • | The business enterprise value as of December 31, 2008 was estimated to be $36.4 million based on an income approach and using a discount rate of 80%. |
| • | We used volatility of 70% based on data from a comparable group of companies. We estimated a time until liquidity event of 3 years, applying a risk free interest rate of 1.0%. We estimated a fair market value of $1.45 per common share at December 31, 2008. |
| • | The impact of: |
| • | hiring key members of our executive team; |
| • | partnering with Dow Corning to market naturally derived ingredients in personal care applications; and |
| • | opening our facility in Bolingbrook, Illinois. |
57
Table of Contents
Income Taxes
We are subject to income taxes in both the United States and foreign jurisdictions, and we use estimates in determining our provisions for income taxes. We use the asset and liability method of accounting for income taxes, whereby deferred tax assets or liability account balances are calculated at the balance sheet date using current tax laws and rates in effect for the year in which the differences are expected to affect taxable income. Recognition of deferred tax assets is appropriate when realization of such assets is more likely than not. We record a valuation allowance against our net deferred tax assets if it is more likely than not that some portion of the deferred tax assets will not be fully realizable. This assessment requires judgment as to the likelihood and amounts of future taxable income by tax jurisdiction. As of September 30, 2011, we had a full valuation allowance against all of our deferred tax assets given our history of losses.
Intangible Assets and Other Long-Lived Assets
Long-lived assets, such as property and equipment, and purchased intangible assets subject to amortization, are reviewed for impairment whenever events or changes in circumstances indicate that the carrying amount of an asset may not be recoverable. If circumstances require a long-lived asset or asset group be tested for possible impairment, we first compare undiscounted cash flows expected to be generated by that asset or asset group to its carrying value. If the carrying value of the long-lived asset or asset group is not recoverable on an undiscounted cash flow basis, an impairment loss is recognized to the extent that the carrying value exceeds its fair value. Fair value is determined through various valuation techniques including discounted cash flow models, quoted market values and third-party independent appraisals, as considered necessary. Due to our history of operating losses and negative cash flows from operations, we performed a review of property, plant and equipment and intangible assets for impairment. As the projected future undiscounted cash flows generated by the asset groups were in excess of the carrying values, no impairment charges have been recorded.
Goodwill
Goodwill represents the excess of the aggregate purchase price over the fair value of the net assets acquired in a purchase businesses combination. Goodwill is reviewed for impairment at least annually. The goodwill impairment test is a two-step test. Under the first step, the fair value of the reporting unit is compared with its carrying value (including goodwill). If the fair value of the reporting unit is less than its carrying value, an indication of goodwill impairment exists for the reporting unit and the enterprise must perform step two of the impairment test (measurement). Under step two, an impairment loss is recognized for any excess of the carrying amount of the reporting unit’s goodwill over the implied fair value of that goodwill. The implied fair value of goodwill is determined by allocating the fair value of the reporting unit in a manner similar to a purchase price allocation, in accordance with business combination rules. The residual fair value after this allocation is the implied fair value of the reporting unit goodwill. Fair value of the reporting unit is determined using a discounted cash flow analysis. If the fair value of the reporting unit exceeds its carrying value, step two does not need to be performed. We perform our annual impairment test of goodwill during the fourth fiscal quarter, and when a triggering event occurs between annual impairment tests.
Recent Accounting Pronouncements
In May 2011, the Financial Accounting Standards Board (“FASB”) issued Accounting Standards Update (“ASU”) 2011-04, “Fair Value Measurement (Topic 820)—Amendments to Achieve Common Fair Value Measurement and Disclosure Requirements in U.S. Generally Accepted Accounting Principals and International Financial Reporting Standards.” ASU 2011-04 amends the application of the “highest and best use” concept to be used only in the measurement of the fair value of nonfinancial assets, clarifies that the measurement of the fair value of financial instruments classified as equity should be performed from the perspective of a market participant who holds the instrument as an asset, clarifies that an entity that manages a group of financial assets and liabilities on the basis of its net risk exposure to those risks can measure those financial instruments on the basis of its net exposure to those risks, and clarifies when premiums and discounts should be taken into account
58
Table of Contents
when measuring fair value. The fair value disclosure requirements also were amended. These provisions are effective for reporting periods beginning on or after December 15, 2011 applied prospectively. Early application is not permitted. We are currently reviewing what effect, if any, this new provision will have on our Consolidated Financial Statements.
In June 2011, the FASB issued ASU 2011-05, “Comprehensive Income (Topic 220)—Presentation of Comprehensive Income.” ASU 2011-05 requires the components of net income and other comprehensive income to be presented either in one continuous statement, referred to as the statement of comprehensive income, or in two separate, but consecutive statements. An entity is also required to present on the face of the financial statements reclassification adjustments for items that are reclassified from other comprehensive income to net income in the statement(s) where the components of net income and the components of other comprehensive income are presented. While the new guidance changes the presentation of comprehensive income, there are no changes to the components that are recognized in net income or other comprehensive income under current accounting guidance. This new guidance is effective for us beginning November 1, 2012 and requires retrospective application. As this guidance only amends the presentation of the components of comprehensive income, the adoption will not have an impact on our consolidated financial position or results of operations.
In September 2011, the FASB issued a standard to simplify the process for determining goodwill impairment ASU 2011-08, “Intangible Goodwill and Other (Topic 350).” This standard gives an entity the option to first assess qualitative factors in determining whether a two-step goodwill impairment test must be performed. If an assessment of qualitative factors leads to a determination that it is not more likely than not that the fair value of the reporting unit is less than its carrying amount, the performing the two-step test is deemed unnecessary. The standard is effective for annual and interim goodwill impairment tests performed for fiscal years beginning after December 15, 2011. We do not expect the adoption of this standard to have a significant impact on our consolidated financial statements.
59
Table of Contents
Results of Operations
The following table presents our consolidated statements of operations for the years ended December 31, 2008, 2009, and 2010 and for the nine months ended September 30, 2010 and 2011 and forms the basis for the following discussion of our operating activities and results of operations.
| For the Years Ended December 31, | Change | For the Nine Months Ended September 30, |
Change | |||||||||||||||||||||||||||||
| 2008 | 2009 | 2010 | 2009 vs. 2008 |
2010 vs. 2009 |
2010 | 2011 | 2011 vs. 2010 |
|||||||||||||||||||||||||
| (unaudited) | (unaudited) | (unaudited) | ||||||||||||||||||||||||||||||
| (in thousands) | ||||||||||||||||||||||||||||||||
| Revenues: |
||||||||||||||||||||||||||||||||
| Product sales |
$ | 18,913 | $ | 12,186 | $ | 20,227 | $ | (6,727 | ) | $ | 8,041 | $ | 13,303 | $ | 16,319 | $ | 3,016 | |||||||||||||||
| Other revenue |
— | — | — | — | — | — | 903 | 903 | ||||||||||||||||||||||||
| Grants |
— | — | 961 | — | 961 | 732 | 604 | (128 | ) | |||||||||||||||||||||||
|
|
|
|
|
|
|
|
|
|
|
|
|
|
|
|
|
|||||||||||||||||
| Total revenues |
18,913 | 12,186 | 21,188 | (6,727 | ) | 9,002 | 14,035 | 17,826 | 3,791 | |||||||||||||||||||||||
| Operating Expense: |
||||||||||||||||||||||||||||||||
| Cost of product sales |
14,425 | 11,860 | 17,824 | (2,565 | ) | 5,964 | 11,603 | 16,751 | 5,148 | |||||||||||||||||||||||
| Cost of other revenue |
— | — | — | — | — | — | 628 | 628 | ||||||||||||||||||||||||
| Sales, general and administrative |
8,086 | 8,168 | 11,356 | 82 | 3,188 | 8,457 | 15,260 | 6,803 | ||||||||||||||||||||||||
| Research and development |
5,539 | 7,760 | 8,896 | 2,221 | 1,136 | 6,728 | 6,383 | (345 | ) | |||||||||||||||||||||||
| Intangible asset amortization |
1,506 | 1,506 | 1,506 | — | — | 1,129 | 1,129 | — | ||||||||||||||||||||||||
|
|
|
|
|
|
|
|
|
|
|
|
|
|
|
|
|
|||||||||||||||||
| Total operating expenses |
29,556 | 29,294 | 39,582 | (262 | ) | 10,288 | 27,917 | 40,151 | 12,234 | |||||||||||||||||||||||
|
|
|
|
|
|
|
|
|
|
|
|
|
|
|
|
|
|||||||||||||||||
| Loss from operations |
(10,643 | ) | (17,108 | ) | (18,394 | ) | (6,465 | ) | (1,286 | ) | (13,882 | ) | (22,325 | ) | (8,443 | ) | ||||||||||||||||
| Gain (loss) on change in fair value of warrants |
1,787 | 652 | (4,506 | ) | (1,135 | ) | (5,158 | ) | (3,172 | ) | (98,823 | ) | (95,651 | ) | ||||||||||||||||||
| Interest expense |
— | (437 | ) | (4,415 | ) | (437 | ) | (3,977 | ) | (3,289 | ) | — | 3,288 | |||||||||||||||||||
| Other income, net |
636 | 56 | 14 | (580 | ) | (43 | ) | 4 | 21 | 17 | ||||||||||||||||||||||
| Income taxes |
— | — | — | — | — | — | — | — | ||||||||||||||||||||||||
|
|
|
|
|
|
|
|
|
|
|
|
|
|
|
|
|
|||||||||||||||||
| Net loss |
$ | (8,220 | ) | $ | (16,837 | ) | $ | (27,301 | ) | $ | (8,617 | ) | $ | (10,464 | ) | $ | (20,339 | ) | $ | (121,127 | ) | $ | (100,789 | ) | ||||||||
|
|
|
|
|
|
|
|
|
|
|
|
|
|
|
|
|
|||||||||||||||||
Comparison of Nine Months Ended September 30, 2011 and 2010
Revenues
Product sales. Our product sales increased by $3.0 million, or 22.7%, in the nine months ended September 30, 2011 compared to the nine months ended September 30, 2010, driven by higher average selling prices, reflecting a 53.0% increase in soy oil prices, offset by a 10.8% decrease in performance wax product volumes as more price-sensitive customers switched to paraffin.
Other revenue. Since August 2011, we have produced biodiesel at the Mississippi facility under the Kolmar Conversion Agreement. We received $0.9 million in revenue for the nine months ended September 30, 2011 pursuant to this agreement.
Grants. Our grant revenue decreased by $0.1 million, or 17.5%, in the nine months ended September 30, 2011 compared to the nine months ended September 30, 2010, which was primarily driven by a decrease related to the $2.5 million grant from the U.S. Department of Energy that was awarded in 2009 and on which draws commenced in 2010.
60
Table of Contents
Operating expenses
Cost of product sales. Our cost of product sales increased by $5.1 million, or 44.4%, in the nine months ended September 30, 2011 compared to the nine months ended September 30, 2010. This primarily reflected an increase in the cost of feedstocks and a writedown of inventory of $1.7 million to reduce certain inventories to market value. Our cost for natural oil feedstocks increased $0.19 per pound, consistent with an increase in the average market index for crude soybean oil (free on board Decatur, Illinois) from $0.36 per pound to $0.55 per pound, or 52.8%, for the respective nine month periods.
Cost of other revenue. The cost of other revenue of $0.6 million in the nine months ended September 30, 2011 reflects the cost incurred to produce biodiesel under the Kolmar Conversion Agreement.
Sales, general and administrative. Our sales, general and administrative expenses increased by $6.8 million, or 80.4%, in the nine months ended September 30, 2011 compared to the nine months ended September 30, 2010, which was primarily due to an increase of $2.6 million in sales, general and administrative expenses related to the Mississippi facility, including preliminary work to repurpose the site, and an increase of $2.2 million in personnel-related expenses.
Research and development. Our research and development expenses decreased by $0.3 million, or 5.1%, in the nine months ended September 30, 2011 compared to the nine months ended September 30, 2010, which was primarily due to a decrease of $0.4 million related to the amortization of a license agreement entered into during 2010.
Intangible asset amortization. Our intangible asset amortization expenses consisted primarily of purchased technology and technology licenses and amounted to $1.1 million for the nine months ended September 30, 2011 and September 30, 2010, respectively.
Other income (expense)
Gain (loss) on change in fair value of warrants. We incurred a loss of $98.8 million and $3.2 million in the nine months ended September 30, 2011 and September 30, 2010, respectively, related to the increase in the fair value of the outstanding warrants to acquire our Series B preferred stock resulting from the increase in the value of our business.
Interest expense. Our interest expense decreased by $3.3 million in the nine months ended September 30, 2011 compared to the nine months ended September 30, 2010, which was due to the conversion of $30.0 million of redeemable convertible preferred notes into shares of Series B preferred stock on December 6, 2010.
Comparison of Years Ended December 31, 2010 and 2009
Revenues
Product sales. Our product sales increased by $8.0 million in 2010 compared to 2009, or 66.0%. This was primarily driven by a 60.8% increase in performance wax product volume due to a favorable soy oil-to-paraffin spread, which drove price sensitive customers to purchase products such as ours, which are derived from soy oil.
Grants. Our grant revenue increased by $1.0 million in 2010 compared to 2009, which was due to the receipt of $1.0 million of a $2.5 million grant from the U.S. Department of Energy that we were awarded in December 2009.
Operating expenses
Cost of product sales. Our cost of product sales increased by $6.0 million, or 50.3%, in 2010 compared to 2009. This was primarily driven by an increase in sales volume and, to a lesser extent, a $0.06 per pound increase in our cost for natural oil feedstocks, consistent with an increase in the average market index for crude soybean oil (free on board Decatur, Illinois) from $0.33 per pound to $0.39 per pound, or 18.2%, for the respective years.
61
Table of Contents
Sales, general and administrative. Our sales, general and administrative expenses increased $3.2 million or 39.0% in 2010 compared to 2009, which was primarily due to an increase of $1.2 million in personnel related expenses due to increased headcount and an increase of $1.0 million in legal fees related to general corporate matters.
Research and development. Our research and development expense increased $1.1 million, or 14.6% in 2010 compared to 2009, which was primarily due to a $0.6 million amortization expense related to a license agreement that was entered into during 2010.
Intangible asset amortization. Our intangible asset amortization expenses consisted primarily of purchased technology and technology licenses and amounted to $1.5 million in 2010 and 2009.
Other income (expense)
Gain (loss) on change in fair value of warrants. We incurred a loss of $4.5 million and a gain of $0.7 million in 2010 and 2009, respectively, related to the change in the fair value of the outstanding warrants to acquire our Series B preferred stock. The loss in 2010 was related to the increased value of our business and thus the value of the warrants, because in 2010, we achieved several strategic milestones with third parties which validated our technical and commercial progress.
Interest expense. Our interest expense increased $4.0 million in 2010 compared to 2009, which was due to the sale of $30.0 million of redeemable convertible preferred notes. These notes were converted into shares of Series B preferred stock on December 6, 2010.
Comparison of Years Ended December 31, 2009 and 2008
Revenues
Product sales. Our product sales decreased $6.7 million, or 35.6%, in 2009 compared to 2008, which was primarily due to a 22.5% decrease in performance wax sales volume which was primarily related to a loss of a customer.
Operating expenses
Cost of product sales. Our cost of product sales decreased $2.6 million, or 17.8%, in 2009 compared to 2008 primarily due to lower volume of 22.5%. The year-over-year change in soy oil prices did not have a significant impact on our cost of product sales.
Sales, general and administrative. Our sales, general and administrative expense increased $0.1 million, or 1.0%, in 2009 compared to 2008, which was primarily due to an increase in personnel related expenses.
Research and development. Our research and development expense increased $2.2 million, or 40.1%, in 2009 compared to 2008, which was primarily due to a $1.8 million increase in personnel related expenses due to increased headcount.
Intangible asset amortization. Our intangible asset amortization expenses consisted primarily of purchased technology and technology licenses and amounted to $1.5 million in 2009 and 2008.
Other gain (loss)
Gain (loss) on change in fair value of warrants. We recorded a gain of $0.7 million and a gain of $1.8 million in 2009 and 2008, respectively, related to the decrease in the fair value of the outstanding warrants to acquire our Series B preferred stock. This gain was a result of a decline in the term to a liquidity event, which resulted in a lower value of the security while the value of our business was relatively constant.
62
Table of Contents
Interest expense. Our interest expense increased $0.4 million in 2009 compared to 2008, which was due to the sale of $10.0 million of convertible notes on October 19, 2009.
Liquidity and Capital Resources
Sources and Uses of Cash
Since our inception, we have financed our operations primarily from an aggregate of $199.1 million raised from private placements of equity securities, $7.0 million of product sales less cost of product sales and $1.6 million from grants.
Gross proceeds from sales of our convertible preferred stock and convertible notes since our inception were as follows.
| Date |
Amount | Financing | ||||
| (in thousands) | ||||||
| November 2007—February 2008 |
$ | 48,770 | Series B preferred stock | |||
| October 2009—August 2010 |
30,000 | Convertible Redeemable Preferred Notes(1) | ||||
| December 2010 |
70,000 | Series C preferred stock | ||||
| June 2011—August 2011 |
50,342 | Series D preferred stock | ||||
|
|
|
|||||
| Total |
$ | 199,112 | ||||
|
|
|
|||||
| (1) | Converted into Series B preferred stock in December 2010. |
The primary uses of our capital resources to date have been to fund operating activities, including research and development and manufacturing expenses, and to fund investing activities primarily related to capital expenditures. During the years ended December 31, 2009 and 2010 and the nine months ended September 30, 2011, we used cash of $1.0 million, $1.9 million, and $23.9 million to fund capital expenditures. We currently anticipate making additional capital expenditures of $9.5 million (net of Wilmar contributions to the Wilmar JV) to fund completion of the Indonesia facility and approximately $150 million to fund completion of the Mississippi facility.
In the second quarter of 2012, we expect to begin operating the Indonesia facility, our first world-scale facility through the Wilmar JV. In addition, we plan to begin operating the Mississippi facility in the second half of 2013, and we are evaluating sites for the construction of a third biorefinery in South America. The amount of capital required to build the South American facility will depend on the existing infrastructure at the site and the terms and conditions of any agreements we enter into with partners. By 2014, we expect these three facilities to have a combined annual production capacity of approximately one million metric tonnes (2.2 billion pounds) assuming an expansion of one of our first two facilities.
We may also use our capital resources to fund working capital, product development, operating expenses, strategic initiatives or acquisitions. If we are unable to access additional capital, our growth may be slowed. For additional information, see “Risk Factors—Risks Related to Our Business—We may require substantial additional financing to achieve our goals, and a failure to obtain funding when needed or on acceptable terms could force us to delay, limit, reduce or terminate our development and commercialization efforts.”
We believe our existing cash, cash equivalents and short-term investments and the net proceeds from this offering will be sufficient to fund our operations and capital expenditures through the completion of our first three biorefineries.
63
Table of Contents
Cash, Cash Equivalents and Short-Term Investments
Our cash, cash equivalents and short-term investments are held primarily in money market funds. Our short-term investments in marketable securities are all classified as held-to-maturity, and are recorded at their amortized cost. We make our investments in accordance with our investment policy, the primary objectives of which are liquidity and capital preservation. The balances of our cash, cash equivalents and short-term investments as of the dates listed below were as follows.
| Years Ended December 31, |
Nine Months Ended September 30, 2011 |
|||||||||||
| 2009 | 2010 | |||||||||||
| (unaudited) | ||||||||||||
| (in thousands) | ||||||||||||
| Cash and cash equivalents |
$ | 7,557 | $ | 36,665 | $ | 71,574 | ||||||
| Short-term investments |
250 | 40,693 | 18,828 | |||||||||
Our cash, cash equivalents and short-term investments increased by $69.6 million in 2010, primarily due to net proceeds of $67.6 million received from the sale of 5,649,718 shares of our Series C preferred stock during 2010 at a price of $12.39 per share and net proceeds of $19.9 million received from the sale of convertible redeemable preferred notes and warrants, partially offset by cash used in operating activities of $17.3 million and capital expenditures of $1.9 million. Cash, cash equivalents and short-term investments increased by $13.0 million during the nine months ended September 30, 2011, primarily due to net proceeds of $50.2 million received from the sale of 2,573,738 shares of our Series D preferred stock during 2011 at a price of $19.56 per share, partially offset by cash used in operating activities of $21.4 million and capital expenditures of $23.9 million.
The following table shows a summary of our cash flows for the periods indicated.
| Years Ended December 31, | Nine Months Ended September 30, |
|||||||||||||||||||
| 2008 | 2009 | 2010 | 2010 | 2011 | ||||||||||||||||
| (unaudited) | ||||||||||||||||||||
| (in thousands) | ||||||||||||||||||||
| Net cash used in operating activities |
$ | (5,401 | ) | $ | (16,021 | ) | $ | (17,298 | ) | $ | (13,637 | ) | $ | (21,360 | ) | |||||
| Net cash provided by (used in) investing activities |
13,780 | 565 | (42,645 | ) | (815 | ) | (3,149 | ) | ||||||||||||
| Net cash provided by financing activities |
3,770 | 9,997 | 89,044 | 21,022 | 59,424 | |||||||||||||||
Operating Activities
Our primary uses for cash from operating activities are costs for product sales, personnel-related expenses and research and development-related expenses. Uses of cash are offset by cash received from product sales and grant revenue. Our primary source of grant revenue is a $2.5 million grant from the U.S. Department of Energy that we were awarded in December 2009.
Cash used in operating activities of $21.4 million during the nine months ended September 30, 2011 reflected our net loss of $121.0 million offset, in part, by non-cash charges totaling $102.7 million and changes in operating assets and liabilities of $2.9 million. Non-cash charges primarily included a loss of $98.8 million from a change in fair value of our warrants.
Cash used in operating activities of $13.6 million during the nine months ended September 30, 2010, reflected our net loss of $20.3 million offset by non-cash charges totaling $8.2 million and changes in operating assets and liabilities of $1.5 million. Non-cash charges primarily included depreciation and amortization of $1.6 million and non-cash interest expense and amortization of debt discounts of $3.3 million. The net change in our operating assets and liabilities was primarily a result of an increase in accounts receivable of $1.5 million.
64
Table of Contents
Cash used in operating activities of $17.3 million in 2010 reflected our net loss of $27.3 million offset by non-cash charges totaling $11.3 million and changes in operating assets and liabilities of $1.3 million. Non-cash charges included depreciation and amortization of $2.1 million, a loss of $4.5 million from a change in fair value of our warrants and non-cash interest expense and amortization of debt discounts of $4.4 million. The net change in our operating assets and liabilities was primarily a result of an increase in inventory of $2.0 million and an increase in accounts payable of $1.2 million. The increase in inventories reflected purchases of catalyst in anticipation of commercial production of biorefinery products.
Cash used in operating activities of $16.0 million in 2009 reflected our net loss of $16.8 million offset by non-cash charges totaling $2.0 million and changes in operating assets and liabilities of $1.1 million. Non-cash charges included depreciation and amortization of $2.0 million. The net change in our operating assets and liabilities was primarily a result of an increase in other current assets of $0.8 million.
Cash used in operating activities of $5.4 million in 2008 reflected our net loss of $8.2 million offset by non-cash charges totaling $0.3 million and changes in operating assets and liabilities of $2.5 million. The net change in our operating assets and liabilities was primarily a result of a decrease in a related party receivable from Cargill of $1.2 million, a decrease in other current assets of $1.3 million, a decrease in accounts payable of $0.8 million. The decrease in other current assets includes a $0.6 million prepayment to Materia in December 2008 for catalyst.
Investing Activities
Our investing activities consist of capital expenditures and the purchases and sales of short-term investments. We invest proceeds from equity offerings in money market accounts or short-term debt securities until the capital is required for operating purposes.
During the nine months ended September 30, 2011, cash used in investing activities totaled $3.1 million and was comprised of capital expenditures totaling $23.9 million which were primarily related to the purchase of the Mississippi facility, the construction of the Indonesia facility and a letter of credit related to a facility lease totaling $1.2 million. These cash expenditures were offset by the net maturities of short-term investments totaling $21.9 million which was used to fund operating requirements.
During the nine months ended September 30, 2010, cash used in investing activities totaled $0.8 million and was comprised of capital expenditures for the construction of a pilot plant at our Bolingbrook, Illinois facility.
In 2010, cash used in investing activities was $42.6 million and was comprised of capital expenditures totaling $1.9 million, which were primarily related to the construction of the Indonesia facility and the expansion of our Bolingbrook facility. Additionally, we made net purchases of $40.7 million of short-term investments.
In 2009, cash provided by investing activities totaled $0.6 million.
In 2008, cash provided by investing activities totaled $13.8 million and was comprised of capital expenditures totaling $3.0 million primarily related to leasehold improvements, which was offset by cash provided by the net sale of short-term investments which totaled $17.1 million.
Financing Activities
During the nine months ended September 30, 2011, cash provided by financing activities was $59.4 million primarily due to the net proceeds of $50.2 million received from the sale of our Series D preferred stock and $9.0 million of contributions from Wilmar, our partner in the Wilmar JV.
65
Table of Contents
During the nine months ended September 30, 2010, cash provided by financing activities was $21.0 million primarily due to the net proceeds of $19.9 million received from the sale of convertible notes and warrants.
In 2010, cash provided by financing activities was $89.0 million primarily due to the net proceeds of $67.6 million from the sale of our Series C preferred stock and $19.9 million from the sale of convertible notes and warrants.
In 2009, cash provided by financing activities was $10.0 million primarily due to proceeds of $9.9 million from the sale of convertible notes and warrants. On May 27, 2009, we entered into a research agreement with respect to a canola research proposal (the “Saskatchewan Research Agreement”) with the Saskatchewan Canola Development Commission (the “SCDC”). Pursuant to the Saskatchewan Research Agreement, we agreed to conduct certain canola oil-related research for the Saskatchewan Commission in exchange for up to CAD $250,000, 50% of which is considered a grant from the SCDC and 50% of which is considered a loan. Principal payments of CAD $7,981 on the loan are payable in 15 equal installments on May 1 of each year beginning on May 1, 2011 and continuing through May 1, 2025. The loan does not bear interest except that any amounts in default shall bear interest at a rate of 5% per annum.
In 2008, cash provided by financing activities was $3.8 million primarily due to the proceeds from the exercise of warrants for the purchase of Series B preferred stock.
Contractual Obligations and Commitments
The following table summarizes our long-term contractual obligations and commitments as of September 30, 2011.
| Payments Due by Period | ||||||||||||||||||||
| Contractual Obligations |
Total | Less than 1 Year |
1-3 Years |
3-5 Years |
More Than 5 Years |
|||||||||||||||
| (in thousands) | ||||||||||||||||||||
| Long-term debt obligations |
$ | 107 | $ | 7 | $ | 15 | $ | 15 | $ | 70 | ||||||||||
| Operating lease obligations |
13,487 | 137 | 2,263 | 2,467 | 8,620 | |||||||||||||||
| Purchase commitments |
54,156 | 3,642 | 17,886 | 16,628 | 16,000 | |||||||||||||||
|
|
|
|
|
|
|
|
|
|
|
|||||||||||
| Total |
$ | 67,750 | $ | 3,786 | $ | 20,164 | $ | 19,110 | $ | 24,690 | ||||||||||
|
|
|
|
|
|
|
|
|
|
|
|||||||||||
The majority of our purchase commitments arise from license and joint development agreements. Commitments under our license agreements require annual minimum purchases that generally remain fixed from year to year. The annual minimum purchases are at or below what management believes it will need to spend to run the business irrespective of contract requirements. Commitments arising from joint development agreements represent funding requirements for contracted research staff, which can vary over the term of a particular agreement. We have prepared the commitment table assuming current staffing levels will continue through the remainder of each agreement.
Off-Balance Sheet Arrangements
We did not have any off-balance sheet arrangements during the periods presented, and we do not currently have any relationships with unconsolidated entities, such as entities often referred to as structured finance or special purpose entities, established for the purpose of facilitating off-balance sheet arrangements or other contractually narrow or limited purposes.
66
Table of Contents
Quantitative and Qualitative Disclosure about Market Risk
We are exposed to financial market risks, primarily changes in interest rates, foreign currency exchange rates and commodity prices. All of the potential changes noted below are based on sensitivity analyses performed on our financial positions as of September 30, 2011. Actual results may differ materially.
Interest Rate Risk
Our exposure to market risk for changes in interest rates relates primarily to our investment portfolio. The primary objective of our investment activities is to preserve our capital for the purpose of funding our operations. We do not enter into investments for trading or speculative purposes. We generally invest our cash in investments with short maturities or with frequent interest reset terms. As of September 30, 2011, our investment portfolio consisted primarily of AAA money market funds and corporate bonds rated A- or higher, all of which are highly liquid investments. Due to the short-term nature of our investment portfolio, our exposure to interest rate risk is minimal.
Foreign Currency Risk
Our operations currently include manufacturing and sales activities primarily in the United States, as well as research activities primarily in the United States. We occasionally pay for contractor or research services in a currency other than the U.S. dollar. Today, we have minimal exposure to fluctuations in foreign currency exchange rates as the difference from the time period for any services performed which require payment in a foreign currency and the date of payment is short. We are actively expanding outside the United States, in particular through the Wilmar JV. As we expand internationally, our results of operations and cash flows will become increasingly subject to fluctuations due to changes in foreign currency exchange rates. We have not hedged our foreign currency since the exposure has not been material to our historical operating results. Although substantially all of our feedstock and sales are currently denominated in U.S. dollars, future fluctuations in the value of the U.S. dollar may affect the price competitiveness of our products outside the United States. We may consider hedging our foreign currency risk as we continue to expand internationally.
Commodity Price Risk
Our exposure to market risk for changes in commodity prices currently relates primarily to our cost of soy oil. We manage our exposure to this risk primarily through our Risk Management Agreement with Cargill. Pursuant to the Risk Management Agreement, prices that we pay Cargill are computed using a formula that may take into account both quarterly average feedstock futures prices and Cargill’s ownership cost of feedstocks, as adjusted to account for all of Cargill’s gains and losses from its futures and derivatives trading. We have not historically hedged the price volatility of soy oil. We are actively expanding our production capacity, in particular through our Wilmar JV and through the Mississippi facility. We will rely on commodity feedstocks such as palm, soy and rapeseed oils. In the future, we may manage our exposure to this risk by hedging the price volatility of feedstock, principally through futures contracts or entering into joint venture agreements that would enable us to obtain secure access to feedstock.
67
Table of Contents
Our Company
We produce high performance specialty chemicals and intermediate chemicals from renewable natural oils. The specialty chemicals that we currently produce and intend to produce address a potential market size that we estimate to be $176 billion. We produce these chemicals using our proprietary, low-cost, capital efficient production process, which utilizes Nobel Prize-winning innovations in metathesis catalysis. Our process uses a highly efficient and selective metathesis catalyst to break down the complex molecules found in natural oils and recombine the fragments to produce high value chemicals. We can produce these chemicals at lower cost and with lower capital investment than conventional processes positioning us to deliver attractive returns on capital. We are building the Indonesia facility as part of the Wilmar JV. We plan to begin commercial operations at this facility by the second quarter of 2012. We are also repurposing an existing facility in Natchez, Mississippi into an integrated biorefinery. We expect construction of our first two facilities to cost $215 to $535 per metric tonne ($0.10 to $0.25 per pound) of annual production capacity compared to $920 to $2,300 per metric tonne ($0.42 to $1.04 per pound) of annual production capacity for conventional facilities. We have established strategic partnerships with market leaders to accelerate the commercialization and rapid deployment of our technology.
Our specialty chemicals have unique and desirable functional attributes previously unavailable in the marketplace. We believe these products will be key performance ingredients and building blocks used in large end markets including detergents, lubricants, personal care products, coatings and plastics. Our intermediate chemicals, namely olefins and oleochemicals, can directly replace critical molecules in large, attractive markets. We expect that prevailing market dynamics, such as the desire for new and increasingly demanding performance characteristics, changing regulatory requirements and structural supply shortages will support rapid adoption of our specialty chemicals and market penetration of our intermediate chemicals. We are in discussions with existing partners and potential new customers for long-term purchasing or offtake agreements for the entirety of our projected 2013 production.
Our conversion process is more direct and energy-efficient than conventional conversion processes, which results in lower unit level production costs and lower up-front capital expenditures. In addition, we have demonstrated our ability to secure a premium for certain high performance specialty chemicals. Unlike conventional processes, we are able to adjust the mix of chemicals we produce by changing our feedstock and operating conditions in real time. This allows us to both target the production of specific high-value chemicals in response to market dynamics and avoid the production of less desirable, lower priced co-products.
We have entered into the Wilmar JV with a subsidiary of Wilmar to build our first world-scale biorefinery. The Indonesia facility, at a total construction cost of approximately $40 million, is fully funded and under construction and will have an annual production capacity of 185,000 metric tonnes (400 million pounds) with an option to expand to 370,000 metric tonnes (810 million pounds). We have structured feedstock and product marketing arrangements with Wilmar for the Indonesia facility. By the end of 2014, we expect to be operating additional world-scale facilities in both North and South America and expect to have combined annual production capacity from our first three facilities of approximately one million metric tonnes (2.2 billion pounds). We plan to rapidly deploy our technology using a combination of modular facility design and repurposing of or integration with existing industrial sites. All of our products are currently manufactured using tolling facilities, which are facilities owned and operated by third parties with whom we contract for such production. We have produced our chemicals at commercial scale through multiple production campaigns ranging in size from 23 metric tonnes (50,000 pounds) to 450 metric tonnes (one million pounds), including two production campaigns that utilized our proprietary biorefinery process, the first of which was completed in November 2010. Our use of tolling facilities has enabled us to validate the target cost of production for our biorefineries because these tolling facilities are similar in size and have similar process conditions as the commercial scale facilities we are designing and constructing. We plan to continue to use tolling facilities to a limited extent after we complete construction of our biorefineries.
68
Table of Contents
The following chart sets forth our intended product portfolio.
Intended Product Portfolio
To date, our revenues have been primarily derived from product sales in the performance waxes and candles markets and in the personal care markets, which utilize our specialty chemicals. The sales into these markets constituted approximately 91% and 96% of our revenue in the nine months ended September 30, 2011 and 2010, respectively.
Our primary feedstocks will include palm, soy and rapeseed oils, all of which we have used in our pilot plant to produce an array of specialty chemicals and intermediate chemicals. These natural oils are available in liquid form in industrial quantities from a variety of geographic regions. These characteristics allow for low-cost transportation and storage compared to other renewable feedstocks such as industrial sugars, biomass and waste. Our ability to adjust our inputs in real time allows us to take advantage of changes in feedstock prices and product demand. We have used multiple natural oils to produce our products to date. Palm oil was used in commercial-scale toll production runs mirroring our biorefinery process. Soy oil has been used in multiple toll production runs using our metathesis process to produce material for cosmetics, polymer modification and industrial applications. Canola and mustard oils have been used to produce products in our pilot plant. We have also tested other oils at lab scale including algae, camelina, pennycress, jatropha and waste oils.
Our collaborative business model is designed to accelerate the commercialization and rapid deployment of our technology. We have established strategic partnerships with market leaders in the specialty chemical and intermediate chemical value chains, including Cargill, Clariant, Dow Corning, DSM, Stepan and Wilmar. These partners provide us with sales and marketing expertise, established distribution channels, technical know-how, product and application development expertise and manufacturing infrastructure.
Industry Overview
According to the OECD, the market size of the global chemical industry was approximately $4.0 trillion as of June 2011. Chemicals are a key component used in the production of most products and materials used in everyday life.
Chemical families are grouped based on the feedstocks from which they are produced. For example, petrochemicals are produced from petroleum and natural gas feedstocks. Oleochemicals are produced from plant
69
Table of Contents
oils, such as palm, soy or rapeseed, or animal oils, such as tallow. Key value drivers for chemical producers include product demand and resulting pricing trends, production economics, feedstock strategy and geographic footprint.
| • | Product demand and resulting pricing trends. Product demand is driven by customer preferences and requirements, market supply, regulatory specifications and the cost and performance of competing products and technologies. |
| • | Production economics. Chemical industry production economics are driven by both the capital cost of building facilities and the cash flow generated by these facilities which is a function of operating costs and the price of the final products. |
| • | Feedstock strategy. Feedstock costs typically represent a significant portion of product cost. Therefore, chemical producers can create value by mitigating the cost and volatility of their feedstocks. Key drivers to manage these costs are developing and licensing process technologies and locating in regions with access to cost advantaged feedstocks. |
| • | Geographic footprint. Some feedstocks or chemical products are located or produced in only certain regions and are difficult or costly to ship, requiring producers to locate facilities close to cost-advantaged feedstock sources or customers. In addition, the geography of the production footprint often drives producer supply chain economics. |
Chemical families are also grouped based on their performance, their relative availability and their ability to add value to downstream products.
Market Structure and Value
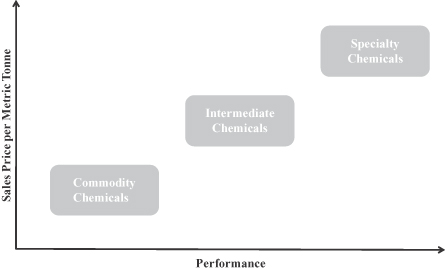
Specialty Chemicals
We believe the size of the global specialty chemical industry was approximately $706 billion in 2010. Specialty chemicals are sold based on the additional value their unique and tailored performance characteristics deliver versus intermediate chemicals or commodity chemicals, which must only meet general specifications. As a result, demand for specialty chemicals is generally driven by customer-specific requirements to enable product performance.
Because specialty chemicals are sold into specific applications, they generally command a higher price and margin than intermediate chemicals and commodity chemicals. Due to their use in specific applications, the
70
Table of Contents
added value of specialty chemicals is more affected by performance attributes than supply and demand dynamics or raw material pricing. Once specialty chemicals are tailored to a given customer’s specifications, there are generally high switching costs for that customer. Specialty chemical producers are required to maintain a strong application development function and a knowledgeable technical sales force to develop, market and support the use of specialty products. These capabilities allow producers to develop product solutions with their customers in response to evolving consumer preferences or changing regulatory requirements.
A number of key challenges currently impact the specialty chemical industry, including the following:
| • | demand for improved performance characteristics driven by evolving consumer preferences or changing regulatory requirements; |
| • | limited availability of certain critical feedstocks and intermediate chemicals; |
| • | feedstock price level and volatility; and |
| • | increasing demand for products made from non-toxic, environmentally friendly and renewable sources. |
We develop applications that will go into several large segments of the specialty chemical industry. Our primary target markets in the specialty chemical industry include surfactants, lubricants and additives and polymers.
Surfactants
Surfactants are substances that give products the ability to remove dirt from surfaces such as skin, plastics and textiles. This property is what allows laundry detergents, for example, to penetrate fabric and capture and lift dirt away from clothing. Surfactant performance is primarily driven by the ability of the liquid in which it is carried to wet, or penetrate, another material, such as a fabric. This property is known as “wettability” and is what allows the surfactant to access the dirt particles that it has been designed to remove. The primary use of surfactants is in the detergents, cleaners and personal care markets. Today, surfactants are derived from two main sources, olefins and oleochemicals.
Within surfactants, specialty surfactants provide multiple functional attributes, better efficacy and offer better characteristics for formulation that cannot be obtained with intermediate and commodity surfactants. For example, one key performance attribute that we believe consumers are demanding is cold water surfactant efficacy. Consumers in developed countries desire cold water performance, as it reduces energy intensity for everyday fabric cleaning. In addition, consumers in developing countries look for cold water performance due to limited access to hot water. Other attributes of specialty surfactants include increased formulation concentration, which reduces shipping and packaging costs, and multifunctionality, such as two-in-one products driven by consumer demand for convenience.
Specialty surfactant pricing varies widely based on the efficacy and functional attributes they deliver and they are typically sold at a premium to high volume surfactants. According to the Freedonia Group, Inc., specialty surfactants were expected to sell for a price ranging from $2,690 to $5,997 per metric tonne ($1.22 to $2.72 per pound) in 2009.
Lubricants and additives
Lubricants are used to reduce friction between moving surfaces. Other functional attributes of lubricants include transporting foreign particles and distributing heat. Lubricants are utilized primarily in engines and gear boxes found in automobiles, trucks and industrial equipment. They are formulated using base oil, typically 80% to 90% of the finished lubricant formulation, and additives which enhance the resistance to friction, corrosion and wear, improve the stability or otherwise boost the performance of the base oil. These enhanced properties enable the lubricant to meet performance requirements for a given application.
71
Table of Contents
Lubricant base oils are classified by the American Petroleum Institute (“API”) into groups based on their composition and physical properties. Group I, II and III base oils are produced using mineral oils. Base oils made from alpha olefins are known as polyalphaolefins (“PAOs”) or Group IV base oils and those made from esters, alcohols or glycols are known as Group V base oils.
Management estimates the size of the existing synthetic high performance base oil market, which we define as API Group III, Group IV and Group V base oils, is approximately 4 million metric tonnes (9 billion pounds) per year and represents approximately $8.5 billion in annual revenues. These synthetic base oils represent both the fastest-growing and highest-performing segment of the lubricants market. Management estimates the average selling prices in this market range from $1,720 to $4,410 per metric tonne ($0.78 to $2.00 per pound). Several factors are driving increased usage of Groups III, IV and V base oils compared to Groups I and II: desire for reduced oil change frequency; requirements for improved fuel economy; and improved lubricating performance.
A new base oil that is expected to come to market in 2011 is gas-to-liquids (“GTL”) base oil. Under a development and production sharing agreement with the government of the state of Qatar, Royal Dutch Shell plc has invested billions of dollars in a GTL facility designed to produce products including fuel and high purity base oils that commenced operations in 2011. GTL base oils are expected to have better performance characteristics than Group III base oils and are being commercialized by Shell through their own lubricant brands. Shell’s major lubricant competitors are looking for alternative, high-performing technology that will enable them to differentiate their lubricants and compete effectively against this new entrant.
We are also targeting the additives market segment. Management estimates that 3.8 million metric tonnes (8.4 billion pounds) of additives were used in lubricants and fuels in 2007 to enable them to meet performance requirements. For example, additives are required in diesel fuel and rapidly growing bio-diesel fuel blends to prevent them from becoming thick or even solid in cold temperatures. Additives enable lubricant formulators and fuel blenders to improve lubricity, modify viscosity at different temperatures, provide detergency to control soot or other impurities, and prevent or reduce corrosion in final products. Management estimates that typical fuel additives prices range from $1,874 to $3,968 per metric tonne ($0.85 to $1.80 per pound) and common lubricant additives prices range from $1,102 to $5,732 per metric tonne ($0.50 to $2.60 per pound).
Polymers
Polymers, commonly referred to as plastics, consist of a broad range of polymer resins manufactured from monomers. Monomers, typically olefins and other highly reactive chemicals, are linked together in long chains to produce polymers with performance attributes that are a function of the type and mix of monomers utilized. Polymers generally are replacing traditional materials, such as metals and ceramics, in order to reduce weight and cost and improve end product performance. The market includes high volume commodity polymers and lower volume, higher performance specialty polymers. Specialty polymers offer unique and tailored functional attributes and characteristics that cannot be addressed by the commodity classes. For example, the melting point of polypropylene, a low-cost commodity polymer, is 160 degrees Celsius while specialty polymer melting points can exceed 300 degrees Celsius. In addition to better thermal properties, attributes of specialty polymers include increased strength, corrosion resistance and electrical insulation.
The ability of engineering polymers to provide benefits such as high temperature performance or weight reduction has led to strong growth. A key challenge facing specialty polymer producers is procuring enough feedstock or monomer on a cost-effective basis given episodes of limited availability and increasing and volatile pricing.
Specialty polymer pricing varies widely based on the type of resin and the performance characteristics offered by the material. These specialty resins are typically priced at a premium to commodity plastics. Management estimates that in the first quarter of 2011, commodity plastics generally sold at prices ranging from $1,186 to $1,988 per metric tonne ($0.54 to $0.90 per pound) and specialty polymers, depending on the type of
72
Table of Contents
polymer, generally sold at prices ranging from $6,614 to $15,432 per metric tonne ($3.00 to $7.00 per pound). In 2004, this category of plastic constituted just over 10% of the total plastic market on a volume basis and amounted to approximately 16 million metric tonnes (35 billion pounds) per year of consumed material.
Intermediate Chemicals
As the building blocks for most of the finished products in the industry, intermediate chemicals have higher margins per unit than commodity chemical feedstocks. A number of key challenges are affecting the market for intermediate chemicals, including the following:
| • | Increasing cost, volatility and scarcity of certain key feedstocks leading to uncertain profitability; |
| • | Limited flexibility to produce higher value chemicals without also producing other lower value chemicals given that conventional processes produce a largely fixed product mix; |
| • | Need for new regional supply to meet increasing emerging market demand; and |
| • | Increasing demand for products made from renewable sources. |
Our manufacturing platform will convert renewable feedstocks into two key categories of intermediate chemicals: olefins and oleochemicals.
Olefins
Olefins are chemicals used, in combination with other olefins or intermediate chemicals, to produce a large portion of downstream chemical products. Olefins are generally produced through a highly energy intensive, multi-step process involving high temperatures and pressures to convert naphtha (a petroleum derivative) and natural gas feedstocks into molecules with added functional attributes. The most common olefin is ethylene, a two carbon molecule with a double bond. Olefins are very reactive with other chemicals, making them useful in the conversion into downstream higher value added products.
Olefins are categorized based on the number of carbon atoms each molecule contains. For example, ethylene and propylene, the smallest of the olefins, have two (C2) and three (C3) carbon atoms, respectively. These olefins represent the largest volume and lowest value olefins derived from petroleum and natural gas. Examples of higher value olefins are LAOs and LIOs with four or more carbon atoms per molecule. We estimate that the total LAO and LIO market size was $7 billion in 2008.
We focus our production output on higher value olefins, specifically those LAOs or LIOs with ten or more carbon atoms. Intermediate olefins are generally used in the production of alcohols used in detergents and PAOs used in Group IV synthetic lubricants and oilfield chemicals.
Conventional LAO production technology is limited by the inability to change product mix to match demand. As demand for different LAOs is growing at different rates while the supply mix has remained fairly static, certain types of LAOs are in short supply while other types are in surplus. For example, increasing use of synthetic lubricants has driven higher demand for decene (C10) versus other LAOs, but the supply of decene has not kept pace because producers have limited ability to change the production mix at their plants. Additionally, new construction of conventional LAO capacity would produce a combination of both C10 and lower value co-products. Our technology has inherently greater flexibility to change our product mix, and thus, in response to market dynamics, we currently focus our production on C10 to C14 molecules, while minimizing the production of other less profitable molecules.
Oleochemicals
Oleochemicals are a diverse set of building block chemicals derived from natural oil feedstocks such as plant oils and animal fats. These chemicals include fatty acids, fatty esters, fatty alcohols and glycerols. Plant oils
73
Table of Contents
and animal fats are made up of triglycerides, which are fatty acids of various lengths and levels of saturation linked together by a glycerol backbone. We estimate the market size for oleochemicals to be $38 billion in 2010. Some of the key raw materials used in the production of oleochemicals are palm, coconut, palm kernel and soy oils. Oleochemicals are typically produced through hydrolysis or transesterification. Hydrolysis, sometimes called steam or fat splitting, is a process whereby steam is reacted with a plant oil or animal fat to separate it into fatty acids and glycerol. Transesterification, which is also used for the production of biodiesel, is a process where methanol or other alcohols are reacted with these oils to produce fatty esters and glycerol. These oleochemical products can then be converted to derivatives or consumed in applications such as detergents, lubricants, personal care products, plastics, soaps and solvents.
Conventional technologies for producing oleochemicals have limited flexibility as their product mix is fixed based on the type of feedstock oil used. For example, an oleochemical producer who uses hydrolysis to process palm oil would produce a high proportion of palmitic acid, a C16 saturated fatty acid, while a producer who processes rapeseed oil would produce a high proportion of oleic acid, a C18 monounsaturated fatty acid.
The table below shows the fatty acid profiles (in percent) that are derived from several common natural oils using conventional hydrolysis technology.
| Fatty Acid Name |
Caprylic* | Capric* | Lauric* | Myristic* | Palmitic* | Palmitoleic | Stearic* | Oleic | Linoleic | Linolenic | Gadoleic | Erucic | Others | Total | ||||||||||||||||||||||||||||||||||||||||||||||
| Number of Carbons : |
||||||||||||||||||||||||||||||||||||||||||||||||||||||||||||
| Number of Double Bonds |
C8:0 | C10:0 | C12:0 | C14:0 | C16:0 | C16:1 | C18:0 | C18:1 | C18:2 | C18:3 | C20:1 | C22:1 | Various | Saturated | Unsaturated | |||||||||||||||||||||||||||||||||||||||||||||
| Canola oil |
— | — | — | — | 5.0 | 0.4 | 1.8 | 57.5 | 22.7 | 10.6 | 1.5 | — | 0.5 | 7.3 | 92.7 | |||||||||||||||||||||||||||||||||||||||||||||
| Coconut oil |
5.8 | 6.5 | 51.2 | 17.6 | 8.5 | — | 2.7 | 6.5 | 1.2 | — | — | — | — | 92.3 | 7.7 | |||||||||||||||||||||||||||||||||||||||||||||
| Corn oil |
— | — | — | — | 12.5 | — | 1.8 | 27.4 | 57.6 | 0.7 | — | — | — | 14.3 | 85.7 | |||||||||||||||||||||||||||||||||||||||||||||
| Palm kernel oil |
3.6 | 3.5 | 47.3 | 16.4 | 8.1 | Trace | 2.3 | 16.2 | 1.8 | Trace | — | — | 0.8 | 81.9 | 18.1 | |||||||||||||||||||||||||||||||||||||||||||||
| Palm oil |
— | — | 0.2 | 1.1 | 44.0 | 0.1 | 4.5 | 39.2 | 10.1 | 0.4 | — | — | 0.4 | 50.2 | 49.8 | |||||||||||||||||||||||||||||||||||||||||||||
| Rapeseed oil |
— | — | — | — | 3.4 | 0.3 | 1.2 | 16.5 | 16.2 | 9.5 | 8.8 | 41.4 | 2.7 | 7.3 | 92.7 | |||||||||||||||||||||||||||||||||||||||||||||
| Soy oil |
— | — | — | — | 11.3 | — | 3.4 | 23.1 | 55.8 | 6.4 | — | — | — | 14.7 | 85.3 | |||||||||||||||||||||||||||||||||||||||||||||
| Tallow (beef) |
— | Trace | Trace | 3.5 | 27.4 | 4.5 | 18.2 | 40.0 | 2.6 | Trace | — | — | 3.8 | 51.3 | 48.7 | |||||||||||||||||||||||||||||||||||||||||||||
Source: ACME-Hardesty Co.
* Indicates saturated, or no carbon-carbon double bonds.
These various fatty acids have different chemical properties which make them desirable in different products. The applications in which fatty acids and fatty esters are used are determined by their carbon chain lengths, which range from C8 to C22. The fastest growing and highest value oleochemicals due to their increasing use in liquid detergents made from fatty alcohols are lauric (C12) and myristic acids (C14).
C10, C12 and C14 acids experience periodic significant price increases compared to other fatty acids such as C16 and C18 and bulk oils like palm oil. Historical spot prices published with permission from ICIS for various fatty acids in Southeast Asia are shown below and illustrate these price trends.
74
Table of Contents
Historical Fatty Acid Prices in Southeast Asia by ICIS
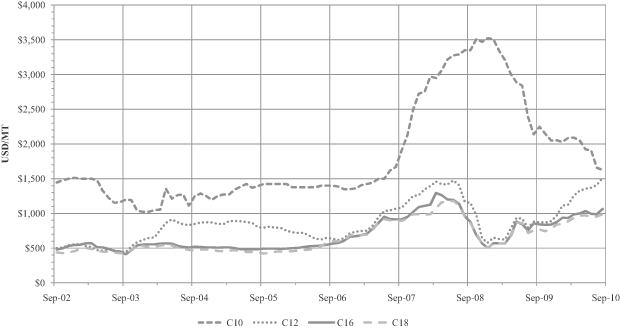
Fatty acid prices are influenced by their value in end-use applications and their supply availability. The value in end-use applications of a given fatty acid relates to its chemical properties, while its availability relates to its proportional presence in various natural oils and the supply of those oils.
Our Solution
Our proprietary process technology and the catalyst that we exclusively license and source from Materia enable us to produce both unique specialty chemicals with desirable functional attributes previously unavailable in the marketplace, as well as key intermediate chemicals that are in limited supply. For more information regarding our license with Materia, including a discussion of its duration, see “—Intellectual Property.”
We combine the performance attributes of both oleochemicals and olefins into di-functional specialty chemicals that we believe cannot be economically produced by either the oleochemical or olefin industry, providing our customers new solutions to address their performance challenges. We believe we will be able to produce these specialty chemicals economically through our biorefineries and to sell them at competitive prices. We expect our product characteristics to drive rapid adoption by customers looking for solutions to their product performance needs.
Our intermediate chemicals, which include olefins and oleochemicals are produced from renewable feedstocks and are direct replacements for olefins and oleochemicals for produced using conventional processes which demand is growing and supply is constrained. Our ability to use a wide variety of natural oil feedstocks and to produce our intermediate chemicals in several regions can help our customers mitigate input cost volatility and reduce supply concerns.
Our Competitive Strengths
Our business model benefits from a number of competitive strengths, including the following:
| • | Proprietary technology. Our proprietary metathesis technology platform utilizes Nobel Prize-winning innovations in metathesis catalysis. Our platform enables us to produce high-value specialty chemicals |
75
Table of Contents
| and direct replacement intermediate chemicals that are cost-advantaged compared to those available from conventional production methods. We own or have exclusive rights to intellectual property that protect this technology, including innovations in feedstocks, catalysts, manufacturing and processing, intermediate chemicals and finished products. As of September 30, 2011, our patent portfolio included title to 44 U.S. and foreign patents, 127 patent applications and over 138 exclusively licensed patents. |
| • | High performance products. Our specialty chemicals have unique and desirable functional attributes previously unavailable in the marketplace. We are currently commercializing products that have enhanced performance features such as: fuel additives that enhance cold flow properties; plastic processing additives that provide excellent thermal stability, extremely low volatility and good release/anti-sticking effects; and personal care products that provide natural moisturizing for the skin, but impart a smoother feel than petrolatum (petroleum jelly). In addition, we have filed patent applications for both surfactants and lubricants where our specialty chemicals have enabled advancements in performance. We expect new and increasingly demanding performance characteristics together with changing regulatory requirements will support rapid adoption of our specialty chemicals. |
| • | Low capital requirements. Our biorefinery design requires less capital per unit of production than conventional technologies because of the following characteristics: (1) fewer major process steps; (2) lower operating temperatures and pressures; (3) limited production of hazardous and toxic by-products; and (4) the ability to integrate our process into existing industrial sites. To produce a similar range of intermediate olefins via conventional technologies would require at least one additional major processing step and would require approximately $2,300 per metric tonne ($1.04 per pound) of production capacity if constructed in the United States. This cost is more than four times what we estimate the Mississippi facility will cost to repurpose. |
| • | Low operating costs. Conversion using our process achieves lower unit-level production costs than alternative routes to comparable products because of the following characteristics: (1) more direct process, resulting in fewer conversion steps; (2) highly efficient and selective catalyst; (3) feedstock flexibility; and (4) lower operating temperatures and pressures, resulting in greater energy efficiency. For each metric tonne (or pound) of intermediate olefins produced, our process reduces the average conversion cost net of feedstock from $313 per metric tonne ($0.14 per pound), when using conventional processes, to $63 per metric tonne ($0.03 per pound) when using ours. We expect our low unit production costs will allow us to operate without subsidies, mandates or green premiums. |
| • | Established partnerships with industry leaders. We have developed strategic partnerships which provide us with sales and marketing expertise, established distribution channels, technical know-how, product and application development expertise and manufacturing infrastructure. We currently have agreements with Cargill, Clariant, Dow Corning, DSM, Stepan and Wilmar, among others, and continue to explore additional partnerships that we believe will accelerate commercialization of our products. |
| • | Feedstock flexibility. Our primary feedstocks will include palm, soy and rapeseed oils, all of which we have used in our pilot plant to produce an array of specialty chemicals and intermediate chemicals. These natural oils are available in liquid form in industrial quantities from a variety of geographic regions. These characteristics allow for low-cost transportation and storage compared to other renewable feedstocks such as industrial sugars, biomass and waste. Our ability to adjust our inputs in real time allows us to take advantage of changes in feedstock prices and product demand. This capability provides us with a competitive advantage versus producers that operate facilities that only process a single feedstock, which typically results in a fixed product mix. |
| • | Large and well-established end markets. Our technology enables us to target a wide variety of end markets. We currently estimate our addressable specialty chemical markets represent $176 billion in annual commercial opportunity. Our ability to manufacture products addressing the detergents, |
76
Table of Contents
| cleaners, personal care products, specialty waxes, lubricants, lubricant and fuel additives, engineered polymers and coatings and intermediate chemicals markets diversifies our revenues across several products, customers and end markets. |
| • | Rapid deployment of commercial production. We can rapidly deploy our technology because of: (1) our ability to repurpose or integrate into existing industrial sites; (2) our low capital requirement per unit of capacity; (3) existing and available large markets for our products; and (4) our relatively short engineering, procurement and construction cycle. |
Our Strategy
Our goal is to become the global market leader in the design and production of specialty chemicals. The key elements for accomplishing our goal are:
| • | Complete rapid deployment of multiple world-scale facilities. We expect to have three world-scale facilities across three continents by the end of 2014, with combined annual production capacity of approximately one million metric tonnes (2.2 billion pounds). We expect the Indonesia facility, our first world-scale facility through the Wilmar JV, will begin commercial operations in the second quarter of 2012. We expect to be independently operating the Mississippi facility, our second facility, in 2013. We are evaluating sites for the construction of a third biorefinery in South America and expect this facility to begin commercial operations in 2014. As demand for our products grows, we intend to continue to construct new facilities across a broad range of geographic regions, employing a modular design that facilitates expedient and capital-efficient growth. |
| • | Develop new and existing market partnerships to accelerate growth and maximize profitability. To accelerate growth, we plan to continue cultivating strategic partnerships with industry leaders. These partners provide us with sales and marketing expertise, established distribution channels, technical know-how, product and application development expertise and manufacturing infrastructure. We plan to continue to retain exclusive marketing rights to our specialty chemicals, providing us control over the most valuable components of our product mix. |
| • | Invest in research and development to enhance product performance characteristics. We intend to leverage our extensive intellectual property portfolio to target unique solutions for customers demanding higher performance chemicals than those offered today. We plan to continue to develop new specialty chemicals with increased functional attributes, such as highly concentrated detergents and lubricants that enable better fuel economy. As we broaden our product offering, we believe our technology platform positions us to deliver superior functional attributes and sell competitively. We believe such products, tailored to meet performance specifications, benefit from high barriers to entry and strong customer retention. |
| • | Leverage feedstock flexibility to maximize margins. We continuously monitor the costs of various feedstock alternatives to take advantage of their imperfect price correlations to each other and to our selling prices. Based on our analysis of historical prices over the past decade, we believe our ability to use more than one feedstock at a single facility could improve gross profits (revenue less input and conversion costs) as a percent of revenue by approximately 4% to 5% per year on average and up to 16% in a single year. |
77
Table of Contents
Our Technology
Our proprietary process utilizes Nobel Prize-winning innovations in metathesis catalysis, a chemical reaction that uses a highly efficient and selective catalyst to break down and recombine molecules into new chemicals. We use metathesis to make novel, di-functional molecules, which will be the building blocks of our specialty chemical business. As shown below, these molecules combine the functional attributes of an olefin and a mono-functional ester or acid, typical of oleochemicals, in a single molecule.
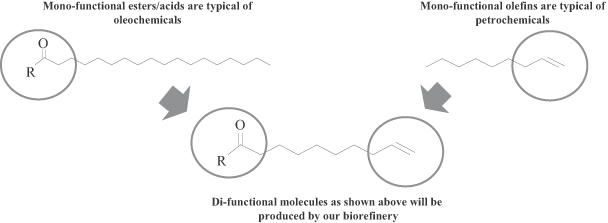
We believe we are the only company that can economically produce these di-functional chemicals which provide access to a large market opportunity. By providing both an olefin functional group and an ester or acid functional group, these di-functional building blocks allow us and our partners to access performance characteristics of both traditional petrochemical and traditional oleochemical chemistries on one molecule. For example, each of our 9-decenoic acid methyl ester and 9-dodecenoic acid methyl ester consists of olefin and methyl ester functional attributes.
Conventional producers have developed manufacturing capabilities using either olefins and related derivatives (largely produced from petroleum) or esters and acids (often oleochemicals derived from natural oils), though they and their customers desire the functional attributes of both. To access these functional attributes simultaneously, these producers have to blend and formulate a number of separate ingredients, which increases their production costs. Our di-functional building blocks change this paradigm by allowing the creation of specialty chemical molecules which simultaneously include desired attributes enabled by both chemistry families, such as lubricant base oils with improved stability or surfactants with improved solvency. In addition, our products can be used to provide a lower cost route to manufacture existing specialty molecules, such as diacids which are highly valued in the manufacture of polymers.
78
Table of Contents
Our breakthrough and cost-advantaged route to these di-functional molecules is enabled by metathesis. Metathesis is a powerful chemical reaction, initiated by using a catalyst, involving carbon-based molecules with at least one double bond between two carbon atoms (a “carbon-carbon double bond”). Metathesis breaks the carbon-carbon double bond and re-connects the molecule fragments in new ways. By changing the process conditions under which this reaction occurs, we can tailor which fragments are created. Metathesis can be used to perform chemical operations such as cleaving, coupling, ring-closing, ring-opening or polymerization. An example of the metathesis reaction is shown in the figure below.
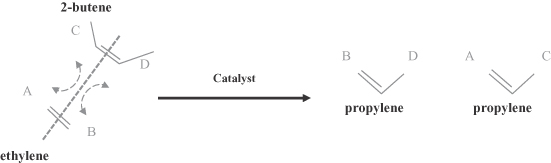
The earliest examples of metathesis date to the 1950s and showed that double bonds in olefins could be rearranged using certain catalysts. The first industrial olefin metathesis processes were developed in the petrochemical industry to produce higher-value chemicals through the metathesis of lower-value olefins. The early commercial applications of metathesis all utilized catalyst systems that were sensitive to air, water and the presence of polar functional groups. These catalyst limitations prevented significant utilization of olefin metathesis for synthesis of value-added functional molecules and polymers. Furthermore, these limitations made metathesis of functionalized molecules, such as natural oils, infeasible.
The 2005 Nobel Prize in Chemistry was shared by three researchers for their breakthroughs that made the metathesis of functional molecules possible. Among these laureates, Dr. Robert Grubbs of the California Institute of Technology (“Caltech”) developed metathesis catalysts that are highly active, stable in air and tolerant of reactants with functional attributes. Dr. Grubbs shared the Prize with Dr. Yves Chauvin and Dr. Richard Shrock. Dr. Chauvin discovered the mechanism by which metathesis operates, and Dr. Shrock invented metathesis catalysts that are highly active. As described below in “—Intellectual Property,” we have an exclusive license for the patents, for use with natural oils, owned and licensed to Materia, which includes all of the innovations created by Dr. Grubbs. We also have a license with XiMo for innovations either created by Dr. Schrock and his team or developed in collaboration with us.
79
Table of Contents
Because natural oils are functionalized molecules, prior to Dr. Grubbs’ innovations, the metathesis of natural oils would have been technically impractical and commercially uneconomic. Our proprietary biorefinery combines metathesis of natural oils with established industrial processes, such as transesterification and distillation, to economically produce specialty chemicals and direct replacement intermediate chemicals through a single process. Natural oils provide a wide array of useful molecule fragments that can be accessed through metathesis. The fragments below are among the most common that can be created from natural oils.
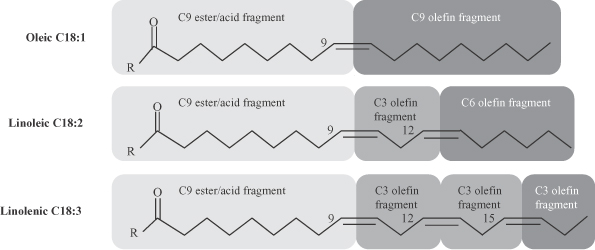
In our proprietary biorefinery design, a stream of natural oils, which are chemically made of triglycerides, is reacted with short-chain olefins, such as butene. This reaction allows us to cleave olefin molecules from the triglyceride, producing what we believe to be higher value olefins, including decene. Moreover, the metathesis reaction of the natural oil cleaves its triglycerides into ones rich in valuable, medium chain-length unsaturated fragments (C10-C15), as well as unreacted saturated long chain fragments (C16-C22). An example of how we react 1-butene with methyl oleate, a common natural oil component, is demonstrated below.
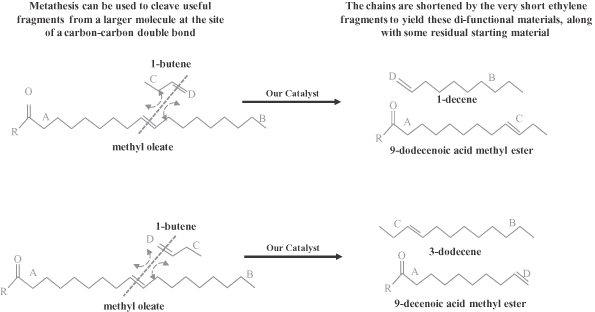
80
Table of Contents
When these unsaturated and saturated fragments are freed from the triglyceride’s glycerol backbone, the resulting unsaturated fragments produce a distribution of di-functional molecules, including fatty acids and esters, as further described below. The saturated fragments, which are inert to metathesis because they lack a carbon-carbon double bond, produce saturated acids, esters or oleochemicals. The figure below illustrates how we plan to produce our products from our biorefinery process.
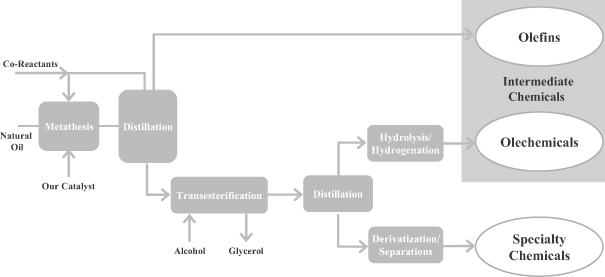
The reactor we have been using in toll manufacturing to date operates at a similar scale as will the reactor being installed at our first biorefinery.
Also, as demonstrated above, our biorefinery produces three main product streams: one stream of specialty chemicals and two streams of intermediate chemicals, namely olefins and oleochemicals, with which we will access a large commercial opportunity.
81
Table of Contents
Our Products and End Markets
Our products will include both specialty chemicals and intermediate chemicals. Our novel di-functional specialty chemicals enable the development of products that are both innovative and high value. Our customers are encouraged by our ability to produce specialty chemicals that allow them to manufacture products with enhanced functional attributes that can be sold at competitive prices. Our intermediate chemicals, which include olefins and oleochemicals will be direct replacements for both olefins and oleochemicals produced using conventional processes.
82
Table of Contents
Specialty Chemicals
The specialty chemicals we and our marketing partners derive from our building blocks will target large end markets with demand drivers such as: customer demand for improved performance characteristics; structural supply shortages for existing specialty chemicals and their respective feedstocks; increasing regulatory requirements; and desire for products made from non-toxic, environmentally friendly and renewable sources. Our three market platforms, Consumer Ingredients & Intermediates, Lubricants & Additives and Engineered Polymers & Coatings, through which we intend to initially sell our specialty chemicals, have a combined addressable market size that we estimate to be $176 billion.
Consumer Ingredients & Intermediates
| Market Platform/Segment (Addressable Market Size*) | Our Value Proposition | |
| Consumer Ingredients & Intermediates ($31 billion) | ||
| Detergents and cleaners ($20 billion) |
||
| • Specialty surfactants |
• Various formulation benefits including improved cold water performance, concentration, compaction, hard water tolerance and solvency
• Alternative alcohol feedstock to palm kernel oil, coconut oil and fossil fuels to address price and supply concerns | |
| Personal care products ($6 billion) |
||
| • High performance soy wax |
• Naturally derived wax, eliminates brittleness, adds body | |
| • Emulsifiers |
• Improved emulsification, improved film forming and emolliency, naturally derived | |
| • Soy petrolatum |
• Naturally derived and elegant aesthetics
• Anti-frizz and shine for leave-in hair care
• Moisturizing benefits and smoother feel for skin care | |
| Performance waxes ($5 billion) |
||
| • Plastic processing additives |
• Thermal stability with low volatility and good release/anti-stick effects | |
| • Soy and palm formulated wax blends for candles |
• Reliability of supply, increased fragrance loading | |
| • Palm wax blends for corrugated coatings |
• Improved recyclability, reliability of supply, sustainability | |
| * Management estimates |
||
Within our Consumer Ingredients & Intermediates platform, we are initially targeting the following three sub-segments: detergents and cleaners, personal care products and performance waxes.
Detergents and cleaners. We and our partners have identified high value differentiated surfactants addressing challenging performance and cost requirements for detergents and cleaners. Surfactant performance requirements that we intend to address include improving cold-water efficacy, which enables more concentrated formulations and improving solvency for better cleaning.
Cold water efficacy has a large impact on sustainability metrics and reduces energy costs. In addition, enabling cold water washing is critical in developing countries as segments of their households do not have access to hot water for laundry. As a result, there is a strong incentive for washing equipment manufacturers and detergent producers to develop, formulate and sell products that provide similar or better cleaning performance in colder water.
Another area where new solutions are desired by major consumer packaged goods companies is compaction. Compaction is the effort to reduce the quantity (volume) of detergent needed to wash a load of clothes. Enabling the consumer to wash more with less detergent creates significant value for the detergent producer resulting from reduced ingredient and packaging costs and reduced transportation and supply chain costs. Compaction would also assist consumer packaged goods companies in making progress on their sustainability goals. Given the
83
Table of Contents
di-functional nature of our starting materials, we are also working to develop surfactants that address more than one performance attribute. For example, certain of our surfactants also contain anti-microbial efficacy, which may lower the amount of anti-microbial additives required in product formulation and therefore reduce formulation and ingredient cost.
Today, we believe the functional attributes of the surfactants made from our biorefinery products will enable significant improvements on these and other highly desired performance attributes. Our work with Stepan, a leading producer of surfactants, has resulted in substantial progress and the filing of patent applications in the area of specialty surfactants.
Personal care products. Our personal care products address increasing consumer demand for natural ingredients and improved performance. We currently supply naturally-derived alternatives to petrolatum (petroleum jelly), which enables formulators to reduce the undesirable oily feel of traditional petrolatum and allows them to market the product as renewable. We provide ingredients for consumer products that are currently sold at major retailers in the United States. Through our partnership with Dow Corning, we are selling our personal care ingredients in South America, Europe and Asia. Consumer products into which our ingredients are currently formulated include skin and hair care products such as creams, lotions, lipsticks and hair pomades. We have been selling products to this market since 2008.
Performance waxes. We are currently commercializing, through our partnership with Clariant, plastic processing additives that provide excellent thermal stability, extremely low volatility and good release/anti-sticking effects. Our NatureWax candle products hold a significant share in the growing soy-based candle wax market in the United States. We attribute our market share to the demonstrated superior characteristics of our performance and candle wax products over those of conventional wax products, including improved glass container adhesion, support of higher fragrance loads and good hot and cold scent properties. Our products also avoid the security of supply and price issues of paraffin, beeswax, montan, carnauba and other performance waxes. For example, paraffins, the primary feedstock for petroleum derived waxes are shrinking in supply due to refining technology shifting to lubricants production instead of waxes. This dynamic creates a market opportunity for our renewable waxes.
Lubricants & Additives
| Market Platform/Segment (Addressable Market Size*) | Our Value Proposition | |
| Lubricants & Additives ($29 billion) | ||
| Lubricant base oils ($17 billion) |
• Reduction in formulation costs
• Improved fuel economy, wear and sludge resistance and stability
• Less frequent oil changes
• Alternative and renewable source of olefins for PAO | |
| Lubricant and fuel additives ($12 billion) |
||
| • Viscosity improvers, extreme pressure and anti-wear additives, dispersants
• Cold flow modifiers, lubricity enhancers, deposit control additives |
• Improved lubricity, detergency to control impurities, corrosion prevention
• Renewable and novel fuel additives to improve cold flow and lubricity
• Supply chain improvements | |
| * Management estimates |
||
The Lubricant & Additives platform represents a large market including lubricants used for automobile engines, industrial equipment, fluids in fabricating metals and fuel additives. Within the Lubricants & Additives platform, we are initially targeting two sub-segments with a combined addressable market size that we estimate to be approximately $29 billion: lubricant base oils and lubricant and fuel additives.
84
Table of Contents
Lubricant base oils. Within the broader lubricant base oil market, we focus on high performance synthetic base oils and the non-synthetic base oils our products can replace. We estimate our addressable markets in these segments to total $17 billion. Globally, high performance synthetic base oils represent the fastest growing segment of the lubricant base oils market. This growth is largely driven by increased demand from consumers and original equipment manufacturers for higher fuel efficiency and increased engine performance. We believe our products will replace critical feedstocks for PAOs and high value formulated lubricants. In addition, we have applied for patent protection for novel and groundbreaking functionalized base oils that can reduce the amount of expensive additives in lubricants while providing the same or better performance attributes.
Our di-functional specialty chemicals will produce functionalized base oils that will provide the consistency and stability of Group IV PAOs combined with the functional attributes of Group V products. This allows us to produce lubricants that reduce formulated costs and improve several performance metrics, including fuel economy, wear and sludge resistance and stability. The chart below shows relative performance on key base oil properties based on initial laboratory testing and structure analysis of our base oils.
Synthetic Base Oil Comparison
| Characteristic | Group III | Group IV | Group V* | Our
Base Oils | ||||
| Temperature Performance (Viscosity Index) |
+ | ++ | ++ | +++ | ||||
| Drain Interval (Oxidative stability) |
++ | +++ | ** | +++ | ||||
| Deposit Control (Polarity) |
+ | ++ | +++ | +++ | ||||
| Improved Fuel Economy (Viscosity, Lubricity, CCS) |
+ | ++ | ++ | +++ | ||||
| Wear Resistance for improved engine/equipment life (Film properties: thickness/lubricity) |
+ | ++ | ++ | +++ | ||||
* Ester-derived base oil used for comparison.
+ Improved performance when compared to mineral oil (non-synthetic) derived base oils and performance in the lower range of synthetic base oils.
++ Performance in the middle range of synthetic base oils.
+++ Performance in the upper range of synthetic base oils.
** Performance depends on specific base oil under consideration.
Source: Management estimates
We are able to provide lubricant marketers a favorable cost position and superior performance attributes through our functionalized base oils due to their di-functional nature. The enhanced performance of our functionalized base oils will provide lubricant marketers the opportunity to differentiate their products by providing increased performance while requiring fewer additives, which could reduce production costs. We are in advanced discussions with several global petroleum companies to commercialize our functionalized base oil products and lubricants products based on them.
Lubricant and fuel additives. Lubricants and fuels are typically enhanced with additives that allow a given product to meet performance requirements that the fuel or lubricant alone is not able to achieve. Currently, we are targeting several fuel and lubricant additives that provide a renewable alternative and also have the potential to improve cold flow properties and increase lubricity and detergency. Laboratory evaluations of our fuel additives have demonstrated significant positive impact on cold flow properties for which we have applied for patent protection. Major fuel producers are sampling our products, and we expect their feedback on this first generation of cold flow additives before the end of 2011.
85
Table of Contents
In lubricant additives, we are evaluating products for both greases and engine oils. We have established a collaboration with NL Grease, a private-label grease manufacturer, to evaluate and commercialize new, renewable, high performance materials. We are also working with a leading lubricant manufacturer that has completed successful initial evaluations of our blend additives that enhance the performance of Group III base oil.
Engineered Polymers & Coatings
| Market Platform/Segment (Addressable Market Size*) | Our Value Proposition | |
| Engineered Polymers & Coatings ($116 billion) | ||
| Monomers and building block chemicals used in: |
||
| • Specialty polyamides, polyesters and polyols ($25 billion)
• Epoxies and polyurethanes ($58 billion)
• Coatings and cross linking agents for coatings ($33 billion) |
• Enhanced corrosion, chemical and heat resistance and improved electrical insulation over existing alternatives
• Light-weight replacement for metal alternatives
• Ability to produce existing products via lower cost routes
• New source of C10 molecules
• Renewable products | |
| * Management estimates |
||
Within our Engineered Polymers & Coatings platform, we are initially targeting high performance polymers made from our di-functional building block molecules. We are targeting the following three sub-segments: specialty polyamides, polyesters and polyols; epoxies and polyurethanes; and coatings.
We believe one of our key specialty chemicals, 9-decenoic acid (“9DA”) ester, can be used as a renewable raw material to make many different types of engineering polymers and coatings. The flexible structure of 9DA ester enables us to produce a wide variety of monomers that can be reacted to produce specific engineered polymers and coatings. Our specialty chemicals enable di-functional monomers that provide more efficient routes to manufacture existing polymers. In addition, we intend to manufacture novel monomers to produce new polymers to meet emerging performance requirements and renewable monomers with more secure supply.
Specialty polyamides, polyesters and polyols. Engineered polymers, which include polyamides, polyesters, epoxies and polyurethanes, can be made from di-functional monomers and are used today in many industries and applications including automotive (under the hood applications, cables and hoses), electrical and electronics (electronic components, wire and cable and cell phones), fibers and textiles (carpet, high performance canvas, bristles and filters). These polymers are often replacements for metal components, but weigh less and can often be easier to process.
Specialty polyamides such as polyamide 12 and co-polymers such as polyamide 6,10 or polyamide 6,12 are produced from diacid monomers with nine or more carbon atoms, all of which are produced today using petrochemical feedstocks. Currently, only three diacids ranging in length from nine carbon atoms to twelve carbon atoms are commercially available for polymer applications. The use of chemical synthesis has not been commercially viable for producing polymer-grade diacids with more than twelve carbon atoms. C14 diacids may be produced by microbial oxidation of alkanes and fatty acids, but we believe their commercialization has been limited to date. In addition, the multi-step chemical conversion processes for petrochemical derived diacids produce unwanted hazardous by-products, which result in yield losses. These by-products must be destroyed before releasing to the environment. Disposal of a hazardous waste stream adds to the cost of production.
Another specialty polyamide, polyamide 11, is made from derivatives of castor oil, a vegetable oil harvested from the castor bean. Castor oil has numerous supply issues that have created a significant increase in price and volatility. Between July 2010 and July 2011, castor oil prices have risen from $1,816 per metric tonne ($0.82 per pound) to $2,632 per metric tonne ($1.19 per pound). Additionally, the process to manufacture polyamide 11 from castor oil involves toxic chemicals (cyanide) and high capital costs.
86
Table of Contents
Our target specialty polyamides are high value and high performing polymers made from long chain diacids. These polymers include homopolymers (polymers made from the same monomer) such as polyamide 11 and polyamide 12 which in 2009 had an average selling price in the United States of $15,432 per metric tonne ($7.00 per pound) and $7,275 per metric tonne ($3.30 per pound), respectively. Other specialty co-polymers (polymers made from two different monomers) include products such as polyamide 6,10 and polyamide 6,12, which in 2009 had average selling prices in the United States of $6,614 per metric tonne ($3.00 per pound) and $8,818 per metric tonne ($4.00 per pound), respectively.
Using our di-functional specialty chemicals, we have produced and sampled customers with diacids, including products with up to eighteen carbon atoms at purities required for polymer use. Our ability to produce diacids longer than twelve carbon atoms enables the production of polymers and co-polymers with unique performance characteristics. In addition, our diacid production requires less capital and is based on a widely available renewable oil. We believe these attributes will enable us to significantly expand the market for polyamides.
We are in advanced discussions with a variety of global chemical companies in the Engineered Polymers & Coatings platform, including DSM, to commercialize our engineered polymers products. DSM’s Engineering Plastics business unit is the market leader in high-temperature polyamides.
Epoxies, polyurethanes and coatings. Epoxies and polyurethanes are commonly used as high performance coatings to provide resistance to chemicals, heat and corrosion. We have demonstrated the ability to make novel epoxy molecules and polyols (a monomer for polyurethanes) based on our specialty chemicals and expect to develop products to meet the needs of these segments.
Intermediate Chemicals
Our intermediate chemicals include olefins and oleochemicals, both produced from renewable natural oils. We intend to sell our intermediate chemicals into large existing markets as direct replacements for olefins and oleochemicals produced using conventional processes meeting current industry specifications.
The following table sets forth the principal products in our olefin portfolio.
Olefin Portfolio
| Key Products | End Uses | |
| Decene (C10) |
PAOs for lubricants | |
| C11+ mixed cut |
Multiple, including hydrogenation to paraffins and fuels | |
| C11-C14 cut |
Surfactants | |
| C15+ cut |
Oil field chemicals, lubricants, paper sizing | |
Our olefins portfolio includes direct replacement products such as decene, a C10 olefin, octadecene, a C18 olefin, and other intermediate olefins (C10-C22). We believe this range of intermediate olefins includes high value-added intermediate chemicals where supply is constrained in the market. In addition to addressing unmet demand, our olefin products also satisfy increasing customer demand for sustainable product offerings. We are in discussions with existing partners and potential new customers for offtake agreements for the entirety of our projected 2013 olefin production.
A key product within our olefins portfolio is decene, which is the primary feedstock for PAOs. Strong growth of PAOs and the fixed LAO product distribution made from petrochemicals has resulted in a systemic shortage of decene. This has forced PAO producers to substitute less desirable olefins and produce lower quality base oil in order to meet consumer demand. This dynamic has created a strong opportunity for our naturally derived olefins, including decene made from our biorefineries.
87
Table of Contents
The following table sets forth the principal products in our oleochemical portfolio.
Oleochemical Portfolio
| Key Products | End Uses | |
| Fatty acids and esters |
Detergents, lubricants, solvents, plastics | |
| Fatty alcohol feedstocks |
Personal care, detergents | |
Our oleochemicals portfolio primarily includes C16 through C18 fatty esters, which can be sold as esters or converted into typical oleochemical intermediate chemicals such as fatty acids or fatty alcohols using a single processing step. We will also be able to produce oleochemicals as acids directly at the Indonesia facility. We intend to sell our oleochemicals into large existing markets as direct replacements meeting current industry specifications at prevailing market prices. For example, our saturated C16 oleochemicals can be sold into large markets, such as C16 acid and as a biodiesel component. Wilmar will act as the primary offtaker or marketing agent for our oleochemical production from the Wilmar JV. In addition, we are in discussions with existing partners and potential new customers for offtake agreements for the entirety of our projected 2013 oleochemical production from facilities other than the Indonesia facility.
In addition to the production of C16 through C18 fatty esters, we also intend to produce di-functional C10 through C15 fatty ester building blocks. While our goal is to sell these products as specialty chemicals, they also can be sold as intermediate chemicals that directly replace esters used in the production of fatty alcohols and detergents. These intermediate chemicals can be sourced otherwise at industrial scale only from palm kernel oil (“PKO”) and coconut oil. However, using our process, we could provide a cost-competitive alternative to imported PKO and CNO in the Americas or Europe using locally sourced soy or rapeseed oil.
A comparison of the fatty acid distribution possible from CNO and PKO compared with that available from soy or palm using our technology is shown below.
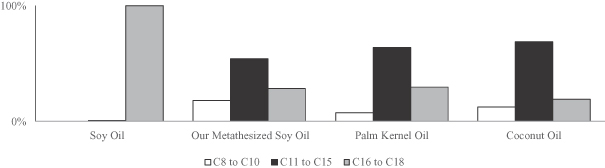
Source: ACME-Hardesty Co., management estimates
PKO and CNO are typically traded at a premium to bulk oils such as soy. Nearly all PKO and CNO is produced in Indonesia and Malaysia, whereas approximately 60% of global demand comes from other regions. In 2010, our ability to produce replacements for PKO and CNO from locally sourced and typically lower-cost oils would have created a $4.4 billion opportunity in the Americas or Europe alone. According to The Jacobsen, from January 2011 to July 2011, the average price of refined, bleached and deodorized PKO free on board New York was $2,135 per metric tonne ($0.97 per pound), while the average price of soy oil on the same basis during the same period was $1,384 per metric tonne ($0.63 per pound). This represented a historical peak spread of $751 per metric tonne ($0.34 per pound), providing an immediate feedstock cost advantage.
88
Table of Contents
Manufacturing Operations
We expect to have three world-scale facilities across three continents by the end of 2014, with a combined annual production capacity of approximately one million metric tonnes (2.2 billion pounds). In the second quarter of 2012, we expect to begin operating our first world-scale facility, the Indonesia facility through the Wilmar JV. We believe the Indonesia facility will be the world’s largest integrated biorefinery with an annual production capacity of 185,000 metric tonnes (400 million pounds), with an option to expand the additional production capacity to 370,000 metric tonnes (810 million pounds). We plan to be operating the Mississippi facility, a 280,000 metric tonne (610 million pound) biorefinery in the second half of 2013 at a site we have acquired. By the end of 2014, we expect to be operating an additional world-scale facility in South America.
Our biorefinery design requires less capital per unit of production than conventional technologies because of the following characteristics:
| • | fewer major process steps; |
| • | lower operating temperatures and pressures; |
| • | limited production of hazardous and toxic by-products; and |
| • | ability to integrate our process into existing industrial sites. |
The following chart sets forth a comparison of the anticipated capital costs of our first two biorefineries and those of alternative routes to comparative products.
Our Capital Costs Compared to
Alternative Routes to Comparative Products
| Kerosene to N-Paraffin for Linear Alkyl Benzene |
Naphtha to Ethylene to Intermediate Olefins* |
Our Process to Intermediate Olefins |
||||||||||
| $/metric tonne | $/metric tonne | $/metric tonne | ||||||||||
| Capital investment |
$ | 920 | $ | 2,300 | $ | 215-$535 | ||||||
| * | Excludes refinery capital required to produce naphtha from crude oil. |
Source: Management estimates
Our conversion process yields lower unit level production costs than alternative routes to comparable products. Attributes of our conversion process that reduce operating costs include the following:
| • | more direct process, resulting in fewer conversion steps; |
| • | highly efficient and selective catalyst; |
| • | feedstock flexibility; and |
| • | lower operating temperatures and pressures, resulting in greater energy efficiency. |
89
Table of Contents
The following chart sets forth a comparison of our conversion costs and alternative routes to comparative products.
Our Conversion Costs Compared to
Alternative Routes to Comparative Products
| Kerosene to N-Paraffin for Linear Alkyl Benzene |
Naphtha to Ethylene to Intermediate Olefins* |
Our Process to Intermediate Olefins | ||||
| $/metric tonne | $/metric tonne | $/metric tonne | ||||
| Utility |
$53 | $164 | $24 | |||
| Direct labor |
$49 | $74 | $15 | |||
| Fixed costs,
excluding |
$42 | $75 | $24 | |||
| Total conversion costs |
$144 | $313 | $63 | |||
| * | Excludes conversion costs to produce naphtha from crude oil. |
Source: Management estimates
The Indonesia facility is structured within the Wilmar JV. Wilmar is constructing the facility based on our design parameters, will provide operators to run the facility and will supply natural oil feedstocks. We currently anticipate that it will cost approximately $40 million to construct this facility, of which the majority has been invested to date. Wilmar will also market the oleochemicals produced at the biorefinery. We will provide the technology and have exclusive marketing rights to the specialty chemicals produced at this facility. The olefins produced at this facility will be jointly placed by us and Wilmar through supply agreements and in the spot markets.
Under the related shareholders agreement, Wilmar and we each control two of the four board seats and share responsibility for the management and supervision of the Wilmar JV. However, certain matters require the approval of at least 75% of the Wilmar JV’s directors. These matters include the approval of any new business plan, the incurrence of indebtedness, the distribution of cash or property and the sale or transfer of all or substantially all of the Wilmar JV’s assets.
The Wilmar JV’s Facility in Gresik, Indonesia
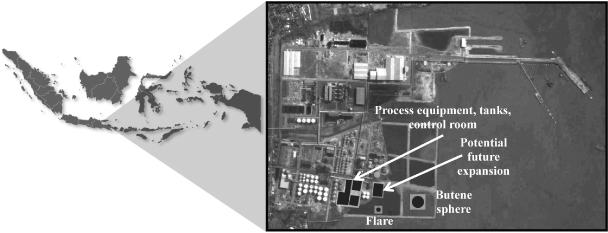
Our second world-scale facility, which we will own and operate, is located in Natchez, Mississippi. We currently anticipate that the Mississippi facility will cost approximately $150 million to construct and will have annual capacity of 280,000 metric tonnes (610 million pounds). We acquired the facility, a former 80 million
90
Table of Contents
gallon per year biodiesel facility, in June 2011 for approximately $16 million. We have begun engineering, are currently negotiating a related engineering, procurement and construction contract and expect to begin commercial operations in 2013. We are in discussions with petrochemical and agricultural processors to evaluate partnership and offtake opportunities for this facility.
Our Biorefinery Facility in Natchez, Mississippi

We expect our third world-scale facility to be located in South America. We are evaluating sites for the construction of this facility and expect to begin commercial operations in 2014. We are in discussions with petrochemical and agricultural processors to evaluate partnership and offtake opportunities for this facility.
We currently produce all of our products through tolling relationships with various partners. Although we do not have committed tolling capacity, we believe tolling manufacturers have sufficient capacity to continue to produce our products. We currently produce the majority of our NatureWax products through our supply agreement with Cargill. These products are produced at various Cargill facilities in the United States. We produce our biorefinery products at multiple toll manufacturers in the United States. We plan to continue to use tolling facilities to a limited extent after we complete construction of our biorefineries.
Our Primary Inputs
Feedstocks
We have the capability to use a wide variety of natural oils in our process, including emerging oils, such as those derived from algae. Our primary feedstocks will include palm, soy and rapeseed oils, all of which we have used in our pilot plant to produce an array of specialty chemicals and intermediate chemicals. These natural oils are available in liquid form in industrial quantities from a variety of geographic regions. These characteristics allow for low-cost transportation and storage compared to other renewable feedstocks such as industrial sugars, biomass and waste. We have used multiple natural oils to produce our products to date. Palm oil was used in commercial-scale toll production runs mirroring our biorefinery process. Soy oil has been used in multiple toll production runs using our metathesis process to produce material for cosmetics, polymer modification and industrial applications. Canola and mustard oils have been used to produce products in our pilot plant. We have also tested other oils at lab scale including algae, camelina, pennycress, jatropha and waste oils. The ability to use a wide range of feedstocks in various geographies will allow us to optimize feedstocks dynamically based on the total cost to use the oils and the value created from the resulting product mix. This flexibility allows us to maximize the profitability of our biorefineries.
91
Table of Contents
Palm oil
Palm oil is extracted from the pulp of the fruit of oil palm trees. According to the USDA, approximately 26% of total palm oil today is used in industrial products. These products include coatings, cosmetics, detergents and industrial lubricants, among many others. Indonesia and Malaysia are currently the largest producers of palm oil, representing approximately 87% of global production in the 2010/2011 season, according to the USDA. There is also emerging production of palm oil in South America. Global production of palm oil exceeded 47 million metric tonnes (100 billion pounds) in the 2010/2011 season.
Soy oil
Soy oil is extracted from soybeans. According to the USDA, approximately 17% of soy oil is used in industrial products. These products include biodiesel, inks, paints, plasticizers and waxes, among many others. China, the United States, Argentina and Brazil are currently the largest producers of soy oil, representing approximately 79% of global production in the 2010/2011 season, according to the USDA. Global production of soy oil exceeded 41 million metric tonnes (90 billion pounds) in the 2010/2011 season.
Rapeseed oil
We define rapeseed oils to include rapeseed, mustard and canola oils. They are derived from the seeds of plants within the brassica genus. According to the USDA, approximately 30% of rapeseed oil is used in industrial products. These products include biodiesel, coatings, lubricants, plastics and rubber additives, among many others. The European Union, China, India and Canada are currently the largest producers of rapeseed oil, representing approximately 83% of global production in the 2010/2011 season according to the USDA. Global production of rapeseed oil exceeded 23 million metric tonnes (50 billion pounds) in the 2010/2011 season.
Due to our feedstock and process flexibility, if changes in feedstock prices occur that are less correlated to our product prices, we can optimize our feedstock and product mix to maximize our profit margins. We do not expect large increases in the market prices of our primary feedstocks as a result of our increased usage of these feedstocks because we expect to continue to consume a de minimis percentage of global natural oil supply.
Other Inputs
Catalysts
We source our current catalyst from our partner, Materia. The catalyst we source from Materia uses ruthenium as a key input and is based on the innovations of Dr. Grubbs and others. Should Materia be unable to supply us catalyst, we have the right to manufacture catalyst ourselves or have a third party manufacture catalyst for us, in accordance with the terms of our agreement with Materia. In addition, we are working with XiMo to develop new catalysts based on the work of Dr. Schrock and others that use molybdenum and tungsten. We have identified the potential for these catalysts to produce molecules similar to those we have produced with ruthenium-based catalysts. If we commercialize these new catalysts, we will either manufacture them ourselves or have a third party manufacture them for us.
Olefin Reactant
Our biorefinery process reacts natural oil with a short chain olefin reactant in its metathesis step. The primary short chain olefin reactant we use is 1-butene, though several other types olefins can also be used in our process. 1-butene is a four carbon olefin derived principally from, or co-produced with, ethylene. It is widely available both on the spot markets and through supply contracts.
Methanol
Within our biorefinery, we plan to use methanol as a reactant for transesterification. Methanol is an alcohol and is an important feedstock for making chemicals such as formaldehyde and fuel components or additives such as biodiesel, methyl tert-butyl ether (“MTBE”) and gasoline. It is widely available both on the spot markets and through supply contracts.
92
Table of Contents
Our Partnerships
We seek to develop new and existing market partnerships to accelerate growth. These partners provide us with sales and marketing expertise, established distribution channels, technical know-how, product and application development expertise and manufacturing infrastructure.
Commercial Partners
The fundamental goal of our commercial partnerships is to accelerate market entry through the development of improved product performance characteristics as well as through access to established supply chains. Our commercial partners possess assets and capabilities that complement our skills, improving our ability to develop products to meet market needs, to manufacture products and to access customers. Examples of our commercial partnerships include:
| • | Dow Corning. Our partnership accelerated commercialization of our personal care products, resulting in initial consumer products in U.S. retail outlets within nine months of the partnership’s formation. |
| • | Stepan. Stepan has committed research and development resources, which has resulted in the filing of patent applications in the area of specialty surfactants. |
| • | Clariant. Clariant has introduced a polymer additive produced from our technology and intends to build a platform of products based on their collaboration with us. |
Manufacturing Partners
Our manufacturing partners support our production of specialty chemicals and direct replacement intermediate chemicals by providing complementary facilities and expertise. Currently, our primary biorefinery manufacturing partner is Wilmar.
Technology Partners
We have established partnerships with Materia and XiMo to develop and commercialize metathesis catalyst technology for use with natural oils. In addition to our catalyst technology partners, we have established partnerships with leading technology companies and a number of academic institutions for research and development efforts around process improvements and application development.
Feedstock Supply Partners
We have established partnerships with leading producers of natural oils in order to ensure that we are able to meet growing demand for our products. We purchase natural oils from these partners through a combination of fixed and spot price contracts. Cargill currently provides the majority of our feedstocks. Wilmar will be the Wilmar JV’s primary feedstock partner. Both Cargill and Wilmar are leading producers of natural oils. Strategic partnerships with large suppliers provide security and diversity of supply as a result of their global footprint.
Our Customers
Five customers accounted for 62% of our revenues in 2010. The International Group Inc., Star Candle Company LLC, Bright Glow Candle Co., Reed Candle Co. and Old Williamsburg Candle Corp. accounted for 16%, 14%, 11%, 11% and 10%, respectively, of our revenues in 2010.
Our Competition
We expect that our products will compete globally with specialty chemical, petrochemical and oleochemical products that serve our targeted markets, as well as products from emerging companies who have targeted the production of substitutes or replacements for existing products. In some cases, we will be competing with entrenched, large scale enterprises with significant established market shares and greater capital resources than ours. However, we believe that the combination of our cost position, differentiated products and partnership strategy will enable us to successfully grow. The competitive factors for each of the markets in which we participate vary between our specialty chemicals and our intermediate chemicals and are further detailed below.
93
Table of Contents
Specialty Chemicals
Our specialty chemicals will compete with products targeting similar end markets. We believe our specialty chemicals will compete on performance and will provide performance improvements by combining the attributes of oleochemicals and olefins on one molecule. The differentiation from existing alternatives will provide our customers and us with the options of price premiums or market share capture, depending on specific market strategies. We expect that our specialty chemicals will include detergents and cleaners, personal care products, performance waxes and candles, lubricants, lubricant and fuel additives and engineering polymers and coatings.
While we expect to compete with various large and established specialty chemical companies, in some cases we may seek to or may already be collaborating with such companies.
Intermediate Chemicals
Olefins
We believe our intermediate olefins will serve as direct replacements for intermediate olefins that are currently sold in the market. We believe our operations currently provide the only renewable source of intermediate olefins. Given our low cost of production and low capital intensity, we expect to be immediately cost competitive with existing technologies. Existing producers of olefins include BASF, Chevron Phillips, ExxonMobil Chemical, INEOS, Royal Dutch Shell and Sasol. While we expect to compete with these large and established olefin producers, in some cases we may seek to partner or collaborate with one or more of these or other companies.
Oleochemicals
Our oleochemicals will compete in the existing global oleochemical market. There are several large, global oleochemical manufacturers, including BASF, Croda and Wilmar. These companies convert plant oils and animal fats into derivative products, including fatty acids, fatty alcohols and fatty acid methyl esters. Participants in the oleochemical market primarily compete on delivered price, which is largely based on the price of delivered commodity oils, including palm oil, palm kernel oil and coconut oil. We believe we are able to effectively compete in this market through our proprietary conversion technology, which allows us to enhance the mix of oleochemicals available from natural oil feedstocks.
Intellectual Property
Our success depends on our ability to obtain and maintain intellectual property protection for our products and technologies, and to operate without infringing on the property rights of others. We protect our proprietary position through a combination of filing for patent applications on inventions, filing for trademark protection on our product names and related materials and methods, and through trade secret protection when and where appropriate. We also seek to ensure our competitive position in metathesis catalyst technology, application development, and process technology through several partnership and joint development agreements.
Our patents and applications cover various aspects of our business, including patents and applications with composition of matter and method claims directed to innovations in feedstocks, catalysts, manufacturing and processing, intermediates and finished products in all three of our product platforms. We continue to file new applications in the United States and overseas to protect all of these areas, with a particular focus on innovations in new uses and formulations for our products.
At the time of our formation in 2007, we received from Cargill title to 9 U.S. Patents, 34 U.S. Patent Applications, 16 PCT International Applications and 20 foreign patent applications. From that time and until September 30, 2011, we have filed an additional 37 U.S. patent applications, 10 PCT International Applications and 103 foreign patent applications. As of September 30, 2011, we held title to 15 U.S. Patents and 29
94
Table of Contents
corresponding foreign patents. As of September 30, 2011, we held title to 34 pending U.S. Patent Applications, four pending PCT International Applications and 88 pending foreign patent applications. While the first of our U.S. Patents will expire April 6, 2020, we continue to file new patent applications. The U.S. Patents resulting from those applications will not expire until 20 years after the non-provisional priority date.
An important component of our intellectual property is our License Agreement with Materia, whereby we have an exclusive license under the patents owned and licensed to Materia for metathesis, subject to the terms and conditions set forth in the license agreement. The license includes access to the current Materia portfolio and all new developments within the scope of the license. Materia’s current portfolio includes 85 U.S. Patents, 6 published U.S. Patent Applications and 47 published PCT applications, together with the corresponding foreign patents and patent applications. Our license is exclusive for the olefin metathesis of natural oils, and excludes only pharmaceuticals, pheromones and “Metathesis Polymers,” (defined as polymers comprised of at least 50% by weight of monomers not derived from natural oil, but excluding metathesis-derived polyols with number average functionality greater than 2.5 and comprised of at least 15% by weight of natural oil raw material). This exclusive license includes the right to grant sub-licenses and will continue in a given country until the last to expire of the Materia patents in that country. Although the first licensed Materia patent will expire April 3, 2012, the last to expire patent application specifically listed in the agreement will not expire until October 2027 (assuming all patents subsist for their natural terms). In addition, our agreement with Materia includes a license to any new Materia patents issuing from any relevant patent applications that may have been or may yet be filed after the agreement was executed. Any such new patents covering new inventions would not expire until 20 years after their earliest non-provisional filing date. Consequently, the duration of our license with Materia would be extended each time it files a new application claiming a new invention. In addition to the patent rights, this license includes a non-exclusive license to Materia’s relevant proprietary information.
In order to ensure our competitive position in metathesis catalyst development, we also entered into a joint development and license agreement with XiMo in 2011 and a license agreement with Evonik Degussa in 2010. We are working with XiMo to develop new catalysts based on the work of Dr. Richard Schrock and others that use molybdenum and tungsten. We have identified the potential for these catalysts to produce molecules similar to those we have produced with ruthenium-based catalysts. We will directly manufacture or have a third party manufacture any catalysts we commercialize through our collaboration with XiMo.
We also protect our intellectual property through agreements. All of our employees and contractors have signed contracts which include the obligation to assign patent rights to us and the obligation to maintain the confidentiality of our trade secrets. In addition, the joint development agreements with our strategic partners mentioned above all grant ownership to us of the relevant innovations coming from these partnerships. Also, whenever working with outside parties, we employ legal agreements (including but not limited to non-analysis, consulting, material transfer, and confidentiality agreements) to protect our confidential information relating to developmental processes, compositions, or materials, which are either intended to be kept as trade secrets, or are at a stage prior to the filing of a patent application. Additionally, we use physical and electronic means to protect the confidentiality of our trade secrets. When and where appropriate, we and our external intellectual property counsel generate legal opinions with respect to the freedom to operate in a given space. We respect the valid intellectual property rights of others and we use our best efforts to avoid infringement.
We have also filed for trademark and servicemark protection. Such marks are used to protect words, names and symbols that distinguish goods and services from those manufactured or sold by others, and to indicate the source of the goods and services. The word marks (and, as applicable, stylized designs) ELEVANCE and ELEVANCE RENEWABLE SCIENCES and INHERENT have been filed for in the U.S. Patent and Trademark Office as early as January 2008. We also own the word mark (and, as applicable, stylized designs) for NATUREWAX, primarily to protect natural oil-based waxes for use in the manufacture of various applications, including candle applications.
95
Table of Contents
Employees
As of September 30, 2011, we had a total of 82 full-time employees, of which 35 were in research, development and engineering and 15 were in sales and marketing. None of our employees are represented by a labor union or subject to a collective bargaining agreement. We have not experienced any work stoppage and consider our relations with our employees to be good.
Facilities
We conduct the majority of our operations in approximately 75,000 square feet of office and laboratory space in Woodridge, Illinois. We moved the majority of our operations from Bolingbrook to Woodridge in September 2011. Prior to that, we conducted all of our operations in an aggregate of approximately 20,000 square feet of office and laboratory space in Bolingbrook, Illinois under a lease that will terminate in December 2013 (if we elect to terminate the lease in June 2013). As of September 30, 2011, our hydrogenation laboratory and pilot plant were still located at our Bolingbrook facility. We believe that our new facility in Woodridge is adequate for our needs for the immediate future and that, should it be needed, suitable additional space will be available to accommodate expansion of our operations on commercially reasonable terms.
On June 2, 2011, we acquired an 80 million gallon per year biodiesel production facility in Natchez, Mississippi, which we intend to repurpose into the Mississippi facility. The Wilmar JV is constructing the Indonesia facility, a biorefinery with annual production capacity of 185,000 metric tonnes (400 million pounds) biorefinery, on land leased from an affiliate of Wilmar.
Legal Proceedings
In addition to the matter described below, we are from time to time subject to various claims and litigation arising in the ordinary course of business. These claims may include assertions that our products infringe existing patents, claims that the use of our products has caused personal injuries and employment-related claims. Although the outcome of these routine claims cannot be predicted with certainty, we do not believe that the ultimate resolution of these claims will have a material adverse effect on our results of operations, financial condition or cash flows.
On March 11, 2010, Evonik Degussa filed suit against us alleging the infringement of certain patents by us. On June 23, 2010, we entered into the Degussa Settlement Agreement, which included a mutual release and patent license permitting us to use the patents that Evonik Degussa alleges that we infringed upon, including the patent that Evonik Degussa alleged to cover our proprietary catalyst, through December 31, 2012, which we may extend, at our option, through December 31, 2013. As a result of our entering into the Degussa Settlement Agreement, Evonik Degussa dismissed the lawsuit against us with prejudice. Evonik Degussa continues to pursue similar litigation against Materia, which provides us with catalysts and has licensed the use of such patents to us.
Environment, Health and Safety Matters
Compliance with Environmental, Health and Safety Laws
Our research and development processes involve, and the construction and operation of our biorefineries will involve, the use of hazardous materials. Our business is subject to international, federal, state and local laws and regulations governing the pollution or protection of the environment and workplace and human health and safety, including the use, manufacture, storage, handling and disposal of, and human exposure to, hazardous materials. We believe that our operations comply in material respects with such laws and regulations. While it is impossible to predict accurately the future costs associated with environmental compliance and potential remediation activities as we develop, construct, repurpose and operate our biorefineries, compliance with environmental, health and safety laws, and obtaining and maintaining required environmental, health and safety
96
Table of Contents
authorizations and permits, is not currently expected to require material capital expenditures and has not had, and is not currently expected to have, a material adverse effect on our earnings or competitive position. We are not aware of any environmental enforcement actions pending or threatened against us which pose the potential for material sanctions or penalties.
Chemical Regulation
As a producer of chemical substances, we are subject to chemical registration requirements in certain jurisdictions. The regulatory approval process for a given chemical product requires a significant investment of time and resources. Given the importance of regulatory approval to our business, we routinely monitor regulatory changes. The goal of these reviews is to ensure that our regulatory strategies align our commercial objectives with regulatory requirements. The two major regulatory processes of consideration for us are those in the United States (the Toxic Substances Control Act, or “TSCA”) and Europe (the European Union’s Registration, Evaluation, Authorisation and Restriction of Chemical substances or “REACH”). To the extent that other jurisdictions, such as Brazil, may rely on the TSCA or REACH for chemical registration, delays with the U.S. or European authorities may subsequently delay entry into these markets as well.
United States—Toxic Substances Control Act (“TSCA”): A key goal of TSCA is to prevent unreasonable risks of injury to health or the environment associated with the manufacture, processing, distribution in commerce, use, or disposal of chemical substances. Under TSCA, the EPA has established reporting, record-keeping, testing and control-related requirements for new and existing chemicals. In September 2009, the EPA announced its comprehensive approach to enhance the EPA’s current chemicals management program under TSCA, including development of action plans. Under TSCA, the EPA may take action to label, restrict, or ban a chemical, or to require submission of additional data needed to determine the risk a chemical may pose. Also in 2009, the EPA announced its “Essential Principles for Reform of Chemicals Management Legislation.” In April 2011, the Safe Chemicals Act of 2011 was introduced in Congress. This bill would amend TSCA to require safety testing of all industrial chemicals and could result in the need to disclose confidential business information relating to chemical safety. We are monitoring this and other legislative and regulatory developments. Before we can manufacture or distribute significant volumes of a chemical, we need to determine whether that chemical is listed in the TSCA inventory. If the substance is listed, then manufacture or distribution can commence. If not, then the chemical is assessed based on known impurities, analytical data and a process description. Next, a Bona Fide Letter of Intent to Manufacture is submitted to the Inventory Expert Service which identifies the intended manufacturing site. At the end of the process, the pre-manufacturing notice includes a description of the process, potential for human exposure, and an overview of toxicology data. The process generally requires 6-12 months for products with low toxicity profiles, but can take substantially longer. Management does not currently expect that the costs to comply with TSCA will be material to the Company’s operations and consolidated financial position.
European Union—Registration, Evaluation, Authorisation and Restriction of Chemical substances (“REACH”): In June 2007, the European Union regulatory framework concerning REACH went into effect. REACH requires manufacturers and importers to gather information on the properties of their substances that meet certain volume or toxicological criteria and register the information in a central database to be maintained by the European Chemicals Agency. Complete registrations containing extensive data on the characteristics of the chemical are or will be required in three phases, depending on production usage or tonnage imported per year, and the toxicological criteria of the chemical. The first registrations for substances that were preregistered in 2008 were required in 2010; subsequent registrations are due in 2013 and 2018. New substances that will be manufactured or imported need to be registered prior to being placed on the market. As the candidate list is updated, companies must notify the European Chemicals Agency and downstream users of products containing above 0.1% of substances of very high concern (“SVHC”) on the candidate list for authorization. There are now 53 such substances and the notice process may create pressure for substitution away from these substances. By June 1, 2013, the European Commission will review whether substances with endocrine disruptive properties should be authorized if safer alternatives exist. Management does not currently expect that the costs to comply with REACH will be material to the Company’s operations and consolidated financial position.
97
Table of Contents
Environmental Remediation
Environmental laws and regulations require mitigation or remediation of the effects of the disposal or release of hazardous substances. Under some of these laws and regulations, as the owner or operator of a property, we could be held liable for the costs of removal or remediation of hazardous substances on, under, or emanating from the property, without regard to whether we knew of or caused the contamination, and regardless of whether the practices that resulted in the contamination were permitted at the time they occurred. In addition, we may be sued in connection with such contamination at or emanating from our properties or waste disposal sites, including for personal injury, property damage and environmental harm.
In June 2011, we purchased a former biodiesel facility in Natchez, Mississippi from Delta Biofuels, Inc. (“Seller”). Soil and groundwater investigations conducted prior to our acquisition of the facility identified the presence of volatile organic compounds above regulatory standards. In May 2011, Seller entered into a Brownfield Agreement with the Mississippi Commission on Environmental Quality (“MCEQ”) agreeing to conduct any remediation or monitoring necessary to address the identified contamination, in exchange for certain protections against claims brought by parties other than the United States for itself and future owners and lenders for liability relating to the identified contamination. In conjunction with the Brownfield Agreement, Seller was required to establish an escrow account for the benefit of MCEQ as financial assurance for completion of the work. An environmental covenant was put into place prohibiting groundwater use and requiring notice to MCEQ prior to the commencement of any soil excavation or digging activities at the Mississippi facility’s site. Provided the Seller satisfies its obligations under the Brownfield Agreement, we do not currently expect this matter to result in any significant liabilities to the Company.
Climate Change and Greenhouse Gas Emissions
In recent years, the U.S. Congress has been considering legislation to restrict or regulate emissions of GHGs such as carbon dioxide and methane, which are understood to contribute to global warming. In addition, almost half of the states in the United States, either through individual or multi-state regional initiatives, have begun to address GHG emissions. The EPA also regulates GHG emissions under its existing Clean Air Act authority, as a result of which certain large stationary sources and modification projects are subject to permitting and reporting requirements for GHG emissions.
International climate change regulations could also impact our business. The Kyoto Protocol to the United Nations Framework Convention on Climate Change entered into force in 2005 and attention is now focused on development of a post-2012 international policy framework to guide international action to address climate change when the Kyoto Protocol expires in 2012. Proposed and existing legislative efforts in international jurisdictions, including those under the European Union’s Emission Trading Scheme, to control or limit GHG emissions could not only increase the cost of compliance but could also adversely affect our energy source and supply choices and increase the cost of energy and raw materials derived from fossil fuels. These efforts could also increase our estimated capital and operating costs associated with the Indonesia facility.
We believe that our products generally compare favorably to the products we replace on lifecycle GHG emissions, including our products which are direct replacements for those derived from petroleum. For example, a key criterion of the U.S. Department of Energy grant that we received for our integrated biorefinery project was that we could demonstrate that the products which were the subject of our application could provide at least a 50% reduction to the lifecycle GHG emissions as compared to those produced through conventional methods.
At this time, the GHG emissions from our facility in Bolingbrook and our repurposing activities at the Mississippi facility do not meet the currently applicable thresholds such that they are subject to certain GHG permitting or reporting requirements. Although it is not possible at this time to accurately estimate how laws or regulations addressing GHG emissions could impact our business, any future application to our business of GHG requirements could require us to incur increased operating costs. The potential increase in the costs of our
98
Table of Contents
operations resulting from any legislation or regulation to restrict emissions of GHGs could include new or increased costs to operate and maintain our facilities, install new emission controls on our facilities, acquire allowances to authorize our GHG emissions, pay any taxes related to our GHG emissions and administer and manage a GHG emissions program. We cannot predict with any certainty at this time how current or future GHG requirements may affect our operations in the future.
99
Table of Contents
Below is a list of the names and ages of our executive officers and directors as of the consummation of this offering and a brief summary of their business experience.
| Name |
Age | Position | ||||
| K’Lynne Johnson. |
43 | Chief Executive Officer, Director | ||||
| Mel L. Luetkens, Ph.D. |
57 | Chief Operating Officer | ||||
| David H. Kelsey |
60 | Chief Financial Officer | ||||
| Andy L. Shafer |
49 | Executive Vice President, Market Development & Sales | ||||
| Kara E. Lawrence |
41 | Vice President Finance and Treasury | ||||
| Geoffrey M. Duyk, M.D., Ph.D. |
52 | Chairperson of the Board, Director | ||||
| Carole Piwnica |
53 | Vice Chairperson of the Board, Director | ||||
| Robert Frost |
44 | Director | ||||
| Véronique Hervouet |
51 | Director | ||||
| W. Donald Johnson, Ph.D. |
64 | Director | ||||
| William E. McGlashan Jr. |
48 | Director | ||||
| Robert B. Shapiro |
73 | Director | ||||
| Mark E. Tomkins |
56 | Director | ||||
Executive Officers and Certain Key Employees
K’Lynne Johnson has served as our Chief Executive Officer and on our board of directors since our formation in November 2007. Prior to joining our company, Ms. Johnson worked from 1991 to 2005 for Amoco Company (“Amoco”) and BP p.l.c. (“BP”). In 2005, Ms. Johnson became the Senior Vice President of the Global Derivatives operating company within Innovene, Inc. one of the world’s largest petrochemical and refining companies (“Innovene”), a wholly owned subsidiary of BP. As a result of these and other professional experiences, we believe Ms. Johnson possesses particular knowledge and experience in chemical development and manufacturing, finance and capital structure, strategic planning and leadership of complex organizations and people management that strengthen the board’s collective qualifications, skills and experience. Ms. Johnson received a masters degree in organizational behavior from Brigham Young University’s Marriott School of Management and a B.S. in organizational psychology.
Mel L. Luetkens, Ph.D. has served as our Chief Operating Officer since our formation in November 2007. Prior to joining our company, Dr. Luetkens served as Innovene’s Europe Technology Director in 2005 and a manager for INEOS Group Limited (“INEOS”) from 2005 to 2007. Dr. Luetkens has over 25 years of experience enhancing value delivery in the petrochemical industry across global operations in Amoco, BP, lnnovene and INEOS. Dr. Luetkens has been accountable for a range of roles and responsibilities including commercial and technology management (catalysts, process engineering, development and health, safety and environmental management) for petrochemicals and refining operations. In addition, his background includes profit and loss management, research and development leadership, new business and product development, strategy development and execution. Dr. Luetkens received a Ph.D. from the University of Michigan in 1984 and an M.B.A. from the University of Chicago.
David H. Kelsey has served as our Chief Financial Officer since August 2011. Prior to joining our company, Mr. Kelsey served as the Chief Financial Officer of Sealed Air Corporation, a manufacturer of packaging and performance-based materials and equipment systems (“Sealed Air”), from December 2001 to August 2011 and as a Senior Vice President of Sealed Air from April 2003 to August 2011. Mr. Kelsey joined Sealed Air in December 2001 and served as its Vice President from January 2002 to December 2003. Previously, he served as Vice President and Chief Financial Officer of Oglebay Norton Company, a Russell 3000 company in the industrial mineral and aggregates industry, from March 1998 to November 2001, and Mr. Kelsey served as Executive Vice President and Chief Financial Officer of Host Communications Inc., a sports marketing and media syndication company, from 1994 to 1998. From 1980 to 1994 Mr. Kelsey held a variety of executive
100
Table of Contents
positions at GE Capital, having initially joined GE in 1973 in its Financial Management Program. Mr. Kelsey has been an independent director of Granite Construction Inc. since 2003 and is a member of its audit committee. Mr. Kelsey holds a B.S.E. degree in Civil and Geological Engineering from Princeton University and an M.B.A. degree from Harvard University Graduate School of Business.
Andy L. Shafer has served as our Executive Vice President, Market Development & Sales since January 1, 2008. Prior to joining our company, Mr. Shafer was the Business Development Manager at Cargill from December 2003 to December 2007, responsible for the development of metathesis of vegetable oils. He also has served as a commercial director with Cargill-Dow (now NatureWorks LLC) and in various commercial positions at The Dow Chemical Company. Mr. Shafer holds a B.S. in chemical engineering from the University of Notre Dame and a M.B.A. from the University of Minnesota’s Carlson School of Management.
Kara E. Lawrence has served as our Vice President Finance and Treasury since January 2011. From January 2008 until January 2011, she was our Controller and Treasurer. Prior to joining our company Ms. Lawrence founded and ran a business from April 2006 to December 2007. Ms. Lawrence served as a Director of Corporate Finance for Innovene from September 2004 to April 2006. Ms. Lawrence is a Certified Public Accountant and holds a M.B.A. from the University of Chicago and a B.B.A from the University of Michigan.
Directors
We believe our board of directors should be comprised of individuals with sophistication and experience in many substantive areas that impact our business. We believe experience, qualifications or skills in the following areas are most important: chemical development, manufacturing, sales and marketing; accounting, finance and capital structure; strategic planning and leadership of complex organizations; legal, regulatory and government affairs; people management; and board practices of other entities. We believe that all of our current board members possess the professional and personal qualifications necessary for board service and have highlighted particularly noteworthy attributes for each board member in the individual biographies below, or above in the case of Ms. Johnson.
Geoffrey M. Duyk, M.D., Ph.D. has been a member of our board of directors since November 2007. Dr. Duyk is a partner of TPG Growth, LLC, an affiliate of TPG Biotechnology Partners II, L.P. (“TPG Growth”). Previously, Dr. Duyk served on its board of directors and was President of Research and Development at Exelixis, Inc. (“Exelixis”) where he led a 550+ person group focused on the discovery and development of small molecule therapeutics. Prior to Exelixis, he was one of the founding scientific staff at Millennium Pharmaceuticals, Inc. (“Millenium”). As Vice President of Genomics at Millennium, Dr. Duyk was responsible for building and leading the informatics, automation, DNA sequencing and genotyping groups as well as the mouse and human genetics group. Prior to his tenure at Millennium, Dr. Duyk was an Assistant Professor at Harvard Medical School (“HMS”) in the Department of Genetics and an Assistant Investigator of the Howard Hughes Medical Institute (“HHMI”). While at HMS, Dr. Duyk was a Co-Principal Investigator in the National Institutes of Health (“NIH”) funded Cooperative Human Linkage Center. Dr. Duyk has been and continues to be a member of numerous NIH panels and oversight committees focused on the planning and execution of the Human Genome Project. Dr. Duyk serves on the Board of Directors of Replidyne, Inc., MacroGenics, Inc., Aerie Pharmaceuticals, Inc., FoldRx Pharmaceuticals, Inc., Galleon Pharmaceuticals, Inc., moksha8 Pharmaceuticals, Inc., ShangPharma Corporation and JCR Pharmaceuticals, Co., Ltd. As a result of these and other professional experiences, we believe Dr. Duyk possesses particular knowledge and experience in strategic planning, leadership of complex organizations and board practices of other entities that strengthen the board’s collective qualifications, skills and experience. Dr. Duyk holds a Ph.D. and M.D. from Case Western Reserve University. He completed his medical and fellowship training at the University of California, San Francisco. While at UCSF, Dr. Duyk was a fellow of the Lucille P. Markey Foundation and was awarded a post-doctoral fellowship from HHMI.
Carole Piwnica has been a member of our board of directors since December 2010. Ms. Piwnica has served as the founding director of Naxos UK since January 2008 and has been advising private equity since 2006 in agricultural processing and clean technology. Ms. Piwnica spent 15 years in various management roles in the
101
Table of Contents
agricultural processing industry, including as a director, from 1996 to 2006 and as Vice-Chairman of Governmental Affairs of Tate & Lyle Plc (“Tate & Lyle”) from 2000 to 2006. She was chairman of the Amylum Group, an affiliate of Tate & Lyle from 1996 to 2000. Ms. Piwnica was also a director of Toepfer International GmbH from 1996 to 2010 and of Dairy Crest Group plc from 2007 to 2010. She was a member of the Biotech Advisory Council of Monsanto Company (“Monsanto”) from 2006 to 2009. Ms. Piwnica has served as an independent director on the board of directors of Aviva plc since 2003 and of Louis Delhaize Group, Eutelsat S.A. and Sanofi S.A. since 2010. She has also been on the boards of directors of Big Red, Inc. since 2009, Amyris, Inc. since 2009 and BioAmber Inc. since 2011. Ms. Piwnica received a law degree from the Université Libre de Bruxelles in 1981 and a Master of Laws degree from New York University in 1985 and has practiced law as a member of the bar of New York and the bar of Paris. As a result of these and other experiences, we believe Ms. Piwnica provides the board of directors with significant experience and knowledge in corporate leadership of multinational firms, including: strategic planning; legal, government and regulatory affairs; people and succession management; and board practices and governance of other entities, which strengthen the board’s collective qualifications, skills and experience.
Robert Frost has been a member of our board of directors since December 2010. Mr. Frost has been a Senior Advisor to Naxos since 2009. Previously, Mr. Frost spent 14 years with various private equity firms, including as a Managing Director of Allianz Capital Partners GmbH from 2000 to 2008 and roles with Nikko Principal Investments Limited and the Nomura Principal Finance Group. Mr. Frost began his career at Deloitte & Touche from 1990 to 1994, where he gained four years of tax structuring and accounting experience. Mr. Frost has experience negotiating international transactions, arranging financing and has served in multiple board positions with private companies. Mr. Frost holds an M.B.A. from the University of London. As a result of these and other experiences, Mr. Frost provides the board of directors and management with significant financial expertise and knowledge related to international financial transactions, including: financial planning; mergers and acquisitions; transactional negotiation; and board practices and governance of other entities, which strengthen the board’s collective qualifications, skills and experience.
Véronique Hervouet has been a member of our board of directors since December 2010. Ms. Hervouet has served as Senior Vice President, Investments of Total Energy Ventures (“Total”) since September 2008. Previously, from January through August 2008, she was Senior Bioenergy Advisor at Total S.A., where she provided strategy guidance on bioenergy and shaped the proposal which led to the formation of Total’s corporate venturing activity. From 2002 through 2007, she led strategic analysis and research activities on advanced bioenergy and advanced refining technologies at Total Refining & Marketing. From 1998 to 2001, she managed the aromatics businesses of Elf Atochem, then Atofina (after the merger of Elf, Total and Petrofina ), covering spot trading, long term contracts and logistics operations. Ms. Hervouet served on the board of directors of Gevo from June 2009 until June 2011. She currently serves on the Steering Committee of the European Biofuels Technology Platform (which she chaired from January 2008 until January 2011), on the Steering Committee of the Bioenergy Program of the French National Research Agency and on the Advisory Board of Demeter, a European Cleantech Fund. Ms. Hervouet is a graduate Engineer from École Centrale de Lyon (France) and holds a M.S. in Materials Science and Engineering from Cornell University. As a result of these and other professional experiences, we believe Ms. Hervouet possesses particular knowledge and experience in: accounting, finance and capital structure; strategic planning and leadership of complex organizations; people management; and board practices of other entities, which strengthen the board’s collective qualifications, skills and experience.
W. Donald Johnson, Ph.D. has been a member of our board of directors since October 2011. Mr. Johnson retired from E. I. du Pont de Nemours and Company (“DuPont”) in December 2010. From March 2008 until his retirement, Mr. Johnson served as DuPont’s Senior Vice President of Human Resources and as a member of the Office of the Chief Executive Officer. Previously, Mr. Johnson served as the Chairman and Representative Director of DuPont Japan from April 2006 until March 2008. During his 36 years with DuPont, Mr. Johnson gained a wealth of global and functional business experience. Mr. Johnson currently also serves on the Board of Directors for Christiana Care Health Systems. As a result of these and other experiences, we believe Mr. Johnson possesses particular knowledge in strategic planning, leadership of complex organizations and board practices of
102
Table of Contents
other entities that strengthen the board’s collective qualifications, skills and experience. Mr. Johnson holds a B.S. in Applied Mathematics and an M.S. and a Ph.D. in Mechanical Engineering from North Carolina State University.
William E. McGlashan Jr. has been a member of our board of directors since October 2008. Mr. McGlashan is the founder and managing partner of TPG Growth and has served as its Managing Partner since 2004. Prior to joining TPG Capital in 2004, Mr. McGlashan was the Chairman and Chief Executive Officer of Critical Path. He joined Critical Path in April 2001 to undertake a major financial and operational restructuring of the company. Previously, he co-founded and served as Chief Executive Officer of Vectis Group, a venture corporation that capitalized and built companies in emerging markets. Mr. McGlashan also co-founded and served as President of Pharmanex Inc., a phyto-pharmaceutical and dietary supplement company (“Pharmanex”). Prior to Pharmanex, he was a senior associate with Bain Capital and Information Partners. Mr. McGlashan holds a B.A. from Yale University and an M.B.A. from the Stanford Graduate School of Business. He is a member of Young Presidents’ Organization in the San Francisco Barbary Coast chapter. He serves on the boards of XOJet, Inc., AgraQuest, Inc., SuccessFactors, Inc., Schiff Nutrition International, Inc., The Vincraft Group, Endeavor Global, Inc. and the Advisory Council for the Yale School of Management. As a result of these and other professional experiences, we believe Mr. McGlashan possesses particular knowledge and experience in: accounting, finance and capital structure; strategic planning and leadership of complex organizations; people management; and board practices of other entities, which strengthen the board’s collective qualifications, skills and experience.
Robert B. Shapiro has been a member of our board of directors since June 2009. Mr. Shapiro is Co-Founder and Managing Director of Sandbox Industries, a development firm that creates, launches and manages new business concepts. Sandbox Industries also manages venture funds, including the BlueCross BlueShield Venture Partners fund. Mr. Shapiro has served as the Managing Director of Sandbox Industries since its formation in 2004. He was formerly Chairman and Chief Executive Officer of Monsanto from 1995 to 2000. Upon the merger of Monsanto with Pharmacia & Upjohn, he served as Chairman of the newly-formed Pharmacia Corporation. Previously, Mr. Shapiro was President and Chief Operating Officer of Monsanto from 1992 to 1995 and President of Monsanto’s Agriculture Group from 1990 to 1992, Chairman and Chief Executive Officer of The NutraSweet Company, a subsidiary of Monsanto, from 1985 to 1990 and President of the NutraSweet Group of G.D. Searle & Co. (“Searle”) from 1982 to 1985, where he previously served as Vice President and General Counsel. Before joining Searle, Mr. Shapiro was Vice President and General Counsel of General Instrument Corporation from 1972 to 1979. Prior to this, he practiced law in New York City; served in government as Special Assistant to the General Counsel and later to the Undersecretary of the U.S. Department of Transportation; and served as a professor of law at Northeastern University in Boston and the University of Wisconsin in Madison. Mr. Shapiro has served on the boards of directors of the New York Stock Exchange (later NYSE Euronext), Citigroup Inc., Rockwell International, Silicon Graphics Inc., and Sequus Pharmaceuticals, Inc. He currently serves as a director of Theranos Inc., AgraQuest, Inc. and Sapphire Energy Inc. Mr. Shapiro has also served on the President’s Advisory Committee on Trade Policy, and on the White House Domestic Policy Review of Industrial Innovation. He is a Fellow of the American Academy of Arts and Sciences. Mr. Shapiro is a graduate of Harvard College and holds a J.D. from Columbia University School of Law. As a result of these and other professional experiences, we believe Mr. Shapiro possesses particular knowledge and experience in: strategic planning and leadership of complex organizations; accounting, finance and capital structure; legal, regulatory and government affairs; people management; and board practices of other entities, which strengthen the board’s collective qualifications, skills and experience.
Mark E. Tomkins has been a member of our board of directors since November 2007. Mr. Tomkins served as the Senior Vice President and Chief Financial Officer of Innovene from May 2005 to January 2006, when Innovene was sold to a strategic buyer. From 2001 to 2005 Mr. Tomkins served as the Senior Vice President and Chief Financial Officer of Vulcan Materials Company, a publicly traded construction materials and chemicals company. From 1998 to 2001, Mr. Tomkins was Senior Vice President and Chief Financial Officer of Chemtura Corporation (formerly Great Lakes Chemical Corporation), a publicly traded specialty chemicals company. From 1996 to 1998, he was Vice President of Finance and Business Development for the polymers division and Vice
103
Table of Contents
President of Finance and Business Development for the electronic materials division of Honeywell Corporation. From 1990 to 1996, Mr. Tomkins worked at Monsanto Company in various management level finance and accounting positions, including Chief Financial Officer of the growth enterprises division. Mr. Tomkins received a B.S. in business, with majors in finance and management, and an M.B.A. from Eastern Illinois University. Mr. Tomkins is a Certified Public Accountant, and a director of W.R. Grace & Co., and CVR Energy Inc. As a result of these and other professional experiences, we believe Mr. Tomkins possesses particular knowledge and experience in: chemical development and manufacturing; accounting, finance and capital structure; strategic planning and leadership of complex organizations; and people management, which strengthen the board’s collective qualifications, skills and experience.
Family Relationships
There are no family relationships between any of our executive officers or directors.
Corporate Governance
Board Composition
Our board of directors currently consists of eight members. Our certificate of incorporation currently provides that the authorized number of directors on the board of directors is nine. Each of our existing directors (other than Messrs. Tomkins and Shapiro) was elected pursuant to, and serve as a stockholder designee under, our Second Amended and Restated Voting Agreement. For additional information, see “Certain Relationships and Related Party Transactions—Preferred Financings—Second Amended and Restated Voting Agreement.” Ms. Piwnica and Mr. Frost currently serve as the Naxos designees to our board of directors. Ms. Hervouet serves as the Total designee on our board of directors. Dr. Duyk and Mr. McGlashan serve as the TPG Capital designees.
Our amended and restated certificate of incorporation that will be in effect upon the consummation of this offering will eliminate our existing classes of preferred stock, and as a result, subject to any future issuances of preferred stock, holders of our common stock will be entitled to one vote for each share of common stock held by them in the election of our directors. Our amended and restated certificate of incorporation will provide that our board of directors shall consist of such number of directors as determined from time to time by resolution adopted by a majority of the total number of directors then in office. Any additional directorships resulting from an increase in the number of directors may only be filled by the directors then in office. The term of office for each director will be until the earlier of his or her death, resignation or removal. Stockholders will elect directors each year at our annual meeting.
Our amended and restated certificate of incorporation will provide that our board of directors will be divided into three classes, with each director serving a three-year term, and one class of directors being elected at each year’s annual meeting of stockholders. will serve as Class I directors with an initial term expiring in 2013. will serve as Class II directors with an initial term expiring in 2014. will serve as Class III directors with an initial term expiring in 2015. Any additional directorships resulting from an increase in the number of directors will be distributed among the three classes so that, as nearly as possible, each class will consist of one-third of the total number of directors.
We believe that Messrs. Johnson, Shapiro and Tomkins will be “independent directors” as defined under the rules of NASDAQ upon the consummation of this offering. In addition, we believe that Messrs. Johnson, Shapiro and Tomkins will be “independent directors” as defined under the rules of the SEC and NASDAQ for purposes of serving on our audit committee.
Board Committees
Our board of directors has established an audit committee, a compensation committee and a corporate governance and nominating committee. The composition and responsibilities of each committee are described
104
Table of Contents
below. Members serve on these committees until their resignation or until otherwise determined by our board of directors.
Audit Committee
Our audit committee will oversee our corporate accounting, financial reporting and internal controls process. Among other matters, the audit committee will evaluate the independent auditors’ qualifications, independence and performance, determine the engagement of the independent auditors, review and approve the scope of our annual audit and audit fee, discuss with management and the independent auditors the results of our annual audit and the review of our quarterly consolidated financial statements, approve the retention of the independent auditors to perform any proposed permissible non-audit services, monitor the rotation of partners of the independent auditors on the engagement team as required by law, review our critical accounting policies and estimates, oversee our internal audit function and annually review the audit committee charter and the committee’s performance. Upon completion of this offering, the members of our audit committee will be Messrs. Johnson, Shapiro and Tomkins, with Mr. Tomkins serving as the chair of the committee. Messrs. Shapiro and Tomkins meet the requirements for financial literacy under the applicable rules and regulations of the SEC and NASDAQ. Our board of directors has determined that Mr. Tomkins is an audit committee financial expert as defined under the applicable rules of the SEC and has the requisite financial sophistication as defined under the applicable rules and regulations of NASDAQ. Our audit committee will consist of at least one member that is independent upon the effectiveness of our registration statement of which this prospectus forms a part, a majority of members that are independent within ninety days thereafter and all members that are independent within one year thereafter. Our board of directors has affirmatively determined that each of Messrs. Shapiro, Tomkins and Johnson meets the definition of “independent director” as defined under the applicable rules and regulations of the SEC and NASDAQ listing rules. The audit committee will operate under a new written charter that satisfies the applicable standards of the SEC and NASDAQ and which will be available on our corporate website at www.elevance.com upon the consummation of this offering. The information on our website is not part of this prospectus.
In 2011, the members of the audit committee were Ms. Hervouet and Messrs. Frost, Tomkins, John March and Patrick McCroskey. Messrs. March and McCroskey no longer serve on the board of directors or the audit committee.
Compensation Committee
Our compensation committee will review and recommend policies relating to compensation and benefits of our officers and employees. The compensation committee will review and set the compensation of our Chief Executive Officer and other executive officers relative to their execution of the corporate plan and achievement of targeted financial results. The compensation committee will also consider recommendations of our Chief Executive Officer with respect to the compensation of other executive officers. Our Chief Executive Officer will evaluate each other executive officer’s overall performance and contributions to us at the end of each year and report to the compensation committee his recommendations as to the other executive officers’ compensation. The compensation committee will also administer the issuance of stock options and other awards under our stock plans. The compensation committee will review and evaluate, at least annually, the performance of the compensation committee and its members, including compliance of the compensation committee with its charter. The members of our compensation committee will be , with serving as the chair of the committee. Our board of directors has determined that meets the definition of “independent director” for purposes of the NASDAQ listing rules. Our compensation committee will consist of at least one member that is independent upon the effectiveness of our registration statement of which this prospectus forms a part, a majority of members that are independent within ninety days thereafter and all members that are independent within one year thereafter. The compensation committee will operate under a new written charter that satisfies the applicable standards of the SEC and NASDAQ and which will be available on our corporate website at www.elevance.com upon the consummation of this offering. The information on our website is not part of this prospectus.
In 2011, the members of the compensation committee were Dr. Duyk, Messrs. McGlashan and Shapiro and Ms. Piwnica.
105
Table of Contents
Corporate Governance and Nominating Committee
Prior the consummation of this offering, we have not had a corporate governance and nominating committee. The corporate governance and nominating committee will be responsible for, among other matters: (1) reviewing key employee compensation goals, policies, plans and programs; (2) reviewing and approving the compensation of our directors, chief executive officer and other executive officers; (3) reviewing and approving employment agreements and other similar arrangements between us and our executive officers; (4) administration of stock plans and other incentive compensation plans; (5) identifying individuals qualified to become members of our board of directors, consistent with criteria approved by our board of directors; (6) overseeing the organization of our board of directors to discharge the board’s duties and responsibilities properly and efficiently; (7) identifying best practices and recommending corporate governance principles; and (8) developing and recommending to our board of directors a set of corporate governance guidelines and principles applicable to us.
Our corporate governance and nominating committee will consist of , and will serve as the chair. Our board of directors has determined that meets the definition of “independent director” for purposes of NASDAQ listing rules. Our corporate governance and nominating committee will consist of at least one member that is independent upon the effectiveness of our registration statement of which this prospectus forms a part, a majority of members that are independent within ninety days thereafter and all members that are independent within one year thereafter. The corporate governance and nominating committee will operate under a new written charter that satisfies the applicable standards of the SEC and NASDAQ and which will be available on our corporate website at www.elevance.com upon the consummation of this offering. The information on our website is not part of this prospectus.
Risk Oversight
The board of directors oversees the risk management activities designed and implemented by our management. The board of directors executes its oversight responsibility for risk management both directly and through its committees. The full board of directors considers specific risk topics, including risk-related issues pertaining to laws and regulations and risks associated with our strategic plan, business operations and capital structure. In addition, the board of directors receives detailed regular reports from members of our senior management and other personnel, including our internal risk management team discussed below, that include assessments and potential mitigation of the risks and exposures involved with their respective areas of responsibility.
The audit committee is specifically tasked with overseeing our compliance with legal and regulatory requirements, including monitoring our risk assessment and risk management activities with management and receiving information on material legal and financial affairs. The audit committee receives periodic reports regarding our risk assessment activities and discusses specific risk areas with the internal risk management team and its members throughout the year. The other committees of the board of directors oversee risks associated with their respective areas of responsibility. For example, the compensation committee assesses risks relating to our compensation policies and practices.
Compensation Committee Interlocks and Insider Participation
None of our executive officers currently serves, or in the past year has served, as a member of the board of directors or compensation committee of any entity that has one or more executive officers serving on our board of directors or compensation committee.
Code of Ethics
We will adopt a code of business conduct and ethics applicable to our principal executive, financial and accounting officers and all persons performing similar functions. A copy of that code will be available on our corporate website at www.elevance.com upon the consummation of this offering. We expect that any amendments to our code of ethics, or any waivers of its requirements, will be disclosed on our website. Our website is not part of this prospectus.
106
Table of Contents
Compensation Discussion and Analysis
Introduction
This Compensation Discussion and Analysis describes the compensation arrangements we have with our Named Executive Officers as required under the rules of the SEC. The SEC rules require disclosure for the principal executive officer (our Chief Executive Officer) and principal financial officer (our Chief Financial Officer) regardless of compensation level, any persons who served in such capacities during the last fiscal year regardless of whether they have left our company, and the three most highly compensated executive officers serving at the end of our last completed fiscal year, other than the chief executive officer and chief financial officer. All of these executive officers are referred to in this Compensation Discussion and Analysis as our “Named Executive Officers” or “NEOs.” This Compensation Discussion and Analysis includes a discussion of our compensation arrangements for our fiscal year ended December 31, 2011 (referred to herein as “fiscal year 2011”) as well as certain recent changes to such compensation arrangements. We refer to the fiscal year ended December 31, 2012 as “fiscal year 2012.” We refer to the fiscal year ended December 31, 2010 as “fiscal year 2010.”
Our NEOs during fiscal year 2011 are listed in the table below.
| Name |
Title | |
| K’Lynne Johnson |
Chief Executive Officer | |
| David Kelsey(1) |
Chief Financial Officer | |
| Mel L. Luetkens, Ph.D. |
Chief Operating Officer | |
| Andy L. Shafer |
Executive Vice President, Market Development & Sales | |
| Kara E. Lawrence(2) |
Vice President Finance and Treasury | |
| Patrick Kelly(1) |
Chief Financial Officer |
| (1) | Mr. Kelly resigned as our Chief Financial Officer in January 2011. Mr. Kelsey was hired as our new Chief Financial Officer effective August 15, 2011. |
| (2) | During fiscal year 2010, Ms. Lawrence served as the Controller and Treasurer. She was appointed to serve in this new role, as the Vice President Finance and Treasury, on January 29, 2011. |
Historical Compensation Decisions
Our compensation approach is necessarily tied to our stage of development. Prior to this offering, we were a privately-held company. As a result, we have not been subject to any stock exchange listing or SEC rules related to corporate governance matters.
Upon completion of this offering, our compensation committee (the “Compensation Committee”) will review and approve the compensation of our NEOs and oversee and administer our executive compensation programs and initiatives. For more information on our Compensation Committee’s current and future role in compensation decisions, see “—Compensation Committee Review of Compensation.” The Compensation Committee currently consists of Messrs. Geoff Duyk, William McGlashan and Robert Shapiro and Ms. Carole Piwnica. In connection with this offering, the Compensation Committee is undertaking a substantial review of our existing compensation programs, objectives and philosophy to determine whether such programs, objectives and philosophy are appropriate after we have become a public company. We expect that the specific direction, emphasis and components of our executive compensation program will continue to evolve as we transition from a private company to a public company.
Executive Compensation Objectives and Philosophy
The key objectives of our executive compensation programs are (1) to attract, motivate, reward and retain superior executive officers with the skills necessary to successfully lead and manage our business; (2) to achieve
107
Table of Contents
accountability for performance by linking annual cash incentive compensation to the achievement of measurable performance objectives; and (3) to align the interests of our executive officers and our equity holders through short- and long-term incentive compensation programs. For our NEOs, these short- and long-term incentives have historically been a significant portion of their compensation and have consisted of cash incentive compensation contingent upon the achievement of financial and operational performance metrics and stock option grants. We expect to continue to provide our NEOs with a significant portion of their compensation in this manner. These two elements of executive compensation provide a significant financial correlation between our financial and operational results and the total compensation of our NEOs and are aligned with the interests of our stockholders because the amount of compensation ultimately received will vary with our company’s financial and operational performance. Equity compensation derives its value from our equity value, which is likely to fluctuate based on our financial and operational performance. Payment of cash incentives is dependent on our achievement of pre-determined financial, operational and strategic objectives, as well as individualized goals.
We seek to apply a consistent philosophy to compensation for all executive officers. Our compensation philosophy is based on the following core principles.
To pay for performance
Individuals in leadership roles, particularly our NEOs, are compensated based on a combination of company and individual performance factors. Company performance is evaluated primarily on the degree to which pre-established financial, operational and strategic objectives are met. Individual performance is evaluated based upon several individualized leadership factors, including:
| • | individual contribution to attaining specific financial, operational and strategic objectives; |
| • | building and developing individual skills and a strong leadership team; and |
| • | developing an effective infrastructure to support profitable business growth. |
To pay competitively
We are committed to providing a total compensation program designed to retain our executives and attract superior leaders to our company. We have established compensation levels that we believe are competitive based on the Compensation Committee’s experience with pay practices and compensation levels for companies such as ours, as more fully explained below in “—Compensation Committee Review of Compensation.”
To pay equitably
We believe that it is important to apply generally consistent guidelines for all executive officer compensation programs. In order to deliver equitable pay levels, the Compensation Committee considers each executive officer’s depth and scope of accountability, complexity of responsibility, qualifications and executive performance, both individually and collectively as a team.
In addition to short- and long-term compensation, we have found it important to provide certain of our executive officers with competitive post-employment compensation. We elect to provide post-employment compensation to our executive officers on a case-by-case basis as the employment market, the qualifications of potential employees and our hiring needs dictate. Post-employment compensation consists primarily of two main types—severance pay and benefits continuation. We believe that these benefits are important considerations for our executive officer compensation package, as they afford a measure of financial security in the event of certain terminations of their employment and also enable us to secure on executive officer’s cooperation following such termination of employment.
Compensation Committee Review of Compensation
We expect that following this offering, the Compensation Committee will continue to review our compensation program for NEOs on an annual basis and at the time of a promotion or other change in level of
108
Table of Contents
responsibilities, as well as when competitive circumstances or business needs may require. We used Insight Performance, a third-party consultant (“Insight”), to assist us with determining compensation levels for our NEOs in fiscal year 2011. Historically, we have worked with Insight and compiled a report of benchmark data for executive positions of other privately held companies with similar revenue and in related industries, such as biotechnology, chemicals, manufacturing and pharmaceuticals. These reports have included summaries of base salary, annual cash incentive plan opportunities and awards and long-term incentive award values. Following this offering, the Compensation Committee expects to construct an appropriate peer group (as identified below under “—IPO Compensation Review”) for compensation benchmarking purposes.
In the past, the Chief Executive Officer has consulted with the Compensation Committee with respect to compensation for executives other than herself and we anticipate that she will continue to do so. We expect that the Compensation Committee will recommend a compensation package that is consistent with our compensation philosophy and competitive with other organizations similar to ours. The Compensation Committee will ultimately make a recommendation to our board of directors, which the board of directors will consider and approve, if appropriate.
We expect that the Compensation Committee will consider input from our Chief Executive Officer and Chief Financial Officer when setting financial, operational and strategic objectives for our incentive plans and will likely give significant weight to our Chief Executive Officer’s judgment when assessing the performance of our other NEOs.
Risk Management
We have determined that any risks arising from our compensation programs and policies are not reasonably likely to have a material adverse effect on our business, financial condition or results of operations. Our compensation programs and policies mitigate risk by combining performance-based, long-term compensation elements with payouts that are highly correlated to the value delivered to stockholders. The combination of performance measures for annual bonuses and the equity compensation programs, as well as the multi-year vesting schedules for equity awards, encourages employees to maintain both a short- and long- term view with respect to our performance.
IPO Compensation Review
In connection with our preparation for this offering, Insight reviewed our current compensation arrangements with our senior executives, including our NEOs. In connection with such review, Insight assessed the overall competitiveness of current pay levels for our senior executives and provided data with respect to cash compensation and long-term incentives. Insight was also requested to provide the Compensation Committee with the following information to consider in understanding current compensation practices as compared to the company’s practices:
| • | information with respect to equity grants or awards in connection with recently completed initial public offerings; |
| • | a financial analysis of the aggregate cost and share usage under multiple scenarios involving equity grants in connection with this offering; and |
| • | information regarding outside director compensation arrangements. |
In connection with its review, Insight conducted an analysis of target total compensation levels for each of our NEOs (other than Mr. Kelly, who resigned as our Chief Financial Officer in January 2011). Insight based its comparisons on market data, such as various surveys used by Insight specifically relevant to our industry and scope of operations such as companies with a revenue size of approximately $50 million to $250 million. In addition, Insight also compared compensation levels for our NEOs (other than Mr. Kelly) to a sample of public renewable fuels and chemicals companies, using compensation data included in such company’s latest proxy
109
Table of Contents
statements filed with the SEC. Companies in the analysis (or the peer group) were comprised of Kior, Solazyme, Myriant and BioAmber. The Compensation Committee is continuing to evaluate our compensation policies and, in that regard, has not determined to utilize this or any other peer group going forward.
Insight concluded that our overall compensation framework, including our NEO compensation arrangements, was largely consistent with industry practices. Overall because the assessment concluded that our executive pay framework and practices were consistent with the market, the Compensation Committee made no changes to our overall executive compensation framework at that time. However, the Compensation Committee considered the information provided by Insight in its decision to increase base salary in 2012 and provide additional equity grants, as described below in “—Elements of Compensation—Base salary” and “—Elements of Compensation—Equity incentives.”
We are party to employment agreements with each of Ms. Johnson, Dr. Luetkens, Messrs. Kelsey and Shafer and Ms. Lawrence. We also had an employment agreement with Mr. Kelly, our former Chief Financial Officer. A detailed discussion of the terms of these employment agreements is set forth below under heading “—Employment Agreements.”
Elements of Compensation
As discussed throughout this Compensation Discussion and Analysis, the compensation policies applicable to our NEOs are reflective of our pay-for-performance philosophy whereby a significant portion of both cash and equity compensation is contingent upon achievement of measurable financial objectives and enhanced equity value, as opposed to current cash compensation and perquisites not directly linked to objective financial performance. This compensation mix is consistent with our performance-based philosophy that the role of executive officers is to enhance the value of our equity over the long term.
The elements of our compensation program are:
| • | base salary; |
| • | performance-based short-term cash incentives; |
| • | long-term equity incentives, which consisted solely of stock options as of December 31, 2011; and |
| • | certain additional benefits and perquisites. |
Base salary, performance-based cash bonuses and long-term equity-based incentives are the most significant elements of our executive compensation program and, on an aggregate basis, are intended to substantially satisfy our program’s overall objectives. For fiscal year 2011, the compensation package for each of our NEOs consisted of the following components (calculated as a percentage of total compensation):
| Name |
Percentage Base Salary |
Percentage Bonus |
Percentage Equity Incentive Grants |
|||||||||
| K’Lynne Johnson |
41 | % | 20 | % | 38 | % | ||||||
| David Kelsey |
7 | 1 | 92 | |||||||||
| Mel L. Luetkens, Ph.D. |
44 | 19 | 35 | |||||||||
| Andy L. Shafer |
59 | 24 | 15 | |||||||||
| Kara E. Lawrence(1) |
TBD | TBD | TBD | |||||||||
| Patrick Kelly |
96 | 4 | — | |||||||||
| (1) | The amount of Ms. Lawrence’s bonus (for 2011 performance) is still to be determined. As such, we cannot yet calculate her total compensation for fiscal year 2011 or the components thereof (on a percentage basis). |
Typically, the Compensation Committee has, and following this offering, the Compensation Committee will seek to evaluate and set each of these elements of compensation annually to enable our board of directors or the Compensation Committee to simultaneously consider all of the significant elements of our compensation
110
Table of Contents
program and their impact on compensation as a whole. Taking this comprehensive view of all compensation components allows us also to make compensation determinations that will reflect the principles of our compensation philosophy and related guidelines with respect to allocation of compensation among certain of these elements and total compensation. We strive to achieve an appropriate mix between the various elements of our compensation program to meet our compensation objectives and philosophy; however, we do not apply any rigid allocation formula in setting our executive compensation, and we may make adjustments to this approach for various positions after giving due consideration to prevailing circumstances, the individuals involved and their responsibilities and performance.
Base salary
The base salaries for our NEOs in fiscal year 2011 were recommended by the Compensation Committee and approved by our board of directors, based on several factors, including:
| • | current salary; |
| • | a discretionary and subjective review of the individual’s performance, results, qualifications and tenure; |
| • | the job’s responsibilities; |
| • | pay mix (base salary, annual cash incentives, equity incentives, perquisites and other benefits); and |
| • | compensation practices in our industry. |
We did not attempt to benchmark salary levels and instead reviewed general industry salary levels as only one broad scope aspect of our information gathering.
The annual base salaries in effect for each of our NEOs employed by us as of December 31, 2011 are as follows.
| Name |
2011 Annual Salary | |||
| K’Lynne Johnson |
$ | 350,000 | ||
| David Kelsey(1) |
340,000 | |||
| Mel L. Luetkens, Ph.D. |
275,000 | |||
| Andy L. Shafer |
215,000 | |||
| Kara E. Lawrence |
195,000 | |||
| Patrick Kelly(1) |
30,769 | (2) | ||
| (1) | Mr. Kelly resigned as our Chief Financial Officer in January 2011. Mr. Kelsey was hired as our Chief Financial Officer effective August 15, 2011. |
| (2) | Reflects the salary paid to Mr. Kelly during fiscal year 2011 prior to his resignation. |
The Compensation Committee did not consider any specific individual or performance targets in setting base salary, rather, it performed a subjective and discretionary review of each individual’s performance, results, qualifications and tenure including its subjective review of the factors described above. This determination was informal and based primarily on the general knowledge of our Compensation Committee of the compensation practices within our industry and not by reference to specific performance as compared to predetermined quantitative performance objectives.
For fiscal year 2012, the Compensation Committee approved the following increases to annual base salary for our NEOs: (1) a $50,000 increase for Ms. Johnson to $400,000, effective February 1, 2012; (2) a $25,000 increase for Dr. Luetkens to $300,000, effective February 1, 2012; and (3) a $45,000 increase to Mr. Shafer’s salary to $260,000, effective February 1, 2012. Mr. Kelly did not receive an increase in base salary for fiscal year 2012 as he resigned in January 2011.
In the future, we expect that salaries for executive officers will be reviewed annually, as well as at the time of a promotion or other change in level of responsibilities, or when competitive circumstances or business needs may require.
111
Table of Contents
Performance-based cash incentives—Management Bonus Plan
We pay annual performance-based cash bonuses in order to align the compensation of our NEOs with our short-term operational and performance goals and to provide near-term incentives for our NEOs to meet these goals. Each of the employment agreements, as described below under “—Employment Agreements,” establishes the potential bonus opportunity for our NEOs expressed as a percentage of such NEO’s base salary for the fiscal year in which they were entered into and beyond. The target percentages range from 25% to 50% of base salary. For fiscal year 2011, bonuses were paid under our 2011 management bonus plan (the “Bonus Plan”). The terms of the Bonus Plan were largely developed by the Compensation Committee and approved by our board of directors in February 2011 as part of an on-going process to review and enhance our compensation programs. In general, the Bonus Plan was intended to incentivize our NEOs to achieve financial, operational and strategic objectives in fiscal year 2011.
The factors that the Compensation Committee considered in setting the Bonus Plan for 2011 included one financial objective (see the second bullet in the chart provided below), and the remaining goals were largely subjective and based upon the standards described below. Our Compensation Committee has the discretion to determine whether and in what amounts such bonuses are paid based upon its subjective evaluation of whether the executive officers have achieved their respective corporate and individual objectives and the impact of their performance on overall corporate objectives. Bonus determinations are not formulaic and our Compensation Committee retains discretion over the ultimate annual bonus determinations regardless of a named executive officer’s individual or corporate performance. In making the bonus determinations or determining the level at which the subjective goals described below were satisfied, our Compensation Committee has not historically followed any established guidelines.
The following chart summarizes our corporate objectives for fiscal year 2011 under the 2011 management bonus plan (collectively, the “2011 Corporate Milestones”).
| 2011 Corporate Milestones |
| Build & Operate Asian Biorefinery |
| • Construction of the biorefinery |
| • Development of supply chain strategies |
| • Secure contracts and qualify customers for biorefinery off-take |
| Design and Finance a North American Biorefinery |
| Deliver and Innovate Specialty Chemical Products and Demonstrate Market Value |
| • Develop proven molecules and secure commercial agreements in the target markets |
| Expand the Operating Business |
| • Deliver sales volumes of at least 24.5 kmt and gross margins of at least 7% |
| Infrastructure |
| • Hire additional resources and expand office space to accommodate growth |
Individual performance accounts for approximately 25% of each NEO’s potential cash bonus. Set forth below is a brief summary of the individual objectives that were established for each of our NEOs under the Bonus Plan.
Chief Executive Officer:
| • | ensure execution and delivery of 2011 Corporate Milestones; |
| • | ongoing development of executive team; and |
| • | hire additional management team members. |
112
Table of Contents
Chief Financial Officer:
| • | S-1 preparation and submission; |
| • | expand finance and accounting capability; and |
| • | explore and evaluate Natchez financing options. |
Chief Operating Officer:
| • | implement Asian joint venture; |
| • | design North American biorefinery; |
| • | expand the operating business; and |
| • | expand research and development capability. |
Executive Vice President, Marketing and Sales:
| • | develop customer pipelines for specialty and premium chemicals; |
| • | deliver off-take agreements for various biorefinery streams; and |
| • | expand marketing and sales capability and processes. |
Vice President Finance and Treasury:
| • | manage corporate funds to preserve capital and provide liquidity; |
| • | deliver timely and accurate consolidated audited financial reports; and |
| • | support closure of fundraising activities. |
On January 26, 2012, the Compensation Committee approved bonus payments to the NEOs under the 2011 Bonus Plan (effective February 1, 2012). The following table shows each NEO’s potential bonus payments and actual bonus payment, for fiscal year 2011.
| Name |
Target Bonus Payment |
Maximum Bonus Payment |
Actual Bonus Payment |
Actual Bonus Payment as a Percentage of Base Salary |
||||||||||||
| K’Lynne Johnson |
$ | 175,000 | $ | 262,500 | $ | 175,000 | 50.0 | % | ||||||||
| David Kelsey(1)(2) |
170,000 | (2) | 255,000 | (2) | 60,208 | (2) | 17.7 | (2) | ||||||||
| Mel L. Luetkens, Ph.D. |
137,500 | 206,250 | 116,875 | 42.5 | ||||||||||||
| Andy L. Shafer |
86,000 | 161,250 | 86,000 | 40.0 | ||||||||||||
| Kara E. Lawrence |
48,750 | 58,500 | TBD | (3) | TBD | (3) | ||||||||||
| Patrick Kelly(1) |
120,000 | 180,000 | 10,000 | 4.2 | (4) | |||||||||||
| (1) | Mr. Kelly resigned as our Chief Financial Officer in January 2011. Mr. Kelsey was hired as our Chief Financial Officer effective August 15, 2011. |
| (2) | Target amounts are for the full fiscal year 2011. Actual amounts are calculated based on the portion of fiscal year 2011 during which Mr. Kelsey was employed by us (i.e. August 15, 2011 through December 31, 2011) and the pro-rated performance bonus he received for fiscal year 2011. |
| (3) | The amount of Ms. Lawrence’s bonus payment for fiscal year 2011 is still to be determined. |
| (4) | Calculated based on the percentage of Mr. Kelly’s base salary at the time of his resignation. |
In determining and approving the bonus amounts and payments, the Compensation Committee concluded that overall company performance was largely on target and therefore the 75% component was paid at target levels. With respect to individual objectives, the Compensation Committee compared each NEO’s performance to the goals set forth above and determined the composite individual payout percentage for each NEO with
113
Table of Contents
respect to attainment of those goals. For each NEO other than Ms. Johnson and Ms. Lawrence, the Compensation Committee consulted with Ms. Johnson regarding the individual performance of such executive as compared to his or her individual performance goals. The management bonus plan for fiscal year 2012 weights corporate objectives and personal performance objectives the same way in calculating the cash bonus for fiscal year 2012.
The management bonus plan for fiscal year 2012 includes the following corporate objectives:
| • | grow annual revenues from existing products to $40.0 million and gross profit to $2.5 million; |
| • | hire 40 additional resources and further expand information systems and facilities to support business requirements; |
| • | contract for sale of product from the Indonesia facility as it becomes available during the start up phase; and |
| • | manage sales, general and administrative expenses to be no greater than $44 million. |
Equity incentives
All of our NEOs (and Mr. Kelsey) have received stock option grants under our 2007 Plan that vest over time or upon the occurrence of certain events. To date, we have used grants of stock options as our only form of equity compensation because options are an effective means to align the long-term interests of our executive officers with those of our stockholders and they also reward our NEOs for performance. The value of an option is at risk for the NEO and is entirely dependent on the value of a share of our stock. The value of our stock is dependent in many ways on management’s success in achieving our goals. If the price of our common stock drops for any reason over the vesting period of the option, the value of the option to the executive will drop and could ultimately become worthless. In determining the number and type of stock options to be granted to executives, we take into account the individual’s position, scope of responsibility, ability to affect profits and stockholder value, the individual’s historical and recent performance and the value of each stock option in relation to other elements of the individual executive’s total compensation. Our board of directors generally makes annual option grants in the first quarter of each fiscal year and, in many cases, initial one-time grants in connection with the hiring of a new executive.
We may in the future grant other forms of equity incentives, subject to the Compensation Committee’s discretion, to ensure that our executives are focused on long-term value creation. We expect that the Compensation Committee will periodically review the equity awards previously awarded to management, the performance of our business and the performance of our stock and, following this offering, make additional grants. We also expect that the Compensation Committee will require our NEOs to maintain and hold equity in our company following this offering. However, no formal requirements have yet been established.
Stock options granted by us to date under the 2007 Plan have an exercise price equal to or greater than the fair market value of our common stock on the date of grant, generally vest over a four-year period from the date of the grant and expire ten years after the date of grant, unless earlier terminated in accordance with the 2007 Plan or applicable award agreements. Specifically, grants that have been made pursuant to the 2007 Plan are generally subject to the following vesting schedule: 1/4th of the stock options vest upon the first anniversary of the grant date with the remaining options vesting monthly on a pro rata basis over a three-year vesting period following the first anniversary of the grant date.
We made our fiscal year 2011 annual grant of options to our employees under the 2007 Plan on March 24, 2011, pursuant to which we granted options to purchase an aggregate of 888,892 shares of our common stock at an exercise price of $2.14 per share. We issued options to purchase 400,000 shares of our common stock at an exercise price of $16.22 per share to Mr. Kelsey on November 17, 2011, in connection with our hiring him as our new Chief Financial Officer. The exercise price for options outstanding under the 2007 Plan will be adjusted as a result of the for stock split we will be effecting in connection with this offering.
114
Table of Contents
Summary of the 2007 Plan
The 2007 Plan permits grants of stock options and restricted stock awards (collectively, “2007 Awards”) to our officers, directors and employees. The Plan also provides for the grant of 2007 Awards (other than “incentive stock options” (as defined in Section 422 of the Internal Revenue Code of 1986, as amended (the “Code”)) to consultants that are natural persons as consideration for performing bona fide consulting or advisory services for us that do not involve any capital-raising transaction. We have not issued any restricted stock awards under the 2007 Plan. The purpose of the 2007 Plan is to provide incentives that will attract, retain and motivate eligible persons whose present and potential contributions are important to our success, our parent company (if any) and any of our subsidiaries by offering them an opportunity to participate in our future performance through 2007 Awards. The following is a summary of the material terms of the 2007 Plan, but does not include all of the provisions of the 2007 Plan. For further information about the 2007 Plan, we refer you to the complete copy of the 2007 Plan, which we have filed as an exhibit to the registration statement, of which this prospectus is a part. Following the completion of this offering, we do not expect to make any further grants under the 2007 Plan and will make equity award grants under the Elevance Renewable Sciences, Inc. 2012 Incentive Compensation Plan (the “2012 Plan,” as further described below in “—Equity Incentives—2012 Plan.”)
Administration. The 2007 Plan is currently administered by the Compensation Committee. Among the Compensation Committee’s powers is to construe and interpret the 2007 Plan, any related award agreement or other agreement or document executed pursuant to the 2007 Plan; prescribe, amend and rescind rules and regulations relating to the 2007 Plan; grant 2007 Awards and approve persons to receive 2007 Awards; determine the form and terms of 2007 Awards; determine the number of shares or other consideration subject to 2007 Awards; determine whether 2007 Awards will be granted singly, in combination with, in tandem with, in replacement of, or as alternatives to, other 2007 Awards or awards under any other incentive or compensation plan; determine whether Section 25102(o) of the California Corporations Code (the “California Code”) is to apply to any Award; grant waivers of any conditions of the 2007 Plan or any 2007 Award; determine the terms of vesting, exercisability and payment of 2007 Awards; correct any defect, supply any omission or reconcile any inconsistency in the 2007 Plan, any 2007 Award or any award or exercise agreement; determine whether a 2007 Award has been earned; delegate to one or more officers that are members of our board of directors or to a committee comprised of two (2) or more “outside directors” (as defined in regulations promulgated under Section 162(m) of the Code) the authority to grant 2007 Awards; make all other determinations necessary or advisable for the administration of the 2007 Plan; and extend the vesting period beyond a participant’s termination date.
Available shares. The number of shares of common stock with respect to which 2007 Awards may be granted under the 2007 Plan may not exceed 3,067,069 common shares. At December 31, 2011, 276,419 shares of our common stock were available for grant under the 2007 Plan. In general, if 2007 Awards expire or terminate unexercised for any reason or are forfeited or repurchased by us at the original issue price at which the related shares of our common stock were issued, the shares covered by such 2007 Awards will again be available for the grant of awards under the 2007 Plan.
Eligibility for participation. Our employees (including employee directors and officers) are eligible to receive grants of incentive stock options under the 2007 Plan. All other types of 2007 Awards (including nonqualified stock options) may be granted to any of our employees, officers and directors and to any consultant that is a natural person, if the 2007 Award to such consultant is in full or partial consideration for bona fide services unconnected with any offer and sale of securities in a capital raising transaction.
Award agreements. 2007 Awards previously granted under the 2007 Plan are evidenced by stock option agreements which need not be identical, that provide additional terms, conditions, restrictions and limitations covering the grant of the 2007 Award, including additional terms providing for the acceleration of exercisability or vesting of 2007 Awards in the event of a change in control or conditions regarding the participant’s employment, as determined by the Compensation Committee. Except as discussed below, the Compensation
115
Table of Contents
Committee determines the number of shares of common stock subject to each 2007 Award, the term of each 2007 Award, the exercise price, the vesting schedule and the material terms of each 2007 Award.
Stock options. The Compensation Committee may grant nonqualified stock options and incentive stock options to purchase shares of our common stock to our employees. The Compensation Committee may also grant nonqualified stock options to our consultants, subject to the restrictions discussed above in “—Eligibility for Participation.” To date, all 2007 Awards have been nonqualified stock options. The Compensation Committee will determine the number of shares of our common stock subject to each option, the term of each option, which may not exceed ten years (or, with respect to incentive stock options held by a 10% stockholder, five years), the exercise price, the vesting schedule, if any, and the material terms of each option. Notwithstanding the foregoing, if the option is subject to Section 25102(o) of the California Code, the exercise price of the option shall be at least 85% of the fair market value (as determined in accordance with the 2007 Plan) on the grant date of the shares of our common stock into which such option is exercisable (the “Shares”). Stock options granted to any person who directly, or by attribution, owns more than 10% of the total combined voting power of all classes of our stock (a “Ten Percent Stockholder”) shall have an exercise price not less than 110% of the fair market value (as determined in accordance with the 2007 Plan) of the Shares on the grant date, unless such option is both (1) a nonqualified stock option and (2) not subject to Section 25102(o) of the California Code. If a stock option is to be an incentive stock option and is not granted to a Ten Percent Stockholder, then the related exercise price shall not be less than 100% of the fair market value (as determined in accordance with the 2007 Plan) of the Shares on the grant date.
Unless earlier terminated, if the participant is terminated for any reason other than death, Disability or Cause (each as defined below), then the participant may exercise his or her options only to the extent that such options have vested as of the termination date, unless otherwise determined by the Compensation Committee. All such vested options must be exercised within three months of the termination date, unless otherwise determined by the Compensation Committee; provided, that any exercise occurring three months or more after the termination dates will be deemed to be exercise of a nonqualified stock option. If a participant is terminated because of death or Disability or dies within three months after a termination other than for Cause, then such participant’s options may only be exercised to the extent they had vested as of the termination date. Such vested options must be exercised within 12 months of the termination date, unless otherwise determined by the Compensation Committee; provided that the exercise period may not exceed five years and may not extend past the expiration date of the applicable options. When a participant is terminated for Cause, any option held by such participant will expire and cease to be exercisable on such participant’s termination date, unless otherwise determined by the Compensation Committee.
As defined in the 2007 Plan, “Cause” means termination on the basis of any of the following: (1) the participant’s conviction for, or guilty plea to, a felony involving moral turpitude; (2) a willful refusal by the participant to comply with the lawful and reasonable instructions of the company or to otherwise perform his or her duties as lawfully and reasonably determined by the company, in each case that is not cured by the participant (if such refusal is of a type that is capable of being cured) within 15 days of written notice being given to the participant of such refusal; (3) any willful misconduct or act of dishonesty undertaken by the participant and intended to result in his or her (or any other person’s) substantial gain or personal enrichment at the expense of the company or any of its customers, partners, affiliates or employees; or (4) any willful act of gross misconduct by the participant which is materially injurious or intended to be materially injurious to the company. “Disability”, as defined in the 2007 Plan means a disability, whether temporary or permanent, partial or total, as determined by the Compensation Committee.
Restricted stock. The Compensation Committee may award shares of restricted stock in the form of a 30-day offer by the company to sell shares that are subject to the specified restrictions. Except as otherwise provided by the Compensation Committee upon the award of restricted stock, the recipient generally has the rights of a stockholder with respect to the shares, including the right to receive dividends and the right to vote the shares of restricted stock. We have not issued any shares of restricted stock under the 2007 Plan or entered into any restricted stock purchase agreements under the 2007 Plan.
116
Table of Contents
Corporation transactions. In the event of certain corporate transactions (as defined in the 2007 Plan) any or all outstanding 2007 Awards may be assumed, converted or replaced by the successor or acquiring corporation. In the alternative, the successor or acquiring corporation may substitute such awards or provide substantially similar consideration to such holder as was provided to stockholders of the company. The successor or acquiring corporation may also issue, in place of shares granted pursuant to such award, substantially similar shares or other property subject to repurchase restrictions and other provisions substantially no less favorable to the award holder. In the event such successor or acquiring corporation, if any, refuses to assume, convert or replace the 2007 Awards, or if there is no successor or acquiring corporation due to a dissolution or liquidation of the company, then, such 2007 Awards expire in connection with such corporate transaction at such time and on such conditions as the board of directors determines (including, without limitation, full or partial vesting and exercisability of any or all outstanding 2007 Awards).
Summary of the 2012 Plan
In connection with this offering, we intend to adopt the 2012 Plan. It is our expectation that the 2012 Plan will provide for grants of stock options, stock appreciation rights, restricted stock, other stock-based awards and other cash-based awards. Directors, officers and other employees of us and our subsidiaries, as well as others providing certain consulting or advisory services for us, will be eligible for grants under the 2012 Plan. The purpose of the 2012 Plan will be to provide incentives that will attract, retain and motivate high-performing officers, directors, employees and consultants by providing them with appropriate incentives and rewards either through a proprietary interest in our long-term success or compensation based on their performance in fulfilling their personal responsibilities. Set forth below is a summary of the currently proposed material terms of the 2012 Plan, but does not include all of the provisions of the 2012 Plan.
Administration. The 2012 Plan will be administered by the Compensation Committee. Among the Compensation Committee’s powers will be to determine the form, amount and other terms and conditions of awards; clarify, construe or resolve any ambiguity in any provision of the 2012 Plan or any award agreement; amend the terms of outstanding awards; and adopt such rules, forms, instruments and guidelines for administering the 2012 Plan as it deems necessary or proper. The Compensation Committee will have full authority to administer and interpret the 2012 Plan, to grant discretionary awards under the 2012 Plan, to determine the persons to whom awards will be granted, to determine the types of awards to be granted, to determine the terms and conditions of each award, to determine the number of shares of common stock to be covered by each award, to make all other determinations in connection with the 2012 Plan and the awards thereunder as the Compensation Committee deems necessary or desirable and to delegate authority under the 2012 Plan to our executive officers.
Available shares. The 2012 Plan will set forth the aggregate number of shares of common stock which may be issued or used for reference purposes under the 2012 Plan or with respect to which awards may be granted. The number of shares available for issuance under the 2012 Plan may be subject to adjustment in the event of a reorganization, stock split, merger or similar change in the corporate structure or the number of outstanding shares of our common stock. In the event of any of these occurrences, we may make any adjustments we consider appropriate to, among other things, the number and kind of shares, options or other property available for issuance under the plan or covered by grants previously made under the plan. The shares available for issuance under the 2012 Plan may be, in whole or in part, either authorized and unissued shares of our common stock or shares of common stock held in or acquired for our treasury. In general, if awards under the 2012 Plan are for any reason cancelled, or expire or terminate unexercised, the shares covered by such awards may again be available for the grant of awards under the 2012 Plan.
Eligibility for participation. Members of our board of directors, as well as employees of, and consultants to, us or any of our subsidiaries and affiliates will be eligible to receive awards under the 2012 Plan.
Award agreement. Awards granted under the 2012 Plan will be evidenced by award agreements, which need not be identical, that provide additional terms, conditions, restrictions or limitations covering the grant of the
117
Table of Contents
award, including, without limitation, additional terms providing for the acceleration of exercisability or vesting of awards in the event of a change of control or conditions regarding the participant’s employment, as determined by the Compensation Committee.
Stock options. The Compensation Committee may grant nonqualified stock options to any eligible participant under the 2012 Plan and incentive stock options to purchase shares of our common stock only to eligible employees. The Compensation Committee will determine the number of shares of our common stock subject to each option, the term of each option, which may not exceed ten years, or five years in the case of an incentive stock option granted to a 10% or greater stockholder, the exercise price, the vesting schedule, if any, and the other material terms of each option. No incentive stock option or nonqualified stock option may have an exercise price less than the fair market value of a share of our common stock at the time of grant or, in the case of an incentive stock option granted to a 10% or greater stockholder, 110% of such share’s fair market value. Options will be exercisable at such time or times and subject to such terms and conditions as determined by the committee at grant and the exercisability of such options may be accelerated by the Compensation Committee.
Stock appreciation rights. The Compensation Committee may grant stock appreciation rights, or “SARs,” either with a stock option, which may be exercised only at such times and to the extent the related option is exercisable, or “Tandem SAR,” or independent of a stock option, or “Non-Tandem SAR.” A SAR is a right to receive a payment in shares of our common stock or cash, as determined by the Compensation Committee, equal in value to the excess of the fair market value of one share of our common stock on the date of exercise over the exercise price per share established in connection with the grant of the SAR. The term of each SAR may not exceed ten years. The exercise price per share covered by an SAR will be the exercise price per share of the related option in the case of a Tandem SAR and will be the fair market value of our common stock on the date of grant in the case of a Non-Tandem SAR. The Compensation Committee may also grant limited SARs, either as Tandem SARs or Non-Tandem SARs, which may become exercisable only upon the occurrence of a change in control, as will be defined in the 2012 Plan and as discussed below in “—Change in Control,” or such other event as the committee may designate at the time of grant or thereafter.
Restricted stock. The Compensation Committee may award shares of restricted stock. Except as otherwise provided by the Compensation Committee upon the award of restricted stock, the recipient generally will have the rights of a stockholder with respect to the shares, including the right to receive dividends, the right to vote the shares of restricted stock and, conditioned upon full vesting of shares of restricted stock, the right to tender such shares, subject to the conditions and restrictions generally applicable to restricted stock or specifically set forth in the recipient’s restricted stock agreement. The Compensation Committee may determine at the time of award that the payment of dividends, if any, will be deferred until the expiration of the applicable restriction period. Recipients of restricted stock will be required to enter into a restricted stock agreement with us that states the restrictions to which the shares are subject, which may include satisfaction of pre-established performance goals, and the criteria or date or dates on which such restrictions will lapse. If the grant of restricted stock or the lapse of the relevant restrictions is based on the attainment of performance goals, the Compensation Committee will establish for each recipient the applicable performance goals, formulae or standards and the applicable vesting percentages with reference to the attainment of such goals or satisfaction of such formulae or standards while the outcome of the performance goals is substantially uncertain. Such performance goals may incorporate provisions for disregarding, or adjusting for, changes in accounting methods, corporate transactions, including, without limitation, dispositions and acquisitions, and other similar events or circumstances. Section 162(m) of the Internal Revenue Code requires that performance awards be based upon objective performance measures. The performance goals for performance-based restricted stock will be based on one or more of the objective criteria to be set forth in the 2012 Plan and are discussed in general below.
Other stock-based awards. The Compensation Committee may, subject to limitations under applicable law, make a grant of such other stock-based awards, including, without limitation, performance units, dividend equivalent units, stock equivalent units, restricted stock and deferred stock units under the 2012 Plan that are payable in cash or denominated or payable in or valued by shares of our common stock or factors that influence
118
Table of Contents
the value of such shares. The Compensation Committee may determine the terms and conditions of any such other awards, which may include the achievement of certain minimum performance goals for purposes of compliance with Section 162(m) of the Code and a minimum vesting period. The performance goals for performance-based other stock-based awards will be based on one or more of the objective criteria to be set forth in the 2012 Plan and discussed in general below.
Other cash-based awards. The Compensation Committee may grant awards payable in cash. Cash-based awards shall be in such form, and dependent on such conditions, as the Compensation Committee shall determine, including, without limitation, being subject to the satisfaction of vesting conditions or awarded purely as a bonus and not subject to restrictions or conditions. If a cash-based award is subject to vesting conditions, the Compensation Committee may accelerate the vesting of such award in its discretion.
Performance awards. The Compensation Committee may grant a performance award to a participant payable upon the attainment of specific performance goals. The Compensation Committee may grant performance awards that are intended to qualify as performance-based compensation under Section 162(m) of the Code as well as performance awards that are not intended to qualify as performance-based compensation under Section 162(m) of the Code. If the performance award is payable in cash, it may be paid upon the attainment of the relevant performance goals either in cash or in shares of restricted stock, based on the then-current fair market value of such shares, as determined by the Compensation Committee. Based on service, performance or other factors or criteria, the committee may, at or after grant, accelerate the vesting of all or any part of any performance award.
Performance goals. The Compensation Committee may grant awards of restricted stock, performance awards, and other stock-based awards that are intended to qualify as performance-based compensation for purposes of Section 162(m) of the Code. These awards may be granted, vest and be paid based on the attainment of specified performance goals established by the Compensation Committee. These performance goals may be based on the attainment of a certain target level of, or a specified increase or decrease in, one or more of the following measures selected by the Compensation Committee: (1) earnings per share; (2) operating income; (3) net income, before or after taxes; (4) cash flow; (5) gross margin return on investment; (6) gross margin; (7) operating margin; (8) working capital; (9) earnings before interest and taxes; (10) earnings before interest, tax, depreciation and amortization; (11) return on equity; (12) return on assets; (13) return on capital; (14) return on invested capital; (15) net revenues; (16) gross revenues; (17) revenue growth, as to either gross or net revenues; (18) annual recurring net or gross revenues; (19) recurring net or gross revenues; (20) license revenues; (21) sales or market share; (22) total stockholder return; (23) economic value added; (24) specified objectives with regard to limiting the level of increase in all or a portion of our bank debt or other long-term or short-term public or private debt or other similar financial obligations, which may be calculated net of cash balances and other offsets and adjustments as may be established by the Compensation Committee; (25) the fair market value of a share of common stock; (26) the growth in the value of an investment in the common stock assuming the reinvestment of dividends; (27) reduction in operating expenses or (28) other objective criteria determined by the Compensation Committee. The Compensation Committee may also establish or adopt other measures not set forth above.
To the extent permitted by applicable law, the Compensation Committee may also exclude the impact of an event or occurrence which the committee determines should be appropriately excluded, such as (1) restructurings, discontinued operations, extraordinary items and other unusual or non-recurring charges; (2) an event either not directly related to our operations or not within the reasonable control of management; or (3) a change in accounting standards required by generally accepted accounting principles. Performance goals may also be based on an individual participant’s performance goals, as determined by the Compensation Committee. In addition, all performance goals may be based upon the attainment of specified levels of our performance, or the performance of a subsidiary, division or other operational unit, under one or more of the measures described above relative to the performance of other corporations. The Compensation Committee may designate additional business criteria on which the performance goals may be based or adjust, modify or amend those criteria.
119
Table of Contents
Change in control. In connection with a change in control, as defined in the 2012 Plan, the Compensation Committee may accelerate vesting of outstanding awards under the 2012 Plan. In addition, such awards may be, in the discretion of the Compensation Committee, (1) assumed and continued or substituted in accordance with applicable law; (2) purchased by us for an amount equal to the excess of the price of a share of our common stock paid in a change in control over the exercise price of the awards; or (3) cancelled if the price of a share of our common stock paid in a change in control is less than the exercise price of the award. The Compensation Committee may also provide for accelerated vesting or lapse of restrictions of an award at any time.
Stockholder rights. Except as otherwise provided in the applicable award agreement, and with respect to an award of restricted stock, a participant will have no rights as a stockholder with respect to shares of our common stock covered by any award until the participant becomes the record holder of such shares.
Amendment and termination. Notwithstanding any other provision of the 2012 Plan, our board of directors may at any time amend any or all of the provisions of the 2012 Plan, or suspend or terminate it entirely, retroactively or otherwise; provided, however, that, unless otherwise required by law or specifically provided in the 2012 Plan, the rights of a participant with respect to awards granted prior to such amendment, suspension or termination may not be adversely affected without the consent of such participant.
Transferability. Awards granted under the 2012 Plan generally will be nontransferable, other than by will or the laws of descent and distribution, except that the Compensation Committee may provide for the transferability of nonqualified stock options at the time of grant or thereafter to certain family members.
Recoupment of awards. The 2012 Plan will provide that awards granted under the 2012 Plan are subject to any recoupment policy we may adopt regarding the clawback of “incentive-based compensation” under the Securities Exchange Act of 1934, as amended (the “Exchange Act”) or under any applicable rules and regulations promulgated by the SEC.
Effective date. We expect that the 2012 Plan will be adopted before consummation of this offering.
Additional benefits and perquisites
We provide our executive officers with benefits that our board of directors believes are reasonable and in the best interests of the company and our stockholders. Consistent with our compensation philosophy, we intend to continue to maintain our current benefits for our executive officers, including retirement plans, life insurance benefits, paid vacation and other perquisites described below. The Compensation Committee, in its discretion, may revise, amend or add to an officer’s benefits if it deems it advisable. We believe the benefits we currently provide are generally equivalent to benefits provided by comparable companies.
Retirement plan benefits. We sponsor a 401(k) defined contribution plan (the “401(k) Plan”) covering all eligible employees. Employee contributions to the 401(k) Plan are voluntary. We contribute an amount equal to 100% of a participant’s contribution up to 4% of such participant’s compensation. Our contributions vest immediately. Contributions by participants are limited to their annual tax-deferred contribution limit as allowed by the Internal Revenue Service. Our total matching contributions to the 401(k) Plan were approximately $176,570, $239,240 and $308,194 for the fiscal years ended December 31, 2009, 2010 and 2011, respectively. We may contribute additional amounts to the 401(k) Plan at our discretion. Discretionary employer contributions also vest immediately. We have not previously made a discretionary contribution to the 401(k) Plan.
Health and welfare benefits. We offer health, dental and vision coverage for all employees. Cost for such coverage is shared between us and the employee. Company contribution percentages to benefits are the same for all employees that choose to participate. Our executive officers are offered bi-annual executive physicals as a part of our wellness and risk management programs. Executive physical expenses not covered by insurance are reimbursed by us and have historically averaged approximately $2,800 per executive officer.
120
Table of Contents
Life insurance. We provide to each benefits-eligible employee, including the NEOs, life insurance with death benefits equal to one times such employee’s annual base salary, up to $300,000, and make related monthly premium payments on behalf of each employee.
Disability insurance. We provide all employees with short-term disability coverage of 60% of their respective weekly salaries up to $1,000 per week. We also provide all employees with long-term disability coverage of 60% of their respective monthly salaries up to $10,000 per month.
Accounting and Tax Considerations
In determining which elements of compensation are to be paid, and how they are weighted, we also take into account whether a particular form of compensation will be deductible under Section 162(m) of the Code. Section 162(m) generally limits the deductibility of compensation paid to each of our NEOs to $1.0 million during any fiscal year unless such compensation is “performance-based” under Section 162(m). However, under a Section 162(m) transition rule for compensation plans or agreements of corporations which are privately held and which become publicly held in an initial public offering, compensation paid under a plan or agreement that existed prior to the initial public offering will not be subject to Section 162(m) until the earlier of (1) the expiration of the plan or agreement; (2) a material modification of the plan or agreement; (3) the issuance of all employer stock and other compensation that has been allocated under our existing plans; or (4) the first meeting of stockholders at which directors are to be elected that occurs after the close of the third calendar year following the year of the initial public offering (the “Transition Date”). After the Transition Date, rights or awards granted under the plan will not qualify as “performance-based compensation” for purposes of Section 162(m) unless such rights or awards are granted or vest upon pre-established objective performance goals, the material terms of which are disclosed to and approved by our stockholders.
Our compensation program is intended to maximize the deductibility of the compensation paid to our NEOs to the extent that we determine it is in our best interests. Consequently, we may rely on the exemption from Section 162(m) afforded to us by the transition rule described above for compensation paid pursuant to our pre-existing plans. Following this offering, the Compensation Committee will determine whether and how to structure our compensation program so as to preserve the related federal income tax deductions.
Many other Code provisions, SEC regulations and accounting rules affect the payment of executive compensation and are generally taken into consideration as programs are developed. Our goal is to create and maintain plans that are efficient, effective and in full compliance with these requirements.
Compensation Tables
The following tables provide information regarding the compensation earned by our NEOs during fiscal years 2010 and 2011, where applicable.
121
Table of Contents
Summary Compensation Table
The following table shows the compensation earned by our NEOs during the fiscal years 2010 and 2011.
| Name and Principal Position |
Year | Salary(1) | Option Awards(2) |
Non-Equity Incentive Plan Compensation(3) |
All
Other Compensation(4) |
Total | ||||||||||||||||||
| K’Lynne Johnson, |
2011 | $ | 345,833 | $ | 321,980 | $ | 175,000 | $ | 9,800 | $ | 852,613 | |||||||||||||
| 2010 | 320,833 | 90,871 | 162,500 | 13,663 | 587,867 | |||||||||||||||||||
| David Kelsey(6), |
2011 | 128,808 | 4,367,746 | 60,208 | 26,780 | 4,583,542 | ||||||||||||||||||
| Mel L. Luetkens, Ph.D., |
2011 | 270,833 | 220,020 | 116,875 | 9,800 | 617,528 | ||||||||||||||||||
| 2010 | 248,333 | 24,930 | 125,000 | 12,559 | 410,822 | |||||||||||||||||||
| Andy L. Shafer, |
2011 | 212,500 | 53,633 | 86,000 | 8,843 | 361,006 | ||||||||||||||||||
| 2010 | 200,000 | 17,095 | 60,000 | 10,830 | 287,925 | |||||||||||||||||||
| Kara E. Lawrence, |
2011 | 190,000 | 48,834 | TBD | (5) | 9,053 | TBD | (5) | ||||||||||||||||
| 2010 | 168,135 | 8,946 | 40,000 | 9,829 | 226,910 | |||||||||||||||||||
| Patrick Kelly(6), |
2011 | 30,769 | N/A | 10,000 | N/A | 40,769 | ||||||||||||||||||
| 2010 | 240,000 | 19,588 | 72,000 | 9,800 | 341,388 | |||||||||||||||||||
| (1) | Due to annual base salary adjustments during fiscal year 2010 for Ms. Johnson, Dr. Luetkens, Mr. Shafer and Ms. Lawrence described in “—Employment Agreements,” the salary amounts for fiscal year 2011 included in the table above differ from the amounts set forth under the heading “—Compensation Discussion and Analysis—Elements of Compensation—Base Salary.” |
| (2) | Represents the aggregate grant date fair value of stock option grants made during fiscal year 2010, calculated in accordance with ASC 718. For additional information, see “Management’s Discussion and Analysis of Financial Condition and Results of Operations—Critical Accounting Policies and Estimates—Share-Based Compensation” and Note 19 of our financial statements for additional information, including valuation assumptions used in calculating the fair value of the awards. |
| (3) | Represents the aggregate amount of cash bonuses paid to all NEOs on March 15, 2011, for fiscal year 2010 performance and on February 15, 2012 for fiscal year 2011 performance (other than Mr. Kelly). Mr. Kelly received a pro-rated portion of his 2011 target bonus in the amount of $10,000. |
| (4) | The following table details All Other Compensation paid to each of our NEOs during fiscal year 2011: |
| Name |
Relocation | 401(k) Company Match |
Total | |||||||||
| K’Lynne Johnson |
— | $ | 9,800 | $ | 9,800 | |||||||
| David Kelsey |
$ | 26,780 | — | 26,780 | ||||||||
| Mel L. Luetkens, Ph.D. |
— | 9,800 | 9,800 | |||||||||
| Andy L. Shafer |
— | 8,843 | 8,843 | |||||||||
| Kara E. Lawrence |
— | 9,053 | 9,053 | |||||||||
| Patrick Kelly |
— | — | — | |||||||||
| (5) | The amount of Ms. Lawrence’s bonus for fiscal year 2011 is still to be determined. The Compensation Committee currently expects to determine such amount in March 2012 and we will report such amount in a subsequent amendment to this prospectus. |
| (6) | Mr. Kelly resigned as our Chief Financial Officer in January 2011. Mr. Kelsey was hired as our Chief Financial Officer effective August 15, 2011. |
122
Table of Contents
2011 Grants of Plan-based Awards Table
During fiscal year 2011, each of our NEOs participated in the Bonus Plan under which each NEO was eligible for awards as set forth under “Estimated Potential Payouts Under Non-Equity Incentive Plan Awards” below. The actual payout received by the NEOs is included in the “Non-Equity Incentive Plan Compensation” column of the Summary Compensation Table. For a detailed discussion of the Bonus Plan, refer to “—Performance-Based Cash Incentives—Management Bonus Plans.”
We made grants of non-qualified stock options to our NEOs during fiscal year 2011 under the 2007 Plan as set forth in the table below. For a detailed discussion of our stock options, refer to “—Equity Incentives.”
| Name |
Estimated Potential Payouts Under Non-Equity Incentive Plan Awards(1) |
All Other Option Awards: Number of Securities Underlying Options |
Exercise or Base Price of Option Awards ($/sh)(2) |
Grant Date Fair Value of Stock and Award Options(3) |
||||||||||||||||||
| Grant Date | Target | Maximum | ||||||||||||||||||||
| K’Lynne Johnson |
February 2011 | $ | 175,000 | $ | 262,500 | — | $ | — | $ | — | ||||||||||||
| March 2011 | — | — | 300,000 | 2.14 | 321,980 | |||||||||||||||||
| David Kelsey(4) |
August 2011 | 170,000 | (4) | 255,000 | (4) | — | — | — | ||||||||||||||
| November 2011 | — | — | 400,000 | 16.22 | 4,367,746 | |||||||||||||||||
| Mel L. Luetkens, Ph.D. |
February 2011 | 137,500 | 206,250 | — | — | — | ||||||||||||||||
| March 2011 |
— | — | 205,000 | 2.14 | 220,020 | |||||||||||||||||
| Andy L. Shafer |
February 2011 | 86,000 | 161,250 | — | — | — | ||||||||||||||||
| March 2011 |
— | — | 50,000 | 2.14 | 53,663 | |||||||||||||||||
| Kara E. Lawrence |
February 2011 | 48,750 | 58,500 | — | — | — | ||||||||||||||||
| March 2011 |
— | — | 45,500 | 2.14 | 48,334 | |||||||||||||||||
| Patrick Kelly(4) |
January 2011 | 120,000 | 180,000 | — | — | — | ||||||||||||||||
| (1) | Includes target and maximum non-equity incentive plan awards that were paid in fiscal year 2012 for fiscal year 2011 performance. |
| (2) | Does not reflect a for stock split of our outstanding common stock that will be effective upon completion of this offering. |
| (3) | Represents the aggregate grant date fair value of each individual equity award (on a grant-by-grant basis) as computed under ASC 718. For additional information, see “Management’s Discussion and Analysis of Financial Condition and Results of Operations—Critical Accounting Policies and Estimates—Share-Based Compensation.” The grants of stock options made on January 20, 2011 were for fiscal year 2010 performance. |
| (4) | Mr. Kelly resigned as our Chief Financial Officer in January 2011. Mr. Kelly received a pro-rata portion of his 2011 target bonus upon his termination. Mr. Kelsey was hired as our Chief Financial Officer effective August 15, 2011. The target and maximum bonus amounts for Mr. Kelsey are for the entire fiscal year 2011 although his 2011 bonus payment was calculated as 5/12th of the applicable target. See the “Non-Equity Incentive Plan Compensation” column of the 2011 Summary Compensation Table for disclosure of the actual bonus payments made. |
123
Table of Contents
Outstanding Equity Awards at 2011 Fiscal Year-End Table
The table below sets forth certain information regarding the outstanding equity awards held by our NEOs as of December 31, 2011. All of the outstanding equity awards were issued under our 2007 Plan. For further information regarding our 2007 Plan, including the vesting schedules of the awards granted thereunder, see “—Elements of Compensation—Equity Incentives—Summary of the 2007 Plan.”
| Name |
Grant Date |
Number of Securities Underlying Unexercised Options Exercisable (#) |
Number of Securities Underlying Unexercised Options Unexercisable (#) |
Option Exercise Price(1) |
Option Expiration Date |
|||||||||||||||
| K’Lynne Johnson(2) |
3/24/11 | — | 300,000 | $ | 2.14 | 3/24/21 | ||||||||||||||
| 1/20/10 | 122,187 | 132,813 | 2.12 | 1/20/20 | ||||||||||||||||
| 3/15/09 | 57,894 | 26,317 | 2.12 | 3/15/19 | ||||||||||||||||
| 3/20/08 | 256,718 | — | 2.12 | 3/20/18 | ||||||||||||||||
| David Kelsey(3) |
11/17/11 | — | 400,000 | 16.22 | 11/17/21 | |||||||||||||||
| Mel L. Luetkens, Ph.D.(4). |
3/24/11 | — | 205,000 | 2.14 | 3/24/21 | |||||||||||||||
| 1/20/10 | 33,541 | 36,459 | 2.12 | 1/20/20 | ||||||||||||||||
| 3/20/08 | 134,283 | — | 2.12 | 3/20/18 | ||||||||||||||||
| Andy L. Shafer(5)(6) |
3/24/11 | — | 50,000 | 2.14 | 3/24/21 | |||||||||||||||
| 1/20/10 | 23,000 | 25,000 | 2.12 | 1/20/20 | ||||||||||||||||
| 3/20/08 | 86,889 | — | 2.12 | 3/20/18 | ||||||||||||||||
| Kara E. Lawrence(6) |
3/24/11 | — | 45,500 | 2.14 | 3/24/21 | |||||||||||||||
| 1/20/10 | 12,036 | 13,082 | 2.12 | 1/20/20 | ||||||||||||||||
| 3/15/09 | 344 | 156 | 2.12 | 3/15/19 | ||||||||||||||||
| 3/20/08 | 37,026 | 2,469 | 2.12 | 3/20/18 | ||||||||||||||||
| Patrick Kelly |
— | — | — | — | — | |||||||||||||||
| (1) | Does not reflect a for stock split of our outstanding common stock that will be effective upon completion of this offering. |
| (2) | Except for the 256,718 options granted to Ms. Johnson on March 20, 2008, all of the options granted to Ms. Johnson are subject to the following vesting schedule: (1) 25% of the options from each grant vested on the first anniversary of the grant date; and (2) an additional 2.08% of the options from each such option grant vested (or will vest) at the end of each month subsequent to the first anniversary of the grant date, until the fourth anniversary of the grant date. For the 256,718 options granted to Ms. Johnson on March 20, 2008, the vesting schedule is as follows: (1) 50% of such options vested on November 20, 2008; and (2) 1.39% of such options vested at the end of each month after November 20, 2008, until November 20, 2011. |
| (3) | Mr. Kelly resigned as our Chief Financial Officer in January 2011. Mr. Kelsey was hired as our Chief Executive Officer effective August 15, 2011. Mr. Kelly exercised options to purchase 95,372 shares of our common stock on April 19, 2011. The remainder of the 31,012 stock options granted to him on May 5, 2008 and the 55,000 stock options granted to him on January 20, 2010 expired on his termination date. |
| (4) | For the 275,000 options granted to Dr. Luetkens on March 24, 2011 and January 20, 2010: (1) 25% of such options vested on the first anniversary of the grant date; and (2) an additional 2.08% of such options vested (or will vest) at the end of each month subsequent to the first anniversary of the grant date, until the fourth anniversary of the grant date. For the 134,283 options granted to Dr. Luetkens on March 20, 2008: (1) 50% of such options vested on November 20, 2008; and (2) 1.39% of such options vested at the end of each month after November 20, 2008, until November 20, 2011. |
| (5) | The options granted to Mr. Shafer on March 20, 2008 are subject to the following vesting schedule: (1) 25% of such options vested on November 20, 2008; and (2) an additional 2.08% of such options vested at the end of each month after November 20, 2008, until November 20, 2011. |
| (6) | The options granted Ms. Lawrence and the 98,000 options granted to Mr. Shafer on January 20, 2010 and March 24, 2011 are subject to the following vesting schedule: (1) 25% of the options from each option grant vested on the first anniversary of the grant date; and (2) an additional 2.08% of the options from each option grant vested at the end of each month subsequent to the first anniversary of the grant date, until the fourth anniversary of the grant date. |
124
Table of Contents
2011 Option Exercises and Stock Vested Table
Mr. Kelly exercised options to purchase 95,372 shares of our common stock on April 19, 2011. None of our other NEOs exercised stock options or had any other stock awards that vested in fiscal year 2011.
Pension Benefits
Our NEOs did not participate in or have account balances in any qualified or nonqualified defined benefit pension plans sponsored by us. Our board of directors or the Compensation Committee may elect to adopt qualified or nonqualified defined benefit pension plans in the future if it determines that doing so is in our best interest.
Deferred Compensation
We do not currently provide any deferred compensation program or benefits but may elect to do so in the future.
Employment Agreements
We are party to employment agreements with each of our NEOs according to the terms set forth below. In addition to the following descriptions, each agreement provides for confidentiality and the assignment of any of our employees’ inventions to us. We have included a description of Mr. Kelsey’s employment agreement in this section, as we hired Mr. Kelsey as our Chief Financial Officer effective August 15, 2011.
K’Lynne Johnson
We are party to an employment agreement with Ms. Johnson, our Chief Executive Officer, which became effective November 16, 2007. Under the terms of her employment agreement, Ms. Johnson is entitled to an annual base salary of $300,000. On February 1, 2012, the Compensation Committee increased Ms. Johnson’s annual base salary to $400,000. Ms. Johnson is also eligible to receive a discretionary annual bonus. Ms. Johnson’s target bonus is 70% of her annual base salary and is based on personal and business-related performance metrics established by the board of directors in its discretion. Ms. Johnson’s compensation is subject to annual review by the board of directors, which may make adjustments to her compensation upon evaluation of a variety of factors, including her performance and market practices. In 2007, in addition to her annual salary and discretionary annual bonus, Ms. Johnson was granted stock options to purchase up to 256,718 shares of our common stock. Ms. Johnson’s original grant of options vest over a four-year period at the rate of 50% on the one year anniversary of her employment and the balance in a series of 36 successive equal monthly installments upon her completion of each additional month of employment with us. Any additional grants that Ms. Johnson receives pursuant to her employment agreement vest on a similar schedule relative to the date of any such grant.
Ms. Johnson is entitled to receive benefits in accordance with the health and welfare plans we provide to our employees from time to time and for which she is eligible at a level that is no less favorable than our other comparable executive officers. Ms. Johnson is also entitled to up to four weeks of paid time off and paid holidays.
Our contract with Ms. Johnson creates an “employment at will” relationship that may be terminated by either party for any reason at any time. Upon the termination of Ms. Johnson’s employment with us, Ms. Johnson will be paid her salary accrued through her date of termination and for the value of all unused paid time off earned through that date. She is also entitled to continue her medical coverage at her own expense to the extent provided by the Consolidated Omnibus Budget Reconciliation Act of 1985, as amended (“COBRA”) or under applicable law.
125
Table of Contents
If Ms. Johnson’s employment is terminated by us without cause or if she resigns for good reason prior to a change in control and Ms. Johnson delivers to us a general release of all claims in favor of us, then (1) we will pay Ms. Johnson an amount equal to twelve months of her then-current base salary plus 100% of her then-current bonus, (2) 100% of any of Ms. Johnson’s then-unvested shares subject to any equity award granted to her by us that are outstanding as of her termination date shall have their vesting and exercisability accelerated in full and (3) if Ms. Johnson timely elects coverage under COBRA, we will reimburse her for COBRA premiums paid by Ms. Johnson to continue her health, dental and vision coverage at the same level of coverage as was provided to her and any of her dependents by us immediately prior to her termination date for a period of twelve months so long as she is not covered as a primary insured under another employer’s group health plan.
If Ms. Johnson’s employment is terminated by us without cause or if she resigns for good reason within the twelve month period immediately following a change of control and Ms. Johnson delivers to us a general release of all claims in favor of us, then (1) we will pay Ms. Johnson an amount equal to eighteen months of her then-current base salary plus 150% of her then-current bonus, (2) we will pay Ms. Johnson a prorated portion of her then-unpaid bonus applicable to the fiscal year in which her employment terminates, (3) 100% of any of Ms. Johnson’s then-unvested shares subject to any equity award granted to her by us that are outstanding as of her termination date shall have their vesting and exercisability accelerated in full and (4) if Ms. Johnson timely elects coverage under COBRA, we will reimburse her for COBRA premiums paid by Ms. Johnson to continue her health, dental and vision coverage at the same level of coverage as was provided to her and any of her dependents by us immediately prior to her termination date for a period of twelve months; provided, however, that if she becomes covered as a primary insured under another employer’s group health plan during that period, then she shall promptly notify us and we shall cease provision of continued group health insurance for her and her dependents.
If Ms. Johnson’s employment is terminated with cause or if she resigns without good reason, then Ms. Johnson is only entitled to receive her salary accrued through her date of termination and for the value of all unused paid time off earned through that date. If Ms. Johnson’s employment is terminated due to her death or disability, she will only be entitled to receive her salary accrued through her date of termination and for the value of all unused paid time off earned through that date plus an additional 90 days of base salary.
David H. Kelsey
We are party to an employment agreement with Mr. Kelsey, our Chief Financial Officer, which became effective August 15, 2011. Under the terms of his employment agreement, Mr. Kelsey is entitled to an annual base salary of $340,000. Mr. Kelsey is also eligible to receive a discretionary annual bonus. Mr. Kelsey’s target bonus is 50% of his annual base salary and is based on personal and business-related performance metrics established by the board of directors in its discretion. Mr. Kelsey’s compensation is subject to annual review by the board of directors, which may make adjustments to his compensation upon evaluation of a variety of factors, including his performance and market practices. In addition to his annual salary and discretionary annual bonus, Mr. Kelsey will be granted a stock option to purchase 400,000 shares of our common stock. If the exercise price of these options exceeds $19.00 per share, then Mr. Kelsey will be granted options to purchase an additional 25,000 shares of our common stock. Twenty-five percent of Mr. Kelsey’s options will vest on the one year anniversary of Mr. Kelsey’s employment and the balance will vest in a series of 36 month successive equal monthly installments upon the completion of each additional month with us. In connection with Mr. Kelsey’s relocation to the greater Chicagoland area, he will receive $75,000. On August 19, 2011, Mr. Kelsey also purchased 17,500 shares of our Series D preferred stock at a price of $19.56 per share pursuant to his employment agreement.
Mr. Kelsey is entitled to receive benefits in accordance with the health and welfare plans we provide to our employees from time to time and for which he is eligible at a level that is no less favorable than our other comparable executive officers. Mr. Kelsey is also entitled to up to four weeks of paid time off and paid holidays.
126
Table of Contents
Our contract with Mr. Kelsey creates an “employment at will” relationship that may be terminated by either party for any reason at any time. Upon the termination of Mr. Kelsey’s employment with us, Mr. Kelsey will be paid his salary accrued through his date of termination and for the value of all unused paid time off earned through that date. He is also entitled to continue his medical coverage at his own expense to the extent provided by COBRA or under applicable law.
If Mr. Kelsey’s employment is terminated by us without cause or if he resigns for good reason prior to a change in control and Mr. Kelsey delivers to us a general release of all claims in favor of us, then (1) we will pay Mr. Kelsey an amount equal to twelve months of his then-current base salary plus 100% of his then-current bonus target, (2) we will pay Mr. Kelsey a prorated portion of his then-unpaid performance bonus target applicable to the fiscal year in which his employment terminates, (3) 100% of any of Mr. Kelsey’s then-unvested shares subject to any equity award granted to him by us that are outstanding as of his termination date shall have their vesting and exercisability accelerated in full and (4) if Mr. Kelsey timely elects coverage under COBRA, we will reimburse him for COBRA premiums paid by Mr. Kelsey to continue his health, dental and vision coverage at the same level of coverage as was provided to him and any of his dependents by us immediately prior to his termination date for a period of twelve months so long as he is not covered as a primary insured under another employer’s group health plan.
If Mr. Kelsey’s employment is terminated by us without cause or if he resigns for good reason within the twelve month period immediately following a change of control and Mr. Kelsey delivers to us a general release of all claims in favor of us, then (1) we will pay Mr. Kelsey an amount equal to eighteen months of his then-current base salary plus 150% of his then-current bonus, (2) we will pay Mr. Kelsey a prorated portion of his then-unpaid bonus applicable to his then-unpaid bonus applicable to the fiscal year in which his employment terminates, (3) 100% of any of Mr. Kelsey’s then-unvested shares subject to any equity award granted to him by us that are outstanding as of his termination date shall have their vesting and exercisability accelerated in full and (4) if Mr. Kelsey timely elects coverage under COBRA, we will reimburse him for COBRA premiums paid by Mr. Kelsey to continue his health, dental and vision coverage at the same level of coverage as was provided to him and any of his dependents by us immediately prior to his termination date for a period of twelve months; provided, however, that if he becomes covered as a primary insured under another employer’s group health plan during that period, then he shall promptly notify us and we shall cease provision of continued group health insurance for him and his dependents.
If Mr. Kelsey’s employment is terminated with cause or if he resigns without good reason, then Mr. Kelsey is only entitled to receive his salary accrued through his date of termination and for the value of all unused paid time off earned through that date. If Mr. Kelsey’s employment is terminated due to his death or disability, he will only be entitled to receive his salary accrued through his date of termination and for the value of all unused paid time off earned through that date plus an additional 90 days of base salary.
Mel L. Luetkens, Ph.D.
We are party to an employment agreement with Dr. Luetkens, our Chief Operating Officer, effective November 16, 2007. Under the terms of his employment agreement, Dr. Luetkens is entitled to an annual base salary of $220,000. On March 1, 2010, Dr. Luetkens’ salary was raised to $250,000. The Compensation Committee approved another increase to his annual base salary on February 1, 2012 to $300,000. Dr. Luetkens is also eligible to receive a discretionary annual bonus. Dr. Luetkens’ target bonus was 35% of his annual base salary and on March 1, 2010 his target bonus was raised to 50% of his annual salary. The bonus is based on personal and business-related performance metrics established by the board of directors in its discretion. Dr. Luetkens’ compensation is subject to annual review by the board of directors, which may make adjustments to his compensation upon evaluation of a variety of factors, including his performance and market practices. In addition to his annual salary and discretionary annual bonus, Dr. Luetkens was granted stock options to purchase up to 134,283 shares of our common stock. Dr. Luetkens’ original grant of options vests over a four-year period at the rate of 50% on the one year anniversary of his employment and the balance in a series of 36 successive
127
Table of Contents
equal monthly installments upon his completion of each additional month of employment with us. Any additional grants that Dr. Luetkens receives pursuant to his employment agreement vest on a similar schedule relative to the date of any such grant.
Dr. Luetkens is also entitled to receive benefits in accordance with the health and welfare plans we provide to our employees from time to time and for which he is eligible at a level that is no less favorable than our other comparable executive officers. Dr. Luetkens is also entitled to up to four weeks of paid time off and paid holidays.
Our contract with Dr. Luetkens creates an “employment at will” relationship that may be terminated by either party for any reason at any time. Upon the termination of Dr. Luetkens’ employment with us, Dr. Luetkens will be paid his salary accrued through his date of termination and for the value of all unused paid time off earned through that date. He is also entitled to continue his medical coverage at his own expense to the extent provided by COBRA or under applicable law.
If Dr. Luetkens’ employment is terminated by us without cause or if he resigns for good reason prior to a change in control and Dr. Luetkens delivers to us a general release of all claims in favor of us, then (1) we will pay Dr. Luetkens an amount equal to twelve months of his then-current base salary plus 100% of his then-current bonus, (2) 100% of any of Dr. Luetkens’ then-unvested shares subject to any equity award granted to him by us that are outstanding as of his termination date shall have their vesting and exercisability accelerated in full and (3) if Dr. Luetkens timely elects coverage under COBRA, we will reimburse him for COBRA premiums paid by Dr. Luetkens to continue his health, dental and vision coverage at the same level of coverage as was provided to him and any of his dependents by us immediately prior to his termination date for a period of twelve months so long as he is not a primary insured under another employer’s group health plan.
If Dr. Luetkens’ employment is terminated by us without cause or if he resigns for good reason within the twelve month period immediately following a change of control and Dr. Luetkens delivers to us a general release of all claims in favor of us, then (1) we will pay Dr. Luetkens an amount equal to eighteen months of his then-current base salary plus 150% of his then-current bonus, (2) we will pay Dr. Luetkens a prorated portion of his then-unpaid bonus applicable to his then-unpaid bonus applicable to the fiscal year in which his employment terminates, (3) 100% of any of Dr. Luetkens’ then-unvested shares subject to any equity award granted to him by us that are outstanding as of his termination date shall have their vesting and exercisability accelerated in full and (4) if Dr. Luetkens timely elects coverage under COBRA, we will reimburse him for COBRA premiums paid by Dr. Luetkens to continue his health, dental and vision coverage at the same level of coverage as was provided to him and any of his dependents by us immediately prior to his termination date for a period of twelve months; provided, however, that if he becomes covered as a primary insured under another employer’s group health plan during that period, then he shall promptly notify us and we shall cease provision of continued group health insurance for him and his dependents.
If Dr. Luetkens’ employment is terminated with cause or if he resigns without good reason, then Dr. Luetkens is only entitled to receive his salary accrued through his date of termination and for the value of all unused paid time off earned through that date. If Dr. Luetkens’ employment is terminated due to his death or disability, he will only be entitled to receive his salary accrued through his date of termination and for the value of all unused paid time off earned through that date plus an additional 90 days of base salary.
Andy L. Shafer
We are party to an employment agreement with Mr. Shafer, our Executive Vice President, Market Development & Sales, dated November 14, 2007. Under the terms of his employment agreement, effective November 16, 2007, Mr. Shafer was entitled to an annual base salary of $185,000, through 2007 and an annual base salary of not less than $200,000 during 2009. Mr. Shafer’s annual salary is subject to review no less frequently than annually and as of February 1, 2012, was $260,000. Mr. Shafer is also eligible to receive a discretionary annual
128
Table of Contents
bonus. Mr. Shafer’s target bonus was initially 20% of his annual base salary but was increased to 50% of his annual base salary beginning for fiscal year 2011 (from 40% of his annual base salary beginning for fiscal year 2010). Mr. Shafer’s bonus is based on personal and business-related performance metrics established by the board of directors in its discretion. Mr. Shafer was granted stock options to purchase up to 86,889 shares of our common stock. If either of the TPG Funds together exercises the warrants to purchase the first 2,812,148 shares of Series B preferred stock while Mr. Shafer is still employed by us, then it will be recommended to our board of directors that Mr. Shafer be granted additional options. Mr. Shafer’s original grant of options vest over a four year period at the rate of 25% on the one year anniversary of his employment and the balance in a series of 36 successive equal monthly installments upon his completion of each additional month of employment with us. Any additional grants that Mr. Shafer receives pursuant to his employment agreement vest on a similar schedule relative to the date of any such grant.
Mr. Shafer is entitled to receive benefits in accordance with the health and welfare plans we provide to our employees from time to time and for which he is eligible at a level that is no less favorable than our other comparable executive officers. Mr. Shafer is also entitled to up to 20 days of paid time off and paid holidays.
Our contract with Mr. Shafer creates an “employment at will” relationship that may be terminated by either party for any reason at any time. In the event of Mr. Shafer’s termination by us without cause or if he incurs a constructive termination and Mr. Shafer delivers to us a general release of claims in favor of us, we will continue to pay Mr. Shafer his then-current base salary for a period of 18 months and any stock options outstanding granted pursuant to this employment agreement shall have their vesting and exercisability accelerated in full.
Mr. Shafer also agreed that during his employment by us and through the 18 month anniversary of the termination of his employment for any reason, he will neither solicit any of our employees or consultants to terminate his or her employment or consulting relationship with us nor engage in the business of the metathesis of natural oils or permit his name to be used in connection with such a business, not including the metathesis of natural oils exclusively for purpose of human consumption, livestock feed purposes or for fuel purposes.
Kara E. Lawrence
We are party to an employment agreement with Ms. Lawrence, our Controller and Treasurer, dated January 15, 2008. On January 29, 2011, she was appointed to be our Vice President of Finance & Treasury. Under the terms of her employment agreement, Ms. Lawrence is entitled to receive an annual base salary of $145,000. Effective September 1, 2011, Ms Lawrence’s annual base salary was increased to $195,000. Ms. Lawrence is also eligible to receive a discretionary annual bonus. Ms. Lawrence’s target bonus was initially 20% of her annual base salary but was increased to 25% of her annual base salary effective beginning for fiscal year 2011. Ms. Lawrence’s bonus is based on personal and business-related performance metrics established by us in our discretion. In addition to her annual salary and annual discretionary bonus, Ms. Lawrence was granted stock options to purchase up to 39,495 shares of our common stock, which vested 25% on March 20, 2009 with the remaining balance vesting in a series of 36 successive equal monthly installments upon her completion of each additional month with us.
Ms. Lawrence is eligible to participate in health insurance and other employee benefit plans that we may establish from time to time for which she is eligible at a level that is no less favorable than other comparable employees of us. Ms. Lawrence is entitled to four weeks of paid time off.
Our contract with Ms. Lawrence creates an “employment at will” relationship that may be terminated by either party for any reason at any time.
129
Table of Contents
Potential Payments upon Termination and Change in Control
The following table summarizes the terms of such agreements with respect to severance and any other payments upon termination or change in control, in each case assuming that such agreements were in place as of December 31, 2011 and that such termination or change of control occurred on December 31, 2011 with respect to base salaries in effect at December 31, 2011.
| Termination | ||||||||||||||||||
| Name |
Benefit |
Without Cause by Us/ With Good Reason |
Without Cause by Us/With Good Reason Within 12 Months of Change in Control |
With Cause by Us/ Without Good Reason |
Death/Disability | |||||||||||||
| K’Lynne Johnson |
Severance |
$ | 350,000 | $ | 525,000 | $ | — | $ | 87,500 | |||||||||
| Bonus |
175,000 | 262,500 | — | — | ||||||||||||||
| Other payments(1) |
18,540 | 18,540 | — | — | ||||||||||||||
| Treatment of unvested stock options(2) |
384,813 | 384,813 | — | — | ||||||||||||||
| David Kelsey(3) |
Severance |
340,000 | 510,000 | — | 42,500 | |||||||||||||
| Bonus |
234,260 | 319,260 | — | — | ||||||||||||||
| Other payments |
18,540 | 18,540 | — | — | ||||||||||||||
| Treatment of unvested stock options |
4,367,746 | 4,367,746 | — | — | ||||||||||||||
| Mel L. Luetkens, Ph.D. |
Severance |
275,000 | 412,500 | — | 68,750 | |||||||||||||
| Bonus |
125,000 | 120,000 | — | — | ||||||||||||||
| Other payments(1) |
18,540 | 18,540 | — | — | ||||||||||||||
| Treatment of unvested stock options(2) |
233,004 | 233,004 | — | — | ||||||||||||||
| Andy L. Shafer |
Severance |
322,500 | 322,500 | — | — | |||||||||||||
| Bonus |
— | — | — | — | ||||||||||||||
| Other payments |
— | — | — | — | ||||||||||||||
| Treatment of unvested stock options |
— | — | — | — | ||||||||||||||
| Kara E. Lawrence |
Severance |
— | — | — | — | |||||||||||||
| Bonus |
— | — | — | — | ||||||||||||||
| Other payments |
— | — | — | — | ||||||||||||||
| Treatment of unvested stock options |
— | — | — | — | ||||||||||||||
| Patrick Kelly(5) |
Severance |
360,000 | 360,000 | — | 60,000 | |||||||||||||
| Bonus |
120,000 | 120,000 | — | — | ||||||||||||||
| Other payments(4) |
9,649 | 9,649 | — | — | ||||||||||||||
| Treatment of unvested stock options equity(2) |
— | — | — | — | ||||||||||||||
| (1) | Represents the value of 12 months of COBRA coverage. |
| (2) | All unvested stock options shall vest automatically upon a termination without cause or a resignation with good reason. Values represent the aggregate grant date fair value of such options as of December 31, 2011, calculated in accordance with ASC 718. |
| (3) | Mr. Kelsey was hired as our Chief Financial Officer effective August 15, 2011. |
| (4) | Represents the value of six months of COBRA coverage. |
| (5) | Mr. Kelly resigned as our Chief Financial Officer in January 2011. He received his 2010 base salary plus 100% of his target bonus of $120,000 (or 50% of his then current base salary) in accordance with the terms of his employment agreement, for a combined severance payment of $360,000. He also received (1) $72,000 for his earned but unpaid bonus for fiscal year 2010, (2) a pro-rated bonus of $10,000 for fiscal year 2011 and (3) six months of COBRA coverage. |
130
Table of Contents
With respect to outstanding options held by our NEOs, the 2007 Plan does not provide for automatic vesting upon a change of control. However, in the event of a “corporate transaction,” if a successor or acquiring corporation refuses to assume, convert or replace the options, or if there is no successor or acquiring corporation due to a dissolution or liquidation of the company, then the options will expire in connection with the corporate transaction at such time and under the conditions as determined by our board of directors, and will include, without limitation, full vesting and exercisability of any outstanding options. For purposes of the 2007 Plan, a “corporate transaction” is (1) a merger or consolidation in which the company is not the surviving corporation, (2) a dissolution or liquidation of the company, (3) the sale of substantially all of the assets of the company, (4) a merger in which the company is the surviving corporation but after which the stockholders of the company immediately prior to such merger (other than any stockholder that merges, or which owns or controls another corporation that merges, with the company in such merger) cease to own their shares or other equity interest in the company or (5) any other transaction which qualifies as a “corporate transaction” under certain provisions of the tax code wherein the stockholders of the company give up all of their equity interest in the company (except for the acquisition, sale or transfer of all or substantially all of the outstanding shares of the company).
Had such a corporate transaction occurred on December 31, 2011, and had the successor not assumed the options in the circumstances described above, all of the options that were not vested as of such time would have vested, and the value of such options shown in the table below is based upon an estimate of the value of our common stock on December 30, 2011 (the last day of trading of 2011) of $15.46 per share, less the applicable exercise price for each such option as of such date.
| Name |
Unvested Stock Options |
Estimated Value | ||||||
| K’Lynne Johnson |
459,130 | $ | 6,118,794 | |||||
| David Kelsey(1) |
400,000 | (304,000 | ) | |||||
| Mel L. Luetkens, Ph.D. |
241,459 | 3,216,963 | ||||||
| Andy L. Shafer |
75,000 | 999,502 | ||||||
| Kara E. Lawrence |
61,207 | 815,597 | ||||||
| Patrick Kelly(1) |
0 | 0 | ||||||
| (1) | Mr. Kelly resigned as our Chief Financial Officer in January 2011. Mr. Kelsey was hired as our Chief Financial Officer effective August 15, 2011. |
Director Compensation
We added our first non-affiliated director, Mr. Tomkins, in November 2007. In July 2010, we added Mr. Shapiro as our second non-affiliated director. In October 2011, we added Mr. Johnson as our third non-affiliated directors.
As discussed in “Certain Relationships and Related Party Transactions—Preferred Financings—Second Amended and Restated Voting Agreement,” Ms. Piwnica and Mr. Frost currently serve as the Naxos designees to our board of directors. Ms. Hervouet serves as the Total designee on our board of directors. Dr. Duyk and Mr. McGlashan serve as the TPG Capital designees. Messrs. Tomkins and Shapiro serve as our independent directors.
131
Table of Contents
The table below sets forth the total compensation paid to our non-employee directors in 2011.
| Name |
Option Award(1) | Other Compensation |
Total | |||||||||
| Geoffrey M. Duyk, M.D., Ph.D. |
$ | — | $ | — | $ | — | ||||||
| Carole Piwnica |
— | — | — | |||||||||
| Robert Frost |
— | — | — | |||||||||
| Véronique Hervouet |
— | — | — | |||||||||
| W. Donald Johnson |
— | — | — | |||||||||
| William E. McGlashan Jr |
— | — | — | |||||||||
| Robert B. Shapiro |
42,638 | — | 42,638 | |||||||||
| Mark E. Tomkins |
56,222 | 25,000 | 81,222 | |||||||||
| (1) | Represents the aggregate grant date fair value of stock option grants made during fiscal year 2011, calculated in accordance with ASC 718. For more information, see “Management’s Discussion and Analysis of Financial Condition and Results of Operations—Critical Accounting Policies and Estimates—Share-Based Compensation” and Note 19 of our financial statements for additional information, including valuation assumptions used in calculating the fair value of the awards. |
| (2) | Mr. Johnson became a member of our board of directors in October 2011. |
Other than the stock options previously granted to Messrs. Shapiro and Tomkins (or stock options which may be granted to such directors (or other non-investor directors) in the future), our directors do not receive any compensation for serving as directors, other than reimbursement for related expenses.
Upon consummation of this offering, we expect to enter into compensation arrangements with our non-affiliated directors, including an annual retainer and an additional retainer for serving as the chair of a committee of the board of directors. We also expect to reimburse all directors for reasonable out-of-pocket expenses they incur in connection with their service as directors, including those incurred in connection with attending all board and other committee meetings. Our directors will also be eligible to receive other equity-based awards when and if determined by the Compensation Committee.
Director and Officer Indemnification and Limitation of Liability
Our certificate of incorporation and bylaws provide that we will indemnify our directors and officers to the fullest extent permitted by law. In addition, our certificate of incorporation provides that our directors will not be liable for monetary damages for breach of fiduciary duty as a director.
In addition, we have entered into indemnity agreements with our directors (including Ms. Johnson). The indemnity agreements provide the related directors with contractual rights to indemnification and expense advancement. They also provide that the indemnitees shall only be entitled to indemnification thereunder if they acted in good faith and in a manner which they reasonably believed to be in, or not opposed to, our best interests. Furthermore, in connection with any criminal proceeding, the related indemnitee must have had no reasonable cause to believe his or her conduct was unlawful. The contractual rights to indemnification and advancement of expenses under the indemnity agreements do not apply to certain claims, actions or proceedings, including claims initiated by the indemnitee (except with respect to claims brought to enforce the indemnitee’s right to indemnification), certain securities laws actions or if a court of competent jurisdiction in the matter determines that indemnification is not lawful.
There is no pending litigation or proceeding naming any of our directors or officers to which indemnification is being sought, and we are not aware of any pending or threatened litigation that may result in claims for indemnification by any director or officer.
132
Table of Contents
SECURITY OWNERSHIP OF CERTAIN BENEFICIAL OWNERS
The following table sets forth information regarding the beneficial ownership of our common stock as of December 31, 2011, after giving effect to the IPO Share Adjustments, and the anticipated beneficial ownership percentages immediately following this offering, by:
| • | each person or group who is known by us to own beneficially more than 5% of our outstanding shares of our common stock; |
| • | each of our named executive officers; |
| • | each of our directors upon the consummation of this offering; and |
| • | all of our executive officers and directors as a group. |
Each stockholder’s percentage ownership before the offering is based on shares of our common stock outstanding as of December 31, 2011, as adjusted to give effect to the IPO Share Adjustments. Each stockholder’s percentage ownership after the offering is based on shares of our common stock outstanding immediately after the completion of this offering. We have granted the underwriters an option to purchase up to additional shares of our common stock to cover over-allotments, if any, and the table below assumes no exercise of that option.
Beneficial ownership for the purposes of the following table is determined in accordance with the rules and regulations of the SEC. These rules generally provide that a person is the beneficial owner of securities if such person has or shares the power to vote or direct the voting thereof, or to dispose or direct the disposition thereof or has the right to acquire such powers within 60 days. Common stock subject to options that are currently exercisable or exercisable within 60 days of December 31, 2011 are deemed to be outstanding and beneficially owned by the person holding the options. These shares, however, are not deemed outstanding for the purposes of computing the percentage ownership of any other person. Percentage of beneficial ownership is based on shares of common stock to be outstanding after the consummation of this offering, assuming no exercise of the option to purchase additional shares. Except as disclosed in the footnotes to this table and subject to applicable community property laws, we believe that each stockholder identified in the table possesses sole voting and investment power over all shares of common stock shown as beneficially owned by the stockholder.
Unless otherwise set forth below, the address of each person listed in the following table is c/o Elevance Renewable Sciences, Inc., 2501 W. Davey Road, Woodridge, Illinois 60440.
| Name |
Shares Beneficially Owned |
Percentage of Shares Beneficially Owned | ||||||||
| Before the Offering | After the Offering | |||||||||
| 5% Stockholders: |
% | % | ||||||||
| TPG Funds(1) |
||||||||||
| Navelance S.A.(2) |
||||||||||
| Executive Officers and Directors: |
||||||||||
| K’Lynne Johnson(3) |
||||||||||
| David H. Kelsey(4) |
||||||||||
| Mel L. Luetkens, Ph.D.(5) |
||||||||||
| Andy L. Shafer(6) |
||||||||||
| Kara E. Lawrence |
||||||||||
| Geoffrey M. Duyk, M.D., Ph.D.(7) |
||||||||||
| Carole Piwnica |
||||||||||
| Robert Frost |
||||||||||
| Véronique Hervouet |
||||||||||
| William E. McGlashan Jr.(8) |
||||||||||
| Robert B. Shapiro(9) |
||||||||||
| Mark E. Tomkins(10) |
||||||||||
| All executive officers and directors as a group (12 persons) |
||||||||||
133
Table of Contents
| * | Represents beneficial ownership of less than 1% of our outstanding common stock. |
| (1) | Represents an aggregate of: (1) shares of common stock (“STAR Stock”) held of record by TPG STAR, L.P., a Delaware limited partnership (“STAR”), whose general partner is TPG STAR GenPar, L.P., a Delaware limited partnership, whose general partner is TPG STAR GenPar Advisors, LLC, a Delaware limited liability company, whose sole member is TPG Holdings, L.P., a Delaware limited partnership (“Holdings I”), whose general partner is TPG Holdings I-A, LLC, a Delaware limited liability company (“Holdings I GP”), whose sole member is TPG Group Holdings (SBS), L.P., a Delaware limited partnership (“Group Holdings”), whose general partner is TPG Group Holdings (SBS) Advisors, Inc., a Delaware corporation (“Group Advisors”) and (2) shares of common stock (“Biotech II Stock”) held of record by TPG Biotechnology Partners II, L.P. (“TPG Biotech II” and together with STAR, the “TPG Funds”), a Delaware limited partnership, whose general partner is TPG Biotechnology GenPar II, L.P., a Delaware limited partnership, whose general partner is TPG Biotechnology GenPar II Advisors, LLC, a Delaware limited liability company, whose sole member is Holdings I, whose general partner is Holdings I GP, whose sole member is Group Holdings, whose general partner is Group Advisors. David Bonderman and James G. Coulter are directors, officers and sole stockholders of Group Advisors and may therefore be deemed to be the beneficial owners of the TPG Stock. The address of Group Advisors and Messrs. Bonderman and Coulter is c/o TPG Capital, L.P., 301 Commerce Street, Suite 3300, Forth Worth TX 76102. |
| (2) | Navelance S. A. is an investment vehicle owned by Naxos Capital Partners SCA Sicar (“Naxos Sicar”). This amount includes an aggregate of shares that may be deemed to be beneficially owned by Naxos SICAR. Voting and investment decisions with respect to all of the shares of common stock held by (or to be issued to) Naxos are made by Naxos Capital Managers S.à.r.l. The Naxos Capital Managers S.à.r.l. address is 40, boulevard Joseph II, L-1840 Luxembourg. |
| (3) | Includes an aggregate of shares that can be acquired upon the exercise of outstanding options. |
| (4) | Includes an aggregate of shares that can be acquired upon the exercise of outstanding options. |
| (5) | Includes an aggregate of shares that can be acquired upon the exercise of outstanding options. |
| (6) | Includes an aggregate of shares that can be acquired upon the exercise of outstanding options. |
| (7) | Dr. Duyk, who is one of our directors, is Managing Director of TPG Biotech. Dr. Duyk has no voting or investment power over and disclaims beneficial ownership of the TPG Stock. The address of Dr. Duyk is c/o TPG Capital, L.P., 301 Commerce Street, Suite 3300, Forth Worth, TX 76102. |
| (8) | Mr. McGlashan, who is one of our directors, is Managing Partner of TPG Growth. Mr. McGlashan has no voting or investment power over and disclaims beneficial ownership of the TPG Stock. The address for Mr. McGlashan is c/o TPG Capital, L.P., 301 Commerce Street, Suite 3300, Forth Worth, TX 76102. |
| (9) | Includes an aggregate of shares that can be acquired upon the exercise of outstanding options. |
| (10) | Includes an aggregate of shares that can be acquired upon the exercise of outstanding options. |
134
Table of Contents
CERTAIN RELATIONSHIPS AND RELATED PARTY TRANSACTIONS
Our board of directors currently is primarily responsible for developing and implementing processes and controls to obtain information from our directors, executive officers and significant stockholders regarding related-person transactions and then determining, based on the facts and circumstances, whether we or a related person has a direct or indirect material interest in these transactions. We currently do not have a formal, written approval policy for related party transactions, but we expect that our board of directors will adopt such a policy prior to the completion of this offering. Following this offering, we expect that our audit committee will be responsible for review, approval and ratification of “related-person transactions” between us and any related person. Under SEC rules, a related person is an officer, director, nominee for director or beneficial holder of more than of 5% of any class of our voting securities since the beginning of the last fiscal year or an immediate family member of any of the foregoing. In the course of its review and approval or ratification of a related-person transaction, we expect the audit committee to consider:
| • | the nature of the related person’s interest in the transaction; |
| • | the material terms of the transaction, including the amount of consideration involved and type of transaction; |
| • | the relative importance of the transaction to the related person and to our company; |
| • | whether the transaction would impair the judgment of a director or executive officer to act in our best interest and the best interest of our stockholders; and |
| • | any other matters the audit committee deems appropriate. |
Any member of the audit committee who is a related person with respect to a transaction under review will not be able to participate in the deliberations or vote on the approval or ratification of such transaction. However, such a director may be counted in determining the presence of a quorum at a meeting of the committee that considers the transaction.
Other than compensation agreements and other arrangements which are described under “Executive Compensation,” and the transactions described below, since January 1, 2008, there has not been, and there is not currently proposed, any transaction or series of similar transactions to which we were or will be a party in which the amount involved exceeded or will exceed $120,000 and in which any related person had or will have a direct or indirect material interest.
Preferred Financings
Initial Financing
On November 20, 2007, we entered into a Stock and Warrant Purchase Agreement (the “2007 Purchase Agreement”) with the investors named therein, pursuant to which we agreed to sell (1) to Cargill, 50,000 shares of our common stock and 843,645 shares of our Series A preferred stock in exchange for (A) Cargill’s contribution of the NatureWax business and (B) Cargill’s agreement to terminate certain license and other contractual rights it held under certain agreements between it and Materia; (2) to Materia, 50,000 shares of our common stock and 843,645 shares of our Series A preferred stock in exchange for (A) Materia’s assignment of all right, title and interest to the contributed NatureWax assets; and (3) to each of the TPG Funds, 2,530,934 shares of our Series B preferred stock in exchange for approximately $45.0 million in the aggregate. In connection with the closing of the transactions contemplated under the 2007 Purchase Agreement, Caltech acquired 50,000 shares of our common stock in exchange for Caltech’s agreement to amend its license agreement with Materia to expand Materia’s right to sublicense certain rights in Caltech intellectual property to us. Materia and Cargill converted their Series A preferred stock into common stock on September 25 and September 30, 2009, respectively. We also issued warrants to each of the TPG Funds to purchase up to 2,249,719 shares of our Series B preferred stock (collectively, the “2007 TPG Warrants”). In addition, as contemplated by the 2007 Purchase Agreement, on February 22, 2008 we sold 424,072 shares of our Series B preferred stock to an affiliate of Materia for $8.89 per share, the same price at which the TPG Funds purchased their shares of Series B preferred stock. In connection with the 2007 Purchase Agreement, we
135
Table of Contents
entered into an investors’ rights agreement, voting agreement and right of first refusal and co-sale agreement with the investors party thereto. All such agreements were subsequently amended and restated in subsequent equity financings, as discussed below.
Convertible Note Financing
On October 19, 2009, March 5, 2010 and August 6, 2010, we entered into financing arrangements with the TPG Funds whereby, pursuant to the arrangements entered into on each such date, we received $10.0 million in exchange for the issuance to the TPG Funds of $10.0 million in convertible promissory notes and warrants to purchase shares of our Series B preferred stock for $8.89 per share, for a total of $30.0 million in financing. The promissory notes accrued interest at a rate of 15.0% per annum, compounded quarterly and were scheduled to mature in October 19, 2010, October 19, 2010 and August 6, 2011, respectively. The promissory notes were secured by a first lien position in substantially all of our assets. In 2010, we extended the maturity date of the promissory notes to December 31, 2010.
Series C Financing
On December 6, 2010, we conducted another equity financing round and issued 5,649,718 shares of our Series C preferred stock in exchange for approximately $70.0 million in cash pursuant to a Subscription Agreement with the investors party thereto, including new investors Naxos, Total, BCP Investment, L.P. (“BCP”) and Mr. Shapiro. In connection with that equity financing round, the TPG Funds elected to convert approximately $33.5 million (representing the aggregate amount of principal then outstanding under the promissory notes held by the TPG Funds (together with all accrued and unpaid interest thereon)) into 3,768,772 shares of our Series B preferred stock. In connection with the December 2010 equity offering, we also amended and restated our investors’ rights agreement, right of first refusal and co-sale agreement, voting agreement and our then-current certificate of incorporation.
Series D Financing
On June 24, 2011, we entered into a subscription agreement pursuant to which the investors named therein purchased 2,556,238 shares of our Series D preferred stock in exchange for $50.0 million in cash. We offered our Series D preferred stock only to our then-current investors. In connection with this latest round of financing, we amended and restated our investors’ rights agreement, right of first refusal and co-sale agreement, voting agreement and our then-current certificate of incorporation, each as described below. On August 19, 2011, we entered into a subscription agreement pursuant to which Mr. Kelsey purchased 17,500 shares of our Series D preferred stock in exchange for $342,300.
Second Amended and Restated Investors’ Rights Agreement
In connection with the Series D financing, we entered into a Second Amended and Restated Investors’ Rights Agreement, dated as of June 24, 2011 (the “Investors’ Rights Agreement”), with certain of our investors, including Cargill, Materia, the TPG Funds, Naxos, Total, BCP, Mr. Kelsey and Mr. Shapiro. The Investors’ Rights Agreement amends and restates the First Amended and Restated Investors’ Rights Agreement dated December 6, 2010, which amended and restated the Investors’ Rights Agreement dated November 20, 2007. Among other provisions and conditions, the Investors’ Rights Agreement grants certain information and inspection rights to the investors party thereto, which rights terminate upon (among other events) the consummation of a “Qualified IPO.” As defined in our current certificate of incorporation, a “Qualified IPO” is a firm commitment underwritten public offering pursuant to an effective registration statement filed under the Securities Act, covering the offer and sale of our common stock for our account in which (1) the aggregate public offering price (before deducting underwriters’ discounts and commissions) is greater than or equal to $50.0 million and (2) the public offering price per share equals or exceeds $35.00 per share of common stock (before deducting underwriters’ discounts and commissions), as such price may be adjusted pursuant to our certificate of
136
Table of Contents
incorporation in connection with certain events specified in our certificate of incorporation, including our issuance of additional shares of common stock as a dividend or other distribution of outstanding common stock, a stock split or a reverse stock split.
The Investors’ Rights Agreement also grants certain demand registration rights to the investors party thereto. If we receive at any time after 180 days after the effective date of our initial public offering of our securities pursuant to a registration statement filed under the Securities Act, a written request from one or more investors (each of which holds at least 900,000 shares of our preferred stock (as such number may be adjusted pursuant to the provisions of the Investors’ Rights Agreement)) who individually or collectively hold (A) a majority of the Series B Registrable Securities, (B) a majority of the Series C Registrable Securities and (C) a majority of the Series D Registrable Securities (each such term as defined therein and, collectively with shares of common stock held by Cargill, Materia and certain Materia Investors, the “Registrable Securities”) that we file a registration statement under the Securities Act covering the registration of such Registrable Securities, we must notify each person holding Registrable Securities, and effect, as soon as practicable but in any event within 90 days after receipt of the demand registration request, the registration under the Securities Act of all Registrable Securities which the holder(s) requested to be included in such registration. Notwithstanding the foregoing, we do not have to effect the filing of a registration statement in response to such a demand registration request if (1) the Registrable Securities requested to be registered have an anticipated aggregate public offering price (before deducting underwriters’ discounts and commissions) of less than $7.5 million; (2) the demand registration has not been approved by directors elected by the holders of a majority of Series B preferred stock, voting as a separate series of stock (“Series B Directors”), and directors elected by the holders of a majority of Series C preferred stock, voting as a separate series of stock (“Series C Directors”), who then are the members of our board of directors and constitute at least 75% of the total number of Series B Directors and Series C Directors that then can be elected to our board of directors, in accordance with our certificate of incorporation; or (3) during any period beginning on a date that is 90 days prior to our good faith estimate of the filing date of, and ending on the date that is 180 days after the effective date of, any registration statement that we initiate under the Securities Act (other than a registration related solely to any employee stock, stock option or benefit plan or any similar compensatory plan or a corporate reorganization, business combination or other transaction under Rule 145 of the Securities Act) if, within 30 days of such holders’ request for demand registration, we notify such holders of our intent to file a Company-initiated registration. The limitation set forth in clause (2) of the immediately preceding sentence shall not apply if (A) we have previously consummated a Qualified IPO at the time the demand registration is first requested or (B) our certificate of incorporation does not require the approval of such registration by 75% of the total number of Series B Directors and Series C Directors that then can be elected to our board of directors. Pursuant to the Investors’ Rights Agreement, we are obligated to effect up to two demand registrations.
If we receive a written request that we effect a registration on Form S-3, then we must give prompt, written notice to the other holders of Registrable Securities and must effect, as soon as practicable, a registration of all Registrable Securities specified in the request, together with any other Registrable Securities that the other holders request be included within 20 days after we provide notice to the other holders. Notwithstanding the foregoing, we need not effect such a registration if (1) Form S-3 is not available for such offering, (2) the total aggregate offering price of the registration would be less than $5.0 million, (3) our president or chief executive officer determines that such offering would be seriously detrimental to us and elects to defer the filing pursuant to the terms of the Investors’ Rights Agreement, (4) we have already effected two registrations on Form S-3 in the 12 month period preceding the date of such request or (5) in any particular jurisdiction in which we would be required to qualify to do business or to execute a general consent to service of process in effecting such registration, qualification or compliance. Requests for registration on Form S-3 do not count toward our two required demand registrations.
At any time that we effect a registration pursuant to the terms of the Investors’ Rights Agreement, each holder party to the Investors’ Rights Agreement agrees, subject to certain exceptions, not to transfer or enter into any agreement to transfer any Registrable Securities or other shares of our stock then owned for up to 180 days or such other period up to a maximum of 34 additional days as we or an underwriter may request to
137
Table of Contents
accommodate regulatory restrictions on (1) the publication or other distribution of research reports and (2) analyst recommendations and opinions, including, but not limited to the restrictions contained in FINRA Rule 2711(f)(4), or NYSE Rule 472(f)(4), or any successor provisions or amendments thereto.
The Investors’ Rights Agreement also grants certain piggyback registration rights to the investors party thereto. In accordance with the terms thereof, we are required to notify all holders of Registrable Securities in writing at least 30 days prior to the date of filing of any registration statement under the Securities Act for purposes of effecting a public offering of our securities and to provide each such holder an opportunity to include any or all of its Registrable Securities in such registration statement, subject to the underwriting cut back provisions set forth in the Investors’ Rights Agreement. Pursuant to the terms of the Investors’ Rights Agreement, the holders of a majority of Registrable Securities have waived their piggyback registration rights arising in connection with this offering.
The registration rights set forth in the Investors’ Rights Agreement may only be assigned by a holder to (1) a party who acquires at least 500,000 Registrable Securities (as such number may be adjusted in accordance with the Investors’ Rights Agreement); provided, that if a holder holds less than 500,000 Registrable Securities, such holder’s piggyback registration rights may be transferred to a transferee who acquires all of such holder’s Registrable Securities, (2) a subsidiary, parent, affiliated venture capital, private equity or other investment fund, partner, limited partner, retired partner, member, retired member, stockholder or affiliate of such holder, (3) a successor entity into which such holder is merged or consolidated in a bona fide statutory merger or consolidation in which such successor entity succeeds to all such holder’s assets, properties and liabilities and obligations by operation of law or (4) a successor entity which acquires all or substantially all of such holder’s assets and properties and assumes all such holder’s obligations under all agreements between such holder and us.
In the event that we include Registrable Securities in a registration statement pursuant to the Investors’ Rights Agreement, we have agreed to indemnify, to the extent permitted by law, each holder, the partners, managers, officers and directors of each holder, any underwriter for such holder and each person who controls such holder or underwriter within the meaning of the Securities Act or the Exchange Act against any losses, claims, damages or liabilities to which they may become subject under the Securities Act, the Exchange Act or other federal or state law, to the extent such losses, claims, damages or liabilities arise out of or are based on (1) any untrue statement or alleged untrue statement of a material fact contained in such registration statement, including any preliminary prospectus or final prospectus contained therein or any amendments or supplements thereto; (2) the omission or alleged omission to state therein a material fact required to be stated therein or necessary to make the statements therein not misleading or (3) any violation or alleged violation by us of the Securities Act, Exchange Act, any federal or state securities law or any rule or regulation promulgated under the Securities Act, the Exchange Act or any federal or state securities law in connection with the offering covered by such registration statement. Furthermore, we will reimburse any of the above indemnitees for any legal or other expenses reasonably incurred by them, as incurred, in connection with investigating or defending any such loss, claim, damage, liability or action; provided, however, that this indemnification agreement does not apply to amounts paid in settlement of any such loss, claim, damage, liability or action if such settlement is entered into without our consent, nor are we liable in any such case for any such loss, claim, damage, liability or action to the extent that it arises out of or is based upon a violation that occurs in reliance and in conformity with written information furnished expressly for use in connection with such registration by such indemnitee.
The Investors’ Rights Agreement also grants to the TPG Funds, Naxos, Total, BCP and Mr. Shapiro (collectively, the “Rights Holders”) a right of first refusal to purchase such holders’ pro rata share of any “New Securities.” New Securities include, subject to certain exceptions set forth in the Investors’ Rights Agreement, any shares of our capital stock, whether authorized currently or not, and any rights, options or warrants to purchase our capital stock and securities of any type that are or may become convertible or exchangeable into our capital stock. One such exception from the right of first refusal of the Rights Holders (which applies for purposes of this offering) includes issuance of common stock by us in connection with a public offering if all shares of preferred stock are converted into common stock at the time of such offering. The pro rata share of each Rights Holder is defined as the ratio of (1) the number of shares of Registrable Securities held by such Rights Holder over (2) the number of shares of Registrable Securities held by all Rights Holders.
138
Table of Contents
The registration rights under the Investors’ Rights Agreement expire (1) generally four years after the closing of a Qualified IPO by us or (2) on or after the closing of an Exit Combination (as such term is defined in the Investors’ Rights Agreement) or the liquidation, dissolution or winding up of our company. In addition, registration rights of any holder of Registrable Securities expire with respect to any Registrable Securities proposed to be sold by such holder if, in the opinion of our counsel, all such Registrable Securities proposed to be sold by such holder may be sold by such holder in a three-month period without registration under the Securities Act pursuant to Rule 144 under the Securities Act. The rights of first refusal will expire immediately before the closing of this offering if it is a Qualified IPO. The Investors’ Rights Agreement also provides that the rights of first refusal will expire immediately before an Exit Combination or the liquidation, dissolution or winding up of our company.
Second Amended and Restated Co-Sale Agreement
In connection with the Series D financing, we entered into a Second Amended and Restated Right of First Refusal and Co-Sale Agreement (the “Co-Sale Agreement”) with certain of our investors, including Cargill, Materia, the TPG Funds, Caltech, Naxos, Total, BCP, Ms. Johnson, Mr. Luetkens, Mr. Kelsey and Mr. Kelly, our former Chief Financial Officer. The Co-Sale Agreement amended and restated the First Amended and Restated Right of First Refusal and Co-Sale Agreement dated December 6, 2010, which amended and restated the Right of First Refusal and Co-Sale Agreement dated November 20, 2007. Among other provisions and conditions, the Co-Sale Agreement provided that each of Cargill, Materia, Materia Innovations LLC (“Materia Innovations”), Caltech, Ms. Johnson, Mr. Luetkens and Mr. Kelly were required to give us, and the TPG Funds, Naxos, Total and BCP (collectively, the “Major Investors”) written notice of any proposed transfer of its shares of our common or preferred stock. In certain such situations, we and the Major Investors had rights of first refusal and co-sale rights with respect to any such stock proposed to be sold. The rights of first refusal and the co-sale rights will terminate automatically immediately prior to the closing of this offering if it is a Qualified IPO. The Co-Sale Agreement also provides that the rights of first refusal and co-sale will expire immediately prior to a “Deemed Liquidation Event” (as defined in our certificate of incorporation as in effect as of June 24, 2011).
Second Amended and Restated Voting Agreement
Prior to the consummation of this offering, we were party to a Second Amended and Restated Voting Agreement (the “Voting Agreement”) with certain of our investors, including Cargill, Materia, Materia Innovations, TPG Star, TPG Biotech, Caltech, Naxos, Total, BCP, Mr. Kelsey and Mr. Shapiro. The Voting Agreement amended and restated the First Amended and Restated Voting Agreement dated December 6, 2010, which amended and restated the Voting Agreement dated November 20, 2007. Each of the investors agreed to vote all shares of our capital stock (including all classes of common, preferred, voting and nonvoting capital stock) which such investor owned or held as of the date of the Voting Agreement or subsequently acquires or holds (the “Shares”) pursuant to the terms of the Voting Agreement when electing members of our board of directors. In addition, the Voting Agreement also provided that, during the term of the Voting Agreement, the applicable Designator (as defined therein) could, in its sole discretion: (1) elect to remove from the board of directors any incumbent board designee who occupies a board seat for which such Designator is entitled to designate the board designee; and (2) designate a new board designee for election to a board seat for which such Designator is entitled to designate the board designee. Each investor party to the Voting Agreement also agreed to vote all of its Shares in favor of a Sale of Company (as defined in the Voting Agreement) if the holders of a majority of the then outstanding shares of Series B preferred stock, Series C preferred stock and Series D preferred stock, each voting separately as a series, consent or vote in favor of such Sale of the Company. The Voting Agreement will terminate automatically upon the consummation of this offering if it is a Qualified IPO. The Voting Agreement will also terminate upon the closing of a “Sale of the Company” (as defined in the Voting Agreement).
Warrants
Upon consummation of this offering, the TPG Funds will exercise all of their warrants and receive shares of our common stock after we withhold shares as payment for such exercise.
139
Table of Contents
DESCRIPTION OF CERTAIN INDEBTEDNESS
Saskatchewan Canola Development Commission Loan
On May 27, 2009, we entered into a research agreement with respect to a canola research proposal with the Saskatchewan Canola Development Commission. Pursuant to the Saskatchewan Research Agreement, we agreed to conduct certain canola oil-related research for the Saskatchewan Commission in exchange for up to CAD $250,000, 50% of which is considered a grant from the SCDC and 50% of which is considered a loan. The SCDC paid us CAD $100,000 upon the signing of the Saskatchewan Research Agreement, CAD $100,000 upon receipt of an acceptable report on August 30, 2009 and CAD $50,000 upon receipt of an acceptable final report on May 31, 2010. Of the CAD $250,000 we received CAD $239,420 from the SCDC pursuant to the Saskatchewan Research Agreement, CAD $119,710 of such funds was a loan. Principal payments of CAD $7,981 on the loan are payable in 15 equal installments on May 1 of each year beginning on May 1, 2011 and continuing through May 1, 2025. The loan does not bear interest except that any amounts in default shall bear interest at a rate of 5% per annum. We made the first principal payment of approximately CAD $7,981 on the loan on June 24, 2011. As of September 30, 2011, we had approximately CAD $111,729 in aggregate principal amount outstanding under the loan.
Fifth Third Bank Reimbursement Agreements
On or around May 20, 2008, we entered into a Letter of Credit Reimbursement Agreement (as amended on October 5, 2009) with Fifth Third Bank (the “Original Fifth Third Reimbursement Agreement”). The Original Fifth Third Reimbursement Agreement provides up to $250,000 of credit (the “Original Line of Credit”) to us. Interest accrues on drawings under the Original Fifth Third Reimbursement Agreement at a rate of 6% plus the prime rate per annum. There have been no drawings made on the Original Line of Credit. We have granted to Fifth Third Bank a first priority security interest in a related certificate of deposit, in the amount of $260,000, to secure our obligations under the Original Fifth Third Reimbursement Agreement.
On June 3, 2011, we entered into a Letter of Credit Reimbursement Agreement (as amended on June 3, 2011) with Fifth Third Bank (the “New Fifth Third Reimbursement Agreement). The New Fifth Third Reimbursement Agreement provides up to $1.2 million of credit (the “New Line of Credit”) to us. Interest accrues on drawings under the New Fifth Third Reimbursement Agreement at a rate of 6% plus the prime rate per annum. There have been no drawings made on the New Line of Credit. We have granted to Fifth Third Bank a first priority security interest in a related certificate of deposit, in the amount of $1.2 million, to secure our obligations under the New Fifth Third Reimbursement Agreement.
140
Table of Contents
General
The following is a description of the material terms of our amended and restated certificate of incorporation and amended and restated bylaws as will each be in effect at or prior to the consummation of this offering. The following description may not contain all of the information that is important to you. To understand the material terms of our common stock, you should read our amended and restated certificate of incorporation and amended and restated bylaws, copies of which are or will be filed with the SEC as exhibits to the registration statement, of which this prospectus is a part.
Authorized Capitalization
Prior to the effectiveness of our amended and restated certificate of incorporation, our authorized capital stock consists of 34,500,000 shares of common stock, par value $0.0001 and 28,900,000 shares of preferred stock, of which (1) 18,600,000 shares are designated as Series B preferred stock, (2) 7,200,000 shares are designated as Series C preferred stock and (3) 3,100,000 shares are designated as Series D preferred stock. All of the outstanding shares of each of the Series B preferred stock, Series C preferred stock and Series D preferred stock will automatically be converted into common stock at the time of the consummation of this offering. Upon the effectiveness of our amended and restated certificate of incorporation, our authorized capital stock will consist of shares of common stock, par value $0.0001 per share, and shares of preferred stock, par value $0.0001 per share.
As of , 2012, shares of common stock were outstanding and were owned by stockholders of record. shares of preferred stock were issued and outstanding and were owned by stockholders of record. As of , 2012, there were outstanding options to purchase shares of our common stock. In addition, shares of common stock are reserved for issuance under the 2012 Plan.
Common Stock
Voting Rights
Each share of common stock will entitle the holder to one vote with respect to each matter presented to our stockholders on which the holders of common stock are entitled to vote. Subject to any rights that may be applicable to any then-outstanding preferred stock, our common stock will vote as a single class on all matters relating to the election and removal of directors on our board of directors and as provided by law. Holders of our common stock will not have cumulative voting rights. Except in respect of matters relating to the election and removal of directors on our board of directors and as otherwise provided in our amended and restated certificate of incorporation or required by law, all matters to be voted on by our stockholders must be approved by a majority of the shares present in person or by proxy at the meeting and entitled to vote on the subject matter. In the case of election of directors, all matters to be voted on by our stockholders must be approved by a plurality of the votes entitled to be cast by all shares of common stock.
Dividend Rights
Subject to preferences that may be applicable to any then-outstanding preferred stock, the holders of our outstanding shares of common stock are entitled to receive dividends, if any, as may be declared from time to time by our board of directors out of legally available funds. For additional information, see “Dividend Policy.”
Liquidation Rights
In the event of any voluntary or involuntary liquidation, dissolution or winding up of our affairs, holders of our common stock would be entitled to share ratably in our assets that are legally available for distribution to
141
Table of Contents
stockholders after payment of our debts and other liabilities. If we have any preferred stock outstanding at such time, holders of the preferred stock may be entitled to distribution or liquidation preferences. In either such case, we must pay the applicable distribution to the holders of our preferred stock before we may pay distributions to the holders of our common stock.
Other Rights
Our stockholders will have no preemptive, conversion or other rights to subscribe for additional shares. All outstanding shares are, and all shares offered by this prospectus will be, when sold, validly issued, fully paid and nonassessable. The rights, preferences and privileges of the holders of our common stock are subject to, and may be adversely affected by, the rights of the holders of shares of any series of our preferred stock that we may designate and issue in the future.
Listing
We have applied for listing of our common stock on The NASDAQ Global Market under the symbol “ERSI.”
Transfer Agent and Registrar
The transfer agent and registrar for our common stock will be .
Preferred Stock
Our amended and restated certificate of incorporation will authorize our board of directors to provide for the issuance of shares of preferred stock in one or more series and to fix the preferences, powers and relative, participating, optional or other special rights, and qualifications, limitations or restrictions thereof, including the dividend rate, conversion rights, voting rights, redemption rights and liquidation preference and to fix the number of shares to be included in any such series without any further vote or action by our stockholders. Any preferred stock so issued may rank senior to our common stock with respect to the payment of dividends or amounts upon liquidation, dissolution or winding up, or both. The issuance of preferred stock may have the effect of delaying, deferring or preventing a change in control of our company without further action by the stockholders and may adversely affect the voting and other rights of the holders of common stock. The issuance of preferred stock with voting and conversion rights may adversely affect the voting power of the holders of common stock, including the loss of voting control to others. At present, we have no plans to issue any preferred stock.
Antitakeover Effects of Delaware Law and Our Certificate of Incorporation and Bylaws
Our amended and restated certificate of incorporation and amended and restated bylaws also will contain provisions that may delay, defer or discourage another party from acquiring control of us. We expect that these provisions, which are summarized below, will discourage coercive takeover practices or inadequate takeover bids. These provisions are also designed to encourage persons seeking to acquire control of us to first negotiate with our board of directors, which we believe may result in an improvement of the terms of any such acquisition in favor of our stockholders. However, they also give our board of directors the power to discourage acquisitions that some stockholders may favor.
Undesignated Preferred Stock
The ability to authorize undesignated preferred stock will make it possible for our board of directors to issue preferred stock with super voting, special approval, dividend or other rights or preferences on a discriminatory basis that could impede the success of any attempt to acquire us. These and other provisions may have the effect of deferring, delaying or discouraging hostile takeovers, or changes in control or management of our company.
142
Table of Contents
Classified Board of Directors
Our amended and restated certificate of incorporation will provide that our board of directors will be divided into three classes, with each class serving three-year staggered terms. In addition, our certificate of incorporation provides that directors may only be removed from the board of directors with cause and by an affirmative vote of at least 66 2/3% of our common stock. These provisions may have the effect of deferring, delaying or discouraging hostile takeovers, or changes in control or management of our company.
Requirements for Advance Notification of Stockholder Meetings, Nominations and Proposals
Our amended and restated certificate of incorporation will provide that, except as otherwise required by law, special meetings of the stockholders may be called only by the chairman of the board of directors or pursuant to a resolution adopted by a majority of the total number of directors then in office. Our amended and restated bylaws will prohibit the conduct of any business at a special meeting other than as specified in the notice for such meeting. These provisions may have the effect of deferring, delaying or discouraging hostile takeovers or changes in control or management of our company.
Stockholder Action by Written Consent
Pursuant to Section 228 of the DGCL, any action required to be taken at any annual or special meeting of the stockholders may be taken without a meeting, without prior notice and without a vote if a consent or consents in writing, setting forth the action so taken, is signed by the holders of outstanding stock having not less than the minimum number of votes that would be necessary to authorize or take such action at a meeting at which all shares of our stock entitled to vote thereon were present and voted, unless our certificate of incorporation provides otherwise. Our amended and restated certificate of incorporation will provide that any action required or permitted to be taken by our stockholders may be effected at a duly called annual or special meeting of our stockholders and may not be effected by consent in writing by such stockholders, unless such action is recommended by all directors then in office.
Section 203 of the Delaware General Corporation Law
We will be subject to the provisions of Section 203 of the DGCL. In general, Section 203 prohibits a publicly held Delaware corporation from engaging in a “business combination” with an “interested stockholder” for a three-year period following the time that this stockholder becomes an interested stockholder, unless the business combination is approved in a prescribed manner. Under Section 203, a business combination between a corporation and an interested stockholder is prohibited unless it satisfies one of the following conditions:
| • | before the stockholder became interested, our board of directors approved either the business combination or the transaction which resulted in the stockholder becoming an interested stockholder; |
| • | upon consummation of the transaction which resulted in the stockholder becoming an interested stockholder, the interested stockholder owned at least 85% of the voting stock of the corporation outstanding at the time the transaction commenced, excluding for purposes of determining the voting stock outstanding, shares owned by persons who are directors and also officers, and employee stock plans, in some instances, but not the outstanding voting stock owned by the interested stockholder; or |
| • | at or after the time the stockholder became interested, the business combination was approved by our board of directors of the corporation and authorized at an annual or special meeting of the stockholders by the affirmative vote of at least two-thirds of the outstanding voting stock which is not owned by the interested stockholder. |
Section 203 defines a “business combination” to include:
| • | any merger or consolidation involving the corporation and the interested stockholder; |
| • | any sale, transfer, pledge or other disposition involving the interested stockholder of 10% or more of the assets of the corporation; |
143
Table of Contents
| • | subject to exceptions, any transaction that results in the issuance or transfer by the corporation of any stock of the corporation to the interested stockholder; |
| • | subject to exceptions, any transaction involving the corporation that has the effect of increasing the proportionate share of the stock of any class or series of the corporation beneficially owned by the interested stockholder; and |
| • | the receipt by the interested stockholder of the benefit of any loans, advances, guarantees, pledges or other financial benefits provided by or through the corporation. |
In general, Section 203 defines an interested stockholder as any entity or person who, together with any entity or person affiliated with or controlling or controlled by the entity or person, beneficially owns, or did own within three years prior to the determination of interested stockholder status, 15% or more of the outstanding voting stock of the corporation.
Amendments
Any amendments to the foregoing provisions of our amended and restated certificate of incorporation (except related to preferred stock) and any amendments to our amended and restated bylaws require the affirmative vote of at least 66 2/3% of the voting power of all shares of our common stock then outstanding.
144
Table of Contents
SHARES ELIGIBLE FOR FUTURE SALE
Prior to this offering, there has been no public market for our common stock. Future sales of substantial amounts of our common stock in the public market, or the perception that such sales may occur, could adversely affect the prevailing market price of our common stock. No prediction can be made as to the effect, if any, future sales of shares, or the availability of shares for future sales, will have on the market price of our common stock prevailing from time to time. The sale of substantial amounts of our common stock in the public market, or the perception that such sales could occur, could harm the prevailing market price of our common stock.
Sale of Restricted Shares
Upon consummation of this offering, we will have shares of common stock outstanding, including shares of common stock held by the TPG Funds after the exercise of the warrants that each holds. For additional information, see “Certain Relationship and Related Party Transactions—Preferred Financings—Warrants.” Of these shares of common stock, the shares of common stock being sold in this offering, plus any shares sold upon exercise of the underwriters’ option to purchase additional shares, will be freely tradable without restriction under the Securities Act, except for any such shares which may be held or acquired by an “affiliate” of ours, as that term is defined in Rule 144 promulgated under the Securities Act, which shares will be subject to the volume limitations and other restrictions of Rule 144 described below. The remaining shares of common stock held by our existing stockholders upon consummation of this offering will be “restricted securities,” as that phrase is defined in Rule 144, and may be resold only after registration under the Securities Act or pursuant to an exemption from such registration, including, among others, the exemptions provided by Rules 144 and 701 under the Securities Act, which rules are summarized below. These remaining shares of common stock held by our existing stockholders upon consummation of this offering will be available for sale in the public market after the expiration of the lock-up agreements described in “Underwriting,” taking into account the provisions of Rules 144 and 701 under the Securities Act.
Rule 144
In general, under Rule 144 as currently in effect, persons who became the beneficial owner of shares of our common stock prior to the consummation of this offering may not sell their shares upon the earlier of (1) the expiration of a six-month holding period, if we have been subject to the reporting requirements of the Exchange Act for at least 90 days prior to the date of the sale and have filed all reports required thereunder or (2) the expiration of a one-year holding period.
At the expiration of the six-month holding period, assuming we have been subject to the Exchange Act reporting requirements for at least 90 days and have filed all reports required thereunder, a person who was not one of our affiliates at any time during the three months preceding a sale would be entitled to sell an unlimited number of shares of our common stock, and a person who was one of our affiliates at any time during the three months preceding a sale would be entitled to sell, within any three-month period, a number of shares of common stock that does not exceed the greater of either of the following:
| • | 1% of the number of shares of our common stock then outstanding, which will equal approximately shares immediately after this offering; or |
| • | the average weekly trading volume of our common stock on NASDAQ during the four calendar weeks preceding the filing of a notice on Form 144 with respect to the sale. |
At the expiration of the one-year holding period, a person who was not one of our affiliates at any time during the three months preceding a sale would be entitled to sell an unlimited number of shares of our common stock without restriction. A person who was one of our affiliates at any time during the three months preceding a sale would remain subject to the volume restrictions described above.
145
Table of Contents
Sales under Rule 144 by our affiliates are also subject to manner of sale provisions and notice requirements and to the availability of current public information about us.
Rule 701
In general, under Rule 701, any of our employees, directors, officers, consultants or advisors who purchased shares from us in connection with a compensatory stock or option plan or other written agreement before the effective date of this offering, or who purchased shares from us after that date upon the exercise of options granted before that date, are eligible to resell such shares in reliance upon Rule 144 beginning 90 days after the date of this prospectus. If such person is not an affiliate, the sale may be made subject only to the manner-of-sale restrictions of Rule 144. If such a person is an affiliate, the sale may be made under Rule 144 without compliance with its one-year minimum holding period, but subject to the other Rule 144 restrictions.
Registration Rights
As described above in “Certain Relationships and Related Party Transactions—Preferred Financings—Second Amended and Restated Investors’ Rights Agreement,” following the consummation of this offering, subject to the 180-day lock-up period described below, certain of our existing stockholders will be entitled, subject to certain exceptions, to demand that we register under the Securities Act all or any portion of their shares. Following this offering, holders of an aggregate of shares will be entitled to demand that we register the shares of common stock held by them. By exercising their registration rights and causing a large number of shares to be registered and sold in the public market, these holders could cause the price of the common stock to fall. In addition, any demand to include such shares in our registration statements could have a material adverse effect on our ability to raise needed capital. We have not granted any other holders of our securities any demand registration rights other than pursuant to the Investors’ Rights Agreement.
Stock Plans
We intend to file one or more registration statements on Form S-8 under the Securities Act to register shares of our common stock issued or reserved for issuance under our the 2007 Plan and the 2012 Plan, which we intend to adopt in connection with this offering. The first such registration statement is expected to be filed soon after the date of this prospectus and will automatically become effective upon filing with the SEC. Accordingly, shares registered under such registration statement will be available for sale in the open market following the effective date, unless such shares are subject to vesting restrictions with us, Rule 144 restrictions applicable to our affiliates or the lock-up restrictions described below.
Lock-Up Agreements
We and each of our officers and directors and holders of approximately shares of our common stock have agreed, subject to certain exceptions, with the underwriters not to offer, pledge, sell, contract to sell, sell any option or contract to purchase, purchase any option or contract to sell, grant any option, right or warrant to purchase, lend or otherwise transfer or dispose of any shares of common stock during the period from the date of the underwriting agreement to be executed by us in connection with this offering continuing through the date that is 180 days after the date of the underwriting agreement, except with the prior written consent of Morgan Stanley & Co. LLC and J.P. Morgan Securities LLC. For additional information, see “Underwriting.”
146
Table of Contents
MATERIAL U.S. FEDERAL INCOME AND ESTATE TAX CONSIDERATIONS TO NON-U.S. HOLDERS
The following is a summary of material U.S. federal income tax consequences of the purchase, ownership and disposition of our common stock to a non-U.S. holder that purchases shares of our common stock in this offering and holds our common stock as a capital asset (within the meaning of Section 1221 of the Code). For purposes of this summary, a “non-U.S. holder” means a beneficial owner of our common stock that is, for U.S. federal income tax purposes:
| • | a nonresident alien individual; |
| • | a foreign corporation (or an entity treated as a foreign corporation for U.S. federal income tax purposes); or |
| • | a foreign estate or foreign trust. |
In the case of a holder that is classified as a partnership for U.S. federal income tax purposes, the tax treatment of a partner in such partnership generally will depend upon the status of the partner and the activities of the partner and the partnership. If you are a partner in a partnership holding our common stock, then you should consult your own tax advisor.
This summary is based upon the provisions of the Code, the Treasury regulations promulgated thereunder and administrative and judicial interpretations thereof, all as of the date hereof. Those authorities may be changed, perhaps retroactively, so as to result in U.S. federal income tax consequences different from those summarized below. We cannot assure you that a change in law, possibly with retroactive application, will not alter significantly the tax considerations that we describe in this summary. We have not sought and do not plan to seek any ruling from the U.S. Internal Revenue Service, which we refer to as the IRS, with respect to statements made and the conclusions reached in the following summary, and there can be no assurance that the IRS or a court will agree with our statements and conclusions.
This summary does not address all aspects of U.S. federal income taxes that may be relevant to non-U.S. holders in light of their personal circumstances, and does not deal with taxes other than the U.S. federal income tax or with non-U.S., state or local tax considerations. Special rules, not discussed here, may apply to certain non-U.S. holders, including:
| • | U.S. expatriates; |
| • | controlled foreign corporations; |
| • | passive foreign investment companies; and |
| • | investors in pass-through entities that are subject to special treatment under the Code. |
Such non-U.S. holders should consult their own tax advisors to determine the U.S. federal, state, local and other tax consequences that may be relevant to them.
This summary applies only to a non-U.S. holder that holds our common stock as a capital asset (within the meaning of Section 1221 of the Code).
If you are considering the purchase of our common stock, you should consult your own tax advisor concerning the particular U.S. federal income tax consequences to you of the purchase, ownership and disposition of our common stock, as well as the consequences to you arising under U.S. tax laws other than the federal income tax law or under the laws of any other taxing jurisdiction.
147
Table of Contents
Dividends
As discussed under the section entitled “Dividend Policy” above, we do not currently anticipate paying dividends. In the event that we do make a distribution of cash or property (other than certain stock distributions) with respect to our common stock (or certain redemptions that are treated as distributions with respect to common stock), any such distributions will be treated as a dividend for U.S. federal income tax purposes to the extent paid from our current or accumulated earnings and profits (as determined under U.S. federal income tax principles). Dividends paid to you generally will be subject to withholding of U.S. federal income tax at a 30% rate or such lower rate as may be specified by an applicable income tax treaty. However, dividends that are effectively connected with the conduct of a trade or business by you within the United States and, where a tax treaty applies, are generally attributable to a United States permanent establishment, are not subject to the withholding tax, but instead are subject to United States federal income tax on a net income basis at applicable graduated individual or corporate rates. Certain certification and disclosure requirements including delivery of a properly executed IRS Form W-8ECI must be satisfied for effectively connected income to be exempt from withholding. Any such effectively connected dividends received by a foreign corporation may be subject to an additional “branch profits tax” at a 30% rate or such lower rate as may be specified by an applicable income tax treaty.
If the amount of a distribution paid on our common stock exceeds our current and accumulated earnings and profits, such excess will be allocated ratably among each share of common stock with respect to which the distribution is paid and treated first as a tax-free return of capital to the extent of your adjusted tax basis in each such share, and thereafter as capital gain from a sale or other disposition of such share of common stock that is taxed to you as described below under the heading “—Gain on disposition of common stock.” Your adjusted tax basis is generally the purchase price of such shares, reduced by the amount of any such tax-free returns of capital.
If you wish to claim the benefit of an applicable treaty rate to avoid or reduce withholding of U.S. federal income tax for dividends, then you must (a) provide the withholding agent with a properly completed IRS Form W-8BEN (or other applicable form) and certify under penalties of perjury that you are not a U.S. person and are eligible for treaty benefits, or (b) if our common stock is held through certain foreign intermediaries, satisfy the relevant certification requirements of applicable U.S. Treasury regulations. Special certification and other requirements apply to certain non-U.S. holders that act as intermediaries (including partnerships).
If you are eligible for a reduced rate of U.S. federal income tax pursuant to an income tax treaty but fail to establish your eligibility prior to the payment of a dividend, then you may obtain a refund or credit of any excess amounts withheld by filing timely an appropriate claim with the IRS.
Gain on Disposition of Common Stock
You generally will not be subject to U.S. federal income tax with respect to gain realized on the sale or other taxable disposition of our common stock, unless:
| • | the gain is effectively connected with a trade or business you conduct in the United States, and, in cases in which certain tax treaties apply, is attributable to a United States permanent establishment; |
| • | if you are an individual, you are present in the United States for 183 days or more in the taxable year of the sale or other taxable disposition, and certain other conditions are met; or |
| • | we are or have been during a specified testing period a “U.S. real property holding corporation” for U.S. federal income tax purposes, and certain other conditions are met. |
Generally, we will be a “United States real property holding corporation” if the fair market value of our U.S. real property interests equals or exceeds 50% of the sum of the fair market values of our worldwide real property interests and other assets used or held for use in a trade or business, all as determined under applicable U.S. Treasury regulations. We believe that we have not been and are not, and we do not anticipate becoming, a “U.S. real property holding corporation” for U.S. federal income tax purposes. If you are an individual described in the
148
Table of Contents
first bullet point above, you will be subject to tax on the net gain derived from the sale under regular graduated United States federal income tax rates or such lower rate as specified by an applicable income tax treaty. If you are an individual described in the second bullet point above, you will be subject to a flat 30% tax on the gain derived from the sale, which may be offset by United States source capital losses. If you are a foreign corporation described in the first bullet point above, you will be subject to tax on your gain under regular graduated United States federal income tax rates and, in addition, may be subject to the branch profits tax equal to 30% of your effectively connected earnings and profits or at such lower rate as may be specified by an applicable income tax treaty.
Information Reporting and Backup Withholding
We must report annually to the IRS and to you the amount of dividends paid to you and the amount of tax, if any, withheld with respect to such dividends. The IRS may make this information available to the tax authorities in the country in which you are resident.
In addition, you may be subject to information reporting requirements and backup withholding (currently at a rate of 28%) with respect to dividends paid on, and the proceeds of disposition of, shares of our common stock, unless, generally, you certify under penalties of perjury (usually on IRS Form W-8BEN) that you are not a U.S. person or you otherwise establish an exemption. Additional rules relating to information reporting requirements and backup withholding tax with respect to payments of the proceeds from the disposition of shares of our common stock are as follows:
| • | If the proceeds are paid to or through the U.S. office of a broker, the proceeds generally will be subject to backup withholding and information reporting, unless you certify under penalties of perjury (usually on IRS Form W-8BEN) that you are not a U.S. person or you otherwise establish an exemption. |
| • | If the proceeds are paid to or through a non-U.S. office of a broker that is not a U.S. person and is not a foreign person with certain specified U.S. connections (a “U.S.-related person”), information reporting and backup withholding generally will not apply. |
| • | If the proceeds are paid to or through a non-U.S. office of a broker that is a U.S. person or a U.S.-related person, the proceeds generally will be subject to information reporting (but not to backup withholding), unless you certify under penalties of perjury (usually on IRS Form W-8BEN) that you are not a U.S. person. |
Any amounts withheld under the backup withholding rules may be allowed as a refund or a credit against your U.S. federal income tax liability, provided the required information is timely furnished by you to the IRS.
Recent Legislation Relating to Foreign Accounts
Recently enacted legislation may impose withholding taxes on certain payments made to “foreign financial institutions” and certain other non-U.S. entities after December 31, 2012 (the IRS has indicated by published guidance, however, that withholding on applicable payments will not begin until January 1, 2014). The legislation imposes a 30% withholding tax on dividends on, or gross proceeds from the sale or other disposition of, our common stock paid to a foreign financial institution unless the foreign financial institution enters into an agreement with the U.S. Treasury to, among other things, undertake to identify accounts held by certain U.S. persons (including certain equity and debt holders of such institutions) or U.S.-owned foreign entities, annually report certain information about such accounts, and withhold 30% on payments to account holders whose actions prevent it from complying with these reporting and other requirements. In addition, unless an exception applies, the legislation imposes a 30% withholding tax on the same types of payments to a foreign non-financial entity unless the entity certifies that it does not have any substantial U.S. owners (which generally includes any U.S. person who directly or indirectly own more than 10% of the entity) or furnishes identifying information regarding each substantial U.S. owner. Non-U.S. holders of our common stock may be eligible for refunds or
149
Table of Contents
credits of taxes imposed under this legislation, but may be required to file a U.S. federal income tax return to claim such refunds or credits. Prospective investors should consult their tax advisors regarding the implications of this legislation on their investment in our common stock.
THE SUMMARY OF MATERIAL U.S. FEDERAL INCOME TAX CONSEQUENCES ABOVE IS INCLUDED FOR GENERAL INFORMATION PURPOSES ONLY. POTENTIAL PURCHASERS OF OUR COMMON STOCK ARE URGED TO CONSULT THEIR OWN TAX ADVISORS TO DETERMINE THE U.S. FEDERAL, STATE, LOCAL AND NON-U.S. TAX CONSIDERATIONS OF PURCHASING, OWNING AND DISPOSING OF OUR COMMON STOCK.
150
Table of Contents
Under the terms and subject to the conditions in an underwriting agreement dated the date of this prospectus, the underwriters named below, for whom Morgan Stanley & Co. LLC, J.P. Morgan Securities LLC and Jefferies & Company, Inc. are acting as representatives, have severally agreed to purchase, and we have agreed to sell to them the number of shares indicated below:
| Name |
Number of Shares | |
| Morgan Stanley & Co. LLC |
||
| J.P. Morgan Securities LLC |
||
| Jefferies & Company, Inc. |
||
| Piper Jaffray & Co. |
||
| Raymond James & Associates, Inc. |
||
| Total: |
The underwriters and the representatives are collectively referred to as the “underwriters” and the “representatives,” respectively. The underwriters are offering the shares of common stock subject to their acceptance of the shares from us and subject to prior sale. The underwriting agreement provides that the obligations of the several underwriters to pay for and accept delivery of the shares of common stock offered by this prospectus are subject to the approval of certain legal matters by their counsel and to certain other conditions. The underwriters are obligated to take and pay for all of the shares of common stock offered by this prospectus if any such shares are taken. However, the underwriters are not required to take or pay for the shares covered by the underwriters’ option to purchase additional shares described below.
The underwriters initially propose to offer part of the shares of common stock directly to the public at the offering price listed on the cover page of this prospectus and part to certain dealers at a price that represents a concession not in excess of $ per share. After the initial offering of the shares of common stock, the offering price and other selling terms may from time to time be varied by the representative.
We have granted to the underwriters an option, exercisable for 30 days from the date of this prospectus, to purchase up to additional shares of common stock at the public offering price listed on the cover page of this prospectus, less underwriting discounts and commissions. The underwriters may exercise this option solely for the purpose of covering over-allotments, if any, made in connection with the offering of the shares of common stock offered by this prospectus. To the extent the option is exercised, each underwriter will become obligated, subject to certain conditions, to purchase about the same percentage of the additional shares of common stock as the number listed next to the underwriter’s name in the preceding table bears to the total number of shares of common stock listed next to the names of all underwriters in the preceding table.
The following table shows the per share and total public offering price, underwriting discounts and commissions, and proceeds before expenses to us. These amounts are shown assuming both no exercise and full exercise of the underwriters’ option to purchase up to an additional shares of common stock.
| Total | ||||||||||||
| Per Share | No Exercise | Full Exercise | ||||||||||
| Public offering price |
$ | $ | $ | |||||||||
| Underwriting discounts and commissions to be paid by us |
$ | $ | $ | |||||||||
| Proceeds, before expenses, to us |
$ | $ | $ | |||||||||
The estimated offering expenses payable by us, exclusive of the underwriting discounts and commissions, are approximately $ .
The underwriters have informed us that they do not intend sales to discretionary accounts to exceed 5% of the total number of shares of common stock offered by them.
151
Table of Contents
We intend to apply for quotation on The NASDAQ Global Market under the symbol “ERSI.”
We and all directors and officers and the holders of all of our outstanding stock and stock options have agreed that, subject to certain exceptions or otherwise without the prior written consent of Morgan Stanley & Co. LLC and J.P. Morgan Securities LLC on behalf of the underwriters, we and they will not, during the period ending 180 days after the date of this prospectus:
| • | offer, pledge, sell, contract to sell, sell any option or contract to purchase, purchase any option or contract to sell, grant any option, right or warrant to purchase, lend, or otherwise transfer or dispose of, directly or indirectly, any shares of common stock or any securities convertible into or exercisable or exchangeable for shares of common stock; |
| • | enter into any swap or other arrangement that transfers to another, in whole or in part, any of the economic consequences of ownership of the common stock; or |
| • | file any registration statement with the SEC relating to the offering of any shares of common stock or any securities convertible into or exercisable or exchangeable for common stock; |
whether any such transaction described in the first two bullet points above is to be settled by delivery of common stock or such other securities, in cash or otherwise. In addition, we and each such person agrees that, without the prior written consent of Morgan Stanley & Co. LLC and J.P. Morgan Securities LLC on behalf of the underwriters, it will not, during the period ending 180 days after the date of this prospectus, make any demand for, or exercise any right with respect to, the registration of any shares of common stock or any security convertible into or exercisable or exchangeable for common stock.
With respect to us, the restrictions described above do not apply to:
| • | the sale of shares to the underwriters; |
| • | issuances of shares of our common stock upon the exercise of any existing option or warrant or the conversion of any security currently outstanding that is disclosed in this prospectus; |
| • | issuances of options or other equity compensation relating to our common stock pursuant to our existing equity compensation plan that is described in this prospectus; or |
| • | the filing of a registration statement on Form S-8 or other appropriate forms as required by the Securities Act, and any amendments thereto, relating to our common stock issued or issuable under our existing equity compensation plan. |
With respect to our directors, officers and the other holders of our outstanding stock, the restrictions described above do not apply to:
| • | transactions relating to shares of our common stock or other securities acquired in open market transactions after the completion of this offering, provided that no filing under Section 16(a) of the Exchange Act shall be required or shall be voluntarily made in connection with subsequent sales of our common stock or other securities acquired in such open market transactions; |
| • | transfers of shares of our common stock or any security convertible into or exercisable for our common stock as a bona fide gift or by will or intestacy; |
| • | transfers of shares of our common stock or any security convertible into or exercisable for our common stock to any trust for the direct or indirect benefit of the director, officer or such other holder of our outstanding stock or an immediate family member of such individual; |
| • | transfers or distributions of shares of our common stock or any security convertible into or exercisable for our common stock to affiliates of the director, officer or such other holder of our outstanding stock, including distributions to related investment fund or other entity controlled or managed by the undersigned or any of its affiliates or any direct or indirect general or limited partners, members, stockholders or subsidiaries of such person; |
152
Table of Contents
| • | the establishment or amendment of a trading plan pursuant to Rule 10b5-1 under the Exchange Act for the transfer of shares of our common stock, provided that such plan does not provide for the transfer of shares of our common stock during the restricted period and no public announcement or filing under the Exchange Act regarding the establishment or amendment of such plan shall be required of or voluntarily made by or on behalf of the director, officer, such other holder of our outstanding stock or us during the restricted period; |
| • | the exercise of any warrants held by such director, officer or other holder of our outstanding stock in accordance with their terms and described in this prospectus, provided that the shares of our common stock issued to such director, officer or other holder of our outstanding stock pursuant to such exercise will remain subject to the restrictions described above; |
| • | transfers to us in connection with the repurchase of shares of common stock or any security convertible into common stock issued pursuant to equity incentive plans disclosed in the Prospectus or pursuant to agreements pursuant to which shares of common stock were issued in connection with the director’s or officer’s termination of employment with us; or |
| • | transfers of shares of our common stock or any security convertible into our common stock pursuant to a bona fide third-party tender offer, merger, consolidation or other similar transaction made to all holders of our common stock involving a change of control of us, provided that in the event that the tender offer, merger, consolidation or other such transaction is not completed, the shares of our common stock owned by such director, officer or other holder of our outstanding stock will remain subject to the restrictions described above; |
provided that, in the case of any transfer or distribution pursuant to the second, third or fourth bullet above, (1) each transferee or distributee shall sign and deliver a lock-up agreement substantially in the form of the lock-up agreement signed by the director, officer or other holder of our outstanding stock and (2) no filing under Section 16(a) of the Exchange Act, reporting a reduction in beneficial ownership of shares of our common stock, shall be required or shall be voluntarily made during the restricted period.
The 180-day restricted period described in the immediately preceding paragraph will be extended if:
| • | during the last 17 days of the 180-day restricted period we issue an earnings release or material news or a material event relating to us occurs, or |
| • | prior to the expiration of the 180-day restricted period, we announce that we will release earnings results during the 16-day period beginning on the last day of the 180-day period or provide notification to Morgan Stanley & Co. LLC and J.P. Morgan Securities LLC of any earnings release or material news or material event that may give rise to an extension of the initial 180-day restricted period, |
in which case the restrictions described in the immediately preceding paragraph will continue to apply until the expiration of the 18-day period beginning on the issuance of the earnings release or the occurrence of the material news or material event.
The lock-up agreements with our directors, officers and certain holders of our outstanding stock and stock options will automatically terminate upon certain specified events.
The lock-up agreements further provide that in the event any shares of common stock held by an officer, director or greater than one percent holder of common stock are released from the restrictions set forth in the lock-up agreement, the same percentage of shares of common stock held by such party will be immediately and fully released from any remaining restrictions under the lock-up agreement concurrently therewith. In the event such person is released from any of its obligations under the lock-up agreement, Morgan Stanley & Co. LLC and J.P. Morgan Securities LLC will use commercially reasonable efforts to notify such person within three business days; provided that the failure to give such notice will not give rise to any claim or liability against Morgan Stanley & Co. LLC and J.P. Morgan Securities LLC or the underwriters.
153
Table of Contents
Morgan Stanley & Co. LLC and J.P. Morgan Securities LLC, in their sole discretion, may release the common stock and other securities subject to the lock-up agreements described above in whole or in part at any time with or without notice. When determining whether or not to release common stock and other securities from lock-up agreements, Morgan Stanley & Co. LLC and J.P. Morgan Securities LLC will consider, among other factors, the holder’s reasons for requesting the release, the number of shares of common stock and other securities for which the release is being requested and market conditions at the time. At least two business days before the effectiveness of any written consent of Morgan Stanley & Co. LLC and J.P. Morgan Securities LLC during the 180-day period, (1) Morgan Stanley & Co. LLC and J.P. Morgan Securities LLC will notify us of the impending release or waiver of any restriction and (2) we have agreed to announce the impending release or waiver by press release through a major news service at least two business days before the effective date of the release or waiver, except where the release or waiver is effected solely to permit a transfer of common stock that is not for consideration and where the transferee has agreed in writing to be bound by the terms of this agreement.
As described below under “Directed Share Program,” any participants in the Directed Share Program shall be subject to a 180-day lock up with respect to any shares sold to them pursuant to that program. This lock up will have similar restrictions and an identical extension provision as the lock-up agreement described above. Any shares sold in the Directed Share Program to our directors or officers shall be subject to the lock-up agreement described above.
In order to facilitate the offering of the common stock, the underwriters may engage in transactions that stabilize, maintain or otherwise affect the price of the common stock. Specifically, the underwriters may sell more shares than they are obligated to purchase under the underwriting agreement, creating a short position. A short sale is covered if the short position is no greater than the number of shares available for purchase by the underwriters under the option to purchase additional shares of common stock. The underwriters can close out a covered short sale by exercising the option to purchase additional shares of common stock or purchasing shares in the open market. In determining the source of shares to close out a covered short sale, the underwriters will consider, among other things, the open market price of shares compared to the price available under the option to purchase additional shares of common stock. The underwriters may also sell shares in excess of the option to purchase additional shares of common stock, creating a naked short position. The underwriters must close out any naked short position by purchasing shares in the open market. A naked short position is more likely to be created if the underwriters are concerned that there may be downward pressure on the price of the common stock in the open market after pricing that could adversely affect investors who purchase in this offering. As an additional means of facilitating the offering, the underwriters may bid for, and purchase, shares of common stock in the open market to stabilize the price of the common stock. These activities may raise or maintain the market price of the common stock above independent market levels or prevent or retard a decline in the market price of the common stock. The underwriters are not required to engage in these activities and may end any of these activities at any time.
In connection with this offering, the underwriters may engage in passive market making transactions in the common stock on NASDAQ in accordance with Rule 103 of Regulation M under the Exchange Act, as amended, during the period before the commencement of offers or sales of common stock and extending through the completion of distribution. A passive market maker must display its bids at a price not in excess of the highest independent bid of the common stock. However, if all independent bids are lowered below the passive market maker’s bid, that bid must be lowered when specified purchase limits are exceeded. From time to time, some of the underwriters and their affiliates have provided, and continue to provide, investment banking services to the Company.
The estimated offering expenses payable by us, in addition to the underwriting discounts and commissions, are approximately $ million, which includes legal, accounting and printing costs and various other fees associated with registering and listing our common stock. The underwriters have agreed to reimburse us for certain of these expenses.
154
Table of Contents
We and the underwriters have agreed to indemnify each other against certain liabilities, including liabilities under the Securities Act.
A prospectus in electronic format may be made available on websites maintained by one or more underwriters, or selling group members, if any, participating in this offering. The representative may agree to allocate a number of shares of common stock to underwriters for sale to their online brokerage account holders. Internet distributions will be allocated by the representative to underwriters that may make Internet distributions on the same basis as other allocations.
Pricing of the Offering
Prior to this offering, there has been no public market for our common stock. The initial public offering price was determined by negotiations between us and the representatives. The factors considered in determining the initial public offering price were our future prospects and those of our industry in general, our sales, earnings and certain other financial and operating information in recent periods, and the price-earnings ratios, price-sales ratios, market prices of securities, and certain financial and operating information of companies engaged in activities similar to ours.
Directed Share Program
At our request, the underwriters have reserved % of the shares of common stock to be issued by the Company and offered by this prospectus for sale, at the initial public offering price, to directors, officers, employees, business associates and related persons of Elevance Renewable Sciences, Inc. If purchased by these persons, these shares will be subject to a 180-day lock-up restriction. The number of shares of common stock available for sale to the general public will be reduced to the extent these individuals purchase such reserved shares. Any reserved shares that are not so purchased will be offered by the underwriters to the general public on the same basis as the other shares offered by this prospectus.
Selling Restrictions
European Economic Area
In relation to each Member State of the European Economic Area which has implemented the Prospectus Directive (each, a “Relevant Member State”) an offer to the public of any shares of our common stock may not be made in that Relevant Member State, except that an offer to the public in that Relevant Member State of any shares of our common stock may be made at any time under the following exemptions under the Prospectus Directive, if they have been implemented in that Relevant Member State:
(a) to any legal entity which is a qualified investor as defined in the Prospectus Directive;
(b) to fewer than 100 or, if the Relevant Member State has implemented the relevant provision of the 2010 PD Amending Directive, 150, natural or legal persons (other than qualified investors as defined in the Prospectus Directive), as permitted under the Prospectus Directive, subject to obtaining the prior consent of the representatives for any such offer; or
(c) in any other circumstances falling within Article 3(2) of the Prospectus Directive, provided that no such offer of shares of our common stock shall result in a requirement for the publication by us or any underwriter of a prospectus pursuant to Article 3 of the Prospectus Directive.
For the purposes of this provision, the expression an “offer to the public” in relation to any shares of our common stock in any Relevant Member State means the communication in any form and by any means of sufficient information on the terms of the offer and any shares of our common stock to be offered so as to enable
155
Table of Contents
an investor to decide to purchase any shares of our common stock, as the same may be varied in that Member State by any measure implementing the Prospectus Directive in that Member State, the expression “Prospectus Directive” means Directive 2003/71/EC (and amendments thereto, including the 2010 PD Amending Directive, to the extent implemented in the Relevant Member State), and includes any relevant implementing measure in the Relevant Member State, and the expression “2010 PD Amending Directive” means Directive 2010/73/EU.
United Kingdom
Each underwriter has represented and agreed that:
(a) it has only communicated or caused to be communicated and will only communicate or cause to be communicated an invitation or inducement to engage in investment activity (within the meaning of Section 21 of the FSMA) received by it in connection with the issue or sale of the shares of our common stock in circumstances in which Section 21(1) of the FSMA does not apply to us; and
(b) it has complied and will comply with all applicable provisions of the FSMA with respect to anything done by it in relation to the shares of our common stock in, from or otherwise involving the United Kingdom.
156
Table of Contents
The validity of the common stock offered hereby will be passed upon for us by Kirkland & Ellis LLP (a partnership that includes professional corporations), Chicago, Illinois. Certain legal matters will be passed upon for the underwriters by Davis Polk & Wardwell LLP, New York, New York.
The consolidated financial statements of Elevance Renewable Sciences, Inc. (f/k/a Renewable Chemicals Corporation) as of December 31, 2009 and 2010, and for each of years in the three-year period ended December 31, 2010, have been included in this Prospectus and Registration Statement in reliance upon the report of KPMG LLP, independent registered public accounting firm, appearing elsewhere herein, and upon the authority of said firm as experts in accounting and auditing.
WHERE YOU CAN FIND MORE INFORMATION
We have filed with the SEC a registration statement on Form S-1 under the Securities Act that registers the shares of our common stock to be sold in this offering. The registration statement, including the attached exhibits, contains additional relevant information about us and our common stock. The rules and regulations of the SEC allow us to omit from this document certain information included in the registration statement.
You may read and copy the reports and other information we file with the SEC at the SEC’s Public Reference Room at 100 F Street, N.E., Room 1580, Washington, D.C. 20549. You may also obtain copies of this information by mail from the public reference section of the SEC, 100 F Street, N.E., Washington, D.C. 20549, at prescribed rates. You may obtain information regarding the operation of the public reference room by calling 1-800-SEC-0330. The SEC also maintains a website that contains reports, proxy statements and other information about issuers, like us, who file electronically with the SEC. The address of that website is www.sec.gov. This reference to the SEC’s website is an inactive textual reference only and is not a hyperlink.
Upon consummation of this offering, we will become subject to the reporting, proxy and information requirements of the Exchange Act, and as a result will be required to file periodic reports, proxy statements and other information with the SEC. These periodic reports, proxy statements and other information will be available for inspection and copying at the SEC’s public reference room and the website of the SEC referred to above, as well as on our website, www.elevance.com. This reference to our website is an inactive textual reference only and is not a hyperlink. The contents of our website are not part of this prospectus, and you should not consider the contents of our website in making an investment decision with respect to our common stock.
We intend to furnish our stockholders with annual reports containing audited financial statements and make available to our stockholders quarterly reports for the first three quarters of each fiscal year containing unaudited interim financial information.
157
Table of Contents
| Page Number |
||||
| Elevance Renewable Sciences, Inc. |
||||
| Report of KPMG LLP, an Independent Registered Public Accounting Firm |
F-2 | |||
| Audited Consolidated Financial Statements |
||||
| Consolidated Balance Sheets as of December 31, 2009 and 2010 |
F-3 | |||
| Consolidated Statements of Operations for the years ended December 31, 2008, 2009 and 2010 |
F-4 | |||
| F-5 | ||||
| Consolidated Statements of Cash Flows for the fiscal years ended December 31, 2008, 2009 and 2010 |
F-6 | |||
| F-7 | ||||
| Unaudited Condensed Financial Statements |
||||
| Condensed Consolidated Balance Sheets as of December 31, 2010 and September 30, 2011 |
F-29 | |||
| F-30 | ||||
| F-31 | ||||
| F-32 | ||||
| Notes to Condensed Consolidated Financial Statements (Unaudited) |
F-33 | |||
F-1
Table of Contents
Report of Independent Registered Public Accounting Firm
The Board of Directors
Elevance Renewable Sciences, Inc:
We have audited the accompanying consolidated balance sheets of Elevance Renewable Sciences, Inc. and subsidiaries (the Company) as of December 31, 2010 and 2009, and the related consolidated statements of operations, shareholders’ deficit and cash flows for each of the years in the three-year period ended December 31, 2010. These consolidated financial statements are the responsibility of the Company’s management. Our responsibility is to express an opinion on these consolidated financial statements based on our audits.
We conducted our audits in accordance with the auditing standards of the Public Company Accounting Oversight Board (United States). Those standards require that we plan and perform the audit to obtain reasonable assurance about whether the financial statements are free of material misstatement. An audit also includes examining, on a test basis, evidence supporting the amounts and disclosures in the financial statements, assessing the accounting principles used and significant estimates made by management, as well as evaluating the overall financial statement presentation. We believe that our audits provide a reasonable basis for our opinion.
In our opinion, the consolidated financial statements referred to above present fairly, in all material respects, the financial position the Company as of December 31, 2010 and 2009, and the results of their operations and their cash flows for each of the years in the three-year period ended December 31, 2010 in conformity with U.S. generally accepted accounting principles.
/s/ KPMG LLP
Chicago, Illinois
March 24, 2011 (September 20, 2011 as to Notes 2(e), 2(x) and 2(y))
F-2
Table of Contents
ELEVANCE RENEWABLE SCIENCES, INC. & SUBSIDIARIES
Consolidated Balance Sheets
(In thousands, except share and per share amounts)
| December 31, 2009 |
December 31, 2010 |
|||||||
| Assets | ||||||||
| Current assets: |
||||||||
| Cash and cash equivalents |
$ | 7,557 | $ | 36,665 | ||||
| Short-term investments |
250 | 40,693 | ||||||
| Trade accounts receivable |
957 | 1,781 | ||||||
| Inventories |
580 | 2,594 | ||||||
| Prepaid expenses |
1,079 | 673 | ||||||
| Other current assets |
159 | 467 | ||||||
|
|
|
|
|
|||||
| Total current assets |
10,582 | 82,873 | ||||||
| Investments |
260 | 260 | ||||||
| Property and equipment, net of accumulated depreciation of $690 and $1,298 at December 31, 2009 and 2010 |
3,747 | 4,932 | ||||||
| Intangible assets, net of accumulated amortization of $3,178 and $4,684 at December 31, 2009 and 2010 |
15,422 | 13,916 | ||||||
| Goodwill |
1,166 | 1,166 | ||||||
| Other assets |
101 | 243 | ||||||
|
|
|
|
|
|||||
| Total assets |
$ | 31,278 | $ | 103,390 | ||||
|
|
|
|
|
|||||
| Liabilities and Shareholders’ Deficit |
||||||||
| Current liabilities: |
||||||||
| Accounts payable |
$ | 576 | $ | 1,115 | ||||
| Due to related party |
272 | 1,106 | ||||||
| Debt due within one year |
9,864 | 7 | ||||||
| Accrued compensation and related liabilities |
1,181 | 1,590 | ||||||
| Accrued expenses |
498 | 302 | ||||||
| Other current liabilities |
50 | 23 | ||||||
|
|
|
|
|
|||||
| Total current liabilities |
12,441 | 4,143 | ||||||
|
|
|
|
|
|||||
| Noncurrent liabilities: |
||||||||
| Long-term debt |
95 | 93 | ||||||
| Convertible preferred stock warrant liability |
6,443 | 12,177 | ||||||
| Other liabilities |
245 | 323 | ||||||
|
|
|
|
|
|||||
| Total noncurrent liabilities |
6,783 | 12,593 | ||||||
|
|
|
|
|
|||||
| Total liabilities |
19,224 | 16,736 | ||||||
|
|
|
|
|
|||||
| Commitments and contingencies (note 5) |
||||||||
| Convertible preferred stock, $0.0001 par value. |
||||||||
| Authorized 14,348,735, 25,800,000 and 28,900,000 shares as of December 31, 2009, and December 31, 2010, respectively; 5,061,868, 14,480,358 shares issued and outstanding as of December 31, 2009 and 2010, respectively (aggregate liquidation value of $52,960 and $161,268 as of December 31, 2009 and December 31, 2010, respectively) |
47,991 | 154,429 | ||||||
| Elevance Renewable Sciences Inc. shareholders’ deficit: |
||||||||
| Common stock, $0.0001 par value. Authorized 18,500,000 and 32,500,000 shares as of December 31, 2009 and December 31, 2010, respectively; 2,261,362, and 2,332,448 shares issued and outstanding as of December 31, 2009 and December 31, 2010, respectively |
— | — | ||||||
| Additional paid-in capital |
10,554 | 4,568 | ||||||
| Accumulated other comprehensive income |
7 | 19 | ||||||
| Accumulated deficit |
(46,498 | ) | (73,789 | ) | ||||
|
|
|
|
|
|||||
| Total Elevance Renewable Sciences, Inc. shareholders’ deficit |
(35,937 | ) | (69,202 | ) | ||||
| Noncontrolling interest |
— | 1,427 | ||||||
|
|
|
|
|
|||||
| Total deficit |
(35,937 | ) | (67,775 | ) | ||||
|
|
|
|
|
|||||
| Total liabilities and deficit |
$ | 31,278 | $ | 103,390 | ||||
|
|
|
|
|
|||||
See accompanying notes to consolidated financial statements.
F-3
Table of Contents
ELEVANCE RENEWABLE SCIENCES, INC. & SUBSIDIARIES
Consolidated Statements of Operations
(In thousands, except share and per share amounts)
| Years Ended December 31, | ||||||||||||
| 2008 | 2009 | 2010 | ||||||||||
| Product sales |
$ | 18,913 | $ | 12,186 | $ | 20,227 | ||||||
| Grants |
— | — | 961 | |||||||||
|
|
|
|
|
|
|
|||||||
| Total revenues |
18,913 | 12,186 | 21,188 | |||||||||
|
|
|
|
|
|
|
|||||||
| Operating expenses: |
||||||||||||
| Cost of product sales |
14,425 | 11,860 | 17,824 | |||||||||
| Sales, general and administrative |
8,086 | 8,168 | 11,356 | |||||||||
| Research and development |
5,539 | 7,760 | 8,896 | |||||||||
| Intangible asset amortization |
1,506 | 1,506 | 1,506 | |||||||||
|
|
|
|
|
|
|
|||||||
| Total operating expenses |
29,556 | 29,294 | 39,582 | |||||||||
|
|
|
|
|
|
|
|||||||
| Loss from operations |
(10,643 | ) | (17,108 | ) | (18,394 | ) | ||||||
| Gain (loss) on change in fair value of warrants |
1,787 | 652 | (4,506 | ) | ||||||||
| Interest expense |
— | (437 | ) | (4,415 | ) | |||||||
| Other income, net |
636 | 56 | 14 | |||||||||
|
|
|
|
|
|
|
|||||||
| Loss before income taxes |
(8,220 | ) | (16,837 | ) | (27,301 | ) | ||||||
| Income taxes |
— | — | — | |||||||||
|
|
|
|
|
|
|
|||||||
| Net loss |
(8,220 | ) | (16,837 | ) | (27,301 | ) | ||||||
| Less net loss attributable to the noncontrolling interest |
— | — | 10 | |||||||||
|
|
|
|
|
|
|
|||||||
| Net loss attributable to Elevance Renewable Sciences, Inc. |
(8,220 | ) | (16,837 | ) | (27,291 | ) | ||||||
| Less accretion on Series A and B preferred stock and cumulative dividends on Series B and C preferred stock |
(6,689 | ) | (6,876 | ) | (6,349 | ) | ||||||
|
|
|
|
|
|
|
|||||||
| Net loss available to Elevance Renewable Sciences, Inc. common shareholders |
$ | (14,909 | ) | $ | (23,713 | ) | $ | (33,640 | ) | |||
|
|
|
|
|
|
|
|||||||
| Net loss per share of common stock attributable to Elevance Renewable Sciences, Inc. shareholders, basic and diluted |
$ | (99.39 | ) | $ | (33.08 | ) | $ | (14.64 | ) | |||
|
|
|
|
|
|
|
|||||||
| Weighted-avererage shares of common stock outstanding used in computing net loss per share of common stock, basic and diluted |
150,000 | 716,886 | 2,297,197 | |||||||||
|
|
|
|
|
|
|
|||||||
See accompanying notes to consolidated financial statements.
F-4
Table of Contents
ELEVANCE RENEWABLE SCIENCES, INC. & SUBSIDIARIES
Consolidated Statements of Shareholders’ Deficit
(In thousands, except shares)
| Common Stock | Additional Paid-in Capital |
Accumulated Deficit |
Accumulated Other Comprehensive Income |
Total Shareholders’ Deficit |
Noncontrolling Interest |
Total Deficit |
||||||||||||||||||||||||||
| Shares | Amount | |||||||||||||||||||||||||||||||
| January 1, 2008 |
150,000 | $ | — | $ | — | $ | (9,759 | ) | $ | — | $ | (9,759 | ) | $ | — | $ | (9,759 | ) | ||||||||||||||
| Share-based compensation expense |
— | — | 328 | — | — | 328 | — | 328 | ||||||||||||||||||||||||
| Series B preferred stock cumulative dividend and accretion |
— | — | (328 | ) | (5,100 | ) | — | (5,428 | ) | — | (5,428 | ) | ||||||||||||||||||||
| Series A preferred stock accretion |
— | — | — | (1,261 | ) | — | (1,261 | ) | (1,261 | ) | ||||||||||||||||||||||
| Net loss |
— | — | — | (8,220 | ) | — | (8,220 | ) | — | (8,220 | ) | |||||||||||||||||||||
|
|
|
|||||||||||||||||||||||||||||||
| Total comprehensive loss |
(8,220 | ) | ||||||||||||||||||||||||||||||
|
|
|
|||||||||||||||||||||||||||||||
| December 31, 2008 |
150,000 | — | — | (24,340 | ) | — | (24,340 | ) | — | (24,340 | ) | |||||||||||||||||||||
| Share-based compensation expense |
— | — | 218 | — | — | 218 | — | 218 | ||||||||||||||||||||||||
| Series B preferred stock cumulative dividend and accretion |
— | — | (1,555 | ) | (4,196 | ) | — | (5,751 | ) | — | (5,751 | ) | ||||||||||||||||||||
| Series A preferred stock accretion |
— | — | — | (1,125 | ) | — | (1,125 | ) | — | (1,125 | ) | |||||||||||||||||||||
| Conversion of Series A and Series B preferred shares |
2,111,362 | — | 11,891 | — | — | 11,891 | — | 11,891 | ||||||||||||||||||||||||
| Comprehensive loss: |
||||||||||||||||||||||||||||||||
| Net loss |
— | — | — | (16,837 | ) | — | (16,837 | ) | — | (16,837 | ) | |||||||||||||||||||||
| Foreign currency translation adjustment |
— | — | — | — | 7 | 7 | — | 7 | ||||||||||||||||||||||||
|
|
|
|||||||||||||||||||||||||||||||
| Total comprehensive loss |
(16,830 | ) | ||||||||||||||||||||||||||||||
|
|
|
|
|
|
|
|
|
|
|
|
|
|
|
|
|
|||||||||||||||||
| December 31, 2009 |
2,261,362 | — | 10,554 | (46,498 | ) | 7 | (35,937 | ) | — | (35,937 | ) | |||||||||||||||||||||
| Share-based compensation expense |
— | — | 293 | — | — | 293 | — | 293 | ||||||||||||||||||||||||
| Issuance of common stock upon exercise of stock options |
71,086 | — | 70 | — | — | 70 | — | 70 | ||||||||||||||||||||||||
| Series C preferred stock cumulative dividend |
— | — | (384 | ) | — | — | (384 | ) | — | (384 | ) | |||||||||||||||||||||
| Series B preferred stock cumulative dividend and accretion |
— | — | (5,965 | ) | — | — | (5,965 | ) | — | (5,965 | ) | |||||||||||||||||||||
| Sale of subsidiary shares to noncontrolling interest |
— | — | — | — | — | — | 1,437 | 1,437 | ||||||||||||||||||||||||
| Comprehensive loss: |
||||||||||||||||||||||||||||||||
| Net loss |
— | — | — | (27,291 | ) | — | (27,291 | ) | (10 | ) | (27,301 | ) | ||||||||||||||||||||
| Foreign currency translation adjustment |
— | — | — | — | 12 | 12 | — | 12 | ||||||||||||||||||||||||
|
|
|
|||||||||||||||||||||||||||||||
| Total comprehensive loss |
(27,289 | ) | ||||||||||||||||||||||||||||||
|
|
|
|
|
|
|
|
|
|
|
|
|
|
|
|
|
|||||||||||||||||
| December 31, 2010 |
2,332,448 | $ | — | $ | 4,568 | $ | (73,789 | ) | $ | 19 | $ | (69,202 | ) | $ | 1,427 | $ | (67,775 | ) | ||||||||||||||
|
|
|
|
|
|
|
|
|
|
|
|
|
|
|
|
|
|||||||||||||||||
See accompanying notes to consolidated financial statements.
F-5
Table of Contents
ELEVANCE RENEWABLE SCIENCES, INC. & SUBSIDIARIES
Consolidated Statements of Cash Flows
(In thousands)
| Years Ended December 31, | ||||||||||||
| 2008 | 2009 | 2010 | ||||||||||
| Cash flows from operating activities: |
||||||||||||
| Net loss |
$ | (8,220 | ) | $ | (16,837 | ) | $ | (27,301 | ) | |||
| Adjustments to reconcile net loss to net cash used in operating activities: |
||||||||||||
| Depreciation and amortization |
1,692 | 2,009 | 2,116 | |||||||||
| Amortization of financing costs and accretion of debt discount |
— | 137 | 1,210 | |||||||||
| Unrealized (gain) loss on preferred stock warrant |
(1,787 | ) | (652 | ) | 4,506 | |||||||
| Share-based compensation expense |
328 | 218 | 293 | |||||||||
| Noncash interest expense |
— | 299 | 3,203 | |||||||||
| Other noncash charges |
68 | (62 | ) | 3 | ||||||||
| Changes in operating assets and liabilities: |
||||||||||||
| Trade accounts receivable and due to related party |
248 | 206 | (823 | ) | ||||||||
| Inventories |
(137 | ) | (443 | ) | (2,013 | ) | ||||||
| Due from related party |
1,158 | — | — | |||||||||
| Other current assets |
1,314 | (814 | ) | 379 | ||||||||
| Other assets |
— | — | (202 | ) | ||||||||
| Accounts payable |
(802 | ) | (42 | ) | 1,189 | |||||||
| Other current liabilities |
737 | (28 | ) | 65 | ||||||||
| Other liabilities |
— | (12 | ) | 77 | ||||||||
|
|
|
|
|
|
|
|||||||
| Net cash used in operating activities |
$ | (5,401 | ) | $ | (16,021 | ) | $ | (17,298 | ) | |||
|
|
|
|
|
|
|
|||||||
| Cash flows from investing activities: |
||||||||||||
| Capital expenditures |
$ | (3,025 | ) | $ | (1,020 | ) | $ | (1,920 | ) | |||
| Purchases of long-term investments |
(260 | ) | — | — | ||||||||
| Sales/maturities of short-term investments |
17,065 | 3,185 | 262 | |||||||||
| Purchases of short-term investments |
— | (1,500 | ) | (41,048 | ) | |||||||
| Other |
— | (100 | ) | 61 | ||||||||
|
|
|
|
|
|
|
|||||||
| Net cash provided by (used in) investing activities |
$ | 13,780 | $ | 565 | $ | (42,645 | ) | |||||
|
|
|
|
|
|
|
|||||||
| Cash flows from financing activities: |
||||||||||||
| Proceeds from sale of convertible notes and warrants, net of deferred financing fees |
$ | — | $ | 9,907 | $ | 19,941 | ||||||
| Proceeds from issuance of Series B preferred stock, net of issuance costs |
3,770 | — | — | |||||||||
| Proceeds from issuance of Series C preferred stock, net of issuance costs |
— | — | 67,596 | |||||||||
| Noncontrolling interest investment in consolidated subsidiary |
— | — | 1,437 | |||||||||
| Other |
— | 90 | 70 | |||||||||
|
|
|
|
|
|
|
|||||||
| Net cash provided by financing activities |
$ | 3,770 | $ | 9,997 | $ | 89,044 | ||||||
| Effects of changes in exchange rates on cash and cash equivalents |
— | 5 | 7 | |||||||||
|
|
|
|
|
|
|
|||||||
| Net (decrease) increase in cash and cash equivalents |
12,149 | (5,454 | ) | 29,108 | ||||||||
| Cash at beginning of period |
862 | 13,011 | 7,557 | |||||||||
|
|
|
|
|
|
|
|||||||
| Cash and cash equivalents at end of period |
$ | 13,011 | $ | 7,557 | $ | 36,665 | ||||||
|
|
|
|
|
|
|
|||||||
| Supplemental disclosures of cash flow information: |
||||||||||||
| Supplemental disclosures of noncash investing and financing information: |
||||||||||||
| Additions to property and equipment under accounts payable and other current liabilities |
$ | 316 | $ | 313 | $ | 186 | ||||||
| Warrants issued in connection with sale of convertible notes |
— | 555 | 1,228 | |||||||||
| Conversion of convertible notes to Series B preferred stock |
— | — | 32,917 | |||||||||
| Conversion of preferred stock to common stock |
— | 11,388 | — | |||||||||
| Series C issuance costs under accounts payable and other current liabilities |
— | — | 425 | |||||||||
| Amortization of bond premium in other current assets |
— | — | 63 | |||||||||
See accompanying notes to consolidated financial statements.
F-6
Table of Contents
Notes to Consolidated Financial Statements
(In thousands, except per share data)
(1) Description of the Business
Elevance Renewable Sciences, Inc. (the Company or Elevance) produces high performance ingredients for use in personal care products, detergents, lubricants, and other specialty chemicals and fuel markets from natural oils using Nobel Prize-winning olefin metathesis technology.
Elevance is a Delaware corporation formed on November 20, 2007 to continue work started in 2004 in a collaborative project between Cargill, Inc. (Cargill), one of the world’s largest producers of agricultural oils, and Materia Inc. (Materia), a leading edge technology organization leveraging patents from the California Institute of Technology (Caltech), to commercialize the production of renewable chemicals. Cargill and Materia had previously entered into certain agreements between each other related to the license and development of olefin metathesis technology in furtherance of a joint business relationship (Metathesis Venture).
Elevance acquired the NatureWax business line carved out of Cargill’s Dressings, Sauces and Oils Business and the Metathesis Venture operated by Cargill on November 20, 2007. The acquired NatureWax business line develops, produces, and sells natural waxes derived from renewable oils. Elevance also acquired from Cargill and Materia technologies, inventions, know-how, trade secrets, intellectual property rights, and other assets developed pursuant to the Metathesis Venture. The Company also acquired license rights with respect to certain other intellectual property rights, inventions, know-how, and trade secrets owned by or licensed to Materia. TPG Star L.P. (TPG Star) and TPG Biotechnology Partners II, L.P. (TPG Biotech) contributed $45,000 in cash for a majority equity interest in the Company.
In June 2010, the Company entered into an agreement to form a joint venture with KOG Investments Pte Ltd, a wholly owned subsidiary of Wilmar International Limited (Wilmar), one of the largest global agribusiness groups, to construct, own, and operate a biorefinery in Indonesia (note 2).
In December 2010, the Company raised $100,000 in additional equity, $70,000 through the sale of additional preferred shares and $30,000 through the conversion of long-term debt. Naxos Capital Partners S.C.A. SICAR, a Luxembourg-based private equity group, led the round with additional new investors including Total Energy Ventures International, the venture capital arm of French oil and gas company Total, joining TPG Star and TPG Biotech in the financing. The proceeds will support the Company’s growth, including expansion and creation of biorefineries in Asia, North America, and South America.
(2) Summary of Significant Accounting Policies
(a) Basis of Presentation
The accompanying consolidated financial statements have been prepared in accordance with accounting principles generally accepted in the United States of America (GAAP).
(b) Use of Estimates
The preparation of consolidated financial statements in conformity with GAAP requires management to make estimates and assumptions that affect the amounts reported in the consolidated financial statements and notes thereto. Actual results could differ from those estimates.
(c) Consolidation and Translation
The consolidated financial statements include the accounts of Elevance Renewable Sciences, Inc., Elevance Renewable Sciences Canada, Wilmar-Elevance 1 Pte. Ltd., and Wilmar-Elevance 2 Pte. Ltd. The Company consolidates investments that meet the criteria of a variable interest entity where the Company is deemed to be the primary beneficiary for accounting purposes and for entities in which the Company has a majority voting interest. Intercompany transactions and accounts are eliminated from the consolidated financial statements.
F-7
Table of Contents
The assets and liabilities of foreign subsidiaries are translated to U.S. dollars at end-of-period exchange rates. Revenues and expenses are translated at average rates for the period. Translation adjustments are reported as a component of accumulated other comprehensive income in shareholders’ deficit.
In June 2010, the Company acquired a 50% interest in Wilmar-Elevance 1 Pte. Ltd. and Wilmar-Elevance 2 Pte. Ltd., Singapore joint venture companies formed by the Company and KOG Investments Pte. Ltd., a wholly owned subsidiary of Wilmar, a Singapore company, to construct, own, and operate an integrated biorefinery in Indonesia, which is currently under construction. The Company determined that the joint venture companies were variable interest entities due to the voting rights of some investors not being proportionate to their rights to receive the expected returns of the entities and that substantially all of the entities’ activities involve the Company. Further, the Company determined that it is the primary beneficiary of the entities for accounting purposes as it has the ability to control the marketing of the specialty chemicals manufactured by the joint venture and the rights to incremental profits of the joint venture. As a result, the Company consolidates the entities in the consolidated financial statements, intercompany transactions are eliminated, and the interest that is not owned by the Company is presented as a noncontrolling interest in the consolidated balance sheets. The Company’s consolidated balance sheet includes cash in the amounts of $2,361 and property and equipment of $520 as of December 31, 2010. The assets of the joint venture will be used to construct the integrated biorefinery and are not available for general corporate purposes.
(d) Revenue Recognition
Product Sales
Revenue is recognized when there is persuasive evidence of an arrangement, the price is fixed or determinable, collectibility is reasonably assured, and shipment has occurred. Revenue is recognized upon the transfer of title and risk of loss to the customer, which generally coincides with delivery of the product to the customer either at the shipping point or at the customer’s destination depending on the terms agreed with the customer. The Company’s sales terms provide no right of return outside the Company’s standard warranty policy. Shipping and handling fees charged to customers are included in product revenues and related costs are included as a component of cost of product sales.
Grants
Grants are agreements that generally provide cost reimbursement for certain types of expenditures over a contractually defined period. Revenues from grants are recognized in the period during which the related costs are incurred, provided that the conditions under which the grants were made have been met and only perfunctory obligations are outstanding.
(e) Concentration of Risks
The Company does not enter into investments for trading or speculative purposes. Some of the securities in which the Company invests, however, may be subject to market risk as a change in prevailing interest rates may cause the principal amount of the investment to fluctuate. To minimize this risk, the Company maintains its portfolio of cash equivalents and short-term investments in a variety of securities, including commercial paper, money market funds, debt securities, and certificates of deposit. Due to the short-term nature of these investments, the Company believes that the Company does not have significant exposure to changes in the fair value of these instruments as a result of changes in interest rates.
The Company sold 94%, 92%, and 85% of its products in the United States during the years ended December 31, 2008, 2009 and 2010, respectively. In the United States, the Company sells products directly to manufacturers and distributors. Outside of the United States, the Company’s products are sold directly to manufacturers and through brokers.
F-8
Table of Contents
Customers representing greater than 10% of revenues were as follows (in percentages):
| Years
Ended December 31, |
||||||||||||
| Customers |
2008 | 2009 | 2010 | |||||||||
| Customer A |
19 | * | * | |||||||||
| Customer B |
13 | 21 | 14 | |||||||||
| Customer C |
* | 16 | 10 | |||||||||
| Customer D |
* | * | 11 | |||||||||
| Customer E |
* | * | 11 | |||||||||
| Customer F |
* | * | 16 | |||||||||
| * | Less than 10 percent |
Customers representing greater than 10% of accounts receivable were as follows (in percentages):
| December 31, | ||||||||
| Customers Accounts Receivable |
2009 | 2010 | ||||||
| Customer B |
27 | 29 | ||||||
| Customer C |
14 | * | ||||||
| Customer D |
* | 13 | ||||||
| Customer E |
* | 13 | ||||||
| Customer G |
12 | * | ||||||
| * | Less than 10 percent |
The Company manufactures the majority of its products through contract manufacturing arrangements with third parties throughout the United States. The products are primarily made at various Cargill locations throughout the United States. Cargill manufactured 99%, 94% and 76% of the Company’s products sold during the years ended December 31, 2008, 2009 and 2010, respectively. The Company believes that there are sufficient other suppliers that could manufacture the products on behalf of the Company.
The Company purchases 100% of its metathesis catalyst from Materia. Elevance has rights to the catalyst technology, which has been put into escrow in the event Materia is unable to provide the catalyst.
(f) Research and Development
All research and development costs are expensed as incurred. Research and development expenses include costs for salaries, employee benefits, subcontractors, facility related expenses, depreciation, and share-based compensation related to employees and nonemployees involved in the Company’s research and development activities.
The Company defers and capitalizes nonrefundable advance payments for services to be received in future research and development activities as other current assets in the consolidated balance sheets and expenses those payments when the services are performed.
(g) Costs of Start-Up Activities
Start-up activities are defined as those one-time activities related to opening a new facility, commencing a new operation, or activities related to organizing a new entity. All the costs associated with such activities are expensed, until the results of such activities are considered viable by management, at which time these costs would be considered for capitalization based on authoritative accounting literature.
F-9
Table of Contents
(h) Intellectual Property
The Company expenses all costs associated with the prosecution and maintenance of patents within sales, general, and administrative expenses in the consolidated statements of operations as incurred.
(i) Comprehensive Loss
Comprehensive loss is comprised of net loss and foreign currency translation adjustments.
(j) Income Taxes
The Company applies the asset and liability method for accounting for income taxes. Deferred tax assets and liabilities are recognized for future tax consequences attributable to differences between the financial statement carrying amounts of existing assets and liabilities and their respective tax bases and operating loss and tax credit carryforwards. Deferred tax assets and liabilities are measured using tax rates expected to apply to taxable income in the years in which those temporary differences are expected to be recovered or settled. The effect on deferred tax assets and liabilities of a change in tax rates is recognized in income in the period that includes the enactment date. Valuation allowances are recognized to reduce the deferred tax assets to the amount that is more likely than not to be realized. In assessing the likelihood of realization, management considers estimates of future taxable income.
The Company recognizes the effect of income tax positions only if those positions are more likely than not of being sustained. Recognized income tax positions are measured at the largest amount that is greater than 50% likely of being realized. Changes in recognition or measurement are reflected in the period in which the change in judgment occurs. The Company records interest related to unrecognized tax benefits in interest expense and penalties in selling, general, and administrative expenses.
(k) Cash and Cash Equivalents
Cash equivalents consist of short-term, highly liquid investments with original maturities of 90 days or less. The majority of cash and cash equivalents are held in bank checking accounts and certificates of deposit. Interest income is recorded on the accrual basis as earned. The Company’s cash and cash equivalents at December 31, 2009 and December 31, 2010 were unrestricted. The Company’s cash and cash equivalents are held for working capital and general corporate purposes. As of December 31, 2009 and 2010, all cash and cash equivalents were held in interest-bearing checking accounts, money market accounts, certificates of deposit, or commercial paper. The Company actively monitors changes in interest rates.
(l) Investments
As of December 31, 2009, the Company’s short-term investments consisted of a certificate of deposit with an original maturity of more than 90 days. As of December 31, 2010, the Company’s short-term investments consisted of investments in corporate bonds. The bonds are classified as held-to-maturity since the Company has the ability and intent to hold them until maturity. The bonds are reported at amortized cost, which is par value, plus or minus unamortized premium or discount. As of December 31, 2010, all of the bonds had maturity dates within one year.
(m) Trade Accounts Receivable and Allowance for Doubtful Accounts
Trade accounts receivable are recorded at invoiced amount less an allowance for doubtful accounts. On a regular basis, the Company evaluates outstanding trade accounts receivable and establishes the allowance for doubtful accounts based on a combination of specific customer circumstances as well as credit conditions and a history of write-offs and collections. The Company has no history of uncollectible trade receivables. The allowance for doubtful accounts was $0 as of December 31, 2009 and 2010.
F-10
Table of Contents
(n) Fair Value
The carrying amounts of certain financial instruments, including cash and cash equivalents, investments, accounts receivable, and accounts payable, approximate fair value due to their short maturities. Based on borrowing rates currently available to the Company for loans with similar terms, the carrying values of the financing obligations approximate their fair values.
Fair value is considered to be the price at which an asset could be exchanged or a liability transferred (an exit price) in an orderly transaction between knowledgeable, willing parties in the principal or most advantageous market for the asset or liability. Where available, fair value is based on or derived from observable market prices or other observable inputs. Where observable prices or inputs are not available, valuation models are applied. These valuation models involve some level of management estimation and judgment, the degree of which is dependent on the price transparency or market for the instruments and the instruments’ complexity.
(o) Inventories
Inventories are carried at the lower of cost or market, using the first-in, first-out method and include material and contract manufacturing costs.
(p) Deferred Financing Costs
Deferred financing costs incurred in connection with the issuance of debt are amortized over the life of the debt using the effective interest rate method with amortization of such costs charged to interest expense. Deferred financing costs, net of accumulated amortization, are classified in other current assets in the consolidated balance sheets.
(q) Property and Equipment, Net
Property and equipment is stated at cost less accumulated depreciation. Depreciation is computed using the straight-line method over the following useful lives:
| Lab equipment |
7 years | |
| Computer software and hardware |
3 years | |
| Furniture and fixtures |
10 years | |
| Leasehold improvements |
10 years |
Leasehold improvements are depreciated over the shorter of their estimated useful lives or the remaining lease term. Repair and maintenance costs are charged to expense as incurred.
(r) Goodwill
Goodwill represents the excess of the aggregate purchase price over the fair value of the net assets acquired in a businesses combination. Goodwill is reviewed for impairment at least annually. The goodwill impairment test is a two-step test. Under the first step, the fair value of the reporting unit is compared with its carrying value (including goodwill). If the fair value of the reporting unit is less than its carrying value, an indication of goodwill impairment exists for the reporting unit and the enterprise must perform step two of the impairment test. Under step two, an impairment loss is recognized for any excess of the carrying amount of the reporting unit’s goodwill over the implied fair value of that goodwill. The implied fair value of goodwill is determined by allocating the fair value of the reporting unit in a manner similar to a purchase price allocation, in accordance with business combination rules. The residual fair value after this allocation is the implied fair value of the reporting unit goodwill. Fair value of the reporting unit is determined using a discounted cash flow analysis. If the fair value of the reporting unit exceeds its carrying value, step two does not need to be performed.
F-11
Table of Contents
The Company performs its annual impairment test of goodwill at October 1st (the first day of its fourth fiscal quarter), and when a triggering event occurs between annual impairment tests.
(s) Intangible Assets
Intangible assets are initially valued at fair value upon acquisition. Intangible assets with definite lives are amortized over their estimated useful lives. Amortization of the Company’s definite-lived intangible assets is computed using the straight-line method over the estimated useful lives of the assets, which are as follows:
| Developed technology |
12 – 17 years | |
| Customer relationships |
10 years | |
| Trademarks |
10 years | |
| Noncompete agreement |
5 years | |
| Catalyst supply agreement |
10 years | |
| Other intangibles |
10 years |
(t) Recoverability of Long-Lived Assets
Long-lived assets, such as property and equipment, and purchased intangible assets subject to amortization, are reviewed for impairment whenever events or changes in circumstances indicate that the carrying amount of an asset may not be recoverable. If circumstances require a long-lived asset or asset group be tested for possible impairment, the Company first compares undiscounted cash flows expected to be generated by that asset or asset group to its carrying value. If the carrying value of the long-lived asset or asset group is not recoverable on an undiscounted cash flow basis, an impairment loss is recognized to the extent that the carrying value exceeds its fair value. Fair value is determined through various valuation techniques including discounted cash flow models, quoted market values, and third-party independent appraisals, as considered necessary.
(u) Convertible Preferred Stock
Holders of the Company’s Series B and Series C convertible preferred shares (Series B and Series C), voting together, control the vote of the Company’s shareholders and board of directors. Since a liquidation event could be caused by a vote of the Series B and Series C shareholders, the Company has elected to classify the preferred stock in the consolidated balance sheets as mezzanine equity between liabilities and shareholders’ deficit. The convertible preferred stock is recorded at fair value on the dates of issuance, net of issuance costs.
(v) Convertible Preferred Stock Warrants
The Company has classified warrants to acquire preferred stock as liabilities on the consolidated balance sheets under other liabilities. Preferred stock warrants are marked-to-market as of each balance sheet date and the corresponding change in fair value is recognized separately in the consolidated statements of operations.
(w) Share-Based Compensation
Share-based compensation cost is measured at the fair value of the award on the grant date and recognized on a straight-line basis over the requisite service period. Excess tax benefits related to stock option exercises are reflected as financing cash inflows.
The fair value of each award is estimated on the grant date using the Black-Scholes option pricing model. The Company uses the simplified method to calculate the expected term of the options. The Company records forfeitures as they occur during the vesting period. Since the Company’s shares are not publicly traded and its shares have not traded privately, expected volatility is computed based on the average historical and implied volatility of similar entities with publicly traded shares. The risk-free rate for the expected term of the option is based on the U.S. Treasury yield curve in effect at the time of grant.
F-12
Table of Contents
(x) Net Loss per Share Attributable to Elevance Renewable Sciences, Inc. Common Shareholders
Basic net loss per share attributable to Elevance Renewable Sciences, Inc. common shareholders is computed by dividing the Company’s net loss attributable to Elevance Renewable Sciences, Inc. common shareholders by the weighted-average number of common shares used in the loss per share calculation during the period. Diluted net loss per share attributable to Elevance Renewable Sciences, Inc. common shareholders is computed by giving effect to all potentially dilutive securities, including stock options, warrants and convertible preferred stock. Basic and diluted net loss per share attribute to Elevance Renewable Sciences, Inc. common shareholders was the same for all periods presented as the inclusion of all potentially dilutive securities outstanding was anti-dilutive.
The following table summarizes the Company’s calculation of historical basic and diluted net loss per share attributable to Elevance Renewable Sciences, Inc. common shareholders (in thousands, except share and per share amounts):
| Years Ended December 31, | ||||||||||||
| 2008 | 2009 | 2010 | ||||||||||
| Actual |
||||||||||||
| Numerator: |
||||||||||||
| Net loss attributable to Elevance Renewable Sciences, Inc. common shareholders |
$ | (14,909 | ) | $ | (23,713 | ) | $ | (33,640 | ) | |||
|
|
|
|
|
|
|
|||||||
| Denominator: |
||||||||||||
| Weighted average number of common shares used in net loss per share calculation |
150,000 | 716,886 | 2,297,197 | |||||||||
| Net loss per share of common stock attributable to Elevance Renewable Sciences, Inc. shareholders, basic and diluted |
$ | (99.39 | ) | $ | (33.08 | ) | $ | (14.64 | ) | |||
|
|
|
|
|
|
|
|||||||
| Proforma |
||||||||||||
| Numerator: |
||||||||||||
| Net loss attributable to Elevance Renewable Sciences, Inc. common stockholders |
$ | (33,640 | ) | |||||||||
| Add back: loss on change in fair value of warrant liabilities (unaudited) |
4,506 | |||||||||||
|
|
|
|||||||||||
| Net loss used in computing pro forma net loss per share of common stock attributable to Elevance Renewable Sciences, Inc. shareholders, basic and diluted (unaudited) |
$ | (29,134 | ) | |||||||||
|
|
|
|||||||||||
| Denominator: |
||||||||||||
| Basic and diluted weighted average common shares, as used above |
2,297,197 | |||||||||||
| Add: pro forma adjustment to reflect weighted-average of assumed conversion of convertible preferred stock |
5,732,774 | |||||||||||
| Weighted-average shares used in computing pro forma basis and diluted net loss per common share |
8,029,971 | |||||||||||
| Pro forma net loss per share of common stock attributable to Elevance Renewable Sciences, Inc. shareholders, basic and diluted (unaudited) |
$ | (3.63 | ) | |||||||||
|
|
|
|||||||||||
F-13
Table of Contents
The following potentially dilutive securities were excluded from the calculation of diluted net loss per share attributable to Elevance Renewable Sciences, Inc. common shareholders during the periods presented because including them would have been antidilutive:
| Years Ended December 31, | ||||||||||||
| 2008 | 2009 | 2010 | ||||||||||
| Convertible preferred stock1 |
5,485,940 | 5,061,868 | 14,480,358 | |||||||||
| Warrants to purchase common stock (as converted basis)1 |
4,499,438 | 4,893,139 | 5,680,541 | |||||||||
| Outstanding stock options to purchase common stock (at period end) |
936,491 | 1,046,302 | 1,722,789 | |||||||||
|
|
|
|
|
|
|
|||||||
| Total |
10,921,869 | 11,001,309 | 21,883,688 | |||||||||
|
|
|
|
|
|
|
|||||||
| (1) | The convertible preferred stock and convertible preferred stock warrants were computed on an as-converted basis using a one-to-one conversion rate for all series of preferred stock. |
(y) Segments
Operating segments are defined as components of an enterprise about which separate financial information is available that is evaluated regularly by the chief operating decision maker, in deciding how to allocate resources and in assessing performance. The Company’s chief operating decision maker is the Chief Executive Officer. The Chief Executive Officer reviews financial information presented on a consolidated basis. The Company has one business activity and there are no segment managers who are held accountable for operations, operating results beyond revenue goals or gross margins, or plans for levels or components below the consolidated unit level. Accordingly, the Company has a single reporting segment through December 31, 2010.
Revenues by geography are based on the billing address of the customer. The following table sets forth revenue and long-lived assets by geographic area (in thousands):
| Years Ended December 31, | ||||||||||||
| 2008 | 2009 | 2010 | ||||||||||
| Revenues |
||||||||||||
| United States |
$ | 17,534 | $ | 11,047 | $ | 18,205 | ||||||
| Foreign Countries |
1,379 | 1,139 | 2,983 | |||||||||
|
|
|
|
|
|
|
|||||||
| Total |
$ | 18,913 | $ | 12,186 | $ | 21,188 | ||||||
|
|
|
|
|
|
|
|||||||
| December 31, 2009 |
December 31, 2010 |
|||||||
| Long-Lived Assets |
||||||||
| United States |
$ | 20,335 | $ | 19,494 | ||||
| Indonesia |
— | 520 | ||||||
|
|
|
|
|
|||||
| Total |
$ | 20,335 | $ | 20,014 | ||||
|
|
|
|
|
|||||
(3) New Accounting Pronouncements
Accounting Standards Update (ASU) No. 2009-17 amends Financial Accounting Standards Board (FASB) Interpretation No. 46(R), Consolidation of Variable Interest Entities, regarding certain guidance for determining whether an entity is a variable interest entity and modifies the methods allowed for determining the primary beneficiary of a variable interest entity. The amendments include: (1) a new approach for determining who should consolidate a variable-interest entity; (2) changes to when it is necessary to reassess who should
F-14
Table of Contents
consolidate a variable-interest entity; and (3) enhanced disclosure requirements about an entity’s involvement in a variable interest entity. ASU 2009-17 is effective for the first annual reporting period beginning after November 15, 2009, with earlier adoption prohibited. The adoption of ASU 2009-17 on January 1, 2010 did not have a material impact on the Company’s consolidated financial statements.
ASU No. 2010-06, Improving Disclosures about Fair Value Measurements, requires new disclosures regarding recurring or nonrecurring fair value measurements. Entities will be required to separately disclose significant transfers into and out of Level 1 and Level 2 measurements in the fair value hierarchy and describe the reasons for the transfers. Entities are required to provide information on purchases, sales, issuances and settlements on a gross basis in the reconciliation of Level 3 fair value measurements. In addition, entities must provide fair value measurement disclosures for each class of assets and liabilities, and disclosures about the valuation techniques used in determining fair value for Level 2 or Level 3 measurements. ASU 2010-06 is effective for interim and annual reporting periods beginning after December 15, 2009, except for the gross basis reconciliation for the Level 3 fair value measurements, which is effective for fiscal years beginning after December 15, 2010. The adoption of ASU 2010-06 did not have a material impact on the Company’s consolidated financial statements.
(4) Liquidity
The Company incurred net losses of $8,220, $16,837, $27,291 and negative cash flows from operating activities of $5,401, $16,021, $17,298 for the years ended December 31, 2008, 2009 and 2010. The Company’s 2008, 2009 and 2010 net losses and cash used in operating activities were due principally to the Company’s strategic focus on research and development, intellectual property protection, construction of assets, and market and sales channel development.
(5) Commitments and Contingencies
(a) Leases
In 2008, the Company entered into a noncancelable operating lease for its office and lab facilities for an initial term of 10 years. In connection with the lease, the Company received a reimbursement for leasehold improvements of $220. This reimbursement has been recorded as deferred rent and is being amortized on a straight-line basis over the 10-year lease term.
Minimum rent payments under operating leases are recognized on a straight-line basis over the term of the lease. Rent expense (including maintenance charges) for the years ended December 31, 2008, 2009 and 2010 was $197, $144 and $176, respectively.
Future minimum lease payments under noncancelable operating leases (with initial or remaining lease terms in excess of one year) as of December 31, 2010 are:
| Minimum Lease Payments |
||||
| Year ending December 31: |
||||
| 2011 |
$ | 138 | ||
| 2012 |
141 | |||
| 2013 |
144 | |||
| 2014 |
145 | |||
| 2015 |
148 | |||
| Later years, through 2018 |
468 | |||
|
|
|
|||
| Total minimum lease payments |
$ | 1,184 | ||
|
|
|
|||
F-15
Table of Contents
(b) Indemnification Guarantees
The Company recognizes the fair value of guarantee and indemnification arrangements issued or modified by the Company, if these arrangements are within the scope of the applicable authoritative guidance. In addition, the Company monitors the conditions that are subject to the guarantees and indemnifications in order to identify if a loss has occurred. If the Company determines that it is probable that a loss has occurred, then any such estimable loss would be recognized under those guarantees and indemnifications.
Under certain contractual arrangements with Cargill, Materia, and other third parties, the Company has agreed to indemnify, defend, and hold harmless licensees of our intellectual property from and against certain losses, damages, and costs arising from claims alleging infringements of the intellectual property rights of a third party. Historically, the Company has not been required to pay any amounts under these provisions as there have been no claims asserted under these provisions, and accordingly, the Company has not recorded a liability relating to such provisions.
(c) Legal Proceedings
The Company may be involved, from time to time, in legal proceedings and claims arising in the ordinary course of its business. Such matters are subject to many uncertainties and outcomes are not predictable with assurance. The Company accrues amounts, to the extent they can be reasonably estimated, that it believes are adequate to address any liabilities related to legal proceedings and other loss contingencies that the Company believes will result in a probable loss. While there can be no assurances as to the ultimate outcome of any legal proceeding or other loss contingency involving the Company, management does not believe any pending matter will be resolved in a manner that would have a material adverse effect on the Company’s consolidated financial position, results of operations, or cash flows.
(6) Investments
At December 31, 2009, the Company’s short-term investments consisted of a certificate of deposit with an original maturity in excess of 90 days. At December 31, 2010, the Company’s short-term investments consisted of investments in corporate bonds with maturities dates within one year. As of December 31, 2010, the amortized cost of the corporate bonds was $40,693, which approximated the fair value of the bonds.
The Company had a $260 certificate of deposit as of December 31, 2009 and 2010, which was restricted as collateral for a letter of credit and is presented in investments in the consolidated balance sheets.
The Company’s cash and cash equivalents and investments earned $100, $25 and $8 in dividends and $515, $38 and $11 in interest during the years ended December 31, 2008, 2009 and 2010, respectively. Dividends and interest income are classified as other income, net in the consolidated statements of operations.
(7) Inventories
Inventories on hand consisted of the following:
| December 31, | ||||||||
| 2009 | 2010 | |||||||
| Raw materials |
$ | 45 | $ | 2,190 | ||||
| Finished goods |
535 | 404 | ||||||
|
|
|
|
|
|||||
| $ | 580 | $ | 2,594 | |||||
|
|
|
|
|
|||||
F-16
Table of Contents
(8) Property and Equipment
Property and equipment consisted of the following at December 31, 2009 and 2010:
| 2009 | 2010 | |||||||
| Lab equipment |
$ | 625 | $ | 1,297 | ||||
| Computer software and hardware |
551 | 592 | ||||||
| Furniture and fixtures |
534 | 586 | ||||||
| Leasehold improvements |
2,067 | 2,454 | ||||||
| Construction in progress |
658 | 1,301 | ||||||
|
|
|
|
|
|||||
| Property and equipment, at cost |
4,435 | 6,230 | ||||||
| Less accumulated depreciation |
(690 | ) | (1,298 | ) | ||||
|
|
|
|
|
|||||
| Property and equipment, net |
$ | 3,745 | $ | 4,932 | ||||
|
|
|
|
|
|||||
Depreciation expense for the years ended December 31, 2008, 2009 and 2010 was $186, $503, and $611, respectively.
The Company’s history of operating losses required the Company to review property and equipment for impairment in 2008, 2009 and 2010. No impairment loss was recorded as a result of the reviews.
(9) Goodwill and Intangible Assets
Intangible assets as of December 31, 2009 and 2010 were as follows:
| December 31, 2009 | ||||||||||||
| Gross Carrying Amount |
Accumulated Amortization |
Net Intangible Amount |
||||||||||
| Developed technology |
$ | 11,230 | $ | 1,497 | $ | 9,733 | ||||||
| Customer relationships |
4,180 | 882 | 3,298 | |||||||||
| Trademarks |
1,740 | 367 | 1,373 | |||||||||
| Noncompete agreement |
600 | 253 | 347 | |||||||||
| Catalyst supply agreement |
810 | 171 | 639 | |||||||||
| Other intangibles |
40 | 8 | 32 | |||||||||
|
|
|
|
|
|
|
|||||||
| Total |
$ | 18,600 | $ | 3,178 | $ | 15,422 | ||||||
|
|
|
|
|
|
|
|||||||
| December 31, 2010 | ||||||||||||
| Gross Carrying Amount |
Accumulated Amortization |
Net Intangible Amount |
||||||||||
| Developed technology |
$ | 11,230 | $ | 2,206 | $ | 9,024 | ||||||
| Customer relationships |
4,180 | 1,300 | 2,880 | |||||||||
| Trademarks |
1,740 | 541 | 1,199 | |||||||||
| Noncompete agreement |
600 | 373 | 227 | |||||||||
| Catalyst supply agreement |
810 | 252 | 558 | |||||||||
| Other intangibles |
40 | 12 | 28 | |||||||||
|
|
|
|
|
|
|
|||||||
| Total |
$ | 18,600 | $ | 4,684 | $ | 13,916 | ||||||
|
|
|
|
|
|
|
|||||||
The intangible assets have definite lives and are amortized on a straight-line basis over their estimated useful lives (5 to 17 years, weighted average of 14 years). Intangible asset amortization expense was $1,506 for each of the years ended December 31, 2008, 2009 and 2010. Intangible asset amortization for each of the five succeeding fiscal years is estimated at $1,506 for 2011, $1,493 for 2012, and $1,386 for each of 2013, 2014, and 2015.
F-17
Table of Contents
The Company’s history of operating losses required the Company to review intangible assets for impairment in 2009 and 2010. No impairment loss was recorded as a result of the reviews.
The Company comprises a single reporting unit. During 2009 and 2010, the Company performed its annual goodwill impairment testing and determined that goodwill was not impaired. There have been no impairments of goodwill through December 31, 2010.
(10) Debt
On October 19, 2009, March 5, 2010, and August 6, 2010 the Company entered into three financing arrangements whereby the Company received $10,000 on each occasion in exchange for the issuance of $10,000 face value convertible notes (Notes) and stock purchase warrants (Warrants) for total proceeds of $30,000 in financing. The Notes accrued interest at 15% per annum compounded quarterly and were scheduled to mature on October 19, 2010, October 19, 2010, and August 6, 2011, respectively. The Notes were secured by a first lien position on substantially all of the assets of the Company. During 2010, the maturity date of the Notes due on October 19, 2010 was extended to December 31, 2010 and interest continued to accrue through the new maturity date. The aggregate Series B preferred shares issuable upon exercise of the Warrants sold with the Notes is equal to $10,500 divided by $8.89.
In connection with the issuance of the Notes, the Company incurred financing costs of $152, which were deferred and recognized in interest expense in the consolidated statements of operations using the effective interest rate method over the life of the Notes. As of December 31, 2009, deferred financing costs related to the Notes of $74 were classified as other current assets and $300 of accrued interest was included in the carrying value of the Notes in the consolidated balance sheet.
The Company determined that the Warrants issued in these financing arrangements were detachable from the Notes and were required to be classified as liabilities and marked-to-market as of each balance sheet date with the corresponding change in fair value recognized in the consolidated statements of operations. The proceeds received in the financing arrangements were allocated between the Notes and the Warrants using the residual method, whereby the proceeds equal to the fair value of the Warrants on the issuance date were allocated to the Warrants with the residual proceeds assigned to the Notes. The total fair value of the Warrants sold with the Notes was $1,783, which was recorded as a discount on the Notes. The discount is recognized in interest expense in the consolidated statements of operations over the life of the Notes using the effective interest rate method.
On December 6, 2010, the Notes were converted into 3,768,772 shares of Series B Preferred Stock at the election of the holders. The total carrying amounts of the Notes, including the face value of the Notes, accrued interest, unamortized discounts, and issuance costs were credited to the Series B Preferred Stock upon conversion.
(11) Research and Development Arrangements
The Company entered into an arrangement with Tetramer Technologies LLC (Tetramer) to perform certain research and development activities. As part of this agreement, the Company committed funding of at least $1,000 to Tetramer. The Company paid Tetramer $500 and $838 under the agreement in 2009 and 2010, respectively. The payments, which were expensed as services were provided, are included in research and development expenses in the Company’s consolidated statements of operations. The Company may also owe certain royalty payments on commercial application of the research. To date, the Company has not recorded any royalties related to this arrangement.
The Company entered into three separate research and development agreements which required the Company to fund $234 Canadian dollars and $125 U.S. dollars in 2009 and $234 Canadian dollars and $413 U.S. dollars in 2010. The Company is also required to fund $200 Canadian dollars each year from 2011 to 2013. The Company may also owe certain royalty payments on commercial application of some technology in exchange for rights to intellectual property or an exclusive license to use technology from the research arrangements.
F-18
Table of Contents
(12) Government Grants
The Company was awarded a $2,500 grant from the U.S. Department of Energy under the Recovery Act for the design and engineering of an integrated pilot scale biorefinery (Grant). Under the Grant, the Company is required to fund $625 in cost sharing expenses. The Company’s obligation for this cost share is contingent on reimbursement for project costs incurred. As of December 31, 2010, the Company recognized $862 in government grant revenue related to the Grant. As of December 31, 2010, $93 in deferred revenue related to the Grant was classified in other liabilities on the Company’s consolidated balance sheet.
(13) Employee Benefit Plan
Elevance established a defined contribution plan (Investment Plan) on November 20, 2007. The Investment Plan permits eligible salaried and nonunion hourly employees to defer a portion of their compensation through payroll deductions and provides for matching contributions from the Company. For the years ended December 31, 2009 and 2010, Elevance matched 100% of the first 4% of the participants’ contributed pay, subject to Internal Revenue Service limits. Participant contributions, matching contributions, and the related earnings immediately vest. In addition, a discretionary feature of the plan allows the board of directors, at their sole discretion, to make contributions to employees on behalf of the Company. The Company reserves the right to amend, modify, or terminate the Elevance sponsored plans at any time subject to provisions of the Employee Retirement Security Act of 1974.
There were $73, $192 and $254 of costs recognized in the consolidated statements of operations for Company contributions to the Investment Plan for years ended December 31, 2008, 2009 and 2010, respectively.
(14) Fair Value Measurements
(a) Fair Value of Financial Instruments
The carrying amounts of the Company’s financial instruments, which include cash equivalents, accounts receivable, investments, accounts payable, convertible notes, other current liabilities, and stock purchase warrants, approximated their fair market values as of December 31, 2009 and 2010.
The fair values of the financial instruments represent management’s best estimates of the amounts that would be received upon sale of those assets or that would be paid to transfer those liabilities in an orderly transaction between market participants at that date. Those fair value measurements maximize the use of observable inputs. However, in situations where there is little, if any, market activity for the asset or liability at the measurement date, the fair value measurement reflects the Company’s own judgments about the assumptions that market participants would use in pricing the asset or liability. Those judgments are developed by the Company based on the best information available in the circumstances.
The following methods and assumptions were used to estimate the fair value of each class of financial instruments:
| • | Cash equivalents, accounts receivable, investments, accounts payable, convertible notes, and certain current liabilities: The carrying amounts, at face value or cost plus accrued interest, approximate fair value because of the short maturity of these instruments. |
| • | At December 31, 2009, the fair value of the Series B warrants was determined by allocating the equity value of the Company among the securities comprising the Company’s capital structure using the option pricing method. The enterprise value of the Company was determined using a discounted cash flow method. |
| • | At December 31, 2010, the fair value of the Series B warrants was determined by allocating the equity value of the Company among the securities comprising the Company’s capital structure using the option pricing method. The enterprise value of the Company was determined using a discounted cash flow analysis and the implied value from recent financing rounds. |
F-19
Table of Contents
(b) Fair Value Hierarchy
The ASC establishes a fair value hierarchy that prioritizes the inputs to valuation techniques used to measure fair value. The hierarchy gives the highest priority to unadjusted quoted prices in active markets for identical assets or liabilities (Level 1 measurements) and the lowest priority to measurements involving significant unobservable inputs (Level 3 measurements). The three levels of the fair value hierarchy are as follows:
| • | Level 1 inputs are quoted prices (unadjusted) in active markets for identical assets or liabilities that the Company has the ability to access at the measurement date. |
| • | Level 2 inputs are inputs other than quoted prices included within Level 1 that are observable for the asset or liability, either directly or indirectly. |
| • | Level 3 inputs are unobservable inputs for the asset or liability. |
The level in the fair value hierarchy within which a fair value measurement in its entirety falls is based on the lowest level input that is significant to the fair value measurement in its entirety.
The following table presents assets and liabilities that are measured at fair value on a recurring basis (including items that are required to be measured at fair value and items for which the fair value option has been elected) at December 31, 2009 and 2010:
| Fair Value Measurements At Reporting Date Using |
||||||||||||
| Quoted Prices in Active Markets For Identical Assets (Level 1) |
Significant Other Observable Inputs (Level 2) |
Significant Unobservable Inputs (Level 3) |
||||||||||
| December 31, 2009: |
||||||||||||
| Liabilities: |
||||||||||||
| Other liabilities (warrants) |
$ | — | $ | — | $ | 6,443 | ||||||
| December 31, 2010: |
||||||||||||
| Liabilities: |
||||||||||||
| Other liabilities (warrants) |
$ | — | $ | — | $ | 12,177 | ||||||
The following table presents the Company’s activity for liabilities measured at fair value on a recurring basis using significant unobservable inputs (Level 3) for the years ended December 31, 2008, 2009 and 2010:
| Other Liability (Warrants) |
||||
| Balance at December 31, 2007 |
$ | 8,327 | ||
| Total realized and unrealized losses (or gains): |
||||
| Included in income |
(1,787 | ) | ||
| Purchases, issuances and settlements (net) |
— | |||
|
|
|
|||
| Balance at December 31, 2008 |
6,540 | |||
| Total realized and unrealized losses (or gains): |
||||
| Included in income |
(652 | ) | ||
| Purchases, issuance and settlements (net) |
555 | |||
|
|
|
|||
| Balance at December 31, 2009 |
6,443 | |||
| Total realized and unrealized losses (or gains): |
||||
| Included in income |
4,506 | |||
| Purchases, issuance and settlements (net) |
1,228 | |||
|
|
|
|||
| Balance at December 31, 2010 |
$ | 12,177 | ||
|
|
|
|||
F-20
Table of Contents
Unrealized gains included in income for the years ended December 31, 2008, 2009 and 2010 for liabilities measured at fair value on a recurring basis using significant unobservable inputs (Level 3) are as follows:
| Years Ended December 31 | ||||||||||||
| 2008 | 2009 | 2010 | ||||||||||
| Gain (loss) on change in fair value of warrants |
$ | 1,787 | $ | 652 | $ | (4,506 | ) | |||||
| Change in unrealized gains (losses) relating to liabilities still held at the reporting date |
1,787 | 652 | (4,506 | ) | ||||||||
(15) Income Taxes
Deferred tax assets consist primarily of net operating loss carryforwards related to U.S. federal and state taxes. Realization of future tax benefits related to these deferred tax assets is dependent on many factors, including the Company’s ability to generate future taxable income. Due to the Company’s history of operating losses, the Company has recorded a full valuation allowance against these assets. At December 31, 2010, the Company had net operating loss carryforwards of $42,819 and research and development credit carryforwards of $1,021. The Company’s net operating loss carryforwards will expire in varying amounts between 2028 and 2031 and the credit carryforwards will expire in varying amounts between 2030 and 2031.
The reconciliation of the federal statutory rate to the Company’s effective tax rate of zero percent for the years ended December 31, 2008, 2009 and 2010 is as follows:
| Years Ended December 31 | ||||||||||||
| 2008 | 2009 | 2010 | ||||||||||
| U.S. statutory rate |
35.0 | % | 35.0 | % | 35.0 | % | ||||||
| State income tax |
4.8 | 5.0 | 5.0 | |||||||||
| Other |
— | — | (2.0 | ) | ||||||||
| Change in valuation allowance |
(39.8 | ) | (40.0 | ) | (38.0 | ) | ||||||
|
|
|
|
|
|
|
|||||||
| Effective tax rate |
— | % | — | % | — | % | ||||||
|
|
|
|
|
|
|
|||||||
Significant tax effects of temporary differences that give rise to deferred tax liabilities and assets as of December 31, 2009 and 2010 were as follows:
| 2009 | 2010 | |||||||
| Deferred tax liabilities: |
||||||||
| Depreciation of property and equipment |
$ | 142 | $ | 111 | ||||
| Deferred tax assets: |
||||||||
| Net operating loss carryforwards |
10,619 | 17,511 | ||||||
| Stock purchase warrants |
2,561 | 4,840 | ||||||
| Amortization of intangible assets |
1,481 | 1,486 | ||||||
| Employee benefits |
639 | 781 | ||||||
| Other |
277 | 127 | ||||||
| Credit carryforwards |
80 | 1,142 | ||||||
|
|
|
|
|
|||||
| Subtotal |
15,657 | 25,887 | ||||||
| Valuation allowance |
(15,515 | ) | (25,776 | ) | ||||
|
|
|
|
|
|||||
| Total deferred tax assets |
142 | 111 | ||||||
|
|
|
|
|
|||||
| Net deferred tax assets |
$ | — | $ | — | ||||
|
|
|
|
|
|||||
As of December 31, 2009 and 2010, the Company had no liability recorded for unrecognized tax benefits. There are no tax-related interest and penalties recognized in the consolidated statements of operations.
F-21
Table of Contents
The Company files tax returns with the United States and Illinois. The tax years from 2007 to 2010 remain open to examination by the taxing jurisdictions to which the Company is subject. The Company is not aware of any examinations by taxing authorities affecting the Company.
The Company has not made any cash payments for income taxes since its inception.
(16) Convertible Preferred Stock
A summary of convertible preferred stock as of December 31, 2009 and December 31, 2010 is as follows:
| December 31, 2009 | ||||||||||||||||
| Shares Authorized |
Shares Issued and Outstanding |
Liquidation Amount |
Carrying Value |
|||||||||||||
| Series B |
14,348,735 | 5,061,868 | $ | 52,960 | $ | 47,991 | ||||||||||
| December 31, 2010 | ||||||||||||||||
| Shares Authorized |
Shares Issued and Outstanding |
Liquidation Amount |
Carrying Value |
|||||||||||||
| Series B |
18,600,000 | 8,830,640 | $ | 90,884 | $ | 86,873 | ||||||||||
| Series C |
7,200,000 | 5,649,718 | 70,384 | 67,556 | ||||||||||||
|
|
|
|
|
|
|
|
|
|||||||||
| Total |
25,800,000 | 14,480,358 | $ | 161,268 | $ | 154,429 | ||||||||||
|
|
|
|
|
|
|
|
|
|||||||||
The combined aggregate liquidation value of all preferred stock for each of the five years ending December 31, 2011 through 2015 is as follows:
| Liquidation value |
||||
| As of December 31: |
||||
| 2011 |
$ | 174,169 | ||
| 2012 |
188,103 | |||
| 2013 |
203,151 | |||
| 2014 |
219,403 | |||
| 2015 |
236,956 | |||
The following summarizes the Series A, Series B, and Series C convertible preferred stock activity for the years ended December 31, 2008, 2009 and 2010:
| Series A | Series B | Series C | ||||||||||||||||||||||
| Shares Issued and Outstanding |
Carrying Value |
Shares Issued and Outstanding |
Carrying Value |
Shares Issued and Outstanding |
Carrying Value |
|||||||||||||||||||
| Balance December 31, 2007 |
1,687,290 | $ | 5,232 | 5,061,868 | $ | 37,316 | — | $ | — | |||||||||||||||
| Issuance of preferred stock |
— | — | 424,072 | 3,770 | — | — | ||||||||||||||||||
| Series B accrued dividend and accretion |
— | — | — | 5,428 | — | — | ||||||||||||||||||
| Series A accretion |
— | 1,261 | — | — | — | — | ||||||||||||||||||
|
|
|
|
|
|
|
|
|
|
|
|
|
|||||||||||||
| Balance December 31, 2008 |
1,687,290 | 6,493 | 5,485,940 | 46,514 | — | — | ||||||||||||||||||
| Series B accrued dividend and accretion |
— | — | — | 5,751 | — | — | ||||||||||||||||||
| Series A accretion |
— | 1,125 | — | — | — | — | ||||||||||||||||||
| Conversion of preferred stock |
(1,687,290 | ) | (7,618 | ) | (424,072 | ) | (4,274 | ) | — | — | ||||||||||||||
|
|
|
|
|
|
|
|
|
|
|
|
|
|||||||||||||
| Balance December 31, 2009 |
— | — | 5,061,868 | 47,991 | — | — | ||||||||||||||||||
| Issuance of preferred stock |
— | — | — | — | 5,649,718 | 67,172 | ||||||||||||||||||
| Conversion of Notes |
— | — | 3,768,772 | 32,917 | — | — | ||||||||||||||||||
| Series C accrued dividend |
— | — | — | — | — | 384 | ||||||||||||||||||
| Series B accrued dividend and accretion |
— | — | — | 5,965 | — | — | ||||||||||||||||||
|
|
|
|
|
|
|
|
|
|
|
|
|
|||||||||||||
| Balance December 31, 2010 |
— | $ | — | 8,830,640 | $ | 86,873 | 5,649,718 | $ | 67,556 | |||||||||||||||
|
|
|
|
|
|
|
|
|
|
|
|
|
|||||||||||||
F-22
Table of Contents
During 2009, 1,687,290 shares of Series A convertible preferred stock were converted to common stock of the Company. As of December 31, 2009 and 2010, the Company did not have any Series A outstanding or available to be issued.
During 2010, the Company authorized and issued 7,200,000 and 5,649,718 shares, respectively, of Series C convertible preferred stock. The stock was issued at $12.39 per share, for gross proceeds of $70,000. The total direct costs related to the issuance of the Series C were $2,828.
Series A and Series B shareholders had the right to redeem their shares at their option between November 20, 2012 and November 20, 2013. The redemption price was $8.89 per share plus unpaid cumulative dividends and was payable in cash or common stock at the holder’s option. The redemption would have occurred in quarterly amounts of 1/12 of total shares over 12 quarters after the redemption request was received. The Series A redemption feature was forfeited when the Series A preferred stock was converted to common stock. Concurrent with the issuance of the Series C stock, the Series B stock was modified to eliminate this redemption feature. Prior to the conversion of the Series A stock and the modification of the Series B stock, the Company accreted the value of the Series A and Series B stock up to their respective redemption values using the effective interest method. As the liquidation, dissolution, or winding up of the Company is currently not probable, no accretion was recorded on the Series A and Series B stock subsequent to the conversion and modification, respectively.
The rights and preferences of the Series B and C convertible preferred stock are as follows:
Voting Rights
Each holder of outstanding shares of Series B and Series C convertible preferred stock shall be entitled, with respect to each outstanding share of preferred stock held, to the number of votes equal to the number of whole shares of common stock into which such outstanding share of preferred stock could be converted.
Dividends
Series B and Series C shareholders are entitled to receive a cumulative dividend payment of 8% per annum on their outstanding shares valued at a rate of $8.89 and $12.39 per share, respectively, with such amount to be adjusted for any stock splits, subdivisions, reverse stock splits, or combinations. The Company must pay the accrued dividend from all funds and assets legally available to pay such dividends whether or not declared by the board of directors in the event of a Qualified IPO (as defined in the Investor Rights Agreement), liquidation, sale, merger, or dissolution. Shareholders may elect to receive Series B or Series C preferred shares (as applicable) or common shares in lieu of a cash payment. The accrued, but undeclared cumulative dividends to Series B shareholders were $7,959 and $12,380 at December 31, 2009 and 2010, respectively, and to Series C shareholders were $384 at December 31, 2010.
Liquidation Rights
Upon any liquidation, dissolution, or winding up of the corporation, whether voluntary or involuntary, including transactions or events deemed to be a liquidation, dissolution, or winding up of the Company, the Series B and Series C have a liquidation preference of $8.89 and $12.39 per share, respectively, plus any accrued or declared and unpaid dividends.
Participation Rights
If there are any available funds and assets remaining after the payment or distribution to the shareholders of the Series B and Series C preferred stock of the full respective preferential amounts, then all such remaining available funds and assets shall be distributed among the holders of the Series B preferred stock, Series C preferred stock and common stock pro rata.
F-23
Table of Contents
Conversion
Each outstanding share of Series B and Series C convertible preferred stock is convertible to one share of common stock at any time at the option of the holder. The Series B and Series C automatically convert to common stock upon a Qualified IPO, or upon majority vote of Series B and Series C shareholders. The conversion ratio of Series B and Series C into common stock will be adjusted for the issue of additional shares of common stock as a dividend or other distribution on outstanding common stock, a stock split, a reverse stock split, reclassification, exchange and substitution, reorganizations, mergers and consolidations, or the sale of shares below the conversion price for the Series B and Series C shareholders. The adjustment enables the Series B and Series C shareholders to obtain the same number of shares or other compensation as they would have obtained had they held the common stock on the date that any of the above outlined events occurred. The conversion price of Series B and Series C to common stock is also subject to weighted average ratchet protection if share or share equivalents, as defined, are issued at a price lower than the then current conversion price.
(17) Warrants for Convertible Preferred Stock
As of December 31, 2009 and 2010, the Company had issued warrants on various dates to acquire up to 4,893,139 and 5,680,541 shares of the Series B convertible preferred stock, respectively, for $8.89 per share. The warrants are exercisable from the date of issuance and expire on August 6, 2018.
During the years ended December 31, 2009 and 2010, the Company recorded an unrealized gain of $652 and loss of $4,506, respectively, for the change in the fair value of the preferred stock warrants.
(18) Shareholders’ Deficit
As of December 31, 2010, the Company was authorized to issue 32,500,000 shares of common stock. Of the authorized common stock, 9,955,007 and 14,480,358 shares were designated for conversion of Series B and Series C as of December 31, 2009 and 2010, respectively. At December 31, 2009 and 2010, 1,200,000 and 3,067,069 shares, respectively, were reserved for issuance under the Company’s 2007 Equity Incentive Plan (the Plan). As of December 31, 2009 and 2010, the Company had issued and outstanding 2,261,362 and 2,332,448 of common shares, respectively. Of the common shares outstanding, 50,000 are restricted shares that may not be transferred to another party unless such shares are registered under the Securities Act of 1933.
Holders of common stock are entitled to one vote per share, and to receive dividends to the extent declared by the board of directors and, upon liquidation or dissolution, are entitled to receive all assets available for distribution to common stockholders. The holders have no preemptive or other subscription rights and there are no redemption or sinking fund provisions with respect to such shares. Common stock is subordinate to the preferred stock with respect to dividend rights and rights upon liquidation, winding up, and dissolution of the Company.
(19) Share-Based Compensation
In 2007, the Company adopted the 2007 Equity Incentive Plan (the 2007 Plan) Plan. As of December 31, 2009 and 2010, the Company reserved 1,200,000 and 3,067,069 shares, respectively, of common stock for issuance under the 2007 Plan. The 2007 Plan requires that options vest at a rate no less than twenty percent (20%) per year over five years from the grant date, and that the expiration date of the options is no later than the 10th anniversary of the date the option is granted. The awards granted during 2009 and 2010 vest over a four-year period. The Company plans to use authorized and unissued shares to satisfy share award exercises.
F-24
Table of Contents
The Company recorded compensation expense for the years ended December 31, 2008, 2009 and 2010 related to stock options issued under the 2007 Plan as follows:
| 2008 | 2009 | 2010 | ||||||||||
| Selling, general and administrative |
$ | 290 | $ | 172 | $ | 252 | ||||||
| Research and development |
38 | 46 | 41 | |||||||||
|
|
|
|
|
|
|
|||||||
| Total pre-tax compensation expense |
328 | 218 | 293 | |||||||||
| Tax benefit |
— | — | — | |||||||||
|
|
|
|
|
|
|
|||||||
| Total share-based compensation expense, net of tax |
$ | 328 | $ | 218 | $ | 293 | ||||||
|
|
|
|
|
|
|
|||||||
The following summarizes stock option activity under the 2007 Plan as of December 31, 2010 and the three years then ended:
| Shares Under Option | ||||||||||||||||||||
| Shares Available For Grant |
Number of Shares |
Weighted Average Exercise Price |
Weighted Average Remaining Contractual Term (in years) |
Aggregate Intrinsic Value |
||||||||||||||||
| January 1, 2008 |
1,000,000 | — | $ | — | $ | |||||||||||||||
| Authorized |
200,000 | — | — | |||||||||||||||||
| Granted |
(936,491 | ) | 936,491 | 2.12 | ||||||||||||||||
|
|
|
|
|
|||||||||||||||||
| December 31, 2008 |
263,509 | 936,491 | 2.12 | 9.3 | — | |||||||||||||||
| Granted |
(137,108 | ) | 137,108 | 2.12 | ||||||||||||||||
| Forfeited or expired |
27,297 | (27,297 | ) | 2.12 | ||||||||||||||||
|
|
|
|
|
|||||||||||||||||
| December 31, 2009 |
153,698 | 1,046,302 | 2.12 | 8.4 | — | |||||||||||||||
|
|
|
|
|
|||||||||||||||||
| Authorized |
1,867,069 | — | 2.12 | |||||||||||||||||
| Granted |
(681,837 | ) | 681,837 | 2.12 | ||||||||||||||||
| Forfeited or expired |
5,350 | (5,350 | ) | 2.12 | ||||||||||||||||
|
|
|
|
|
|||||||||||||||||
| December 31, 2010 |
1,344,280 | 1,722,789 | 2.12 | 7.4 | 34 | |||||||||||||||
|
|
|
|
|
|||||||||||||||||
| Exercisable at December 31, 2010 |
771,526 | 2.12 | 7.4 | 15 | ||||||||||||||||
The fair value of each option award is estimated on the date of grant using the Black-Scholes option pricing model. The following are the weighted average assumptions used in the model:
| 2008 | 2009 | 2010 | ||||||||||
| Dividend yield |
— | % | — | % | — | % | ||||||
| Weighted average volatility |
65 | % | 65 | % | 56 | % | ||||||
| Years until exercise |
5.72 - 6.08 | 6.08 | 6.08 | |||||||||
| Risk-free interest rate |
1.7 | % | 2.0 | % | 2.8 | % | ||||||
The weighted average grant date fair value of options granted during 2009 and 2010 was $0.67 and $0.13, respectively. At December 31, 2010, there was $480 of total unrecognized compensation cost related to nonvested share-based compensation arrangements granted under the 2007 Plan. That cost is expected to be recognized over a weighted average period of 1.74 years. The total fair value of options vested during the years ended December 31, 2009 and 2010 was $239 and $254, respectively. There have been no exercises of options granted under the 2007 Plan.
The terms of the share-based payments awarded to certain employees include rights to additional stock option awards upon issuance of the first 2,812,148 of Series B shares issued upon the exercise of the Series B warrants. These awards are required to be granted at fair value.
F-25
Table of Contents
(20) Related Party Transactions
Cargill, Caltech, and Materia are considered related parties due to their ownership interest in the Company. The Company has entered into transactions and agreements with Cargill and its subsidiaries and Materia, from time to time, and the Company expects to enter into additional transactions and agreements with Cargill and its subsidiaries and Materia in the future. Certain agreements and transactions with Cargill and its subsidiaries and with Materia and Caltech are described below.
(a) Cargill
Supply Agreement
In 2007, the Company entered into a Supply Agreement with Cargill (Supply Agreement) for a term of five years whereby Cargill supplies substantially all of the Company’s global supply requirements for bulk vegetable and animal based oils and fats and modified vegetable or animal based oils and fats. The Company is not obligated to purchase any specific quantity of products from Cargill during any given time period. If Cargill is unable to supply products at a competitive price, the Company may procure the products elsewhere. For the years ended December 31, 2008, 2009 and 2010, the Company purchased $14,047, $11,540 and $13,717, respectively, of products from Cargill and its subsidiaries. Included in accounts payable in the Company’s consolidated balance sheets as of December 31, 2009 and 2010 is $272 and $1,106, respectively, payable to Cargill for product purchases under the Supply Agreement.
Risk Management Program
The Company entered into a Risk Management Agreement with Cargill (Risk Management Agreement) whereby Cargill provides natural oil risk management services on the Company’s behalf. The agreement requires the purchase of any risk instruments to coincide with the Company’s 12 month forecasted normal sales and purchases of oil under the Supply Agreement, and is not intended to be speculative. The agreement is terminable by either party with 120 days notice. There were no amounts paid or received from Cargill as a result of the Risk Management Agreement (i.e. incremental to the amounts paid under the Supply Agreement) for the years ended December 31, 2009 and 2010.
Letter Agreement
Elevance and Cargill entered into an agreement (Letter Agreement) on February 8, 2008 to permit Cargill to engage in certain sales in Europe (which sales would otherwise be prohibited under the terms and conditions of the NatureWax Asset Purchase Agreement) in exchange for Cargill paying Elevance a royalty on such sales. The Company recorded royalty income of $188, $178 and $36 in the years ended December 31, 2008, 2009 and 2010, respectively, in relation to the Letter Agreement. The royalty is reflected as Product sales in the Company’s consolidated statements of operations. As of May 20, 2009, Elevance revoked the provisions of the Letter Agreement.
The Company was owed $66 and $2 from Cargill for royalty payments under the Letter Agreement as of December 31, 2009 and 2010, respectively, which is reflected in other current assets in the Company’s consolidated balance sheets.
(b) Materia
Joint Development Agreement
In 2007, the Company entered into a Joint Development Agreement (JDA) with Materia to conduct research for the purposes of developing and commercializing chemicals and other materials from natural oils. As part of
F-26
Table of Contents
the JDA, Elevance pays Materia for research costs. The term of the agreement is five years. The agreement is terminable by the Company on or after the first anniversary date. Research costs incurred by Materia and reimbursed by the Company were $2,880, $2,040 and $1,170 for the years ended December 31, 2008, 2009 and 2010, respectively, and is included in research and development expenses in the Company’s consolidated statements of operations. There were no amounts payable to Materia under the terms of the JDA included in the Company’s consolidated balance sheets as of December 31, 2009 and 2010.
Catalyst Supply Agreement
The Company entered into a catalyst supply agreement with Materia for an initial term of 10 years whereby Materia supplies Elevance with all its metathesis catalyst requirements. This supply agreement is renewable annually after the initial term at the Company’s option. During the years ended December 31, 2008, 2009 and 2010, the Company paid Materia $137, $600, and $1,311, respectively, under the catalyst supply agreement. Materia was owed $0 as of December 31, 2009 and 2010 under the catalyst supply agreement. As of December 31, 2009, the Company had prepaid for $600 of catalyst, which is included in other current assets in the consolidated balance sheet.
License Agreement
The Company entered into an exclusive license agreement with Materia on November 20, 2007, which among other things, allows for the Company to obtain exclusivity rights to certain intellectual property owned and licensed to Materia for the purpose of enabling the Company to develop and commercialize chemicals and materials derived from natural oils (License Agreement). The License Agreement is perpetual and requires the Company to make a payment of $250 to Materia in each of the first five years of the agreement to maintain exclusivity. After the fifth year of the agreement, the amount owed to Materia to retain exclusivity over the licensed technology will be determined using a formula based on payments made under the JDA, catalyst supply agreement, and the License Agreement. For the years ended December 31, 2008, 2009 and 2010, the Company made payments to Materia of $250 under the License Agreement. These payments are amortized as research and development expenses in the consolidated statements of operations over the twelve month period for which the payments relate. As of December 31, 2009 and 2010, the unamortized portion of the payments under the License Agreement was $222 and was included in other current assets in the Company’s consolidated balance sheets.
(21) Subsequent Events
In January 2011, the Company entered into a four year joint development agreement with XiMo Ltd (XiMo), a Swiss company, to develop uses for XiMo’s proprietary molybdenum and tungsten metathesis catalysts in the field of natural oils. Under the joint development agreement, the Company and XiMo will collaborate to engage in certain research undertaken by XiMo and funded by the Company. The Company made an initial payment to XiMo of 400 Swiss francs and will make exclusivity payments of 250 Swiss francs in the second and third years of the agreement. Additionally, the Company will make periodic additional payments to fund research activities undertaken by XiMo. The Company will have exclusive rights to use catalyst technology developed under the agreement in exchange for royalties paid to XiMo on commercial sales of products using the developed catalysts.
F-27
Table of Contents
UNAUDITED CONDENSED CONSOLIDATED FINANCIAL STATEMENTS
F-28
Table of Contents
ELEVANCE RENEWABLE SCIENCES, INC. & SUBSIDIARIES
Condensed Consolidated Balance Sheets
(In thousands, except share and per share amounts)
| December 31, 2010 |
September 30, 2011 |
|||||||
| (unaudited) | ||||||||
| Assets | ||||||||
| Current assets: |
||||||||
| Cash and cash equivalents |
$ | 36,665 | $ | 71,574 | ||||
| Short-term investments |
40,693 | 18,828 | ||||||
| Trade accounts receivable |
1,781 | 3,904 | ||||||
| Inventories |
2,594 | 4,692 | ||||||
| Prepaid expenses and other current assets |
1,140 | 2,709 | ||||||
|
|
|
|
|
|||||
| Total current assets |
82,873 | 101,707 | ||||||
| Investments |
260 | 1,470 | ||||||
| Property and equipment, net of accumulated depreciation of $1,298 and $2,092 at December 31, 2010 and September 30, 2011 |
4,932 | 28,915 | ||||||
| Intangible assets, net of accumulated amortization of $4,684 and $5,814 at December 31, 2010 and September 30, 2011 |
13,916 | 12,786 | ||||||
| Goodwill |
1,166 | 1,166 | ||||||
| Other assets |
243 | 153 | ||||||
|
|
|
|
|
|||||
| Total assets |
$ | 103,390 | $ | 146,197 | ||||
|
|
|
|
|
|||||
| Liabilities and Shareholders’ Deficit | ||||||||
| Current liabilities: |
||||||||
| Accounts payable |
$ | 1,115 | $ | 1,110 | ||||
| Due to related party |
1,106 | 2,220 | ||||||
| Debt due within one year |
7 | 7 | ||||||
| Accrued expenses |
1,892 | 5,374 | ||||||
| Other current liabilities |
23 | 23 | ||||||
|
|
|
|
|
|||||
| Total current liabilities |
4,143 | 8,714 | ||||||
|
|
|
|
|
|||||
| Noncurrent liabilities: |
||||||||
| Long-term debt |
93 | 100 | ||||||
| Convertible preferred stock warrant liability |
12,177 | 111,000 | ||||||
| Other liabilities |
323 | 1,161 | ||||||
|
|
|
|
|
|||||
| Total noncurrent liabilities |
12,593 | 112,261 | ||||||
|
|
|
|
|
|||||
| Total liabilities |
16,736 | 120,975 | ||||||
|
|
|
|
|
|||||
| Commitments and contingencies (note 4) |
||||||||
| Convertible preferred stock, $0.0001 par value. |
||||||||
| Authorized 25,800,000 and 28,900,000 shares as of December 31, 2010, and September 30, 2011, respectively; 14,480,358 and 17,054,096 shares issued and outstanding as of December 31, 2010 and September 30, 2011, respectively (aggregate liquidation value of $161,268 and $222,272 as of December 31, 2010 and September 30, 2011, respectively) |
154,429 | 215,335 | ||||||
| Elevance Renewable Sciences Inc. shareholders’ deficit: |
||||||||
| Common stock, $0.0001 par value. Authorized 32,500,000 shares and 34,500,000 as of December 31, 2010 and September 30, 2011, respectively; 2,332,448 and 2,437,820 shares issued and outstanding as of December 31, 2010 and September 30, 2011, respectively |
— | — | ||||||
| Additional paid-in capital |
4,568 | — | ||||||
| Accumulated other comprehensive income |
19 | 17 | ||||||
| Accumulated deficit |
(73,789 | ) | (200,483 | ) | ||||
|
|
|
|
|
|||||
| Total Elevance Renewable Sciences, Inc. shareholders’ deficit |
(69,202 | ) | (200,466 | ) | ||||
| Noncontrolling interest |
1,427 | 10,353 | ||||||
|
|
|
|
|
|||||
| Total deficit |
(67,775 | ) | (190,113 | ) | ||||
|
|
|
|
|
|||||
| Total liabilities and deficit |
$ | 103,390 | $ | 146,197 | ||||
|
|
|
|
|
|||||
See accompanying notes to consolidated financial statements.
F-29
Table of Contents
ELEVANCE RENEWABLE SCIENCES, INC. & SUBSIDIARIES
Condensed Consolidated Statements of Operations
(In thousands, except share and per share amounts)
| Nine Months Ended September 30, | ||||||||
| 2010 | 2011 | |||||||
| (unaudited) | ||||||||
| Product sales |
$ | 13,303 | $ | 16,319 | ||||
| Other revenue |
— | 903 | ||||||
| Grants |
732 | 604 | ||||||
|
|
|
|
|
|||||
| Total revenues |
14,035 | 17,826 | ||||||
|
|
|
|
|
|||||
| Operating expenses: |
||||||||
| Cost of product sales |
11,603 | 16,751 | ||||||
| Cost of other revenue |
— | 628 | ||||||
| Sales, general, and administrative |
8,457 | 15,260 | ||||||
| Research and development |
6,728 | 6,383 | ||||||
| Intangible asset amortization |
1,129 | 1,129 | ||||||
|
|
|
|
|
|||||
| Total operating expenses |
27,917 | 40,151 | ||||||
|
|
|
|
|
|||||
| Loss from operations |
(13,882 | ) | (22,325 | ) | ||||
| Loss on change in fair value of warrants |
(3,172 | ) | (98,823 | ) | ||||
| Interest expense |
(3,289 | ) | — | |||||
| Other income, net |
4 | 21 | ||||||
|
|
|
|
|
|||||
| Loss before income taxes |
(20,339 | ) | (121,127 | ) | ||||
| Income taxes |
— | — | ||||||
|
|
|
|
|
|||||
| Net loss |
(20,339 | ) | (121,127 | ) | ||||
| Less gain attributable to the noncontrolling interest |
1 | 82 | ||||||
|
|
|
|
|
|||||
| Net loss attributable to Elevance Renewable Sciences, Inc. |
(20,338 | ) | (121,045 | ) | ||||
| Less accretion on Series A and B preferred stock and cumulative dividends on Series B, C and D preferred stock |
(4,409 | ) | (10,731 | ) | ||||
|
|
|
|
|
|||||
| Net loss available to Elevance Renewable Sciences, Inc. common shareholders |
$ | (24,747 | ) | $ | (131,776 | ) | ||
|
|
|
|
|
|||||
| Net loss per share of common stock attributable to Elevance Renewable Sciences, Inc. shareholders, basic and diluted |
$ | (10.83 | ) | $ | (54.96 | ) | ||
|
|
|
|
|
|||||
| Weighted-average shares of common stock outstanding used in computing net loss per share of common stock, basic and diluted |
2,285,318 | 2,397,453 | ||||||
|
|
|
|
|
|||||
See accompanying notes to consolidated financial statements.
F-30
Table of Contents
ELEVANCE RENEWABLE SCIENCES, INC. & SUBSIDIARIES
Condensed Consolidated Statements of Shareholders’ Deficit
(In thousands, except shares)
| Common Stock | Additional Paid-in Capital |
Accumulated Deficit |
Accumulated Other Comprehensive Income |
Total Shareholders’ Deficit |
Noncontrolling Interest |
Total Deficit |
||||||||||||||||||||||||||
| Shares | Amount | |||||||||||||||||||||||||||||||
| December 31, 2010 |
2,332,448 | $ | — | $ | 4,568 | $ | (73,789 | ) | $ | 19 | $ | (69,202 | ) | $ | 1,427 | $ | (67,775 | ) | ||||||||||||||
| Share-based compensation expense |
— | — | 292 | — | — | 292 | — | 292 | ||||||||||||||||||||||||
| Issuance of common stock upon exercise of stock options |
105,372 | — | 223 | — | — | 223 | — | 223 | ||||||||||||||||||||||||
| Series B preferred stock cumulative dividend |
— | — | (3,166 | ) | (2,277 | ) | — | (5,443 | ) | — | (5,443 | ) | ||||||||||||||||||||
| Series C preferred stock cumulative dividend |
— | — | (1,917 | ) | (2,294 | ) | — | (4,211 | ) | — | (4,211 | ) | ||||||||||||||||||||
| Series D preferred stock cumulative dividend |
— | — | — | (1,078 | ) | — | (1,078 | ) | — | (1,078 | ) | |||||||||||||||||||||
| Sale of subsidiary shares to noncontrolling interest |
— | — | — | — | — | — | 9,008 | 9,008 | ||||||||||||||||||||||||
| Comprehensive loss: |
||||||||||||||||||||||||||||||||
| Net loss |
— | — | — | (121,045 | ) | — | (121,045 | ) | (82 | ) | (121,127 | ) | ||||||||||||||||||||
| Foreign currency translation adjustment |
— | — | — | — | (2 | ) | (2 | ) | — | (2 | ) | |||||||||||||||||||||
|
|
|
|||||||||||||||||||||||||||||||
| Total comprehensive loss |
(121,129 | ) | ||||||||||||||||||||||||||||||
|
|
|
|
|
|
|
|
|
|
|
|
|
|
|
|
|
|||||||||||||||||
| September 30, 2011 |
2,437,820 | $ | — | $ | — | $ | (200,483 | ) | $ | 17 | $ | (200,466 | ) | $ | 10,353 | $ | (190,113 | ) | ||||||||||||||
|
|
|
|
|
|
|
|
|
|
|
|
|
|
|
|
|
|||||||||||||||||
See accompanying notes to consolidated financial statements.
F-31
Table of Contents
ELEVANCE RENEWABLE SCIENCES, INC. & SUBSIDIARIES
Condensed Consolidated Statements of Cash Flows
(In thousands)
| Nine Months Ended September 30, |
||||||||
| 2010 | 2011 | |||||||
| (unaudited) | ||||||||
| Cash flows from operating activities: |
||||||||
| Net loss |
$ | (20,339 | ) | $ | (121,127 | ) | ||
| Adjustments to reconcile net loss to net cash used in operating activities: |
||||||||
| Depreciation and amortization |
1,571 | 1,924 | ||||||
| Amortization of financing costs and accretion of debt discount |
1,237 | — | ||||||
| Unrealized loss on preferred stock warrant |
3,172 | 98,823 | ||||||
| Share-based compensation expense |
203 | 292 | ||||||
| Writedown of inventory |
— | 1,681 | ||||||
| Noncash interest expense (income) |
2,051 | (33 | ) | |||||
| Other noncash charges |
3 | 2 | ||||||
| Changes in operating assets and liabilities: |
||||||||
| Trade accounts receivable |
(1,537 | ) | (2,123 | ) | ||||
| Inventories |
(728 | ) | (3,779 | ) | ||||
| Other current assets |
(721 | ) | (1,589 | ) | ||||
| Other assets |
(252 | ) | 50 | |||||
| Accounts payable and due to related party |
1,628 | 834 | ||||||
| Accrued expenses and other current liabilities |
(8 | ) | 4,671 | |||||
| Other liabilities |
83 | (986 | ) | |||||
|
|
|
|
|
|||||
| Net cash used in operating activities |
$ | (13,637 | ) | $ | (21,360 | ) | ||
|
|
|
|
|
|||||
| Cash flows from investing activities: |
||||||||
| Capital expenditures |
$ | (1,126 | ) | $ | (23,893 | ) | ||
| Purchases of long-term investments |
— | (1,210 | ) | |||||
| Sales/maturities of short-term investments |
250 | 32,685 | ||||||
| Purchases of short-term investments |
— | (10,773 | ) | |||||
| Other |
61 | 42 | ||||||
|
|
|
|
|
|||||
| Net cash used in investing activities |
$ | (815 | ) | $ | (3,149 | ) | ||
|
|
|
|
|
|||||
| Cash flows from financing activities: |
||||||||
| Proceeds from sale of convertible notes and warrants, net of deferred financing fees |
$ | 19,941 | $ | — | ||||
| Proceeds from issuance of Series D preferred stock, net of issuance costs |
— | 50,198 | ||||||
| Noncontrolling interest investment in consolidated subsidiary |
1,011 | 9,008 | ||||||
| Proceeds from sale of common stock resulting from stock option exercises |
70 | 223 | ||||||
| Other |
— | (5 | ) | |||||
|
|
|
|
|
|||||
| Net cash provided by financing activities |
$ | 21,022 | $ | 59,424 | ||||
| Effects of changes in exchange rates on cash and cash equivalents |
3 | (6 | ) | |||||
|
|
|
|
|
|||||
| Net increase in cash and cash equivalents |
6,573 | 34,909 | ||||||
| Cash at beginning of period |
7,557 | 36,665 | ||||||
|
|
|
|
|
|||||
| Cash and cash equivalents at end of period |
$ | 14,130 | $ | 71,574 | ||||
|
|
|
|
|
|||||
| Supplemental disclosures of cash flow information: |
||||||||
| Supplemental disclosures of noncash investing and financing information: |
||||||||
| Additions to property and equipment under accounts payable and other current liabilities |
$ | 77 | $ | 1,071 | ||||
See accompanying notes to consolidated financial statements.
F-32
Table of Contents
Notes to Condensed Consolidated Financial Statements
(unaudited)
(In thousands, except per share amounts)
(1) Description of the Business
Elevance Renewable Sciences, Inc. (the Company or Elevance) produces high performance specialty chemicals from renewable natural oil using Nobel Prize winning olefin metathesis technology. Our products are key performance ingredients and building blocks used in detergents, lubricants, personal care products, coatings and other plastics.
Elevance is a Delaware corporation formed on November 20, 2007 to continue work started in 2004 in a collaborative project between Cargill, Inc. (Cargill), one of the world’s largest producers of agricultural oils, and Materia Inc. (Materia), a leading edge technology organization leveraging patents from the California Institute of Technology (Caltech) to commercialize the production of renewable chemicals. Cargill and Materia had previously entered into certain agreements between each other related to the license and development of olefin metathesis technology in furtherance of a joint business relationship (Metathesis Venture).
Elevance acquired the NatureWax business line carved out of Cargill’s Dressings Sauces and Oils Business and the Metathesis Venture operated by Cargill on November 20, 2007. The acquired NatureWax business line develops, produces, and sells natural waxes derived from renewable oils. Elevance also acquired from Cargill and Materia technologies, inventions, know-how, trade secrets, intellectual property rights, and other assets developed pursuant to the Metathesis Venture. The Company also acquired license rights with respect to certain other intellectual property rights, inventions, know-how, and trade secrets owned by or licensed to Materia. TPG Star L.P. (TPG Star) and TPG Biotechnology Partners II, L.P. (TPG Biotech) contributed $45,000 in cash for a majority equity interest in the Company.
In June 2010, the Company entered into an agreement to form a joint venture with KOG Investments Pte Ltd, a wholly owned subsidiary of Wilmar International Limited (Wilmar), one of the largest global agribusiness groups, to construct, own, and operate a biorefinery in Indonesia (note 2).
In December 2010, the Company raised $100,000 in additional equity, $70,000 through the sales of additional preferred shares and $30,000 through the conversion of long-term debt. Naxos Capital Partners, a Luxembourg-based private equity group, led the round with additional new investors including Total Energy Ventures International, the venture capital arm of French oil and gas company Total, joining TPG Star and TPG Biotech in the financing. The proceeds will support the Company’s growth, including expansion and creation of biorefineries in Asia, North America, and South America.
In June 2011, the Company raised $50,000 in additional equity. Naxos Capital Partners led the round which consisted of previous investors in the Company.
In June 2011, the Company entered into an asset purchase agreement with Delta Biofuels, Inc. to acquire a biodiesel production facility in Natchez, Mississippi (note 2).
(2) Summary of Significant Accounting Policies
(a) Basis of Presentation
The Company has prepared the consolidated financial statements included herein pursuant to the rules and regulations of the Securities and Exchange Commission (the “SEC”). Some information and note disclosures, which would normally be included in comprehensive annual financial statements prepared in accordance with accounting principles generally accepted in the United States, have been condensed or omitted pursuant to those rules and regulations. These consolidated financial statements should be read together with the annual consolidated financial statements and the accompanying notes for the year ended December 31, 2010.
F-33
Table of Contents
(b) Use of Estimates
The preparation of consolidated financial statements in conformity with GAAP requires management to make estimates and assumptions that affect the amounts reported in the consolidated financial statements and notes thereto. Actual results could differ from those estimates.
(c) Consolidation and Translation
The consolidated financial statements include the accounts of Elevance Renewable Sciences, Inc., Elevance Renewable Sciences Canada, Wilmar-Elevance 1 Pte. Ltd., and Wilmar-Elevance 2 Pte. Ltd and Elevance Natchez, Inc. The Company consolidates investments that meet the criteria of a variable interest entity where the Company is deemed to be the primary beneficiary for accounting purposes and for entities in which the Company has a majority voting interest. Intercompany transactions and accounts are eliminated from the consolidated financial statements.
The assets and liabilities of foreign subsidiaries are translated to U.S. dollars at end-of-period exchange rates. Revenues and expenses are translated at average rates for the period. Translation adjustments are reported as a component of accumulated other comprehensive income in shareholders’ deficit.
In June 2010, the Company acquired a 50% interest in Wilmar-Elevance 1 Pte. Ltd. and Wilmar-Elevance 2 Pte. Ltd., Singapore joint venture companies formed by the Company and KOG Investments Pte. Ltd., a wholly owned subsidiary of Wilmar, a Singapore company, to construct, own, and operate an integrated biorefinery in Indonesia, which is currently under construction. The Company determined that the joint venture companies were variable interest entities due to the voting rights of some investors not being proportionate to their rights to receive the expected returns of the entities and that substantially all of the entities’ activities involve the Company. Further, the Company determined that it is the primary beneficiary of the entities for accounting purposes as it has the ability to control the marketing of the specialty chemicals manufactured by the joint venture and the rights to incremental profits of the joint venture. As a result, the Company consolidates the entities in the consolidated financial statements, intercompany transactions are eliminated, and the interest that is not owned by the Company is presented as a noncontrolling interest in the consolidated balance sheets. The Company’s consolidated balance sheet includes cash in the amounts of $2,361 and $13,548 and property and equipment of $520 and $7,552 as of December 31, 2010 and September 30, 2011, respectively. The assets of the joint venture will be used to construct the integrated biorefinery and are not available for general corporate purposes.
In June 2011, the Company executed an asset purchase agreement with Delta Biofuels, Inc. to acquire a former 80 million gallon per year biodiesel production facility located in Natchez, Mississippi for approximately $15,900. The Company accounted for the transaction as an asset purchase, therefore the cost of the acquisition was allocated to the assets acquired based on the relative fair values of the assets, with no gain/loss or goodwill recognition. The Company has begun engineering on the site to convert the plant to a biorefinery and expects to begin commercial operations in 2013.
(d) Revenue Recognition
Product Sales
Revenue is recognized when there is persuasive evidence of an arrangement, the price is fixed or determinable, collectibility is reasonably assured, and shipment has occurred. Revenue is recognized upon the transfer of title and risk of loss to the customer, which generally coincides with delivery of the product to the customer either at the shipping point or at the customer’s destination depending on the terms agreed with the customer. The Company’s sales terms provide no right of return outside the Company’s standard warranty policy. Shipping and handling fees charged to customers are included in product revenues and related costs are included as a component of cost of product sales.
F-34
Table of Contents
(e) Net Loss per Share Attributable to Elevance Renewable Sciences, Inc. Common Shareholders
Basic net loss per share attributable to Elevance Renewable Sciences, Inc. common stockholders is computed by dividing the Company’s net loss attributable to Elevance Renewable Sciences, Inc common stockholders by the weighted-average number of common shares used in the loss per share calculation during the period. Diluted net loss per share attributable to Elevance Renewable Sciences, Inc. common stockholders is computed by giving effect to all potentially dilutive securities, including stock options, restricted stock, warrants and convertible preferred stock. Basic and diluted net loss per share attribute to Elevance Renewable Sciences, Inc. common stockholders was the same for all periods presented as the inclusion of all potentially dilutive securities outstanding was anti-dilutive.
The following table summarizes the Company’s calculation of historical basic and diluted net loss per share attributable to Elevance Renewable Sciences, Inc. common stockholders (in thousands, except share and per share amounts):
| Nine Months Ended September 30, |
||||||||
| 2010 | 2011 | |||||||
| Actual |
||||||||
| Numerator: |
||||||||
| Net loss attributable to Elevance Renewable Sciences, Inc. common stockholders |
$ | (24,747 | ) | $ | (131,776 | ) | ||
|
|
|
|
|
|||||
| Denominator: |
||||||||
| Weighted average number of common shares used in net loss per share calculation |
2,285,318 | 2,397,453 | ||||||
|
|
|
|
|
|||||
| Net loss per share of common stock attributable to Elevance Renewable Sciences, Inc. stockholders, basic and diluted |
$ | (10.83 | ) | $ | (54.96 | ) | ||
|
|
|
|
|
|||||
| Proforma |
||||||||
| Numerator: |
||||||||
| Net loss attributable to Elevance Renewable Sciences, Inc. common stockholders |
$ | (131,776 | ) | |||||
| Add back: loss on change in fair value of warrant liabilities (unaudited) |
98,823 | |||||||
| Net loss used in computing pro forma net loss per share of common stock attributable to Elevance Renewable Sciences, Inc. stockholders, basic and diluted (unaudited) |
$ | (32,953 | ) | |||||
|
|
|
|||||||
| Denominator: |
||||||||
| Basic and diluted weighted average common shares, as used above |
2,397,453 | |||||||
| Add: pro forma adjustment to reflect weighted-average of assumed conversion of convertible preferred stock |
15,410,102 | |||||||
| Weighted-average shares used in computing pro forma basis and diluted net loss per common share |
17,807,555 | |||||||
|
|
|
|||||||
| Pro forma net loss per share of common stock attributable to Elevance Renewable Sciences, Inc. stockholders, basic and diluted |
$ | (1.85 | ) | |||||
|
|
|
|||||||
F-35
Table of Contents
The following potentially dilutive securities were excluded from the calculation of diluted net loss per share attributable to Elevance Renewable Sciences, Inc. common stockholders during the periods presented because including them would have been antidilutive:
| Nine Months Ended September 30, | ||||||||
| 2010 | 2011 | |||||||
| Convertible preferred stock1 |
5,061,868 | 17,054,096 | ||||||
| Warrants to purchase common stock (as converted basis)1 |
5,680,541 | 5,680,541 | ||||||
| Outstanding stock options to purchase common stock (at period end) |
1,728,139 | 2,304,884 | ||||||
|
|
|
|
|
|||||
| Total |
12,470,548 | 25,039,521 | ||||||
|
|
|
|
|
|||||
| (1) | The convertible preferred stock and convertible preferred stock warrants were computed on an as-converted basis using a one-to-one conversion rate for all series of preferred stock. |
(f) Recoverability of Long-lived Assets
Long-lived assets, such as property and equipment, and purchased intangible assets subject to amortization, are reviewed for impairment whenever events or changes in circumstances indicate that the carrying amount of an asset may not be recoverable. If circumstances require a long-lived asset or asset group be tested for possible impairment, the Company first compares undiscounted cash flows expected to be generated by that asset or asset group to its carrying value. If the carrying value of the long-lived asset or asset group is not recoverable on an undiscounted cash flow basis, an impairment loss is recognized to the extent that the carrying value exceeds its fair value. Fair value is determined through various valuation techniques including discounted cash flow models, quoted market values, and third-party independent appraisals, as considered necessary.
Due to our history of operating losses and negative cash flows from operations, we performed a review of property, plant and equipment and intangible assets for impairment. As the projected future undiscounted cash flows generated by the asset groups were in excess of the carrying values, no impairment charges have been recorded.
(3) New Accounting Pronouncements
In May 2011, the Financial Accounting Standards Board (“FASB”) issued Accounting Standards Update (“ASU”) 2011-04, “Fair Value Measurement (Topic 820)—Amendments to Achieve Common Fair Value Measurement and Disclosure Requirements in U.S. GAAP and IFRS. This guidance amends the application of the “highest and best use” concept to be used only in the measurement of the fair value of nonfinancial assets, clarifies that the measurement of the fair value of equity-classified financial instruments should be performed from the perspective of a market participant who holds the instrument as an asset, clarifies that an entity that manages a group of financial assets and liabilities on the basis of its net risk exposure to those risks can measure those financial instruments on the basis of its net exposure to those risks, and clarifies when premiums and discounts should be taken into account when measuring fair value. The fair value disclosure requirements also were amended. These provisions are effective for reporting periods beginning on or after December 15, 2011 applied prospectively. Early application is not permitted. The Company is currently reviewing what effect, if any, this new provision will have on its Consolidated Financial Statements.
In June 2011, the FASB issued ASU 2011-05, “Comprehensive Income (Topic 220)—Presentation of Comprehensive Income.” ASU 2011-05 requires the components of net income and other comprehensive income to be either presented in one continuous statement, referred to as the statement of comprehensive income, or in two separate, but consecutive statements. An entity is also required to present on the face of the financial statements reclassification adjustments for items that are reclassified from other comprehensive income to net income in the statement(s) where the components of net income and the components of other comprehensive income are presented. While the new guidance changes the presentation of comprehensive income, there are no changes to the components that are recognized in net income or other comprehensive income under current accounting guidance. This new guidance is effective for the Company beginning November 1, 2012 and requires retrospective application. As this guidance only amends the presentation of the components of comprehensive income, the adoption will not have an impact on the Company’s consolidated financial position or results of operations.
F-36
Table of Contents
In September 2011, the FASB issued a standard to simplify the process for determining goodwill impairment ASU 2011-08, “Intangible Goodwill and Other (Topic 350)” This standard gives an entity the option to first assess qualitative factors in determining whether a two step goodwill impairment test must be performed. If an assessment of qualitative factors leads to a determination that it is not more likely than not that the fair value of the reporting unit is less than its carrying amount, the performing the two-step test is deemed unnecessary. The standard is effective for annual and interim goodwill impairment tests performed for fiscal years beginning after December 15, 2011. We do not expect the adoption of this standard to have a significant impact on our consolidated financial statements.
(4) Commitments and Contingencies
(a) Leases
In 2008, the Company entered into an operating lease for its office and lab facilities for an initial term of 10 years. In connection with this lease, the Company received a reimbursement for leasehold improvements of $220. This reimbursement has been recorded as deferred rent and is being amortized on a straight-line basis over the 10-year lease term.
In June 2011, the Company entered into an operating lease for office and lab facilities for an initial term of 12 years. In connection with this lease, the Company will receive a reimbursement for leasehold improvements of $226. This reimbursement has been recorded as deferred rent and is being amortized on a straight-line basis over the 12-year lease term.
Future minimum lease payments under operating leases (with initial or remaining lease terms in excess of one year) as of September 30, 2011 are:
| Minimum Lease Payments |
||||
| Year ending September 30: |
||||
| 2012 |
$ | 137 | ||
| 2013 |
1,075 | |||
| 2014 |
1,188 | |||
| 2015 |
1,218 | |||
| 2016 |
1,249 | |||
| Later years, through 2023 |
8,620 | |||
|
|
|
|||
| Total minimum lease payments |
$ | 13,487 | ||
|
|
|
|||
(b) Indemnification Guarantees
The Company recognizes the fair value of guarantee and indemnification arrangements issued or modified by the Company, if these arrangements are within the scope of the applicable authoritative guidance. In addition, the Company monitors the conditions that are subject to the guarantees and indemnifications in order to identify if a loss has occurred. If the Company determines that it is probable that a loss has occurred, then any such estimable loss would be recognized under those guarantees and indemnifications.
Under certain contractual arrangements with Cargill, Materia, and other third parties, the Company has agreed to indemnify, defend, and hold harmless licensees of our intellectual property from and against certain losses, damages, and costs arising from claims alleging infringements of the intellectual property rights of a third party. Historically, the Company has not been required to pay any amounts under these provisions as there have been no claims asserted under these provisions, and accordingly, the Company has not recorded a liability relating to such provisions.
F-37
Table of Contents
(c) Legal Proceedings
The Company may be involved, from time to time, in legal proceedings and claims arising in the ordinary course of its business. Such matters are subject to many uncertainties and outcomes are not predictable with assurance. The Company accrues amounts, to the extent they can be reasonably estimated, that it believes are adequate to address any liabilities related to legal proceedings and other loss contingencies that the Company believes will result in a probable loss. While there can be no assurances as to the ultimate outcome of any legal proceeding or other loss contingency involving the Company, management does not believe any pending matter will be resolved in a manner that would have a material adverse effect on the Company’s consolidated financial position, results of operations, or cash flows.
(5) Investments
As of December 31, 2010 and September 30, 2011, the Company’s short-term investments consisted of investments in a certificate of deposit and corporate bonds. The bonds are classified as held-to-maturity since the Company has the ability and intent to hold them until maturity. The bonds are reported at amortized cost, which is par value, plus or minus unamortized premium or discount. As of December 31, 2010 and September 30, 2011, the amortized cost of the corporate bonds was $40,693 and $18,828, respectively, which approximated the fair value of the bonds.
The Company had $260 and $1,470 in certificates of deposit as of December 31, 2010 and September 30, 2011, respectively, which was restricted as collateral for a letters of credit and is presented in investments in the condensed consolidated balance sheets.
The Company’s cash and cash equivalents and investments earned $3 and $25 in dividends, and $4 and $57 in interest during the nine months ended, September 30, 2010 and 2011. Dividends and interest income are classified as other income, net in the condensed consolidated statements of operations.
(6) Inventories
Inventories are carried at the lower of cost or market, using the first-in, first-out method and include material and contract manufacturing costs.
Inventories on hand at December 31, 2010 and September 30, 2011 consisted of the following:
| 2010 | 2011 | |||||||
| Raw materials |
$ | 2,190 | 3,289 | |||||
| Finished goods |
404 | 1,514 | ||||||
|
|
|
|
|
|||||
| $ | 2,594 | 4,803 | ||||||
|
|
|
|
|
|||||
In March 2011, the Company executed a tolling agreement to produce new biorefinery products in quantities larger than previously produced. The production run, which is viewed as a precursor to operations at the Company’s joint venture biorefinery in Indonesia, yielded approximately 900,000 pounds of product at a cost of $2.3 million and was completed in May 2011. The Company expects to sell these products at competitive market prices, which are below the cost of the tolling agreement. Production costs related to this agreement were higher than the Company expects to incur when its biorefinery becomes operational in 2012, as it realizes cost efficiencies with respect to production size and duration of production (batch vs. continuous processing). At June 30, 2011, the Company estimated that the cost of the products produced under the tolling agreement exceeded the market value by approximately $1.6 million. Accordingly, the Company reduced the carrying value of the inventory by this amount, which was recorded as a component of cost of product sales in the Condensed Consolidated Statement of Operation for the nine months ended September 30, 2011.
F-38
Table of Contents
(7) Research and Development Arrangements
The Company entered into an arrangement with Tetramer Technologies LLC (Tetramer) to perform certain research and development activities. As part of this agreement, the Company committed funding of at least $1,000 to Tetramer. The Company paid Tetramer $535 and $856 under the agreement during the nine months ended September 30, 2010 and 2011, respectively. The payments, which were expensed as services were provided, are included in research and development expenses in the Company’s consolidated statements of operations. The Company may also owe certain royalty payments on commercial application of the research. To date, the Company has not recorded any royalties related to this arrangement.
In January 2011, the Company entered into a four year joint development agreement with XiMo Ltd (XiMo), a Swiss company, to develop uses for XiMo’s proprietary molybdenum and tungsten metathesis catalysts in the field of natural oils. Under the joint development agreement, the Company and XiMo will collaborate to engage in certain research undertaken by XiMo and funded by the Company. The Company made an initial payment to XiMo of $419 (400 Swiss francs) and will make exclusivity payments of approximately $279 (250 Swiss francs) in the second and third years of the agreement. Additionally, the Company will make periodic additional payments to fund research activities undertaken by XiMo. The Company will have exclusive rights to use catalyst technology developed under the agreement in exchange for royalties paid to XiMo on commercial sales of products using the developed catalysts. Total expenses incurred under this agreement were $759 for the nine months ended September 30, 2011.
(8) Grants
Grants are agreements that generally provide cost reimbursement for certain types of expenditures over a contractually defined period. Revenues from grants are recognized in the period during which the related costs are incurred, provided that the conditions under which the grants were made have been met and only perfunctory obligations are outstanding. The Company recognized revenue under grants of $732 and $604 for the nine months ended September 30, 2010 and 2011. As of December 31, 2010 and September 30, 2011, $93 and $689 in deferred revenue related to the grant, respectively, was classified in other liabilities on the Company’s condensed consolidated balance sheet.
(9) Fair Value Measurements
(a) Fair Value of Financial Instruments
The carrying amounts of the Company’s financial instruments, which include cash equivalents, accounts receivable, investments, accounts payable, convertible notes, other current liabilities, and stock purchase warrants, approximated their fair market values as of December 31, 2010 and September 30, 2011.
The fair values of the financial instruments represent management’s best estimates of the amounts that would be received upon sale of those assets or that would be paid to transfer those liabilities in an orderly transaction between market participants at that date. Those fair value measurements maximize the use of observable inputs. However, in situations where there is little, if any, market activity for the asset or liability at the measurement date, the fair value measurement reflects the Company’s own judgments about the assumptions that market participants would use in pricing the asset or liability. Those judgments are developed by the Company based on the best information available in the circumstances.
The following methods and assumptions were used to estimate the fair value of each class of financial instruments:
| • | Cash equivalents, accounts receivable, investments, accounts payable, convertible notes, and certain current liabilities: The carrying amounts, at face value or cost plus accrued interest, approximate fair value because of the short maturity of these instruments. |
F-39
Table of Contents
| • | At December 31, 2010, the fair value of the Series B warrants was determined by allocating the equity value of the Company among the securities comprising the Company’s capital structure using the option pricing method. The enterprise value of the Company was determined using a discounted cash flow analysis and the implied value from recent financing rounds. |
| • | At September 30, 2011, the fair value of the Series B warrants was determined using a hybrid method consisting of both an Option Pricing Method and a Probability –Weighted Expected Return Method as described in the AICPA Practice Aid entitled Valuation of Privately-Held –Company Equity Securities Issued as Compensation. We considered three different scenarios under the hybrid method, with the resulting share values under each scenario weighted by their respective likelihood. |
(b) Fair Value Hierarchy
The ASC establishes a fair value hierarchy that prioritizes the inputs to valuation techniques used to measure fair value. The hierarchy gives the highest priority to unadjusted quoted prices in active markets for identical assets or liabilities (Level 1 measurements) and the lowest priority to measurements involving significant unobservable inputs (Level 3 measurements). The three levels of the fair value hierarchy are as follows:
| • | Level 1 inputs are quoted prices (unadjusted) in active markets for identical assets or liabilities that the Company has the ability to access at the measurement date. |
| • | Level 2 inputs are inputs other than quoted prices included within Level 1 that are observable for the asset or liability, either directly or indirectly. |
| • | Level 3 inputs are unobservable inputs for the asset or liability. |
The level in the fair value hierarchy within which a fair value measurement in its entirety falls is based on the lowest level input that is significant to the fair value measurement in its entirety.
The following table presents assets and liabilities that are measured at fair value on a recurring basis (including items that are required to be measured at fair value and items for which the fair value option has been elected) at December 31, 2010 and September 30, 2011:
| Fair value measurements at reporting date using |
||||||||||||
| Quoted prices in active markets for identical assets (Level 1) |
Significant other observable inputs (Level 2) |
Significant unobservable inputs (Level 3) |
||||||||||
| December 31, 2010: |
||||||||||||
| Liabilities: |
||||||||||||
| Noncurrent liabilities (warrants) |
$ | — | — | $ | 12,177 | |||||||
| September 30, 2011: |
||||||||||||
| Liabilities: |
||||||||||||
| Noncurrent liabilities (warrants) |
$ | — | — | $ | 111,000 | |||||||
F-40
Table of Contents
The following table presents the Company’s activity for liabilities measured at fair value on a recurring basis using significant unobservable inputs (Level 3) for the year ended December 31, 2010 and the nine months ended September 30, 2011:
| Noncurrent liability (warrants) |
||||
| Balance at December 31, 2010 |
12,177 | |||
| Total realized and unrealized losses: |
||||
| Included in income |
98,823 | |||
| Purchases, issuance, and settlements (net) |
— | |||
|
|
|
|||
| Balance at September 30, 2011 |
$ | 111,000 | ||
|
|
|
|||
Unrealized gains included in income for the years ended December 31, 2010 and the nine months ended September 30, 2011 for liabilities measured at fair value on a recurring basis using significant unobservable inputs (Level 3) are as follows:
| Nine Months Ended September 30, |
||||||||
| 2010 | 2011 | |||||||
| Loss on change in fair value of warrants |
$ | (3,172 | ) | (98,823 | ) | |||
| Change in unrealized losses relating to liabilities still held at the reporting date |
$ | (3,172 | ) | (98,823 | ) | |||
(10) Accrued Expenses
Accrued expenses at December 31, 2010 and September 30, 2011 consisted of the following:
| 2010 | 2011 | |||||||
| Accrued compensation costs |
1,567 | 1,655 | ||||||
| Other accrued expenses |
325 | 3,719 | ||||||
|
|
|
|
|
|||||
| 1,892 | 5,374 | |||||||
(11) Income Taxes
Deferred tax assets consist primarily of net operating loss carryforwards related to U.S. federal and state taxes. Realization of future tax benefits related to these deferred tax assets is dependent on many factors, including the Company’s ability to generate future taxable income. Due to the Company’s history of operating losses, the Company has recorded a full valuation allowance against these assets. At December 31, 2010, the Company had net operating loss carryforwards of $42,819 and research and development credit carryforwards of $1,021. The Company’s net operating loss carryforwards will expire in varying amounts between 2028 and 2031 and the credit carryforwards will expire in varying amounts between 2030 and 2031.
The Company files tax returns with the United States and Illinois. The tax years from 2007 to 2010 remain open to examination by the taxing jurisdictions to which the Company is subject. The Company is not aware of any examinations by taxing authorities affecting the Company.
The Company has not made any cash payments for income taxes since its inception.
(12) Convertible Preferred Stock
Holders of the Company’s Series B, Series C and Series D convertible preferred shares (Series B Series C and Series D), voting together, control the vote of the Company’s shareholders and board of directors. Since a liquidation event could be caused by a vote of the Series B, Series C shareholders and Series D shareholders, the Company has elected to classify the preferred stock in the consolidated balance sheets as mezzanine equity between liabilities and shareholders’ deficit. The convertible preferred stock is recorded at fair value on the dates of issuance, net of issuance costs.
F-41
Table of Contents
A summary of convertible preferred stock as of December 31, 2010 and September 30, 2011 is as follows:
| December 31, 2010 | ||||||||||||||||
| Shares Authorized |
Shares Issued and Outstanding |
Liquidation Amount |
Carrying Value |
|||||||||||||
| Series B |
18,600,000 | 8,830,640 | $ | 90,884 | $ | 86,873 | ||||||||||
| Series C |
7,200,000 | 5,649,718 | 70,384 | 67,556 | ||||||||||||
|
|
|
|
|
|
|
|
|
|||||||||
| Total |
25,800,000 | 14,480,358 | $ | 161,268 | $ | 154,429 | ||||||||||
|
|
|
|
|
|
|
|
|
|||||||||
| September 30, 2011 | ||||||||||||||||
| Shares Authorized |
Shares Issued and Outstanding |
Liquidation Amount |
Carrying Value |
|||||||||||||
| Series B |
18,600,000 | 8,830,640 | $ | 96,281 | $ | 92,315 | ||||||||||
| Series C |
7,200,000 | 5,649,718 | 74,572 | 71,748 | ||||||||||||
| Series D |
3,100,000 | 2,573,738 | 51,419 | 51,272 | ||||||||||||
|
|
|
|
|
|
|
|
|
|||||||||
| Total |
28,900,000 | 17,054,096 | $ | 222,272 | $ | 215,335 | ||||||||||
|
|
|
|
|
|
|
|
|
|||||||||
The combined aggregate liquidation value of all preferred stock for each of the five years ending September 30, 2011 through 2016 is as follows:
| Liquidation value |
||||
| As of September 30, |
||||
| 2012 |
$ | 240,049 | ||
| 2013 |
259,253 | |||
| 2014 |
279,994 | |||
| 2015 |
302,393 | |||
| 2016 |
326,585 | |||
The following summarizes the Series A, Series B, Series C and Series D convertible preferred stock activity for the years ended December 31, 2010 and the nine months ended September 30, 2011:
| Series B | Series C | Series D | ||||||||||||||||||||||
| Shares Issued and Outstanding |
Carrying Value |
Shares Issued and Outstanding |
Carrying Value |
Shares Issued and Outstanding |
Carrying Value |
|||||||||||||||||||
| Balance December 31, 2010 |
8,830,640 | 86,873 | 5,649,718 | 67,556 | — | — | ||||||||||||||||||
| Issuance of preferred stock |
— | — | 2,573,738 | 50,194 | ||||||||||||||||||||
| Series B accrued dividend |
5,442 | |||||||||||||||||||||||
| Series C accrued dividend |
4,211 | |||||||||||||||||||||||
| Series D accrued dividend |
1,078 | |||||||||||||||||||||||
| Offering costs |
(19 | ) | ||||||||||||||||||||||
|
|
|
|
|
|
|
|
|
|
|
|
|
|||||||||||||
| Balance September 30, 2011 |
8,830,640 | $ | 92,315 | 5,649,718 | $ | 71,748 | 2,573,738 | $ | 51,272 | |||||||||||||||
|
|
|
|
|
|
|
|
|
|
|
|
|
|||||||||||||
During 2011, the Company authorized and issued 2,573,238 shares of Series D convertible preferred stock. The stock was issued at $19.56, for gross proceeds of $50,342. The total direct costs related to the issuance of the Series D were $149.
The rights and preferences of the Series D convertible preferred stock are as follows:
Voting Rights
Each holder of outstanding shares of Series D convertible preferred stock shall be entitled, with respect to each outstanding share of preferred stock held, to the number of votes equal to the number of whole shares of common stock into which such outstanding share of preferred stock could be converted.
F-42
Table of Contents
Dividends
Series D shareholders are entitled to receive a cumulative dividend payment of 8% per annum on their outstanding shares valued at a rate of $19.56 per share with such amount to be adjusted for any stock splits, subdivisions, reverse stock splits, or combinations. The Company must pay the accrued dividend from all funds and assets legally available to pay such dividends whether or not declared by the board of directors in the event of a Qualified initial public offering (IPO), liquidation, sale, merger, or dissolution. Shareholders may elect to receive Series D preferred shares (as applicable) or common shares in lieu of a cash payment. The accrued, but undeclared cumulative dividends to Series D shareholders were $1,078 at September 30, 2011.
Liquidation Rights
Upon any liquidation, dissolution, or winding up of the corporation, whether voluntary or involuntary, including transactions or events deemed to be a liquidation, dissolution, or winding up of the Company, the Series D have a liquidation preference of $19.56 per share, respectively, plus any accrued or declared and unpaid dividends.
Participation Rights
If there are any available funds and assets remaining after the payment or distribution to the shareholders of the Series B, Series C and Series D preferred stock of the full respective preferential amounts, then all such remaining available funds and assets shall be distributed among the holders of the Series B preferred stock, Series C preferred stock, Series D preferred stock and common stock pro rata.
Conversion
Each outstanding share of Series D convertible preferred stock is convertible to one share of common stock at any time at the option of the holder. The Series D automatically convert to common stock upon a Qualified IPO, or upon majority vote of Series B, Series C and Series D shareholders. The conversion ratio of Series D into common stock will be adjusted for the issue of additional shares of common stock as a dividend or other distribution on outstanding common stock, a stock split, a reverse stock split, reclassification, exchange and substitution, reorganizations, mergers and consolidations, or the sale of shares below the conversion price for the Series D shareholders. The adjustment enables the Series D shareholders to obtain the same number of shares or other compensation as they would have obtained had they held the common stock on the date that any of the above outlined events occurred. The conversion price of Series D to common stock is also subject to weighted average ratchet protection if share or share equivalents, as defined, are issued at a price lower than the then current conversion price.
(13) Warrants for Convertible Preferred Stock
The Company has classified warrants to acquire preferred stock as liabilities on the consolidated balance sheets under other liabilities. Preferred stock warrants are marked-to-market as of each balance sheet date and the corresponding change in fair value is recognized separately in the consolidated statements of operations.
As of December 31, 2010 and September 30, 2011, the Company had issued warrants on various dates to acquire up to 5,680,541 shares of the Series B convertible preferred stock, respectively, for $8.89 per share. The warrants are exercisable from the date of issuance and expire on August 6, 2018.
During the nine months ended September 30, 2010 and 2011, the Company recorded unrealized loss of $3,172 and $98,823, respectively, for the change in the fair value of the preferred stock warrants.
(14) Share-Based Compensation
Share-based compensation cost is measured at the fair value of the award on the grant date and recognized on a straight-line basis over the requisite service period. Excess tax benefits related to stock option exercises are reflected as financing cash inflows.
F-43
Table of Contents
The fair value of each award is estimated on the grant date using the Black-Scholes option pricing model. The Company uses the simplified method to calculate the expected term of the options. The Company records forfeitures as they occur during the vesting period. Since the Company’s shares are not publicly traded and its shares have not traded privately, expected volatility is computed based on the average historical and implied volatility of similar entities with publicly traded shares. The risk-free rate for the expected term of the option is based on the U.S. Treasury yield curve in effect at the time of grant.
In 2007, the Company adopted the 2007 Equity Incentive Plan (the Plan). As of December 31, 2010 and September 30, 2011, the Company reserved 3,067,069 and 2,961,697 shares, respectively, of common stock for issuance under the Plan. The Plan requires that options vest at a rate no less than twenty percent (20%) per year over five years from the grant date, and that the expiration date of the options is no later than the 10th anniversary of the date the option is granted. The awards granted during 2010 and 2011 vest over a four-year period. The Company plans to use authorized and unissued shares to satisfy share award exercises.
The Company recorded compensation expense for the nine months ended September 30, 2010 and 2011 related to stock options issued under the Plan as follows:
| Nine Months Ended September 30, |
||||||||
| 2010 | 2011 | |||||||
| Selling, general, and administrative |
$ | 170,690 | $ | 270,032 | ||||
| Research and development |
33,338 | 21,855 | ||||||
|
|
|
|
|
|||||
| Total pre-tax compensation expense |
204,028 | 291,887 | ||||||
| Tax benefit |
— | — | ||||||
|
|
|
|
|
|||||
| Total stock-based compensation expense, net of tax |
$ | 204,028 | $ | 291,887 | ||||
|
|
|
|
|
|||||
The following summarizes stock option activity under the plan as of September 30, 2011:
| Shares under option | ||||||||||||||||||||
| Shares available for grant |
Number of shares |
Weighted average exercise price |
Weighted average remaining contractual term (in years) |
Aggregate intrinsic value in thousands |
||||||||||||||||
| December 31, 2010 |
1,344,280 | 1,722,789 | $ | 2.12 | 7.4 | $ | — | |||||||||||||
|
|
|
|
|
|||||||||||||||||
| Authorized |
— | |||||||||||||||||||
| Granted |
(888,892 | ) | 888,892 | 2.14 | ||||||||||||||||
| Exercised |
(105,372 | ) | 2.12 | 2 | ||||||||||||||||
| Forfeited |
95,981 | (95,981 | ) | 2.12 | ||||||||||||||||
| Expired |
105,444 | (105,444 | ) | 2.12 | ||||||||||||||||
|
|
|
|
|
|||||||||||||||||
| September 30, 2011 |
656,813 | 2,304,884 | 2.13 | 8.2 | 32,476 | |||||||||||||||
| Exercisable at September 30, 2011 |
809,106 | 2.12 | 6.8 | 11,408 | ||||||||||||||||
The fair value of each option award is estimated on the date of grant using the Black-Scholes option pricing model. The following are the weighted average assumptions used in the model:
| Nine Months Ended September 30, | ||||||||
| 2010 | 2011 | |||||||
| Dividend yield |
— | % | — | % | ||||
| Weighted average volatility |
56 | % | 50 | % | ||||
| Years until exercise |
6.1 | 6.0 | ||||||
| Risk-free interest rate |
2.8 | % | 2.5 | % | ||||
F-44
Table of Contents
The weighted average grant date fair value of options granted during the nine months ended September 30, 2010 and 2011 was $0.36 and $1.07, respectively. At September 30, 2011, there was $1,201 of total unrecognized compensation cost related to nonvested share-based compensation arrangements granted under the Plan. That cost is expected to be recognized over a weighted average period of 3.18 years. The total grant date fair value of options vested during the nine months ended September 30, 2010 and 2011 was $194 and $152, respectively. There were 105,372 exercises of options granted under the Plan for the period ended September 30, 2011.
The terms of the share-based payments awarded to certain employees include rights to additional stock option awards upon issuance of the first 2,812,148 of Series B shares issued upon the exercise of the Series B warrants. These awards are required to be granted at fair value.
(15) Related Party Transactions
Cargill, Caltech, and Materia are considered related parties due to their ownership interest in the Company. The Company has entered into transactions and agreements with Cargill and its subsidiaries and Materia, from time to time, and the Company expects to enter into additional transactions and agreements with Cargill and its subsidiaries and Materia in the future. Certain agreements and transactions with Cargill and its subsidiaries and with Materia and Caltech are described below.
(a) Cargill
Supply Agreement
In 2007, the Company entered into a Supply Agreement with Cargill (Supply Agreement) for a term of five years whereby Cargill supplies substantially all of the Company’s global supply requirements for bulk vegetable and animal based oils and fats and modified vegetable or animal based oils and fats. The Company is not obligated to purchase any specific quantity of products from Cargill during any given time period. If Cargill is unable to supply products at a competitive price, the Company may procure the products elsewhere. For the nine months ended September 30, 2010 and 2011, the Company purchased $8,491 and $14,609, respectively, of products from Cargill and its subsidiaries. Included in accounts payable in the Company’s consolidated balance sheet as of December 31, 2010 and September 30, 2011 is $1,106 and $2,200, respectively, payable to Cargill for product purchases under the Supply Agreement.
Risk Management Program
The Company entered into a Risk Management Agreement with Cargill (Risk Management Agreement) whereby Cargill provides natural oil risk management services on the Company’s behalf. The agreement requires the purchase of any risk instruments to coincide with the Company’s 12 month forecasted normal sales and purchases of oil under the Supply Agreement, and is not intended to be speculative. The agreement is terminable by either party with 120 days notice. There were no amounts paid or received from Cargill as a result of the Risk Management Agreement (i.e. incremental to the amounts paid under the Supply Agreement) for the nine months ended September 30, 2010 and 2011.
(b) Materia and Caltech
Joint Development Agreement
In 2007, the Company entered into a Joint Development Agreement (JDA) with Materia to conduct research for the purposes of developing and commercializing chemicals and other materials from natural oils. As part of the JDA, Elevance pays Materia for research costs. The term of the agreement is five years. The agreement is terminable by the Company on or after the first anniversary date. Research costs incurred by Materia and reimbursed by the Company were $945 and $720 for the nine months ended September 30, 2010 and 2011, respectively, and is included in research and development expenses in the Company’s condensed consolidated
F-45
Table of Contents
statements of operations. There were no amounts payable to Materia under the terms of the JDA included in the Company’s consolidated balance sheets as of December 31, 2010 and September 30, 2011.
Catalyst Supply Agreement
The Company entered into a catalyst supply agreement with Materia for an initial term of 10 years whereby Materia supplies Elevance with all its metathesis catalyst requirements. This supply agreement is renewable annually after the initial term at the Company’s option. During the nine months ended September 30, 2010 and 2011, the Company paid Materia $1,311 and $0, respectively, under the catalyst supply agreement. Materia was owed $0 as of December 31, 2010 and September 30, 2011 under the catalyst supply agreement.
License Agreement
The Company entered into an exclusive license agreement with Materia on November 20, 2007, which among other things, allows for the Company to obtain exclusivity rights to certain intellectual property owned and licensed to Materia for the purpose of enabling the Company to develop and commercialize chemicals and materials derived from natural oils (License Agreement). The License Agreement is perpetual and requires the Company to make a payment of $250 to Materia in each of the first five years of the agreement to maintain exclusivity. After the fifth year of the agreement, the amount owed to Materia to retain exclusivity over the licensed technology will be determined using a formula based on payments made under the JDA, catalyst supply agreement, and the License Agreement. For the nine months ended September 30, 2010 and 2011, the Company made no payments to Materia under the License Agreement. These payments are amortized as research and development expenses in the consolidated statements of operations over the twelve month period for which the payments relate. As of December 31, 2010 and September 30, 2011, the unamortized portion of the payments under the License Agreement was $222 and $35, respectively and was included in other current assets in the Company’s consolidated balance sheets.
F-46
Table of Contents

Table of Contents
PART II
INFORMATION NOT REQUIRED IN PROSPECTUS
Item 13. Other Expenses of Issuance and Distribution.
The following table sets forth all costs and expenses, other than the underwriting discounts and commissions payable by us, in connection with the offer and sale of the securities being registered. All amounts shown are estimates except for the SEC registration fee and the Financial Industry Regulatory Authority, Inc. (“FINRA”) filing fee.
| SEC registration fee |
$ | 11,610 | ||
| FINRA filing fee |
10,500 | |||
| Exchange listing fee |
* | |||
| Printing expenses |
* | |||
| Legal fees and expenses |
* | |||
| Accounting fees and expenses |
* | |||
| Miscellaneous expenses |
* | |||
|
|
|
|||
| Total expenses |
$ | * | ||
|
|
|
| * | To be provided by amendment. |
Item 14. Indemnification of Directors and Officers.
Section 102(b)(7) of the Delaware General Corporation Law (the “DGCL”) allows a corporation to provide in its certificate of incorporation that a director of the corporation will not be personally liable to the corporation or its stockholders for monetary damages for breach of fiduciary duty as a director, except where the director breached the duty of loyalty, failed to act in good faith, engaged in intentional misconduct or knowingly violated a law, authorized the payment of a dividend or approved a stock repurchase in violation of Delaware corporate law or obtained an improper personal benefit. Our amended and restated certificate of incorporation will provide for this limitation of liability.
Section 145 of the DGCL (“Section 145”), provides that a Delaware corporation may indemnify any person who was, is or is threatened to be made, party to any threatened, pending or completed action, suit or proceeding, whether civil, criminal, administrative or investigative (other than an action by or in the right of such corporation), by reason of the fact that such person is or was an officer, director, employee or agent of such corporation or is or was serving at the request of such corporation as a director, officer, employee or agent of another corporation or enterprise. The indemnity may include expenses (including attorneys’ fees), judgments, fines and amounts paid in settlement actually and reasonably incurred by such person in connection with such action, suit or proceeding, provided such person acted in good faith and in a manner he reasonably believed to be in or not opposed to the corporation’s best interests and, with respect to any criminal action or proceeding, had no reasonable cause to believe that his or her conduct was illegal. A Delaware corporation may indemnify any persons who are, were or are threatened to be made a party to any threatened, pending or completed action or suit by or in the right of the corporation by reason of the fact that such person is or was a director, officer, employee or agent of another corporation or enterprise. The indemnity may include expenses (including attorneys’ fees) actually and reasonably incurred by such person in connection with the defense or settlement of such action or suit, provided such person acted in good faith and in a manner he reasonably believed to be in or not opposed to the corporation’s best interests, provided that no indemnification is permitted without judicial approval if the officer, director, employee or agent is adjudged to be liable to the corporation. Where an officer or director is successful on the merits or otherwise in the defense of any action referred to above, the corporation must indemnify him against the expenses which such officer or director has actually and reasonably incurred.
Section 145 further authorizes a corporation to purchase and maintain insurance on behalf of any person who is or was a director, officer, employee or agent of the corporation or is or was serving at the request of the
II-1
Table of Contents
corporation as a director, officer, employee or agent of another corporation or enterprise, against any liability asserted against him and incurred by him in any such capacity, or arising out of his or her status as such, whether or not the corporation would otherwise have the power to indemnify him under Section 145.
Our amended and restated certificate of incorporation will provide that we must indemnify our directors and officers to the fullest extent authorized by the DGCL and must also pay expenses incurred in defending any such proceeding in advance of its final disposition upon delivery of an undertaking, by or on behalf of an indemnified person, to repay all amounts so advanced if it should be determined ultimately that such person is not entitled to be indemnified under this section or otherwise.
The indemnification rights set forth above shall not be exclusive of any other right which an indemnified person may have or hereafter acquire under any statute, provision of our amended and restated certificate of incorporation, our amended and restated bylaws, agreement, vote of stockholders or disinterested directors or otherwise.
We expect to maintain standard policies of insurance that provide coverage (1) to our directors and officers against loss arising from claims made by reason of breach of duty or other wrongful act and (2) to us with respect to indemnification payments that we may make to such directors and officers.
The proposed form of Underwriting Agreement to be filed as Exhibit 1.1 to this Registration Statement provides for indemnification of our directors and officers by the underwriters party thereto against certain liabilities.
Item 15. Recent Sales of Unregistered Securities.
Set forth below is certain information regarding the shares of our capital stock issued, and equity awards granted, by us within the past three years that were not registered under the Securities Act, the consideration, if any, received by us for such shares or equity awards and information relating to the section of the Securities Act, or rule of the SEC, under which exemption from registration was claimed. Piper Jaffray & Co. was involved with the issuance of the Series C preferred stock; no other underwriters were involved in any of the issuances or grants described below.
| Date of Sale |
Title of Security |
Number of Shares/Amount |
Proceeds | Underwriting Discount or Commission |
||||||||||
| October 19, 2009 |
Senior Secured Convertible Notes | $ | 10,000,000 | $ | 10,000,000 | $ | — | |||||||
| October 19, 2009 |
Warrants to purchase Series B preferred stock | 393,701 | 3,500,000 | — | ||||||||||
| March 5, 2010 |
Senior Secured Convertible Notes | $ | 10,000,000 | 10,000,000 | — | |||||||||
| March 5, 2010 |
Warrants to purchase Series B preferred stock | 393,701 | 3,500,000 | — | ||||||||||
| August 6, 2010 |
Senior Secured Convertible Notes | $ | 10,000,000 | 10,000,000 | — | |||||||||
| August 6, 2010 |
Warrants to purchase Series B preferred stock | 393,701 | 3,500,000 | — | ||||||||||
| December 6, 2010 |
Series C preferred stock | 5,649,718 | 70,000,006 | 1,800,000 | ||||||||||
| December 6, 2010 |
Conversion of Senior Secured Notes into Series B preferred stock | 3,768,772 | — | — | ||||||||||
| June 24, 2011 |
Series D preferred stock | 2,556,238 | 50,000,015 | — | ||||||||||
| August 19, 2011 |
Series D preferred stock | 17,500 | 342,300 | — | ||||||||||
The offers, sales and issuances of these securities were deemed to be exempt from registration under the Securities Act in reliance upon the exemption provided by Section 4(2) of the Securities Act since each such transaction did not involve a public offering. In that regard, each purchaser of these securities represented to us in connection with such offer and sale that it was an “Accredited Investor” within the meaning of Rule 501 of Regulation
II-2
Table of Contents
D under the Securities Act and that it was acquiring such securities in these transactions for investment only and not with a view to or for sale in connection with any distribution thereof. These offers, sales and issuances were generally made to existing stockholders or persons with whom we otherwise had an existing business relationship.
Since January 1, 2008, we have issued options to purchase 2,644,328 shares of our common stock to certain of our employees under our 2007 Plan. These grants were made in the ordinary course of business and did not involve any cash payment from the recipients. These grants did not involve a “sale” of securities for purposes of Section 2(3) of the Securities Act and were otherwise made in reliance on Rule 701 under the Securities Act.
Appropriate legends were affixed to the securities issued in all of these transactions.
Item 16. Exhibits and Financial Statement Schedules.
(a) Exhibits
The exhibit index attached hereto is incorporated herein by reference.
(b) Financial Statement Schedules
No financial statement schedules are provided because the information called for is not applicable or is shown in the financial statements or notes thereto.
Item 17. Undertakings.
The undersigned registrant hereby undertakes to provide to the underwriters at the closing specified in the underwriting agreement, certificates in such denominations and registered in such names as required by the underwriters to permit prompt delivery to each purchaser.
Insofar as indemnification for liabilities arising under the Securities Act may be permitted to directors, officers and controlling persons of the registrant pursuant to the provisions referenced in Item 14 of this registration statement or otherwise, the registrant has been advised that in the opinion of the SEC such indemnification is against public policy as expressed in the Securities Act and is, therefore, unenforceable. In the event that a claim for indemnification against such liabilities (other than the payment by the registrant of expenses incurred or paid by a director, officer or controlling person of the registrant in the successful defense of any action, suit or proceeding) is asserted by such director, officer or controlling person in connection with the securities being registered hereunder, the registrant will, unless in the opinion of its counsel the matter has been settled by controlling precedent, submit to a court of appropriate jurisdiction the question whether such indemnification by it is against public policy as expressed in the Securities Act and will be governed by the final adjudication of such issue.
The undersigned registrant hereby undertakes that:
| (1) | For purposes of determining any liability under the Securities Act of 1933, the information omitted from the form of prospectus filed as part of this registration statement in reliance upon Rule 430A and contained in the form of prospectus filed by the registrant pursuant to Rule 424(b) (1) or (4) or 497(h) under the Securities Act shall be deemed to be part of this registration statement as of the time it was declared effective; and |
| (2) | For the purpose of determining any liability under the Securities Act of 1933, each post-effective amendment that contains a form of prospectus shall be deemed to be a new registration statement relating to the securities offered therein, and the offering of such securities at the time shall be deemed to be the initial bona fide offering thereof. |
II-3
Table of Contents
SIGNATURES
Pursuant to the requirements of the Securities Act of 1933, the registrant has duly caused this Registration Statement on Form S-1 to be signed on its behalf by the undersigned, thereunto duly authorized, in the city of Woodridge, state of Illinois, on March 9, 2012.
| Elevance Renewable Sciences, Inc. | ||
| By: | /s/ K’LYNNE JOHNSON | |
| Name: | K’Lynne Johnson | |
| Title: | Chief Executive Officer | |
* * *
Pursuant to the requirements of the Securities Act of 1933, this registration statement has been signed by the following persons in the capacities and on the date indicated.
| Signature |
Title |
Date | ||
| /S/ K’LYNNE JOHNSON K’Lynne Johnson |
Chief Executive Officer (principal executive officer) |
March 9, 2012 | ||
| /S/ DAVID H. KELSEY David H. Kelsey |
Chief Financial Officer (principal financial officer) |
March 9, 2012 | ||
| /S/ KARA E. LAWRENCE Kara E. Lawrence |
Controller and Treasurer (principal accounting officer) |
March 9, 2012 | ||
| * Geoffrey M. Duyk, M.D., Ph.D. |
Chairperson of the Board, Director |
March 9, 2012 | ||
| * Carole Piwnica |
Vice Chairperson of the Board, Director |
March 9, 2012 | ||
| * Robert Frost |
Director |
March 9, 2012 | ||
II-4
Table of Contents
| * Véronique Hervouet |
Director |
March 9, 2012 | ||
| * William E. McGlashan Jr. |
Director |
March 9, 2012 | ||
| * Robert B. Shapiro |
Director |
March 9, 2012 | ||
| * Mark E. Tomkins |
Director |
March 9, 2012 | ||
| * W. Donald Johnson |
Director |
March 9, 2012 | ||
| *By: /s/ K’LYNNE JOHNSON K’Lynne Johnson, as Attorney-in-fact |
||||
II-5
Table of Contents
EXHIBIT INDEX
| Exhibit |
Description | |||
| 1.1* | Form of Underwriting Agreement. | |||
| 3.1* | Form of Fifth Amended and Restated Certificate of Incorporation of the registrant. | |||
| 3.2* | Form of Amended and Restated Bylaws of the registrant. | |||
| 4.1* | Specimen Common Stock certificate. | |||
| 5.1** | Opinion of Kirkland & Ellis LLP. | |||
| 10.1** | Industrial Lease Agreement, dated as of June 24, 2011, by and between the registrant and Jeffrey Perpich. | |||
| 10.2** | Industrial Lease Agreement, dated as of May 29, 2008, by and between the registrant and Industrial Property Fund X, L.P. | |||
| 10.3+** | 2007 Equity Incentive Plan. | |||
| 10.4+* | 2012 Incentive Compensation Plan. | |||
| 10.5+* | Form of Indemnification Agreement. | |||
| 10.6+* | Executive Employment Agreement, dated as of November 16, 2007, by and between the registrant and K’Lynne Johnson. | |||
| 10.7+* | Executive Employment Agreement, dated as of November 16, 2007, by and between the registrant and Mel L. Luetkens. | |||
| 10.8+* | Executive Employment Agreement, dated as of November 14, 2007, by and between the registrant and Andy L. Shafer. | |||
| 10.9+* | Offer Letter, dated as of January 15, 2008, by and between the registrant and Kara E. Lawrence. | |||
| 10.10+* | Executive Employment Agreement, dated as of July 25, 2011, by and between the registrant and David H. Kelsey. | |||
| 10.11† | Joint Development Agreement, dated as of August 5, 2010, by and between the registrant and Stepan Company. | |||
| 10.11(a)† | Amendment No. 1 to Joint Development Agreement, dated as of December 15, 2010, by and between the registrant and Stepan Company. | |||
| 10.11(b)† | Amendment No. 3 to Joint Development Agreement, dated as of December 15, 2010, by and between the registrant and Stepan Company. | |||
| 10.11(c)† | Amendment No. 4 to Joint Development Agreement, dated as of July 21, 2011, by and between the registrant and Stepan Company. | |||
| 10.12† | Joint Development Agreement, dated as of January 14, 2011, by and between the registrant and XiMo Ltd. | |||
| 10.13† | Commercialization and Supply Agreement, dated as of June 16, 2011, by and between the registrant and Clariant International. | |||
| 10.14† | Product Conversion Agreement, dated as of August 8, 2011, by and between Elevance Natchez, Inc. and Kolmar Americas, Inc. | |||
| 10.15* | Catalyst Supply Agreement, dated as of November 20, 2007, by and between the registrant and Materia, Inc. | |||
| 10.16* | License Agreement, dated as of November 20, 2007, by and between the registrant and Materia, Inc. | |||
II-6
Table of Contents
| Exhibit |
Description | |||
| 10.17* | Joint Development Agreement, dated as of November 20, 2007, by and between the registrant and Materia, Inc. | |||
| 10.18* | Product Supply Agreement, dated as of November 20, 2007, by and between the registrant and Cargill, Incorporated. | |||
| 10.19* | Risk Management Agreement, dated as of November 20, 2007, by and between the registrant and Cargill, Incorporated. | |||
| 10.20* | Surabaya, Indonesia Biorefinery Master Agreement, dated as of June 25, 2010, by and between the registrant and KOG Investments Pte Ltd. | |||
| 10.21* | Shareholders’ Agreement, dated as of June 25, 2010, by and among the registrant, KOG Investments PTE Ltd, Wilmar-Elevance 1 Pte Ltd and Wilmar-Elevance 2 Pte Ltd. | |||
| 10.22* | License and Catalyst Supply Agreement, dated as of June 25, 2010, by and between the registrant and Wilmar-Elevance 2 Pte Ltd. | |||
| 10.23* | Chemicals Offtake and Marketing Agreement, dated as of June 25, 2010, by and between Wilmar-Elevance 2 Pte Ltd and the registrant. | |||
| 10.24** | Second Amended and Restated Investors’ Rights Agreement, dated as of June 24, 2011, by and among the registrant, Cargill, Incorporated, Materia, Inc., Materia Innovations, LLC, TPG STAR, L.P., TPG Biotechnology Partners II, L.P., Navelance S.A., Total Energy Ventures International, BCP Investment, L.P. and Robert Shapiro. | |||
| 21.1** | List of subsidiaries of the registrant. | |||
| 23.1 | Consent of KPMG LLP, independent registered public accounting firm. | |||
| 23.2 | Consent of Kirkland & Ellis LLP (included in Exhibit 5.1). | |||
| 24.1 | Powers of Attorney (included on signature page). | |||
| 99.1** | Consent of ICIS. | |||
| 99.2** | Consent of The Jacobsen. | |||
| 99.3** | Consent of The Freedonia Group, Inc. | |||
| * | To be filed by amendment. |
| ** | Previously filed by the registrant. |
| + | Indicates a management or compensatory plan or arrangement. |
| † | Certain provisions have been omitted pursuant to a request for confidential treatment, which has been separately filed with the Securities and Exchange Commission. |
II-7