Attached files
| file | filename |
|---|---|
| 8-K - FORM 8-K - US BANCORP \DE\ | d312131d8k.htm |
Exhibit 99.1
| Citi 2012 Financial Services Conference Richard K. Davis Chairman, President and CEO March 8, 2012 |
| The following information appears in accordance with the Private Securities Litigation Reform Act of 1995: This presentation contains forward-looking statements about U.S. Bancorp. Statements that are not historical or current facts, including statements about beliefs and expectations, are forward-looking statements and are based on the information available to, and assumptions and estimates made by, management as of the date made. These forward-looking statements cover, among other things, anticipated future revenue and expenses and the future plans and prospects of U.S. Bancorp. Forward-looking statements involve inherent risks and uncertainties, and important factors could cause actual results to differ materially from those anticipated. Global and domestic economies could fail to recover from the recent economic downturn or could experience another severe contraction, which could adversely affect U.S. Bancorp's revenues and the values of its assets and liabilities. Global financial markets could experience a recurrence of significant turbulence, which could reduce the availability of funding to certain financial institutions and lead to a tightening of credit, a reduction of business activity, and increased market volatility. Continued stress in the commercial real estate markets, as well as a delay or failure of recovery in the residential real estate markets, could cause additional credit losses and deterioration in asset values. In addition, U.S. Bancorp's business and financial performance is likely to be negatively impacted by effects of recently enacted and future legislation and regulation. U.S. Bancorp's results could also be adversely affected by continued deterioration in general business and economic conditions; changes in interest rates; deterioration in the credit quality of its loan portfolios or in the value of the collateral securing those loans; deterioration in the value of securities held in its investment securities portfolio; legal and regulatory developments; increased competition from both banks and non-banks; changes in customer behavior and preferences; effects of mergers and acquisitions and related integration; effects of critical accounting policies and judgments; and management's ability to effectively manage credit risk, residual value risk, market risk, operational risk, interest rate risk and liquidity risk. For discussion of these and other risks that may cause actual results to differ from expectations, refer to U.S. Bancorp's Annual Report on Form 10-K for the year ended December 31, 2011, on file with the Securities and Exchange Commission, including the sections entitled "Risk Factors" and "Corporate Risk Profile" contained in Exhibit 13, and all subsequent filings with the Securities and Exchange Commission under Sections 13(a), 13(c), 14 or 15(d) of the Securities Exchange Act of 1934. Forward-looking statements speak only as of the date they are made, and U.S. Bancorp undertakes no obligation to update them in light of new information or future events. This presentation includes non-GAAP financial measures to describe U.S. Bancorp's performance. The reconciliations of those measures to GAAP measures are provided within or in the appendix of the presentation. These disclosures should not be viewed as a substitute for operating results determined in accordance with GAAP, nor are they necessarily comparable to non-GAAP performance measures that may be presented by other companies. Forward-looking Statements and Additional Information |
| U.S. Bancorp The Momentum Continues Forward Focus Current Initiatives Long-term Growth Drivers |
| continues Momentum U.S. Bancorp 2011 Annual Report |
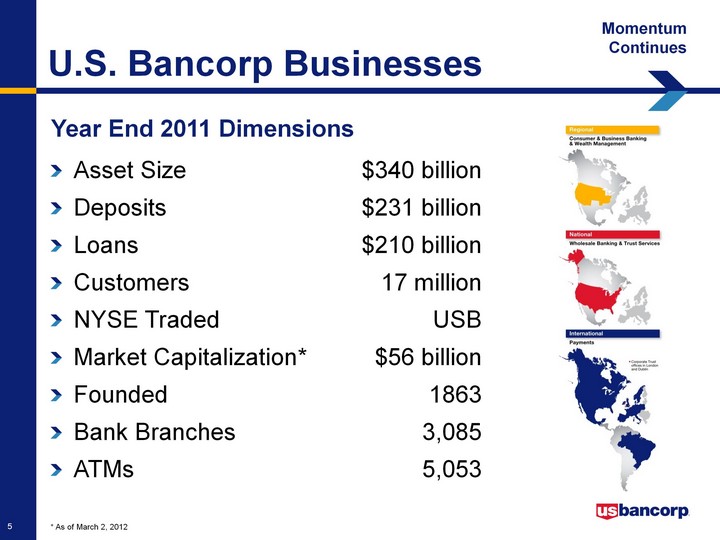
| Year End 2011 Dimensions * As of March 2, 2012 Momentum Continues U.S. Bancorp Businesses Asset Size $340 billion Deposits $231 billion Loans $210 billion Customers 17 million NYSE Traded USB Market Capitalization* $56 billion Founded 1863 Bank Branches 3,085 ATMs 5,053 |
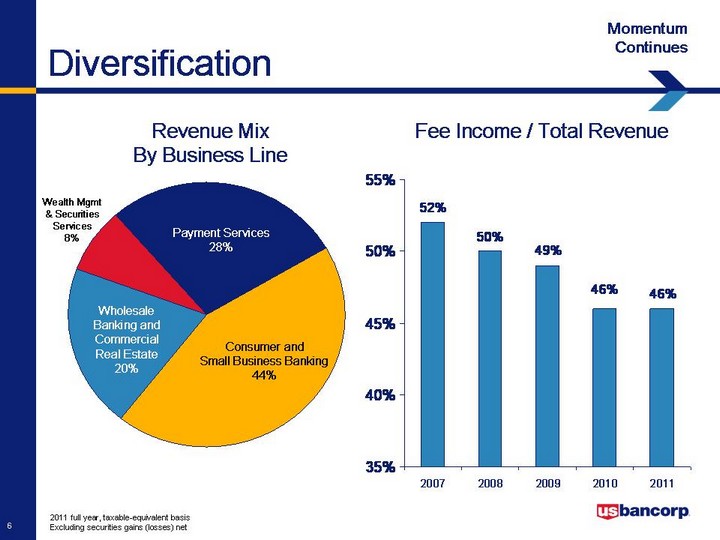
| 2011 full year, taxable-equivalent basis Excluding securities gains (losses) net Consumer Wholesale PCTAM Payments Treas & Corp Support Revenue 44 20 8 28 0 2007 2008 2009 2010 2011 Fee Income 0.52 0.5 0.49 0.46 0.46 Core 0 0 0 0 0 Revenue Mix By Business Line Fee Income / Total Revenue Consumer and Small Business Banking 44% Payment Services 28% Wealth Mgmt & Securities Services 8% Wholesale Banking and Commercial Real Estate 20% Diversification Momentum Continues |
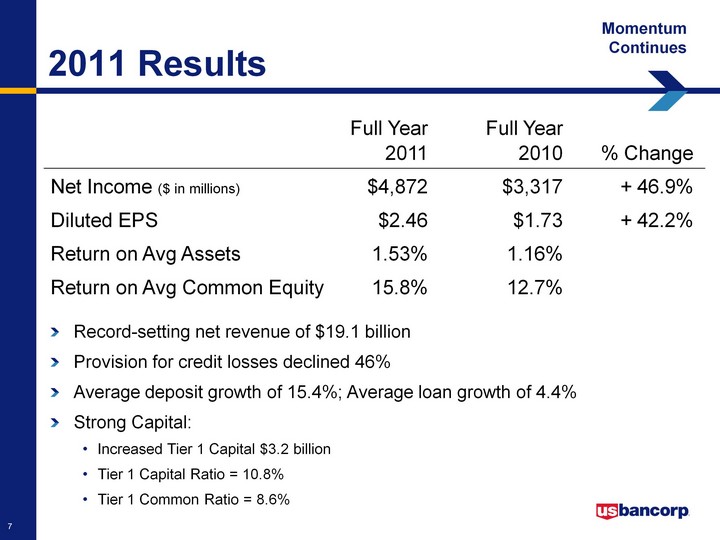
| Full Year Full Year 2011 2010 % Change Net Income ($ in millions) $4,872 $3,317 + 46.9% Diluted EPS $2.46 $1.73 + 42.2% Return on Avg Assets 1.53% 1.16% Return on Avg Common Equity 15.8% 12.7% 2011 Results Momentum Continues Record-setting net revenue of $19.1 billion Provision for credit losses declined 46% Average deposit growth of 15.4%; Average loan growth of 4.4% Strong Capital: Increased Tier 1 Capital $3.2 billion Tier 1 Capital Ratio = 10.8% Tier 1 Common Ratio = 8.6% |

| Source: SNL and company reports Peer banks: BAC, BBT, FITB, JPM, KEY, PNC, RF, STI and WFC USB Peer 1 Peer 2 Peer 3 Peer 4 Peer 5 Peer 6 Peer 7 Peer 8 Peer 9 ROA 0.0119 0.0103 0.0099 0.0074 0.0066 0.0015 0.0011 0.0001 USB Peer 1 Peer 2 Peer 3 Peer 4 Peer 5 Peer 6 Peer 7 Peer 8 Peer 9 ROCE 0.129 0.1 0.095 0.077 0.071 USB Peer 1 Peer 2 Peer 3 Peer 4 Peer 5 Peer 6 Peer 7 Peer 8 Peer 9 ER 0.498 0.563 0.574 0.593 0.603 0.604 0.671 0.7 0.7 0.717 Return on Average Assets Return on Average Common Equity Efficiency Ratio USB Peer 1 Peer 2 Peer 3 Peer 4 Peer 5 Peer 6 Peer 7 Peer 8 Peer 9 ROA 0.0153 0.0125 0.0115 0.0115 0.0104 0.0086 0.0079 0.0038 0.0006 USB Peer 1 Peer 2 Peer 3 Peer 4 Peer 5 Peer 6 Peer 7 Peer 8 Peer 9 ROCE 0.158 0.119 0.101 0.095 0.088 0.088 0.075 0.026 0 USB Peer 1 Peer 2 Peer 3 Peer 4 Peer 5 Peer 6 Peer 7 Peer 8 Peer 9 ER 0.518 0.605 0.629 0.635 0.654 0.659 0.667 0.681 0.735 0.844 Since 1Q08 Full Year 2011 Performance vs. Peers Momentum Continues |
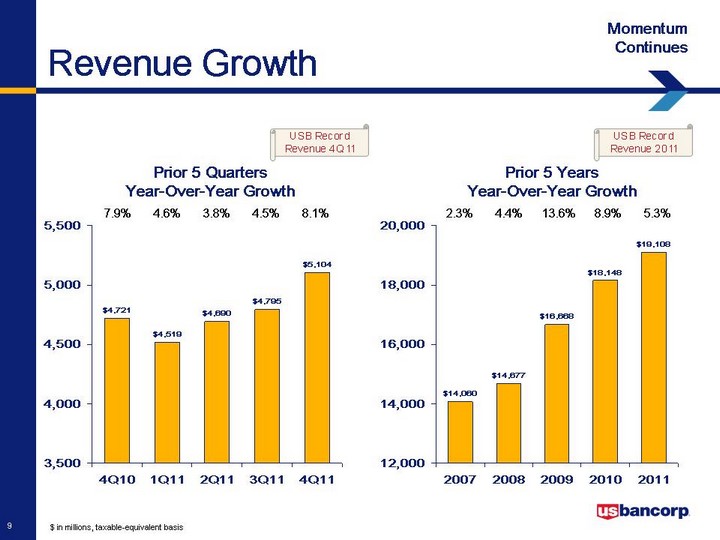
| $ in millions, taxable-equivalent basis 4Q10 1Q11 2Q11 3Q11 4Q11 Reported 4721 4519 4690 4795 5104 2007 2008 2009 2010 2011 Reported 14060 14677 16668 18148 19108 Prior 5 Quarters Year-Over-Year Growth 7.9% 4.6% 3.8% 4.5% 8.1% Prior 5 Years Year-Over-Year Growth 2.3% 4.4% 13.6% 8.9% 5.3% Revenue Growth Momentum Continues |
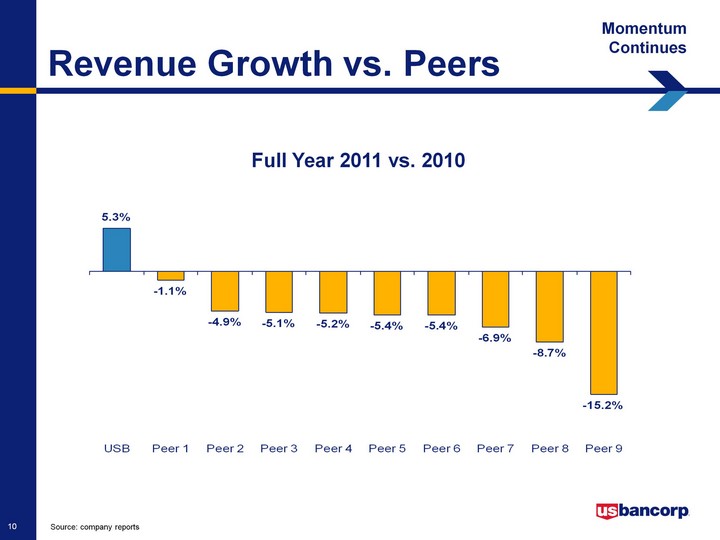
| Source: company reports USB Peer 1 Peer 2 Peer 3 Peer 4 Peer 5 Peer 6 Peer 7 Peer 8 Peer 9 Reported 0.053 -0.011 -0.049 -0.051 -0.052 -0.054 -0.054 -0.069 -0.087 -0.152 Full Year 2011 vs. 2010 Revenue Growth vs. Peers Momentum Continues |
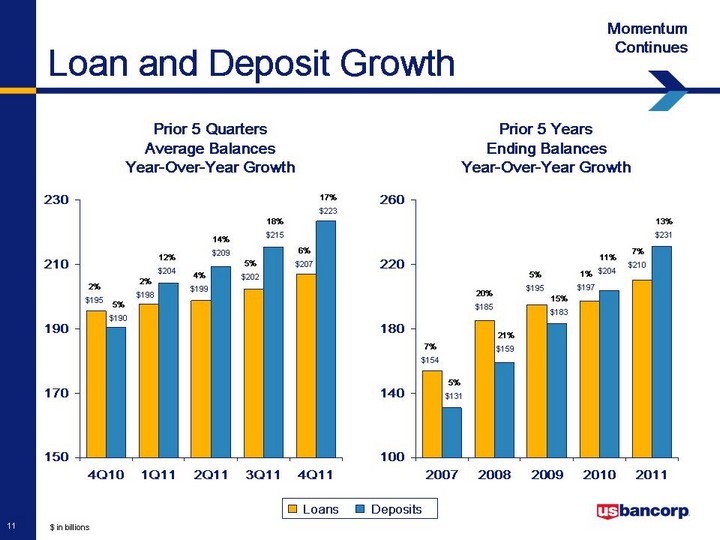
| $ in billions 4Q10 1Q11 2Q11 3Q11 4Q11 Loans 195.5 197.6 198.8 202.2 207 Deposits 190.3 204.3 209.4 215.4 223.3 2007 2008 2009 2010 2011 Loans 154 185 195 197 210 Deposits 131 159 183 204 231 6% $207 2% $195 2% $198 4% $199 5% $202 17% $223 5% $190 12% $204 14% $209 18% $215 1% $197 7% $210 7% $154 20% $185 5% $195 11% $204 13% $231 5% $131 21% $159 15% $183 Loans Deposits Prior 5 Quarters Average Balances Year-Over-Year Growth Prior 5 Years Ending Balances Year-Over-Year Growth Loan and Deposit Growth Momentum Continues |
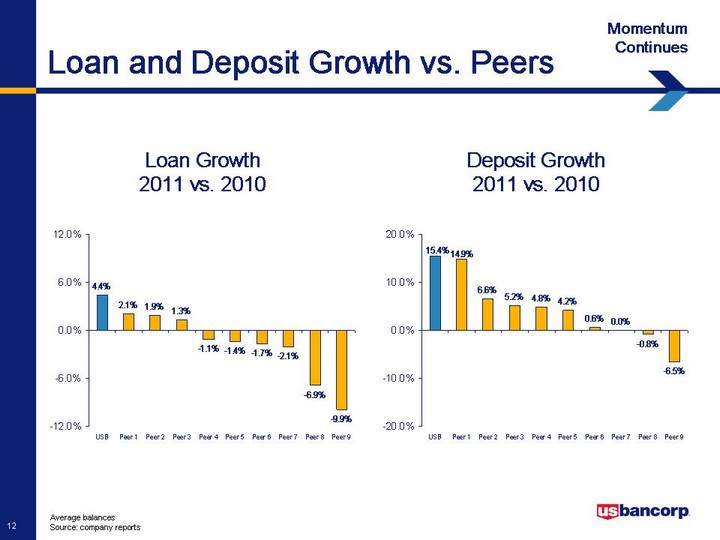
| Average balances Source: company reports USB Peer 1 Peer 2 Peer 3 Peer 4 Peer 5 Peer 6 Peer 7 Peer 8 Peer 9 Loan Growth 0.044 0.021 0.019 0.013 -0.011 -0.014 -0.017 -0.021 -0.069 -0.099 USB Peer 1 Peer 2 Peer 3 Peer 4 Peer 5 Peer 6 Peer 7 Peer 8 Peer 9 Deposit Growth 0.154 0.149 0.066 0.052 0.048 0.042 0.006 0 -0.008 -0.065 Loan Growth 2011 vs. 2010 Deposit Growth 2011 vs. 2010 Loan and Deposit Growth vs. Peers Momentum Continues |
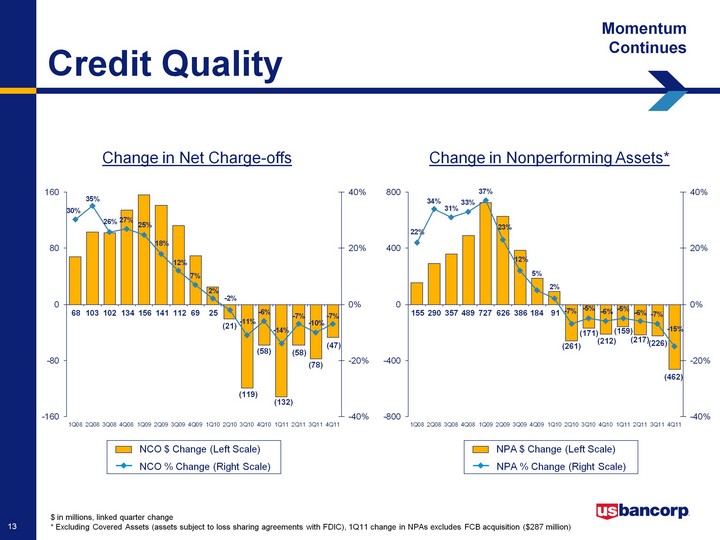
| $ in millions, linked quarter change * Excluding Covered Assets (assets subject to loss sharing agreements with FDIC), 1Q11 change in NPAs excludes FCB acquisition ($287 million) 3Q07 4Q07 1Q08 2Q08 3Q08 4Q08 1Q09 2Q09 3Q09 4Q09 1Q10 2Q10 3Q10 4Q10 1Q11 2Q11 3Q11 4Q11 NPA $ Change 76 49 155 290 357 489 727 626 386 184 91 -261 -171 -212 -159 -217 -226 -462 NPA % Change 0.13 0.08 0.22 0.34 0.31 0.33 0.37 0.23 0.12 0.05 0.02 -0.07 -0.05 -0.06 -0.05 -0.06 -0.07 -0.15 3Q07 4Q07 1Q08 2Q08 3Q08 4Q08 1Q09 2Q09 3Q09 4Q09 1Q10 2Q10 3Q10 4Q10 1Q11 2Q11 3Q11 4Q11 NCO $ Change 8 26 68 103 102 134 156 141 112 69 25 -21 -119 -58 -132 -58 -78 -47 NCO % Change 0.041884817 0.130653266 0.302222222 0.351535836 0.257575758 0.269076305 0.246835443 0.17893401 0.12056 0.07 0.02 -0.02 -0.11 -0.06 -0.14 -0.07 -0.1 -0.07 Change in Net Charge-offs Change in Nonperforming Assets* NCO $ Change (Left Scale) NCO % Change (Right Scale) NPA $ Change (Left Scale) NPA % Change (Right Scale) 103 68 (21) 25 69 112 141 156 134 102 155 290 91 184 386 626 727 489 357 (261) (119) (171) (58) (212) (132) (159) (78) (217) (58) (226) (47) (462) Credit Quality Momentum Continues |
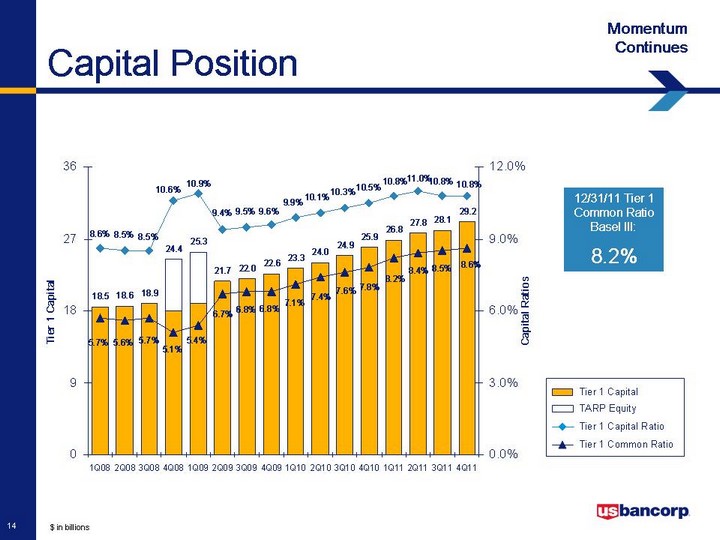
| $ in billions 4Q07 1Q08 2Q08 3Q08 4Q08 1Q09 2Q09 3Q09 4Q09 1Q10 2Q10 3Q10 4Q10 1Q11 2Q11 3Q11 4Q11 TARP 0 0 0 0 24.4 25.3 0 0 0 0 0 0 0 0 0 0 0 Tier 1 Capital Ratio 0.083 0.086 0.085 0.085 0.106 0.109 0.094 0.095 0.096 0.099 0.101 0.103 0.105 0.108 0.11 0.108 0.108 Tier 1 Common Ratio 0.056 0.057 0.056 0.057 0.051 0.054 0.067 0.068 0.068 0.071 0.074 0.076 0.078 0.082 0.084 0.085 0.086 Tier 1 Capital 17.5 18.5 18.6 18.9 18 18.9 21.7 22 22.6 23.3 24 24.9 25.9 26.8 27.8 28.1 29.2 TARP Equity Tier 1 Capital Tier 1 Capital Ratio Tier 1 Common Ratio 12/31/11 Tier 1 Common Ratio Basel III: 8.2% Capital Position Momentum Continues |
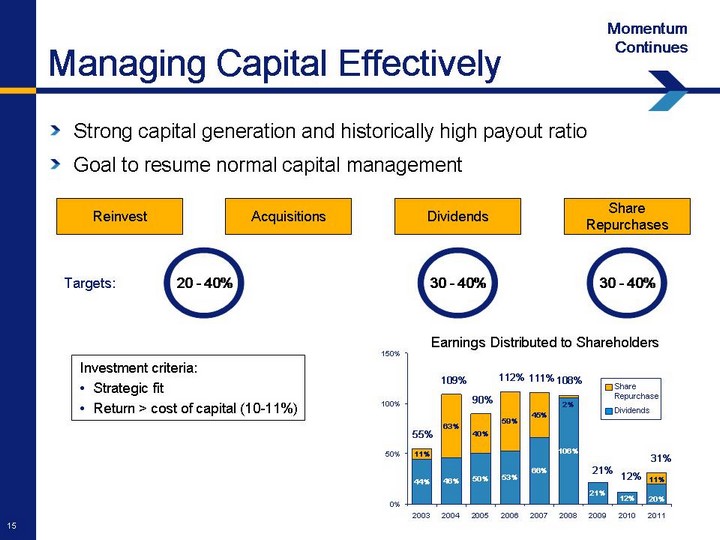
| Reinvest Acquisitions Dividends Share Repurchases 20 - 40% Targets: 30 - 40% 30 - 40% Investment criteria: Strategic fit Return > cost of capital (10-11%) 2003 2004 2005 2006 2007 2008 2009 2010 2011 Dividends 0.44 0.46 0.5 0.53 0.66 1.06 0.21 0.12 0.2 Share Repurchase 0.11 0.63 0.4 0.59 0.45 0.02 0 0 0.11 Earnings Distributed to Shareholders 90% 55% 109% 112% 111% 108% 21% 12% Dividends Share Repurchase 31% Managing Capital Effectively Momentum Continues Strong capital generation and historically high payout ratio Goal to resume normal capital management |
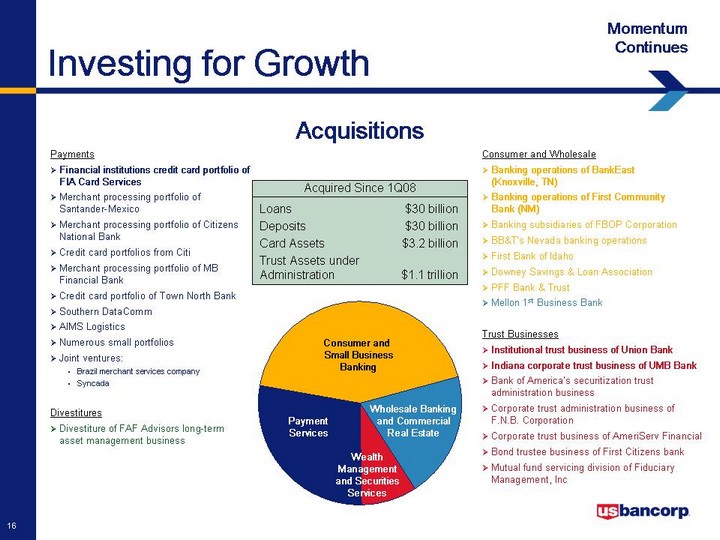
| Payments Financial institutions credit card portfolio of FIA Card Services Merchant processing portfolio of Santander-Mexico Merchant processing portfolio of Citizens National Bank Credit card portfolios from Citi Merchant processing portfolio of MB Financial Bank Credit card portfolio of Town North Bank Southern DataComm AIMS Logistics Numerous small portfolios Joint ventures: Brazil merchant services company Syncada Consumer and Wholesale Banking operations of BankEast (Knoxville, TN) Banking operations of First Community Bank (NM) Banking subsidiaries of FBOP Corporation BB&T's Nevada banking operations First Bank of Idaho Downey Savings & Loan Association PFF Bank & Trust Mellon 1st Business Bank Trust Businesses Institutional trust business of Union Bank Indiana corporate trust business of UMB Bank Bank of America's securitization trust administration business Corporate trust administration business of F.N.B. Corporation Corporate trust business of AmeriServ Financial Bond trustee business of First Citizens bank Mutual fund servicing division of Fiduciary Management, Inc Divestitures Divestiture of FAF Advisors long-term asset management business Acquisitions Consumer Wholesale PCTAM Payments Revenue 43 20 9 28 Consumer and Small Business Banking Payment Services Wealth Management and Securities Services Wholesale Banking and Commercial Real Estate Loans $30 billion Deposits $30 billion Card Assets $3.2 billion Trust Assets under Administration $1.1 trillion Acquired Since 1Q08 Investing for Growth Momentum Continues |
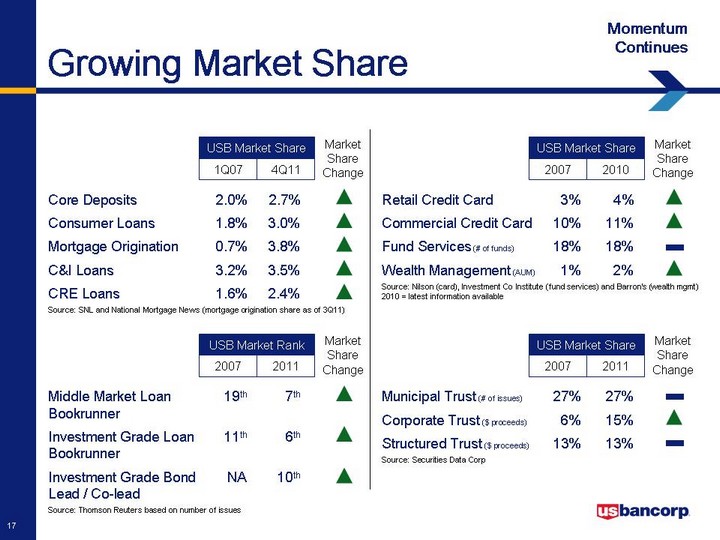
| Middle Market Loan 19th 7th Bookrunner Investment Grade Loan 11th 6th Bookrunner Investment Grade Bond NA 10th Lead / Co-lead Source: Thomson Reuters based on number of issues 2011 2007 USB Market Rank Market Share Change Core Deposits 2.0% 2.7% Consumer Loans 1.8% 3.0% Mortgage Origination 0.7% 3.8% C&I Loans 3.2% 3.5% CRE Loans 1.6% 2.4% Source: SNL and National Mortgage News (mortgage origination share as of 3Q11) 4Q11 1Q07 USB Market Share Market Share Change 2010 2007 USB Market Share Market Share Change Retail Credit Card 3% 4% Commercial Credit Card 10% 11% Fund Services (# of funds) 18% 18% Wealth Management (AUM) 1% 2% Source: Nilson (card), Investment Co Institute (fund services) and Barron's (wealth mgmt) 2010 = latest information available Municipal Trust (# of issues) 27% 27% Corporate Trust ($ proceeds) 6% 15% Structured Trust ($ proceeds) 13% 13% Source: Securities Data Corp 2011 2007 USB Market Share Market Share Change Growing Market Share Momentum Continues |
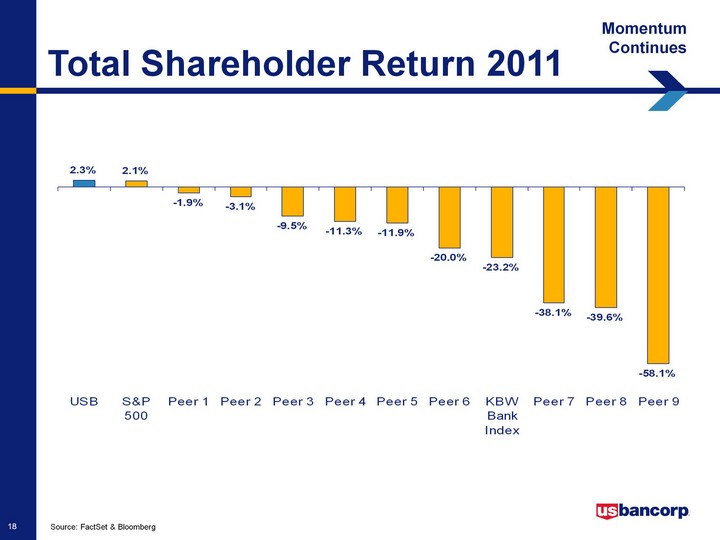
| Source: FactSet & Bloomberg USB S&P 500 Peer 1 Peer 2 Peer 3 Peer 4 Peer 5 Peer 6 KBW Bank Index Peer 7 Peer 8 Peer 9 TSR 0.023 0.021 -0.019 -0.031 -0.095 -0.113 -0.119 -0.2 -0.232 -0.381 -0.396 -0.581 Total Shareholder Return 2011 Momentum Continues |
| U.S. Bancorp The Momentum Continues Forward Focus Current Initiatives Long-term Growth Drivers |
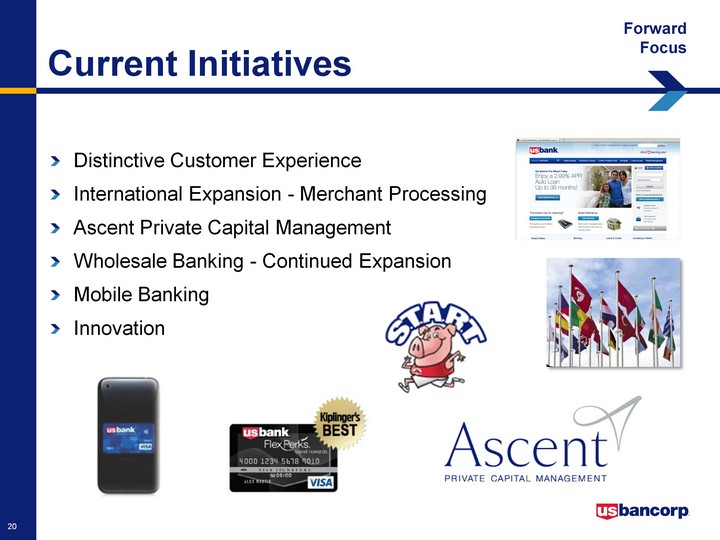
| Current Initiatives Forward Focus Distinctive Customer Experience International Expansion - Merchant Processing Ascent Private Capital Management Wholesale Banking - Continued Expansion Mobile Banking Innovation |
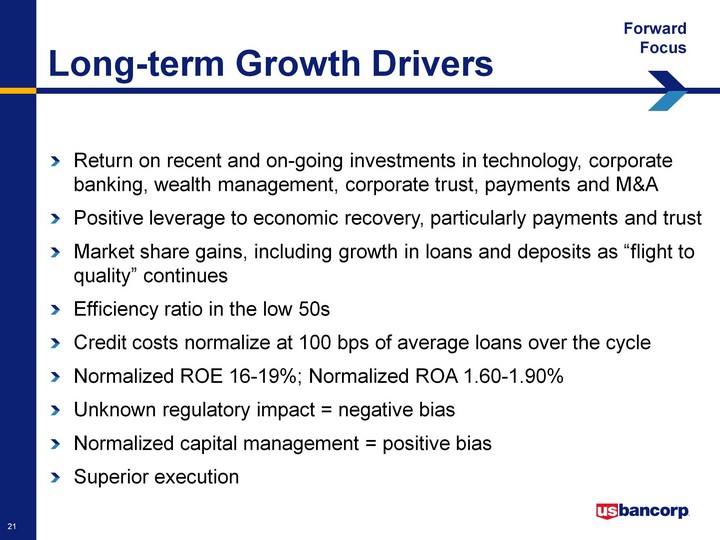
| Long-term Growth Drivers Forward Focus Return on recent and on-going investments in technology, corporate banking, wealth management, corporate trust, payments and M&A Positive leverage to economic recovery, particularly payments and trust Market share gains, including growth in loans and deposits as "flight to quality" continues Efficiency ratio in the low 50s Credit costs normalize at 100 bps of average loans over the cycle Normalized ROE 16-19%; Normalized ROA 1.60-1.90% Unknown regulatory impact = negative bias Normalized capital management = positive bias Superior execution |
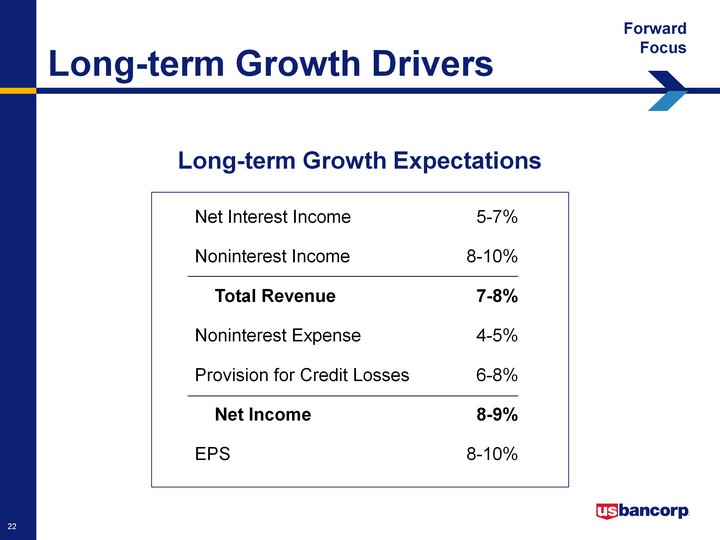
| Net Interest Income 5-7% Noninterest Income 8-10% Total Revenue 7-8% Noninterest Expense 4-5% Provision for Credit Losses 6-8% Net Income 8-9% EPS 8-10% Long-term Growth Drivers Forward Focus Long-term Growth Expectations |
| continues Momentum |
| Appendix |
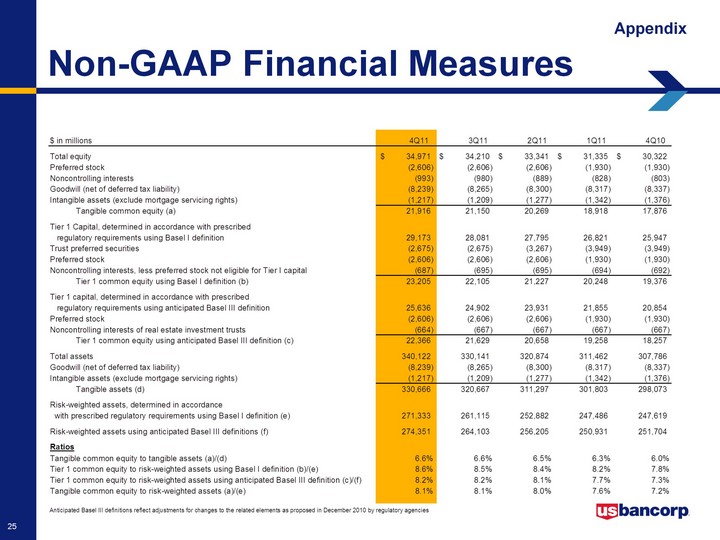
| Non-GAAP Financial Measures Appendix |