Attached files
| file | filename |
|---|---|
| 8-K - CURRENT REPORT ON FORM 8-K - Clearwater Paper Corp | d312308d8k.htm |
 Clearwater Paper Corporation
Vertical Partners Global Paper & Packaging Conference
March 8, 2012 |
 1
Forward-Looking Statements
•
difficulties
with
the
completion
of
our
new
tissue
manufacturing
and
converting
facilities,
including
the
completion
of
our
new
through-air-dried
paper
machine;
•
difficulties with the integration process or the realization of the benefits expected from
our acquisition of Cellu Tissue; •
changes in raw material and energy costs, including changes in the cost and availability of
wood fiber and wood pulp; •
changes in freight costs and disruptions in transportation services;
•
the loss of large customers;
•
customers' product preferences;
•
changes in the United States and international economies;
•
cyclical industry conditions;
•
competitive pricing pressure for the company's products;
•
reliance on a limited number of third-party suppliers of raw materials;
•
an inability to successfully implement our expansion strategies;
•
labor disruptions;
•
unanticipated manufacturing disruptions;
•
changes in general and industry-specific laws and regulations; and
•
unforeseen environmental liabilities or expenditures.
Forward-looking statements contained in this presentation present management’s
views only as of the date of this presentation. We undertake no obligation to publicly update forward-
looking statements, whether as a result of new information, future events or otherwise.
This presentation contains, in addition to historical information, certain
forward-looking statements within the meaning of the Private Securities Litigation Reform Act of 1995, including
statements regarding our strategies to grow our business, optimize profitability and build a
high performance culture, the expected delivery and budget relating to our new tissue
machine and converting lines in Shelby, North Carolina, expected future cost savings from
cost synergies relating to our Cellu Tissue acquisition, efficiency projects and reductions to
our cost structure, including our Lean manufacturing program, future growth and market
opportunities, including in the eastern U.S., internal and external pulp purchases and transfers,
internal pulp production and requirements, customer purchases of Private Label tissue,
production capacity of operating divisions, our share repurchase program and the expected
benefit thereof, our capital allocation objectives, our financial priorities such as growing
free cash flow and maintaining modest leverage, estimated annual EBITDA sensitivities, sales
volumes, input costs, and our financial condition and results of operations. Words such as
“anticipate,” “expect,” “intend,” “will,” “plan,” “goals,” “target,” “project,” “believe,” “schedule,”
“estimate,” “may,” and similar expressions are intended to identify such
forward-looking statements. These forward-looking statements are based on management’s current
expectations, estimates, assumptions and projections that are subject to change. Our actual
results of operations may differ materially from those expressed or implied by the forward-
looking statements contained in this presentation. Important factors that could cause or
contribute to such differences include the risk factors described in Item 1A of Part I of our Form
10-K for the year ended December 31, 2011, as well as the following:
|
 2
•
We are a company formed in late 2008 with
more than 60 years of operating history
•
A leader in Private Label consumer tissue and
bleached paperboard
•
Focused on producing high quality products that
help our customers build their brands
•
Operate
in
two
segments
of
similar
size
¹
–
Pulp and Paperboard: 43%
–
Consumer Products: 57%
•
Financial overview
–
2011 Net Sales: $1.9 billion
–
2011
Adjusted
EBITDA:
$195.5
million
²
–
5 year average annual Free Cash Flow (FCF)
generation
(2007-2011):
$48.0
million
²
1
Based on net sales for 2011
Introduction to Clearwater Paper
2
See
“Appendix:
Detailed
Financials”
for
the
definition
of
Adjusted
EBITDA
and
Free
Cash
Flow
as
well
as
the
reconciliation to the most comparable GAAP measures |
 3
•
Lead Private Label quality
•
Expand geographically
•
Expand retail channel
penetration
Our Strategy
•
Improve sales mix
•
Reduce costs
•
Continue to improve quality
•
Develop common culture
•
Drive for results
•
Attract and retain high
performers
Build a High
Performance
Culture
Optimize
Profitability of
Paperboard
Business
Grow our Tissue
Business |
 4
•
Expansion of the Consumer Products Segment:
–
acquisition of Cellu Tissue, and
–
start up of two new converting lines and initiation of construction of our new
TAD paper machine in Shelby, NC
•
Continuing to optimize the pulp and paperboard mills to improve cost
structure •
First U.S. Private Label manufacturer to offer FSC products
•
2-for-1 stock split and $30 million repurchase program in third quarter
2011 •
Sold our sawmill for $30 million in late 2011 to allow the Pulp and Paperboard
Segment to focus on core operations
Accomplishments Since the 2008 Spin-off |
 5
•
Complete
new
paper
machine
and
corresponding
converting
lines
in
Shelby,
NC
on time and on budget
•
Expand customer base to align with the expected start up of the paper machine
in fourth quarter 2012
•
Launch Lean Manufacturing program company-wide to reduce costs and
improve efficiencies
•
Achieve $35-$40 million annual run rate cost synergies associated with the
acquisition of Cellu Tissue
2012 Objectives |
 6
New Paper Machine |
 Shelby Paper Machine –
Our Accomplishments and Goals
•
Remain ON BUDGET with original estimate
of $260-$280 million
•
Remain ON TIME with paper machine
estimated to start up in fourth quarter 2012
•
Manufacture and deliver QUALITY products
•
Remain ON TASK with dedicated project
team to ensure results
7
•
First two converting lines operational
•
Consolidate third-party warehouse to
Shelby
•
Paper machine and remaining
converting lines operational
•
Commence product trials |
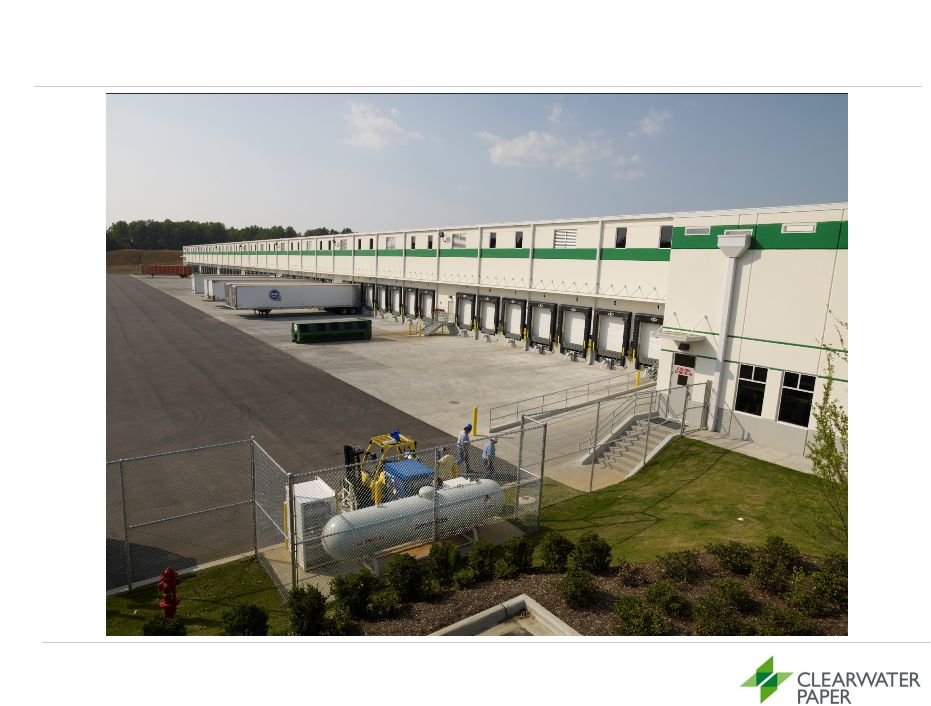 Shelby
8 |
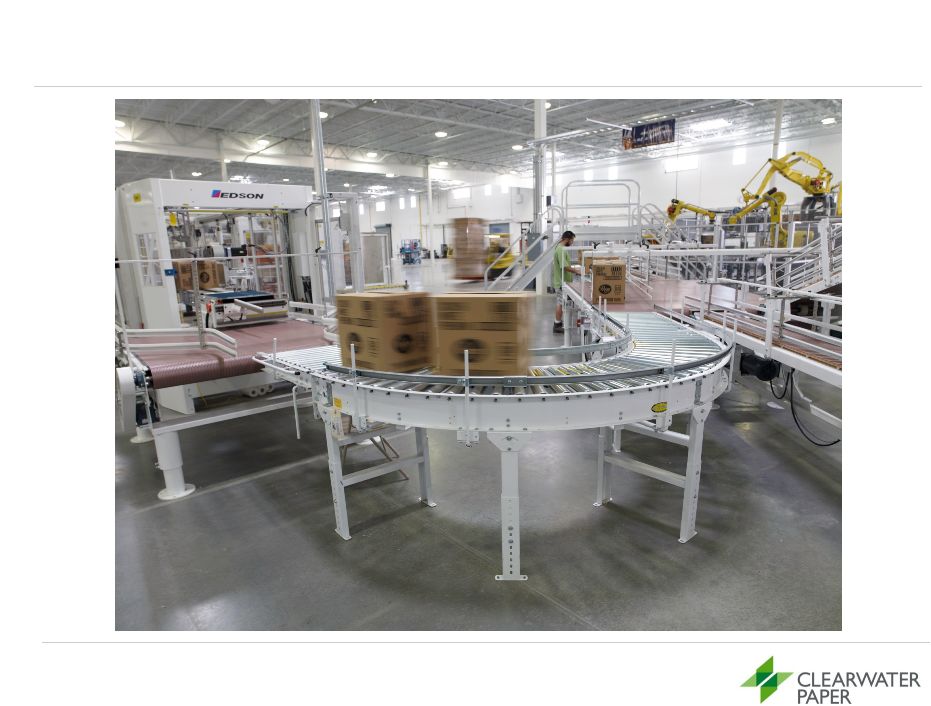 Shelby
9 |
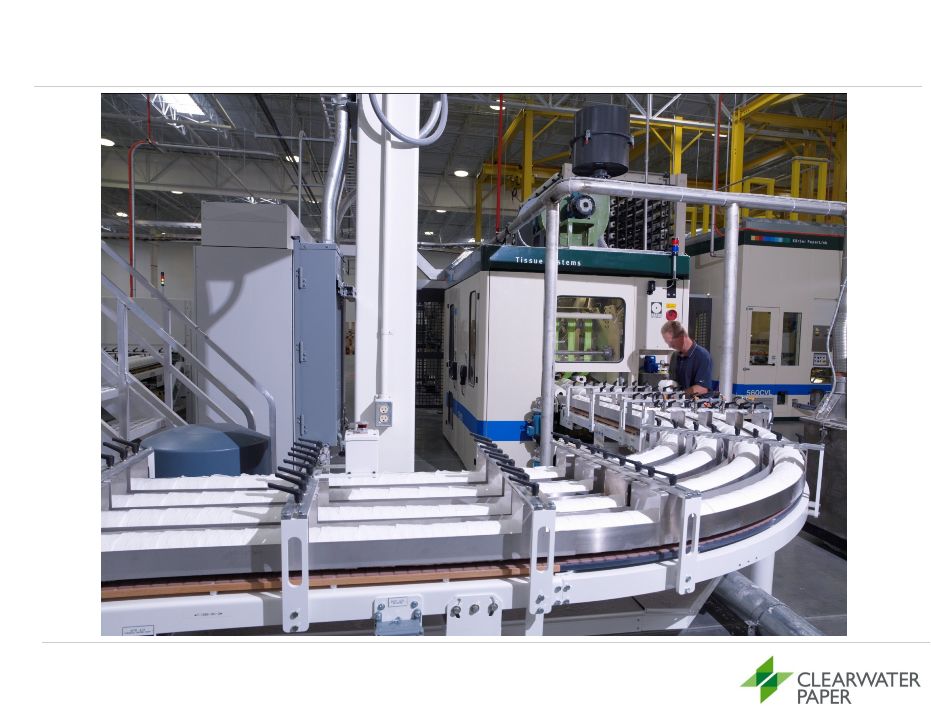 Shelby
10 |
 11
Cellu Tissue Acquisition |
 12
The acquisition of Cellu Tissue has provided us with:
Strategic Benefits of Acquisition
•
A national manufacturing footprint that allows greater
operational efficiencies
•
New retail channel opportunities
•
An estimated $15-$20 million in cost synergies in 2012
and an estimated cost synergies annual run rate of $35-
$40 million by the end of 2012 |
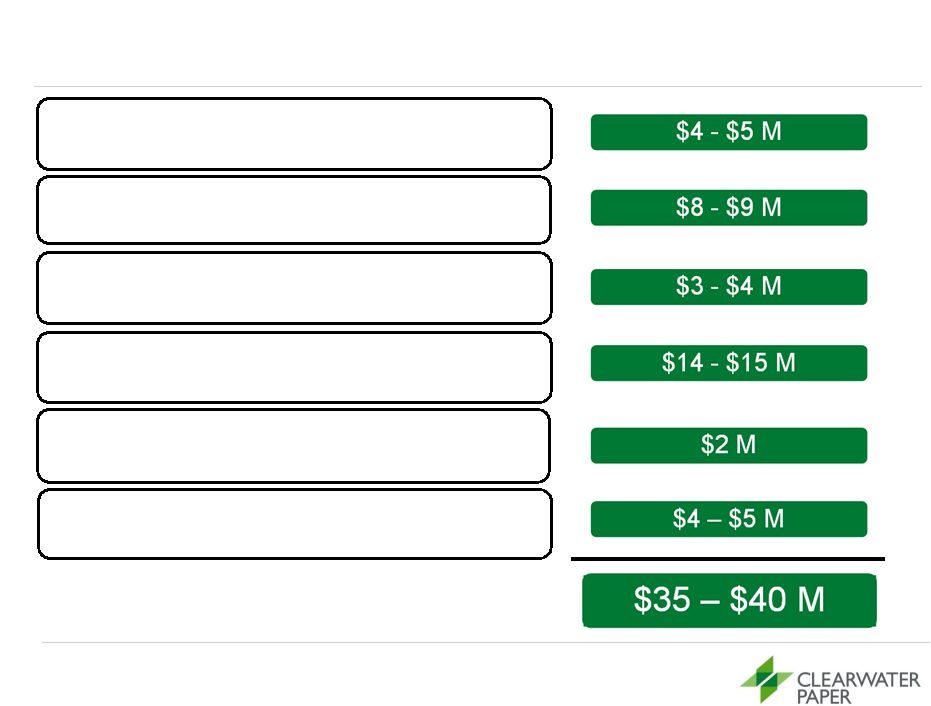 Breakdown
of
Estimated
Annual
Acquisition
Cost
Synergies
1
13
Manufacturing
–
Moving parent rolls to
converted cases
Transportation
–
Product spec changes and
lower miles
Warehousing
–
Closing duplicate facilities
Procurement
–
Purchasing power and
economies of scale
Fiber
–
Increased use of internal pulp
Wages
–
Streamlining processes and
overhead
1
Estimated annual run rate cost synergies of $35-$40 million by the end of
2012 |
 14
Consumer Tissue |
 15
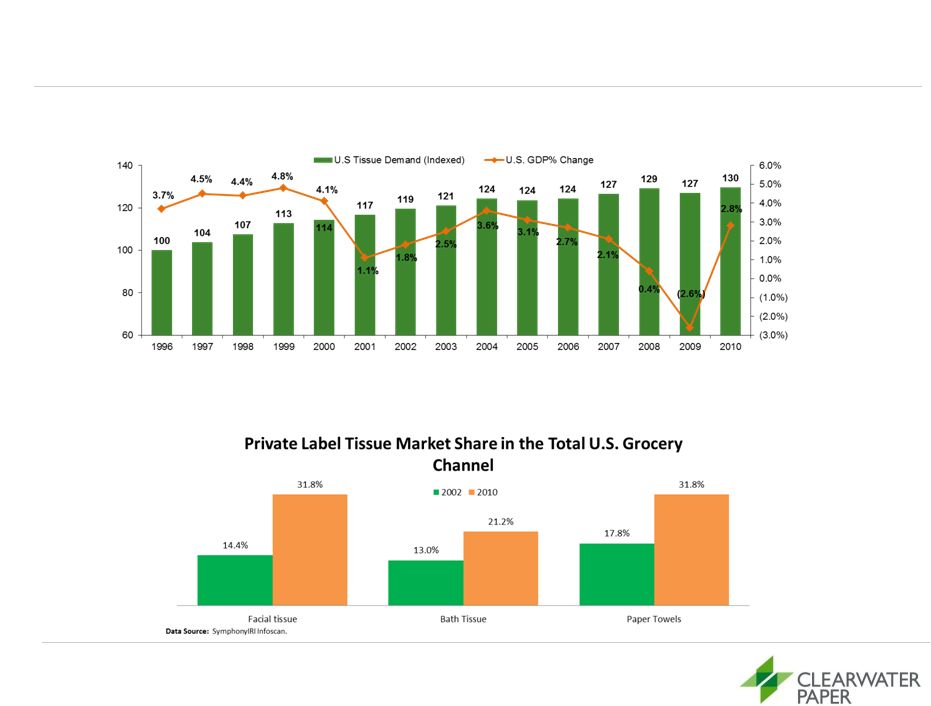
Attractive Industry Characteristics
Within
the
tissue
market,
Private
Label
penetration
has
also
grown
substantially
since
2002
²
The
tissue
market
has
grown
an
average
of
2%
annually
since
1996
¹
Source: RISI and IRI
1 Based on converted short tons
2 Represents market share as a % of sales in U.S. grocery channel
|
 16
Therefore they require:
•
National brand-like quality to support high quality store
brands
•
High quality packaging and branding support
•
Complete mix of product offerings to support retailer
assortment objectives
•
Category management support and expertise
•
Experience and execution to deliver a comprehensive
Private Label tissue program
Private Label is a Strategic Focus for Retailers |
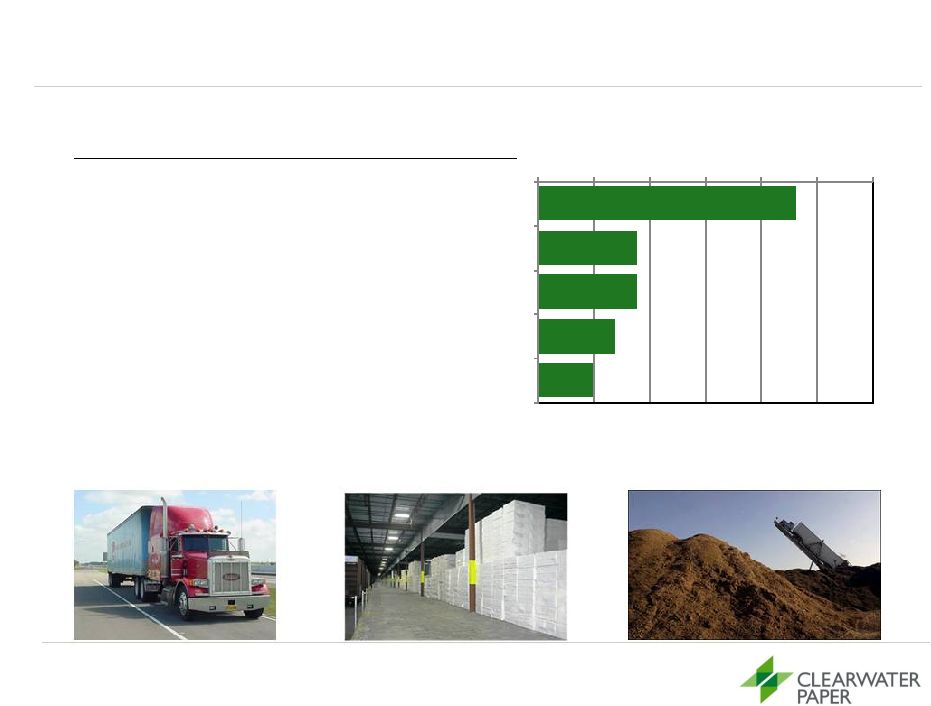
 Tissue is an Important Category for U.S. Retailers
Segment
% Category (cases)
Annual Sales
Bath Tissue
53%
$4.2B
Paper Towels
32%
$2.5B
Facial Tissue
10%
$795MM
Paper Napkins
5%
$360MM
Est. Total Category
$7.86B
SOURCE: 52 Week Sales Food, Drug, Mass without Wal-Mart, May 29, 2011,
Symphony IRI 17 |
 Private Label Quality is More Important Than Ever Before
18
Mid 60’s to 70’s
2011
•
Private Label has become more brand-like
in quality since the early days of generic
store brand tissue
•
Clearwater Paper manages over 1,300 retail
package SKU’s for its customers |
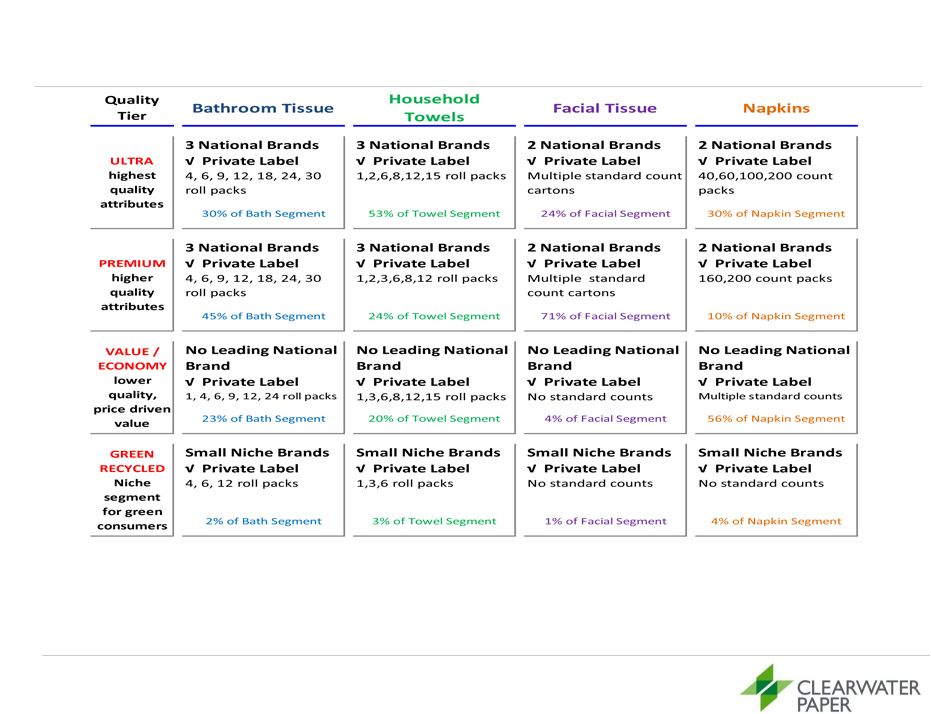 19
Complex Segmentation Requires Expertise
•
Clearwater Paper is well represented in all segments of the tissue category,
including a leading presence in the value/economy product tier
•
Clearwater Paper is the category leader in providing a full-range of product
tier Private Label offerings nationwide |
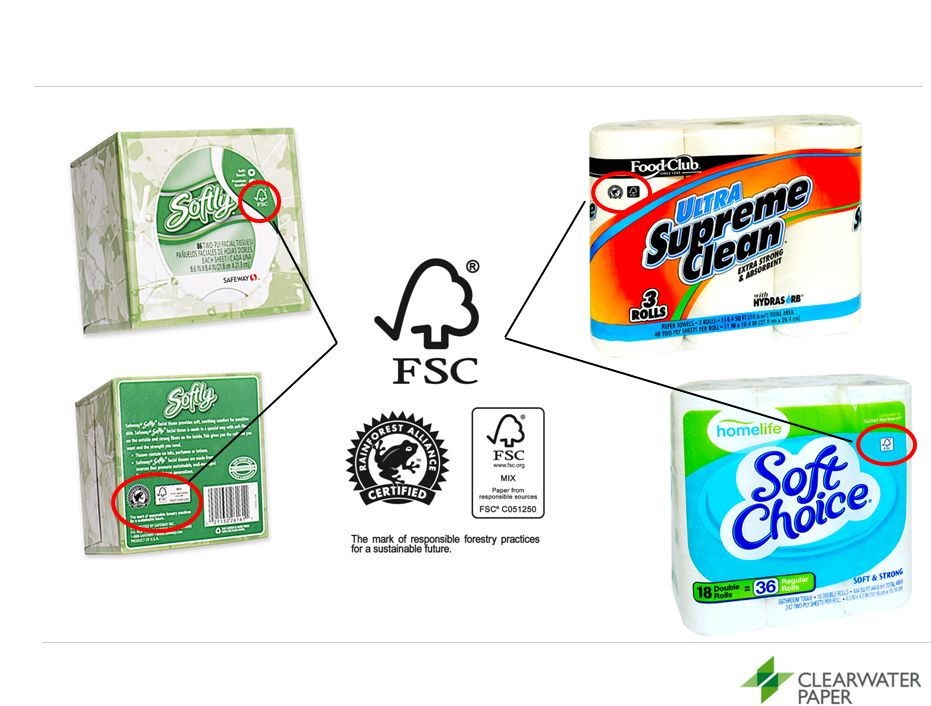 20
Clearwater Paper Adds Unique Value Through FSC and
Rainforest Alliance Certification |
 21
Paperboard |
 22
Attractive Industry Characteristics
Source: RISI
1 Top 5 manufacturers in 1998 were International Paper, Westvaco,
Temple-Inland, Georgia-Pacific and Potlatch. Top 5 manufacturers in 2011 were International Paper, MeadWestvaco,
Georgia-Pacific, Evergreen Packaging and Clearwater Paper
2 Based on tons produced
3 Average price per short ton of 16 pt. SBS folding carton C1S
2011 North American Bleached
Paperboard (SBS) Production
Pulp and Paperboard
Capacity
Top 5 Manufacturers
Stable demand for U.S. paperboard products
Demand
Price
1 |
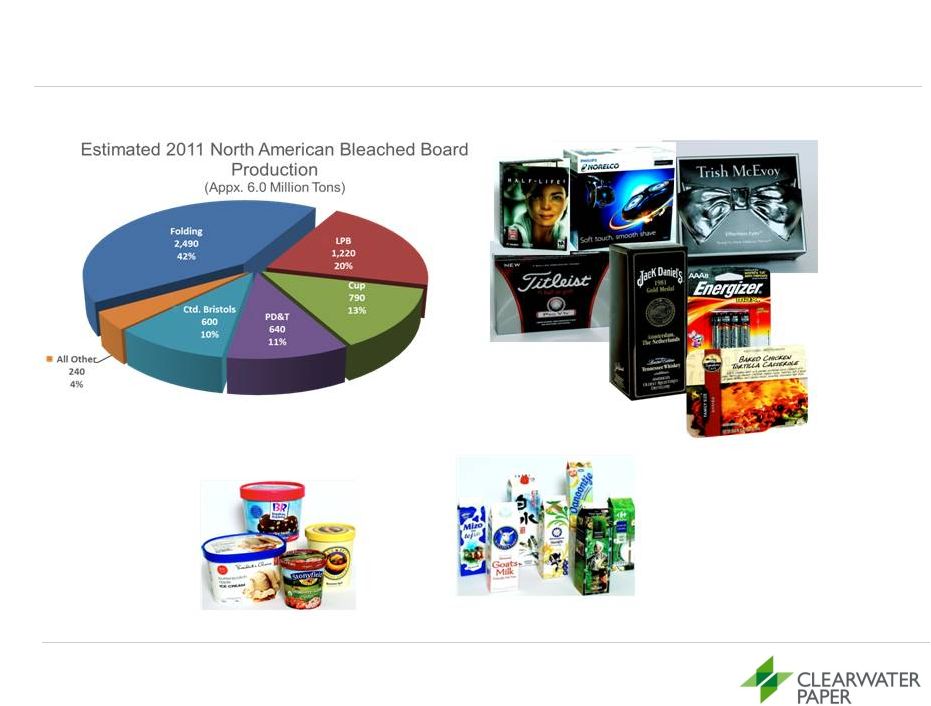 Estimated Industry Mix
23
SOURCE: RISI / Company Websites / Internal Estimates
Cup
Liquid Packaging
Folding/CIS |
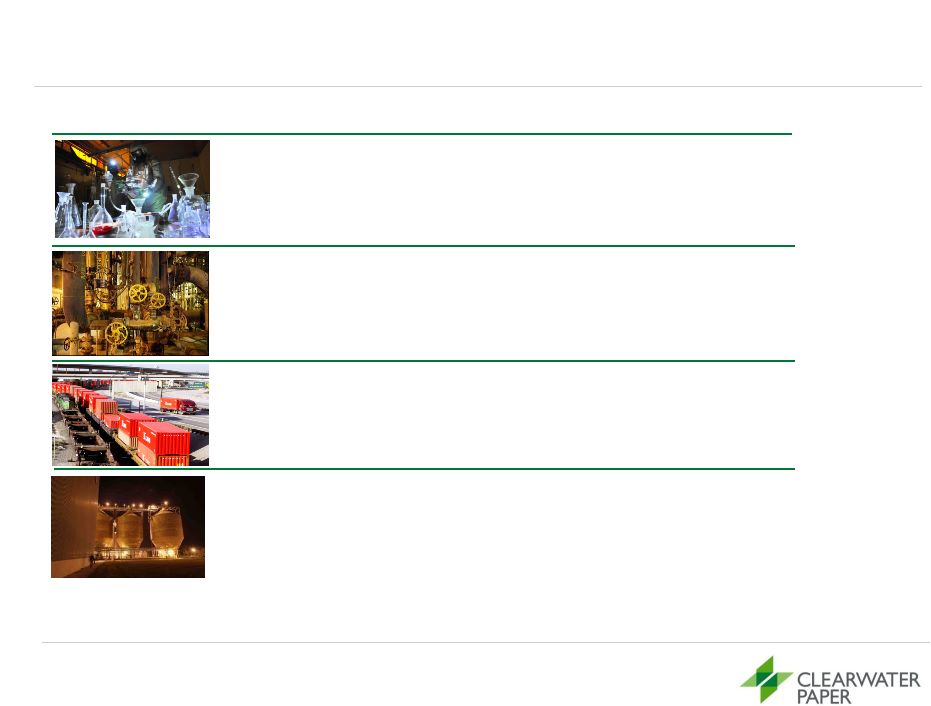
 24
Efficiency and Optimization
•
Lean manufacturing initiatives focusing on non-capital solutions
for driving out waste and improving quality
•
Sold our sawmill in late 2011 for approximately $30 million and
signed a long-term residual supply agreement
•
Cost reduction projects such as:
•
Lower Columbia reload facility for sawdust to increase fiber
supply
•
Chip screening at Lewiston to improve quality
•
Strong pulp integration –
we internally produced approximately
64% of our pulp requirements in 2011 |
 Chip Screening
25 |
 26
Financial Overview |
 Financial Goals and Priorities
•
Create strong shareholder return
•
Grow free cash flow through strong operating performance
•
Maintain modest leverage in the range of Net Debt/EBITDA of
1x –
4x
•
Deploy capital effectively
•
Focus on appropriate liquidity levels for growth and business
cycles
27 |
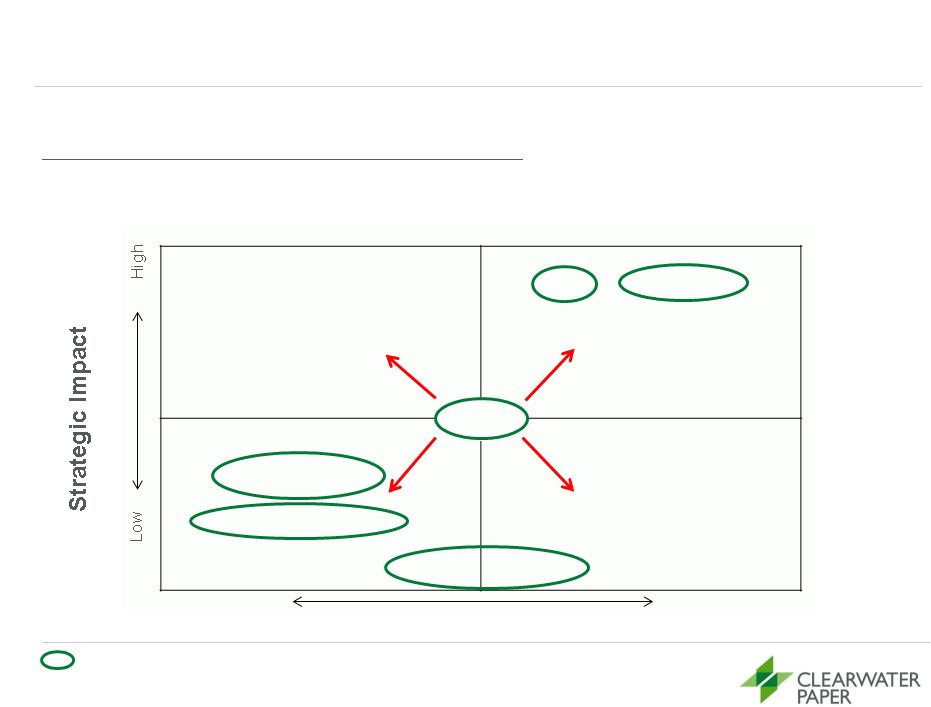 28
Our objective is to allocate capital using a dynamic framework to
create strong returns to shareholders
while providing appropriate
liquidity to meet growth objectives and compete effectively.
Capital Allocation
Return Timeframe
Greenfield
M&A
Stock Repurchase
Debt Pay Down
Pension Payments
Dividend
Capital allocation CLW has deployed
Shorter
Longer
Illustrative of Projects Meeting Return Hurdle Rates
Capital |
 Share Repurchase
•
Authorization to repurchase up to $30 million of common stock
•
Purchases help offset share dilution from equity incentive plans
•
During the fourth quarter of 2011 we repurchased 41,700 shares
of outstanding common stock at an average price of $32.30 per
share
•
Through year-end 2011 we had repurchased 333,300 shares at a
total cost of $11.3 million
29 |
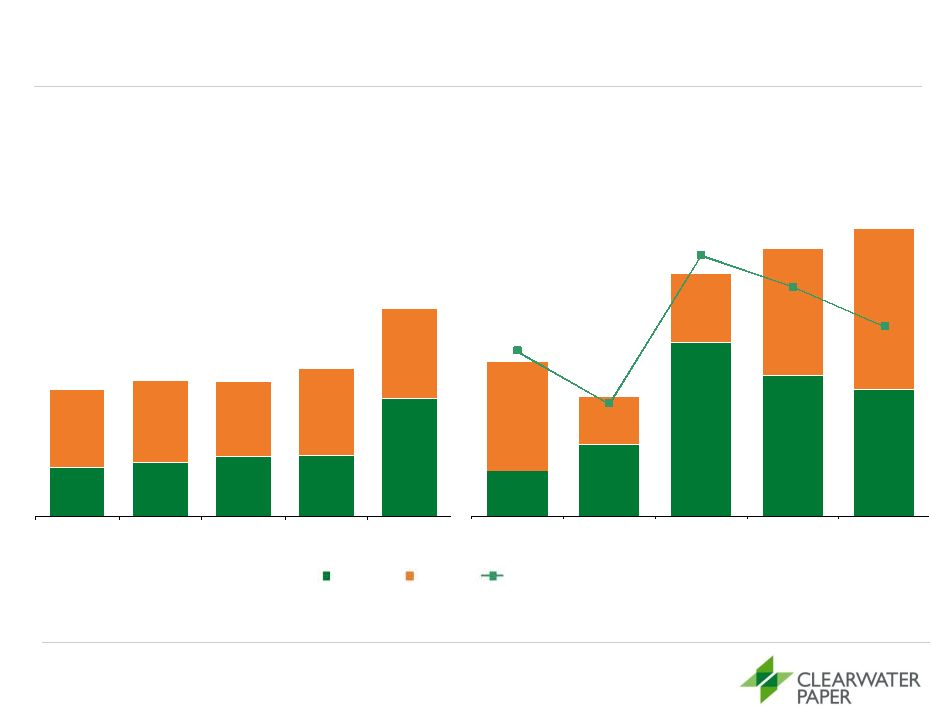 $196
Financial Track Record
$34
$53
$128
$104
$93
$80
$35
$51
$94
$134
8.8%
6.0%
13.9%
12.2%
10.1%
2007
2008
2009
2010
2011
Adjusted
EBITDA
and
Segment
Adjusted
EBITDA
2
5 Yr. Average: $143
$452
$504
$554
$570
$1,092
$731
$751
$696
$803
$836
2007
2008
2009
2010
2011
30
($ in millions)
Net Sales and Segment Net Sales
1
$1,183
$1,255
$1,250
$104
$75
5 Yr. Average: $1,398
$174
$1,373
$167
$1,928
1 Excludes
intersegment
net
sales
and
transfers.
Net
sales
for
2010
for
CPD
includes
four
days
of
Cellu
Tissue
results.
Prior
periods
have
no
Cellu
Tissue
amounts
2 See
Appendix:
“Detailed
Financials”
for
the
definition
of
Adjusted
EBITDA
and
Segment
Adjusted
EBITDA
as
well
as
the
reconciliation
to
the
most
comparable
GAAP
measures
3 Adjusted
EBITDA
margin
percentage
calculated
by
dividing
Adjusted
EBITDA
by
Net
Sales
CPD
Adj. EBITDA Margin %
3
PPD |
 Historical Cost Drivers –
Wood Fiber
31
Total Cost
1
:
% of Total
Cost of Sales
2009
2010
2008
$325.4 M
28%
$259.6 M
25%
$304.5 M
26%
1
Excludes intersegment amounts and Cellu Tissue amounts prior to acquisition
•
Wood fiber includes pulp, wood chips, sawdust and saw logs (until the
November 28, 2011 sale of our sawmill)
•
Generally we use a mix of pulp including northern softwood, southern
softwood, northern hardwood, eucalyptus and recycled
•
In 2011, we utilized 95% of our internally generated pulp which represented
approximately 64% of our total pulp needs
2011
$487.6 M
29%
Wood
Fiber |
 Historical Cost Drivers –
All Other
32
Total Cost:
% of Total
Cost of Sales
2009
2010
Energy
2008
Total Cost:
% of Total
Cost of Sales
Total
Cost
1
:
% of Total
Cost of Sales
$143.0 M
12%
$114.7 M
10%
$97.3 M
9%
$92.0 M
8%
$123.2 M
10%
$100.3 M
9%
$117.3 M
10%
$ 61.9 M
5%
$70.0 M
7%
$82.4 M
7%
$123.2 M
12%
$132.3 M
11%
Maintenance
& Repairs
Total Cost:
% of Total
Cost of Sales
Chemicals
1
Excludes related labor costs
Transportation
2011
$130.2 M
8%
$148.1 M
9%
$99.8 M
6%
$174.7 M
10% |
 33
Estimated Annual Cost Sensitivities
Change
2011
EBITDA
Variable
Units
$/Unit
Units
Purchased Pulp
$/Tonne
$50.00
450,000
+/-
$23
Chips/Sawdust
$/Ton
$5.00
1,750,000
+/-
$9
Transportation
$/Gallon
$1.00
8,820,000
+/-
$9
Chemicals
$/Prod Ton
$5.00
1,300,000
+/-
$7
Natural Gas
$/mmbtu
$0.50
10,400,000
+/-
$5
$0
$5
$10
$15
$20
$25
$30
($ Millions) |
 34
($ in millions)
1
See Appendix “Detailed Financials”
for the definition of EBITDA, Adjusted EBITDA and Free Cash Flow as well as a
reconciliation to the most comparable GAAP measures. 2009, 2010 and
2011
amounts
are
Adjusted
EBITDA
and
all
other
periods
represent
EBITDA
2
See Appendix “Detailed Financials”
for supporting schedules
3
We converted gallons previously claimed under the Alternative Fuel Mixture Tax
Credit, or AFMTC, to the Cellulosic Biofuel Producer Credit, or CBPC Free Cash
Flow 2011 free cash flow was impacted by Shelby capital, taxes paid in
connection with our
transition
to
CBPC
³
and
pension
funding
2007
2008
2009
2010
2011
EBITDA/Adjusted
EBITDA
¹
$103.7
$75.4
$174.3
$166.8
$195.5
Capital Expenditures
(20.5)
(21.3)
(19.3)
(46.1)
(134.1)
Cash
Taxes
Paid
²
(14.1)
(5.6)
(41.3)
(28.6)
(43.1)
Cash Net Interest Expense
(13.0)
(13.1)
(15.1)
(15.9)
(43.6)
Working
Capital
Dec
(Inc)
²
37.6
(21.2)
(99.6)
88.5
(85.6)
Other
Cash
Flow
Items
²
(5.7)
6.6
88.2
(44.7)
34.6
Free
Cash
Flow
¹
$88.0
$20.8
$87.2
$120.0
$(76.3) |
 35
($ in millions)
Balance Sheet
1
December 31,
December 31,
December 31,
2009
2010
2011
Assets
Current Assets
Cash, Restricted Cash & Short-Term Investments
$190.8
$148.7
$64.2
Receivables, net
94.5
153.3
176.2
Taxes Receivable
101.3
10.4
10.0
Inventories
169.8
228.3
244.1
Prepaid Expenses and Other
15.9
48.8
50.8
Non-Current Assets
Property, Plant & Equipment
364.0
654.5
735.6
Goodwill & Intangibles
-
285.9
279.2
Other
11.2
15.4
11.2
Total Assets
$947.5
$1,545.3
$1,571.3
Liabilities
Current Liabilities
Accounts Payable & Accrued Liabilities
109.8
184.6
144.6
Other
9.9
10.5
9.9
Non-Current Liabilities
Long-Term Debt
148.3
538.3
523.7
Deferred Taxes
-
61.1
69.4
Other Long-Term Liabilities
242.3
210.5
264.3
Accrued Taxes
73.5
72.0
74.5
Total Liabilities
$583.8
$1,077.0
$1,086.4
Total Stockholders' Equity
$363.7
$468.3
$484.9
Total Liabilities & Stockholders' Equity
$947.5
$1,545.3
$1,571.3
Adjusted
EBITDA
to
Interest
Expense,
net
1
11.2X
7.4X
4.4X
0.9
3.2
2.7
Total Debt/Adjusted EBITDA
1
See Appendix “Detailed Financials” for the definition of Adjusted EBITDA as well as a
reconciliation to the most comparable GAAP measure |
 36
Appendix:
Detailed Financials |
 37
Income Statement
($ in millions)
1
See Appendix for definition of EBITDA and a reconciliation to most comparable GAAP
measure 2007
2008
2009
2010
2011
Net Sales
$1,183.0
$1,255.3
$1,250.1
$1,373.0
$1,928.0
Costs & Expenses
Cost of Sales
1,083.8
1,179.4
1,052.2
1,173.8
1,702.5
Selling, General, & Administrative
46.8
47.4
71.1
100.4
110.0
Income from Canadian Lumber Settlement
-
-
-
-
-
Alternative Fuel Mixture Tax Credit
-
-
170.6
-
-
Income from Operations
$52.4
$28.5
$297.4
$98.8
$115.4
Margin (%)
4.4
%
2.3
%
23.8
%
7.2
%
6.0
%
Depreciation and Amortization
51.3
47.0
47.4
47.7
76.9
EBITDA
1
$103.7
$75.4
$338.6
$146.5
$192.7
Margin (%)
8.8
%
6.0
%
27.1
%
10.7
%
10.0
%
Interest Expense
13.0
13.1
15.5
22.6
44.8
Debt Retirement Costs
-
-
6.2
-
-
Other Expense (Income)
-
-
-
-
(0.3)
Earnings Before Income Taxes
$39.4
$15.3
$275.7
$76.2
$70.9
Income Tax Provision
14.1
5.6
93.2
2.4
31.2
Net Earnings
$25.3
$9.7
$182.5
$73.8
$39.7 |
 38
Reconciliation of GAAP to Non-GAAP:
Net Cash from Operating Activities to Free Cash Flow
($ in millions)
1
2009
amount
excludes
$170.6
million
of
alternative
fuel
mixture
tax
credits
for
the
period
late
January
through
December
31,
2009
2007
2008
2009
1
2010
2011
Net Cash Provided by Operating
Activities
$108.5
$42.1
$54.2
$185.6
$68.4
Capital Expenditures
(20.5)
(21.3)
(19.3)
(46.1)
(134.1)
Non-cash Net Interest
-
-
0.4
6.7
1.3
Non-cash Net Taxes
-
-
51.9
(26.2)
(11.9)
Free Cash Flow
$88.0
$20.8
$87.2
$120.0
$(76.3) |
  39
Free Cash Flow –
Working Capital
($ in millions)
2007
2008
2009
2010
2011
Dec (Inc) in Receivables
$18.8
$(8.8)
$9.5
$(9.9)
$(25.6)
Dec (Inc) in Tax Receivables
-
-
(101.3)
93.8
0.4
Dec (Inc) in Inventories
(8.5)
(14.0)
(16.8)
(3.9)
(18.7)
Dec (Inc) in Prepaid Expenses
0.4
(0.5)
0.1
(5.0)
(0.2)
Inc (Dec) in Taxes Payable
18.1
0.8
(0.8)
-
2.2
Inc (Dec) in Accounts Payable
and Accrued Liabilities
8.9
1.3
9.7
13.5
(43.7)
Working Capital Dec (Inc)
$37.6
$(21.2)
$(99.6)
$88.5
$(85.6) |
  40
Free Cash Flow –
Other
($ in millions)
2007
2008
2009
2010
2011
Equity-Based Compensation
Expense
$3.3
$2.3
$5.6
$8.5
$8.1
Employee Benefit Plans
(1.0)
1.1
14.1
15.0
16.9
Funding of Qualified Pension
Plans
-
-
-
(25.1)
(12.5)
Excess Tax Benefit from Share-
based Payment Arrangements
-
-
(0.1)
(0.9)
(0.9)
Change in Non-current Accrued
Taxes
-
-
73.5
(4.3)
2.5
Change in Deferred Taxes
(8.1)
4.9
(4.6)
(15.0)
14.8
Other
0.2
(1.7)
(0.3)
(22.9)
5.7
Other Cash Flow Items
$(5.7)
$6.6
$88.2
$(44.7)
$34.6 |
 41
Reconciliation of GAAP to Non-GAAP:
Clearwater Paper EBITDA and Adjusted EBITDA
1
See last page of this Appendix for definitions of EBITDA and Adjusted EBITDA
($ in millions)
2007
2008
2009
2010
2011
Net Earnings
$25.3
$9.7
$182.5
$73.8
$39.7
Income Tax Provision
14.1
5.6
93.2
2.4
31.2
Interest Expense
13.0
13.1
15.5
22.6
44.8
Earnings Before Interest and
Income Taxes
52.4
28.5
291.2
98.8
115.7
Depreciation & Amortization
51.3
47.0
47.4
47.7
76.9
EBITDA
1
$103.7
$75.4
$338.6
$146.5
$192.7
Alternative Fuel Mixture Tax
Credit
-
-
(170.6)
-
-
Debt Retirement Costs
-
-
6.2
-
-
Cellu Tissue Acquisition
Related Expenses
-
-
-
20.3
-
Lewiston, Idaho sawmill sale
related adjustments
-
-
-
-
2.9
Adjusted EBITDA¹
$103.7
$75.4
$174.3
$166.8
$195.5 |
 42
Reconciliation of GAAP to Non-GAAP:
Clearwater Paper Segment EBITDA and Segment Adjusted EBITDA
($ in millions)
1
See last page of this Appendix for definitions of Segment EBITDA and Segment
Adjusted EBITDA 2007
2008
2009
2010
2011
Consumer Products
Operating Income
$17.6
$37.3
$112.2
$80.8
$42.8
Depreciation and Amortization
16.3
15.7
16.0
17.0
50.4
Other, net
-
-
-
-
0.1
Segment EBITDA
1
$33.9
$53.0
$128.2
$97.8
$93.3
Cellu Tissue Acquisition
Related Expenses
-
-
-
6.4
-
Segment
Adjusted EBITDA
1
$33.9
$53.0
$128.2
$104.2
$93.3
Pulp & Paperboard
Operating Income
$45.0
$4.4
$201.8
$64.9
$92.8
Depreciation
34.6
30.9
29.9
28.7
26.1
Segment
EBITDA
1
$79.6
$35.3
$231.7
$93.6
$118.9
Alternative Fuel Mixture Tax
Credits
-
-
(170.6)
-
-
Lewiston, Idaho sawmill sale
related adjustments
-
-
-
-
15.4
Segment
Adjusted EBITDA
1
$79.6
$35.3
$51.1
$93.6
$134.3 |
 43
Definitions of Non-GAAP Measures
Clearwater Paper Definitions of Non-GAAP Measures
EBITDA
is a non-GAAP measure that Clearwater Paper management uses to evaluate the
cash generating capacity of Clearwater Paper. The most directly comparable
GAAP measure is net earnings. EBITDA, as defined by Clearwater Paper management, is net earnings adjusted for net
interest
expense,
income
taxes,
and
depreciation
and
amortization.
It
should
not
be
considered
as
an
alternative
to
net
earnings
computed under
GAAP.
Adjusted EBITDA
is a non-GAAP measure that Clearwater Paper management defines as EBITDA
adjusted for items that we do not believe are indicative of our core
operating performance, including acquisition related expenses and alternative fuel mixture tax credits. The most directly
comparable GAAP measure is net earnings. It should not be considered as an
alternative to net earnings computed under GAAP. Segment EBITDA
is a non-GAAP measure used by Clearwater Paper management. The most directly
comparable GAAP measure is segment operating
income.
Segment
EBITDA,
as
defined
by
Clearwater
Paper
management, is segment operating income adjusted for segment
depreciation
and
amortization.
It
should
not
be
considered
as
an
alternative to segment operating income computed under GAAP.
Segment
Adjusted
EBITDA
is
a
non-GAAP
measure
that
Clearwater
Paper
management
defines
as
Segment
EBITDA adjusted for items that we
do
not
believe
are
indicative
of
the
segment’s
core
operating
performance,
including
alternative
fuel
mixture
tax credits. The most directly
comparable GAAP measure is segment operating income. It should not be
considered as an alternative to segment operating income computed under
GAAP. Free Cash Flow
is a non-GAAP measure that Clearwater Paper management uses to evaluate the
financial performance of Clearwater Paper. The most
directly
comparable
GAAP
measure
is
net
cash
from
operating
activities. Free Cash Flow, as defined by Clearwater Paper management, is
net cash from operating cash flows adjusted for capital expenditures,
non-cash net interest and non-cash taxes. It should not be considered as an
alternative
to
net
cash
from
operating
activities
computed
under
GAAP. |
 44
Appendix:
Estimated Pulp Flow and
Synergy Example |
 45
Pulp Flows 2011
(MT)
36%
64%
Pulp Sources
Internal
90%
10%
By Division
26%
74%
Recycled/Virgin
Recycled
DIP,
Other
38%
62%
Virgin
Hardwood
•
BEK
Softwood
Consumer Products
Idaho
Pulp and Paperboard
External
450,000 MT
•
NBHK
•
SBHK
•
NBSK
•
NBHK
•
NBSK
•
SBSK
•
SOP, |
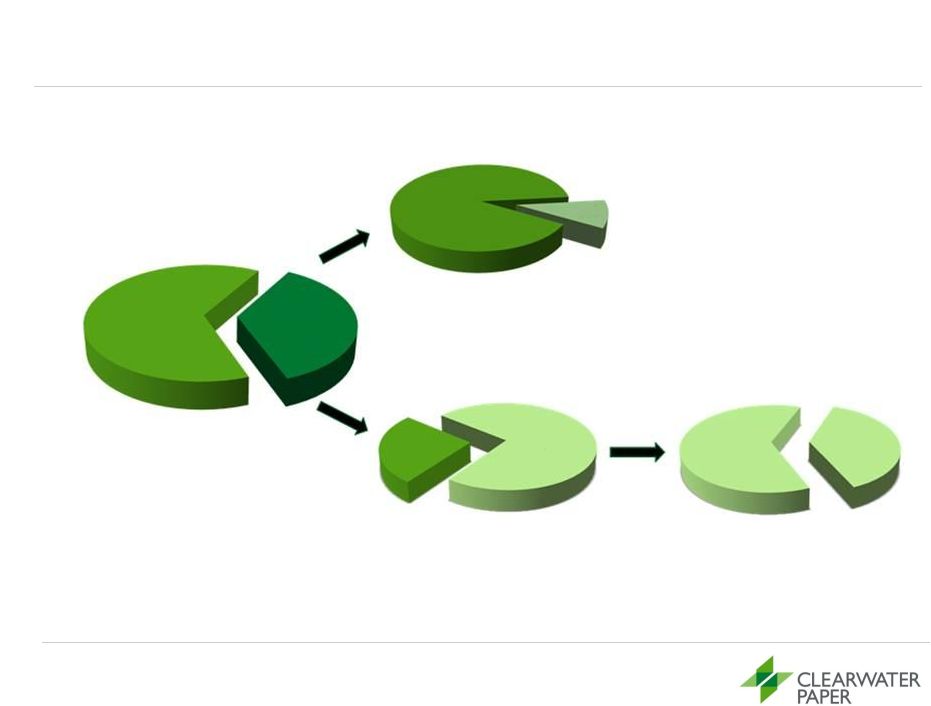
 Synergy Opportunity Example
Underutilized
large converting winder in Neenah, WI (formerly Cellu Tissue) can more
efficiently produce Away-from-Home products and 1000 count bathroom
tissue Actions:
1.
Relocate a wrapper machine from Elwood, IL (formerly CLW) to Neenah, WI
2.
Reposition an underutilized case packer in Neenah, WI
3.
Redirect the existing 1000 count product from Lewiston, ID (formerly CLW) and
Thomaston, GA (formerly CLU) to Neenah, WI
4.
Increase the production schedule of the existing underutilized large converting
winder in Neenah, WI from 5 to 7 days
Expected Results:
1.
Creates new case capacity in the systems at Neenah, Lewiston and
Thomaston
2.
Reduces freight
3.
Improves paper machine trim
46 |
 47
Appendix:
Other Information |
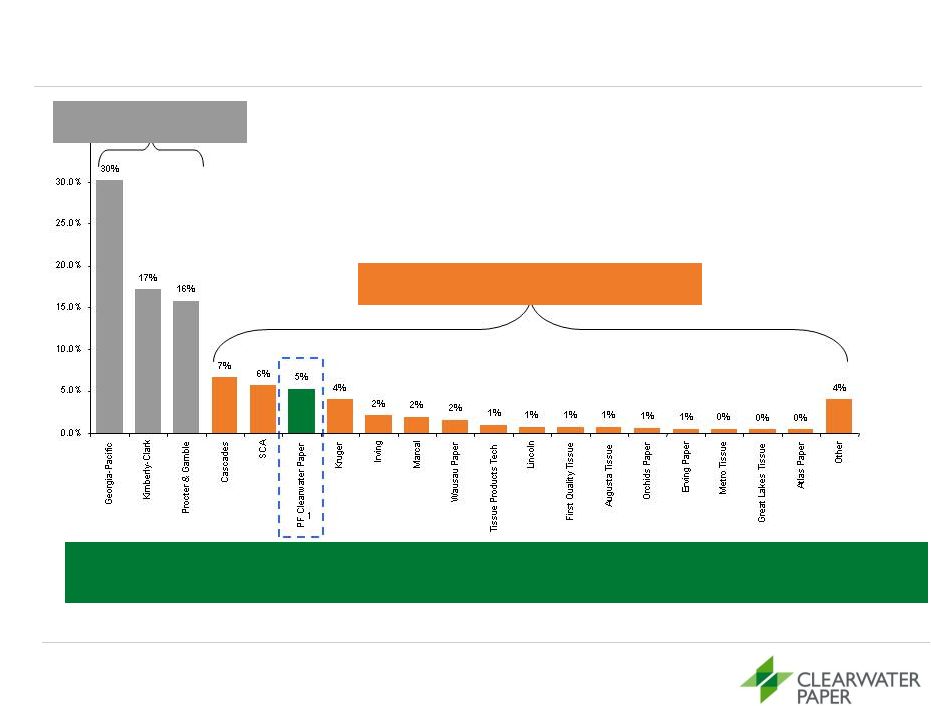 48
2010 North American Tissue Market by Producer
Remaining Manufacturing Base Highly
Fragmented
Large Brand
Manufacturers
Source: Equity research.
1
Represents Clearwater Paper tissue parent roll capacity combined on a pro
forma basis with Cellu Tissue tissue parent roll production The Combined
Company was the Sixth-Largest Manufacturer in the
North American Tissue Market in 2010 |
 1 Clearwater Paper capacities exclude expected tissue parent roll
manufacturing in Shelby, NC of 70,000 tons annual capacity expected to be
operational in 2012
49
National Manufacturing Footprint
Bleached Paperboard
775,000 tons
Tissue Parent Roll
586,000 tons
Tissue Converting
489,000 tons
Pulp
845,000 tons
Clearwater
Paper
Capacities
1
Clearwater Paper Pulp
Clearwater Paper SBS
Clearwater Paper Tissue Converting
Clearwater Paper Tissue Parent Roll
Corporate and administrative
Spokane, WA
Corporate Headquarters
Lewiston, ID
Converting Capacity:
102,000 tons
Lewiston, ID (Pulp)
Capacity: 540,000 tons
Lewiston, ID (SBS)
Capacity:
445,000 tons
Lewiston, ID (Tissue)
Capacity: 189,000 tons
Las Vegas, NV (TAD)
Capacity: 39,000 tons
Las Vegas, NV
Converting Capacity:
51,000 tons
Cypress Bend, AR (Pulp)
Capacity: 305,000 tons
Cypress Bend, AR (SBS)
Capacity: 330,000 tons
Elwood, IL
Converting Capacity:
68,000 tons
Wiggins, MS
Capacity: 59,000 tons
Neenah, WI
Capacity: 85,000 tons
Ladysmith, WI
Capacity: 56,000 tons
Oklahoma City, OK
Converting Capacity:
19,000 tons
East Hartford, CT
Capacity: 36,000 tons
Gouverneur, NY
Capacity: 39,000 tons
Alpharetta, GA
Thomaston, GA
Converting Capacity:
58,000 tons
Long Island, NY
Converting Capacity:
38,000 tons
Shelby, NC (TAD)
Announced Capacity:
70,000 tons
Neenah, WI
Converting
Capacity:
99,000 tons
Menominee, MI
Capacity: 36,000 tons
St. Catharines, ON (TAD)
Capacity: 47,000 tons
Menominee, MI
Converting
Capacity:
27,000 tons
Shelby, NC (TAD)
Converting Capacity:
27,000 tons |
 50
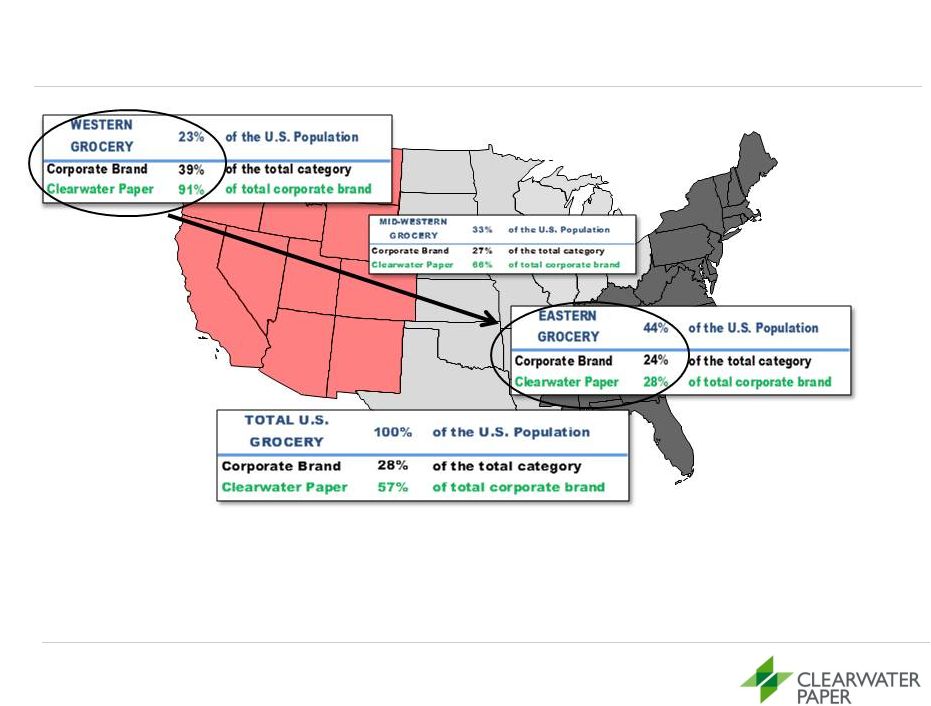
Expansion Opportunities
Clearwater Paper has been a strong influence in the development of Private
Label tissue in the Western U.S. An opportunity exists to grow Private
Label category development and company share in the Eastern U.S.
Source: SymphonyIRI InfoScan. 52 Weeks Ending May 29, 2011. Data
excludes Cellu Tissue |
 North American Tissue Capacity Change
51
* Estimated
Source: RISI and Other Industry
COMPANY
LOCATION
CONV/TAD
TONS
STARTUP DATE
CHANNEL/BUSINESS/PRODUCTS
Procter and Gamble
Box Elder, UT
TAD
80,000
4th Q, 2012
Retail/Brand/Bounty
First Quality
Anderson, SC
TAD
70,000
3rd Q, 2012
Retail/P.L./BRT
Florelle Tissue
Brownville, NY
CONV
35,000
2nd Q, 2012 *
Retail/P.L./Virgin Fiber
Patriarch Partners
Gorham, NH
CONV
(Overmechanica)
35,000
3rd Q, 2012 *
Retail/P.L.
Kruger
Memphis, TN
TAD
70,000
4th Q, 2012
Retail/Brand/P.L.
Clearwater Paper
Shelby, NC
TAD
70,000
4th Q, 2012
Retail/P.L./BRT & HHT
ST Paper
Franklin, VA
CONV
70,000
1st Q, 2013
Parent Roll Sales/Recycled
South Georgia Tissue
Snelling, SC
CONV
70,000
1st Q, 2013 *
Parent Roll Sales/Recycled
Wausau Paper
Harrodsburg, KY
ATMOS
75,000
1st Q, 2013
AFH/Recycled
COMPANY
LOCATION
CONV/TAD
TONS
STARTUP DATE
CHANNEL/BUSINESS/PRODUCTS
Georgia Pacific
Port Hudson, LA
ETAD
100,000
4th Q, 2012 *
Retail/Brand & P.L./HHT & BRT
SCA
Menasha, WI
ATMOS (PM#3)
70,000
1st Q, 2013
AFH
COMPANY
LOCATION
CONV/TAD
TONS
STARTUP DATE
CHANNEL/BUSINESS/PRODUCTS
Kimberly-Clark
Everett, WA
CONV/UCTAD/DRC
(All 5 PM)
193,000
1st Q, 2012
Retail/AFH/PL-Club/Parent Roll Sales
Kimberly-Clark
Chester, PA
CONV (PM #16)
27,000
1st Q, 2012
Napkin/BRT
REBUILDS
ANNOUNCED SHUTDOWNS
ANNOUNCED NEW PAPER MACHINES |