Attached files
| file | filename |
|---|---|
| 8-K - CURRENT REPORT - WEB.COM GROUP, INC. | v304918_8k.htm |

We Help Small Businesses Compete and Succeed Online Investor Presentation March 2012
Safe Harbor Statement This presentation includes certain "forward - looking statements" including, without limitation, statements regarding the anticipated positive impact of acquiring Network Solutions, expected growth from our investment in marketing initiatives, cost synergies resulting from our recent combination with Network Solutions, expected benefits to merchants and other customers, market opportunities, and expected customer base, that are subject to risks, uncertainties and other factors that could cause actual results or outcomes to differ materially from those contemplated by the forward - looking statements. These forward - looking statements include, but are not limited to, plans, objectives, expectations and intentions and other statements contained in this presentation that are not historical facts. These statements are sometimes identified by words such as “potential,” “expect” or words of similar meaning. As a result of the ultimate outcome of such risks and uncertainties, Web.com’s actual results could differ materially from those anticipated in these forward - looking statements. These statements are based on Web.com’s current beliefs or expectations, and there are a number of important factors that could cause the actual results or outcomes to differ materially from those indicated by these forward - looking statements, including, without limitation, Web.com’s ability to integrate the Network Solutions business, disruption created by the Network Solutions acquisition and from integration efforts making it more difficult to maintain relationships with customers, employees or suppliers; risks related to the successful offering of the combined company's products and services; the risk that the anticipated benefits of the acquisition may not be realized; and other risks that may impact Web.com’s businesses. Other risk factors are set forth under the caption, "Risk Factors," in Web.com’s Quarterly Report on Form 10 - Q for the period ended September 30, 2011, as filed with the Securities and Exchange Commission, which is available on a website maintained by the Securities and Exchange Commission at www.sec.gov. Web.com expressly disclaims any obligation or undertaking to release publicly any updates or revisions to any forward - looking statements contained herein as a result of new information, future events or otherwise. 2
Non - GAAP measures Some of the measures in this presentation are non - GAAP financial measures within the meaning of the SEC Regulation G. Web.com believes presenting non - GAAP financial measures is useful to investors, because it describes the operating performance of the company, excluding some recurring charges that are included in the most directly comparable measures calculated and presented in accordance with GAAP. Company management uses these non - GAAP measures as important indicators of the Company's past performance and in planning and forecasting performance in future periods. The non - GAAP financial information Web.com presents may not be comparable to similarly - titled financial measures used by other companies, and investors should not consider non - GAAP financial measures in isolation from, or in substitution for, financial information presented in compliance with GAAP. You are encouraged to review the reconciliation of non - GAAP financial measures to GAAP financial measures included in Web.com’s filings with the Securities and Exchange Commission, which are available at www.sec.gov as well as in this presentation. 3
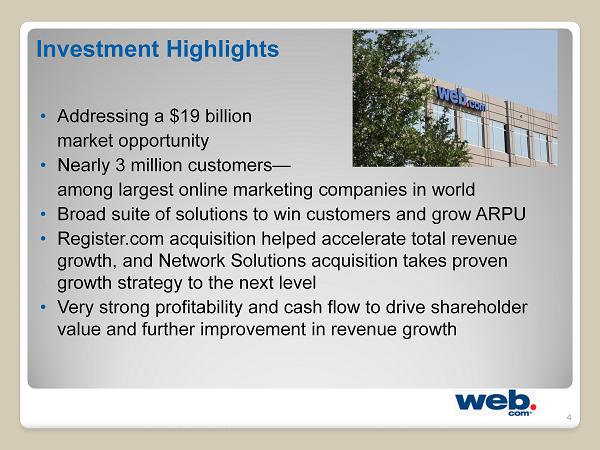
Investment Highlights • Addressing a $19 billion market opportunity • Nearly 3 million customers — among largest online marketing companies in world • Broad suite of solutions to win customers and grow ARPU • Register.com acquisition helped accelerate total revenue growth, and Network Solutions acquisition takes proven growth strategy to the next level • Very strong profitability and cash flow to drive shareholder value and further improvement in revenue growth 4
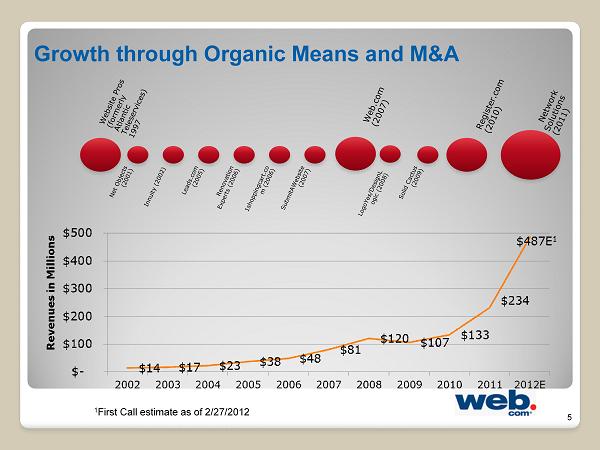
5 Growth through Organic Means and M&A 1 First Call estimate as of 2/27/2012
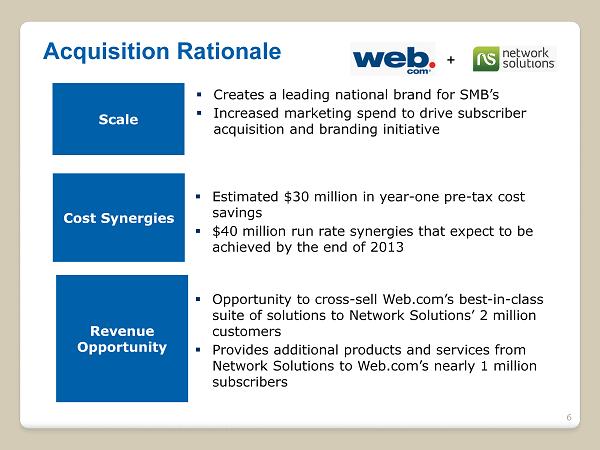
Scale ▪ Estimated $30 million in year - one pre - tax cost savings ▪ $40 million run rate synergies that expect to be achieved by the end of 2013 Cost Synergies ▪ Creates a leading national brand for SMB’s ▪ Increased marketing spend to drive subscriber acquisition and branding initiative Revenue Opportunity ▪ Opportunity to cross - sell Web.com’s best - in - class suite of solutions to Network Solutions’ 2 million customers ▪ Provides additional products and services from Network Solutions to Web.com’s nearly 1 million subscribers 6 + Acquisition Rationale
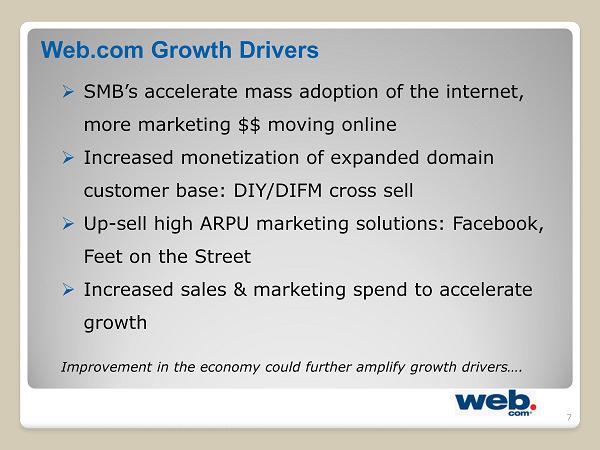
Web.com Growth Drivers 7 » SMB’s accelerate mass adoption of the internet, more marketing $$ moving online » Increased monetization of expanded domain customer base: DIY/DIFM cross sell » Up - sell high ARPU marketing solutions: Facebook, Feet on the Street » Increased sales & marketing spend to accelerate growth Improvement in the economy could further amplify growth drivers….
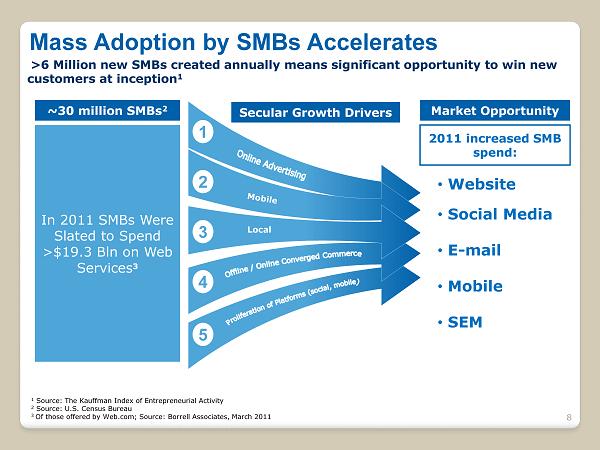
Mass Adoption by SMBs Accelerates 1 2 3 4 5 >6 Million new SMBs created annually means significant opportunity to win new customers at inception 1 1 Source: The Kauffman Index of Entrepreneurial Activity 2 Source: U.S. Census Bureau 3 Of those offered by Web.com; Source: Borrell Associates, March 2011 8 ~30 million SMBs 2 Secular Growth Drivers Market Opportunity Local In 2011 SMBs Were Slated to Spend >$19.3 Bln on Web Services 3 2011 increased SMB spend: • Website • Social Media • E - mail • Mobile • SEM
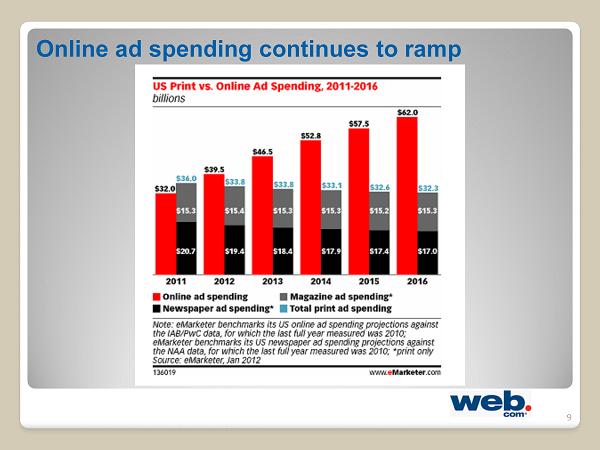
Online ad spending continues to ramp 9
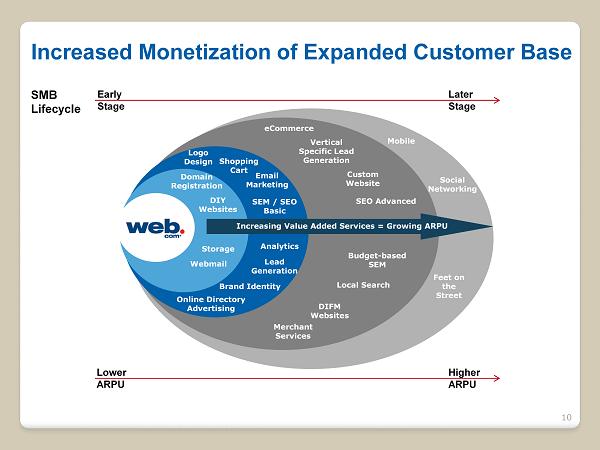
ra Online Directory Advertising Brand Identity Lead Generation Analytics SEM / SEO Basic Email Marketing Shopping Cart Logo Design Domain Registration DIY Websites Storage Webmail Increasing Value Added Services = Growing ARPU eCommerce Vertical Specific Lead Generation Custom Website SEO Advanced Budget - based SEM Local Search DIFM Websites Merchant Services Increased Monetization of Expanded Customer Base Mobile Feet on the Street Social Networking SMB Lifecycle Early Stage Lower ARPU Higher ARPU Later Stage 10
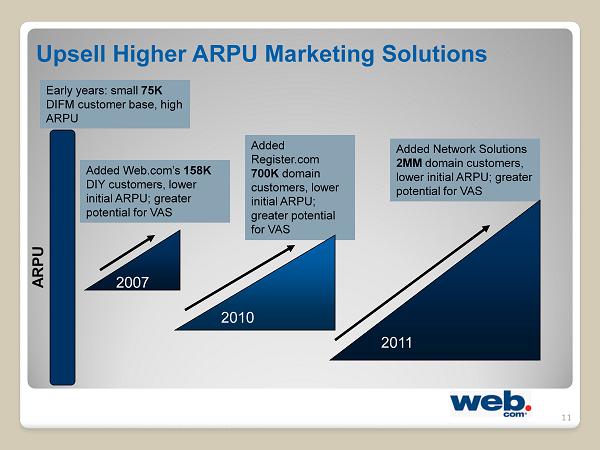
Upsell Higher ARPU Marketing Solutions 11 Early years: small 75K DIFM customer base, high ARPU Added Register.com 700K domain customers, lower initial ARPU; greater potential for VAS Added Web.com’s 158K DIY customers, lower initial ARPU; greater potential for VAS Added Network Solutions 2MM domain customers, lower initial ARPU; greater potential for VAS ARPU 2007 2010 2011

Increased Sales & Marketing Spend to Accelerate Growth 12 DRTV Online Marketing Feet On The Street
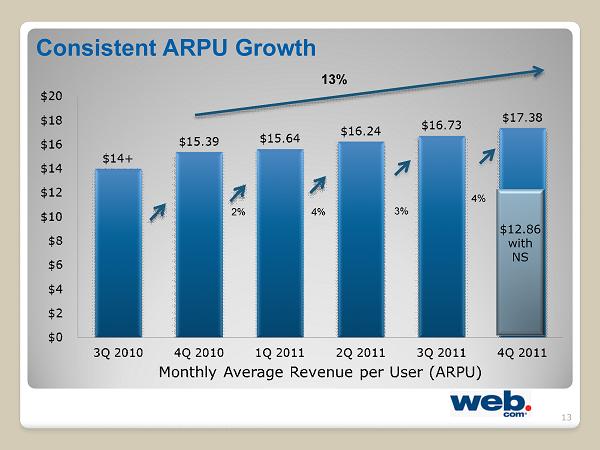
Consistent ARPU Growth 13 $12.86 with NS 4% 13%
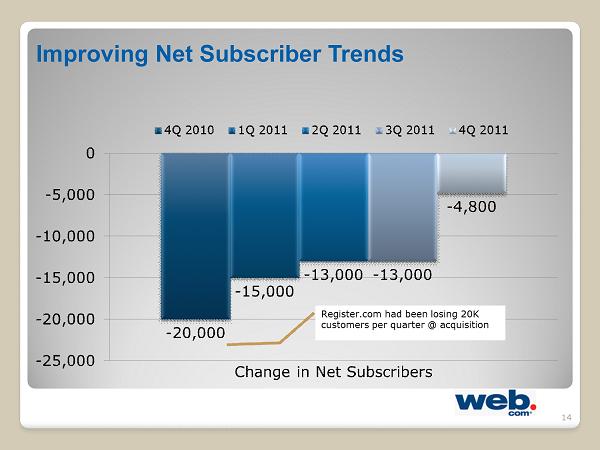
Improving Net Subscriber Trends 14
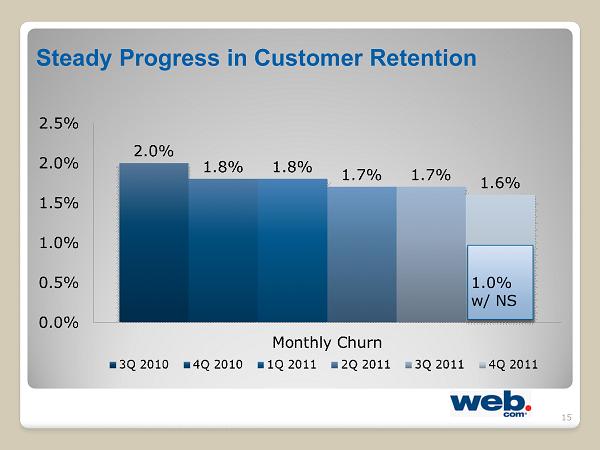
Steady Progress in Customer Retention 15
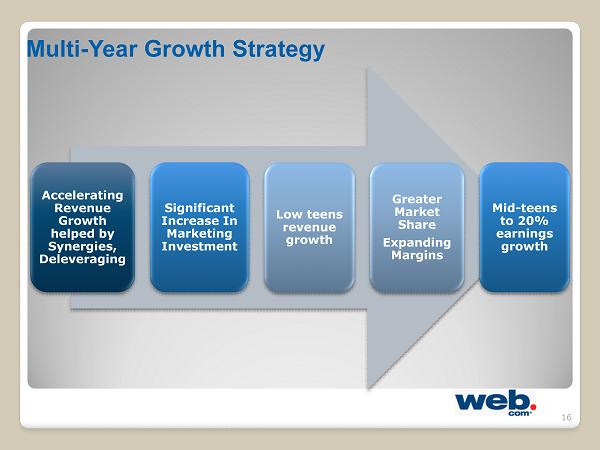
Multi - Year Growth Strategy Accelerating Revenue Growth helped by Synergies, Deleveraging Significant Increase In Marketing Investment Low teens revenue growth Greater Market Share Expanding Margins Mid - teens to 20% earnings growth 16

Non - GAAP Revenues (dollars in millions) 1 First Call estimates as of 2/27/2012 17
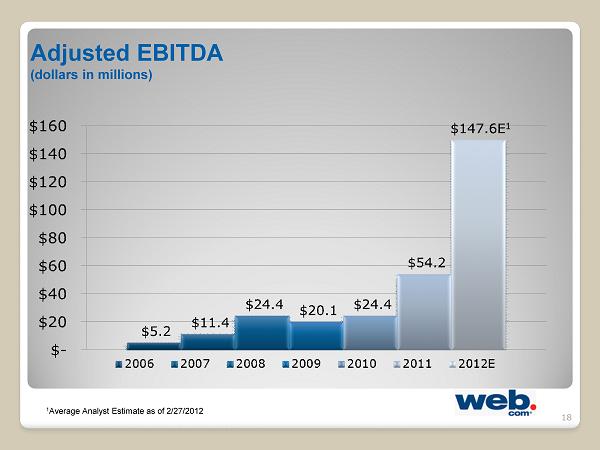
Adjusted EBITDA (dollars in millions) 18 1 Average Analyst Estimate as of 2/27/2012
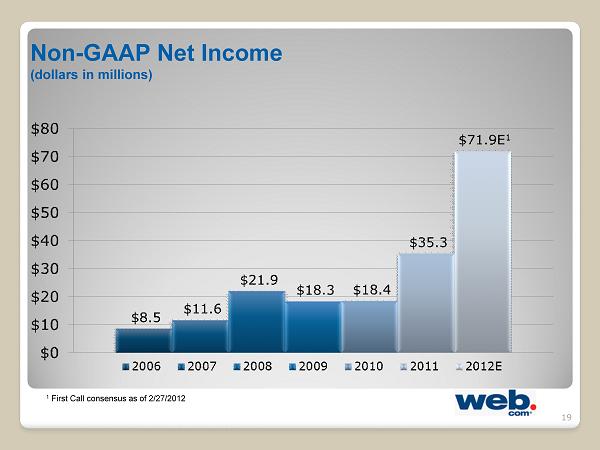
Non - GAAP Net Income (dollars in millions) 1 First Call consensus as of 2/27/2012 19
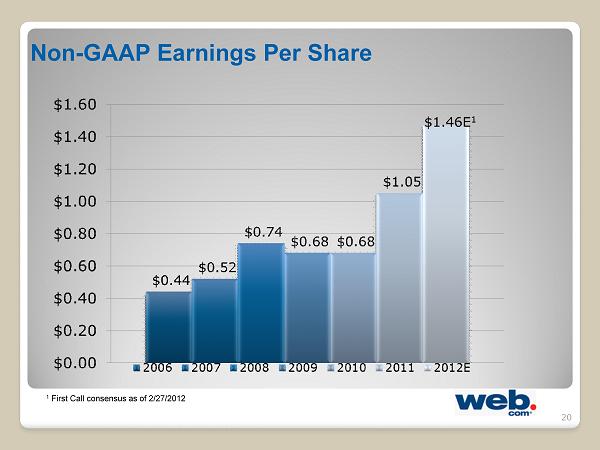
Non - GAAP Earnings Per Share 1 First Call consensus as of 2/27/2012 20
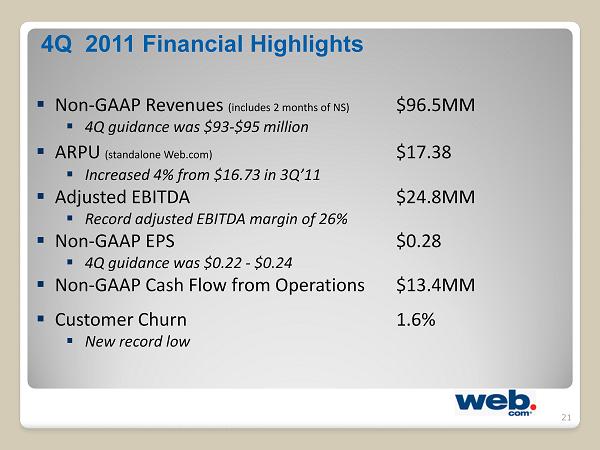
4Q 2011 Financial Highlights ▪ Non - GAAP Revenues (includes 2 months of NS) $96.5MM ▪ 4Q guidance was $93 - $95 million ▪ ARPU (standalone Web.com) $17.38 ▪ Increased 4% from $16.73 in 3Q’11 ▪ Adjusted EBITDA $24.8MM ▪ Record adjusted EBITDA margin of 26% ▪ Non - GAAP EPS $0.28 ▪ 4Q guidance was $0.22 - $0.24 ▪ Non - GAAP Cash Flow from Operations $13.4MM ▪ Customer Churn 1.6% ▪ New record low 21

22
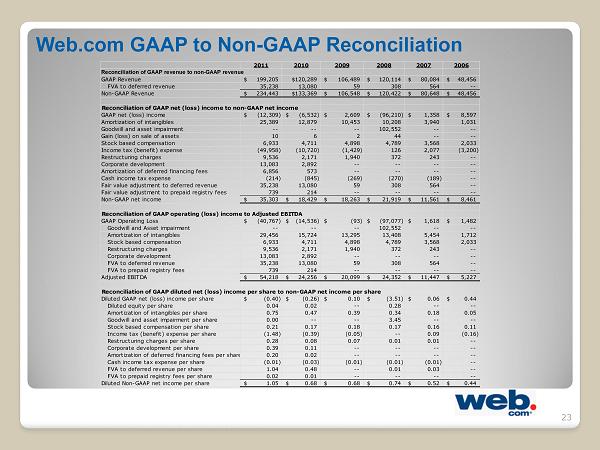
Web.com GAAP to Non - GAAP Reconciliation 23 2011 2010 2009 2008 2007 2006 Reconciliation of GAAP revenue to non-GAAP revenue GAAP Revenue 199,205$ $120,289 106,489$ 120,114$ 80,084$ 48,456$ FVA to deferred revenue 35,238 13,080 59 308 564 -- Non-GAAP Revenue 234,443$ $133,369 106,548$ 120,422$ 80,648$ 48,456$ Reconciliation of GAAP net (loss) income to non-GAAP net income GAAP net (loss) income (12,309)$ (6,532)$ 2,609$ (96,210)$ 1,358$ 8,597$ Amortization of intangibles 25,389 12,879 10,453 10,208 3,940 1,031 Goodwill and asset impairment -- -- -- 102,552 -- -- Gain (loss) on sale of assets 10 6 2 44 -- -- Stock based compensation 6,933 4,711 4,898 4,789 3,568 2,033 Income tax (benefit) expense (49,958) (10,720) (1,429) 126 2,077 (3,200) Restructuring charges 9,536 2,171 1,940 372 243 -- Corporate development 13,083 2,892 -- -- -- -- Amortization of deferred financing fees 6,856 573 -- -- -- -- Cash income tax expense (214) (845) (269) (270) (189) -- Fair value adjustment to deferred revenue 35,238 13,080 59 308 564 -- Fair value adjustment to prepaid registry fees 739 214 -- -- -- -- Non-GAAP net income 35,303$ 18,429$ 18,263$ 21,919$ 11,561$ 8,461$ Reconciliation of GAAP operating (loss) income to Adjusted EBITDA GAAP Operating Loss (40,767)$ (14,536)$ (93)$ (97,077)$ 1,618$ 1,482$ Goodwill and Asset impairment -- -- -- 102,552 -- -- Amortization of intangibles 29,456 15,724 13,295 13,408 5,454 1,712 Stock based compensation 6,933 4,711 4,898 4,789 3,568 2,033 Restructuring charges 9,536 2,171 1,940 372 243 -- Corporate development 13,083 2,892 -- -- -- -- FVA to deferred revenue 35,238 13,080 59 308 564 -- FVA to prepaid registry fees 739 214 -- -- -- -- Adjusted EBITDA 54,218$ 24,256$ 20,099$ 24,352$ 11,447$ 5,227$ Reconciliation of GAAP diluted net (loss) income per share to non-GAAP net income per share Diluted GAAP net (loss) income per share (0.40)$ (0.26)$ 0.10$ (3.51)$ 0.06$ 0.44$ Diluted equity per share 0.04 0.02 -- 0.28 -- -- Amortization of intangibles per share 0.75 0.47 0.39 0.34 0.18 0.05 Goodwill and asset impairment per share 0.00 -- -- 3.45 -- -- Stock based compensation per share 0.21 0.17 0.18 0.17 0.16 0.11 Income tax (benefit) expense per share (1.48) (0.39) (0.05) -- 0.09 (0.16) Restructuring charges per share 0.28 0.08 0.07 0.01 0.01 -- Corporate development per share 0.39 0.11 -- -- -- -- Amortization of deferred financing fees per share 0.20 0.02 -- -- -- -- Cash income tax expense per share (0.01) (0.03) (0.01) (0.01) (0.01) -- FVA to deferred revenue per share 1.04 0.48 -- 0.01 0.03 -- FVA to prepaid registry fees per share 0.02 0.01 -- -- -- -- Diluted Non-GAAP net income per share 1.05$ 0.68$ 0.68$ 0.74$ 0.52$ 0.44$
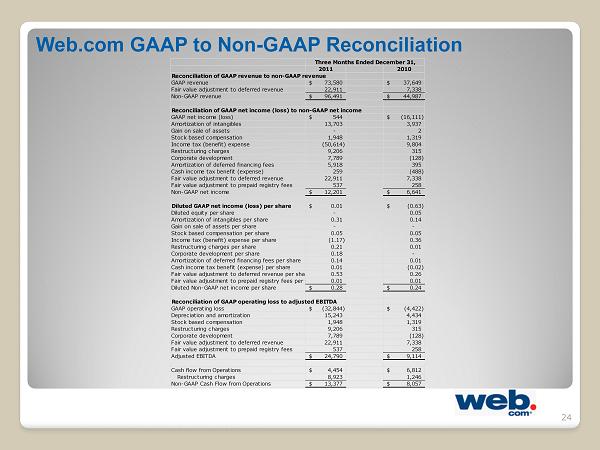
Web.com GAAP to Non - GAAP Reconciliation 24 2011 2010 Reconciliation of GAAP revenue to non-GAAP revenue GAAP revenue 73,580$ 37,649$ Fair value adjustment to deferred revenue 22,911 7,338 Non-GAAP revenue 96,491$ 44,987$ Reconciliation of GAAP net income (loss) to non-GAAP net income GAAP net income (loss) 544$ (16,111)$ Amortization of intangibles 13,703 3,937 Gain on sale of assets - 2 Stock based compensation 1,948 1,319 Income tax (benefit) expense (50,614) 9,804 Restructuring charges 9,206 315 Corporate development 7,789 (128) Amortization of deferred financing fees 5,918 395 Cash income tax benefit (expense) 259 (488) Fair value adjustment to deferred revenue 22,911 7,338 Fair value adjustment to prepaid registry fees 537 258 Non-GAAP net income 12,201$ 6,641$ Diluted GAAP net income (loss) per share 0.01$ (0.63)$ Diluted equity per share - 0.05 Amortization of intangibles per share 0.31 0.14 Gain on sale of assets per share - - Stock based compensation per share 0.05 0.05 Income tax (benefit) expense per share (1.17) 0.36 Restructuring charges per share 0.21 0.01 Corporate development per share 0.18 - Amortization of deferred financing fees per share 0.14 0.01 Cash income tax benefit (expense) per share 0.01 (0.02) Fair value adjustment to deferred revenue per share 0.53 0.26 Fair value adjustment to prepaid registry fees per share 0.01 0.01 Diluted Non-GAAP net income per share 0.28$ 0.24$ Reconciliation of GAAP operating loss to adjusted EBITDA GAAP operating loss (32,844)$ (4,422)$ Depreciation and amortization 15,243 4,434 Stock based compensation 1,948 1,319 Restructuring charges 9,206 315 Corporate development 7,789 (128) Fair value adjustment to deferred revenue 22,911 7,338 Fair value adjustment to prepaid registry fees 537 258 Adjusted EBITDA 24,790$ 9,114$ Cash flow from Operations 4,454$ 6,812$ Restructuring charges 8,923 1,246 Non-GAAP Cash Flow from Operations 13,377$ 8,057$ Three Months Ended December 31,