Attached files
| file | filename |
|---|---|
| 8-K - COPANO ENERGY, L.L.C. FORM 8 - Copano Energy, L.L.C. | form8-k.htm |
| EX-99.2 - COPANO ENERGY, L.L.C. PRESS RELEASE - Copano Energy, L.L.C. | ex99-2.htm |
Exhibit 99.1

1
Morgan Stanley MLP and
Diversified Natural Gas Corporate
Access Day
Diversified Natural Gas Corporate
Access Day
March 7, 2012
NASDAQ: CPNO

2
Disclaimer
This presentation includes “forward-looking statements,” as defined in the federal securities laws. Statements that
address activities or events that Copano believes will or may occur in the future are forward-looking statements. These
statements include, but are not limited to, statements about future producer activity and Copano’s total distributable
cash flow and distribution coverage. These statements are based on management’s experience and perception of
historical trends, current conditions, expected future developments and other factors management believes are
reasonable.
Important factors that could cause actual results to differ materially from those in the forward-looking statements
include the following risks and uncertainties, many of which are beyond Copano’s control: the volatility of prices and
market demand for natural gas and natural gas liquids; Copano’s ability to continue to obtain new sources of natural
gas supply and retain its key customers; the impact on volumes and resulting cash flow of technological, economic
and other uncertainties inherent in estimating future production, producers’ ability to drill and successfully complete
and attach new natural gas supplies and the availability of downstream transportation systems and other facilities for
natural gas and NGLs; mechanical failures and other operational risks affecting the performance of Copano’s
processing plants and other facilities, higher construction costs or project delays due to inflation, limited availability of
required resources, or the effects of environmental, legal or other uncertainties; general economic conditions; the
effects of government regulations and policies; and other financial, operational and legal risks and uncertainties
detailed from time to time in Copano’s quarterly and annual reports filed with the Securities and Exchange
Commission.
Copano undertakes no obligation to update any forward-looking statements, whether as a result of new information or
future events.
future events.

3
Introduction to Copano
Independent midstream company founded in 1992
• Producer focused
• Entrepreneurial approach
• Focus on long-term accretive growth
• Publicly traded LLC
- No general partner or incentive distribution rights
- Tax benefits similar to MLPs, but with corporate governance of a C-corp
Service throughput volumes approximate 1,950,000 MMBtu/d of natural gas(1)
Over 7,000 miles of active pipelines
10 natural gas processing plants with over 1.2 Bcf/d of combined processing
capacity
capacity
One NGL fractionation facility with total capacity of 44,000 Bbls/d
(1) Based on 4Q 2011 results. Includes unconsolidated affiliates.

4
Area of Operations
Operating segments
• Texas
• Oklahoma
• Rocky Mountains
Copano currently has assets in five
U.S. resource plays
U.S. resource plays
• Eagle Ford Shale
• North Barnett Shale Combo
• Woodford Shale
• Mississippi Lime
• Powder River Basin Niobrara

5
Eagle Ford Shale
Growth Projects
Business Segment
Outlook
Financing and
Commodity Price
Commodity Price
Sensitivity
Conclusions
Agenda
Eagle Ford Shale
Growth Projects
Business Segment
Outlook
Financing and
Commodity Price
Commodity Price
Sensitivity
Conclusions
6
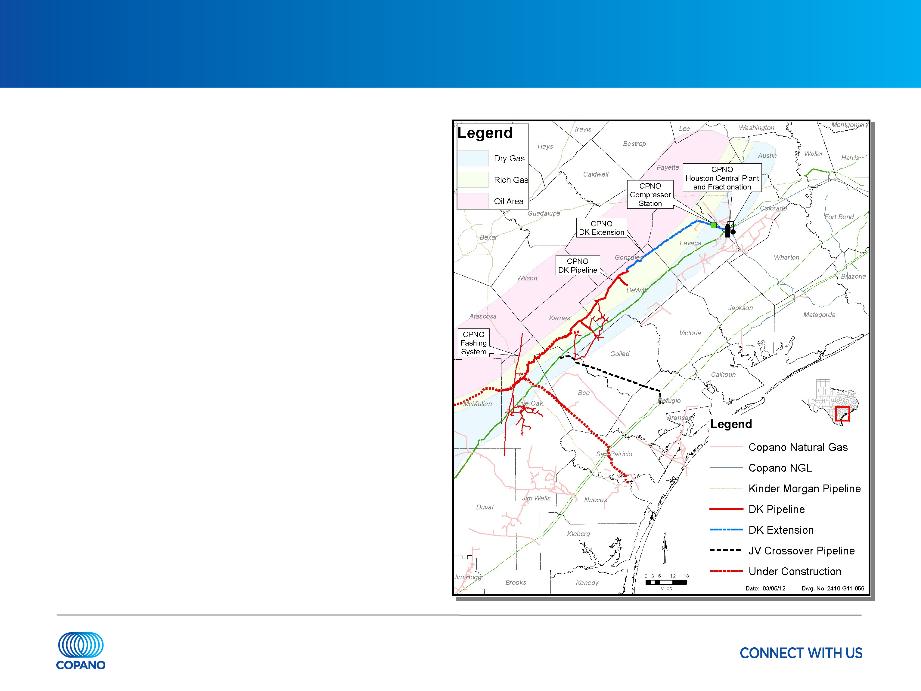
DK Pipeline - Northern Eagle Ford Shale
100% Copano-owned project
Key producer contracts signed
• Volume commitments for
approximately 120,000 MMBtu/d
approximately 120,000 MMBtu/d
• Additional acreage dedication from
approximately 135,000 gross acres
approximately 135,000 gross acres
Pipeline capacity of 350 MMcf/d
Extension from DeWitt County to
Houston Central placed into service
December 2011
Houston Central placed into service
December 2011
7
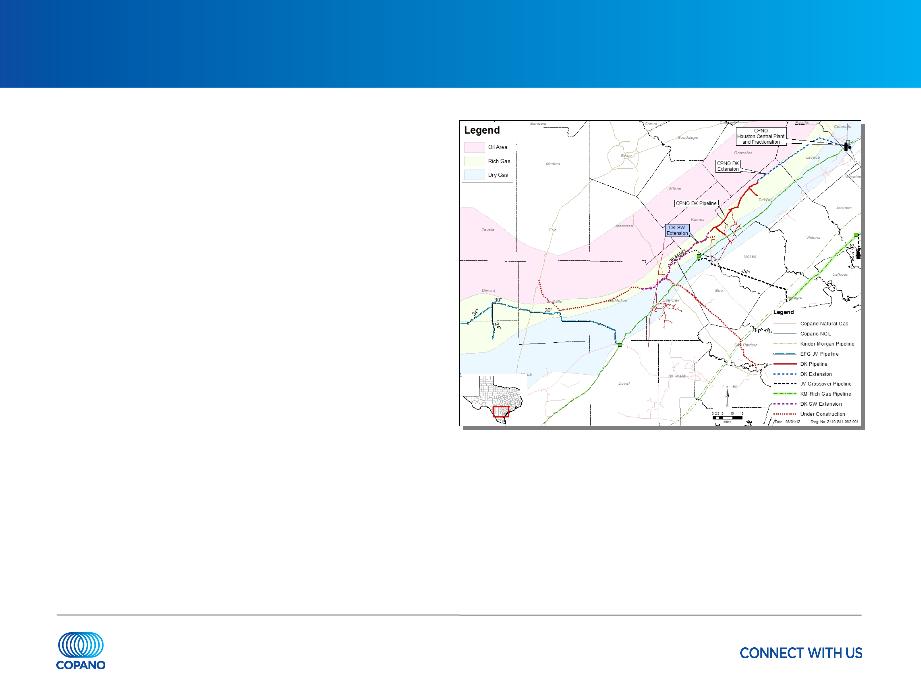
DK Pipeline Southwest Extension
Further extend DK pipeline by adding
approximately 65 miles of 24” pipeline
southwest into McMullen County
approximately 65 miles of 24” pipeline
southwest into McMullen County
• Provides access to significant new
Eagle Ford Shale volumes
Eagle Ford Shale volumes
• Ties additional existing Copano
gathering systems directly to Houston
Central complex
gathering systems directly to Houston
Central complex
• Supported by new, long-term volume
commitment from Petrohawk Energy
commitment from Petrohawk Energy
Expect to begin service in the first half
of 2013
of 2013
Estimated capital investment of
approximately $120 million
approximately $120 million
8
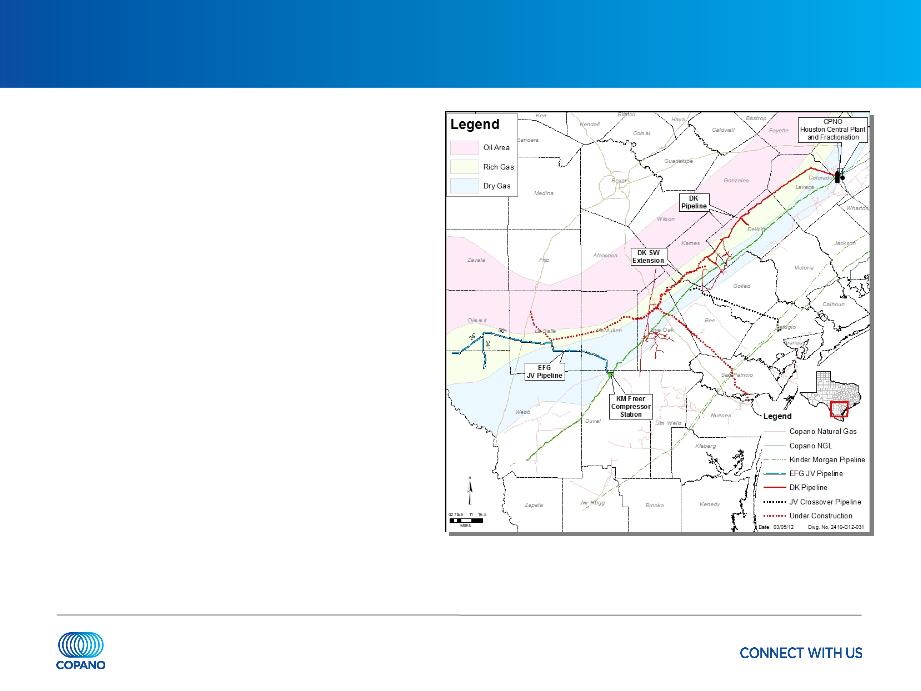
Southern Eagle Ford Shale
Eagle Ford Gathering (EFG)
• 50/50 JV with Kinder Morgan
EFG mainline
• Copano constructed and operates
• Placed into full service December 1,
2011
2011
• Long-term, fee-based contracts with
volume commitments for 637,500
MMBtu/d
volume commitments for 637,500
MMBtu/d
- Compression may be added at a
net cost of $14.2 million to increase
pipeline capacity
net cost of $14.2 million to increase
pipeline capacity
9
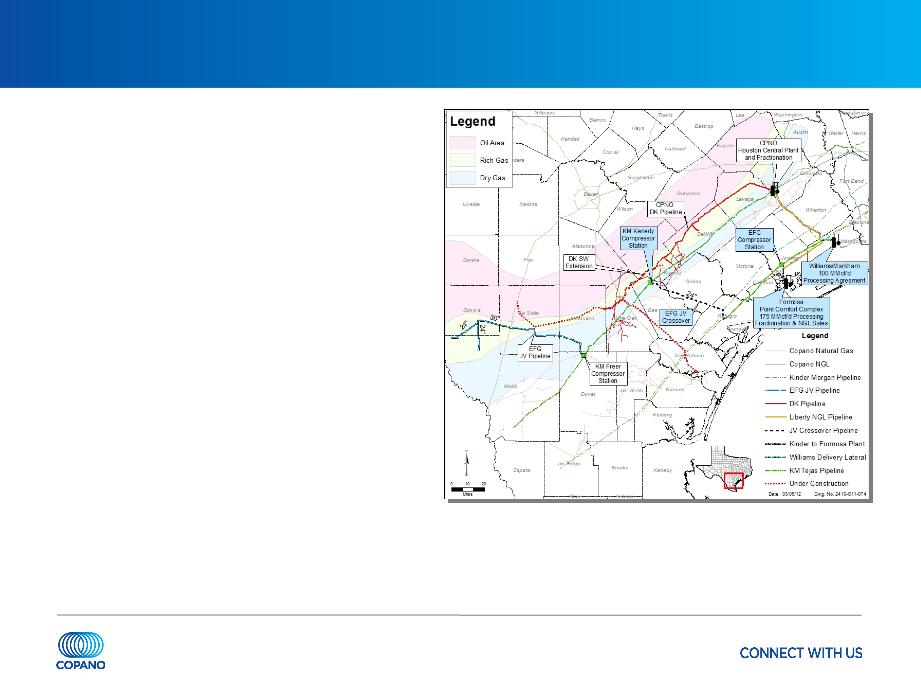
EFG Crossover
24-inch pipeline connecting two
Kinder Morgan 30” pipelines
Kinder Morgan 30” pipelines
• Provides EFG access to Williams
Markham and Formosa processing
Markham and Formosa processing
Long-term contracts with Williams
Partners and Formosa
Partners and Formosa
• Williams Partners’ Markham - 100
MMcf/d processing and associated
fractionation
MMcf/d processing and associated
fractionation
• Formosa - ultimately will provide up to
175 MMcf/d of processing,
fractionation and product sales
175 MMcf/d of processing,
fractionation and product sales
Began deliveries to Markham plant
October 2011
October 2011
Expect to begin initial deliveries to
Formosa March 2012
Formosa March 2012
10
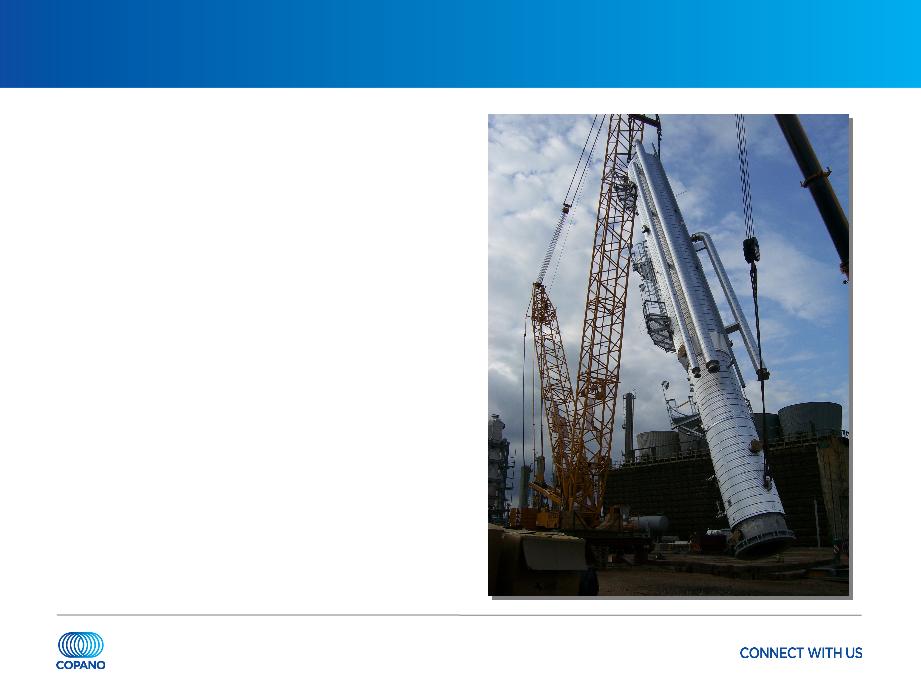
Houston Central Complex
Fractionation expansion
• Fractionation expansion from 22,000
Bbls/d to 44,000 Bbls/d placed in-service
in November 2011
Bbls/d to 44,000 Bbls/d placed in-service
in November 2011
• Ethane and propane delivered and sold
to Dow through Copano purity pipelines
under long-term contracts
to Dow through Copano purity pipelines
under long-term contracts
Cryo plant upgrade ongoing
• Working through startup issues
• Currently estimated to start up in March

11
Houston Central Complex
Processing expansion
• Adding 400 MMcf/d of cryogenic processing
• Expected to be in-service 1Q 2013
Long-term fractionation and product sales agreement with Formosa
• Currently entitled to up to 7,000 Bbls/d
• Upon completion of Formosa’s fractionation expansion in 1Q 2013, will have up to 37,500
Bbls/d of firm capacity for a 15-year term
Bbls/d of firm capacity for a 15-year term

12
Liberty NGL Pipeline
NGL pipeline extending from the
Houston Central complex to Formosa
Houston Central complex to Formosa
• NGLs delivered to Formosa for
fractionation and purchase
fractionation and purchase
• Total capacity of 75,000 Bbls/d
• Copano constructed and operates through
50/50 JV with Energy Transfer
50/50 JV with Energy Transfer
• Placed into full service September 2011
Access to Formosa’s NGL storage
capacity at Markham
capacity at Markham
• Firm storage capacity beginning 2Q 2013
13
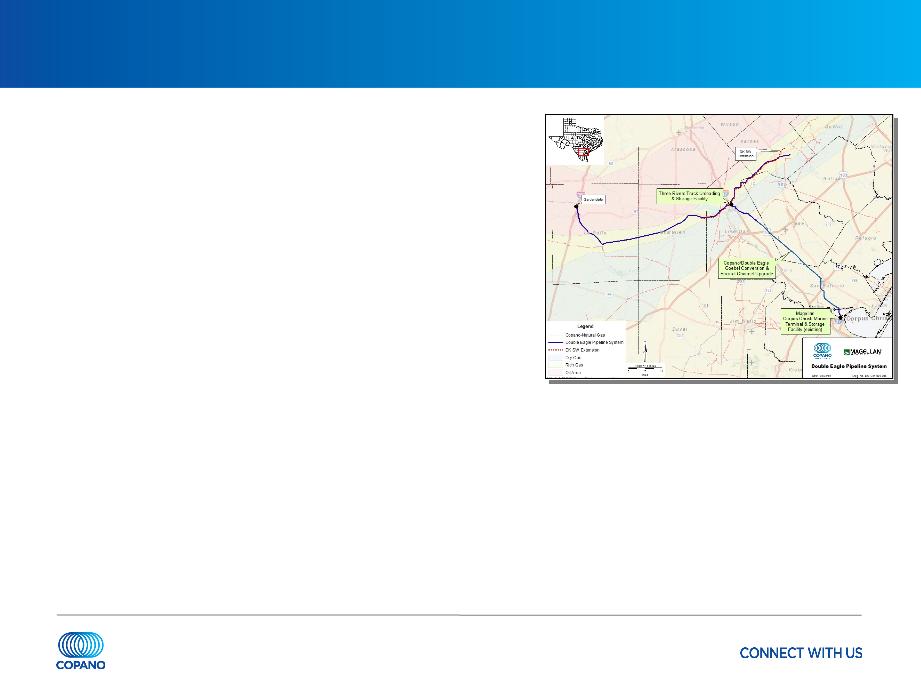
Double Eagle Condensate Pipeline Joint Venture
50/50 JV with Magellan
• Construct 140-mile condensate gathering system
- Copano will construct and operate
• Utilizes Copano’s existing 14” Copano Goebel
pipeline and dual-line rights of way
pipeline and dual-line rights of way
• 100,000 Bbls/d of nominal capacity
• Tie into existing and expanded Magellan storage
and loading docks at the Port of Corpus Christi
and loading docks at the Port of Corpus Christi
• Pipeline from Three Rivers to Corpus Christi
expected to begin service as early as 1Q 2013;
remaining assets 2Q 2013
expected to begin service as early as 1Q 2013;
remaining assets 2Q 2013
Executed long-term, fee-based contracts with
Talisman and Statoil
Talisman and Statoil
Estimated capital investment of approximately
$100 million (includes Copano’s net JV costs
and costs to convert Goebel pipeline)
$100 million (includes Copano’s net JV costs
and costs to convert Goebel pipeline)

14
Summary of Eagle Ford Shale Infrastructure
Total capital investment of over $750 million since 2010
• Approximately $375 million already completed and in service
In excess of 1 Bcf/d of pipeline and processing capacity
Greater than 100,000 Bbls/d of fractionation capacity
Access to multiple markets for residue gas and NGLs

15
Eagle Ford Shale
Growth Projects
Business Segment
Outlook
Financing and
Commodity Price
Commodity Price
Sensitivity
Conclusions
Business Segment Outlook
Eagle Ford Shale
Growth Projects
Business Segment
Outlook
Financing and
Commodity Price
Commodity Price
Sensitivity
Conclusions
16
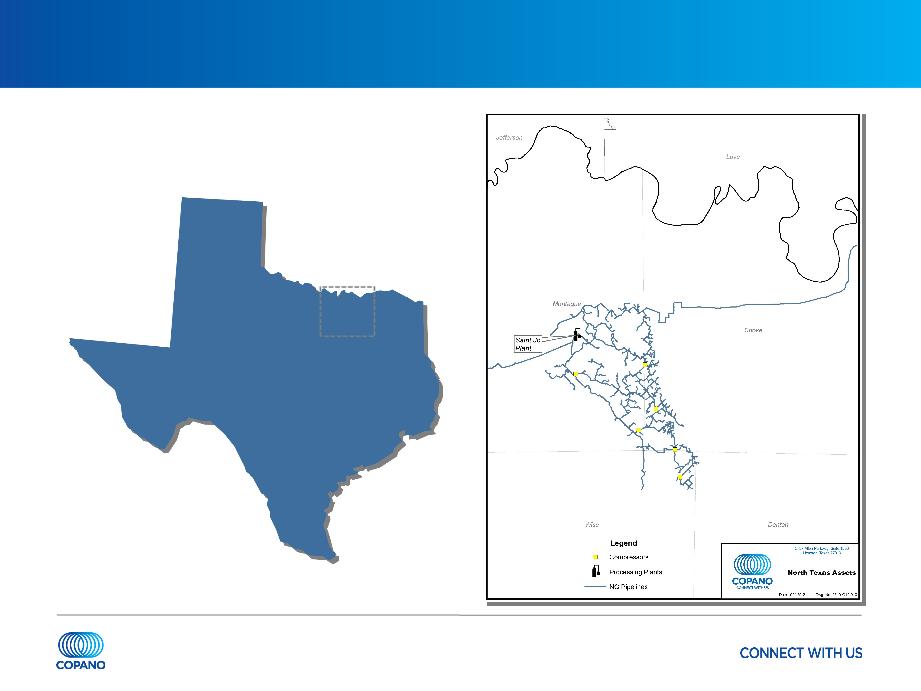
Texas Recent Developments
Saint Jo system - north Barnett Shale
Combo
Combo
• Plant fully committed under long-term,
fee-based contracts
fee-based contracts
• Plant running at or near capacity
• Increasing treating capacity at Saint Jo
plant
plant
- Will allow plant to increase inlet volumes
from 92 MMcf/d to 105 MMcf/d
from 92 MMcf/d to 105 MMcf/d
- Expected in-service March 2012
- Capital investment of $12 million
• Southeast extension of Saint Jo
gathering system
gathering system
- Gathering incremental to current processed
volume at Saint Jo
volume at Saint Jo
- Expect initial service beginning July 2012
- Capital investment of $12.5 million
(includes pipe and compression)
(includes pipe and compression)

17
Texas Recent Developments
Eagle Ford Shale
• Copano’s total Eagle Ford Shale volumes (including Eagle Ford Gathering volumes) have
been averaging approximately 400,000 MMBtu/d
been averaging approximately 400,000 MMBtu/d
• Recently announced Double Eagle condensate pipeline joint venture and southwest
extension of DK pipeline
extension of DK pipeline
- Approximately $320 million capital investment
- Expect capital to be invested at 5x multiple
Lake Charles plant
• Processed volumes approximate 125 MMcf/d
- Currently running on an opportunistic basis
- At current pricing, anticipated monthly net gross margin of approximately $500K -
$750K
$750K

18
Texas Outlook
Saint Jo system
• Copano’s largest producer continues an active drilling program in the area
• Leasing activity continues
Eagle Ford Shale
• Approximately 225 rigs currently running in the Eagle Ford Shale
• Expect to see continued volume increases on both wholly owned and joint venture assets
for the balance of 2012 and beyond
for the balance of 2012 and beyond
Expect segment gross margin in 1Q 2012 to be lower by $5 - $8 million
compared to 4Q 2011 due to operational issues related to the startup of new
cryogenic tower at Houston Central
compared to 4Q 2011 due to operational issues related to the startup of new
cryogenic tower at Houston Central

19
Oklahoma Recent Developments
Woodford Shale
• Volumes on the Cyclone Mountain system up in 1Q 2012 from 4Q 2011
• Treating and compression capacity expansion ongoing
Mississippi Lime
• Drilling near Copano infrastructure continues to be active
• Expanding Osage system gathering footprint by installing approximately 17 miles of 12”
pipe to provide additional gathering and processing services to Mississippi Lime
producers
pipe to provide additional gathering and processing services to Mississippi Lime
producers
• Evaluating several other gathering and processing projects to accommodate anticipated
growth from this play
growth from this play

20
Oklahoma Outlook
Rich gas (primarily Hunton dewatering and Mississippi Lime)
• Drilling activity increased in 1Q 2012 compared to 4Q 2011
• 5 rigs running in the Hunton, 3 rigs in the Mississippi Lime and 10 rigs in other rich gas
areas
areas
• Attractive processing upgrade and low geologic risk
Lean gas (primarily Woodford Shale)
• Drilling activity remains steady in 1Q 2012 compared to 4Q 2011; however, a slow down
in activity will likely occur for the remainder of 2012 due to low gas prices
in activity will likely occur for the remainder of 2012 due to low gas prices
• 5 wells currently being completed
• No active rigs
Expect gross margin to be flat to slightly lower in 1Q 2012 compared to 4Q
2011 due to lower commodity prices, offset by production growth in the
Woodford Shale and continued development in the Mississippi Lime
2011 due to lower commodity prices, offset by production growth in the
Woodford Shale and continued development in the Mississippi Lime

21
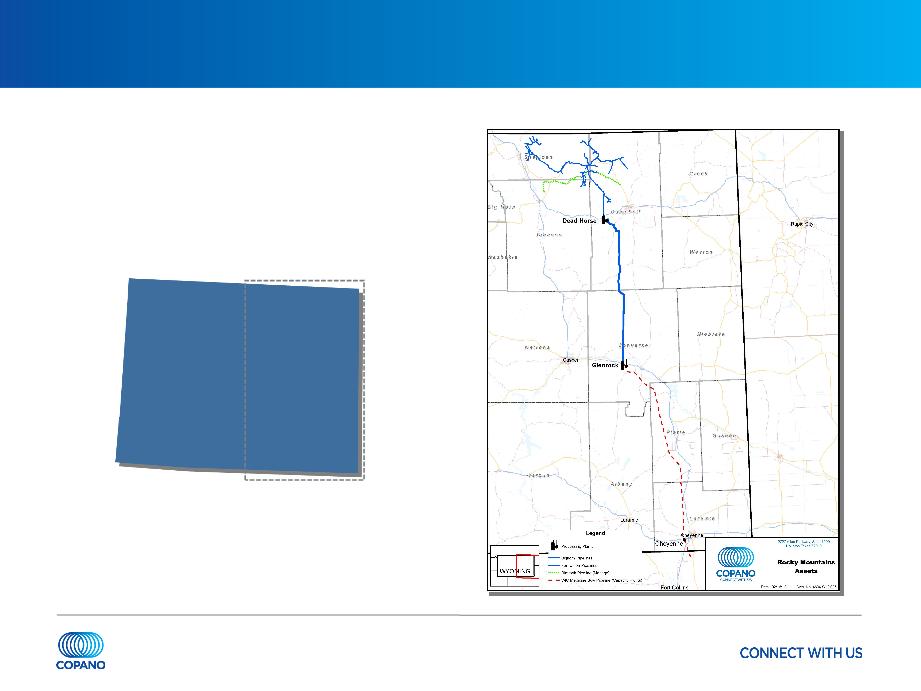
Rocky Mountains Outlook
Drilling and dewatering activity will be driven by commodity prices and
producer economics
producer economics
• 1Q 2012 volumes for Bighorn expected to be lower compared to 4Q 2011
• 1Q 2012 volumes for Fort Union expected to be higher compared to 4Q 2011 due to
volumes diverted by producers from Bison pipeline to Fort Union in order to capture
better pricing at Cheyenne Hub
volumes diverted by producers from Bison pipeline to Fort Union in order to capture
better pricing at Cheyenne Hub
• 1Q 2012 Adjusted EBITDA expected to be lower compared to 4Q 2011

22
2012 Guidance
1Q 2012 total distributable cash flow expected to be lower by $11 - $13 million
compared to 4Q 2011 due primarily to:
compared to 4Q 2011 due primarily to:
• Operational issues affecting startup of new cryogenic tower at Houston Central
• Lower distributions received from Eagle Ford Gathering joint venture
• Lower commodity prices in Oklahoma segment
For 2012, Copano expects expenses to be slightly higher this year to support
recent and upcoming growth
recent and upcoming growth
• G&A: between $53 and $57 million - increased personnel and benefits costs
• O&M: between $76 and $80 million - expanded operations related to new Eagle
Ford Shale, north Barnett Shale Combo and Woodford Shale assets, and full year
of operations at Lake Charles and Harrah plants
Ford Shale, north Barnett Shale Combo and Woodford Shale assets, and full year
of operations at Lake Charles and Harrah plants
• Interest expense: between $63 and $67 million - higher level of borrowings related
to capital expansion projects
to capital expansion projects
• Maintenance capital expenditures: between $12 and $14 million

23
Eagle Ford Shale
Growth Projects
Business Segment
Outlook
Financing and
Commodity Price
Commodity Price
Sensitivity
Conclusions
Financing and Commodity Price Sensitivity
Eagle Ford Shale
Growth Projects
Business Segment
Outlook
Financing and
Commodity Price
Commodity Price
Sensitivity
Conclusions

24
Recent Equity and Debt Offerings
January 2012 equity offering
• Issued 5,750,000 common units (includes greenshoe)
• Base offering upsized by 500,000 units
• Approximately $187.5 million in net proceeds (including greenshoe)
• Proceeds used to reduce revolver borrowings, which ultimately will fund expansion capex
• Enhances balance sheet and liquidity available to fund expansion capex
February 2012 senior notes offering
• $150 million add-on to existing 7.125% senior notes
• Price to investors of 102.25%, for a yield to worst of 6.721%
• Proceeds used to reduce revolver borrowings, which ultimately will fund expansion capex
• Replaces secured debt with longer-term, unsecured debt
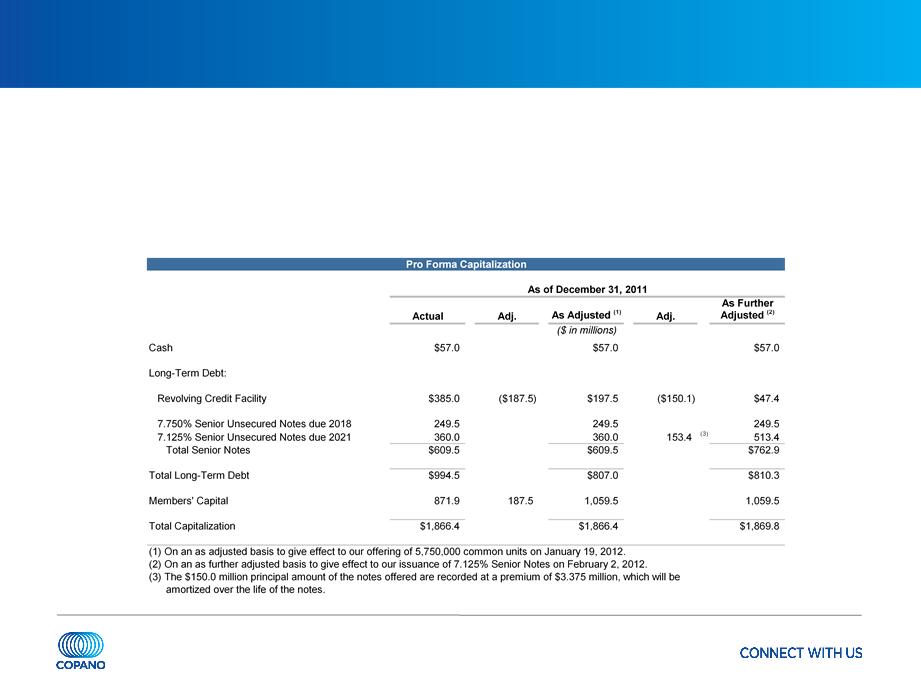
25
Liquidity and Capitalization
Recent equity and debt financings fund current planned 2012 expansion capital
expenditures
expenditures
Pro forma for recent equity and debt offerings, total available liquidity of over
$400 million
$400 million
26
Shifting Contract Mix
Continued shift towards a more fee-based mix
• Eagle Ford Shale and north Barnett Shale Combo volume growth are key drivers
|
Contract Mix as a % of Gross Margin
|
|||
|
|
1Q 2010
|
3Q 2011
|
4Q 2011
|
|
Fee-based
|
27%
|
43%
|
47%
|
|
|
|
|
|
|
Percentage-of-
proceeds |
39%
|
31%
|
27%
|
|
Keep-
whole/Other |
36%
|
36%
|
41%
|
|
Net hedging
|
-2%
|
-10%
|
-15%
|
|
Net commodity
exposed |
73%
|
57%
|
53%
|
Note: Includes Copano’s share of gross margin from unconsolidated affiliates. Approximate percentages based on Copano internal financial planning models.
27
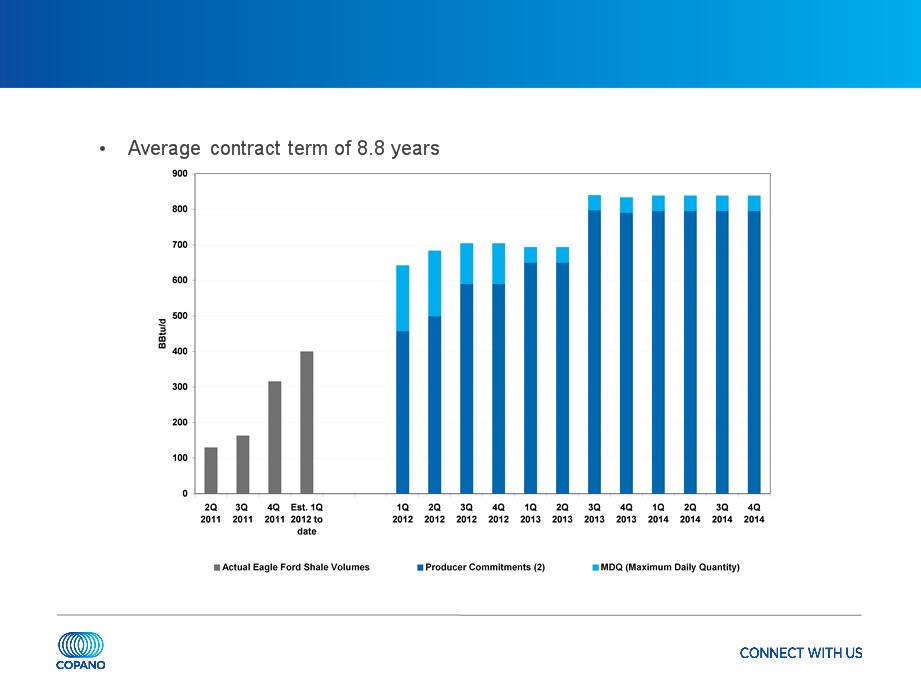
Long-term Eagle Ford Shale Contracts(1)
Eagle Ford Shale will drive near-term growth in fee-based volumes
(1) Includes 100% of volumes under Eagle Ford Gathering contracts.
(2) Excludes substantial, long-term acreage dedication from GeoSouthern in northern Eagle Ford Shale.

28
Expansion Capital Expenditures
2011 expansion capital projects expected to contribute $45 - $55 million
incremental DCF in 2012 and an additional $35 - $45 million in 2013
incremental DCF in 2012 and an additional $35 - $45 million in 2013
• Expect volumes related to 2011 expansion capital expenditures to peak in the 2014 -
2015 timeframe
2015 timeframe
Board approved 2012 expansion capex of approximately $400 million

29
Hedging Strategy
Continued shift towards a more fee-based contract mix
• Reliance on hedging will decrease as contract mix changes over time
2012 hedged near policy limits for all products except ethane
• Approximately 90% of propane, butane, natural gasoline and condensate exposure
hedged
hedged
• Approximately 40% of ethane exposure hedged
2013 hedging positions continue to be added
• Between 60% and 80% of butane, natural gasoline and condensate exposure hedged
• Approximately 65% of propane exposure hedged
• No ethane hedges for 2013

30
Eagle Ford Shale
Growth Projects
Business Segment
Outlook
Financing and
Commodity Price
Commodity Price
Sensitivity
Conclusions
Conclusions
Eagle Ford Shale
Growth Projects
Business Segment
Outlook
Financing and
Commodity Price
Commodity Price
Sensitivity
Conclusions

31
Conclusions - Executing Our Strategy
To build a more diversified midstream company with scale and stability of cash
flows, above-average returns on invested capital and “investment-grade quality”
distributions
flows, above-average returns on invested capital and “investment-grade quality”
distributions
• Eagle Ford growth strategy on track
- Projects completed have been on time and on budget
- Cryo upgrade delayed until operational startup issue resolved
• Fractionation expansion completed and in service
• Recently announced Double Eagle condensate pipeline joint venture and southwest
extension of DK pipeline further diversifies our services and adds scale
extension of DK pipeline further diversifies our services and adds scale
• Continued shift towards volume-commitment, fee-based contracts; many with producer
deficiency fees
deficiency fees
• Approximately $380 million of expansion capital invested in 2011; $400 million expected
in 2012
in 2012
• Expansion capital being invested at 5x multiple or better
• Improving coverage and distribution growth expected in 2012

32
Appendix
33
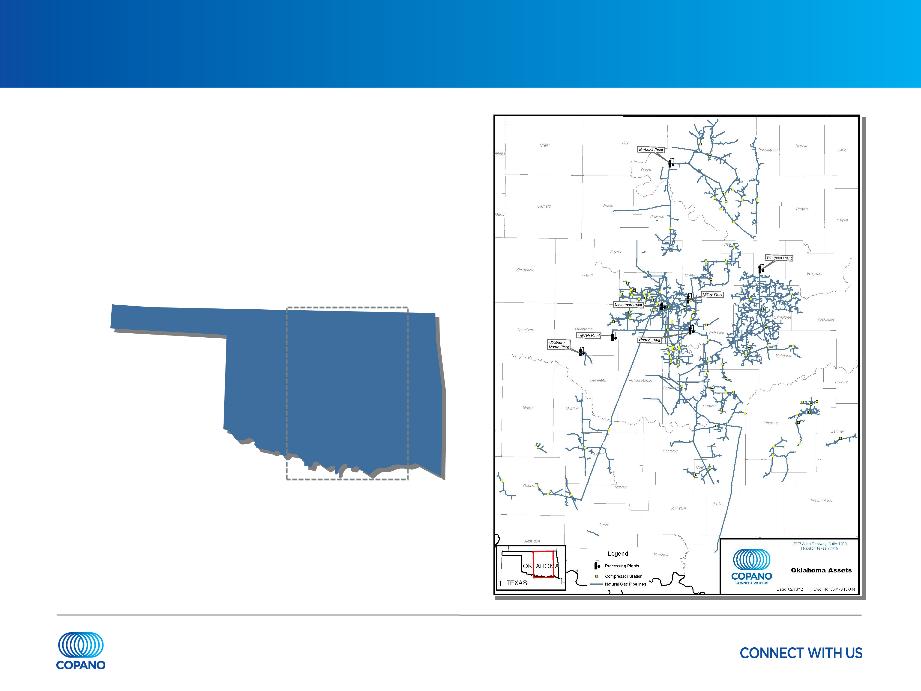
Oklahoma Assets
OKLAHOMA
34
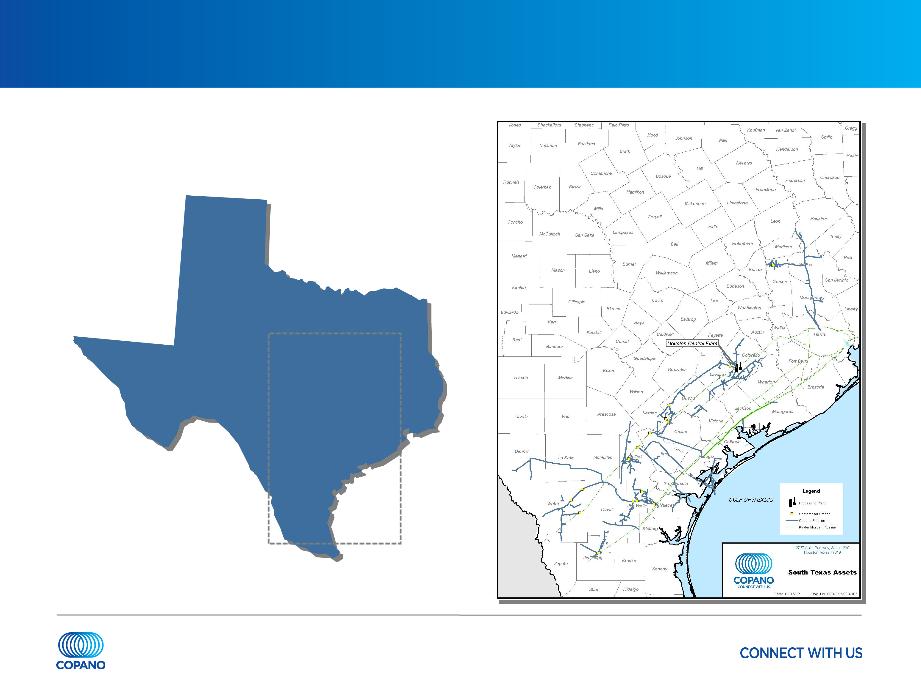
South Texas Assets
TEXAS
35
North Texas Assets
TEXAS
36
Rocky Mountains Assets
WYOMING
37
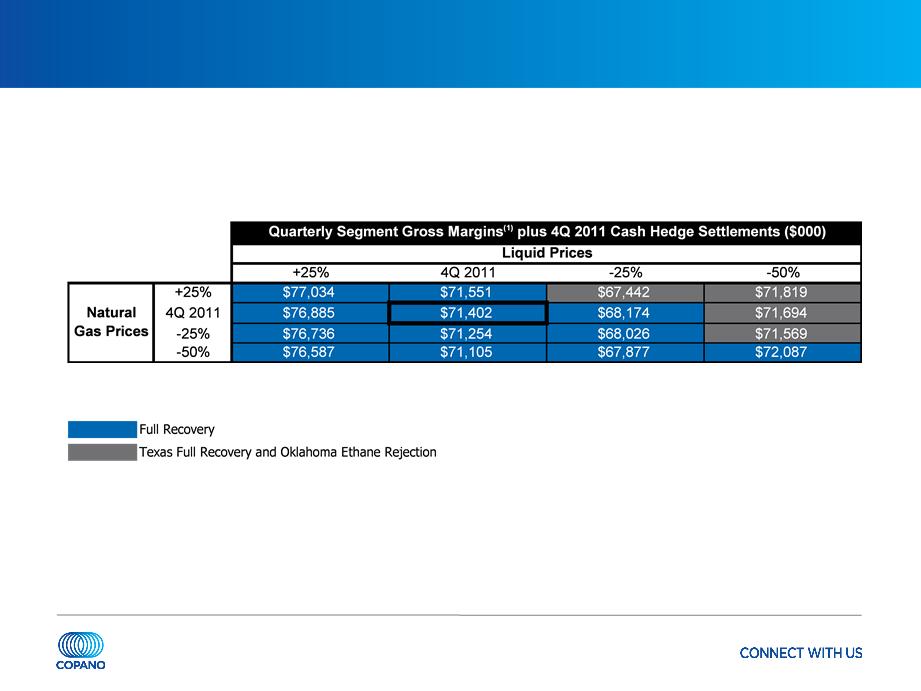
Commodity-Related Margin Sensitivities
Matrix reflects 4Q 2011 wellhead and plant inlet volumes, adjusted using
Copano’s 2011 planning model
Copano’s 2011 planning model
(1) Consists of Texas and Oklahoma Segment gross margins.
38
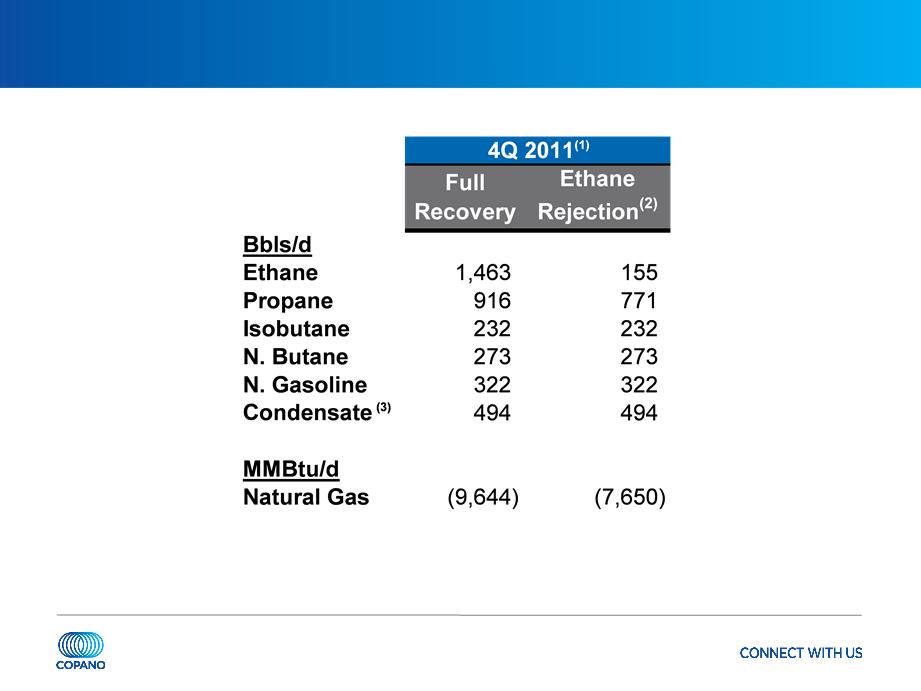
Texas Net Commodity Exposure
Note: See explanation of processing modes in this Appendix.
(1) Source: Copano Energy internal financial planning models. Based on 4Q 2011 daily wellhead/plant inlet volumes.
(2) Fractionation at Houston Central complex permits significant reductions in ethane recoveries in ethane rejection mode. To optimize profitability, plant operations can also be adjusted
to partial recovery mode.
(3) At the Houston Central complex, pentanes+ may be sold as condensate.

39
Texas Commodity Price Sensitivities
Texas segment gross margins excluding hedge settlements
• Matrix reflects 4Q 2011 volumes and operating conditions, adjusted using Copano’s
2011 planning model
2011 planning model
Note: Please see this Appendix for definitions of processing modes and additional details.
40
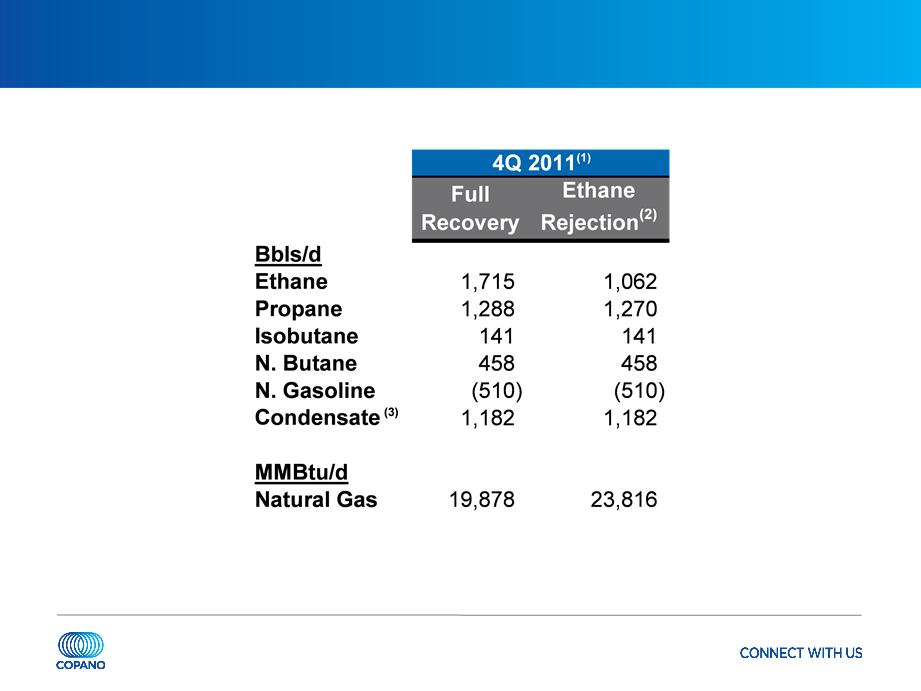
Oklahoma Net Commodity Exposure
Note: See explanation of processing modes in this Appendix. Values reflect rounding.
(1) Source: Copano Energy internal financial planning models.
(2) Ethane rejection at Paden plant is limited by nitrogen rejection facilities.
(3) Reflects impact of producer delivery point allocations, offset by field condensate collection and stabilization.
41
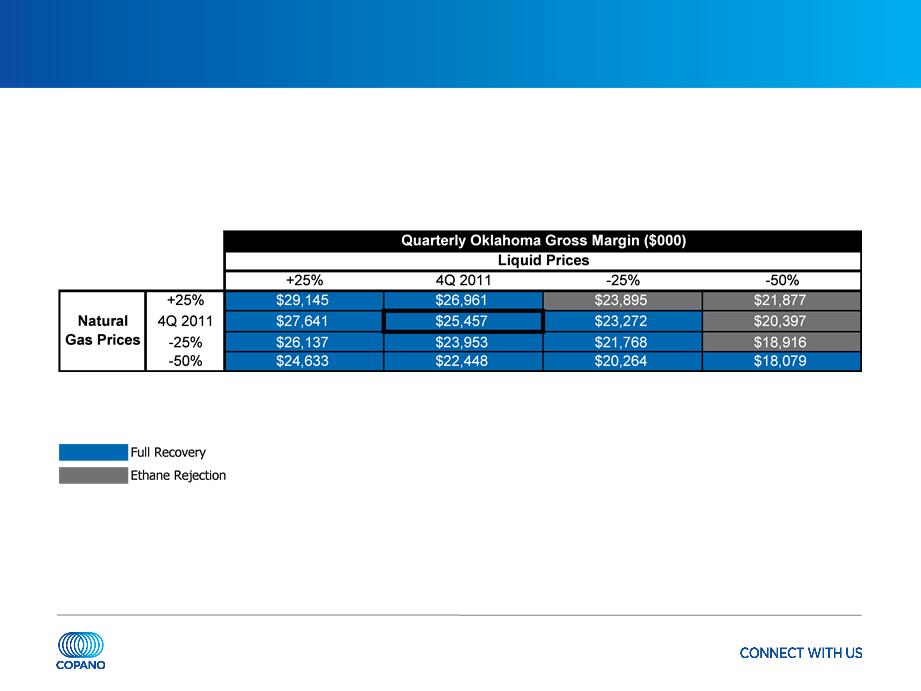
Oklahoma Commodity Price Sensitivities
Oklahoma segment gross margins excluding hedge settlements
• Matrix reflects 4Q 2011 volumes, adjusted using Copano’s 2011 planning model
Note: Please see this Appendix for definitions of processing modes and additional details.

42
Rocky Mountains Sensitivities
4Q 2011 Adjusted EBITDA volume sensitivity (positive or negative impact)
• Bighorn: 10,000 MMBtu/d = $248,000(1)
• Fort Union: 10,000 MMBtu/d = immaterial impact until physical volumes exceed long-term
contractual volume commitments
contractual volume commitments
- 4Q 2011 pipeline throughput: 557,309 MMBtu/d
- 4Q 2011 revenue based on 790,002 MMBtu/d of volume commitments
Note: See this Appendix for reconciliation of Adjusted EBITDA. Values reflect rounding.
(1) Impact on Adjusted EBITDA based on Copano’s interest in the unconsolidated affiliate.
43
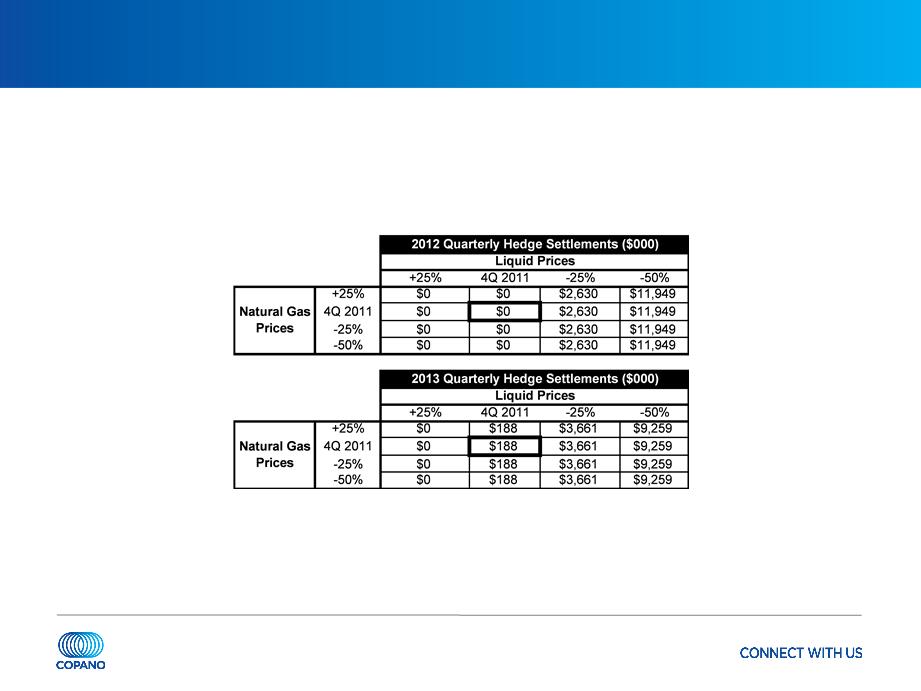
Hedging Impact of Commodity Price Sensitivities
Commodity hedging program supplements cash flow in 2012 through 2013
during less favorable commodity price periods
during less favorable commodity price periods

44
Processing Modes
|
Full Recovery
|
|
|
|
Texas and Oklahoma - If the value of
recovered NGLs exceeds the fuel and gas shrinkage costs of recovering NGLs |
|
Ethane Rejection
|
|
|
|
Texas and Oklahoma - If the value of ethane
is less than the fuel and shrinkage costs to recover ethane (in Oklahoma, ethane rejection at Paden plant is limited by nitrogen rejection facilities) |
45
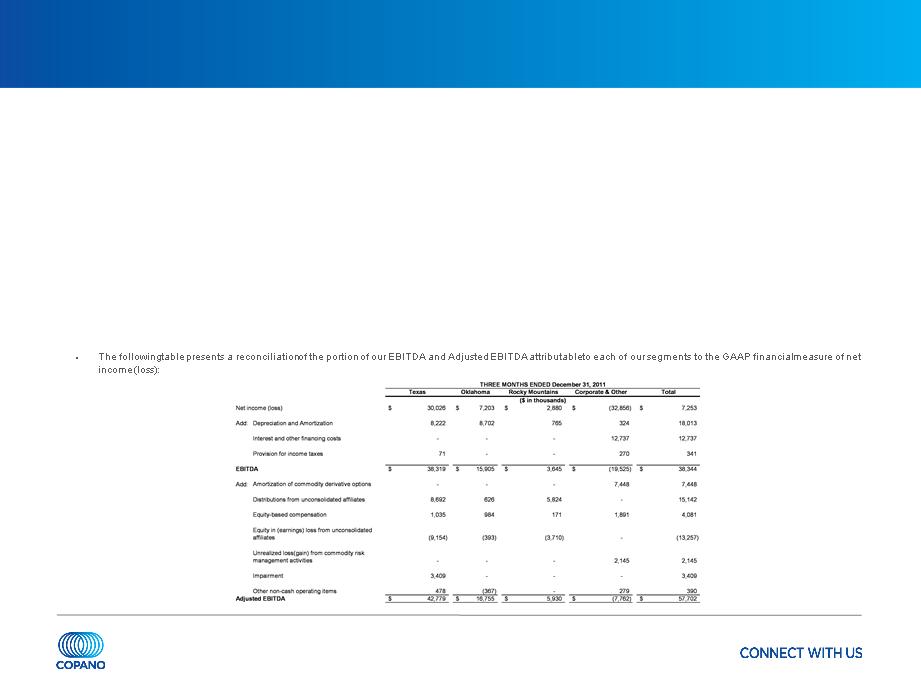
Reconciliation of Non-GAAP Financial Measures
Adjusted EBITDA
• Commencing with the second quarter of 2011, we revised our calculation of adjusted EBITDA to more closely resemble that of many of our peers in terms of measuring
our ability to generate cash. Our adjusted EBITDA (as revised) equals:
our ability to generate cash. Our adjusted EBITDA (as revised) equals:
- net income (loss);
- plus interest and other financing costs, provision for income taxes, depreciation, amortization and impairment expense, non-cash amortization expense associated with our commodity
derivative instruments, distributions from unconsolidated affiliates, loss on refinancing of unsecured debt and equity-based compensation expense;
derivative instruments, distributions from unconsolidated affiliates, loss on refinancing of unsecured debt and equity-based compensation expense;
- minus equity in earnings (loss) from unconsolidated affiliates and unrealized gains (losses) from commodity risk management activities; and
- plus or minus other miscellaneous non-cash amounts affecting net income (loss) for the period.
• In calculating adjusted EBITDA as revised, we no longer add to EBITDA (earnings before interest taxes depreciation and amortization our share of the depreciation,
amortization and impairment expense and interest and other financing costs embedded in our equity in earnings (loss) from unconsolidated affiliates; instead we now add
to EBITDA (i) our impairment expense, and other non-cash amounts affecting net income (loss) for the period, (ii) non-cash amortization expense associated with our
commodity derivative instruments, (iii) loss on refinancing of unsecured debt and (iv) distributions from unconsolidated affiliates.
• We believe that our revised calculation of adjusted EBITDA is a more effective tool for our management in evaluating our operating performance for several reasons.
Although our historical method for calculating adjusted EBITDA was useful in assessing the performance of our assets (including our unconsolidated affiliates) without
regard to financing methods, capital structure or historical cost basis, the prior calculation was not as useful in evaluating the core performance of our assets and their
ability to generate cash because adjustments for a number of non-cash expenses and other non-cash and non-operating items were not reflected in the calculation and
the impact of cash distributions from our unconsolidated affiliates was likewise not reflected. We believe that the revised calculation of adjusted EBITDA is more consistent
with the method and presentation used by many of our peers and will allow management and analysts to better evaluate our performance relative to our peer companies.
Also, we believe that the revised calculation more effectively represents what lenders and debt holders, as well as industry analysts and many of our unitholders, have
indicated is useful in assessing our core performance and outlook and comparing us to other companies in our industry.