Attached files
| file | filename |
|---|---|
| EXCEL - IDEA: XBRL DOCUMENT - UNIVERSAL STAINLESS & ALLOY PRODUCTS INC | Financial_Report.xls |
| EX-23.1 - CONSENT OF SCHNEIDER DOWNS & CO., INC. - UNIVERSAL STAINLESS & ALLOY PRODUCTS INC | d272220dex231.htm |
| EX-21.1 - SUBSIDIARIES OF REGISTRANT - UNIVERSAL STAINLESS & ALLOY PRODUCTS INC | d272220dex211.htm |
| EX-32.1 - SECTION 906 CEO AND CFO CERTIFICATION - UNIVERSAL STAINLESS & ALLOY PRODUCTS INC | d272220dex321.htm |
| EX-31.1 - SECTION 302 CEO CERTIFICATION - UNIVERSAL STAINLESS & ALLOY PRODUCTS INC | d272220dex311.htm |
| EX-31.2 - SECTION 302 CFO CERTIFICATION - UNIVERSAL STAINLESS & ALLOY PRODUCTS INC | d272220dex312.htm |
Table of Contents
UNITED STATES
SECURITIES AND EXCHANGE COMMISSION
Washington, DC 20549
FORM 10-K
| x | ANNUAL REPORT PURSUANT TO SECTION 13 OR 15(d) OF THE SECURITIES EXCHANGE ACT OF 1934 |
For the Fiscal Year Ended December 31, 2011
OR
| ¨ | TRANSITION REPORT PURSUANT TO SECTION 13 OR 15(d) OF THE SECURITIES EXCHANGE ACT OF 1934 |
Commission File Number 000-25032

UNIVERSAL STAINLESS & ALLOY PRODUCTS, INC.
(Exact name of Registrant as specified in its charter)
| DELAWARE | 25-1724540 | |
| (State or other jurisdiction of incorporation or organization) |
(IRS Employer Identification No.) |
| 600 MAYER STREET, BRIDGEVILLE, PA 15017 | (412) 257-7600 | |
| (Address of principal executive offices, including zip code) | (Registrant’s telephone number, including area code) |
Securities registered pursuant to Section 12(b) of the Act:
| Title of each class |
Name of exchange on which registered | |
| Common Stock, par value $0.001 per share | The NASDAQ Stock Market, LLC |
Securities registered pursuant to Section 12(g) of the Act: [None]
Indicate by check mark if the registrant is a well-known seasoned issuer, as defined in Rule 405 of the Securities Act. Yes ¨ No x
Indicate by check mark if the registrant is not required to file reports pursuant to Section 13 or Section 15(d) of the Act. Yes ¨ No x
Indicate by check mark whether the registrant (1) has filed all reports required to be filed by Section 13 or 15(d) of the Securities Exchange Act of 1934 during the preceding 12 months (or for such shorter period that the registrant was required to file such reports), and (2) has been subject to such filing requirements for the past 90 days. Yes x No ¨
Indicate by check mark whether the registrant has submitted electronically and posted on its corporate website, if any, every Interactive Data file required to be submitted and posted pursuant to Rule 405 of Regulation S-T during the preceding 12 months (or for such shorter period that the registrant was required to submit and post such files). Yes x No ¨
Indicate by check mark if disclosure of delinquent filers pursuant to Item 405 of Regulation S-K (§229.405 of this chapter) is not contained herein, and will not be contained, to the best of registrant’s knowledge, in definitive proxy or information statements incorporated by reference in Part III of this Form 10-K or any amendment to this Form 10-K. ¨
Indicate by check mark whether the registrant is a large accelerated filer, an accelerated filer, or a non-accelerated filer. See definitions of “accelerated filer and large accelerated filer” in Rule 12b-2 of the Exchange Act. (Check One)
| Large accelerated filer | ¨ | Accelerated filer | x | |||
| Non-accelerated filer | ¨ (Do not check if a smaller reporting company) | Smaller reporting company | ¨ |
Indicate by check mark whether the registrant is a shell company (as defined in Rule 12b-2 of the Act). Yes ¨ No x
The aggregate market value of the voting stock held by non-affiliates of the registrant on June 30, 2011, based on the closing price of $46.76 per share on that date, was approximately $161,795,000. For the purposes of this disclosure only, the registrant has assumed that its directors, executive officers, and beneficial owners of 5% or more of the registrant’s Common Stock are the affiliates of the registrant. The registrant has made no determination that such persons are “affiliates” within the meaning of Rule 405 under the Securities Act of 1933.
As of February 29, 2012, there were 6,849,184 shares of the Registrant’s Common Stock outstanding.
DOCUMENTS INCORPORATED BY REFERENCE
Part III of this Form 10-K incorporates by reference portions of the Company’s definitive Proxy Statement for the 2012 Annual Meeting of Stockholders.
Table of Contents
i
Table of Contents
PART I
| ITEM 1. | BUSINESS |
GENERAL
Universal Stainless & Alloy Products, Inc. and its wholly-owned subsidiaries (the “Company”), which was incorporated in 1994, manufactures and markets semi-finished and finished specialty steel products, including stainless steel, tool steel and certain other alloyed steels. The Company’s manufacturing process involves melting, remelting, heat treating, hot and cold rolling, forging, machining and cold drawing of semi-finished and finished specialty steels. The Company’s products are sold to rerollers, forgers, service centers, original equipment manufacturers (“OEMs”) and wire redrawers. The Company’s customers further process its products for use in a variety of industries, including the aerospace, power generation, petrochemical and heavy equipment manufacturing industries. The Company also performs conversion services on materials supplied by customers that lack certain of the Company’s production facilities or that are subject to their own capacity constraints.
The Company is comprised of four operating locations and a corporate headquarters. For segment reporting, the Bridgeville, North Jackson and Titusville facilities have been aggregated into one reportable segment, Universal Stainless & Alloy Products (“USAP”). Dunkirk Specialty Steel represents the second reportable segment.
Management is currently evaluating the impact of the 2011 North Jackson Facility acquisition on the Company’s externally reported segments in accordance with Accounting Standards Codification (“ASC”) Topic 280, “Segment Reporting”. The Company has included the results of North Jackson in the USAP reportable segment from the August 18, 2011 acquisition date through December 31, 2011. The North Jackson operating segment was included in the USAP reporting segment as a result of North Jackson having consistent characteristics as identified in ASC Topic 280 with the USAP segment.
The Company’s products are manufactured in a wide variety of grades and melt qualities including argon oxygen decarburization (“AOD”) quality, electro-slag remelted (“ESR”) quality, vacuum induction melting (“VIM”) quality and vacuum-arc remelted (“VAR”) quality. At its Bridgeville facility, the Company produces specialty steel products in the form of long products (ingots, blooms, billets and bars) and flat rolled products (slabs and plates). Certain grades requiring VAR may be transported to the Titusville or North Jackson facilities to complete that process and then be transported to the Bridgeville or Dunkirk facility for further processing. The Company began melting in its new VIM furnace located in North Jackson in December 2011. Material melted in the VIM will be further processed in North Jackson or one of the Company’s other operating facilities. The semi-finished long products are primarily used by the Company’s Dunkirk facility and certain customers to produce finished bar, rod and wire products, and the semi-finished flat rolled products are used by customers to produce light-gauge plate, sheet and strip products. The finished bar products manufactured by the Company are primarily used by OEMs and by service center customers for distribution to a variety of end users. The Company also produces customized shapes primarily for OEMs that are cold rolled from purchased coiled strip, flat bar or extruded bar at its Precision Rolled Products department, located at its Titusville facility.
INDUSTRY OVERVIEW
The specialty steel industry is a relatively small but distinct segment of the overall steel industry. Specialty steels include stainless steels, high-speed and tool steels, electrical steels, high-temperature alloys, magnetic alloys and electronic alloys. Specialty steels are made with a high alloy content, which enables their use in environments that demand exceptional hardness, toughness, strength and resistance to heat, corrosion or abrasion, or combinations thereof. Specialty steels generally must conform to more demanding customer specifications for consistency, straightness and surface finish than carbon steels. According to the Specialty Steel Industry of North America (“SSINA”), annual domestic consumption of specialty steels approximated 2.1 million tons in 2010 compared with 1.6 million tons in 2009. Of the 2010 amount, approximately 1.3 million tons of specialty steels consumed domestically represented stainless steel sheet and strip and electrical alloy products which the Company does not produce. Also, according to SSINA data through October 31, 2011, U.S. consumption of total
1
Table of Contents
specialty steel products in 2011 increased 27% from 2010 levels. The consumption of those products in the Company’s addressable markets, comprising stainless steel bar, rod and wire products, increased by 23%, 12% and 5% in 2011, 2010 and 2009, respectively.
The Company primarily manufactures its products within the following product lines and, generally, in response to customer orders:
Stainless Steel. Stainless steel, which represents the largest part of the specialty steel market, contains elements such as nickel, chrome and molybdenum that give it the unique qualities of high strength, good wear characteristics, natural attractiveness, ease of maintenance and resistance to rust, corrosion and heat. Stainless steel is used, among other applications, in the automotive, aerospace, petrochemical and power generation industries, as well as in the manufacturing of food handling, health and medical, chemical processing and pollution control equipment. The increased number of applications for stainless steel has resulted in the development of a greater variety of stainless steel metallurgical grades than carbon steel.
Tool Steel. Tool steels contain elements of manganese, silicon, chrome and molybdenum to produce specific hardness characteristics that enable tool steels to form, cut, shape and shear other materials in the manufacturing process. Heating and cooling at precise rates in the heat-treating process bring out these hardness characteristics. Tool steels are utilized in the manufacturing of metals, plastics, paper and aluminum extrusions, pharmaceuticals, electronics and optics.
High-Strength Low Alloy Steel. High-strength low alloy steel is a relative term that refers to those steels that maintain alloying elements that range in versatility. The alloy element of nickel, chrome and molybdenum in such steels typically exceeds the alloy element of carbon steels but not that of high-temperature alloy steel. High-strength low alloy steels are manufactured for use generally in the aerospace industry.
High-Temperature Alloy Steel. These steels are designed to meet critical requirements of heat resistance and structural integrity. They generally have very high nickel content relative to other types of specialty steels. High-temperature alloy steels are manufactured for use generally in the aerospace industry.
Net sales by principal product line were as follows:
| For the years ended December 31, | 2011 | 2010 | 2009 | |||||||||
|
|
||||||||||||
| (dollars in thousands) |
||||||||||||
| Stainless steel |
$ | 202,000 | $ | 142,302 | $ | 98,069 | ||||||
| Tool steel |
21,963 | 26,196 | 9,413 | |||||||||
| High-strength low alloy steel |
17,532 | 10,310 | 9,235 | |||||||||
| High-temperature alloy steel |
6,809 | 5,853 | 5,567 | |||||||||
| Conversion services |
3,905 | 2,719 | 1,203 | |||||||||
| Other |
387 | 2,043 | 1,420 | |||||||||
|
|
|
|
|
|
|
|||||||
| Total net sales |
$ | 252,596 | $ | 189,423 | $ | 124,907 | ||||||
|
|
|
|
|
|
|
|||||||
RAW MATERIALS
The Company depends on the delivery of key raw materials for its day-to-day operations. These key raw materials are ferrous and non-ferrous scrap metal and alloys, primarily consisting of nickel, chrome, molybdenum, manganese and copper. Scrap metal is primarily generated by industrial sources and is purchased through a number of scrap brokers and dealers. The Company also recycles scrap metal generated from its own production operations as a source of metal for the melt shop. Alloys are generally purchased from domestic agents and originate in the United States, Australia, Canada, China, Russia, Brazil and South Africa. Political disruptions in countries such as these could cause supply interruptions and affect the availability and price of the raw materials purchased by the Company.
2
Table of Contents
The Bridgeville facility currently supplies semi-finished specialty steel products as starting materials to the Company’s North Jackson, Titusville and Dunkirk facilities. Semi-finished specialty steel starting materials, not capable of being produced by the Company at a competitive cost, are purchased from other suppliers. The Company generally purchases these starting materials from steel strip coil suppliers, extruders, flat rolled producers and service centers. The Company believes that adequate supplies of starting material will continue to be available. In December 2011, the Company also began producing starting material in its new VIM furnace at its North Jackson facility.
The cost of raw materials represents more than 50% of the Company’s total cost of products sold in 2011, 2010 and 2009. Raw material costs can be impacted by significant price changes. Raw material prices vary based on numerous factors, including quality, and are subject to frequent market fluctuations. Future raw material prices cannot be predicted with any degree of certainty. The Company does not maintain any long-term agreements with any of its raw material suppliers.
The Company has implemented a sales price surcharge mechanism on its products to help offset the impact of raw material price fluctuations. For substantially all stainless semi-finished products, the surcharge is calculated at the time of order entry, based on current raw material prices or prices at the time of shipment. For substantially all finished products and tool steel plate, the surcharge is calculated based on the monthly average raw material prices two months prior to the promised ship date. While the material surcharge mechanism is designed to offset modest fluctuations in raw material prices, it cannot immediately absorb significant spikes in raw material prices. A material change in raw material prices within a short period of time could have a material effect on the financial results of the Company, and there can be no assurance that the raw material surcharge mechanism will completely offset immediate changes in the Company’s raw material costs.
ENERGY AGREEMENTS
The production of specialty steel requires the ready availability of substantial amounts of electricity and natural gas for which the Company negotiates competitive agreements for the supply of electricity and natural gas. While the Company believes that its energy agreements allow it to compete effectively within the specialty steel industry, the potential of curtailments exists as a result of decreased supplies during periods of increased demand for electricity and natural gas. These interruptions not only can adversely affect the operating performance of the Company, but also can lead to increased costs. The Company has a sales price surcharge mechanism on its products to help offset the impact of natural gas price fluctuations.
CUSTOMERS
The Company’s five largest customers in the aggregate accounted for approximately 45%, 45% and 38% of sales for the years ended December 31, 2011, 2010 and 2009, respectively. For the year ended December 31, 2011, sales to Carpenter Technology Corporation and Fry Steel Company accounted for 12% and 11% of the Company’s net sales, respectively, and 13% and 9% of its accounts receivable, respectively. No other customer accounted for more than 10% of the Company’s net sales for the year ended December 31, 2011. Sales outside of the United States approximated 4% of 2011, 5% of 2010 and 10% of 2009 net sales.
BACKLOG
The Company’s backlog of orders on hand, considered to be firm, as of December 31, 2011 was approximately $102.6 million as compared to approximately $69.3 million at the same time in 2010. The 48.0% increase in the backlog is primarily due to increased demand primarily caused by improving economic and credit conditions. The December 31, 2011 backlog has no promise dates beyond the year 2012. The Company’s backlog may not be indicative of actual sales because certain surcharges are not determinable until the order is shipped to the customer and therefore should not be used as a direct measure of future revenue.
3
Table of Contents
COMPETITION
Competition in the Company’s markets is based upon product quality, delivery capability, customer service and price. Maintaining high standards of product quality, while responding quickly to customer needs and keeping production costs at competitive levels, is essential to the Company’s ability to compete in its markets.
Annual domestic U.S. consumption of specialty steel products of the type manufactured by the Company approximated 600,000 tons in 2010 compared with 400,000 tons in 2009. The Company chooses to restrict its participation in this market by limiting the volume of commodity stainless steel products it markets because of the highly competitive nature of the commodity business.
The Company believes that twelve companies that manufacture one or more similar specialty steel products are significant competitors. There are many smaller producing companies and material converters that are also considered to be competitors of the Company.
High import penetration of specialty steel products, especially stainless and tool steels, also impacts the competitive nature within the United States. Unfair pricing practices by foreign producers have resulted in high import penetration into the U.S. markets in which the Company participates. According to SSINA, import penetration for the years ended December 31, 2010 and 2009 was 50% and 51%, respectively, for stainless bar, and 37% and 39%, respectively, for stainless rod. Import penetration during the first ten months of 2011 for stainless bar and rod was 55% and 38%, respectively, according to SSINA.
The Continued Dumping and Subsidy Offset Act of 2000 (the “CDSOA”) provides for payment of import duties collected by the U.S. Treasury to domestic companies injured by unfair foreign trade practices. The Company has joined other domestic producers in the filing of trade actions against foreign producers.
In 2011, 2010 and 2009, the Company received import duty net payments of $115,000, $32,000, $551,000, respectively. Benefits awarded from the CDSOA expired on September 30, 2007. Future benefits are dependent on the amount of undistributed import duties collected as of September 30, 2007 and the relationship of Dunkirk Specialty Steel’s claim in relation to claims filed by other domestic specialty steel producers. The Company expects minimal distributions in the future.
EMPLOYEE RELATIONS
The Company considers the maintenance of good relations with its employees to be important to the successful conduct of its business. The Company has profit-sharing plans for certain salaried employees and for all of its employees represented by United Steelworkers (the “USW”) and has equity ownership programs for all of its eligible employees, in an effort to forge an alliance between its employees’ interests and those of the Company’s stockholders. At December 31, 2011, the Company had 661 employees, of which 518 were USW members.
Collective Bargaining Agreements
The Company’s Bridgeville, Titusville and Dunkirk facilities recognize the USW as the exclusive representative for their hourly employees with respect to the terms and conditions of their employment. The North Jackson facility is not unionized. The Company has entered into the following collective bargaining agreements:
| Facility |
Commencement Date |
Expiration Date | ||
| Dunkirk |
November 2007 | October 2012 | ||
| Bridgeville |
September 2008 | August 2013 | ||
| Titusville |
October 2010 | September 2015 |
4
Table of Contents
The Company believes a critical component of its collective bargaining agreements is the inclusion of a profit sharing plan. Under the plan, the hourly employees are entitled to receive 8.5% of their respective facilities’ annual pre-tax profits in excess of $1.0 million at Bridgeville and Dunkirk, and in excess of $500,000 at Titusville.
Employee Benefit Plans
The Company maintains a 401(k) retirement plan for its hourly and salaried employees. Pursuant to the 401(k) plan, participants may elect to make pre-tax and after-tax contributions, subject to certain limitations imposed under the Internal Revenue Code of 1986, as amended. In addition, the Company makes periodic contributions to the 401(k) plan for the hourly employees employed at the Dunkirk and Titusville facilities, based on service, and at the North Jackson facility based upon the employee’s age. The Company makes periodic contributions for the salaried employees at all locations, except for North Jackson, based upon their individual contribution to the 401(k) retirement plan. For North Jackson salaried employees, the Company makes periodic contributions based upon the employee’s age.
The Company participates in the Steelworkers Pension Trust (the “Trust”), a multi-employer defined-benefit pension plan that is open to all hourly and salaried employees associated with the Bridgeville facility. The Company makes periodic contributions to the Trust based on hours worked at a fixed rate for each hourly employee and a fixed monthly contribution on behalf of each salaried employee.
The Company also provides group life and health insurance plans for its hourly and salaried employees.
Employee Stock Purchase Plan
Under the 1996 Employee Stock Purchase Plan, as amended (the “Plan”), the Company is authorized to issue up to 150,000 shares of Common Stock to its full-time employees, nearly all of whom are eligible to participate. Under the terms of the Plan, employees can choose as of January 1 and July 1 of each year to have up to 10% of their total earnings withheld to purchase up to 100 shares of the Company’s Common Stock each six-month period. The purchase price of the stock is 85% of the lower of its beginning-of-the-period or end-of-the-period market prices. At December 31, 2011, the Company had issued 131,484 shares of Common Stock since the Plan’s inception.
ENVIRONMENTAL
The Company is subject to federal, state and local environmental laws and regulations (collectively, “Environmental Laws”), including those governing discharges of pollutants into the air and water, and the generation, handling and disposal of hazardous and non-hazardous substances. The Company monitors its compliance with applicable Environmental Laws and, accordingly, believes that it is currently in compliance with all laws and regulations in all material respects. The Company is subject periodically to environmental compliance reviews by various regulatory offices. The Company may be liable for the remediation of contamination associated with generation, handling and disposal activities. Environmental costs could be incurred, which may be significant, related to environmental compliance, at any time or from time to time in the future.
5
Table of Contents
EXECUTIVE OFFICERS
The following table sets forth, as of February 29, 2012, certain information with respect to the executive officers of the Company:
| NAME (AGE) |
EXECUTIVE OFFICER SINCE |
POSITION | ||
| Dennis M. Oates (59) | 2008 | Chairman, President and Chief Executive Officer | ||
| William W. Beible, Jr. (60) | 2009 | Senior Vice President of Operations | ||
| Paul A. McGrath (60) | 1996 | Vice President of Administration, General Counsel and Secretary | ||
| Douglas M. McSorley (46) | 2010 | Vice President of Finance, Chief Financial Officer and Treasurer | ||
| Christopher M. Zimmer (38) | 2010 | Vice President of Sales and Marketing | ||
Dennis M. Oates has been President and Chief Executive Officer of the Company since January 2008. Mr. Oates was named to the Company’s Board of Directors in October 2007. Mr. Oates previously served as Senior Vice President of the Specialty Alloys Operations of Carpenter Technology Corporation from 2003 to July 2007. Mr. Oates also served as President and Chief Executive Officer of TW Metals, Inc. from 1998 to 2003. In May 2010, the Board of Directors elected Mr. Oates to the additional position of Chairman.
William W. Beible, Jr. has been Senior Vice President of Operations of the Company since February 2009. Mr. Beible was employed by Carpenter Technology Corporation from 2006 to 2008 and served in several positions, including Vice President of Manufacturing—Specialty Alloys Operations. Mr. Beible also served as Vice President of Business Improvement and of Information Technology at P.H. Glatfelter Company, a global supplier of specialty papers and engineered products, from 2003 to 2005. Prior to working at P.H. Glatfelter Company, Mr. Beible spent approximately 29 years in various managerial roles in the steel industry.
Paul A. McGrath has been Vice President of Administration of the Company since January 2007, General Counsel since 1995 and was appointed Secretary in 1996. Mr. McGrath served as Vice President of Operations from 2001 to December 2006. Previously, he was employed by Westinghouse Electric Corporation for approximately 24 years in various management positions.
Douglas M. McSorley has been Vice President of Finance, Chief Financial Officer and Treasurer since July 2010. Mr. McSorley was previously employed as Chief Financial Officer of PSC Metals, Inc. (“PSC”), an Icahn Enterprises L.P. scrap metal recycling company operating in the United States and Canada from 1999 to 2009. He joined a predecessor company to PSC as Controller in 1994, after serving five years with Deloitte & Touche LLP in Ontario, Canada, where he worked as a Chartered Accountant with a broad spectrum of industrial clients.
Christopher M. Zimmer has been Vice President of Sales and Marketing since April 2008. Mr. Zimmer previously served as Vice President of Sales and Marketing for Schmoltz+Bickenbach USA from 1995 to 2008. He held positions of increasing responsibility including inside sales, commercial manager—stainless bar, general manager—nickel alloy products, and National Sales Manager.
PATENTS AND TRADEMARKS
The Company does not consider its business to be materially dependent on patent or trademark protection, and believes it owns or maintains effective licenses covering all the intellectual property used in its business. The Company seeks to protect its proprietary information by use of confidentiality and non-competition agreements with certain employees.
6
Table of Contents
AVAILABLE INFORMATION
Copies of the Company’s Annual Report on Form 10-K, Quarterly Reports on Form 10-Q, current reports on Form 8-K, and any amendments to those reports, as well as proxy and information statements that we file with the Securities and Exchange Commission (the “SEC”), are available free of charge on the Company’s website at www.univstainless.com as soon as reasonably practicable after such reports are filed with the SEC. The contents of our website are not part of this Form 10-K. Copies of these documents will be available to any shareholder upon request. Requests should be directed in writing to Investor Relations at 600 Mayer Street, Bridgeville, PA 15017. You also may read and copy any materials we file with the SEC at the SEC’s Public Reference Room at 100 F Street, NE, Washington, DC 20549. You may obtain information on the operation of the Public Reference Room by calling the SEC at 1-800-SEC-0330. The SEC maintains an Internet site at www.sec.gov that contains reports, proxy and information statements and other information regarding issuers, like the Company, that file electronically with the SEC.
The Company’s business and results of operations are subject to a wide range of substantial business and economic factors including, but not limited to, the factors discussed below, many of which are not within the Company’s control. Other factors of which the Company is unaware or which the Company does not consider to be material at this time also may impact the Company’s business and results of operations. See the information under the heading “Forward-Looking Information Safe Harbor” in Item 7, Management’s Discussion and Analysis of Financial Condition and Results of Operations, of this Annual Report on Form 10-K.
A substantial amount of the Company’s sales are derived from a limited number of customers.
Net sales to the Company’s two largest customers in 2011 accounted for 12% and 11% of 2011 sales. The accounts receivable balance from these largest customers comprised approximately 13% and 9% of total accounts receivable at December 31, 2011. An adverse change in, or termination of, the Company’s relationship with one or more of its major customers or one or more of its market segments could have a material adverse effect upon the Company. See the information under the heading “Customers” in Item 1, Business, of this Annual Report on Form 10-K.
The Company’s business is very competitive and increased competition could reduce its sales.
The Company competes with domestic and foreign producers of specialty steel products. In addition, many of the finished products sold by the Company’s customers are in direct competition with finished products manufactured by foreign sources, which may affect the demand for those customers’ products. Any competitive factors that adversely affect the market for finished products manufactured by the Company or its customers could indirectly adversely affect the demand for the Company’s semi-finished products. Additionally, the Company’s products compete with products fashioned from alternative materials such as aluminum, composites and plastics, the production of which includes domestic and foreign enterprises. Competition in the Company’s field is intense and is expected to continue to be so in the foreseeable future. There can be no assurance that the Company will be able to compete successfully in the future. See the information under the heading “Competition” in Item 1, Business, of this Annual Report on Form 10-K.
A substantial amount of the Company’s sales are derived from the aerospace industry.
Approximately 42% of the Company’s sales and 33% of tons shipped represent products sold to customers in the aerospace market in 2011. The aerospace market is historically cyclical due to both external and internal market factors. These factors include general economic conditions, diminished credit availability, airline profitability, demand for air travel, age of fleets, varying fuel and labor costs, price competition, and international and domestic political conditions such as military conflict and the threat of terrorism. The length and degree of
7
Table of Contents
cyclical fluctuation can be influenced by any one or a combination of these factors and therefore are difficult to predict with certainty. A downturn in the aerospace industry would adversely affect the demand for products and/or the prices at which the Company is able to sell its products, and its results of operations, business and financial condition could be materially adversely affected.
The Company is dependent on the availability and price of raw materials.
The Company purchases scrap metal and alloy additives, principally nickel, chrome, molybdenum, manganese and copper, for its melting operation. A substantial portion of the alloy additives is available only from foreign sources, some of which are located in countries that may be subject to unstable political and economic conditions. Those conditions might disrupt supplies or affect the prices of the raw materials used by the Company. The Company maintains sales price surcharges to help offset the impact of raw material price fluctuations.
The Company does not maintain long-term supply agreements with any of its raw material suppliers. If its supply of raw materials were interrupted, the Company might not be able to obtain sufficient quantities of raw materials, or obtain sufficient quantities of such materials at satisfactory prices, which, in either case, could adversely affect the Company’s results of operations. In addition, significant volatility in the price of the Company’s principal raw materials could adversely affect the Company’s financial results and there can be no assurance that the raw material surcharge mechanism employed by the Company will completely offset immediate changes in the Company’s raw material costs. See the information under the headings “Raw Materials” in Item 1, Business, and “Liquidity and Capital Resources” and “Future Outlook” in Item 7, Management’s Discussion and Analysis of Financial Condition and Results of Operations, of this Annual Report on Form 10-K.
The Company is subject to risks associated with global economic and market factors.
The Company’s results of operations are affected directly by the level of business activity of its customers, which in turn is affected by global economic and market factors impacting the industries and markets that they serve. The Company is susceptible to macroeconomic downturns in the United States and abroad that may affect the general economic climate, its performance and the demand of its customers. The Company may face significant challenges if conditions in the financial markets deteriorate. There can be no assurance that global economic and market conditions will not adversely impact the Company’s results of operations, cash flow or financial position in the future.
The Company may experience a shortage in the supply of energy or an increase in energy costs to operate its facilities.
The manufacturing of specialty steels is an energy-intensive industry. While the Company believes that its energy agreements allow it to compete effectively within the specialty steel industry, the Company is subjected to curtailments as a result of decreased supplies and increased demand for electricity and natural gas. These interruptions not only can adversely affect the operating performance of the Company, but also can lead to increased costs for energy. See the information under the heading “Energy Agreements” in Item 1, Business, of this Annual Report on Form 10-K.
The Company’s business depends largely on our ability to attract and retain key personnel.
The Company depends on the continued service, availability and ability to attract skilled personnel, including members of its executive management team, management, metallurgists, maintenance and production positions. The inability of the Company and industry to attract and retain such people may adversely impact its ability to fill existing roles and support growth. Further, the loss of key personnel could adversely affect the Company’s ability to perform until suitable replacements are found.
The Company’s business may be harmed by strikes or work stoppages.
At December 31, 2011, the Company had 518 employees out of a total of 661 who were covered under collective bargaining agreements. The collective bargaining agreement for hourly employees at the Company’s Dunkirk facility expires in October 2012. Approximately 34% of the Company’s employees at December 31, 2011 were
8
Table of Contents
covered by this collective bargaining agreement. There can be no assurance that the Company will be successful in timely concluding collective bargaining agreements with the USW to succeed the agreements that expire.
The Company’s business may be harmed by failures on critical manufacturing equipment.
The Company’s manufacturing processes are dependent upon certain critical pieces of specialty steel making equipment, such as the Company’s 50-ton electric-arc furnace and AOD vessel, its ESR, VIM and VAR furnaces, its radial hydraulic forge and its universal rolling mill. In the event a critical piece of equipment should become inoperative as a result of unexpected equipment failure, there can be no assurance that the Company’s operations would not be substantially curtailed, which may have a negative effect on the Company’s financial results. See Item 2, Properties.
The acquisition of the North Jackson Facility may not achieve its intended results.
The Company acquired the North Jackson Facility with the expectation that the acquisition will result in various benefits and synergies. The Company’s achievement of the anticipated benefits and synergies of the acquisition is subject to a number of uncertainties. For example, it is possible that the integration process could take longer or cost more than anticipated and could result in the disruption of the Company’s ongoing businesses, processes and systems. Further, the Company may not have discovered prior to closing all known and unknown factors regarding the assets acquired that could produce unintended and unexpected consequences for the Company. As a result, no assurance can be given that the anticipated benefits and synergies of the acquisition will be realized or, if realized, the timing or cost of their realization. Failure to achieve the anticipated benefits and synergies could result in increased costs or decreases in the amount of expected revenues associated with the acquired assets.
ITEM 1B. UNRESOLVED STAFF COMMENTS
None.
The Company owns its Bridgeville facility, which consists of approximately 760,000 square feet of floor space and the Company’s executive offices on approximately 74 acres. The Bridgeville facility contains melting, remelting, conditioning, rolling, annealing and various other processing equipment. Substantially all products shipped from the Bridgeville facility are processed through its melt shop and universal rolling mill operations.
The Company owns its North Jackson facility, which consists of approximately 231,000 square feet of floor space on approximately 110 acres. The North Jackson facility contains melting, remelting, forging, annealing and various other processing operations.
The Company owns its Dunkirk facility, which consists of approximately 680,000 square feet of floor space on approximately 81 acres. The Dunkirk facility processes semi-finished billet and bar stock through one or more of its four rolling mills, a high temperature annealing facility and/or a round bar facility.
The Company owns its Titusville facility, which consists of seven buildings on approximately 10 acres, including two principal buildings of approximately 265,000 square feet in total area. The Titusville facility contains five VAR furnaces and various rolling and finishing equipment.
Specialty steel production is a capital-intensive industry. The Company believes that its facilities and equipment are suitable for its present needs. The Company believes, however, that it will continue to require capital from time to time to add new equipment and to repair or replace existing equipment to remain competitive and to enable it to manufacture quality products and provide delivery and other support service assurances to its customers. See Capital Expenditures and Investments, within Management’s Discussion and Analysis of Financial Condition and Results of Operations.
9
Table of Contents
From time to time, various lawsuits and claims have been or may be asserted against the Company relating to the conduct of its business, including routine litigation relating to commercial and employment matters. The ultimate cost and outcome of any litigation or claim cannot be predicted with certainty. Management believes, based on information presently available, that the likelihood that the ultimate outcome of any such pending matter will have a material adverse effect on its financial condition, or liquidity or a material impact to its results of operations is remote, although the resolution of one or more of these matters may have a material adverse effect on its results of operations for the period in which the resolution occurs.
ITEM 4. MINE SAFETY DISCLOSURES
Not applicable.
PART II
| ITEM 5. | MARKET FOR THE REGISTRANT’S COMMON EQUITY, RELATED STOCKHOLDER MATTERS AND ISSUER PURCHASES OF EQUITY SECURITIES |
At December 31, 2011, a total of 7,130,365 shares of the Company’s Common Stock, par value $.001 per share, were issued and held by approximately 133 holders of record. There were 282,850 shares of the issued Common Stock of the Company held in treasury at December 31, 2011.
Certain holders of Common Stock and the Company are party to a stockholder agreement. That agreement maintains in effect certain registration rights granted to non-management stockholders and provides to them two demand registration rights exercisable at any time upon written request for the registration of shares of Common Stock having an aggregate net offering price of at least $5.0 million.
PRICE RANGE OF COMMON STOCK
The Common Stock is listed on the NASDAQ Global Select Market under the symbol “USAP.” The following table sets forth the range of high and low sales prices per share of Common Stock, for the periods indicated below:
| 2011 | 2010 | |||||||||||||||
| High | Low | High | Low | |||||||||||||
| First quarter |
$ | 34.75 | $ | 25.43 | $ | 24.09 | $ | 17.07 | ||||||||
| Second quarter |
$ | 47.37 | $ | 28.01 | $ | 25.37 | $ | 15.83 | ||||||||
| Third quarter |
$ | 52.70 | $ | 22.25 | $ | 25.06 | $ | 15.68 | ||||||||
| Fourth quarter |
$ | 41.93 | $ | 23.01 | $ | 33.50 | $ | 23.80 | ||||||||
EQUITY COMPENSATION PLAN INFORMATION
Securities authorized for issuance under equity compensation plans at December 31, 2011 were as follows:
| Plan Category | Number of shares to be issued upon exercise of outstanding options |
Weighted-average exercise price of outstanding options |
Number of shares remaining available for future issuance under equity compensation plans (A) |
|||||
|
|
||||||||
| Equity compensation plans approved by security holders |
720,100 | $ 25.19 | 330,834 | |||||
| Equity compensation plans not approved by security holders |
- | - | - | |||||
|
|
|
|
||||||
| Total |
720,100 | $ 25.19 | 330,834 | |||||
|
|
|
|
||||||
| (A) | Includes 312,318 shares of Common Stock on stock options not issued under the Stock Incentive Plan and 18,516 shares of Common Stock available under the 1996 Employee Stock Purchase Plan, as amended. |
10
Table of Contents
PERFORMANCE GRAPH
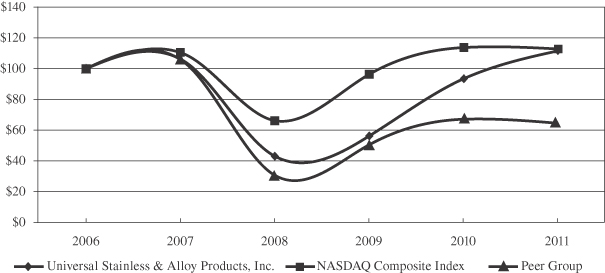
The performance graph below compares the cumulative total shareholder return on the Company’s stock with the cumulative total return on the equity securities of the NASDAQ Composite Index and a peer group selected by the Company. The peer group consists of domestic specialty steel producers: Allegheny Technologies Incorporated; Materion Corporation (f/k/a Brush Engineered Materials Inc.); Carpenter Technology Corporation; Haynes International, Inc.; and RTI International Metals, Inc. The graph assumes an investment of $100 on December 31, 2006 reinvestment of dividends, if any, on the date of dividend payment and the peer group is weighted by each company’s market capitalization. The performance graph represents past performance and should not be considered to be an indication of future performance.
Comparison of 5-Year Cumulative Total Shareholder Return among Universal Stainless & Alloy Products, Inc., the NASDAQ Composite Index and a Peer Group
| For the years ended December 31, | ||||||||||||||||||||||||
| Company/Peer/Market |
2006 | 2007 | 2008 | 2009 | 2010 | 2011 | ||||||||||||||||||
| Universal Stainless & Alloy Products, Inc. |
$ | 100.00 | $ | 106.24 | $ | 43.28 | $ | 56.33 | $ | 93.43 | $ | 111.59 | ||||||||||||
| Peer Group |
100.00 | 105.98 | 30.80 | 50.73 | 67.16 | 64.47 | ||||||||||||||||||
| NASDAQ Composite Index |
100.00 | 110.55 | 66.30 | 96.34 | 113.71 | 112.81 | ||||||||||||||||||
PREFERRED STOCK
The Company’s Certificate of Incorporation provides that the Company may, by vote of its Board of Directors, issue up to 1,980,000 shares of Preferred Stock. The Preferred Stock may have rights, preferences, privileges and restrictions thereon, including dividend rights, dividend rates, conversion rights, voting rights, terms of redemption, redemption prices, liquidation preferences and the number of shares constituting any series or designation of such series, without further vote or action by the stockholders. The issuance of Preferred Stock may have the effect of delaying, deferring or preventing a change in control of the Company without further action by the stockholders and may adversely affect the voting and other rights of the holders of Common Stock. The issuance of Preferred Stock with voting and conversion rights may adversely affect the voting power of the holders of Common Stock, including the loss of voting control to others. The Company has no outstanding Preferred Stock and has no current plans to issue any of the authorized Preferred Stock.
DIVIDENDS
The Company has never paid a cash dividend on its Common Stock. The Company’s Credit Agreement does not permit the payment of cash dividends on its Common Stock.
11
Table of Contents
ITEM 6. SELECTED FINANCIAL DATA
| For the years ended December 31, |
2011 | 2010 | 2009 | 2008 | 2007 | |||||||||||||||
| (dollars in thousands, except per share amounts) |
||||||||||||||||||||
| Summary of operations: |
||||||||||||||||||||
| Net sales |
$ | 252,596 | $ | 189,423 | $ | 124,907 | $ | 235,106 | $ | 229,936 | ||||||||||
| Operating income (loss) |
$ | 29,687 | $ | 20,423 | $ | (4,657 | ) | $ | 19,092 | $ | 33,407 | |||||||||
| Net income (loss) |
$ | 18,122 | $ | 13,242 | $ | (2,958 | ) | $ | 13,950 | $ | 22,504 | |||||||||
| Financial position at year-end: |
||||||||||||||||||||
| Cash |
$ | 274 | $ | 34,400 | $ | 41,615 | $ | 14,272 | $ | 8,584 | ||||||||||
| Working capital (A) |
$ | 113,971 | $ | 110,096 | $ | 97,572 | $ | 94,821 | $ | 85,921 | ||||||||||
| Property, plant & equipment, net (A) |
$ | 183,148 | $ | 71,581 | $ | 70,085 | $ | 62,626 | $ | 54,271 | ||||||||||
| Total assets (A) |
$ | 361,672 | $ | 210,601 | $ | 180,980 | $ | 182,404 | $ | 162,232 | ||||||||||
| Long-term debt (A) |
$ | 91,650 | $ | 7,990 | $ | 10,823 | $ | 1,046 | $ | 1,453 | ||||||||||
| Stockholders’ equity |
$ | 180,306 | $ | 159,623 | $ | 144,226 | $ | 145,700 | $ | 129,602 | ||||||||||
| Common share data: |
||||||||||||||||||||
| Net income (loss) per common share – Basic |
$ | 2.65 | $ | 1.95 | $ | (0.44 | ) | $ | 2.08 | $ | 3.39 | |||||||||
| Net income (loss) per common share – Diluted |
$ | 2.56 | $ | 1.93 | $ | (0.44 | ) | $ | 2.05 | $ | 3.32 | |||||||||
| (A) | The December 31, 2011 balances include $(10.2) million of working capital, $107.7 million of property, plant & equipment, $132.4 million of total assets and $91.7 million of long-term debt relating to the North Jackson operations. |
12
Table of Contents
| ITEM 7. | MANAGEMENT’S DISCUSSION AND ANALYSIS OF FINANCIAL CONDITION AND RESULTS OF OPERATIONS |
Overview
The following Management Discussion and Analysis (“MD&A”) is intended to help the reader understand the results of operations and financial condition of Universal Stainless & Alloy Products, Inc. (“the “Company”). This MD&A is provided as a supplement to, and should be read in conjunction with, our consolidated financial statements and the accompanying notes to the financial statements.
We manufacture and market semi-finished and finished specialty steel products, including stainless steel, tool steel and certain other alloyed steels. Our manufacturing process involves melting, remelting, heat treating, hot and cold rolling, forging, machining and cold drawing of semi-finished and finished specialty steels. Our products are sold to rerollers, forgers, service centers, original equipment manufacturers and wire redrawers. Our customers further process our products for use in a variety of industries, including the aerospace, power generation, petrochemical and heavy equipment manufacturing industries. We also perform conversion services on materials supplied by customers that lack certain of our production capabilities or are subject to their own capacity constraints.
We recognized net income for the year ended December 31, 2011 of $18.1 million, or $2.56 per diluted share, compared with net income of $13.2 million, or $1.93 per diluted share, for 2010.
On August 18, 2011, we acquired substantially all the assets of Patriot Special Metals, Inc. and RSM Real Estate Holding, Inc., consisting of a new specialty steel manufacturing facility located in North Jackson, Ohio (the “North Jackson Facility”). We began forging and finishing operations at the North Jackson Facility in September 2011. In December 2011, we performed our first melts on the facility’s new vacuum induction melting (VIM) furnace and two vacuum arc remelting (VAR) furnaces. We believe the acquisition of the North Jackson Facility will broaden our production capabilities, expand our product range and market penetration, as well as benefit our future operating margins. The aggregate purchase price of the North Jackson Facility was $111.3 million, which was funded with the proceeds of a $40.0 million term note, $40.0 million in borrowings under a new revolving credit facility, $20.0 million in aggregate principal amount of convertible promissory notes issued to the sellers of the North Jackson Facility and the remainder from cash on-hand at the time of the acquisition. At the same time, we entered into an escrow agreement with the sellers, pursuant to which $2.5 million of the purchase price was placed in escrow. The escrow agreement expires on August 18, 2012. We assumed approximately $4.6 million of liabilities, primarily related to approved capital expenditure projects at the North Jackson Facility.
Our net sales increased from $189.4 million in 2010 to a record $252.6 million for the current year. This $63.2 million, or 33%, increase is largely due to increased volume recognized in the current year and favorable product mix. Tons shipped increased by 16% in the current year when compared to the prior year. Our net sales for the current year were also favorably affected by product mix. Our tool steel shipments as a percentage of total shipments decreased from 16% in 2010 to 11% in the current year, while our shipments as a percentage of total shipments for stainless steel and high-strength low alloy steel increased from 74% and 3%, respectively, during 2010 to 76% and 5%, respectively, in the current year. Our stainless steel and high-strength low alloy products have a higher content of nickel and typically have a higher selling price per pound than our tool steel products.
Our cost of products sold increased from $155.7 million in 2010 to $205.1 million in 2011. This $49.4, million or 32% increase is primarily due to the aforementioned 33% increase in net sales. Our consolidated cost of products sold for 2011, includes $907,000 of costs from the start-up of the North Jackson Facility.
Our results for the current year were negatively affected by increased acquisition related expenses and general and administrative start-up costs associated with the North Jackson Facility, which are included within selling and administrative expenses. Selling and administrative expenses increased from $13.3 million in 2010 to $17.8 million in the current year. Increased acquisition related and start-up costs associated with the North Jackson Facility accounted for $2.8 million of this $4.5 million increase.
13
Table of Contents
Interest expense increased from $0.5 million for 2010 to $1.4 million in 2011. This $0.9 million increase is primarily due to the higher debt balance maintained during the last five months of 2011 to finance the North Jackson Facility acquisition. In addition, during 2011 we settled our interest rate swap and wrote-off unamortized deferred financing costs related to our old term loan that was repaid in conjunction with the new financing arrangement entered into to acquire the North Jackson Facility. The write-off of these items in the current year increased interest expense by $0.3 million. We expect that our interest expense will increase from historical levels for the foreseeable future as a result of holding an increased amount of debt.
Our effective tax rate increased to 36.4% for 2011 from 34.0% recorded in 2010. The Tax Relief, Unemployment Insurance Reauthorization, and Job Creation Act, enacted in December 2010, provided for 100% bonus depreciation for qualified investments made during 2011, and 50% bonus depreciation for qualified investments made during 2012. As a result of the North Jackson Facility acquisition and the significant amount of machinery and equipment placed in service in 2011, we will claim the 100% bonus depreciation deduction on such equipment and, as a result, will generate a net operating loss (“NOL”) for the 2011 federal income tax return. As a consequence of generating a NOL, the benefit of the domestic production activities deduction will no longer be available, which is the primary reason for the increase in the effective tax rate. Prior to the acquisition of the North Jackson Facility, we paid federal estimated taxes of $4.5 million for 2011. We have recorded refundable income taxes in the amount of $4.8 million as of December 31, 2011, most of which represents the amount of federal estimated payments for 2011. In February 2012, we received a tax refund of $4.5 million. At December 31, 2011, we had a deferred tax asset of $15.1 million related to NOL carry forwards. We are currently evaluating whether to carry back a portion of this NOL to 2010 to obtain a refund of $5.4 million paid for federal income taxes for the 2010 tax year. If we choose to carry back the NOL to 2010, we would no longer benefit from certain deductions taken in 2010 that reduced our taxable income. These deductions would not be available which would have a negative impact on our 2012 effective tax rate. We expect to finalize the treatment of the NOL by the end of the second quarter of 2012. All remaining federal NOL’s can be carried forward until 2031.
Results of Operations
An analysis of our operations is as follows:
| For the years ended December 31, |
2011 | 2010 | 2009 | |||||||||||||||||||||
| (dollars in thousands; percentages of total net sales) | ||||||||||||||||||||||||
| Amount | % | Amount | % | Amount | % | |||||||||||||||||||
| Net sales: |
||||||||||||||||||||||||
| Stainless steel |
$ | 202,000 | 80.0 | $ | 142,302 | 75.1 | $ | 98,069 | 78.5 | |||||||||||||||
| Tool steel |
21,963 | 8.7 | 26,196 | 13.8 | 9,413 | 7.5 | ||||||||||||||||||
| High-strength low alloy steel |
17,532 | 6.9 | 10,310 | 5.4 | 9,235 | 7.4 | ||||||||||||||||||
| High-temperature alloy steel |
6,809 | 2.7 | 5,853 | 3.1 | 5,567 | 4.5 | ||||||||||||||||||
| Conversion services |
3,905 | 1.5 | 2,719 | 1.5 | 1,203 | 1.0 | ||||||||||||||||||
| Scrap sales and other |
387 | 0.2 | 2,043 | 1.1 | 1,420 | 1.1 | ||||||||||||||||||
|
|
|
|
|
|
|
|
|
|
|
|
|
|||||||||||||
| Total net sales |
252,596 | 100.0 | 189,423 | 100.0 | 124,907 | 100.0 | ||||||||||||||||||
| Cost of products sold |
205,148 | 81.2 | 155,651 | 82.2 | 117,901 | 94.4 | ||||||||||||||||||
| Selling and administrative expenses |
17,761 | 7.0 | 13,349 | 7.0 | 11,663 | 9.3 | ||||||||||||||||||
|
|
|
|
|
|
|
|
|
|
|
|
|
|||||||||||||
| Operating income (loss) |
$ | 29,687 | 11.8 | $ | 20,423 | 10.8 | $ | (4,657 | ) | (3.7 | ) | |||||||||||||
|
|
|
|
|
|
|
|
|
|
|
|
|
|||||||||||||
14
Table of Contents
2011 Results as Compared to 2010
Net sales for 2011 increased $63.2 million as compared to 2010. The increase is largely due to a 16% increase in tonnage shipped, combined with price increases and a change in product mix, which favorably affected our net sales. Shipments of aerospace products, petrochemical products, conversion services and power generation products increased 43.1%, 18.8%, 32.1% and 7.0%, respectively, over 2010. These increases were partially offset by a 21.0% reduction in service center plate shipments in 2011 when compared to 2010.
Net sales by market segment are as follows:
| For the years ended December 31, |
2011 | 2010 | 2009 | |||||||||||||||||||||
| (dollars in thousands; percentages of total net sales) | ||||||||||||||||||||||||
| Amount | % | Amount | % | Amount | % | |||||||||||||||||||
| Net sales: |
||||||||||||||||||||||||
| Service centers |
$ | 131,624 | 52.1 | $ | 88,421 | 46.6 | $ | 50,355 | 40.3 | |||||||||||||||
| Forgers |
48,432 | 19.2 | 41,793 | 22.0 | 39,821 | 31.9 | ||||||||||||||||||
| Rerollers |
47,114 | 18.6 | 36,515 | 19.3 | 12,174 | 9.7 | ||||||||||||||||||
| Original equipment manufacturers |
16,427 | 6.5 | 13,800 | 7.3 | 16,089 | 12.9 | ||||||||||||||||||
| Wire redrawers |
4,707 | 1.9 | 4,132 | 2.2 | 3,845 | 3.1 | ||||||||||||||||||
| Conversion services |
3,905 | 1.5 | 2,719 | 1.5 | 1,203 | 1.0 | ||||||||||||||||||
| Scrap sales and other |
387 | 0.2 | 2,043 | 1.1 | 1,420 | 1.1 | ||||||||||||||||||
|
|
|
|
|
|
|
|
|
|
|
|
|
|||||||||||||
| Total net sales |
$ | 252,596 | 100.0 | $ | 189,423 | 100.0 | $ | 124,907 | 100.0 | |||||||||||||||
|
|
|
|
|
|
|
|
|
|
|
|
|
|||||||||||||
| Tons shipped |
50,164 | 43,373 | 28,182 | |||||||||||||||||||||
|
|
|
|
|
|
|
|||||||||||||||||||
Cost of products sold as a percentage of net sales was 81.2% and 82.2% for 2011 and 2010, respectively. Excluding a favorable $1.0 million inventory adjustment recorded in 2010 for additional metal recovered as a result of a capital project streamlining the scrap loading area, our material cost as a percentage of net sales increased slightly from 42.4% in 2010 to 42.6% in 2011. Our operation costs as a percentage of net sales decreased from 40.3% in 2010 to 38.6% in 2011. The reduction as a percentage of sales is due to operational benefits that we recognized in the current year from process improvement projects. In addition, our current cost of products sold as a percentage of sales benefited from reduced fixed costs as a percentage of sales. A portion of our cost structure is relatively fixed in nature, such as overhead and depreciation costs. These fixed costs combined with significantly higher net sales in 2011, resulted in a lower cost of products sold as a percentage of net sales for 2011.
Selling and administrative expenses increased in 2011 to $17.8 million, or 7.0% of sales, from $13.3 million, or 7.0% of sales, in 2010. The increased cost in 2011 is primarily due to increased acquisition related costs associated with the North Jackson acquisition of $1.9 million, a $937,000 increase in compensation and compensation related costs, which includes North Jackson personnel and $728,000 of additional North Jackson selling and administrative expenses. Our 2010 selling and administrative costs include an additional $647,000 stock option compensation charge as a result of changes in estimated forfeiture rates and to fully expense vested options. Excluding the North Jackson acquisition related costs, the 2010 additional stock compensation charge and North Jackson selling and administrative expenses, our selling and administrative expenses as a percentage of net sales would have decreased from 6.6% for 2010 to 5.9% in 2011.
2010 Results as Compared to 2009
Net sales for the year ended December 31, 2010 increased $64.5 million as compared to 2009. The increase was primarily due to a 54% increase in tonnage shipped as well as price increases realized in 2010. The year over year increase in net sales due to increased shipment volume was $52.7 million. The increase in shipments was attributed to improved economic conditions and market demand which continued to recover throughout 2010 as compared to 2009. During 2009, weaker economic conditions resulted in “destocking” in the service center industry to bring inventory levels in line with significantly lower end-user demand.
15
Table of Contents
Cost of products sold as a percentage of net sales was 82.2% and 94.4% for 2010 and 2009, respectively. The results for 2010 and 2009 include a $1.0 million favorable inventory adjustment in 2010, as described above, and $3.9 million of 2009 unusual charges pertaining to inventory write-downs and restructuring charges stemming from the economic downturn, representing 0.5% and 3.1% of net sales, respectively. Excluding these adjustments, gross margin was 17.3% of sales in 2010 compared to 8.7% for 2009. The improved proportion of cost of sales to sales in 2010 is also attributable to fixed operating costs being spread over higher production volumes as a result of increased product orders.
Selling and administrative expenses increased in 2010 to $13.3 million, or 7.0% of sales, from $11.7 million, or 9.3% of sales, in 2009. The increased cost in 2010 was primarily due to a $2.1 million increase in accrued variable compensation, the $647,000 increase in stock option compensation, as described above, and by a $408,000 increase in salary and benefit expenses in 2010, which were partially offset by $2.1 million of bad debt and inventory write-down charges taken in 2009.
The effective income tax rate in 2010 was 34.0% as compared to a benefit of 27.0% for 2009. The effective income tax rate in 2010 reflects taxable income and benefits from the domestic manufacturing deduction, whereas 2009 reflected a net operating loss, benefits related to a federal loss carry back and state loss carry forwards. We had $2.0 million of state tax carry forwards at December 31, 2010 and $2.2 million at December 31, 2009 that represented New York Empire Zone tax credits with no expiration date and various state net operating loss carry forwards expiring in 2029. We believe we will generate sufficient taxable income to utilize these tax credits and losses.
In 2009, we recorded a $742,000 negative tax adjustment primarily for the reconciliation of tax balances to 2008 federal and state income tax returns. We determined that $370,000 of this adjustment related to prior periods and was not considered material to any prior period or to 2009 that would require the restatement of prior period financial statements. The remaining $172,000 of adjustments consisted of $48,000 relating to 2009 tax provision-to-tax return adjustments to properly report state tax credits, and the remaining $124,000 related to other timing differences, primarily state bonus depreciation adjustments.
Business Segment Results
We are comprised of four operating locations and a corporate headquarters. For segment reporting, the Bridgeville, North Jackson and Titusville facilities have been aggregated into one reportable segment, Universal Stainless & Alloy Products (“USAP”). The USAP manufacturing process involves melting, remelting, treating, forging and hot and cold rolling of semi-finished and finished specialty steels. The manufacturing process at Dunkirk Specialty Steel, our other reportable segment, involves hot rolling and finishing specialty steel bar, rod and wire products.
Management is currently evaluating the impact of the North Jackson Facility acquisition on our externally reported segments in accordance with Accounting Standards Codification (“ASC”) Topic 280, “Segment Reporting”. We have included the results of North Jackson in the USAP segment from the August 18, 2011 acquisition date through December 31, 2011. The North Jackson operating segment was included in the USAP reporting segment as a result of North Jackson having consistent characteristics as identified in ASC Topic 280 with the USAP segment. The USAP segment also includes acquisition related costs.
16
Table of Contents
UNIVERSAL STAINLESS & ALLOY PRODUCTS SEGMENT
An analysis of the segment’s operations is as follows:
| For the years ended December 31, |
2011 | 2010 | 2009 | |||||||||||||||||||||
| (dollars in thousands; percentages of total net sales) | ||||||||||||||||||||||||
| Amount | % | Amount | % | Amount | % | |||||||||||||||||||
| Net sales: |
||||||||||||||||||||||||
| Stainless steel |
$ | 125,936 | 55.9 | $ | 99,092 | 57.2 | $ | 71,670 | 66.2 | |||||||||||||||
| Tool steel |
20,248 | 9.0 | 25,325 | 14.6 | 9,146 | 8.4 | ||||||||||||||||||
| High-strength low alloy steel |
3,026 | 1.3 | 2,091 | 1.2 | 3,017 | 2.8 | ||||||||||||||||||
| High-temperature alloy steel |
2,791 | 1.3 | 2,427 | 1.4 | 1,988 | 1.8 | ||||||||||||||||||
| Conversion services |
2,985 | 1.3 | 2,110 | 1.2 | 763 | 0.7 | ||||||||||||||||||
| Scrap sales and other |
401 | 0.2 | 1,928 | 1.1 | 1,391 | 1.3 | ||||||||||||||||||
|
|
|
|
|
|
|
|
|
|
|
|
|
|||||||||||||
| 155,387 | 69.0 | 132,973 | 76.7 | 87,975 | 81.2 | |||||||||||||||||||
| Intersegment |
69,946 | 31.0 | 40,321 | 23.3 | 20,344 | 18.8 | ||||||||||||||||||
|
|
|
|
|
|
|
|
|
|
|
|
|
|||||||||||||
| Total net sales |
225,333 | 100.0 | 173,294 | 100.0 | 108,319 | 100.0 | ||||||||||||||||||
| Material cost of sales |
116,959 | 51.9 | 85,507 | 49.3 | 49,592 | 45.8 | ||||||||||||||||||
| Operation cost of sales |
76,014 | 33.7 | 61,428 | 35.4 | 52,656 | 48.6 | ||||||||||||||||||
| Selling and administrative expenses |
12,184 | 5.4 | 9,048 | 5.2 | 8,467 | 7.8 | ||||||||||||||||||
|
|
|
|
|
|
|
|
|
|
|
|
|
|||||||||||||
| Operating income (loss) |
$ | 20,176 | 9.0 | $ | 17,311 | 10.0 | $ | (2,396 | ) | (2.2 | ) | |||||||||||||
|
|
|
|
|
|
|
|
|
|
|
|
|
|||||||||||||
Net sales for 2011 increased by $52.0 million, or 30.0%, in comparison to 2010 primarily due to an 18.4% increase in tonnage shipped, base price increases realized in 2011 and product mix. Our intersegment sales as a percent of sales increased from the prior year to the current year to support the increased sales volume recognized by our Dunkirk segment. In addition, our 2011 net sales include $145,000 of external sales from the North Jackson operation, from August 18, 2011 through December 31, 2011. Shipments of aerospace products, petrochemical products, conversion services and power generation products increased 44.3%, 25.2%, 33.9% and 7.0%, respectively, over 2010. These increases were partially offset by a 20.6% reduction in service center plate shipments in 2011 when compared to 2010.
Net sales for 2010 increased by $65.0 million, or 60.0%, in comparison to 2009 primarily due to a 57.5% increase in tonnage shipped, and base price increases realized in 2010. The increase in shipments was attributed to improved economic conditions and market demands which recovered throughout 2010 as compared to 2009. During 2009, weaker economic conditions resulted in ‘destocking’ in the service center industry to bring inventory levels in line with significantly lower end-user demand. A 144% increase in reroller shipments was accompanied by a 111% increase in service center plate shipments, a 23.1% increase in service center long products shipments, and a 10.5% increase in forger shipments. Shipments of service center plate products, petrochemical products, aerospace products and power generation products increased 111%, 70%, 47% and 41%, respectively, over 2009.
Our operating income for 2011 increased by $2.9 million when compared to 2010, however as a percentage of sales operating income decreased from 10.0% in 2010 to 9.0% in 2011. North Jackson acquisition and start-up costs negatively affected our 2011 operating income by $3.5 million when compared to 2010. In addition, our 2010 operating income benefited from the $1.0 million favorable inventory adjustment described above. Excluding the impact of North Jackson on the current year and the inventory adjustment on 2010, our operating income as a percentage of sales, increased to 10.5% in 2011 from 9.4% in the prior year. The improved proportion of operating income to sales in 2011 is largely attributable to fixed operating costs being spread over higher production volumes as a result of increased product orders.
Operating income for 2010 increased by $19.7 million compared to 2009. The 2010 results include the $1.0 million favorable inventory adjustment described above, and $5.0 million of 2009 unusual charges pertaining to inventory write-downs, restructuring and bad debt expenses stemming from the economic slowdown in 2009, representing 0.6% and 4.6% of net sales, respectively. Excluding the impact of the unusual charges, material costs, as a
17
Table of Contents
percentage of sales, increased to 49.9% from 43.7% for the years ended December 31, 2010 and 2009, respectively, as a result of higher material costs in 2010, and operation costs, as a percentage of sales, decreased to 35.4% from 48.0% for the same years, respectively. The improved proportion of cost of sales to sales in 2010 is also attributable to fixed operating costs being spread over higher production volumes as a result of increased product orders.
DUNKIRK SPECIALTY STEEL SEGMENT
An analysis of the segment’s operations is as follows:
| For the years ended December 31, |
2011 | 2010 | 2009 | |||||||||||||||||||||
| (dollars in thousands; percentages of total net sales) | ||||||||||||||||||||||||
| Amount | % | Amount | % | Amount | % | |||||||||||||||||||
| Net sales: |
||||||||||||||||||||||||
| Stainless steel |
$ | 76,064 | 78.1 | $ | 43,211 | 76.3 | $ | 26,399 | 70.9 | |||||||||||||||
| Tool steel |
1,715 | 1.8 | 871 | 1.5 | 267 | 0.7 | ||||||||||||||||||
| High-strength low alloy steel |
14,506 | 14.9 | 8,219 | 14.5 | 6,218 | 16.7 | ||||||||||||||||||
| High-temperature alloy steel |
4,018 | 4.1 | 3,426 | 6.1 | 3,579 | 9.6 | ||||||||||||||||||
| Conversion services |
920 | 0.9 | 609 | 1.1 | 440 | 1.2 | ||||||||||||||||||
| Scrap sales and other |
(14 | ) | - | 114 | 0.2 | 29 | 0.1 | |||||||||||||||||
|
|
|
|
|
|
|
|
|
|
|
|
|
|||||||||||||
| 97,209 | 99.8 | 56,450 | 99.7 | 36,932 | 99.2 | |||||||||||||||||||
| Intersegment |
169 | 0.2 | 150 | 0.3 | 313 | 0.8 | ||||||||||||||||||
|
|
|
|
|
|
|
|
|
|
|
|
|
|||||||||||||
| Total net sales |
97,378 | 100.0 | 56,600 | 100.0 | 37,245 | 100.0 | ||||||||||||||||||
| Material cost of sales |
59,835 | 61.4 | 33,003 | 58.3 | 23,221 | 62.3 | ||||||||||||||||||
| Operation cost of sales |
21,689 | 22.3 | 15,000 | 26.5 | 13,089 | 35.1 | ||||||||||||||||||
| Selling and administrative expenses |
5,577 | 5.7 | 4,301 | 7.6 | 3,196 | 8.6 | ||||||||||||||||||
|
|
|
|
|
|
|
|
|
|
|
|
|
|||||||||||||
| Operating income (loss) |
$ | 10,277 | 10.6 | $ | 4,296 | 7.6 | $ | (2,261 | ) | (6.1 | ) | |||||||||||||
|
|
|
|
|
|
|
|
|
|
|
|
|
|||||||||||||
Net sales for 2011 increased by $40.8 million, or 72.0%, in comparison to 2010 primarily due to a 57.3% increase in tonnage shipped and base price increases realized in 2011. The increase in shipments is largely attributed to improved economic conditions and market demand. Sales to service centers in 2011 comprised 85.4% of external sales and 80.8% of external shipments. Our service center sales increased by $36.9 million over the similar 2010 period. Shipments of aerospace, petrochemical, power generation and general industrial products increased 72.5%, 79.3%, 24.9% and 18.2%, respectively, over 2010.
Net sales for 2010 increased by $19.4 million, or 52.0%, in comparison to 2009 primarily due to a 35% increase in tonnage shipped and base price increases realized in 2010. Shipments of general industrial products, petrochemical products and aerospace products increased 50%, 41% and 22%, respectively, over 2009.
Operating income increased by $6.0 million for 2011 as compared to 2010. Cost of products sold as a percentage of net sales decreased from 84.8% in 2010 to 83.7% in 2011. This improvement is partially attributable to fixed operating costs being spread over higher production volumes, partially offset by an increase in material cost as a percentage of net sales in 2011. The segment’s results also benefited from lower selling and administrative expenses as a percentage of sales in 2011.
Operating income for the year ended December 31, 2010 increased by $6.6 million compared to the similar period in 2009 primarily due to decreases in material cost and fixed costs as a percentage of sales.
Liquidity and Capital Resources
We have financed our operating activities through cash on hand at the beginning of the period, cash provided by operations and cash provided through our credit facilities. Working capital increased $3.9 million to $114.0 million at December 31, 2011 compared to $110.1 million at December 31, 2010. Accounts receivable increased $5.3 million as a result of a 20.5% increase in sales for the three-month period ended December 31, 2011 in comparison to the three-month period ended December 31, 2010. The $15.4 million increase in inventory at
18
Table of Contents
December 31, 2011 compared to December 31, 2010 is due principally to a 26% increase in our work-in-process inventory in response to the rise in our backlog. The backlog increased from $69.3 million at December 31, 2010 to $102.6 million at December 31, 2011, an increase of 48.1%.
We generated cash from operations of $10.7 million, $0.9 million, and $26.7 million in the years ended December 31, 2011, 2010 and 2009, respectively. Cash received from sales of $247.5 million, $177.2 million, and $139.5 million for 2011, 2010 and 2009, respectively; represent the primary source of cash from operations.
An analysis of the primary uses of cash is as follows:
| For the years ended December 31, |
2011 | 2010 | 2009 | |||||||||||||||||||||
| (dollars in thousands; percentages of total uses of cash) |
||||||||||||||||||||||||
| Amount | % | Amount | % | Amount | % | |||||||||||||||||||
| Raw material purchases |
$ | 116,240 | 49.1 | $ | 93,625 | 53.3 | $ | 40,699 | 36.5 | |||||||||||||||
| Employment costs |
46,296 | 19.5 | 32,768 | 18.6 | 27,840 | 25.0 | ||||||||||||||||||
| Utilities |
15,164 | 6.4 | 14,240 | 8.1 | 14,891 | 13.3 | ||||||||||||||||||
| Capital expenditures |
16,790 | 7.1 | 6,903 | 3.9 | 11,415 | 10.2 | ||||||||||||||||||
| Other |
42,305 | 17.9 | 28,340 | 16.1 | 16,725 | 15.0 | ||||||||||||||||||
|
|
|
|
|
|
|
|
|
|
|
|
|
|||||||||||||
| Total uses of cash |
$ | 236,795 | 100.0 | $ | 175,876 | 100.0 | $ | 111,570 | 100.0 | |||||||||||||||
|
|
|
|
|
|
|
|
|
|
|
|
|
|||||||||||||
Cash used for raw material purchases increased in 2011 in comparison to 2010 primarily due to increased production. We continuously monitor market price fluctuations of our key raw materials.
The following table reflects the average market values per pound for key raw materials for selected months during the last three-year period.
| December 2011 |
June 2011 |
December 2010 |
June 2010 |
December 2009 |
June 2009 |
|||||||||||||||||||
| Nickel |
$ | 8.23 | $ | 10.14 | $ | 10.94 | $ | 8.79 | $ | 7.74 | $ | 6.79 | ||||||||||||
| Chrome |
$ | 1.10 | $ | 1.23 | $ | 1.31 | $ | 1.33 | $ | 0.89 | $ | 0.78 | ||||||||||||
| Molybdenum |
$ | 13.42 | $ | 16.09 | $ | 16.17 | $ | 14.73 | $ | 11.47 | $ | 10.34 | ||||||||||||
| Carbon scrap |
$ | 0.21 | $ | 0.22 | $ | 0.19 | $ | 0.20 | $ | 0.15 | $ | 0.10 | ||||||||||||
The market values for these raw materials and others continue to fluctuate based on supply and demand, market disruptions and other factors. We maintain sales price surcharge mechanisms, priced at time of order or shipment, to mitigate the risk of substantial raw material cost fluctuations. There can be no assurance that these sales price adjustments will completely offset our raw material costs.
The average price of nickel was $10.38, $9.89 and $6.65 per pound for 2011, 2010 and 2009, respectively. The average price of chrome was $1.22, $1.26 and $0.82 per pound for 2011, 2010 and 2009, respectively. The average price of molybdenum was $15.48, $15.85 and $11.23 per pound for 2011, 2010 and 2009, respectively. The average price of carbon scrap, which is the most significant ingredient in our grades of steel produced, was $0.21, $0.19 and $0.11 per pound for 2011, 2010 and 2009, respectively.
While the material surcharge mechanism is designed to offset modest fluctuations in raw material prices, it cannot immediately absorb significant spikes in raw material prices. There can be no assurance that the raw material surcharge mechanism will completely offset immediate changes in our raw material costs. A material decline in raw material prices within a short period of time could have a material adverse effect on our financial results.
Cash payments in 2011 for employment costs were $13.5 million higher than 2010 primarily due to increased employee headcount and hours worked as a result of the higher production volumes recognized in 2011. Our employment costs also increased as a result of higher payouts under our profit-sharing plan due to our increased profitability. The increase in employment costs in 2010 when compared to 2009 was primarily due to higher production volumes and higher payouts under our profit-sharing and variable compensation plans.
19
Table of Contents
Utility costs for 2011 increased by approximately 6% when compared to 2010. This increase is due to an increase in electricity and natural gas consumption of 19% and 23%, respectively for the current year when compared to 2010, due to increased production. These consumption increases were offset by reductions in the per unit cost of the utilities.
Other uses of cash, the majority of which is cash for production supplies, plant maintenance, outside conversion services, insurance, taxes and freight, increase or decrease in relation to production volume. Cash spent for maintenance expenses in 2011 increased by $3.3 million in comparison to 2010, following a $2.4 million increase in 2010 in comparison to 2009 in response to increased production levels. Prior to the acquisition of the North Jackson Facility, we paid federal estimated taxes of $4.5 million for 2011. As a result of the acquisition of the North Jackson Facility and the significant amount of machinery and equipment that has been placed in service in 2011, we will claim the 100% bonus depreciation deduction on such equipment and, as a result, will generate a NOL for the 2011 federal income tax return. We have recorded refundable income taxes in the amount of $4.8 million as of December 31, 2011, which mostly represents the amount paid in federal taxes during 2011. In February 2012, we received a tax refund of $4.5 million. At December 31, 2011, we had a deferred tax asset of $15.1 million related to NOL carry forwards. We are currently evaluating whether to carry back a portion of this NOL to 2010 to obtain a refund of the $5.4 million paid for federal income taxes for the 2010 tax year. If we choose to carry back the NOL to 2010, we would no longer benefit from certain deductions taken in 2010 that reduced our taxable income. These deductions would not be available which would have a negative impact on our 2012 effective tax rate. We expect to finalize the treatment of the NOL by the end of the second quarter of 2012. All remaining federal NOL’s can be carried forward until 2031. In 2010, we paid net taxes of $1.8 million.
Capital Expenditures and Investments. Including amounts in current liabilities, we had capital expenditures for the year ended December 31, 2011 of $24.5 million compared with $7.5 million for the same period in 2010. The most significant capital expenditures incurred during the current year relate to the North Jackson facility build-out. Subsequent to the North Jackson acquisition date, we incurred capital expenditures of $14.7 million, largely due to the completion of the VIM and two VAR furnaces. In addition, during 2011 at the Bridgeville facility, we invested in remelt and laboratory upgrades, which collectively were $2.4 million. We had $0.4 million of capital expenditures related to these projects in 2010. The Bridgeville melt shop upgrade accounted for $0.5 million of the 2011 expenditures and $2.6 million of the 2010 expenditures. During the year ended December 31, 2011, our Titusville facility began upgrading the furnace controls and power supplies of its VAR furnaces. We incurred $1.3 million in 2011 related to this project. The remainder of the increase in capital expenditures related to various individually less significant additions at both of our reportable segments. Capital expenditures in 2012 are expected to increase by approximately $25.0 million from historical levels as a result of the approved addition of two VAR furnaces and the completion of equipment at the North Jackson facility.
Capital Resources Including Off-Balance Sheet Arrangements. We do not maintain off-balance sheet arrangements, nor do we participate in non-exchange traded contracts requiring fair value accounting treatment, or material related-party transaction arrangements.
On August 18, 2011, we and our wholly owned subsidiaries entered into a Credit Agreement (the “Credit Agreement”) which provides for a senior secured revolving credit facility in an aggregate principal amount not to exceed $75.0 million (the “Revolver”) and a $40.0 million senior secured term loan facility (the “Term Loan” and together with the Revolver, (the “Facilities”). PNC Bank, National Association (“PNC”) serves as Administrative Agent with respect to the Facilities. The Facilities, which expire in August 2016, are collateralized by substantially all of the assets of the Company and its subsidiaries, except that no real property other than the North Jackson Facility is collateral under the Facilities. Universal Stainless & Alloy Products, Inc., Dunkirk Specialty Steel, LLC and North Jackson Specialty Steel, LLC are co-borrowers under the Facilities. The co-borrowers’ obligations under the Facilities have been guaranteed by USAP Holdings, Inc.
Availability under the Revolver is based on eligible accounts receivable and inventory, less outstanding letters of credit issued under the Revolver, which may not exceed $10.0 million at any given time. At December 31, 2011, we had borrowing capacity under the Revolver of $70.5 million. At any time prior to August 18, 2015, we may make up to two requests to increase the maximum aggregate principal amount of borrowings under the Revolver
20
Table of Contents
by at least $10.0 million, with the maximum aggregate principal amount of borrowings under the Revolver not to exceed $100.0 million in any event. We are required to pay a commitment fee based on the daily unused portion of the Revolver. At December 31, 2011, the commitment fee under the Revolver was 0.375%. The Revolver also provides for up to $7.0 million of swing loans so long as the sum of the outstanding swing loans and the outstanding borrowings under the Revolver does not exceed the aggregate borrowing capacity under the Revolver at any given time. The Term Loan is payable in quarterly installments in the principal amount of $1.5 million beginning on July 1, 2012, with the balance of the Term Loan payable in full on August 18, 2016.
Amounts outstanding under the Facilities other than swing loans under the Revolver, at our option, will bear interest at either a base rate (the “Base Rate Option”) or a LIBOR-based rate (the “LIBOR Option”), in either case calculated in accordance with the terms of the Credit Agreement. We elected to use the LIBOR Option during the period from the entrance into the Credit Agreement through December 31, 2011, which was 2.51% at December 31, 2011. Interest on swing loans under the Revolver is calculated using the Base Rate Option, which was 4.50% at December 31, 2011. Interest on the Facilities is payable monthly. Interest on the swing loans is payable quarterly.
The Credit Agreement requires that we maintain a leverage ratio not less than a ratio decreasing from 3.25 to 1.00 to 2.50 to 1.00 during the term of the Facilities and a fixed charge coverage ratio of not less than 1.20 to 1.00. At December 31, 2011, we were obligated to maintain a leverage ratio of not less than 3.25 to 1.00. We were in compliance with all covenants contained in the Credit Agreement at December 31, 2011.
As a result of our entrance into the Credit Agreement, we recorded deferred finance costs of $1.4 million in the consolidated balance sheet as a component of other long-term assets as of December 31, 2011. These costs are being amortized to interest expense over the life of the Credit Agreement.
In connection with the acquisition of the North Jackson Facility on August 18, 2011, we issued $20.0 million in convertible notes (the “Notes”) to the sellers of the North Jackson Facility as partial consideration of the acquisition. The Notes are subordinated obligations and rank junior to the Facilities. The Notes bear interest at a fixed rate of 4.0% per annum, payable in cash semi-annually in arrears on each June 18 and December 18, beginning on December 18, 2011. Unless earlier converted, the Notes mature and the unpaid principal balance is due on August 17, 2017. The Notes and any accrued and unpaid interest are convertible into shares of our Common Stock at the option of the holder at an initial conversion price of $47.1675 per share of Common Stock. The conversion price associated with the Notes may be adjusted in certain circumstances. We may prepay any outstanding Notes, in whole or in part, after August 17, 2014 during a fiscal quarter if our share price is greater than 140% of the current conversion price for at least 20 of the trading days in the 30 consecutive trading day period ending on the last trading day of the immediately preceding quarter. We evaluated the conversion feature of the Notes and determined that no beneficial conversion feature existed.
We expect to meet all of our short-term liquidity requirements resulting from operations and current capital investment plans with internally generated funds and borrowings under the Revolver. At December 31, 2011, we had $35.9 million in availability under the Revolver.
Prior to our entrance into the Credit Agreement, we had a credit agreement with PNC which provided for an unsecured $12.0 million term loan (“Old Term Loan”) and an unsecured $15.0 million revolving credit facility. We used a portion of our cash balance prior to the acquisition of the North Jackson Facility to repay the Old Term Loan during the year ended December 31, 2011. There were no borrowings on this revolving credit facility and it was extinguished with our entrance into the Credit Agreement. During the year ended December 31, 2011, we also repaid all of our governmental debt obligations in the amount of $0.6 million.
We had an interest rate swap with PNC to convert the LIBOR floating rate under the Old Term Loan to a fixed interest rate for the life of the loan. Under the agreement, our interest rate was fixed at 4.515%. The effective portion of the change in the fair value of the interest rate swap was recorded net of tax in accumulated other
21
Table of Contents
comprehensive loss (within stockholders’ equity) prior to extinguishing the Old Term Loan. We recorded a charge of $0.3 million during the year ended December 31, 2011 as a component of interest expense and other financing costs on the consolidated statement of operations to terminate the interest rate swap.
Share-Based Financing Activity. We issued 36,051, 50,415 and 40,820 shares of our Common Stock during the years ended December 31, 2011, 2010 and 2009, respectively, through our two share-based compensation plans. In 2011, 27,500 stock options issued under the Stock Incentive Plan were exercised for $375,000 plus related tax benefits of $172,000. In 2010, 40,550 stock options issued under the Stock Incentive Plan were exercised for $466,000 plus related tax benefits of $143,000. In 2009, 32,000 stock options were issued for $253,000 plus related tax benefits of $86,000. The remaining shares were issued to participants of the Employee Stock Purchase Plan.
In October 1998, we initiated a stock repurchase program to repurchase up to 315,000 shares of the Company’s outstanding Common Stock in open market transactions at market prices. We have not repurchased any shares under the program since 2001. We are authorized to repurchase 45,100 remaining shares of Common Stock under this program as of December 31, 2011.
Contractual Obligations. At December 31, 2011, we had the following contractual principal, interest and purchase obligations:
| Payments due by period | ||||||||||||||||||||
| Less than | 1-3 | 3-5 | More than | |||||||||||||||||
| (dollars in thousands) | Total | 1 year | years | years | 5 years | |||||||||||||||
| Long-term debt (A) |
$ | 107,026 | $ | 5,751 | $ | 17,069 | $ | 63,702 | $ | 20,504 | ||||||||||
| Purchase obligations - capital expenditures (B) |
14,521 | 14,521 | - | - | - | |||||||||||||||
| Purchase obligations - other (B) |
9,968 | 9,968 | - | - | - | |||||||||||||||
|
|
|
|
|
|
|
|
|
|
|
|||||||||||
| Total contractual obligations |
$ | 131,515 | $ | 30,240 | $ | 17,069 | $ | 63,702 | $ | 20,504 | ||||||||||
|
|
|
|
|
|
|
|
|
|
|
|||||||||||
| (A) | Amounts include interest expense, which was estimated based upon the December 31, 2011 interest rate for our debt and assumes that debt will not be repaid until its maturity. |
| (B) | Purchase obligations include the value of all open purchase orders with established quantities and purchase prices as well as minimum purchase commitments. |
Import Protections. The CDSOA provides for payment of import duties collected by the U.S. Treasury Department to domestic companies injured by unfair foreign trade practices. In accordance with the CDSOA, which expired September 30, 2007, we filed claims to receive our appropriate share of the import duties collected and received a net payment of $115,000 in 2011. Future benefits are dependent on the amount of undistributed import duties collected as of September 30, 2007 and the relationship of Dunkirk Specialty Steel’s claim in relation to claims filed by other domestic specialty steel producers. We expect minimal distributions in the future.
EFFECTS OF INFLATION
Despite modest inflation in recent years, rising costs, in particular increasing wage and benefit rates, continue to affect operations. We strive to mitigate the effects of inflation through cost containment, productivity improvements and sales price increases.
CONTINGENT ITEMS
Product Claims. We are subject to various claims and legal actions that arise in the normal course of conducting business. There were no material product claims outstanding at December 31, 2011.
Environmental Matters. We, as well as other steel companies, are subject to demanding environmental standards imposed by federal, state and local environmental laws and regulations. We are not aware of any environmental condition that currently exists at any of our facilities that are probable or reasonably possible of having a material impact on our results of operations or liquidity.
22
Table of Contents
We are aware of energy usage concerns relating to climate change; however, we are not aware of any pending regulations that are expected to have a material impact on our results of operations or liquidity.
Legal Matters. From time to time, various lawsuits and claims have been or may be asserted against us relating to the conduct of our business, including routine litigation relating to commercial and employment matters. The ultimate cost and outcome of any litigation or claim cannot be predicted with certainty. Management believes, based on information presently available, that the likelihood that the ultimate outcome of any such pending matter will have a material adverse effect on its financial condition, or liquidity or a material impact to our results of operations is remote, although the resolution of one or more of these matters may have a material adverse effect on its results of operations for the period in which the resolution occurs.
CRITICAL ACCOUNTING POLICIES AND NEW ACCOUNTING PRONOUNCEMENTS
Critical Accounting Policies
Revenue from the sale of products is recognized when both risk of loss and title have transferred to the customer, which in most cases coincides with shipment of the related products, and collection is reasonably assured. We manufacture specialty steel products to customer purchase order specifications and in recognition of requirements for product acceptance. Material certification forms are executed, indicating compliance with the customer purchase orders, before the specialty steel products are packed and shipped to the customer.
Revenue from conversion services is recognized when the performance of the service is complete. Invoiced shipping and handling costs are also accounted for as revenue. Customer claims, which are not material, are accounted for primarily as a reduction to gross sales after the matter has been researched and an acceptable resolution has been reached.
In addition, management constantly monitors the ability to collect its unpaid sales invoices and the valuation of its receivables. The allowance for doubtful accounts includes specific reserves for the value of outstanding invoices issued to customers currently operating under the protection of the federal bankruptcy law and other amounts that are deemed potentially not collectible.
Inventories are stated at the lower of cost or market. The cost of inventory is principally determined by the average cost method for material costs and operation costs. An inventory reserve is provided for material on hand for which management believes cost exceeds net realizable value and for material on hand for more than one year not assigned to a specific customer order.
Long-lived assets, including property, plant and equipment and identifiable intangible assets are evaluated for impairment whenever events or changes in circumstances indicate that the carrying amount of an asset may not be recoverable in relation to the operating performance and future undiscounted cash flows of the underlying assets. Adjustments are made if the sum of expected future cash flows is less than book value. Based on management’s assessment of the carrying values of long-lived assets, no impairment reserve was deemed necessary as of December 31, 2011, 2010 and 2009.
Deferred income taxes are provided for temporary differences between amounts of assets and liabilities for financial reporting purposes and the basis of such assets and liabilities as measured by tax laws and regulations.
Our deferred tax assets include NOL carry forwards that can be used to offset taxable income in future periods and reduce income taxes payable in those future periods. These deferred tax assets will expire, if unused, at various times through 2031.
Management assesses the need to record a valuation allowance to reduce deferred tax assets to the amount that is more likely than not to be realized. We believe we will generate sufficient taxable income to utilize the deferred tax assets recorded at December 31, 2011.
23
Table of Contents
Identifiable intangible assets are recorded at original fair value and are amortized over their useful lives using the straight-line method.
Goodwill, which represents the excess of cost over net tangible and identifiable intangible assets of acquired businesses, is stated at cost. Goodwill is not amortized, but is be tested annually for impairment or more frequently if any event indicates that the carrying amount of goodwill may be impaired.
In accordance with ASU 2011-08, we qualitatively evaluated the goodwill balance at October 1, 2011, and determined that it was more likely than not that the fair value of the reporting unit with a goodwill balance exceeded the carrying value. As such, there has been no impairment of goodwill in 2011.
The calculation for our share-based compensation expense involves a number of assumptions. Management believes each assumption used in the valuation is reasonable because it takes into account the experience of the plan and reasonable expectations. Management estimates volatility and forfeitures based on historical data, future expectations and the expected term of the share-based compensation awards. The assumptions, however, involve inherent uncertainties. As a result, if other assumptions had been used, share-based compensation expense could have varied.
We did not hold any derivative instruments at December 31, 2011. In 2009, we entered into an interest rate swap that effectively converted the floating-rate Old Term Loan into a fixed-rate debt instrument. Also, in 2009, we entered into nickel futures contracts, the last of which matured March 31, 2010, to minimize the price change impact of anticipated purchases of nickel over the life of a customer short-term supply agreement. The interest rate swap was extinguished in 2011. The interest rate swap and nickel futures contracts qualified as cash flow hedges and were marked-to-market at each reporting period date prior to their extinguishment with unrealized gains and losses included in other comprehensive income (loss) to the extent effective, and reclassified to interest expense or cost of sales in the period during which the hedged transaction affected earnings.
New Accounting Pronouncements
See information under the heading “Note 1: Significant Accounting Policies” within “Notes to Consolidated Financial Statements” in Item 8, Financial Statements and Supplementary Data, in this Annual Report on Form 10-K for details of recently issued accounting pronouncements and their expected impact on our financial statements.
FUTURE OUTLOOK
We entered 2012 with a total backlog of approximately $102.6 million, which is 48.0% higher than the $69.3 million backlog at the beginning of 2011. The increase is primarily due to stronger end-market demand within each of our end markets. End-market demand is expected to gradually increase from current levels during 2012. We expect that orders for our products will improve in 2012 as demand increases. Our ability to make scheduled payments of principal, or to pay the interest on or to refinance our indebtedness, or to fund planned capital expenditures will depend on our future performance, which, to a certain extent, is subject to general economic, financial, competitive, legislative, regulatory and other factors that are beyond our control. Based upon the current level of operations and our current expectations for future periods in light of the current economic environment, we believe that cash flow from operations and available cash, together with available borrowings under our Revolver, will be adequate to meet the future liquidity needs during 2012.
FORWARD-LOOKING INFORMATION SAFE HARBOR
The Management’s Discussion and Analysis and other sections of this Annual Report on Form 10-K contain forward-looking statements that reflect the Company’s current views with respect to future events and financial performance. Statements looking forward in time, including statements regarding future growth, cost savings, expanded production capacity, broader product lines, greater capacity to meet customer quality reliability, price
24
Table of Contents
and delivery needs, enhanced competitive posture, effect of new accounting pronouncements and no material financial impact from litigation or contingencies are included in this Annual Report on Form 10-K pursuant to the “safe harbor” provision of the Private Securities Litigation Reform Act of 1995.
The Company’s actual results will be affected by a wide range of factors, including those items described in Item 1A, Risk Factors. Many of these factors are not within the Company’s control and involve known and unknown risks and uncertainties that may cause the Company’s actual results in future periods to be materially different from any future performance suggested herein. Any unfavorable change in the foregoing or other factors could have a material adverse effect on the Company’s business, financial condition and results of operations. Further, the Company operates in an industry sector where securities values may be volatile and may be influenced by economic and other factors beyond the Company’s control.
| ITEM 7A. | QUANTITATIVE AND QUALITATIVE DISCLOSURES ABOUT MARKET RISK |
The Company’s customers and suppliers absorb fluctuations in foreign currency exchange rates. Prices for the Company’s raw materials and natural gas requirements are subject to frequent market fluctuations, and profit margins may decline in the event market prices increase. Selling price increases and surcharges are implemented to offset raw material and natural gas market price increases.
The cost of raw materials represented 52% of the Company’s total cost of products sold in 2011 due to producing products with a higher grade of nickel content compared with approximately 51% of the total cost of products sold in 2010. Raw material prices vary based on numerous factors, including quality, and are subject to frequent market fluctuations. Future raw material prices cannot be predicted with any degree of certainty. The Company does not maintain any long-term agreements with any of its raw material suppliers.
The Company has implemented a sales price surcharge mechanism on its products to help offset the impact of raw material price fluctuations. For substantially all stainless semi-finished products, the surcharge is calculated at the time of order entry, based on current raw material prices or prices at the time of shipment. For substantially all finished products, the surcharge is calculated based on the monthly average raw material prices two months prior to the promised ship date. While the material surcharge mechanism is designed to offset modest fluctuations in raw material prices, it cannot immediately absorb significant spikes in raw material prices. A material change in raw material prices within a short period of time could have a material effect on the financial results of the Company and there can be no assurance that the raw material surcharge mechanism will completely offset immediate changes in the Company’s raw material costs.
At December 31, 2011, the Company had $74.7 million of floating rate debt outstanding with interest rates ranging from 2.51% to 4.5%. Since the interest rate on floating rate debt changes with the short-term market rate of interest, the Company is exposed to the risk that these interest rates may increase, raising its interest expense. A hypothetical 1.0% increase or decrease in the Company’s floating rate debt would unfavorable or favorably impact its pre-tax results by $747,000.
25
Table of Contents
| ITEM 8. | FINANCIAL STATEMENTS AND SUPPLEMENTARY DATA |
| Page | ||||
| Management’s Report on Internal Control over Financial Reporting |
26 | |||
| 27 | ||||
| Financial Statements |
||||
| Consolidated Statements of Operations for the years ended December 31, 2011, 2010 and 2009 |
28 | |||
| 28 | ||||
| 29 | ||||
| Consolidated Statements of Cash Flows for the years ended December 31, 2011, 2010 and 2009 |
30 | |||
| 31 | ||||
| Consolidated Financial Statement Schedules |
||||
| 52 | ||||
MANAGEMENT’S REPORT ON INTERNAL CONTROL OVER FINANCIAL REPORTING
Management is responsible for establishing and maintaining adequate internal control over financial reporting (as defined in Rules 13a-15(f) under the Securities Exchange Act of 1934). Our internal control over financial reporting is designed to provide reasonable assurance to management and the board of directors regarding the preparation and fair presentation of published financial statements. Because of its inherent limitations, internal control over financial reporting may not prevent or detect misstatements. Therefore, even those systems determined to be effective can provide only reasonable assurance with respect to financial statement preparation and presentation. Based on our assessment, we believe that, as of December 31, 2011, our internal control over financial reporting is effective.
The effectiveness of internal control over financial reporting as of December 31, 2011 has been audited by Schneider Downs & Co. Inc., an independent registered public accounting firm which also audited our consolidated financial statements. Schneider Downs’ attestation report on the consolidated financial statements and management’s maintenance of effective internal control over financial reporting is included under the heading “Report of Independent Registered Public Accounting Firm.”
| /s/ Dennis M. Oates | /s/ Douglas M. McSorley | |||
| Dennis M. Oates | Douglas M. McSorley | |||
| Chairman, President and Chief Executive Officer | Vice President of Finance, Chief Financial Officer and Treasurer |
26
Table of Contents
REPORT OF INDEPENDENT REGISTERED PUBLIC ACCOUNTING FIRM
To the Board of Directors and Stockholders of Universal Stainless & Alloy Products, Inc.
We have audited the accompanying consolidated balance sheets of Universal Stainless & Alloy Products, Inc. and subsidiaries (the Company) as of December 31, 2011 and 2010, and the related consolidated statements of operations, comprehensive income (loss) and cash flows for each of the years in the three-year period ended December 31, 2011. In addition, our audit included the financial statement schedule listed in the index at Item 15 (2) (Schedule II). We also have audited the Company’s internal control over financial reporting as of December 31, 2011, based on criteria established in Internal Control - Integrated Framework issued by the Committee of Sponsoring Organizations of the Treadway Commission (COSO). The Company’s management is responsible for these consolidated financial statements and financial statement schedule, for maintaining effective internal control over financial reporting, and for its assessment of the effectiveness of internal control over financial reporting, included in the accompanying Management’s Report on Internal Control Over Financial Reporting. Our responsibility is to express an opinion on these consolidated financial statements, the consolidated financial statement Schedule II, and the Company’s internal control over financial reporting based on our audits.
We conducted our audits in accordance with the standards of the Public Company Accounting Oversight Board (United States). Those standards require that we plan and perform the audits to obtain reasonable assurance about whether the financial statements are free of material misstatement and whether effective internal control over financial reporting was maintained in all material respects. Our audits of the financial statements included examining, on a test basis, evidence supporting the amounts and disclosures in the financial statements, assessing the accounting principles used and significant estimates made by management, and evaluating the overall financial statement presentation. Our audit of internal control over financial reporting included obtaining an understanding of internal control over financial reporting, assessing the risk that a material weakness exists, and testing and evaluating the design and operating effectiveness of internal control based on the assessed risk. Our audits also included performing such other procedures as we considered necessary in the circumstances. We believe that our audits provide a reasonable basis for our opinions.
A company’s internal control over financial reporting is a process designed to provide reasonable assurance regarding the reliability of financial reporting and the preparation of financial statements for external purposes in accordance with generally accepted accounting principles. A company’s internal control over financial reporting includes those policies and procedures that (1) pertain to the maintenance of records that, in reasonable detail, accurately and fairly reflect the transactions and dispositions of the assets of the company; (2) provide reasonable assurance that transactions are recorded as necessary to permit preparation of financial statements in accordance with generally accepted accounting principles, and that receipts and expenditures of the company are being made only in accordance with authorizations of management and directors of the company; and (3) provide reasonable assurance regarding prevention or timely detection of unauthorized acquisition, use, or disposition of the company’s assets that could have a material effect on the financial statements.
Because of its inherent limitations, internal control over financial reporting may not prevent or detect misstatements. Also, projections of any evaluation of effectiveness to future periods are subject to the risk that controls may become inadequate because of changes in conditions, or that the degree of compliance with the policies or procedures may deteriorate.
In our opinion, the consolidated financial statements referred to above present fairly, in all material respects, the financial position of the Company as of December 31, 2011 and 2010, and the results of its operations, comprehensive income (loss) and its cash flows for each of the years in the three-year period ended December 31, 2011, in conformity with accounting principles generally accepted in the United States of America. Also, in our opinion, the related financial statement schedule, when considered in relation to the consolidated financial statements as a whole, presents fairly in all material respects, the information set forth therein. Also, in our opinion, the Company maintained, in all material respects, effective internal control over financial reporting as of December 31, 2011, based on criteria established in Internal Control - Integrated Framework issued by the Committee of Sponsoring Organizations of the Treadway Commission (COSO).
| /s/ Schneider Downs & Co., Inc. |
| Schneider Downs & Co., Inc. |
| Pittsburgh, Pennsylvania |
| March 6, 2012 |
27
Table of Contents
UNIVERSAL STAINLESS & ALLOY PRODUCTS, INC.
CONSOLIDATED STATEMENTS OF OPERATIONS
| For the years ended December 31, | 2011 | 2010 | 2009 | |||||||||
|
|
||||||||||||
| (dollars in thousands, except per share information) |
||||||||||||
| Net sales |
$ | 252,596 | $ | 189,423 | $ | 124,907 | ||||||
| Cost of products sold |
205,148 | 155,651 | 117,901 | |||||||||
| Selling and administrative expenses |
17,761 | 13,349 | 11,663 | |||||||||
|
|
|
|
|
|
|
|||||||
| Operating income (loss) |
29,687 | 20,423 | (4,657 | ) | ||||||||
| Interest expense and other financing costs |
(1,421 | ) | (452 | ) | (89 | ) | ||||||
| Other income, net |
212 | 92 | 695 | |||||||||
|
|
|
|
|
|
|
|||||||
| Income (loss) before income tax expense |
28,478 | 20,063 | (4,051 | ) | ||||||||
| Provision (benefit) for income taxes |
10,356 | 6,821 | (1,093 | ) | ||||||||
|
|
|
|
|
|
|
|||||||
| Net income (loss) |
$ | 18,122 | $ | 13,242 | $ | (2,958 | ) | |||||
|
|
|
|
|
|
|
|||||||
| Net income (loss) per common share – Basic |
$ | 2.65 | $ | 1.95 | $ | (0.44 | ) | |||||
|
|
|
|
|
|
|
|||||||
| Net income (loss) per common share – Diluted |
$ | 2.56 | $ | 1.93 | $ | (0.44 | ) | |||||
|
|
|
|
|
|
|
|||||||
| Weighted average shares of Common Stock outstanding: |
||||||||||||
| Basic |
6,826,490 | 6,782,576 | 6,755,560 | |||||||||
| Diluted |
7,138,824 | 6,868,255 | 6,755,560 | |||||||||
CONSOLIDATED STATEMENTS OF COMPREHENSIVE INCOME (LOSS)
| For the years ended December 31, | 2011 | 2010 | 2009 | |||||||||
|
|
||||||||||||
| (dollars in thousands) |
||||||||||||
| Net income (loss) |
$ | 18,122 | $ | 13,242 | $ | (2,958 | ) | |||||
| Other comprehensive income (loss), net of tax: |
||||||||||||
| Unrealized gain (loss) on interest rate swap, net of tax |
182 | (90 | ) | (92 | ) | |||||||
| Unrealized gain (loss) on nickel hedge contracts, net of tax |
- | (60 | ) | 60 | ||||||||
|
|
|
|
|
|
|
|||||||
| Other comprehensive income (loss), net of tax |
182 | (150 | ) | (32 | ) | |||||||
|
|
|
|
|
|
|
|||||||
| Comprehensive income (loss) |
$ | 18,304 | $ | 13,092 | $ | (2,990 | ) | |||||
|
|
|
|
|
|
|
|||||||
The accompanying notes are an integral part of these consolidated financial statements.
28
Table of Contents
UNIVERSAL STAINLESS & ALLOY PRODUCTS, INC.
CONSOLIDATED BALANCE SHEETS
| December 31,
|
2011
|
2010
|
||||||
| (dollars in thousands) |
||||||||
| ASSETS |
||||||||
| Current assets: |
||||||||
| Cash |
$ | 274 | $ | 34,400 | ||||
| Accounts receivable (less allowance for doubtful accounts of $1,952 and $2,134, respectively) |
34,554 | 29,273 | ||||||
| Inventory, net |
85,088 | 69,710 | ||||||
| Deferred income taxes |
28,438 | 4,202 | ||||||
| Refundable income taxes |
4,844 | 137 | ||||||
| Other current assets |
2,198 | 1,198 | ||||||
|
|
|
|
|
|||||
| Total current assets |
155,396 | 138,920 | ||||||
| Property, plant and equipment, net |
183,148 | 71,581 | ||||||
| Goodwill |
20,479 | - | ||||||
| Other long-term assets |
2,649 | 100 | ||||||
|
|
|
|
|
|||||
| Total assets |
$ | 361,672 | $ | 210,601 | ||||
|
|
|
|
|
|||||
| LIABILITIES AND STOCKHOLDERS’ EQUITY |
||||||||
| Current liabilities: |
||||||||
| Accounts payable |
$ | 29,912 | $ | 20,022 | ||||
| Accrued employment costs |
7,547 | 5,488 | ||||||
| Current portion of long-term debt |
3,000 | 2,833 | ||||||
| Other current liabilities |
966 | 481 | ||||||
|
|
|
|
|
|||||
| Total current liabilities |
41,425 | 28,824 | ||||||
| Long-term debt |
91,650 | 7,990 | ||||||
| Deferred income taxes |
48,291 | 13,877 | ||||||
| Other long-term liabilities |
- | 287 | ||||||
|
|
|
|
|
|||||
| Total liabilities |
181,366 | 50,978 | ||||||
| Commitments and contingencies (Note 13) |
||||||||
| Stockholders’ equity: |
||||||||
| Senior Preferred Stock, par value $0.001 per share; 1,980,000 shares authorized; 0 shares issued and outstanding |
- | - | ||||||
| Common Stock, par value $0.001 per share; 10,000,000 shares authorized; 7,130,365 and 7,094,314 shares issued, respectively |
7 | 7 | ||||||
| Additional paid-in capital |
43,720 | 41,341 | ||||||
| Retained earnings |
138,498 | 120,376 | ||||||
| Treasury Stock at cost; 282,850 common shares held |
(1,919 | ) | (1,919 | ) | ||||
| Accumulated other comprehensive loss |
- | (182 | ) | |||||
|
|
|
|
|
|||||
| Total stockholders’ equity |
180,306 | 159,623 | ||||||
|
|
|
|
|
|||||
| Total liabilities and stockholders’ equity |
$ | 361,672 | $ | 210,601 | ||||
|
|
|
|
|
|||||
The accompanying notes are an integral part of these consolidated financial statements.
29
Table of Contents
UNIVERSAL STAINLESS & ALLOY PRODUCTS, INC.
CONSOLIDATED STATEMENTS OF CASH FLOWS
| For the years ended December 31,
|
2011
|
2010
|
2009
|
|||||||||
| (dollars in thousands) |
||||||||||||
| Operating Activities: |
||||||||||||
| Net income (loss) |
$ | 18,122 | $ | 13,242 | $ | (2,958 | ) | |||||
| Adjustments to reconcile net income (loss) to net cash provided by operating activities: |
||||||||||||
| Depreciation and amortization |
7,271 | 5,486 | 4,859 | |||||||||
| Loss (gain) on sale of property, plant and equipment |
(20 | ) | 17 | 84 | ||||||||
| Deferred income tax |
10,072 | 730 | 1,853 | |||||||||
| Share-based compensation expense, net |
1,408 | 1,676 | 972 | |||||||||
| Changes in assets and liabilities: |
||||||||||||
| Accounts receivable, net |
(5,281 | ) | (12,245 | ) | 16,029 | |||||||
| Inventory, net |
(15,378 | ) | (28,388 | ) | 21,900 | |||||||
| Accounts payable |
(5 | ) | 11,661 | (12,546 | ) | |||||||
| Accrued employment costs |
2,057 | 4,310 | (2,617 | ) | ||||||||
| Income taxes |
(4,672 | ) | 4,175 | (1,613 | ) | |||||||
| Other, net |
(2,887 | ) | 243 | 764 | ||||||||
|
|
|
|
|
|
|
|||||||
| Net cash provided by operating activities |
10,687 | 907 | 26,727 | |||||||||
| Investing Activities: |
||||||||||||
| Business acquisition, net of convertible notes assumed |
(91,298 | ) | - | - | ||||||||
| Capital expenditures, net of amount included in current liabilities |
(16,790 | ) | (6,903 | ) | (11,415 | ) | ||||||
| Proceeds from sale of property, plant and equipment |
20 | 18 | 60 | |||||||||
|
|
|
|
|
|
|
|||||||
| Net cash used in investing activities |
(108,068 | ) | (6,885 | ) | (11,355 | ) | ||||||
| Financing Activities: |
||||||||||||
| Borrowings under term loan facility |
40,000 | - | 12,000 | |||||||||
| Borrowings under revolving credit facility |
65,925 | - | - | |||||||||
| Payments on revolving credit facility |
(31,275 | ) | - | - | ||||||||
| Debt repayments |
(10,823 | ) | (2,223 | ) | (403 | ) | ||||||
| Proceeds from the issuance of Common Stock |
627 | 603 | 372 | |||||||||
| Payment of deferred financing costs |
(1,371 | ) | - | (84 | ) | |||||||
| Tax benefit from share-based payment arrangements |
172 | 143 | 86 | |||||||||
| State grant funding the purchase of new equipment |
- | 500 | - | |||||||||
| Purchase of Treasury Stock |
- | (260 | ) | - | ||||||||
|
|
|
|
|
|
|
|||||||
| Net cash provided by (used in) financing activities |
63,255 | (1,237 | ) | 11,971 | ||||||||
|
|
|
|
|
|
|
|||||||
| Net increase (decrease) in cash |
(34,126 | ) | (7,215 | ) | 27,343 | |||||||
| Cash at beginning of period |
34,400 | 41,615 | 14,272 | |||||||||
|
|
|
|
|
|
|
|||||||
| Cash at end of period |
$ | 274 | $ | 34,400 | $ | 41,615 | ||||||
|
|
|
|
|
|
|
|||||||
| Supplemental Non-Cash Investing and Financing Activities: |
||||||||||||
| Convertible notes issued as acquisition consideration |
$ | 20,000 | $ | - | $ | - | ||||||
| Capital expenditures included in current liabilities |
$ | 7,690 | $ | 578 | $ | 979 | ||||||
| Supplemental Disclosure of Cash Flow Information: |
||||||||||||
| Interest paid, net of amount capitalized |
$ | 1,334 | $ | 446 | $ | 65 | ||||||
| Income taxes paid (refunded), net |
$ | 4,782 | $ | 1,774 | $ | (1,368 | ) | |||||
The accompanying notes are an integral part of these consolidated financial statements.
30
Table of Contents
UNIVERSAL STAINLESS & ALLOY PRODUCTS, INC.
NOTES TO CONSOLIDATED FINANCIAL STATEMENTS
Note 1: Significant Accounting Policies
Basis of Consolidation. The consolidated financial statements include the accounts of Universal Stainless & Alloy Products, Inc. and its wholly-owned subsidiaries (collectively, the “Company”). All intercompany accounts and transactions have been eliminated in consolidation. The Company has no interests in any unconsolidated entity.
Use of Estimates. The preparation of financial statements in conformity with accounting principles generally accepted in the United States of America requires management to make estimates and assumptions that affect the amounts reported in the consolidated financial statements. The estimates and assumptions used in these consolidated financial statements are based on known information available as of the balance sheet date. Actual results could differ from those estimates.
Concentration of Credit Risk. The Company limits its credit risk on accounts receivable by performing ongoing credit evaluations and, when deemed necessary, requiring letters of credit, guarantees or cash collateral. The Company’s largest customers were Carpenter Technology Corporation, which accounted for approximately 12%, 14% and 7% of its net sales for the years ended December 31, 2011, 2010 and 2009, respectively and approximately 13% and 17% of its accounts receivable balance at December 31, 2011 and 2010, respectively, and Fry Steel Company, which accounted for approximately 11%, 8% and 11% of its net sales for the years ended December 31, 2011, 2010 and 2009, respectively and approximately 9% and 4% of its accounts receivable balance at December 31, 2011 and 2010, respectively.
Accounts Receivable and Allowance for Doubtful Accounts. Accounts receivable are presented net of the allowance for doubtful accounts on the consolidated balance sheets. The Company markets its products to a diverse customer base, primarily throughout the United States. The allowance for doubtful accounts includes specific reserves for the value of outstanding invoices issued to customers currently operating under the protection of the federal bankruptcy law and other amounts that are deemed potentially not collectible. The Company reviews historical trends for collectability in determining an estimate for its allowance for doubtful accounts. If economic circumstances change substantially, estimates of the recoverability of amounts due to the Company could be reduced. Receivables are charged-off to the allowance when they are deemed to be uncollectible. Bad debt expense for the years ended December 31, 2011, 2010 and 2009 was ($99,000), $4,000 and $1.8 million, respectively.
Inventories. Inventories are stated at the lower of cost or market with cost principally determined by the weighted average cost method. Such costs include the acquisition cost for raw materials and supplies, direct labor and applied manufacturing overhead within the guidelines of normal plant capacity. The Company changed its method of stating the raw material inventory from the first-in-first-out method to the weighted average cost method in 2010. The Company believes the change was preferable as the average cost method better reflects the current value of the co-mingled raw material inventory and provides a consistent better reflection of periodic income. The change did not have a material impact due to the rapid turn-over rate of the raw material inventory. Provisions are made for slow-moving inventory based upon management’s expected method of disposition. The net change in inventory reserves for the years ended December 31, 2011, 2010 and 2009 was a $148,000 increase, a $166,000 decrease and a $2.0 million decrease, respectively.
Included in inventory are operating materials consisting of production molds and rolls that will normally be consumed within one year.
Property, Plant and Equipment. Property, plant and equipment is recorded at cost. Costs incurred in connection with the construction or major rebuild of facilities, including interest directly related to the project, are capitalized as construction in progress. During the years ended December 31, 2011, and 2010, the Company
31
Table of Contents
capitalized $394,000 and $132,000 respectively, of interest expense related to construction projects in progress. No depreciation is recognized on assets until they are placed in service. Assets which have been retired or disposed of are removed from cost and accumulated depreciation accounts, with the gain or loss reflected in operating income. Material major equipment maintenance costs are capitalized as incurred and amortized to expense over the subsequent six or twelve-month period, depending on the expected benefit that the Company believes it will receive from the major maintenance. Other maintenance costs are expensed as incurred. Costs of improvements and renewals are capitalized. Maintenance expense for the fiscal years 2011, 2010 and 2009 was $15.9 million, $11.9 million and $9.4 million, respectively.
Depreciation is computed using the straight-line method based on the estimated useful lives of the related assets. The estimated useful lives of buildings and land improvements are between 10 and 39 years, and the estimated useful lives of machinery and equipment are between 5 and 20 years. Depreciation expense for the years ended December 31, 2011, 2010 and 2009 was $7.0 million, $5.5 million and $4.8 million, respectively.
Intangible Assets. Identifiable intangible assets are recorded at fair value and are amortized over their useful lives using the straight-line method. The Company allocated $1.3 million of the North Jackson Facility purchase price to an intangible asset related to the non-compete agreement entered into during 2011 with the seller of the North Jackson Facility. The intangible asset is included on the consolidated balance sheet as a component of other long-term assets and will be amortized over the five-year life of the agreement. The Company recognized $100,000 of amortization expense in 2011 from this intangible asset, which is included as a component of selling and administrative expenses on the consolidated statement of operations. Amortization expense for this intangible asset is estimated to be $266,000 for 2012, 2013, 2014 and 2015 and $166,000 for 2016.
Long-Lived Asset Impairment. Long-lived assets, including property, plant and equipment and intangible assets, are evaluated for impairment whenever events or changes in circumstances indicate that the carrying amount of an asset may not be recoverable in relation to the operating performance and future undiscounted cash flows of the underlying assets. Adjustments are made if the sum of expected future cash flows is less than the book value. Based on management’s assessment of the carrying values of long-lived assets, no impairment reserve was deemed necessary as of December 31, 2011, 2010 and 2009.
Deferred Finance Costs. Deferred finance costs are amortized over the life of the related financial instrument using the straight-line method, which approximates the effective interest method. Deferred finance cost amortization for the years ended December 31, 2011, 2010 and 2009 was $153,000, $17,000 and $24,000, respectively, and is included as a component of interest expense and other financing costs on the consolidated statements of operations.
Goodwill. Goodwill, which represents the excess of cost over net tangible and identifiable intangible assets of acquired businesses, is stated at cost. Goodwill is not amortized by the Company, but will be tested annually for impairment or more frequently if any event indicates that the carrying amount of goodwill may be impaired.
In accordance with Accounting Standards Update (“ASU”) 2011-08, the Company has qualitatively evaluated the goodwill balance on October 1, 2011, and determined that it was more likely than not that the fair value of the reporting unit with a goodwill balance exceeded the carrying value. As such, there has been no impairment of goodwill in 2011.
Revenue Recognition. Revenue from the sale of products is recognized when both risk of loss and title have transferred to the customer, which in most cases coincides with shipment of the related products, and collection is reasonably assured. Revenue from conversion services is recognized when the performance of the service is complete. Invoiced shipping and handling costs are also accounted for as revenue. Customer claims, which are not material, are accounted for primarily as a reduction to gross sales after the matter has been researched and an acceptable resolution has been reached.
32
Table of Contents
Income Taxes. Deferred income taxes are provided for unused tax credits earned and the tax effect of temporary differences between the tax basis of assets and liabilities and their reported amounts in the financial statements. The Company uses the liability method to account for income taxes, which requires deferred taxes to be recorded at the statutory rate expected to be in effect when the taxes are paid. Valuation allowances are provided for a deferred tax asset when it is more likely than not that such asset will not be realized. Income tax penalties and interest are included in the provision for income tax expense.
The Company evaluates the tax positions taken or expected to be taken in its tax returns. A tax position should only be recognized in the financial statements if the Company determines that it is more-likely-than-not that the tax position will be sustained upon examination by the tax authorities, based upon the technical merits of the position. For those tax positions that should be recognized, the measurement of a tax position is determined as being the largest amount of benefit that is greater than fifty percent likely of being realized upon ultimate settlement. The Company believes there are no known uncertain tax positions at December 31, 2011, 2010 and 2009.
Share-based Compensation Plans. The Company recognizes compensation expense based on the grant-date fair value of the awards. The fair value of the option grants is estimated on the date of grant using the Black-Scholes option-pricing model, and is recognized ratably over the service/vesting period of the award. The tax effects of exercising stock options are added to additional paid-in capital at the exercise date.
Net Income per Common Share. Net income per common share is computed by dividing net income (loss) by the weighted-average number of common shares outstanding during the period. Diluted net income per common share is computed by dividing net income (loss), adjusted to include interest expense (tax effected) for the convertible notes by the weighted-average number of common shares outstanding plus all dilutive potential common shares outstanding during the period. Dilutive common shares are determined using the treasury stock method. Under the treasury stock method, exercise of options is assumed at the beginning of the period when the average stock price during the period exceeds the exercise price of outstanding options, and common shares are assumed issued. The assumed proceeds from the exercise of stock options are used to purchase Common Stock at the average market price during the period. The incremental shares to be issued are considered to be the dilutive potential common shares outstanding. All shares that were issuable under the Company’s outstanding convertible notes were considered outstanding for the Company’s net income per common share computation, using the “if converted” method of accounting from the date of issuance.
Other Income. Other income is primarily comprised of duties received from the Continued Dumping and Subsidy Offset Act of 2000 (the “CDSOA”), The CDSOA provides for payment of import duties collected by the U.S. Treasury to domestic companies injured by unfair foreign trade practices. In accordance with the CDSOA, which expired in 2007, the Company filed claims to receive its appropriate share of the import duties collected. In 2011, 2010, and 2009 the Company received $115,000, $32,000, and $551,000, respectively, from the U.S. Treasury net of expenses incurred. Future benefits are dependent on the amount of undistributed import duties collected as of September 30, 2007 and the relationship of the Company’s wholly owned subsidiary, Dunkirk Specialty Steel LLC’s claim in relation to claims filed by other domestic specialty steel producers.
Treasury Stock. The Company accounts for Treasury Stock under the cost method and includes such shares as a reduction of total shareholders’ equity.
Financial Instruments. Financial instruments held by the Company include cash, accounts receivable, accounts payable and long-term debt. The carrying value of cash, accounts receivable and accounts payable is considered to be representative of fair value because of the short maturity of these instruments. Refer to Note 7 of the Company’s consolidated financial statements for fair value disclosures of the Company’s financial instruments.
Recent Accounting Pronouncements.
In June 2011, the Financial Accounting Standards Board (“FASB”) issued ASU 2011-05, “Comprehensive Income (Topic 220): Presentation of Comprehensive Income,” which amends current comprehensive income
33
Table of Contents
guidance. This accounting update eliminates the option to present the components of other comprehensive income as part of the statement of shareholders’ equity. Instead, the Company must report comprehensive income in either a single continuous statement of comprehensive income which contains two sections, net income and other comprehensive income, or in two separate but consecutive statements. The Company adopted this guidance during the year ended December 31, 2011. The adoption of this guidance had no material impact on the Company’s consolidated financial statements, as it only required a change in the format of presentation.
In May 2011, the FASB issued ASU 2011-04, ”Fair Value Measurements (Topic 820): Amendments to Achieve Common Fair Value Measurement and Disclosure Requirements in U.S. GAAP and International Financial Reporting Standards (“IFRS”)”. This amendment provides a consistent definition of fair value and ensures that the fair value measurement and disclosure requirements are similar between GAAP and IFRS. The amendment clarifies the application of existing fair value measurements and disclosures, and changes certain principles or requirements for fair value measurements and disclosures. These provisions are effective for reporting periods beginning on or after December 15, 2011. This amendment is not expected to have a material impact on the Company’s consolidated balance sheets, results of operations or cash flows.
In September 2011, the FASB issued ASU 2011-09, “Compensation – Retirement Benefits – Multiemployer Plans (Topic 715)”. This update is intended to provide more information about an employer’s financial obligations to a multiemployer pension plan and, therefore, help financial statement users better understand the financial health of all of the significant plans in which the employer participates. The Company adopted this guidance during the year ended December 31, 2011. The adoption of this guidance, which is included in Note 12, had no material impact on the Company’s consolidated financial statements, as it only increased the disclosure requirements.
In September 2011, the FASB issued ASU 2011-08, “Intangibles — Goodwill and Other (Topic 350): Testing Goodwill for Impairment,” which permits an entity to perform a qualitative assessment to determine whether it is more likely than not that a reporting unit’s fair value is less than its carrying value before applying the two-step goodwill impairment model that is currently in place. If it is determined through the qualitative assessment that a reporting unit’s fair value is more likely than not greater than its carrying value, the remaining impairment steps would be unnecessary. The qualitative assessment is optional, allowing companies to go directly to the quantitative assessment. This update is effective for annual and interim goodwill impairment tests performed in fiscal years beginning after December 15, 2011, however early adoption is permitted. The Company adopted this guidance during the year ended December 31, 2011. This update impacted testing steps only, and therefore the adoption did not have an impact on the Company’s consolidated balance sheets, results of operations or cash flows.
Reclassifications. Certain prior year amounts have been reclassified to conform to the 2011 presentation.
Note 2: Acquisition
On August 18, 2011, the Company acquired substantially all the assets of Patriot Special Metals, Inc. and RSM Real Estate Holding, Inc., consisting of a specialty steel manufacturing facility located in North Jackson, Ohio (the “North Jackson Facility”). The North Jackson Facility began forging and finishing operations in September. In December, the North Jackson Facility performed its first melts on the facilities new vacuum induction melting (VIM) furnace and two vacuum arc remelting (VAR) furnaces. The Company believes that the acquisition of the North Jackson Facility will broaden the Company’s production capabilities and expand its product range and market penetration. The aggregate purchase price for the North Jackson Facility was $111.3 million, which was comprised of a $40.0 million term note, $40.0 million in borrowings under a new revolving credit facility, $20.0 million in aggregate principal amount of convertible promissory notes issued to the sellers of the North Jackson Facility and the remainder from cash on-hand prior to the acquisition. At the same time, the Company entered into an escrow agreement with the sellers, pursuant to which $2.5 million of the purchase price was placed in escrow. The escrow agreement expires one year after the closing date. The Company assumed approximately $4.6 million of liabilities, primarily related to approved capital expenditure projects at the North Jackson Facility.
34
Table of Contents
For the years ended December 31, 2011, 2010 and 2009, the Company incurred $2.1 million, $0.2 million and $0, respectively, of acquisition related costs which are included as a component of selling and administrative expenses on the consolidated statements of operations.
The following table summarizes the preliminary acquisition-date fair value of the assets acquired and the liabilities assumed in connection with the North Jackson Facility acquisition (dollars in thousands):
| August 18, 2011 |
||||||
| Property, plant and equipment |
$ | 94,102 | ||||
| Non-compete agreement |
1,330 | |||||
| Goodwill |
20,479 | |||||
| Accounts payable |
(4,475 | ) | ||||
| Accrued expenses and other current liabilities |
(138 | ) | ||||
|
|
|
|||||
| Net assets acquired |
$ | 111,298 | ||||
|
|
|
|||||
Assets acquired and liabilities assumed in connection with the acquisition have been recorded at their estimated fair values as of the acquisition date. Preliminary fair values were determined by management based, in part, on independent valuations performed by third party valuation specialists. The above preliminary fair values are subject to change based upon the finalization of the valuations. Under GAAP, the measurement period shall not exceed one year from the acquisition date. The Company will finalize the above amounts as the information necessary to complete the analysis is obtained.
Goodwill is calculated as the excess of the purchase price over the fair value of net assets acquired and represents the future economic benefits arising from other assets acquired that could not be individually identified and separately recognized. Among the factors that contributed to a purchase price in excess of the fair value of the net tangible and intangible assets acquired were the acquisition of an assembled workforce and the expected synergies and other benefits that the Company believes will result from combining the operations of the North Jackson Facility with the Company’s other operations. Goodwill related to the North Jackson Facility acquisition was recorded in the Company’s Universal Stainless & Alloy Products reportable segment. The Company is currently evaluating the purchase price allocation for income tax purposes. Any value assigned to goodwill is expected to be deductible for income tax purposes.
The following is a summary of the changes in the carrying value of goodwill, from January 1, 2011 through December 31, 2011 (dollars in thousands):
| 2011 | ||||||
| Goodwill at beginning of period |
$ | - | ||||
| Goodwill recognized from the North Jackson Facility acquisition |
20,479 | |||||
|
|
|
|||||
| Goodwill at end of period |
$ | 20,479 | ||||
|
|
|
|||||
As previously mentioned, the Company incurred debt in the form of a term loan, borrowings under a revolving credit facility and convertible notes issued to acquire the North Jackson Facility. In accordance with GAAP, the Company has recorded this debt at fair value as of the acquisition date. The fair value of the term loan and borrowings under the revolving credit facility were determined to be the par value of the debt. The terms of the convertible notes were designed to and resulted in the fair value of the option to convert and the debt component aggregating to the par amount of the convertible notes. The Company evaluated the conversion feature of the convertible notes at issuance and determined that no beneficial conversion features existed, which would have required bifurcation.
35
Table of Contents
The operating results of the North Jackson Facility have been included in the Company’s consolidated financial statements since the acquisition date. The results for the year ended December 31, 2011 include net external sales and pre-tax loss of $145,000 and $2.8 million, respectively, related to the North Jackson Facility. The pre-tax loss at the North Jackson Facility includes interest expense on debt incurred to finance the acquisition.
The following unaudited pro forma information presents the combined results as if the acquisition had occurred on January 1, 2009. The unaudited pro forma financial information was prepared to give effect to events that are (1) directly attributable to the acquisition; (2) factually supportable; and (3) expected to have a continuing impact on the combined company’s results. Pro forma adjustments have been made to reflect the incremental impact on earnings of amortization expense related to the acquired intangible asset and income tax expense. The Company has calculated the pro forma results using a 36.4%, 34.0% and (27.0)% effective tax rate for the years ended December 31, 2011, 2010 and 2009, respectively. As a result of no assets being placed in service prior to the acquisition date, the Company has not included any incremental interest expense resulting from the debt incurred to finance the acquisition. All incurred interest would have been capitalized prior to placing the assets in service. The Company has not included the dilutive effect of the convertible notes on the unaudited pro forma information. Due to the level of completion of the North Jackson Facility on January 1, 2009, it is highly unlikely that the acquisition would have been partially financed through the issuance of convertible notes. Prior to the acquisition, the North Jackson Facility’s only sales were derived from scrap sales. Pro forma adjustments were made to eliminate one-time acquisition related costs. The unaudited pro forma financial information does not reflect any cost savings, operating synergies or revenue enhancements that the combined company may achieve as a result of the acquisition or the costs to integrate the operations or the costs necessary to achieve cost savings, operating synergies or revenue enhancements. The pro forma results are not indicative of how the results will appear in the future:
| For the years ended December 31, | 2011 | 2010 | 2009 | |||||||||
|
|
||||||||||||
| (dollars in thousands, except per share amounts)(unaudited) | ||||||||||||
| Net sales |
$ | 252,896 | $ | 189,423 | $ | 124,907 | ||||||
| Net income (loss) |
$ | 17,720 | $ | 10,397 | $ | (3,298 | ) | |||||
| Net income (loss) per common share - Basic |
$ | 2.60 | $ | 1.53 | $ | (0.49 | ) | |||||
| Net income (loss) per common share - Diluted |
$ | 2.54 | $ | 1.51 | $ | (0.49 | ) | |||||
| Weighted-average shares of Common Stock outstanding: |
||||||||||||
| Basic |
6,826,490 | 6,782,576 | 6,775,560 | |||||||||
| Diluted |
6,979,887 | 6,868,255 | 6,775,560 | |||||||||
Note 3: Inventory
The major classes of inventory are as follows:
| December 31, | 2011 | 2010 | ||||||
|
|
||||||||
| (dollars in thousands) | ||||||||
| Raw materials and supplies |
$ | 5,934 | $ | 7,141 | ||||
| Semi-finished and finished steel products |
73,046 | 57,913 | ||||||
| Operating materials |
6,108 | 4,656 | ||||||
|
|
|
|
|
|||||
| Total inventory, net |
$ | 85,088 | $ | 69,710 | ||||
|
|
|
|
|
|||||
36
Table of Contents
Note 4: Property, Plant and Equipment
Property, plant and equipment consists of the following:
| December 31, | 2011 | 2010 | ||||||
|
|
||||||||
| (dollars in thousands) | ||||||||
| Land and land improvements |
$ | 6,829 | $ | 2,772 | ||||
| Buildings |
32,440 | 16,313 | ||||||
| Machinery and equipment |
173,428 | 90,909 | ||||||
| Construction in progress |
20,485 | 4,606 | ||||||
|
|
|
|
|
|||||
| 233,182 | 114,600 | |||||||
| Accumulated depreciation |
(50,034 | ) | (43,019 | ) | ||||
|
|
|
|
|
|||||
| Property, plant and equipment, net |
$ | 183,148 | $ | 71,581 | ||||
|
|
|
|
|
|||||
The Company acquired $94.1 million of property, plant and equipment from the August 18, 2011 acquisition of the North Jackson Facility.
Note 5: Long-Term Debt and Other Financing
Long-term debt consists of the following:
| December 31, | 2011 | 2010 | ||||||
|
|
||||||||
| (dollars in thousands) | ||||||||
| Term loan, due 2016 |
$ | 40,000 | $ | - | ||||
| Revolving credit facility |
29,350 | - | ||||||
| Convertible notes |
20,000 | - | ||||||
| Swing loan credit facility |
5,300 | - | ||||||
| Term loan, due 2012 |
- | 10,200 | ||||||
| Government debt |
- | 623 | ||||||
|
|
|
|
|
|||||
| 94,650 | 10,823 | |||||||
| Less current portion of long-term debt |
3,000 | 2,833 | ||||||
|
|
|
|
|
|||||
| Long-term debt |
$ | 91,650 | $ | 7,990 | ||||
|
|
|
|
|
|||||
Credit Facility
On August 18, 2011, the Company and its wholly owned subsidiaries entered into a Credit Agreement (the “Credit Agreement”) which provides for a senior secured revolving credit facility in an aggregate principal amount not to exceed $75.0 million (the “Revolver”) and a $40.0 million senior secured term loan facility (the “Term Loan”) and together with the Revolver, the (“Facilities”). PNC Bank, National Association (“PNC”) serves as Administrative Agent with respect to the Facilities. The Facilities, which expire in August 2016, are collateralized by substantially all of the assets of the Company and its subsidiaries, except that no real property other than the North Jackson Facility is collateral under the Facilities. Universal Stainless & Alloy Products, Inc., Dunkirk Specialty Steel, LLC and North Jackson Specialty Steel, LLC are co-borrowers under the Facilities. The co-borrowers’ obligations under the Facilities have been guaranteed by USAP Holdings, Inc. In conjunction with the entrance into the Credit Agreement, the Company recorded deferred finance cost of $1.4 million in the consolidated balance sheet as a component of other long-term assets as of December 31, 2011.
Availability under the Revolver is based on eligible accounts receivable and inventory, less outstanding letters of credit issued under the Revolver, which may not exceed $10.0 million at any given time. At December 31, 2011, the Company had borrowing capacity under the Revolver of $70.5 million. At any time prior to August 18, 2015,
37
Table of Contents
the Company may make up to two requests to increase the maximum aggregate principal amount of borrowings under the Revolver by at least $10.0 million, with the maximum aggregate principal amount of borrowings under the Revolver not to exceed $100.0 million in any event. The Company is required to pay a commitment fee based on the daily unused portion of the Revolver. At December 31, 2011, the commitment fee under the Revolver was 0.375%. The Revolver also provides for up to $7.0 million of swing loans so long as the sum of the outstanding swing loans and the outstanding borrowings under the Revolver does not exceed the aggregate borrowing capacity under the Revolver at any given time. The Term Loan is payable in quarterly installments in the principal amount of $1.5 million beginning on July 1, 2012, with the balance of the Term Loan payable in full on August 18, 2016.
Amounts outstanding under the Facilities other than swing loans under the Revolver, at the Company’s option, will bear interest at either a base rate (the “Base Rate Option”) or a LIBOR-based rate (the “LIBOR Option”), in either case calculated in accordance with the terms of the Credit Agreement. The Company elected to use the LIBOR Option during the period from the entrance into the Credit Agreement through December 31, 2011, which was 2.51% at December 31, 2011. Interest on swing loans under the Revolver is calculated using the Base Rate Option, which was 4.50% at December 31, 2011. Interest on the Facilities is payable monthly. Interest on the swing loans is payable quarterly.
The Credit Agreement requires the Company to maintain a leverage ratio not less than a ratio decreasing from 3.25 to 1.00 to 2.50 to 1.00 during the term of the Facilities and a fixed charge coverage ratio not less than 1.20 to 1.00. At December 31, 2011, the Company was obligated to maintain a leverage ratio of not less than 3.25 to 1.00. The Company was in compliance with all covenants contained in the Credit Agreement at December 31, 2011.
Convertible Notes
In connection with the acquisition of the North Jackson Facility, on August 18, 2011, the Company issued $20.0 million in convertible notes (the “Notes”) to the sellers of the North Jackson Facility as partial consideration of the acquisition. The Notes are subordinated obligations of the Company and rank junior to the Credit Facility. The Notes bear interest at a fixed rate of 4.0% per annum, payable in cash semi-annually in arrears on each June 18 and December 18, beginning on December 18, 2011. Unless earlier converted, the Notes mature and the unpaid principal balance is due on August 17, 2017. The Notes and any accrued and unpaid interest are convertible into shares of the Company’s Common Stock at the option of the holder at an initial conversion price of $47.1675 per share of Common Stock. The conversion price associated with the Notes may be adjusted in certain circumstances. The Company may prepay any outstanding Notes, in whole or in part, on any date after August 17, 2014 during a fiscal quarter if the Company’s share price is greater than 140% of the current conversion price for at least 20 of the trading days in the 30 consecutive trading day period ending on the last trading day of the immediately preceding quarter. The Company evaluated the conversion feature of the Notes upon issuance and determined that no beneficial conversion feature existed.
The aggregate annual principal payments due under the Company’s long-term debt are as follows:
| Year ended December 31, | (dollars in thousands) | |||||
|
|
||||||
| 2012 |
$ | 3,000 | ||||
| 2013 |
6,000 | |||||
| 2014 |
6,000 | |||||
| 2015 |
6,000 | |||||
| 2016 |
53,650 | |||||
| Thereafter |
20,000 | |||||
|
|
|
|||||
| $ | 94,650 | |||||
|
|
|
|||||
38
Table of Contents
Extinguished Debt
The Company had a credit agreement with PNC, which provided for an unsecured $12.0 million term loan (“Old Term Loan”) and an unsecured $15.0 million revolving credit facility. There was no balance outstanding under the revolving credit facility at December 31, 2010. Quarterly Old Term Loan principal payments of $600,000 began in May 2010. Interest on both facilities was based on short-term market rates. PNC charged a commitment fee payable on the unused portion of the revolving credit facility of 0.25%. The Old Term Loan was repaid in August 2011. In conjunction with the extinguishment of the Old Term Loan, the Company wrote-off $44,000 of unamortized deferred finance costs related to the Old Term Loan. This write-off is included as a component of interest expense and other financing costs on the consolidated statement of operations for the year ended December 31, 2011.
The Company maintained a $400,000 20-year loan agreement with the Commonwealth of Pennsylvania’s Department of Commerce (the “PADC”), which bore interest at 6% per annum. The Company repaid this PADC loan in August 2011. In addition, the Company had a $200,000 15-year loan with the PADC, which bore interest at 5% per annum and matured and was repaid in April 2011. The Company’s wholly-owned subsidiary, Dunkirk Specialty Steel, LLC had two ten-year, 5% interest-bearing notes payable to the New York Job Development Authority for the combined amount of $3.0 million. These notes payable were repaid in August 2011.
Note 6: Derivatives and Hedging Activities
To manage interest rate risk on the Old Term Loan, the Company had an interest rate swap that effectively converted the floating-rate Old Term Loan into a fixed-rate debt instrument. The interest rate swap agreement was executed to minimize the impact of interest rate changes on the Company’s floating-rate debt and was designated and accounted for as a cash flow hedge. The effective portion of the change in the fair value of the interest rate swap was recorded net of tax in accumulated other comprehensive loss (within stockholders’ equity) prior to extinguishing the Old Term Loan. The Company utilized the interest rate swap to maintain a fixed-rate of 4.515% on the Old Term Loan. During year ended December 31, 2011, the Company recognized $139,000 of interest expense from the monthly settlement of the interest rate swap. As a result of extinguishing the Old Term Loan during the year ended December 31, 2011, the interest rate swap no longer qualified for hedge accounting. The Company recorded a charge of $267,000 during the year ended December 31, 2011 as a component of interest expense and other financing costs on the consolidated statement of operations to terminate the interest rate swap.
In July 2009, the Company entered into nickel futures contracts to minimize the price change impact of anticipated purchases of nickel over the life of a customer short-term supply agreement. These contracts were designated as and accounted for as cash flow hedges. The effective portion of the change in the fair value of the nickel hedge agreements was recorded in accumulated other comprehensive loss until they expired on March 31, 2010.
The location and amounts recorded in the consolidated balance sheets for the derivative instrument were as follows:
| December 31, | 2011 | 2010 | ||||||
|
|
||||||||
| (dollars in thousands) | ||||||||
| Other long-term assets, deferred tax |
$ | - | $ | 105 | ||||
| Other long-term liabilities |
- | (287 | ) | |||||
|
|
|
|
|
|||||
| Stockholders’ equity, accumulated other comprehensive loss |
$ | - | $ | (182 | ) | |||
|
|
|
|
|
|||||
39
Table of Contents
Note 7: Fair Value Measurements
The fair value hierarchy has three levels based on the inputs used to determine fair value, which are as follows:
Level 1 — Unadjusted quoted prices available in active markets for the identical assets or liabilities at the measurement date.
Level 2 — Unadjusted quoted prices in active markets for similar assets or liabilities, or unadjusted quoted prices for identical or similar assets or liabilities in markets that are not active, or inputs other than quoted prices that are observable for the asset or liability.
Level 3 — Unobservable inputs that cannot be corroborated by observable market data and reflect the use of significant management judgment. These values are generally determined using pricing models for which the assumptions utilize management’s estimates of market participant assumptions.
The fair value hierarchy requires the use of observable market data when available. In instances where the inputs used to measure fair value fall into different levels of the fair value hierarchy, the fair value measurement has been determined based on the lowest level input significant to the fair value measurement in its entirety. The Company’s assessment of the significance of a particular item to the fair value measurement in its entirety requires judgment, including the consideration of inputs specific to the asset or liability. Prior to its termination, the interest rate swap was recorded at fair value based on Level 2 quoted LIBOR swap rates adjusted for credit and non-performance risk.
Financial instruments include cash, accounts receivable, other current assets, accounts payable, short-term debt and other current liabilities. The carrying amounts of these financial instruments approximated fair value at December 31, 2011 and December 31, 2010 due to their short-term maturities. The fair value of the Term Loan, Revolver and swing loans at December 2011 and 2010 approximated the carrying amount as the interest rate is based upon floating short-term interest rates. At December 31, 2011, the fair value of the Notes approximated the carrying amount.
Note 8: Income Taxes
The Tax Relief, Unemployment Insurance Reauthorization, and Job Creation Act, enacted in December 2010 provided for 100% bonus depreciation for qualified investments made during 2011, and 50% bonus depreciation for qualified investments made during 2012. As a result of the North Jackson Facility acquisition and the significant amount of machinery and equipment that was placed in service in 2011, the Company will claim the 100% bonus depreciation deduction on such equipment. As a result, the Company will generate a net operating loss (“NOL”) for the 2011 federal income tax return. The Company has recorded refundable income taxes in the amount of $4.8 million as of December 31, 2011, which primarily represents the amount of estimated federal taxes paid for 2011, prior to the North Jackson Facility acquisition. At December 31, 2011, the Company had a deferred tax asset of $15.1 million related to federal NOL carry forwards. The Company is currently evaluating whether to carry back a portion of this NOL to 2010 to obtain a refund of $5.4 million paid for federal income taxes for the 2010 tax year. If the Company chooses to carry back the NOL to 2010, it will no longer benefit from the 2010 domestic production deduction. The Company expects to finalize the treatment of the NOL by the end of the second quarter of 2012. All remaining NOL federal carry forwards can be carried forward until 2031.
Components of the provision (benefit) for income taxes are as follows:
| For the years ended December 31, | 2011 | 2010 | 2009 | |||||||||
|
|
||||||||||||
| (dollars in thousands) | ||||||||||||
| Current provision (benefit) |
||||||||||||
| Federal |
$ | 3 | $ | 5,887 | $ | (4,109 | ) | |||||
| State |
280 | 205 | 1,164 | |||||||||
|
|
|
|
|
|
|
|||||||
| Deferred provision (benefit) |
||||||||||||
| Federal |
9,897 | 568 | 2,450 | |||||||||
| State |
176 | 161 | (598 | ) | ||||||||
|
|
|
|
|
|
|
|||||||
| Provision (benefit) for income taxes |
$ | 10,356 | $ | 6,821 | $ | (1,093 | ) | |||||
|
|
|
|
|
|
|
|||||||
40
Table of Contents
A reconciliation of the federal statutory tax rate and the Company’s effective tax rate is as follows:
| For the years ended December 31, | 2011 | 2010 | 2009 | |||||||||
|
|
||||||||||||
| Federal statutory tax (benefit) rate |
35.0 | % | 35.0 | % | (35.0 | )% | ||||||
| Reconciliation of federal and state tax balances to tax returns |
- | - | 13.4 | |||||||||
| Statutory tax rate changes |
- | - | (4.5 | ) | ||||||||
| Loss carryback realized at higher statutory rate |
- | - | (1.9 | ) | ||||||||
| State government grants, net of federal tax impact |
(0.3 | ) | (0.1 | ) | (1.2 | ) | ||||||
| Domestic manufacturing deduction |
- | (2.8 | ) | - | ||||||||
| State income taxes, net of federal impact |
1.6 | 1.6 | - | |||||||||
| Other, net |
0.1 | 0.3 | 2.2 | |||||||||
|
|
|
|
|
|
|
|||||||
| Effective income tax (benefit) rate |
36.4 | % | 34.0 | % | (27.0 | )% | ||||||
|
|
|
|
|
|
|
|||||||
Dunkirk Specialty Steel operates in a New York State Empire Zone and is qualified to benefit from investments made and employees hired at the Dunkirk, New York facility for up to 15 years from its 2002 acquisition date. The Company recognized deferred tax credit benefits of $125,000, $43,000 and $73,000 for the years December 31, 2011, 2010 and 2009, respectively. These credits, which have no expiration date, will be applied against future tax liabilities for income apportioned to New York State. The Company believes it will generate sufficient taxable income to utilize these tax credits.
Deferred taxes result from the following:
| December 31, | 2011 | 2010 | ||||
|
| ||||||
| (dollars in thousands) | ||||||
| Current deferred tax assets: |
||||||
| Inventory |
$ | 12,466 | $ 1,598 | |||
| Federal tax carryforwards |
12,418 | - | ||||
| Share-based compensation |
2,000 | 1,443 | ||||
| Receivables |
765 | 809 | ||||
| Accrued liabilities |
679 | 386 | ||||
| Other |
348 | 90 | ||||
|
|
|
| ||||
| Total current deferred tax assets |
$ | 28,676 | $ 4,326 | |||
|
|
|
| ||||
| Noncurrent deferred tax assets: |
||||||
| Federal and state tax carryforwards |
$ | 4,498 | $ 1,294 | |||
| Other |
- | 105 | ||||
|
|
|
| ||||
| Total noncurrent deferred tax assets |
$ | 4,498 | $ 1,399 | |||
|
|
|
| ||||
| Deferred tax liabilities: |
||||||
| Property, plant and equipment (noncurrent) |
$ | 52,789 | $ 15,276 | |||
| Other (current) |
238 | 124 | ||||
|
|
|
| ||||
| $ | 53,027 | $ 15,400 | ||||
|
|
|
| ||||
State tax carry forwards represent New York Empire Zone tax credits with no expiration date and a state net operating loss carry forwards expiring at various times through 2031.
The Company is routinely under audit by federal or state authorities. The Company’s tax returns are subject to examination by the Internal Revenue Service for tax years 2009 through 2011, and by state tax jurisdictions for tax years 2007 through 2011.
41
Table of Contents
Note 9: Stockholders’ Equity
The Company has never paid a cash dividend on its Common Stock. The Company’s Credit Agreement does not permit the payment of cash dividends on its Common Stock.
In October 1998, the Company initiated a stock repurchase program to repurchase up to 315,000 shares of its outstanding Common Stock in open market transactions at market prices. The Company is authorized to repurchase 45,100 remaining shares of Common Stock under this program as of December 31, 2011.
The Company has 1,980,000 authorized shares of Senior Preferred Stock. At December 31, 2011 and 2010, there were no preferred shares issued or outstanding.
| Common shares outstanding |
Common Stock |
Additional paid-in capital |
Retained earnings |
Accumulated other comprehensive loss |
Treasury shares |
Treasury Stock |
||||||||||||||||||||||
| (dollars in thousands) |
||||||||||||||||||||||||||||
| Balance at January 1, 2009 |
6,732,284 | $ | 7 | $ | 37,260 | $ | 110,092 | $ | - | 270,795 | $ | (1,659 | ) | |||||||||||||||
| Common Stock issuance under Employee Stock Purchase Plan |
8,820 | - | 119 | - | - | - | - | |||||||||||||||||||||
| Exercise of stock options |
32,000 | - | 253 | - | - | - | - | |||||||||||||||||||||
| Share-based compensation |
- | - | 1,058 | - | - | - | - | |||||||||||||||||||||
| Tax benefit on share-based compensation |
- | - | 86 | - | - | - | - | |||||||||||||||||||||
| Net loss |
- | - | - | (2,958 | ) | - | - | - | ||||||||||||||||||||
| Net loss on derivative instruments, net of tax |
- | - | - | - | (32 | ) | - | - | ||||||||||||||||||||
|
|
|
|
|
|
|
|
|
|
|
|
|
|
|
|||||||||||||||
| Balance at December 31, 2009 |
6,773,104 | 7 | 38,776 | 107,134 | (32 | ) | 270,795 | (1,659 | ) | |||||||||||||||||||
| Common Stock issuance under Employee Stock Purchase Plan |
9,865 | - | 137 | - | - | - | - | |||||||||||||||||||||
| Exercise of stock options |
40,550 | - | 466 | - | - | - | - | |||||||||||||||||||||
| Share-based compensation |
- | - | 1,819 | - | - | - | - | |||||||||||||||||||||
| Tax benefit on share-based compensation |
- | - | 143 | - | - | - | - | |||||||||||||||||||||
| Net income |
- | - | - | 13,242 | - | - | - | |||||||||||||||||||||
| Net loss on derivative instruments, net of tax |
- | - | - | - | (150 | ) | - | - | ||||||||||||||||||||
| Purchase of Treasury Stock |
(12,055 | ) | - | - | - | - | 12,055 | (260 | ) | |||||||||||||||||||
|
|
|
|
|
|
|
|
|
|
|
|
|
|
|
|||||||||||||||
| Balance at December 31, 2010 |
6,811,464 | 7 | 41,341 | 120,376 | (182 | ) | 282,850 | (1,919 | ) | |||||||||||||||||||
| Common Stock issuance under Employee Stock Purchase Plan |
8,551 | - | 252 | - | - | - | - | |||||||||||||||||||||
| Exercise of stock options |
27,500 | - | 375 | - | - | - | - | |||||||||||||||||||||
| Share-based compensation |
- | - | 1,580 | - | - | - | - | |||||||||||||||||||||
| Tax benefit on share-based compensation |
- | - | 172 | - | - | - | - | |||||||||||||||||||||
| Net income |
- | - | - | 18,122 | - | - | - | |||||||||||||||||||||
| Net income on derivative instruments, net of tax |
- | - | - | - | 182 | - | - | |||||||||||||||||||||
|
|
|
|
|
|
|
|
|
|
|
|
|
|
|
|||||||||||||||
| Balance at December 31, 2011 |
6,847,515 | $ | 7 | $ | 43,720 | $ | 138,498 | $ | - | 282,850 | $ | (1,919 | ) | |||||||||||||||
|
|
|
|
|
|
|
|
|
|
|
|
|
|
|
|||||||||||||||
42
Table of Contents
Note 10: Net Income (Loss) Per Common Share
The computation of basic and diluted net income (loss) per common share for the years ended December 31, 2011, 2010 and 2009 is as follows:
| For the years ended December 31, | 2011 | 2010 | 2009 | |||||||||
|
|
||||||||||||
| (dollars in thousands, except per share amounts) | ||||||||||||
| Numerator: |
||||||||||||
| Net income (loss) |
$ | 18,122 | $ | 13,242 | $ | (2,958 | ) | |||||
| Adjustment for interest expense on convertible notes, net of capitalized interest |
119 | - | - | |||||||||
|
|
|
|
|
|
|
|||||||
| Net income (loss), as adjusted |
$ | 18,241 | $ | 13,242 | $ | (2,958 | ) | |||||
|
|
|
|
|
|
|
|||||||
| Denominator: |
||||||||||||
| Weighted average number of shares of Common Stock outstanding |
6,826,490 | 6,782,576 | 6,755,560 | |||||||||
| Weighted average effect of dilutive stock options |
153,397 | 85,679 | - | |||||||||
| Weighted average effect of assumed conversion of convertible notes (A) |
158,937 | - | - | |||||||||
|
|
|
|
|
|
|
|||||||
| Weighted average number of shares of Common Stock outstanding, as adjusted |
7,138,824 | 6,868,255 | 6,755,560 | |||||||||
|
|
|
|
|
|
|
|||||||
| Net income per common share: |
||||||||||||
| Net income (loss) per common share – Basic |
$ | 2.65 | $ | 1.95 | $ | (0.44 | ) | |||||
|
|
|
|
|
|
|
|||||||
| Net income (loss) per common share – Diluted |
$ | 2.56 | $ | 1.93 | $ | (0.44 | ) | |||||
|
|
|
|
|
|
|
|||||||
| (A) | The weighted average for the assumed conversion of the Notes was calculated from the August 18, 2011 issuance until December 31, 2011. |
There were 144,300; 211,800 and 379,550 stock options outstanding, which were excluded from the computation of diluted net income (loss) per common share, at an average price of $38.35, $32.90 and $27.06, respectively, at December 31, 2011, 2010 and 2009, respectively. These outstanding options were not included in the computation of diluted net income (loss) per common share because their respective exercise prices were greater than the average market price of the Common Stock. These options were excluded from the computation of diluted net income (loss) per common share under the treasury stock method. In addition, the Company had 38,028 common stock equivalents outstanding at December 31, 2009 which were not included in the diluted net loss per common share as the Common Stock equivalents were anti-dilutive, as a result of being in a net loss position.
Note 11: Share-Based Compensation Plans
At December 31, 2011, the Company has three incentive compensation plans that are described below:
Stock Incentive Plan
The Company maintains a Stock Incentive Plan that has been adopted and amended from time to time by the Company’s Board of Directors and approved by its stockholders. The Stock Incentive Plan permits the issuance of stock options to non-employee directors, other than those directors owning more than 5% of the Company’s outstanding Common Stock, officers and other key employees of the Company who are expected to contribute to
43
Table of Contents
the Company’s future growth and success. The stockholders approved an increase of 400,000 reserved shares in 2010. The Company may grant options up to a maximum of 1,750,000 shares of Common Stock, of which 312,318 were available for grant at December 31, 2011. The option price is equal to the fair market value of the Common Stock at the date of grant. Options granted to non-employee directors vest over a three-year period, and options granted to employees vest over a four-year period. All options under the Stock Incentive Plan will expire no later than ten years after the grant date. Forfeited options may be reissued and are included in the amount available for grants.
A summary of the Stock Incentive Plan activity as of and for the years ended December 31, 2011, 2010 and 2009 is presented below:
| Non-vested stock options outstanding |
Stock options outstanding |
|||||||||||||||||||
| Shares available for grant |
Number of shares |
Weighted- average grant fair value |
Number of shares |
Weighted- average exercise price |
||||||||||||||||
| Balance, January 1, 2009 |
252,918 | 251,575 | $ | 15.42 | 479,550 | $ | 21.77 | |||||||||||||
| Granted |
(122,500 | ) | 122,500 | 9.24 | 122,500 | 16.31 | ||||||||||||||
| Stock options exercised |
(32,000 | ) | 7.90 | |||||||||||||||||
| Stock options vested |
(84,250 | ) | 14.80 | |||||||||||||||||
| Forfeited |
8,750 | (5,750 | ) | 15.07 | (8,750 | ) | 30.00 | |||||||||||||
|
|
|
|
|
|
|
|||||||||||||||
| Balance, December 31, 2009 |
139,168 | 284,075 | 12.94 | 561,300 | 20.04 | |||||||||||||||
| Additional shares reserved |
400,000 | |||||||||||||||||||
| Granted |
(130,000 | ) | 130,000 | 12.49 | 130,000 | 22.10 | ||||||||||||||
| Stock options exercised |
(40,550 | ) | 11.49 | |||||||||||||||||
| Stock options vested |
(95,700 | ) | 13.85 | |||||||||||||||||
| Forfeited |
45,150 | (36,400 | ) | 12.55 | (45,150 | ) | 20.62 | |||||||||||||
|
|
|
|
|
|
|
|||||||||||||||
| Balance, December 31, 2010 |
454,318 | 281,975 | 12.59 | 605,600 | 22.02 | |||||||||||||||
| Granted |
(146,000 | ) | 146,000 | 21.27 | 146,000 | 36.33 | ||||||||||||||
| Stock options exercised |
(27,500 | ) | 13.64 | |||||||||||||||||
| Stock options vested |
(142,050 | ) | 14.78 | |||||||||||||||||
| Forfeited |
4,000 | (1,000 | ) | 16.08 | (4,000 | ) | 32.07 | |||||||||||||
|
|
|
|
|
|
|
|||||||||||||||
| Balance, December 31, 2011 |
312,318 | 284,925 | $ | 15.56 | 720,100 | $ | 25.19 | |||||||||||||
|
|
|
|
|
|
|
|
|
|
|
|||||||||||
The following table summarizes information about stock options outstanding at December 31, 2011:
| Options outstanding | Options exercisable | |||||||||||||||||||
| Range of exercise prices |
Number of shares |
Weighted- average remaining years contractual life |
Weighted- average exercise price |
Number of shares |
Weighted- average exercise price |
|||||||||||||||
| $5.12 to $16.11 |
148,800 | 4.1 | $ | 11.78 | 116,575 | $ | 11.45 | |||||||||||||
| $16.95 to $19.25 |
147,500 | 7.3 | 17.86 | 49,300 | 17.82 | |||||||||||||||
| $20.61 to $32.07 |
174,500 | 7.3 | 26.99 | 65,250 | 31.00 | |||||||||||||||
| $32.20 to $36.94 |
144,150 | 7.6 | 34.51 | 47,400 | 34.94 | |||||||||||||||
| $38.16 to $42.50 |
105,150 | 8.7 | 38.65 | 16,600 | 41.10 | |||||||||||||||
|
|
|
|
|
|
|
|
|
|
|
|||||||||||
| Outstanding at end of year |
720,100 | 6.9 | $ | 25.19 | 295,125 | $ | 22.28 | |||||||||||||
|
|
|
|
|
|
|
|
|
|
|
|||||||||||
| Exercisable at end of year |
295,125 | 4.9 | ||||||||||||||||||
|
|
|
|
|
|||||||||||||||||
44
Table of Contents
Proceeds from stock option exercises totaled $375,000, $466,000 and $253,000 for the years ended December 31, 2011, 2010 and 2009, respectively. Shares issued in connection with stock option exercises are issued from available authorized shares. Tax benefits realized from stock options exercised totaled $172,000, $143,000 and $86,000 for the years ended December 31, 2011, 2010 and 2009, respectively.
Based upon the closing stock price of $37.36 at December 31, 2011, the aggregate intrinsic value of outstanding in-the-money stock options and outstanding exercisable in-the-money stock options was $9.1 million and $4.6 million, respectively. Intrinsic value of stock options is calculated as the amount by which the market price of the Company’s Common Stock exceeds the exercise price of the options. The aggregate intrinsic value of stock options exercised for the years ended December 31, 2011, 2010 and 2009 was $549,000, $560,000 and $239,000, respectively. The total fair value of share awards vested was $2.1 million, $1.3 million and $1.2 million during the years ended December 31, 2011, 2010 and 2009, respectively.
Share-based Compensation Expense. Share-based compensation to employees and directors is recognized as compensation expense in the consolidated statements of operations based on their fair values on the measurement date, which is the date of the grant. The value of the portion of the award that is ultimately expected to vest is recognized as expense over the requisite service periods. The compensation expense recognized and its related tax effects are included in additional paid-in capital. Additional paid-in capital is further adjusted for the difference between compensation expense recorded under the accounting standard and compensation expense reported for tax purposes upon actual exercise of employee stock options.
Share-based compensation expense totaled $1.6 million, $1.8 million and $1.1 million for the years ended December 31, 2011, 2010 and 2009, respectively. Share-based compensation expense is recognized ratably over the requisite service period for all awards. The tax benefit associated with the share-based compensation expense recognized in the accompanying consolidated statements of operations was $563,000 in 2011, $420,000 in 2010, and $394,000 in 2009. Unrecognized share-based compensation expense related to non-vested stock awards totaled $4.3 million at December 31, 2011. At such date, the weighted-average period over which this unrecognized expense was expected to be recognized was 24 months.
Valuation of Share-based Compensation. The fair value of the Company’s employee stock options granted is estimated on the measurement date, which, for the Company, is the date of grant. The Company uses the Black-Scholes option-pricing model. The weighted-average fair value of stock options granted was $3.1 million for 2011, $1.6 million for 2010 and $1.1 million for 2009. The Company’s determination of fair value of share-based payment awards on the date of grant is affected by the Company’s stock price as well as assumptions regarding the Company’s expected stock price volatility over the term of the awards, and actual and projected employee stock option exercise behaviors.
The assumptions used to determine the fair value of options granted are detailed in the table below:
| 2011 | 2010 | 2009 | ||||||||||
| Risk-free interest rate |
1.23 to 2.66 % | 1.53 to 2.68 % | 2.34 to 3.15 % | |||||||||
| Dividend yield |
0.0% | 0.0% | 0.0% | |||||||||
| Expected market price volatility |
55 to 62 % | 54 to 59 % | 54 to 56 % | |||||||||
| Weighted-average expected market price volatility |
56.1% | 56.3% | 55.2% | |||||||||
| Expected term |
6.0 to 7.9 years | 6.0 to 7.8 years | 6.0 to 7.8 years | |||||||||
45
Table of Contents
The risk-free interest rate was developed using the U.S. Treasury yield curve for periods equal to the expected life of the options at the grant date. No dividend yield was assumed because the Company does not pay cash dividends on Common Stock and currently has no plans to pay a dividend. Expected volatility is based on the long-term historical volatility (estimated over a period equal to the expected term of the options) of the Company’s stock. In estimating the fair value of stock options under the Black-Scholes option-pricing model, separate groups of employees that have similar historical exercise behavior are considered separately. The expected term of options granted represents the period of time that options granted are expected to be outstanding.
Employee Stock Purchase Plan
Under the 1996 Employee Stock Purchase Plan, the Company is authorized to issue up to 150,000 shares of Common Stock to its full-time employees, nearly all of whom are eligible to participate. Under the terms of the plan, employees can choose as of January 1 and July 1 of each year to have up to 10% of their total earnings withheld to purchase up to 100 shares of the Company’s Common Stock each six-month period. The purchase price of the stock is 85% of the lower of its beginning-of-the-period or end-of-the-period market prices. At December 31, 2011, the Company has issued 131,484 shares of Common Stock since the plan’s inception.
Cash Incentive Plans
The Company has a Variable Compensation Plan covering certain key executives and employees and profit-sharing plans that cover the remaining employees. The profit-sharing plans provide for the sharing of pre-tax profits in excess of specified amounts. For the years ended December 31, 2011, 2010 and 2009, the Company expensed $6.8 million, $5.0 million, and $252,000, respectively, under these plans of which $4.5 million, $2.7 million and $13,000, respectively was included as a component of cost of products sold while the remainder is included in selling and administrative expense.
Note 12: Retirement Plans
The Company has a defined contribution retirement plan that covers substantially all employees. Pursuant to the 401(k) plan, participants may elect to make pre-tax and after-tax contributions, subject to certain limitations imposed under the Internal Revenue Code of 1986, as amended. In addition, the Company makes periodic contributions to the 401(k) plan based on service for the Titusville and Dunkirk hourly employees and age for North Jackson hourly employees. The Company makes periodic contributions for the salaried employees at all locations except for North Jackson based upon their individual contribution to the 401(k) retirement plan. For North Jackson salaried employees, the Company makes periodic contributions based upon the employee’s age.
The Company also participates in the Steelworkers Pension Trust (the “Trust”), a multi-employer defined-benefit pension plan that is open to all hourly and salaried employees associated with the Bridgeville facility. The Company makes periodic contributions to the Trust based on hours worked at a fixed rate for each hourly employee and a fixed monthly contribution on behalf of each salaried employee. The collective bargaining agreement at the Bridgeville facility expires August 31, 2013. The trustees of the Trust have provided the Company with the latest data available for the Trust year ending December 31, 2011. As of that date, the Trust is not fully funded. The Company could be held liable to the Trust for its own obligations, as well as those of other employers, due to the Company’s participation in the Trust. Contribution rates could increase if the Trust is required to adopt a funding improvement plan or a rehabilitation plan, if the performance of the Trust assets do not meet expectations, or as a result of future collectively-bargained wage and benefit agreements. If the Company chooses to stop participating in the Trust, it may be required to pay the Trust an amount based on the underfunded status of the Trust, referred to as a withdrawal liability.
The Pension Protection Act (PPA) defines a zone status for each trust. Trusts in the green zone are at least 80% funded, trusts in the yellow zone are at least 65% funded, and trusts in the red zone are generally less than 65%
46
Table of Contents
funded. The Trust has utilized extended amortization provisions to amortize its losses from 2008. The Trust recertified its zone status after using the extended amortization provisions as allowed by law. The Trust has not implemented a funding improvement or rehabilitation plan, nor are such plans pending. The Company’s contributions to the Trust have not exceeded more than 5% of the total contributions to the Trust. The increased levels of employment and overtime increased the Company’s contributions in 2011.
| Trusts employer identification number / plan number |
Funding plan pending / implemented |
|||||||||||||||||||||
| Company contributions to the Trust | ||||||||||||||||||||||
| Pension fund |
PPA zone status |
(dollars in thousands) | Surcharge imposed | |||||||||||||||||||
| 2011 |
2010 |
2011 | 2010 | 2009 | ||||||||||||||||||
| Trust |
23-6648508 / 499 | Green | Green | No | $ | 712 | $ | 567 | $ | 438 | No | |||||||||||
The total expense of all retirement plans for the years ended December 31, 2011, 2010 and 2009 was $1.3 million, $937,000, and $743,000, respectively. No other post-retirement benefit plans exist.
Note 13: Commitments and Contingencies
From time to time, various lawsuits and claims have been or may be asserted against the Company relating to the conduct of its business, including routine litigation relating to commercial and employment matters. The ultimate cost and outcome of any litigation or claim cannot be predicted with certainty. Management believes, based on information presently available, that the likelihood that the ultimate outcome of any such pending matter will have a material adverse effect on its financial condition, or liquidity or a material impact to our results of operations is remote, although the resolution of one or more of these matters may have a material adverse effect on its results of operations for the period in which the resolution occurs.
The Company, as well as other steel companies, is subject to demanding environmental standards imposed by federal, state and local environmental laws and regulations. The Company is not aware of any environmental condition that currently exists at any of its facilities that would cause a material adverse effect on the financial condition of the Company, results of operations or liquidity in a particular future quarter or year.
The Company’s purchase obligations include the value of all open purchase orders with established quantities and purchase prices, as well as minimum purchase commitments, all made in the normal course of business. At December 31, 2011, the Company’s total purchase obligations were $24.5 million, all of which will be due in year 2012.
Note 14: Segment and Related Information
The Company is comprised of two reportable business segments. The Bridgeville, North Jackson and Titusville facilities have been aggregated into one reportable segment, Universal Stainless & Alloy Products (“USAP”). Dunkirk Specialty Steel represents the second reportable segment. The USAP manufacturing process involves melting, remelting, heat treating, forging and hot and cold rolling of semi-finished and finished specialty steels. Dunkirk Specialty Steel’s manufacturing process involves hot rolling, heat treating and finishing of specialty steel bar, rod and wire products.
Management is currently evaluating the impact of the North Jackson Facility acquisition on the Company’s externally reported segments in accordance with ASC Topic 280, “Segment Reporting”. From the North Jackson acquisition date through December 31, 2011, the Company has included the results of North Jackson in the USAP segment. The North Jackson operating segment was included in the USAP reporting segment as a result of North Jackson having consistent characteristics as identified in ASC Topic 280 with the USAP segment. The USAP segment also includes acquisition related costs.
47
Table of Contents
The accounting policies of both reportable segments are the same as those described in Note 1: Significant Accounting Policies. Sales between the segments are generally made at market-related prices.
The segment data is as follows:
| For the years ended December 31, | 2011 | 2010 | 2009 | |||||||||||
|
|
||||||||||||||
| (dollars in thousands) | ||||||||||||||
| Net sales |
||||||||||||||
| Universal Stainless & Alloy Products |
$ | 225,333 | $ | 173,294 | $ | 108,319 | ||||||||
| Dunkirk Specialty Steel |
97,378 | 56,600 | 37,245 | |||||||||||
| Intersegment |
(70,115 | ) | (40,471 | ) | (20,657 | ) | ||||||||
|
|
|
|
|
|
|
|||||||||
| Consolidated net sales |
$ | 252,596 | $ | 189,423 | $ | 124,907 | ||||||||
|
|
|
|
|
|
|
|||||||||
| Operating income (loss) |
||||||||||||||
| Universal Stainless & Alloy Products |
$ | 20,176 | $ | 17,311 | $ | (2,396 | ) | |||||||
| Dunkirk Specialty Steel |
10,277 | 4,296 | (2,261 | ) | ||||||||||
| Intersegment |
(766 | ) | (1,184 | ) | - | |||||||||
|
|
|
|
|
|
|
|||||||||
| Consolidated operating income (loss) |
$ | 29,687 | $ | 20,423 | $ | (4,657 | ) | |||||||
|
|
|
|
|
|
|
|||||||||
| Interest expense and other financing costs |
||||||||||||||
| Universal Stainless & Alloy Products (A) |
$ | 1,406 | $ | 412 | $ | 30 | ||||||||
| Dunkirk Specialty Steel |
15 | 40 | 59 | |||||||||||
|
|
|
|
|
|
|
|||||||||
| Consolidated interest expense and other financing costs |
$ | 1,421 | $ | 452 | $ | 89 | ||||||||
|
|
|
|
|
|
|
|||||||||
| Other income, net |
||||||||||||||
| Universal Stainless & Alloy Products |
$ | 68 | $ | 40 | $ | 62 | ||||||||
| Dunkirk Specialty Steel (B) |
144 | 52 | 633 | |||||||||||
|
|
|
|
|
|
|
|||||||||
| Consolidated other income, net |
$ | 212 | $ | 92 | $ | 695 | ||||||||
|
|
|
|
|
|
|
|||||||||
| Depreciation and amortization (C) |
||||||||||||||
| Universal Stainless & Alloy Products |
$ | 5,738 | $ | 4,210 | $ | 3,555 | ||||||||
| Dunkirk Specialty Steel |
1,274 | 1,162 | 1,187 | |||||||||||
| Corporate |
106 | 97 | 93 | |||||||||||
|
|
|
|
|
|
|
|||||||||
| Consolidated depreciation and amortization |
$ | 7,118 | $ | 5,469 | $ | 4,835 | ||||||||
|
|
|
|
|
|
|
|||||||||
| Capital expenditures (D) |
||||||||||||||
| Universal Stainless & Alloy Products |
$ | 22,455 | $ | 6,831 | $ | 11,496 | ||||||||
| Dunkirk Specialty Steel |
1,829 | 425 | 874 | |||||||||||
| Corporate |
196 | 225 | 24 | |||||||||||
|
|
|
|
|
|
|
|||||||||
| Consolidated capital expenditures |
$ | 24,480 | $ | 7,481 | $ | 12,394 | ||||||||
|
|
|
|
|
|
|
|||||||||
| (A) | Includes amortization of deferred financing costs of $153,000, $17,000, and $24,000 for the years ended December 31, 2011, 2010 and 2009, respectively. |
| (B) | Includes net receipt of import duties of $115,000, $32,000 and $551,000 for the years ended December 31, 2011, 2010 and 2009, respectively. |
| (C) | These amounts include depreciation on property, plant and equipment and amortization on the non-compete agreement. |
| (D) | These amounts include capital expenditures included in current liabilities of $7.7 million, $578,000 and $1.0 million for the years ended December 31, 2011, 2010 and 2009, respectively. |
48
Table of Contents
The following table presents total assets by segment:
| December 31,
|
2011
|
2010
|
||||||
| (dollars in thousands) |
||||||||
| Universal Stainless & Alloy Products (A) |
$ | 271,107 | $ | 128,174 | ||||
| Dunkirk Specialty Steel |
55,820 | 42,199 | ||||||
| Corporate (B), (C) |
149,101 | 42,804 | ||||||
| Intersegment eliminations (C) |
(114,356 | ) | (2,576 | ) | ||||
|
|
|
|
|
|||||
| Total assets |
$ | 361,672 | $ | 210,601 | ||||
|
|
|
|
|
|||||
| (A) | December 31, 2011 includes $115.9 million of assets acquired as a result of the North Jackson Facility acquisition. |
| (B) | Includes cash of $0.3 million and $34.4 million, respectively. |
| (C) | Includes investments in consolidated subsidiaries of $112.5 million and $1.5 million, respectively. |
The following table presents net sales by product line:
| For the years ended December 31,
|
2011
|
2010
|
2009
|
|||||||||
| (dollars in thousands) |
||||||||||||
| Stainless steel |
$ | 202,000 | $ | 142,302 | $ | 98,069 | ||||||
| Tool steel |
21,963 | 26,196 | 9,413 | |||||||||
| High-strength low alloy steel |
17,532 | 10,310 | 9,235 | |||||||||
| High-temperature alloy steel |
6,809 | 5,853 | 5,567 | |||||||||
| Conversion services |
3,905 | 2,719 | 1,203 | |||||||||
| Other |
387 | 2,043 | 1,420 | |||||||||
|
|
|
|
|
|
|
|||||||
| Total net sales |
$ | 252,596 | $ | 189,423 | $ | 124,907 | ||||||
|
|
|
|
|
|
|
|||||||
The Company derived 4%, 5% and 10% of its net sales from markets outside of the United States for the years ended December 31, 2011, 2010 and 2009. The Company has no assets located outside the United States.
49
Table of Contents
Note 15: Selected Quarterly Financial Data (unaudited)
| First quarter | Second quarter | Third quarter | Fourth quarter | |||||||||||||
| (dollars in thousands, except per share amounts) |
|
|||||||||||||||
| 2011 Data: |
||||||||||||||||
| Net sales |
$ | 59,811 | $ | 63,318 | $ | 67,299 | $ | 62,168 | ||||||||
| Gross profit margin |
10,798 | 12,172 | 12,574 | 11,904 | ||||||||||||
| Operating income |
6,968 | 8,475 | 7,231 | 7,013 | ||||||||||||
| Provision for income taxes |
2,395 | 2,975 | 2,774 | 2,212 | ||||||||||||
| Net income |
4,448 | 5,525 | 3,893 | 4,256 | ||||||||||||
| Net income per common share: |
||||||||||||||||
| Basic |
$ | 0.65 | $ | 0.81 | $ | 0.57 | $ | 0.62 | ||||||||
| Diluted |
$ | 0.64 | $ | 0.79 | $ | 0.55 | $ | 0.59 | ||||||||
|
|
|
|
|
|
|
|
|
|||||||||
| 2010 Data: |
||||||||||||||||
| Net sales |
$ | 34,679 | $ | 51,291 | $ | 51,870 | $ | 51,583 | ||||||||
| Gross profit margin |
4,919 | 9,697 | 10,315 | 8,841 | ||||||||||||
| Operating income |
2,259 | 6,397 | 6,314 | 5,453 | ||||||||||||
| Provision for income taxes |
736 | 2,140 | 2,107 | 1,838 | ||||||||||||
| Net income |
1,427 | 4,155 | 4,091 | 3,569 | ||||||||||||
| Net income per common share: |
||||||||||||||||
| Basic |
$ | 0.21 | $ | 0.61 | $ | 0.60 | $ | 0.53 | ||||||||
| Diluted |
$ | 0.21 | $ | 0.61 | $ | 0.60 | $ | 0.52 | ||||||||
|
|
|
|
|
|
|
|
|
|||||||||
Net income per common share amounts for each quarter is required to be computed independently. As a result, their sum may not equal the total year earnings per share amounts.
50
Table of Contents
| ITEM 9. | CHANGES IN AND DISAGREEMENTS WITH ACCOUNTANTS ON ACCOUNTING AND FINANCIAL DISCLOSURE |
None.
| ITEM 9A. | CONTROLS AND PROCEDURES |
The Company’s management, including the Company’s Chairman, President and Chief Executive Officer and the Vice President of Finance, Chief Financial Officer and Treasurer, performed an evaluation of the effectiveness of the Company’s disclosure controls and procedures. Based on that evaluation, the Company’s Chairman, President and Chief Executive Officer and the Vice President of Finance, Chief Financial Officer and Treasurer concluded that, as of the end of the fiscal year covered by this Annual Report on Form 10-K, the Company’s disclosure controls and procedures are effective. Management’s Report on the Company’s internal control over financial reporting is included in Item 8 of this Annual Report on Form 10-K under the caption “Management’s Report on Internal Control Over Financial Reporting” and is incorporated herein by reference. The Company’s independent registered public accounting firm has issued a report on management’s maintenance of effective internal control over financial reporting and is set forth in Item 8 of this Annual Report on Form 10-K under the caption “Report of Independent Registered Public Accounting Firm” and is incorporated herein by reference.
During the last fiscal quarter of the fiscal year ended December 31, 2011, there were no changes in the Company’s internal control over financial reporting which have materially affected, or are reasonably likely to materially affect, the Company’s internal control over financial reporting.
| ITEM 9B. | OTHER INFORMATION |
None.
PART III
| ITEM 10. | DIRECTORS, EXECUTIVE OFFICERS AND CORPORATE GOVERNANCE |
The information concerning the directors of the Company is set forth in the Proxy Statement for the 2012 Annual Meeting of Stockholders (the “Proxy Statement”) to be sent to stockholders in connection with the Company’s 2012 Annual Meeting of Stockholders, under the heading “Proposal No. 1—Election of Directors,” which information is incorporated by reference. With the exception of the information specifically incorporated herein by reference, the Company’s Proxy Statement is not to be deemed filed as part of this report for the purposes of this Item.
In addition to the information set forth under the caption “Executive Officers” in Part I of this report, the information concerning our directors required by this item is incorporated and made part hereof by reference to the material appearing under the heading “Nominees for Election as Directors” in the Company’s Proxy Statement, which will be filed with the SEC, pursuant to Regulation 14A, not later than 120 days after the end of the 2011 fiscal year. Information concerning the Audit Committee and its “audit committee financial expert” required by this item is incorporated and made part hereof by reference to the material appearing under the heading “Committees of the Board of Directors” in the Proxy Statement. Information required by this item regarding compliance with Section 16(a) of the Exchange Act is incorporated and made a part hereof by reference to the material appearing under the heading “Security Ownership of Certain Beneficial Owners and Management” in the Proxy Statement. Information concerning the executive officers of the Company is contained in Part I of this Annual Report on Form 10-K under the caption “Executive Officers.”
The Company has adopted a Code of Business Conduct and Ethics that applies to all directors and employees, including its principal executive officer and principal financial officer. A copy is available, free of charge, through the Company’s website at http://www.univstainless.com. Information on the Company’s website is not part of this Annual Report on Form 10-K. The Company intends to timely disclose any amendment of or waiver under the Code of Business Conduct and Ethics on its website and will retain such information on its website as required by applicable SEC rules.
51
Table of Contents
| ITEM 11. | EXECUTIVE COMPENSATION |
The information concerning executive compensation is set forth in the Proxy Statement under the heading “Executive Compensation,” which information is incorporated by reference. With the exception of the information specifically incorporated herein by reference, the Proxy Statement is not to be deemed filed as part of this report for the purposes of this Item.
| ITEM 12. | SECURITY OWNERSHIP OF CERTAIN BENEFICIAL OWNERS AND MANAGEMENT AND RELATED STOCKHOLDER MATTERS |
The information concerning security ownership of certain beneficial owners and management is set forth in the Proxy Statement under the heading “Security Ownership of Certain Beneficial Owners and Management,” which information is incorporated by reference. With the exception of the information specifically incorporated herein by reference, the Proxy Statement is not to be deemed filed as part of this report for the purposes of this Item.
| ITEM 13. | CERTAIN RELATIONSHIPS AND RELATED TRANSACTIONS, AND DIRECTOR INDEPENDENCE |
The information concerning certain relationships and related transactions, and director independence is set forth in the Proxy Statement under the heading “The Board of Directors,” which information is incorporated by reference. With the exception of the information specifically incorporated herein by reference, the Proxy Statement is not to be deemed filed as part of this report for the purposes of this Item.
| ITEM 14. | PRINCIPAL ACCOUNTANT FEES AND SERVICES |
The information concerning principal accountant fees and services is set forth in the Proxy Statement under the heading “Principal Accountant Fees and Services,” which information is incorporated by reference. With the exception of the information specifically incorporated herein by reference, the Proxy Statement is not to be deemed filed as part of this report for the purposes of this Item.
PART IV
| ITEM 15. | EXHIBITS AND FINANCIAL STATEMENT SCHEDULES |
The following documents are filed as part of this Form 10-K:
1) Financial Statements
The list of financial statements required by this item is set forth in Item 8, “Financial Statements and Supplementary Data” and is incorporated herein by reference.
2) Consolidated Financial Statement Schedules
Schedule II – Valuation and Qualifying Accounts
| For the Years Ended December 31, 2009, 2010 and 2011 |
Balance at beginning of year |
Charged to costs and expenses |
Deductions/net charge-offs (A) |
Balance at end of year |
||||||||||||
| (dollars in thousands) | ||||||||||||||||
| ALLOWANCE FOR DOUBTFUL ACCOUNTS: |
||||||||||||||||
| Year ended December 31, 2009 |
$ | 330 | $ | 1,823 | $ | (21 | ) | $ | 2,132 | |||||||
| Year ended December 31, 2010 |
2,132 | 274 | (272 | ) | 2,134 | |||||||||||
| Year ended December 31, 2011 |
2,134 | 202 | (384 | ) | 1,952 | |||||||||||
| (A) | Represents write-off of bad debts net of recoveries |
52
Table of Contents
3) Exhibits
| EXHIBIT NUMBER |
DESCRIPTION | |||
| 2.1 | Asset Purchase Agreement, dated as of June 10, 2011, by and among Universal Stainless & Alloy Products, Inc., Patriot Special Metals, Inc. and RSM Real Estate Holding, Inc. |
Incorporated herein by reference to Exhibit 2.1 to the Current Report on Form 8-K filed by Universal Stainless & Alloy Products, Inc. on June 14, 2011. | ||
| 2.2 | Amendment to Asset Purchase Agreement, dated as of August 18, 2011, by and among Universal Stainless & Alloy Products, Inc., Patriot Special Metals, Inc. and RSM Real Estate Holding, Inc. | Incorporated herein by reference to Exhibit 2.2 to the Current Report on Form 8-K filed by Universal Stainless & Alloy Products, Inc. on August 18, 2011. | ||
| 3.1 | Amended and Restated Certificate of Incorporation | Incorporated herein by reference to Exhibit 3.1 to Registration No. 33-85310. | ||
| 3.2 | Amended and Restated By-laws of the Company | Incorporated herein by reference to Exhibit 3.1 to the Current Report on Form 8-K filed November 27, 2007. | ||
| 4.1 | Specimen Copy of Stock Certificate for shares of Common Stock | Incorporated herein by reference to Exhibit 4.1 to the Company’s Annual Report on Form 10-K for the year ended December 31, 1998. | ||
| 4.2 | Form of Convertible Note, dated August 18, 2011 | Incorporated herein by reference to Exhibit 4.1 to the Current Report on Form 8-K filed by Universal Stainless & Alloy Products, Inc. on August 18, 2011. | ||
| 10.1 | Stockholders Agreement dated as of August 1, 1994, by and among the Company and its existing stockholders | Incorporated herein by reference to Exhibit 10.1 to Registration No. 33-85310. | ||
| 10.2 | Credit Agreement, dated as of August 18, 2011, by and among Universal Stainless & Alloy Products, Inc., the other borrowers party thereto, the guarantors party thereto, the lenders party thereto, PNC Bank National Association, as Administrative Agent, and PNC Capital Markets LLC, as Lead Arranger and Sole Bookrunner. | Incorporated herein by reference to Exhibit 10.1 to the Current Report on Form 8-K filed by Universal Stainless & Alloy Products, Inc. on August 18, 2011. | ||
| 10.3 | Employment Agreement dated December 21, 2007 between the Company and Dennis M. Oates | Incorporated herein by reference to Exhibit 10.7 to the Company’s Annual Report on Form 10-K for the year ended December 31, 2007.* | ||
| 10.4 | Employment Agreement dated February 21, 2008 between the Company and Paul A. McGrath | Incorporated herein by reference to Exhibit 10.4 to the Company’s Annual Report on Form 10-K for the year ended December 31, 2007.* | ||
| 10.5 | Employment Agreement dated July 12, 2010 between the Company and Douglas M. McSorley | Incorporated herein by reference to Exhibit 10.1 to the Company’s Current Report on Form 8-K dated July 19, 2010.* | ||
53
Table of Contents
| EXHIBIT NUMBER |
DESCRIPTION | |||
| 10.6 | Employment Agreement dated February 11, 2009 between the Company and William W. Beible, Jr. | Incorporated herein by reference to Exhibit 10.6 to the Company’s Annual Report on Form 10-K for the year ended December 31, 2008.* | ||
| 10.7 | Employment Agreement dated April 21, 2008 between the Company and Christopher M. Zimmer | Incorporated herein by reference to Exhibit 10.7 to the Company’s Annual Report on Form 10-K for the year ended December 31, 2010.* | ||
| 10.8 | Stock Incentive Plan | Incorporated herein by reference to Appendix A of the Company’s Definitive Proxy Statement dated April 19, 2010.* | ||
| 21.1 | Subsidiaries of Registrant | Filed herewith. | ||
| 23.1 | Consent of Schneider Downs & Co., Inc. | Filed herewith. | ||
| 24.1 | Powers of Attorney | Included on the signature page herein. | ||
| 31.1 | Certification of Chief Executive Officer pursuant to Rule 13a-14(a) and 15d-14(a), as adopted pursuant to Section 302 of the Sarbanes-Oxley Act of 2002 | Filed herewith. | ||
| 31.2 | Certification of Chief Financial Officer pursuant to Rule 13a-14(a) and 15d-14(a), as adopted pursuant to Section 302 of the Sarbanes-Oxley Act of 2002 |
Filed herewith. | ||
| 32.1 | Certification of Chief Executive Officer and Chief Financial Officer pursuant to Rule 18 U.S.C. Section 1350, as adopted pursuant to Section 906 of the Sarbanes-Oxley Act of 2002 | Filed herewith. | ||
| 101 | The following financial information from this Annual Report on Form 10-K for the fiscal year ended December 31, 2011, formatted in XBRL (Extensible Business Reporting Language) and furnished electronically herewith: (i) the Consolidated Balance Sheets as of December 31, 2011 and 2010; (ii) the Consolidated Statements of Operations for the years ended December 31, 2011, 2010 and 2009; (iii) the Consolidated Statements of Comprehensive Income (Loss) for the years ended December 31, 2011, 2010 and 2009; (iv) the Consolidated Statements of Cash Flows for the years ended December 31, 2011, 2010 and 2009; and (v) the Notes to Consolidated Financial Statements, tagged as blocks of text . | Filed herewith. | ||
* - Reflects management contract or compensatory plan or arrangement to be filed as an exhibit pursuant to Item 15(b) of this Annual Report on Form 10-K.
54
Table of Contents
SIGNATURES
Pursuant to the requirements of Section 13 or 15(d) of the Securities Exchange Act of 1934, the Registrant has duly caused this Report on Form 10-K to be signed on its behalf by the undersigned, thereunto duly authorized, on March 6, 2012.
| UNIVERSAL STAINLESS & ALLOY PRODUCTS, INC. | ||
| By: | /s/ Dennis M. Oates | |
| Dennis M. Oates | ||
| Chairman, President and Chief Executive Officer | ||
POWER OF ATTORNEY
Each of the officers and directors of Universal Stainless & Alloy Products, Inc., whose signature appears below in so signing also makes, constitutes and appoints Dennis M. Oates and Paul A. McGrath, and each of them acting alone, his true and lawful attorney-in-fact, with full power of substitution, for him in any and all capacities, to execute and cause to be filed with the SEC any and all amendment or amendments to this Report on Form 10-K, with exhibits thereto and other documents connected therewith and to perform any acts necessary to be done in order to file such documents, and hereby ratifies and confirms all that said attorney-in-fact, or his substitute or substitutes, may do or cause to be done by virtue hereof.
Pursuant to the requirements of the Securities Exchange Act of 1934, this Report has been signed below by the following persons on behalf of the Registrant in the capacities and on the dates indicated.
| SIGNATURE |
TITLE |
DATE | ||
| /s/ Dennis M. Oates Dennis M. Oates |
Chairman, President, Chief Executive Officer and Director (Principal Executive Officer) |
March 6, 2012 | ||
| /s/ Douglas M. McSorley Douglas M. McSorley |
Vice President of Finance, Chief Financial Officer and Treasurer (Principal Financial and Accounting Officer) |
March 6, 2012 | ||
| /s/ Christopher L. Ayers Christopher L. Ayers |
Director |
March 6, 2012 | ||
| /s/ Douglas M. Dunn Douglas M. Dunn |
Director |
March 6, 2012 | ||
| /s/ M. David Kornblatt M. David Kornblatt |
Director |
March 6, 2012 | ||
| /s/ Udi Toledano Udi Toledano |
Director |
March 6, 2012 | ||
55