Attached files
| file | filename |
|---|---|
| 8-K - FORM 8-K - SAFEWAY INC | a8-kx2012investorconference.htm |
| EX-99.1 - PRESS RELEASE DATED MARCH 6, 2012 OF SAFEWAY INC. - SAFEWAY INC | ex9918-kinvestorconference.htm |

Reconciliations and Financial Slides
from the Safeway Investor Conference
March 6, 2012
1
Safe Harbor Language
This presentation may contain forward-looking statements. Such statements may relate to topics such as sales, margins, earnings estimates, guidance, free cash flow, capital spending, and other related subjects.
These statements are based on Safeway's current plans and expectations and are subject to risks and uncertainties that could cause actual events and results to vary significantly from those implied by such statements. We ask you to refer to Safeway's reports and filings with the SEC for a further discussion of these risks and uncertainties.
2Reconciliation of Diluted EPS | ||||||||||
2011G | ||||||||||
2011 | Low | High | ||||||||
Diluted earnings per share | $ | 1.49 | $ | 1.45 | $ | 1.65 | ||||
Tax effect of Canadian dividend | 0.29 | 0.22 | 0.22 | |||||||
Diluted earnings per share, before Canadian dividend | $ | 1.78 | $ | 1.67 | $ | 1.87 | ||||
3Reconciliation of GAAP Cash Flow | |||||||||||||||||||||||||||||
Measure to Free Cash Flow * | |||||||||||||||||||||||||||||
(In Millions) | |||||||||||||||||||||||||||||
2011 Original Guidance | |||||||||||||||||||||||||||||
Low | High | 2011 | 2010 | 2009 | 2008 | 2007 | 2006 | 2005 | |||||||||||||||||||||
Net cash flow from operating activities | $ | 1,750 | $ | 1,850 | $ | 2,024 | $ | 1,850 | $ | 2,549 | $ | 2,251 | $ | 2,190 | $ | 2,175 | $ | 1,881 | |||||||||||
(Increase) decrease in payables related to third-party gift cards, net of receivables | — | — | (294 | ) | 7 | (170 | ) | (24 | ) | (84 | ) | (71 | ) | (48 | ) | ||||||||||||||
Interest earned on favorable income tax settlement, net of tax | — | — | — | — | — | — | — | (63 | ) | — | |||||||||||||||||||
Net cash flow from operating activities, as adjusted | 1,750 | 1,850 | 1,730 | 1,857 | 2,379 | 2,227 | 2,106 | 2,041 | 1,833 | ||||||||||||||||||||
Net cash flow used by investing activities | (1,000 | ) | (1,000 | ) | (1,015 | ) | (799 | ) | (889 | ) | (1,546 | ) | (1,686 | ) | (1,735 | ) | (1,314 | ) | |||||||||||
Cash used for investments and other business acquisitions | 36 | — | — | — | — | 50 | — | ||||||||||||||||||||||
Net cash flow used by investing activities, as adjusted | (1,000 | ) | (1,000 | ) | (979 | ) | (799 | ) | (889 | ) | (1,546 | ) | (1,686 | ) | (1,685 | ) | (1,314 | ) | |||||||||||
Free cash flow | $ | 750 | $ | 850 | $ | 751 | $ | 1,058 | $ | 1,490 | $ | 681 | $ | 420 | $ | 356 | $ | 519 | |||||||||||
Stock buyback | $ | 1,554 | $ | 621 | $ | 885 | $ | 360 | $ | 226 | $ | 318 | $ | — | |||||||||||||||
Dividends | $ | 188 | $ | 168 | $ | 153 | $ | 132 | $ | 112 | $ | 96 | $ | 45 | |||||||||||||||
Total cash returned | $ | 1,742 | $ | 789 | $ | 1,038 | $ | 492 | $ | 338 | $ | 414 | $ | 45 | |||||||||||||||
Percent of free cash flow | 232 | % | 75 | % | 70 | % | 72 | % | 80 | % | 116 | % | 9 | % | |||||||||||||||
* Free cash flow is calculated as (1) net cash flow from operating activities adjusted to exclude payables related to third-party gift cards, net of receivables, less (2) net cash flow used by investing activities adjusted to exclude cash used by investments and business acquisitions. Cash from the sale of third-party gift cards is held for a short period of time and then remitted, less our commission, to card partners. Because this cash flow is temporary, it is not available for other uses, and it is therefore excluded from our calculation of free cash flow. We add back cash used by investments and business acquisitions to our calculation of free cash flow in order to provide a more accurate indication of our capacity to apply our available free cash flow to its intended uses. No forecast was made for these items. | |||||||||||||||||||||||||||||
4Reconciliation of GAAP Cash Flow | ||||||||||||||||||||||||||||||||||
Measure to Free Cash Flow | ||||||||||||||||||||||||||||||||||
(In Millions) | ||||||||||||||||||||||||||||||||||
2012F | 2013F | 2014F | 2015F | 2016F | ||||||||||||||||||||||||||||||
Low | High | Low | High | Low | High | Low | High | Low | High | |||||||||||||||||||||||||
Net cash flow from operating activities | $ | 1,700 | $ | 1,800 | $ | 1,900 | $ | 2,000 | $ | 2,000 | $ | 2,100 | $ | 2,100 | $ | 2,200 | $ | 2,200 | $ | 2,300 | ||||||||||||||
Net cash used by investing activities | (850 | ) | (850 | ) | (900 | ) | (900 | ) | (900 | ) | (900 | ) | (900 | ) | (900 | ) | (900 | ) | (900 | ) | ||||||||||||||
Free cash flow | $ | 850 | $ | 950 | $ | 1,000 | $ | 1,100 | $ | 1,100 | $ | 1,200 | $ | 1,200 | $ | 1,300 | $ | 1,300 | $ | 1,400 | ||||||||||||||
5Reconciliation of Operating Profit Margin BP Change | |||||||||||||||||||||||||||||||||
Excluding Fuel, Gross Presentation of Gift Card Commissions, Unusual Items and LIFO charge for 2011 | |||||||||||||||||||||||||||||||||
Basis point (decrease) increase over prior year: | |||||||||||||||||||||||||||||||||
2011 | |||||||||||||||||||||||||||||||||
2012G | Original Guidance | ||||||||||||||||||||||||||||||||
Low | High | Low | High * | 2011 | 2010 | 2009 | 2008 | 2007 | 2006 | 2005 | |||||||||||||||||||||||
Basis point change in operating profit margin | (12 | ) | (2 | ) | 3 | NM | (22 | ) | 436 | (574 | ) | 1 | 21 | 82 | (11 | ) | |||||||||||||||||
Unusual items: | |||||||||||||||||||||||||||||||||
Texas store closures | (29 | ) | 29 | ||||||||||||||||||||||||||||||
Goodwill impairment charges | (483 | ) | 483 | ||||||||||||||||||||||||||||||
Impairment charges | (13 | ) | |||||||||||||||||||||||||||||||
Labor buyout and health and welfare contributions | (15 | ) | 7 | ||||||||||||||||||||||||||||||
Stock option expense | 15 | ||||||||||||||||||||||||||||||||
Impact from gross presentation of gift card commissions | 5 | ||||||||||||||||||||||||||||||||
Fuel impact | 7 | 7 | (3 | ) | (3 | ) | 9 | (3 | ) | (4 | ) | (1 | ) | 4 | 15 | 6 | |||||||||||||||||
Basis point change in operating profit margin, excluding fuel and unusual items | (5 | ) | 5 | — | NM | (8 | ) | (50 | ) | (95 | ) | — | 25 | 53 | 33 | ||||||||||||||||||
LIFO charge | 16 | ||||||||||||||||||||||||||||||||
Basis point change in operating profit margin, excluding fuel, unusual items and LIFO charge | 8 | ||||||||||||||||||||||||||||||||
* Basis point change not specified. | |||||||||||||||||||||||||||||||||
6Reconciliation of Net Cash Flow from Operating Activities to Adjusted EBITDA | |||||||||||||||||||||||||||||||||||
(dollars in millions) | |||||||||||||||||||||||||||||||||||
2011 | 2010 | 2009 | 2008 | 2007 | 2006 | 2005 | 2004 | 2003 | |||||||||||||||||||||||||||
Net cash flow from operating activities | $ | 2,023.6 | $ | 1,849.7 | $ | 2,549.7 | $ | 2,250.9 | $ | 2,190.5 | $ | 2,175.0 | $ | 1,881.0 | $ | 2,226.4 | $ | 1,609.6 | |||||||||||||||||
Add (subtract): | |||||||||||||||||||||||||||||||||||
Income taxes | 363.9 | 290.6 | 144.2 | 539.3 | 515.2 | 369.4 | 287.9 | 233.7 | 310.9 | ||||||||||||||||||||||||||
Interest expense | 272.2 | 298.5 | 331.7 | 358.7 | 388.9 | 396.1 | 402.6 | 411.2 | 442.4 | ||||||||||||||||||||||||||
Amortization of deferred finance costs | (5.4 | ) | (4.8 | ) | (4.8 | ) | (5.1 | ) | (5.3 | ) | — | — | — | — | |||||||||||||||||||||
Excess tax benefit from exercise of stock options | 1.8 | 1.6 | 0.1 | 1.5 | 38.3 | — | — | — | — | ||||||||||||||||||||||||||
Deferred income taxes | 63.7 | 31.3 | 142.1 | (171.7 | ) | (130.8 | ) | (1.1 | ) | 215.9 | 29.2 | 77.9 | |||||||||||||||||||||||
Net pension and post-retirement benefits expense | (114.3 | ) | (125.2 | ) | (140.1 | ) | (96.7 | ) | (72.1 | ) | (83.1 | ) | (115.6 | ) | (112.9 | ) | (130.9 | ) | |||||||||||||||||
Contributions to pension and post-retirement benefit plans | 176.2 | 17.7 | 24.4 | 42.5 | 33.0 | 29.2 | 18.1 | 15.1 | 12.1 | ||||||||||||||||||||||||||
(Increase) decrease in accrued claims and other liabilities | (23.2 | ) | (36.2 | ) | 34.3 | (21.1 | ) | 5.8 | (10.8 | ) | (44.1 | ) | (118.1 | ) | (52.7 | ) | |||||||||||||||||||
Gain (loss) on property dispositions and lease exit activities | 65.6 | 27.5 | (12.7 | ) | 19.0 | 42.3 | 17.8 | (13.6 | ) | (20.6 | ) | 13.4 | |||||||||||||||||||||||
Changes in working capital items | (385.8 | ) | 67.9 | (426.7 | ) | 226.0 | (45.6 | ) | (181.4 | ) | (310.9 | ) | (538.2 | ) | 263.0 | ||||||||||||||||||||
Other | (13.8 | ) | 6.6 | (20.9 | ) | 3.1 | (6.9 | ) | (4.1 | ) | (14.4 | ) | (14.5 | ) | (8.2 | ) | |||||||||||||||||||
Total Adjusted EBITDA | 2,424.5 | 2,425.2 | $ | 2,621.3 | $ | 3,146.4 | $ | 2,953.3 | $ | 2,707.0 | $ | 2,306.9 | $ | 2,111.3 | $ | 2,537.5 | |||||||||||||||||||
7Reconciliation of Net Income (Loss) Attributable to Safeway Inc. to Adjusted EBITDA (Interest Coverage) | |||||||||||||||||||||||||||
(dollars in millions) | |||||||||||||||||||||||||||
2011 | 2010 | 2009 | 2008 | 2007 | 2006 | 2005 | 2004 | 2003 | |||||||||||||||||||
Net income (loss) attributable to Safeway Inc. | $ | 516.7 | $ | 589.8 | $ | (1,097.5 | ) | $ | 965.3 | $ | 888.4 | $ | 870.6 | $ | 561.1 | $ | 560.2 | $ | (169.8 | ) | |||||||
Add (subtract): | |||||||||||||||||||||||||||
Income taxes | 363.9 | 290.6 | 144.2 | 539.3 | 515.2 | 369.4 | 287.9 | 233.7 | 310.9 | ||||||||||||||||||
Interest expense | 272.2 | 298.5 | 331.7 | 358.7 | 388.9 | 396.1 | 402.6 | 411.2 | 442.4 | ||||||||||||||||||
Depreciation expense | 1,148.8 | 1,162.4 | 1,171.2 | 1,141.1 | 1,071.2 | 991.4 | 932.7 | 894.6 | 863.6 | ||||||||||||||||||
LIFO expense (income) | 35.1 | (28.0 | ) | (35.2 | ) | 34.9 | 13.9 | 1.2 | (0.2 | ) | (15.2 | ) | (1.3 | ) | |||||||||||||
Share-based employee compensation | 50.0 | 55.5 | 61.7 | 64.3 | 48.4 | 51.2 | 59.7 | — | — | ||||||||||||||||||
Property impairment charges | 44.7 | 71.7 | 73.7 | 40.3 | 27.1 | 39.2 | 78.9 | 39.4 | 344.9 | ||||||||||||||||||
Miscellaneous equity investment impairment charge | — | — | — | — | — | — | — | — | 10.6 | ||||||||||||||||||
Goodwill impairment charges | — | — | 1,974.2 | — | — | — | — | — | 729.1 | ||||||||||||||||||
Equity in (earnings) losses of unconsolidated affiliate | (13.0 | ) | (15.3 | ) | (8.5 | ) | 2.5 | (8.7 | ) | (21.1 | ) | (15.8 | ) | (12.6 | ) | 7.1 | |||||||||||
Dividend received from unconsolidated affiliate | 6.1 | — | 5.8 | — | 8.9 | 9.0 | — | — | — | ||||||||||||||||||
Total Adjusted EBITDA | $ | 2,424.5 | $ | 2,425.2 | $ | 2,621.3 | $ | 3,146.4 | $ | 2,953.3 | $ | 2,707.0 | $ | 2,306.9 | $ | 2,111.3 | $ | 2,537.5 | |||||||||
Adjusted EBITDA as a multiple of interest expense | 8.9x | 8.1x | 7.9x | 8.8x | 7.6x | 6.8x | 5.7x | 5.1x | 5.7x | ||||||||||||||||||
8Reconciliation of Gross Margin BP Change | |||||||||||||||||
Excluding Fuel, Gross Presentation of Gift Card Commissions and LIFO | |||||||||||||||||
Basis point (decrease) increase over prior year: | |||||||||||||||||
2011 | 2010 | 2009 | 2008 | 2007 | 2006 | ||||||||||||
Basis point change in gross margin | (125 | ) | (34 | ) | 24 | (36 | ) | (8 | ) | (11 | ) | ||||||
Fuel | 80 | 27 | (59 | ) | 10 | 20 | 28 | ||||||||||
Impact from gross presentation of gift card commissions | 32 | — | — | — | — | — | |||||||||||
Basis point change in gross margin, excluding fuel and gross presentation of gift card commissions | (13 | ) | (7 | ) | (35 | ) | (26 | ) | 12 | 17 | |||||||
LIFO | 16 | 2 | (18 | ) | 5 | 3 | — | ||||||||||
Basis point change in gross margin, excluding fuel, gross presentation of gift card commissions and LIFO | 3 | (5 | ) | (53 | ) | (21 | ) | 15 | 17 | ||||||||
9Reconciliation of Operating & Administrative Expense BP Change | |||||||||||||||||||||
Excluding Fuel, Gross Presentation of Gift Card Commissions and Unusual Items | |||||||||||||||||||||
Basis point (decrease) increase over prior year: | |||||||||||||||||||||
2011 | 2010 | 2009 | 2008 | 2007 | 2006 | 2005 | |||||||||||||||
Basis point change in operating & administrative expense | (102 | ) | 12 | 116 | (38 | ) | (29 | ) | (93 | ) | (53 | ) | |||||||||
Unusual items: | |||||||||||||||||||||
Texas store closures | 29 | (29 | ) | ||||||||||||||||||
Impairment charges | 13 | ||||||||||||||||||||
Labor buyout and health and welfare contributions | 15 | (7 | ) | ||||||||||||||||||
Stock option expense | (15 | ) | |||||||||||||||||||
Impact from gross presentation of gift card commissions | 28 | ||||||||||||||||||||
Fuel impact | 69 | 31 | (56 | ) | 11 | 16 | 13 | 32 | |||||||||||||
Basis point change in operating & administrative expense, excluding fuel, gross presentation of gift card commissions and unusual items | (5 | ) | 43 | 60 | (27 | ) | (13 | ) | (36 | ) | (59 | ) | |||||||||
10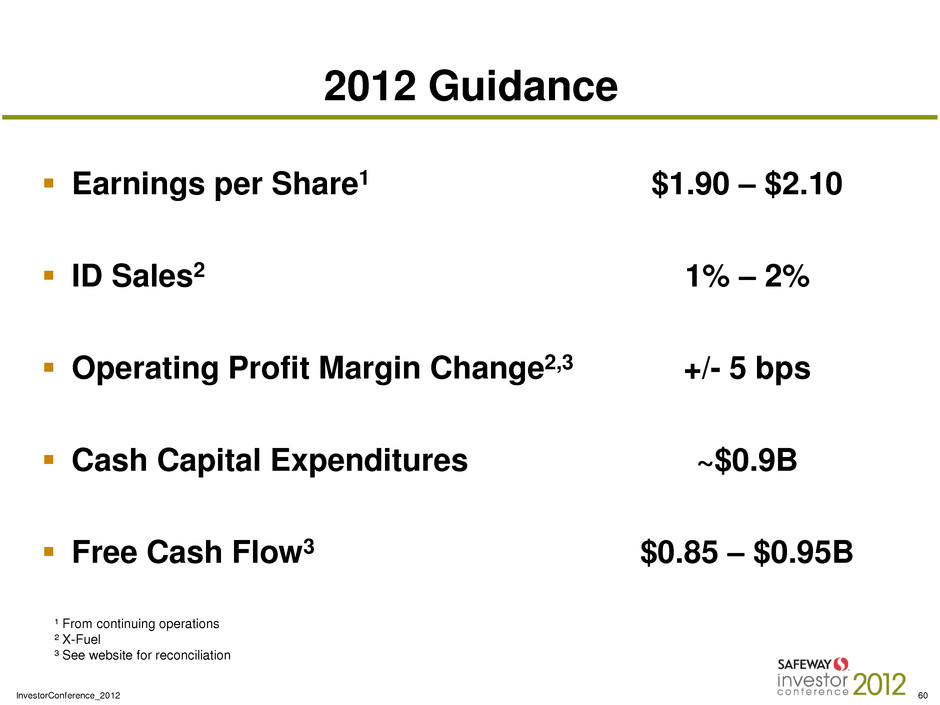 11
11 12
12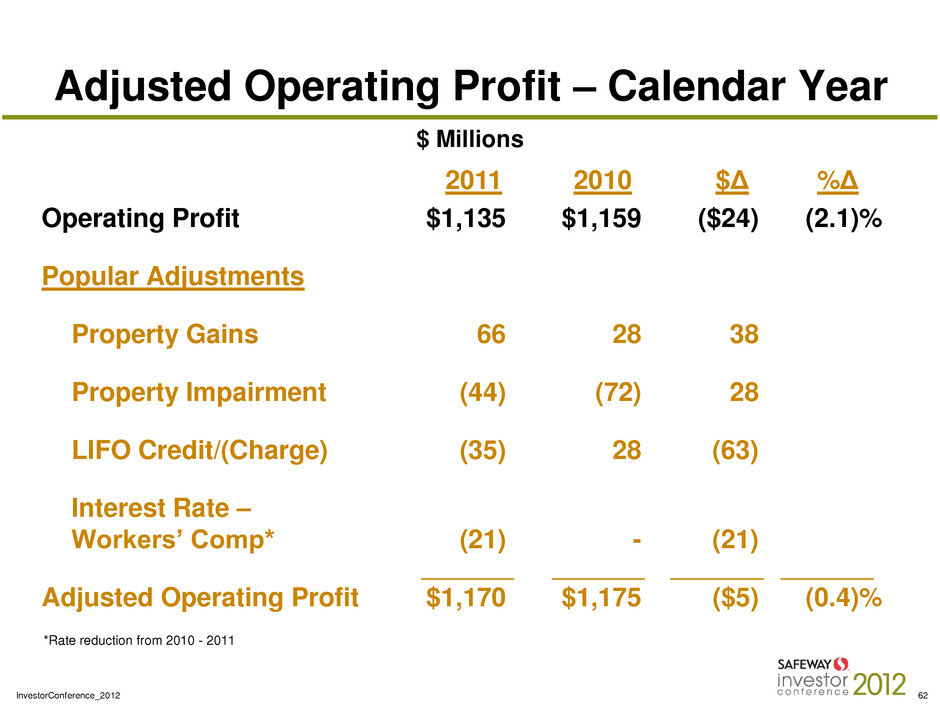 13
13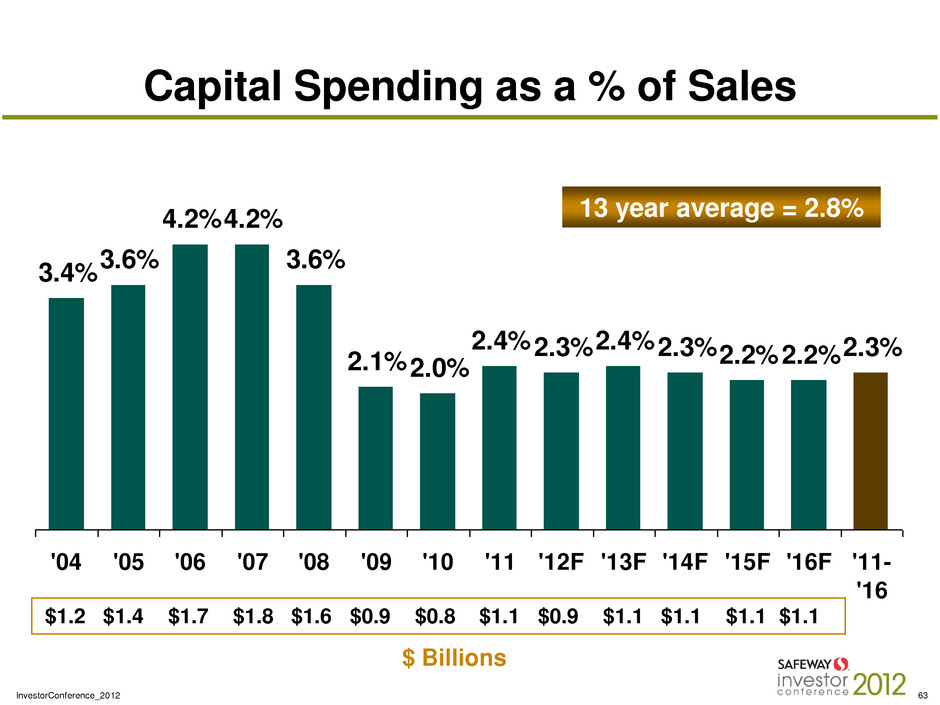 14
14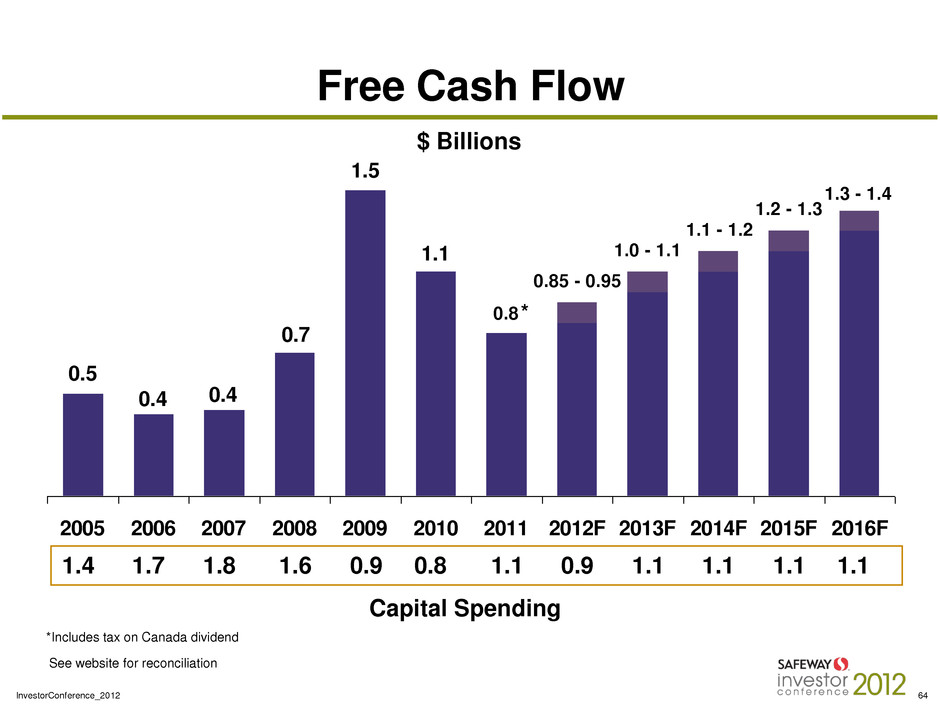 15
1516