Attached files
| file | filename |
|---|---|
| 8-K - 8-K - Essex Rental Corp. | v304743_8-k.htm |
Essex Rental Corp
ISI Annual Industrial Conference March 6, 2012
Importance Notice
This document does not constitute an offer to sell or a solicitation of an offer to buy any securities. It is an outline of matters for discussion only.
Some of the statements in this presentation and other written and oral statements made from time to time by the Company and its representatives -looking statements” within the meaning of Section 27A are “forward d Section 21E of the Securities Exchange Act of 1934, as amended. These statements include statements regarding the intent and belief or current expectations of Essex and its management team and may be identified by the use of words like "anticipate", "believe", "estimate", "expect", "intend", "may", "plan", "will", "should", "seek", the negative of these terms or other comparable terminology. Investors are cautioned that any such forward-looking statements are not guarantees of future performance and involve risks and uncertainties, and that actual results may differ materially from those projected in the forward-looking statements. Important factors that could cause actual results to differ materially from Essex’s expectations fully execute itsinclude, business plan, the possibility of a change in demand for the products and services that Essex provides, intense competition which may require us to lower prices or offer more favorable terms of sale, our reliance on third party suppliers, our indebtedness which could limit our operational and financial flexibility, global economic factors including interest rates, general economic conditions, geopolitical events and regulatory changes, our dependence on our management team and key personnel, as well as other relevant risks detailed in our Annual Report on Form 10-K/A and subsequent periodic reports filed with the Securities and Exchange Commission and available on our website, www.essexrentalcorp.com. The factors listed here are not exhaustive. Many of these uncertainties and risks are difficult to predict and beyond management’s -looking statements are not guarantees of future performance, results orcontrol. Forward events. Essex assumes no obligation to update or supplement forward-looking information in this presentation whether to reflect changed assumptions, the occurrence of unanticipated events or changes in future operating results or financial conditions, or otherwise.
| This presentation contains unaudited non-GAAP financial measures, including Total EBITDA, and EBITDA before Rental Equipment Sales. | |
| Management believes that the presentation of these non-GAAP financial measures serves to enhancedual | |
| operating and financial performance. These non-GAAP financial measures should be considered in addition to, but not as substitutes for, | |
| the most directly comparable U.S. GAAP measures. A reconciliation of Total EBITDA and EBITDA before Rental Equipment Sales to income | |
| from operations for the three and nine month periods ended September 30, 2011 can be found in Essex’s Current8-K | Report |
| filed with the Securities and NovemberExchange9, 2011. Commission (the “SEC”) | on |
| We believe the non-Company information provided herein is reliable, as of the date hereof, but do not warrant its accuracy or | |
| completeness. In preparing these materials, we have relied upon and assumed, without independent verification, the accuracy and | |
| completeness of all information available from public sources. Except as required by law, the Company, Essex and their respective | |
| directors, officers, employees, agents and consultants make no representation or warranty as to the accuracy or completeness of the non- | |
| Company information contained in this document, and take no responsibility under any circumstances for any loss or damage suffered as | |
| a result of any omission, inadequacy, or inaccuracy in this document. | |
| The Company does not guaranty the performance or return of capital from investments. | |
| ©2011 Essex Rental Corp. |
1
Introduction
Introduction
• Laurence S. Levy, Chairman
• Chairman of Hyde Park Holdings, an investment firm specializing in private equity investments since 1986
• History of acquiring and building businesses, primarily in the logistics and infrastructure market
• Ronald Schad, President, Chief Executive Officer, Directo
• President & CEO of Essex Crane since 2000
• 15 years with Manitowoc Crane Group, including Executive Vice President and General Manager of the Crane Group responsible for over $350 miles in sales
• Martin Kroll, Chief Financial Officer & Senior Vice President
• CFO & Senior Vice President of Essex Crane since May 2001
• Over 25 years of CFO/Operations experience in middle-market manufacturing and service companies (Outokumpu Copper Group and American Brass)
• 8 years with PricewaterhouseCoopers LLP (Certified Public Accountant)
• Edward Levy, Vice Chairman
• 6 years of actively managing a private equity fund for CIBC
• History of acquiring and building middle-market businesses
• Management and Directors collectively own approximately 30% of the Company
Essex Rental Corp.
• Leading provider of heavy lifting equipment solutions to the infrastructure and construction industry
• Acquisition of Coast Crane Company in November 2010 increased the Company’s geographic footprint, product offerings and lines of business, and diversified its earnings stream
• Focused on bare rental of construction lifting equipment with over 1,000 pieces of equipment and attachments
• Rental fleet has an Orderly Liquidation Value (“OLV”)in excess of $350 million
• Highly diversified end markets served across a national footprint

Integrated Business Model
Geographic & End Market Diversity
Significant Asset Value
Return on Capital Business Model
3 Primary Growth Drivers
Investment Highlights
| Rental | Multi faceted offering of diverse lifting needs | ||
| New and Used Sales | Multiple lines of business driving growth | ||
| Parts and Service | Cyclical “earnings |
| • | 22 locations in 12 states and Canada |
| • | Serve a broad array of end markets, with no exposure to a single industry or geography |
| • | Significant focus on infrastructure and energy-related end markets |
| • | Appraised OLV fleet value of over $350 million as of 9/30/11 |
| • | Replacement value of approximately $600 million |
| • | Focus on long economic lived assets |
| • | High residual value relative to original cost |
| • | Attractive ROIC business model due to efficient conversion of EBITDA to free cash flow |
| • | Rental equipment |
| • | New and used equipment sales |
| • | Parts and services support |

2
Company Overview
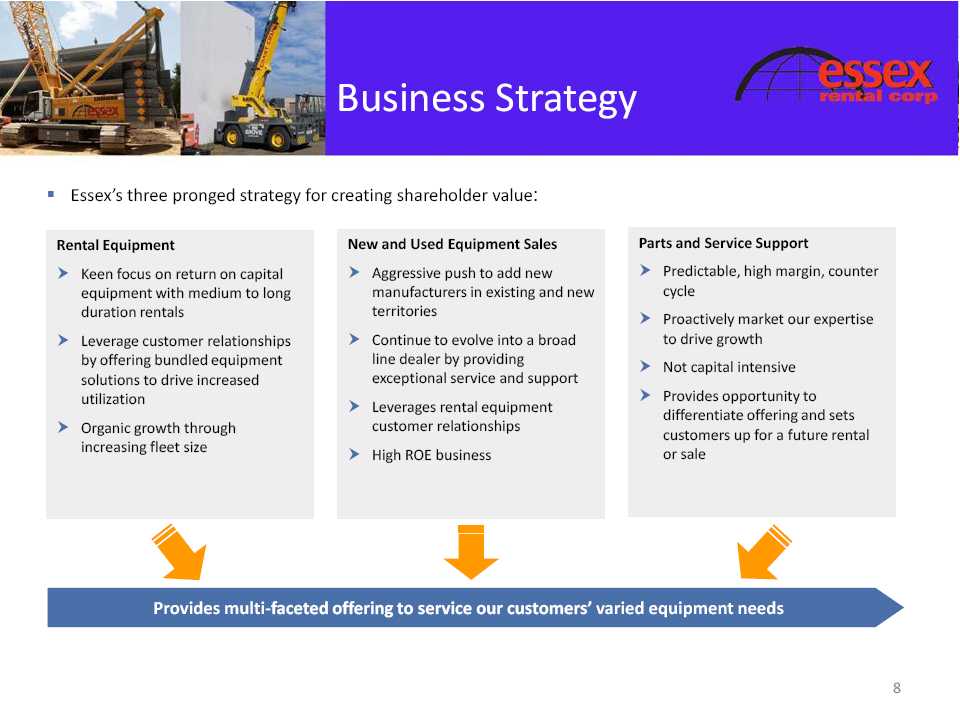
Business Strategy
Essex’s three pronged strategy for creating shareholder value:
Rental Equipment
| • | Keen focus on return on capital equipment with medium to long duration rentals |
| • | Leverage customer relationships by offering bundled equipment solutions to drive increased utilization |
| • | Organic growth through increasing fleet size |
New and Used Equipment Sales
Aggressive push to add new manufacturers in existing and new territories Continue to evolve into a broad line dealer by providing exceptional service and support Leverages rental equipment customer relationships High ROE business
Parts and Service Support
| • | Predictable, high margin, counter cycle |
| • | Proactively market our expertise to drive growth |
| • | Not capital intensive |
| • | Provides opportunity to differentiate offering and sets customers up for a future rental or sale |
Provides multi-faceted offering to service our customers’ varied equipment needs

Rental Fleet Summary
Return on Capital
vs.
Return of Capital
Fleet Employs Long Lived Assets
| Asset Depreciation (1) Benchmark: Residual Value vs. Lifespan | |||||||||
| 90 | % | ||||||||
| ESSEX | |||||||||
| 80 | % | ||||||||
| Crawler Crane | |||||||||
| 70 | % | Coast Crane | |||||||
| Tower Crane | |||||||||
| 60 | % | Scotsman rental | Mobile Mini | ||||||
| Skidsteer Loader equipment (North | storage units | ||||||||
| America) Mobile Mini (steel) | |||||||||
| Tractor Loader | |||||||||
| 50 | % | storage units | |||||||
| Forklift Crane | (wood) | ||||||||
| 40 | % | Backhoe Rough terrain cranes | |||||||
| Excavator Boom Trucks | |||||||||
| 30 | % | Roller | Boom Lift | ||||||
| Scissor Lift | |||||||||
| 20 | % | Van trailers | |||||||
| Scotsman rental | |||||||||
| 10 | % | All terrain cranes | equipment | ||||||
| Hospital | |||||||||
| equipment | (Europe) | ||||||||
| 0 | % | ||||||||
| 0 | 5 | 10 | 15 | 20 | 25 | 30 | 35 | ||
| Rental Lifespan (years) | |||||||||
| Denotes classes of equipment owned by Essex Crane/Coast | 10 | ||||||||
| Crane | |||||||||
National Footprint
| • | Continue to leverage the Essex and Coast brands in the territories in which they are strongest, yet achieve the benefits of geographic and product diversity: |
Essex Rental Corp. 2011 Rental Revenues by End Market
| Crane Type | Crawler | Rough Terrain (RTs) | Self Erecting Tower | Tower | Boom Truck | Carry Deck | ||||||||||||||
| Sales Channel | Rental & Distribution | Rental & Distribution | Rental & Distribution | Rental & Distribution | Rental & Distribution | Rental & Distribution | ||||||||||||||
| Max. Lift Cap. (tons) | 3,000 | + | 150 | 9 | 80 | 50 | + | 18 | ||||||||||||
| Max. Reach Cap. | 700 | + | 250 | 165 | 350 | 200 | 80 | |||||||||||||
| (ft.) | ||||||||||||||||||||
| Price New ($ | $ | 800 -$5,000 (1) | $ | 250 -$1,500 | $ | 150 -$500 | $ | 300 -$1,000 | $ | 100 -$600 | $ | 100 - $250 | ||||||||
| ‘ | 000 | ) | ||||||||||||||||||
| Avg. Life (years) | 50 | + | 20 | + | 20 | + | 30 | + | 15 | + | 15 | + | ||||||||
| Rental Duration | Long-term | Short-medium term | Short-medium term | Long-term | Short-term | Short-medium term | ||||||||||||||
| Key End Markets | Highways, large bridges, | Highways, large bridges, | Public infrastructure | Nuclear power | Petrochemical | Highways, large bridges, | ||||||||||||||
| railroads | railroads | (stadiums, garages) | Sewer / water treatment | Oil & Gas | railroads | |||||||||||||||
| Public infrastructure | Public infrastructure | Sewer / water treatment | High rise (>10 story) | Railroads | Public infrastructure | |||||||||||||||
| (stadiums, garages) | (stadiums, garages) | Office Towers | Power generation | |||||||||||||||||
| Office Towers | Highways | |||||||||||||||||||
| Power generation | Power generation | Condominiums | Sewer / water | |||||||||||||||||
| Condominiums | Public Utilities | |||||||||||||||||||
| Sewer / water treatment | Sewer / water treatment | Apartment Buildings | Petrochemicals | |||||||||||||||||
| Apartment Buildings | Condominiums | |||||||||||||||||||
| Petrochemicals | Petrochemicals | Industrial / marine | ||||||||||||||||||
| Apartment Buildings | ||||||||||||||||||||
| Industrial / marine | Industrial / marine | Commercial & Residential | ||||||||||||||||||
| Other Residential | ||||||||||||||||||||
| Commercial & Residential | ||||||||||||||||||||
| % of total OLV Fleet | 70 | % | 13 | % | 2 | % | 7 | % | 5 | % | 1 | % | ||||||||
| Value | (2 | ) | ||||||||||||||||||
| Note | (1 | ): | Crawler crane -liftpricesniche. Light and superreflectheavy-lift crawlermodelscranes can rangeinfrom $0.Essex’s5 million to over $35 heavymillion. | |||||||||||||||||
| Note (2): The remaining fleet value not accounted for in this fleet summary is comprised primarily of forklifts and aerial work platforms. | 9 | |||||||||||||||||||
Essex Rental Corp. End Markets
New & Used
Equipment Sales
§ New and used equipment sales segment provides a countercyclical balance to rental business segment.
New Equipment Sales
| • | Distribution agreements signed with Terex, Manitex, Broderson, Mantis, Tadano and Potain: |
| • | Each agreement includes distribution to several states, British Columbia, the Yukon, Guam and Republic of the Marshall Islands. |
Rental Equipment Sales
| • | Continue to rebalance the Essex crawler crane fleet by selling $20M of older underutilized cranes |
| • | Near term opportunity to divest shorter economic life assets that were acquired as part of the Coast fleet |
| • | Emphasize-to-sell a ―rentbusiness model by selecting appropriate equipment offering for customers not prepared to buy new. |
Market Indicators
| • | Nonresidential building construction spending is expected to grow 12%, 23% and 22% in 2012, 2013 and 2014, respectively as reported by McGraw-Hill (1). |
(1) Source: Sneak Peak Third Quarter 2011
Current Business
Initiatives
| • | The Company is pursuing a number of business initiatives to improve return on invested capital, including; |
Asset Rebalancing
| • | Dispose of approximately $20 million of older under utilized crawler crane assets |
| • | Divest short economic life assets that were acquired as part of the Coast acquisition but do not fit our return on capital business philosophy |
Asset Utilization
| • | Drive utilization on approximately $24 million of new equipment purchased during 2011 |
Earnings Improvements
| • | Aggressively manage Coast operation to capitalize on meaningful profit opportunities |
| • | Increase rental rates in certain asset classes with high utilization |
3
Summary Financial
Information and Valuation
Summary Financial Information
| December 31 Year End | Historical Audited | Unaudited | |||||||||||||||||||
| (USD $000's) | 2006 | 2007 | 2008 | (5) | 2009 | 2010 | (6) | 9M’ 11 (7) 3Q’11 | |||||||||||||
| Total Revenue before Rental Equipment Sales (2) | $ | 55,659 | $ | 64,532 | $ | 76,888 | $ | 45,606 | $ | 37,276 | $ | 63,874 | $ | 22,233 | |||||||
| Operating Expenses | (20,960 | ) | (23,322 | ) | (27,789 | ) | (16,106 | ) | (19,128 | ) | (38,936 | ) | (13,582 | ) | |||||||
| Gross Profit | 34,699 | 41,210 | 54,099 | 29,500 | 18,148 | 24,938 | 8,651 | ||||||||||||||
| SG&A | (8,732 | ) | (9,112 | ) | (12,498 | ) | (10,547 | ) | (12,965 | ) | (21,154 | ) | (6,615 | ) | |||||||
| One-time Transaction Costs (3) | - | - | (5,200 | ) | - | - | - | - | |||||||||||||
| EBITDA before Rental Equipment Sales | 25,967 | 32,098 | 36,401 | 18,953 | 5,183 | 3,784 | 2,036 | ||||||||||||||
| EBITDA before Rental Equipment Sales Margin (%) | 46.7 | % | 49.7 | % | 47.3 | % | 41.6 | % | 13.9 | % | 5.9 | % | 9.2 | % | |||||||
| Gain On Sale of Rental Equipment | 3,007 | 6,049 | 3,814 | 893 | 704 | 544 | 245 | ||||||||||||||
| Total EBITDA | 28,974 | 38,147 | 40,215 | 19,846 | 5,887 | 4,328 | 2,281 | ||||||||||||||
| Rental Equipment Sale Proceeds | 5,980 | 13,233 | 8,440 | 6,478 | 4,256 | 3,242 | 1,051 | ||||||||||||||
| Revenue + Rental Equipment Sale Proceeds | 61,639 | 77,765 | 85,328 | 52,084 | 41,531 | 67,115 | 23,284 | ||||||||||||||
| Total EBITDA Margin % | 47.0 | % | 49.1 | % | 47.1 | % | 38.1 | % | 14.2 | % | 6.4 | % | 9.8 | % | |||||||
| Maintenance Capital Expenditure | (512 | ) | (724 | ) | (2,375 | ) | (1,014 | ) | (755 | ) | (1,259 | ) | (520 | ) | |||||||
| Discretionary Crane Investment | (6,004 | ) | (18,784 | ) | (21,153 | ) | (20,041 | ) | (2,633 | ) | (14,086 | ) | (9,539 | ) | |||||||
| Average Crawler Crane Utilization Rate (4) | 68.9 | % | 72.1 | % | 72.7 | % | 43.6 | % | 37.5 | % | 40.3 | % | 39.5 | % | |||||||
| Average Monthly Crawler Crane Rental Rate ($000's) | $ | 13.8 | $ | 16.3 | $ | 21.4 | $ | 21.1 | $ | 16.4 | $ | 15.6 | $ | 15.9 | |||||||
Notes:
| 1. | Source: Essex |
| 2. | Total Rental Related Revenues excludes used rental equipment sales. |
| 3. | 2008 financial information includes $5.2 million of one-time non-recurring transaction costs incurred related to Essex Rental Corp’s(formerly Hyde Park Acquisition Corp.) acquisition of Essex Crane Rental. |
| 4. | Based on ―days method utilization. |
| 5. | 2008 financial information excludes the impact of the $23.9 million goodwill impairment charge recorded in the fourth quarter of 2008. |
| 6. | 2010 financial information includes $5.0 million in revenue excluding rental equipment sales and $0.3 million in EBITDA generated from the acquisition of Coast Crane during the |
period of 11/24/10 to 12/31/10.
17
| 7. | 2011 financial information includes $1.0 million of one-time non-recurring expenses in Selling, General and Administrative expenses related to the acquisition of Coast Crane and related integration through September 30, 2011. |
| Average Rental Rate and | ||||||||||||
| Utilization Statistics | ||||||||||||
| Three Months Ended September 30, | Nine Months Ended September 30, | |||||||||||
| 2011 | 2010 | 2011 | 2010 | |||||||||
| Average Crawler Crane rental rate per month | $ | 15,868 | $ | 16,137 | $ | 15,577 | $ | 16,690 | ||||
| Utilization Statistics - "Days" Utilization | ||||||||||||
| Crawler Cranes | 39.5 | % | 40.2 | % | 40.3 | % | 35.1 | % | ||||
| Rough Terrain Cranes | 63.2 | % | N/A | 66.3 | % | N/A | ||||||
| Boomtrucks | 60.3 | % | N/A | 54.1 | % | N/A | ||||||
| Self-Erecting Tower Cranes | 29.4 | % | N/A | 23.1 | % | N/A | ||||||
| City & Other Tower Cranes | 37.5 | % | N/A | 41.2 | % | N/A | ||||||
| Forklifts and Other Equipment | 41.6 | % | N/A | 40.1 | % | N/A | ||||||
| (See definitions
in the quarterly and |
||||||||||||
Capitalization

Credit Facilities Snapshot
| • | Essex Rental Corp. Total consolidated debt outstanding of $218.9 million as of September 30, 2011. |
| • | Essex Crane Rental Corp. |
| • | Total debt outstanding (9/30/11): $157.7 million |
| • | Revolving Credit Facility: |
| • | $157.7 million outstanding as of September 30, 2011 |
| • | $190 million facility size |
| • | 5-year facility |
| • | Libor plus 225 bps |
| • | 2 financial covenants (only become effective if availability is below $20 million) |
| • | Availability under facility of $29.5 million as of September 30, 2011 |
| • | Coast Crane |
| • | Total debt outstanding (9/30/11): $56.2 million |
| • | U.S. Revolving Credit Facility: |
| • | $51.7 million outstanding as of September 30, 2011 |
| • | $75 million facility size |
| • | 4-year facility |
| • | Libor plus 375 bps (Libor floor of 150 bps) |
| • | Availability under facility of $8.9 million as of September 30, 2011 |
Investment Summary
| • | Market leader with significant operating leverage |
| • | Utilization in certain asset classes is increasing and rental rates have bottomed |
| • | Management and Board of Directors represent ownership in excess of 30% of common shares outstanding |
| • | Return on capital business model with high conversion rate of EBITDA to free cash flow |
| • | Poised to participate in growing infrastructure & energy related markets as economy recovers….companies are beginning to make long term decisions again |
| • | Numerous organic and strategic growth opportunities |
| • | Sound capital structure including attractive, flexible debt facilities |