Attached files
| file | filename |
|---|---|
| 8-K - FORM 8-K - CEDAR REALTY TRUST, INC. | d310845d8k.htm |
| EX-99.1 - EXHIBIT 99.1 - CEDAR REALTY TRUST, INC. | d310845dex991.htm |
Exhibit 99.2

Supplemental Financial Information
December 31, 2011
(unaudited)
Cedar Realty Trust, Inc.
44 South Bayles Avenue
Port Washington, NY 11050-3765
Tel: (516) 767-6492 Fax: (516) 767-6497
www.cedarrealtytrust.com
CEDAR REALTY TRUST, INC.
Supplemental Financial Information
December 31, 2011
(unaudited)
TABLE OF CONTENTS
| Consolidated Financial Information |
||
| Consolidated Balance Sheets |
3 | |
| Consolidated Statements of Operations |
4 | |
| Supporting Schedules to Consolidated Statements |
5 - 6 | |
| Funds from Operations and Additional Disclosures |
7 | |
| Earnings Before Interest, Taxes, Depreciation and Amortization |
8 | |
| Summary of Outstanding Debt |
9-10 | |
| Summaries of Debt Maturities |
11 | |
| Consolidated Operating Portfolio Information |
||
| Real Estate Summary |
12-14 | |
| Leasing Activity |
15 | |
| Tenant Concentration |
16 | |
| Lease Expirations |
17 | |
| Property Net Operating Income |
18 | |
| Significant 2011 Acquisitions and Dispositions |
19 | |
| Unconsolidated Cedar/RioCan Joint Venture |
||
| Combined Balance Sheets |
21 | |
| Combined Statements of Operations |
22 | |
| Real Estate Summary |
23 | |
| Summary of Outstanding Debt |
24 | |
| Summary of Debt Maturities |
25 | |
| Significant 2011 Acquisitions and Dispositions |
26 | |
| Properties Held for Sale/Conveyance |
||
| Real Estate Summary |
28 | |
| Summary of Outstanding Debt |
29 | |
| Summary of Debt Maturities |
30 | |
| Portfolio Map |
31 | |
| Non-GAAP Financial Disclosures |
32 | |
Forward-Looking Statements
The information contained in this Supplemental Financial Information is unaudited and does not purport to disclose all items required by accounting principles generally accepted in the United States (“GAAP”). In addition, statements made or incorporated by reference herein may include certain “forward-looking statements” within the meaning of Section 27A of the Securities Act of 1933 and Section 21E of the Securities Exchange Act of 1934 and, as such, may involve known and unknown risks, uncertainties and other factors which may cause the Company’s actual results, performance or achievements to be materially different from future results, performance or achievements expressed or implied by such forward-looking statements. Forward-looking statements, which are based on certain assumptions and describe the Company’s future plans, strategies and expectations, are generally identifiable by use of the words “may”, “will”, “should”, “estimates”, “projects”, “anticipates”, “believes”, “expects”, “intends”, “future”, and words of similar import, or the negative thereof. Factors which could have a material adverse effect on the operations and future prospects of the Company include, but are not limited to, those set forth under the heading “Risk Factors” in the Company’s Annual Report on Form 10-K. Accordingly, the information contained herein should be read in conjunction with the Company’s Form 10-K for the year ended December 31, 2011.
2
CEDAR REALTY TRUST, INC.
Consolidated Balance Sheets
| December 31, | ||||||||
| 2011 | 2010 | |||||||
| Assets: |
||||||||
| Real estate |
||||||||
| Land |
$ | 269,479,000 | $ | 261,673,000 | ||||
| Buildings and improvements |
1,099,642,000 | 1,028,443,000 | ||||||
|
|
|
|
|
|||||
| 1,369,121,000 | 1,290,116,000 | |||||||
| Less accumulated depreciation |
(197,608,000 | ) | (157,803,000 | ) | ||||
|
|
|
|
|
|||||
| Real estate, net |
1,171,513,000 | 1,132,313,000 | ||||||
| Real estate held for sale/conveyance |
206,674,000 | 348,743,000 | ||||||
| Investment in unconsolidated joint ventures |
44,743,000 | 52,466,000 | ||||||
| Cash and cash equivalents |
12,070,000 | 14,166,000 | ||||||
| Restricted cash |
14,707,000 | 12,493,000 | ||||||
| Receivables |
26,264,000 | 26,387,000 | ||||||
| Other assets and deferred charges, net |
33,893,000 | 33,867,000 | ||||||
| Assets relating to real estate held for sale/conveyance |
2,299,000 | 2,052,000 | ||||||
|
|
|
|
|
|||||
| Total assets |
$ | 1,512,163,000 | $ | 1,622,487,000 | ||||
|
|
|
|
|
|||||
| Liabilities and equity: |
||||||||
| Mortgage loans payable |
$ | 589,027,000 | $ | 550,525,000 | ||||
| Mortgage loans payable—real estate held for sale/conveyance |
122,604,000 | 156,991,000 | ||||||
| Secured revolving credit facilities |
166,317,000 | 132,597,000 | ||||||
| Accounts payable and accrued liabilities |
32,404,000 | 29,026,000 | ||||||
| Unamortized intangible lease liabilities |
35,017,000 | 40,253,000 | ||||||
| Liabilities relating to real estate held for sale/conveyance |
6,406,000 | 7,571,000 | ||||||
|
|
|
|
|
|||||
| Total liabilities |
951,775,000 | 916,963,000 | ||||||
|
|
|
|
|
|||||
| Noncontrolling interest—limited partners’ mezzanine OP Units |
4,616,000 | 7,053,000 | ||||||
| Commitments and contingencies |
— | — | ||||||
| Equity: |
||||||||
| Cedar Realty Trust, Inc. shareholders’ equity: |
||||||||
| Preferred stock |
158,575,000 | 158,575,000 | ||||||
| Common stock and other shareholders’ equity |
335,268,000 | 471,491,000 | ||||||
|
|
|
|
|
|||||
| Total Cedar Realty Trust, Inc. shareholders’ equity |
493,843,000 | 630,066,000 | ||||||
|
|
|
|
|
|||||
| Noncontrolling interests: |
||||||||
| Minority interests in consolidated joint ventures |
56,511,000 | 62,050,000 | ||||||
| Limited partners’ OP Units |
5,418,000 | 6,355,000 | ||||||
|
|
|
|
|
|||||
| Total noncontrolling interests |
61,929,000 | 68,405,000 | ||||||
|
|
|
|
|
|||||
| Total equity |
555,772,000 | 698,471,000 | ||||||
|
|
|
|
|
|||||
| Total liabilities and equity |
$ | 1,512,163,000 | $ | 1,622,487,000 | ||||
|
|
|
|
|
|||||
3
CEDAR REALTY TRUST, INC.
Consolidated Statements of Operations
| Three months ended December 31, | Years ended December 31, | |||||||||||||||
| 2011 | 2010 | 2011 | 2010 | |||||||||||||
| Revenues: |
||||||||||||||||
| Rents |
$ | 26,876,000 | $ | 24,483,000 | $ | 105,452,000 | $ | 102,070,000 | ||||||||
| Expense recoveries |
6,582,000 | 6,079,000 | 26,947,000 | 25,716,000 | ||||||||||||
| Other |
876,000 | 1,863,000 | 3,014,000 | 3,786,000 | ||||||||||||
|
|
|
|
|
|
|
|
|
|||||||||
| Total revenues |
34,334,000 | 32,425,000 | 135,413,000 | 131,572,000 | ||||||||||||
|
|
|
|
|
|
|
|
|
|||||||||
| Property operating expenses: |
||||||||||||||||
| Operating, maintenance and management |
6,408,000 | 6,293,000 | 27,608,000 | 25,632,000 | ||||||||||||
| Real estate and other property-related taxes |
4,321,000 | 3,798,000 | 16,628,000 | 16,151,000 | ||||||||||||
|
|
|
|
|
|
|
|
|
|||||||||
| Total property operating expenses |
10,729,000 | 10,091,000 | 44,236,000 | 41,783,000 | ||||||||||||
|
|
|
|
|
|
|
|
|
|||||||||
| Property operating income |
23,605,000 | 22,334,000 | 91,177,000 | 89,789,000 | ||||||||||||
|
|
|
|
|
|
|
|
|
|||||||||
| Other expenses: |
||||||||||||||||
| General and administrative |
2,970,000 | 2,799,000 | 11,085,000 | 9,537,000 | ||||||||||||
| Management transition charges |
— | — | 6,530,000 | — | ||||||||||||
| Impairment charges |
(271,000 | ) | 221,000 | 7,148,000 | 2,493,000 | |||||||||||
| Acquisition transaction costs and terminated projects |
267,000 | 593,000 | 1,436,000 | 3,958,000 | ||||||||||||
| Depreciation and amortization |
15,406,000 | 7,930,000 | 43,250,000 | 34,872,000 | ||||||||||||
|
|
|
|
|
|
|
|
|
|||||||||
| Total other expenses |
18,372,000 | 11,543,000 | 69,449,000 | 50,860,000 | ||||||||||||
|
|
|
|
|
|
|
|
|
|||||||||
| Operating income |
5,233,000 | 10,791,000 | 21,728,000 | 38,929,000 | ||||||||||||
|
|
|
|
|
|
|
|
|
|||||||||
| Non-operating income and expense: |
||||||||||||||||
| Interest expense, including amortization of deferred financing costs |
(10,715,000 | ) | (10,001,000 | ) | (41,870,000 | ) | (43,138,000 | ) | ||||||||
| Write-off of deferred financing costs |
— | — | — | (2,552,000 | ) | |||||||||||
| Interest income |
133,000 | 9,000 | 349,000 | 21,000 | ||||||||||||
| Unconsolidated joint ventures: |
||||||||||||||||
| Equity in income (loss) |
519,000 | (63,000 | ) | 1,671,000 | 484,000 | |||||||||||
| Write-off of investment |
— | — | (7,961,000 | ) | — | |||||||||||
| Gain on sale |
— | — | 130,000 | — | ||||||||||||
|
|
|
|
|
|
|
|
|
|||||||||
| Total non-operating income and expense |
(10,063,000 | ) | (10,055,000 | ) | (47,681,000 | ) | (45,185,000 | ) | ||||||||
|
|
|
|
|
|
|
|
|
|||||||||
| (Loss) income before discontinued operations |
(4,830,000 | ) | 736,000 | (25,953,000 | ) | (6,256,000 | ) | |||||||||
|
|
|
|
|
|
|
|
|
|||||||||
| Discontinued operations: |
||||||||||||||||
| Income (loss) from operations |
2,192,000 | (174,000 | ) | 5,013,000 | 1,724,000 | |||||||||||
| Impairment charges |
(1,171,000 | ) | (36,548,000 | ) | (88,458,000 | ) | (39,822,000 | ) | ||||||||
| Gain on sales |
382,000 | — | 884,000 | 170,000 | ||||||||||||
|
|
|
|
|
|
|
|
|
|||||||||
| Total discontinued operations |
1,403,000 | (36,722,000 | ) | (82,561,000 | ) | (37,928,000 | ) | |||||||||
|
|
|
|
|
|
|
|
|
|||||||||
| Net loss |
(3,427,000 | ) | (35,986,000 | ) | (108,514,000 | ) | (44,184,000 | ) | ||||||||
|
|
|
|
|
|
|
|
|
|||||||||
| Less, net loss (income) attributable to noncontrolling interests: |
||||||||||||||||
| Minority interests in consolidated joint ventures |
(825,000 | ) | 1,807,000 | 2,507,000 | 1,613,000 | |||||||||||
| Limited partners’ interest in Operating Partnership |
152,000 | 794,000 | 2,446,000 | 1,282,000 | ||||||||||||
|
|
|
|
|
|
|
|
|
|||||||||
| Total net loss (income) attributable to noncontrolling interests |
(673,000 | ) | 2,601,000 | 4,953,000 | 2,895,000 | |||||||||||
|
|
|
|
|
|
|
|
|
|||||||||
| Net loss attributable to Cedar Realty Trust, Inc. |
(4,100,000 | ) | (33,385,000 | ) | (103,561,000 | ) | (41,289,000 | ) | ||||||||
| Preferred distribution requirements |
(3,579,000 | ) | (3,579,000 | ) | (14,200,000 | ) | (10,196,000 | ) | ||||||||
|
|
|
|
|
|
|
|
|
|||||||||
| Net loss attributable to common shareholders |
$ | (7,679,000 | ) | $ | (36,964,000 | ) | $ | (117,761,000 | ) | $ | (51,485,000 | ) | ||||
|
|
|
|
|
|
|
|
|
|||||||||
| Per common share attributable to common shareholders (basic and diluted): |
||||||||||||||||
| Continuing operations |
$ | (0.13 | ) | $ | (0.01 | ) | $ | (0.61 | ) | $ | (0.24 | ) | ||||
| Discontinued operations |
0.01 | $ | (0.55 | ) | $ | (1.18 | ) | $ | (0.57 | ) | ||||||
|
|
|
|
|
|
|
|
|
|||||||||
| $ | (0.12 | ) | $ | (0.56 | ) | $ | (1.79 | ) | $ | (0.81 | ) | |||||
|
|
|
|
|
|
|
|
|
|||||||||
| Weighted average number of common shares outstanding: |
||||||||||||||||
| Basic |
66,804,000 | 66,374,000 | 66,387,000 | 63,843,000 | ||||||||||||
|
|
|
|
|
|
|
|
|
|||||||||
| Diluted |
66,804,000 | 66,374,000 | 66,387,000 | 63,862,000 | ||||||||||||
|
|
|
|
|
|
|
|
|
|||||||||
4
CEDAR REALTY TRUST, INC.
Supporting Schedules to Consolidated Statements
Balance Sheets Detail
| December 31, | December 31, | |||||||
| 2011 | 2010 | |||||||
| Construction in process (included in building and improvements) |
$ | 24,475,000 | $ | 14,053,000 | ||||
|
|
|
|
|
|||||
| Investment in unconsolidated joint ventures |
||||||||
| Cedar/RioCan |
$ | 44,743,000 | $ | 46,618,000 | ||||
| Philadelphia redevelopment property |
— | 5,848,000 | ||||||
|
|
|
|
|
|||||
| $ | 44,743,000 | $ | 52,466,000 | |||||
|
|
|
|
|
|||||
| Receivables |
||||||||
| Rents and other tenant receivables, net |
$ | 6,882,000 | $ | 7,048,000 | ||||
| Straight-line rents |
13,572,000 | 12,471,000 | ||||||
| Other |
5,810,000 | 6,868,000 | ||||||
|
|
|
|
|
|||||
| $ | 26,264,000 | $ | 26,387,000 | |||||
|
|
|
|
|
|||||
| Other assets and deferred charges, net |
||||||||
| Lease origination costs |
$ | 14,336,000 | $ | 13,282,000 | ||||
| Financing costs |
6,268,000 | 9,623,000 | ||||||
| Prepaid expenses |
5,857,000 | 5,258,000 | ||||||
| Investments and cumulative mark-to-market adjustments related to share-based compensation |
3,562,000 | 2,101,000 | ||||||
| Property and other deposits |
1,430,000 | 1,527,000 | ||||||
| Leasehold improvements, furniture and fixtures |
1,035,000 | 525,000 | ||||||
| Other |
1,405,000 | 1,551,000 | ||||||
|
|
|
|
|
|||||
| $ | 33,893,000 | $ | 33,867,000 | |||||
|
|
|
|
|
|||||
| Minority interests in consolidated joint ventures |
||||||||
| Operating joint ventures: |
||||||||
| New London Mall and San Souci Plaza joint venture |
6,805,000 | 8,240,000 | ||||||
| Upland Square joint venture |
1,048,000 | 1,048,000 | ||||||
| Homburg joint venture (2 properties) |
13,909,000 | 14,355,000 | ||||||
| Held for Sale/Conveyance joint ventures: |
||||||||
| Homburg joint venture (7 properties) |
34,774,000 | 36,690,000 | ||||||
| CVS at Naugatuck joint venture |
56,000 | 52,000 | ||||||
| Heritage Crossing joint venture |
(81,000 | ) | (81,000 | ) | ||||
| Columbia Mall joint venture |
— | 1,746,000 | ||||||
|
|
|
|
|
|||||
| $ | 56,511,000 | $ | 62,050,000 | |||||
|
|
|
|
|
|||||
5
CEDAR REALTY TRUST, INC.
Supporting Schedules to Consolidated Statements
Statements of Operations Detail
| Three months ended December 31, | ||||||||
| 2011 | 2010 | |||||||
| Rents |
||||||||
| Base rents |
$ | 24,819,000 | $ | 22,767,000 | ||||
| Percentage rent |
371,000 | 1,455,000 | ||||||
| Straight-line rents |
274,000 | 585,000 | ||||||
| Amortization of intangible lease liabilities |
1,412,000 | (324,000 | ) | |||||
|
|
|
|
|
|||||
| $ | 26,876,000 | $ | 24,483,000 | |||||
|
|
|
|
|
|||||
| Years ended December 31, | ||||||||
| 2011 | 2010 | |||||||
| Rents |
||||||||
| Base rents |
$ | 97,437,000 | $ | 93,493,000 | ||||
| Percentage rent |
1,058,000 | 906,000 | ||||||
| Straight-line rents |
1,221,000 | 1,577,000 | ||||||
| Amortization of intangible lease liabilities |
5,736,000 | 6,094,000 | ||||||
|
|
|
|
|
|||||
| $ | 105,452,000 | $ | 102,070,000 | |||||
|
|
|
|
|
|||||
| Three months ended December 31, | ||||||||
| 2011 | 2010 | |||||||
| RioCan management fees |
||||||||
| Management fees |
$ | 708,000 | $ | 733,000 | ||||
| Other fees |
150,000 | 1,068,000 | ||||||
|
|
|
|
|
|||||
| $ | 858,000 | $ | 1,801,000 | |||||
|
|
|
|
|
|||||
| Years ended December 31, | ||||||||
| 2011 | 2010 | |||||||
| RioCan management fees |
||||||||
| Management fees |
$ | 2,277,000 | $ | 1,235,000 | ||||
| Other fees |
478,000 | 2,349,000 | ||||||
|
|
|
|
|
|||||
| $ | 2,755,000 | $ | 3,584,000 | |||||
|
|
|
|
|
|||||
| Three months ended December 31, | ||||||||
| 2011 | 2010 | |||||||
| Net loss (income) attributable to noncontrolling interests—minority interests in consolidated joint ventures |
||||||||
| Held and used: |
||||||||
| New London Mall and San Souci Plaza joint venture |
$ | 37,000 | $ | 187,000 | ||||
| Homburg joint venture (2 properties) |
(75,000 | ) | (145,000 | ) | ||||
| Held for sale/conveyance: |
||||||||
| Homburg joint venture (7 properties) |
(778,000 | ) | (427,000 | ) | ||||
| CVS at Naugatuck joint venture |
(9,000 | ) | 1,000 | |||||
| Columbia Mall joint venture |
— | 2,191,000 | ||||||
|
|
|
|
|
|||||
| $ | (825,000 | ) | $ | 1,807,000 | ||||
|
|
|
|
|
|||||
| Years ended December 31, | ||||||||
| 2011 | 2010 | |||||||
| Net loss (income) attributable to noncontrolling interests—minority interests in consolidated joint ventures |
||||||||
| Held and used: |
||||||||
| New London Mall and San Souci Plaza joint venture |
$ | 488,000 | $ | 902,000 | ||||
| Homburg joint venture (2 properties) |
(381,000 | ) | (470,000 | ) | ||||
| Held for sale/conveyance: |
||||||||
| Homburg joint venture (7 properties) |
391,000 | (1,094,000 | ) | |||||
| CVS at Naugatuck joint venture |
(24,000 | ) | (17,000 | ) | ||||
| Columbia Mall joint venture |
2,033,000 | 2,292,000 | ||||||
|
|
|
|
|
|||||
| $ | 2,507,000 | $ | 1,613,000 | |||||
|
|
|
|
|
|||||
6
CEDAR REALTY TRUST, INC.
Funds From Operations and Additional Disclosures
| Three months ended December 31, | Years ended December 31, | |||||||||||||||
| 2011 | 2010 | 2011 | 2010 | |||||||||||||
| Net loss attributable to the Company’s common shareholders |
$ | (7,679,000 | ) | $ | (36,964,000 | ) | $ | (117,761,000 | ) | $ | (51,485,000 | ) | ||||
| Real estate depreciation and amortization |
15,427,000 | 10,793,000 | 48,353,000 | 46,279,000 | ||||||||||||
| Limited partners’ interest |
(152,000 | ) | (794,000 | ) | (2,446,000 | ) | (1,282,000 | ) | ||||||||
| Impairment charges and write-off of joint venture interest |
900,000 | 36,769,000 | 103,567,000 | 42,315,000 | ||||||||||||
| Gain on sales |
(382,000 | ) | — | (884,000 | ) | (170,000 | ) | |||||||||
| Consolidated minority interest: |
||||||||||||||||
| Share of income |
825,000 | (1,807,000 | ) | (2,507,000 | ) | (1,613,000 | ) | |||||||||
| Share of FFO |
(1,476,000 | ) | (2,131,000 | ) | (5,918,000 | ) | (6,846,000 | ) | ||||||||
| Unconsolidated joint venture: |
||||||||||||||||
| Share of income |
(519,000 | ) | 63,000 | (1,671,000 | ) | (484,000 | ) | |||||||||
| Share of FFO |
1,546,000 | 1,230,000 | 5,984,000 | 2,796,000 | ||||||||||||
|
|
|
|
|
|
|
|
|
|||||||||
| Funds From Operations (“FFO”) |
8,490,000 | 7,159,000 | 26,717,000 | 29,510,000 | ||||||||||||
| Adjustments for items affecting comparability: |
||||||||||||||||
| Management transition charges and employee termination costs |
— | — | 6,875,000 | — | ||||||||||||
| Accelerated write-off of deferred financing costs |
— | — | — | 2,552,000 | ||||||||||||
| Share-based compensation mark-to-market adjustments |
(68,000 | ) | 101,000 | (808,000 | ) | (276,000 | ) | |||||||||
| Acquisition transaction costs and terminated projects, including Company share from the Cedar/RioCan joint venture (a) |
262,000 | 1,988,000 | 1,618,000 | 6,770,000 | ||||||||||||
|
|
|
|
|
|
|
|
|
|||||||||
| Recurring Funds From Operations (“Recurring FFO”) |
$ | 8,684,000 | $ | 9,248,000 | $ | 34,402,000 | $ | 38,556,000 | ||||||||
|
|
|
|
|
|
|
|
|
|||||||||
| FFO per diluted share: |
$ | 0.12 | $ | 0.11 | $ | 0.38 | $ | 0.45 | ||||||||
|
|
|
|
|
|
|
|
|
|||||||||
| Recurring FFO per diluted share: |
$ | 0.12 | $ | 0.14 | $ | 0.49 | $ | 0.59 | ||||||||
|
|
|
|
|
|
|
|
|
|||||||||
| Weighted average number of diluted common shares: |
||||||||||||||||
| Common shares |
69,746,000 | 66,374,000 | 68,715,000 | 63,862,000 | ||||||||||||
| OP Units |
1,415,000 | 1,435,000 | 1,415,000 | 1,814,000 | ||||||||||||
|
|
|
|
|
|
|
|
|
|||||||||
| 71,161,000 | 67,809,000 | 70,130,000 | 65,676,000 | |||||||||||||
|
|
|
|
|
|
|
|
|
|||||||||
| Additional Disclosures (Pro-Rata Share): |
||||||||||||||||
| Straight-line rents |
$ | 357,000 | $ | 245,000 | $ | 1,634,000 | $ | 1,580,000 | ||||||||
| Amortization of intangible lease liabilities |
1,471,000 | 1,264,000 | 6,476,000 | 7,861,000 | ||||||||||||
| Non-real estate amortization |
997,000 | 1,520,000 | 4,399,000 | 5,653,000 | ||||||||||||
| Stock-based compensation other than mark-to-market adjustments |
786,000 | 795,000 | 5,470,000 | 3,240,000 | ||||||||||||
| Maintenance capital expenditures |
1,126,000 | 1,081,000 | 3,302,000 | 3,987,000 | ||||||||||||
| Development and redevelopment capital expenditures |
7,951,000 | 8,365,000 | 33,412,000 | 22,254,000 | ||||||||||||
| Capitalized interest and financing costs |
593,000 | 332,000 | 2,629,000 | 2,542,000 | ||||||||||||
| NOI attributable to Cedar/RioCan properties prior to dates of transfer |
— | — | — | 2,463,000 | ||||||||||||
| (a) | The amounts for the three and twelve months ended December 31, 2010 are principally fees paid to the Company’s investment advisor related to Cedar/RioCan joint venture transactions. The Company’s share from the Cedar/RioCan joint venture are $0, $892,000, $183,000 and $1,424,000, respectively. |
7
CEDAR REALTY TRUST, INC.
Earnings Before Interest, Taxes, Depreciation and Amortization
| Three months ended December 31, | Years ended December 31, | |||||||||||||||
| 2011 | 2010 | 2011 | 2010 | |||||||||||||
| EBITDA Calculation |
||||||||||||||||
| (Loss) income from continuing operations |
$ | (4,830,000 | ) | $ | 736,000 | $ | (25,953,000 | ) | $ | (6,256,000 | ) | |||||
| Add (deduct): |
||||||||||||||||
| Interest expense and amortization of financing costs, net |
10,715,000 | 10,001,000 | 41,870,000 | 43,138,000 | ||||||||||||
| Accelerated write-off of deferred financing costs |
— | — | — | 2,552,000 | ||||||||||||
| Depreciation and amortization |
15,406,000 | 7,930,000 | 43,250,000 | 34,872,000 | ||||||||||||
| Minority interests share of consolidated joint venture EBITDA |
(3,165,000 | ) | (3,526,000 | ) | (10,844,000 | ) | (12,605,000 | ) | ||||||||
| Discontinued operations: |
||||||||||||||||
| Income (loss) from operations |
2,192,000 | (174,000 | ) | 5,013,000 | 1,724,000 | |||||||||||
| Interest expense and amortization of financing costs, net |
2,237,000 | 2,466,000 | 9,255,000 | 8,647,000 | ||||||||||||
| Depreciation and amortization |
82,000 | 2,911,000 | 5,356,000 | 11,571,000 | ||||||||||||
| Pro-rata share attributable to Cedar/RioCan joint venture: |
||||||||||||||||
| Depreciation and amortization |
1,027,000 | 1,213,000 | 4,123,000 | 1,905,000 | ||||||||||||
| Interest expense |
833,000 | 747,000 | 3,616,000 | 1,581,000 | ||||||||||||
|
|
|
|
|
|
|
|
|
|||||||||
| EBITDA |
24,497,000 | 22,304,000 | 75,686,000 | 87,129,000 | ||||||||||||
| Adjustments for items affecting comparability: |
||||||||||||||||
| Share-based compensation mark-to-market adjustments |
(68,000 | ) | 101,000 | (808,000 | ) | (276,000 | ) | |||||||||
| Impairment charges and write-off of investment in unconsolidated joint venture |
(271,000 | ) | 221,000 | 15,109,000 | 2,493,000 | |||||||||||
| Management transition charges and employee termination costs |
— | — | 6,875,000 | — | ||||||||||||
| Acquisition transaction costs and terminated projects, including Company share from the Cedar/RioCan joint venture (a) |
262,000 | 1,813,000 | 1,618,000 | 6,070,000 | ||||||||||||
|
|
|
|
|
|
|
|
|
|||||||||
| Adjusted EBITDA |
$ | 24,420,000 | $ | 24,439,000 | $ | 98,480,000 | $ | 95,416,000 | ||||||||
|
|
|
|
|
|
|
|
|
|||||||||
| Adjusted EBITDA annualized (b) |
$ | 97,680,000 | $ | 97,756,000 | $ | 98,480,000 | $ | 95,416,000 | ||||||||
|
|
|
|
|
|
|
|
|
|||||||||
| Pro-rata share of outstanding debt (c) |
$ | 827,036,000 | $ | 778,327,000 | $ | 827,036,000 | $ | 778,327,000 | ||||||||
|
|
|
|
|
|
|
|
|
|||||||||
| Fixed charges |
||||||||||||||||
| Interest expense (d) |
$ | 12,538,000 | $ | 11,357,000 | $ | 49,332,000 | $ | 47,238,000 | ||||||||
| Interest expense—consolidated minority interests share |
(1,671,000 | ) | (1,687,000 | ) | (6,654,000 | ) | (6,285,000 | ) | ||||||||
| Interest expense—unconsolidated Cedar/RioCan joint venture |
833,000 | 747,000 | 3,616,000 | 1,581,000 | ||||||||||||
|
|
|
|
|
|
|
|
|
|||||||||
| Interest Expense |
$ | 11,700,000 | $ | 10,417,000 | $ | 46,294,000 | $ | 42,534,000 | ||||||||
| Preferred dividend requirements |
3,579,000 | 3,579,000 | 14,200,000 | 10,196,000 | ||||||||||||
| Pro-rata share of scheduled mortgage repayments |
2,195,000 | 2,106,000 | 8,749,000 | 7,484,000 | ||||||||||||
|
|
|
|
|
|
|
|
|
|||||||||
| Fixed charges |
$ | 17,474,000 | $ | 16,102,000 | $ | 69,243,000 | $ | 60,214,000 | ||||||||
|
|
|
|
|
|
|
|
|
|||||||||
| Debt and Coverage Ratios |
||||||||||||||||
| Debt to Adjusted EBITDA (b) |
8.7 | x | 8.0 | x | 8.8 | x | 8.2 | x | ||||||||
| Interest coverage ratio (Based on Adjusted EBITDA) |
2.1 | x | 2.3 | x | 2.1 | x | 2.2 | x | ||||||||
| Fixed charge coverage ratio (Based on Adjusted EBITDA) |
1.4 | x | 1.5 | x | 1.4 | x | 1.6 | x | ||||||||
| (a) | The Company’s share from the Cedar/RioCan joint venture are $0, $892,000, $183,000 and $1,424,000, respectively. |
| (b) | For purposes of the Debt to Adjusted EBITDA ratio, the adjusted EBITDA annualized amounts have been further adjusted to exclude results for properties sold during each of the respective periods ($2,664,000, $372,000, $4,149,000 and $812,000). |
| (c) | Includes debt from properties “held for sale/conveyance.” |
| (d) | Includes interest expense from properties “held for sale/conveyance.” |
8
CEDAR REALTY TRUST, INC.
Summary of Outstanding Debt
| Stated contract amounts | ||||||||||||||||||||
| Property |
Percent Owned |
Maturity Date |
Interest rate (a) |
December 31, 2011 |
December 31, 2010 |
|||||||||||||||
| Fixed-rate mortgages: |
||||||||||||||||||||
| Consolidated Properties: |
||||||||||||||||||||
| The Point |
100 | % | Sep 2012 | 7.6 | % | $ | 16,277,000 | $ | 16,807,000 | |||||||||||
| Carll’s Corner |
100 | % | Nov 2012 | 5.6 | % | 5,656,000 | 5,786,000 | |||||||||||||
| Washington Center Shoppes |
100 | % | Dec 2012 | 5.9 | % | 8,321,000 | 8,452,000 | |||||||||||||
| Fort Washington |
100 | % | Jan 2013 | 5.4 | % | 5,535,000 | 5,666,000 | |||||||||||||
| Fairview Plaza |
100 | % | Feb 2013 | 5.7 | % | 5,254,000 | 5,370,000 | |||||||||||||
| Academy Plaza |
100 | % | Mar 2013 | 7.3 | % | 8,894,000 | 9,139,000 | |||||||||||||
| General Booth Plaza |
100 | % | Aug 2013 | 6.1 | % | 5,070,000 | 5,166,000 | |||||||||||||
| Kempsville Crossing |
100 | % | Aug 2013 | 6.1 | % | 5,724,000 | 5,841,000 | |||||||||||||
| Port Richmond Village |
100 | % | Aug 2013 | 6.5 | % | 14,156,000 | 14,428,000 | |||||||||||||
| Smithfield Plaza |
100 | % | Aug 2013 | 6.1 | % | 3,263,000 | 3,317,000 | |||||||||||||
| Suffolk Plaza |
100 | % | Aug 2013 | 6.1 | % | 4,297,000 | 4,395,000 | |||||||||||||
| Virginia Little Creek |
100 | % | Aug 2013 | 6.1 | % | 4,588,000 | 4,680,000 | |||||||||||||
| Timpany Plaza |
100 | % | Jan 2014 | 6.1 | % | 7,914,000 | 8,067,000 | |||||||||||||
| Trexler Mall |
100 | % | May 2014 | 5.5 | % | 20,567,000 | 20,993,000 | |||||||||||||
| Coliseum Marketplace |
100 | % | Jul 2014 | 6.1 | % | 11,471,000 | 11,642,000 | |||||||||||||
| Fieldstone Marketplace |
20 | % | Jul 2014 | 6.0 | % | 17,662,000 | 17,945,000 | |||||||||||||
| King’s Plaza |
100 | % | Jul 2014 | 6.0 | % | 7,538,000 | 7,678,000 | |||||||||||||
| Liberty Marketplace |
100 | % | Jul 2014 | 6.1 | % | 8,666,000 | 8,865,000 | |||||||||||||
| Yorktowne Plaza |
100 | % | Jul 2014 | 6.0 | % | 19,721,000 | 20,092,000 | |||||||||||||
| Mechanicsburg Giant |
100 | % | Nov 2014 | 5.5 | % | 8,999,000 | 9,274,000 | |||||||||||||
| Elmhurst Square Shopping Center |
100 | % | Dec 2014 | 5.4 | % | 3,892,000 | 3,970,000 | |||||||||||||
| Newport Plaza |
100 | % | Jan 2015 | 6.0 | % | 5,471,000 | 5,583,000 | |||||||||||||
| New London Mall |
40 | % | Apr 2015 | 4.9 | % | 27,365,000 | 27,365,000 | |||||||||||||
| Carbondale Plaza |
100 | % | May 2015 | 6.4 | % | 4,862,000 | 4,951,000 | |||||||||||||
| Oak Ridge Shopping Center |
100 | % | May 2015 | 5.5 | % | 3,351,000 | 3,407,000 | |||||||||||||
| Pine Grove Plaza |
100 | % | Sep 2015 | 5.0 | % | 5,574,000 | 5,688,000 | |||||||||||||
| Groton Shopping Center |
100 | % | Oct 2015 | 5.3 | % | 11,663,000 | 11,843,000 | |||||||||||||
| Southington Shopping Center |
100 | % | Nov 2015 | 5.1 | % | 5,578,000 | 5,690,000 | |||||||||||||
| Jordan Lane |
100 | % | Dec 2015 | 5.5 | % | 12,628,000 | 12,860,000 | |||||||||||||
| Oakland Mills |
100 | % | Jan 2016 | 5.5 | % | 4,748,000 | 4,835,000 | |||||||||||||
| Smithfield Plaza |
100 | % | May 2016 | 6.2 | % | 6,890,000 | 6,976,000 | |||||||||||||
| West Bridgewater |
100 | % | Sep 2016 | 6.2 | % | 10,718,000 | 10,848,000 | |||||||||||||
| Carman’s Plaza |
100 | % | Oct 2016 | 6.2 | % | 33,500,000 | 33,500,000 | |||||||||||||
| Hamburg Commons |
100 | % | Oct 2016 | 6.1 | % | 5,017,000 | 5,101,000 | |||||||||||||
| Meadows Marketplace |
20 | % | Nov 2016 | 5.6 | % | 10,002,000 | 10,172,000 | |||||||||||||
| San Souci Plaza |
40 | % | Dec 2016 | 6.2 | % | 27,200,000 | 27,200,000 | |||||||||||||
| Camp Hill Shopping Center |
100 | % | Jan 2017 | 5.5 | % | 65,000,000 | 65,000,000 | |||||||||||||
| Golden Triangle |
100 | % | Feb 2018 | 6.0 | % | 20,387,000 | 20,702,000 | |||||||||||||
| East Chestnut |
100 | % | Apr 2018 | 7.4 | % | 1,624,000 | 1,704,000 | |||||||||||||
| Townfair Center |
100 | % | Jul 2021 | 5.2 | % | 16,371,000 | — | |||||||||||||
| Gold Star Plaza |
100 | % | May 2019 | 7.3 | % | 1,933,000 | 2,123,000 | |||||||||||||
| Kingston Plaza |
100 | % | Jul 2019 | 5.3 | % | 511,000 | 522,000 | |||||||||||||
| Halifax Plaza |
100 | % | Apr 2020 | 6.3 | % | 4,175,000 | 4,252,000 | |||||||||||||
| Swede Square |
100 | % | Nov 2020 | 5.5 | % | 10,453,000 | 10,588,000 | |||||||||||||
| Colonial Commons |
100 | % | Feb 2021 | 5.5 | % | 27,729,000 | — | |||||||||||||
| Virginia Little Creek |
100 | % | Sep 2021 | 8.0 | % | 345,000 | 367,000 | |||||||||||||
| Metro Square |
100 | % | Nov 2029 | 7.5 | % | 8,750,000 | 8,964,000 | |||||||||||||
|
|
|
|
|
|||||||||||||||||
| Total Fixed-Rate Mortgages |
4.3 years | 5.9 | % | 525,310,000 | 487,814,000 | |||||||||||||||
|
|
|
|
|
|||||||||||||||||
| weighted average | ||||||||||||||||||||
9
CEDAR REALTY TRUST, INC.
Summary of Outstanding Debt (Continued)
| Stated contract amounts | ||||||||||||||||||||
| Property |
Percent Owned |
Maturity Date |
Interest rate (a) |
December 31, 2011 |
December 31, 2010 |
|||||||||||||||
| Variable-rate mortgage: |
||||||||||||||||||||
| Upland Square |
60 | % | Nov 2013 | 3.0 | % | 63,768,000 | 62,577,000 | |||||||||||||
|
|
|
|
|
|||||||||||||||||
| Total mortgages at stated contract amounts |
4.1 years | 5.6 | % | 589,078,000 | 550,391,000 | |||||||||||||||
|
|
weighted average |
|
||||||||||||||||||
| Unamortized discount/premium |
(51,000 | ) | 134,000 | |||||||||||||||||
|
|
|
|
|
|||||||||||||||||
| Total mortgage debt (including unamortized discount/premium) |
589,027,000 | 550,525,000 | ||||||||||||||||||
|
|
|
|
|
|||||||||||||||||
| Revolving Credit Facilities: |
||||||||||||||||||||
| Stabilized properties |
Jan 2012 | (b) | 5.5 | % | 74,035,000 | 29,535,000 | ||||||||||||||
| Development properties |
Jun 2012 | (b) | 2.4 | % | 92,282,000 | 103,062,000 | ||||||||||||||
|
|
|
|
|
|||||||||||||||||
| 0.3 years | 3.8 | % | 166,317,000 | 132,597,000 | ||||||||||||||||
|
|
|
|
|
|||||||||||||||||
|
|
weighted average |
|
||||||||||||||||||
| Total Consolidated Debt (Excluding Held for Sale/Conveyance Mortgage Debt) |
3.2 years | 5.2 | % | $ | 755,344,000 | 683,122,000 | ||||||||||||||
|
|
|
|
|
|||||||||||||||||
|
|
weighted average |
|
||||||||||||||||||
| Pro-rata share of total debt reconciliation: |
||||||||
| Total consolidated debt (excluding held for sale/conveyance mortgage debt) |
$ | 755,344,000 | $ | 683,122,000 | ||||
| Less pro-rata share attributable to consolidated joint venture minority interests |
(54,470,000 | ) | (54,735,000 | ) | ||||
| Plus pro-rata share attributable to properties held for sale/conveyance (c) |
62,703,000 | 91,260,000 | ||||||
| Plus pro-rata share attributable to the unconsolidated Cedar/RioCan Joint Venture (d) |
63,459,000 | 58,680,000 | ||||||
|
|
|
|
|
|||||
| Pro-rata share of total debt |
$ | 827,036,000 | $ | 778,327,000 | ||||
|
|
|
|
|
|||||
| Pro-rata share of fixed debt |
$ | 578,051,000 | $ | 562,153,000 | ||||
| Pro-rata share of variable debt |
$ | 248,985,000 | $ | 216,174,000 | ||||
|
|
|
|
|
|||||
| Pro-rata share of total debt |
$ | 827,036,000 | $ | 778,327,000 | ||||
|
|
|
|
|
|||||
| Percentage of pro-rata fixed debt |
70 | % | 72 | % | ||||
| Percentage of pro-rata variable debt |
30 | % | 28 | % | ||||
|
|
|
|
|
|||||
| 100 | % | 100 | % | |||||
|
|
|
|
|
|||||
| (a) | For variable rate debt, rate in effect as of December 31, 2011. |
| (b) | On January 26, 2012, the Company entered into a $300 million secured Credit Facility which amended, restated and consolidated the stabilized and development facilities. The new Credit Facility is comprised of a four-year $75 million term loan (expiring January 2016, subject to a one-year extension option) and a three year $225 million revolving credit facility (expiring January 2015, subject to a one-year extension option). |
| (c) | See “Summary of Outstanding Debt—Held for Sale Properties.” |
| (d) | See “Summary of Outstanding Joint Venture Debt.” |
10
CEDAR REALTY TRUST, INC.
Summaries of Debt Maturities
As of December 31, 2011
| Consolidated Properties Including Properties Held for Sale |
||||||||||||||||||||||||||||||||
| Maturity | Cedar pro-rata share of: | JV Partners pro-rata share of: | ||||||||||||||||||||||||||||||
| schedule by year |
Scheduled Amortization |
Balloon Payments |
Credit Facilities |
Total | Scheduled Amortization |
Balloon Payments |
Total | Total | ||||||||||||||||||||||||
| 2012 |
$ | 10,057,000 | $ | 61,403,000 | $ | — | $ | 71,460,000 | $ | 1,247,000 | $ | — | $ | 1,247,000 | $ | 72,707,000 | ||||||||||||||||
| 2013 |
8,992,000 | 117,107,000 | (a) | — | 126,099,000 | 1,442,000 | — | 1,442,000 | 127,541,000 | |||||||||||||||||||||||
| 2014 |
6,760,000 | 89,421,000 | — | 96,181,000 | 1,312,000 | 22,571,000 | 23,883,000 | 120,064,000 | ||||||||||||||||||||||||
| 2015 |
5,502,000 | 61,476,000 | 91,317,000 | (b) | 158,295,000 | 951,000 | 36,783,000 | 37,734,000 | 196,029,000 | |||||||||||||||||||||||
| 2016 |
4,730,000 | 80,657,000 | 75,000,000 | (b) | 160,387,000 | 486,000 | 31,275,000 | 31,761,000 | 192,148,000 | |||||||||||||||||||||||
| 2017 |
3,306,000 | 67,072,000 | — | 70,378,000 | 151,000 | 17,184,000 | 17,335,000 | 87,713,000 | ||||||||||||||||||||||||
| 2018 |
2,507,000 | 32,905,000 | — | 35,412,000 | 41,000 | — | 41,000 | 35,453,000 | ||||||||||||||||||||||||
| 2019 |
2,001,000 | 1,299,000 | — | 3,300,000 | 36,000 | 892,000 | 928,000 | 4,228,000 | ||||||||||||||||||||||||
| 2020 |
1,446,000 | 12,169,000 | — | 13,615,000 | — | — | — | 13,615,000 | ||||||||||||||||||||||||
| 2021 |
604,000 | 22,386,000 | — | 22,990,000 | — | — | — | 22,990,000 | ||||||||||||||||||||||||
| Thereafter |
4,983,000 | 477,000 | — | 5,460,000 | — | — | — | 5,460,000 | ||||||||||||||||||||||||
|
|
|
|
|
|
|
|
|
|
|
|
|
|
|
|
|
|||||||||||||||||
| $ | 50,888,000 | $ | 546,372,000 | $ | 166,317,000 | $ | 763,577,000 | $ | 5,666,000 | $ | 108,705,000 | $ | 114,371,000 | $ | 877,948,000 | |||||||||||||||||
|
|
|
|
|
|
|
|
|
|
|
|
|
|
|
|
|
|||||||||||||||||
| Consolidated Properties Excluding Properties Held for Sale |
||||||||||||||||||||||||||||||||
| Maturity | Cedar pro-rata share of: | JV Partners pro-rata share of: | ||||||||||||||||||||||||||||||
| schedule by year |
Scheduled Amortization |
Balloon Payments |
Credit Facilities |
Total | Scheduled Amortization |
Balloon Payments |
Total | Total | ||||||||||||||||||||||||
| 2012 |
$ | 9,066,000 | $ | 29,638,000 | $ | — | $ | 38,704,000 | $ | 276,000 | $ | — | $ | 276,000 | $ | 38,980,000 | ||||||||||||||||
| 2013 |
7,919,000 | 117,107,000 | (a) | — | 125,026,000 | 302,000 | — | 302,000 | 125,328,000 | |||||||||||||||||||||||
| 2014 |
5,629,000 | 87,154,000 | — | 92,783,000 | 151,000 | 13,502,000 | 13,653,000 | 106,436,000 | ||||||||||||||||||||||||
| 2015 |
4,396,000 | 56,385,000 | 91,317,000 | (b) | 152,098,000 | 125,000 | 16,419,000 | 16,544,000 | 168,642,000 | |||||||||||||||||||||||
| 2016 |
3,722,000 | 71,520,000 | 75,000,000 | (b) | 150,242,000 | 150,000 | 23,545,000 | 23,695,000 | 173,937,000 | |||||||||||||||||||||||
| 2017 |
2,616,000 | 60,478,000 | — | 63,094,000 | — | — | — | 63,094,000 | ||||||||||||||||||||||||
| 2018 |
1,980,000 | 32,905,000 | — | 34,885,000 | — | — | — | 34,885,000 | ||||||||||||||||||||||||
| 2019 |
1,600,000 | 407,000 | — | 2,007,000 | — | — | — | 2,007,000 | ||||||||||||||||||||||||
| 2020 |
1,419,000 | 12,169,000 | — | 13,588,000 | — | — | — | 13,588,000 | ||||||||||||||||||||||||
| 2021 |
604,000 | 22,383,000 | — | 22,987,000 | — | — | — | 22,987,000 | ||||||||||||||||||||||||
| Thereafter |
4,983,000 | 477,000 | — | 5,460,000 | — | — | — | 5,460,000 | ||||||||||||||||||||||||
|
|
|
|
|
|
|
|
|
|
|
|
|
|
|
|
|
|||||||||||||||||
| $ | 43,934,000 | $ | 490,623,000 | $ | 166,317,000 | $ | 700,874,000 | $ | 1,004,000 | $ | 53,466,000 | $ | 54,470,000 | $ | 755,344,000 | |||||||||||||||||
|
|
|
|
|
|
|
|
|
|
|
|
|
|
|
|
|
|||||||||||||||||
| (a) | Includes $62.2 million of property-specific construction financing, due in October 2013, subject to a one-year extension option. |
| (b) | Reflects the amended, restated and consolidated credit facility concluded on January 26, 2012 ; each of the 2015 and 2016 amounts are subject to a one-year extension option. |
11
CEDAR REALTY TRUST, INC.
Real Estate Summary
As of December 31, 2011
| Average | ||||||||||||||||||||||||||||||
| Percent | Year | % | base rent per | Major Tenants (a) |
||||||||||||||||||||||||||
| Property Description |
State | owned | acquired | GLA | occupied | leased sq. ft. | Name |
GLA | ||||||||||||||||||||||
| Connecticut |
||||||||||||||||||||||||||||||
| Groton Shopping Center |
CT | 100 | % | 2007 | 117,986 | 90.8 | % | $ | 10.96 | TJ Maxx | 30,000 | |||||||||||||||||||
| Jordan Lane |
CT | 100 | % | 2005 | 181,730 | 97.7 | % | 10.87 | Stop & Shop | 60,632 | ||||||||||||||||||||
| CW Price | 39,280 | |||||||||||||||||||||||||||||
| Retro Fitness | 20,283 | |||||||||||||||||||||||||||||
| New London Mall |
CT | 40 | % | 2009 | 259,293 | 96.9 | % | 13.98 | Shoprite | 64,017 | ||||||||||||||||||||
| Marshalls | 30,354 | |||||||||||||||||||||||||||||
| Homegoods | 25,432 | |||||||||||||||||||||||||||||
| Petsmart | 23,500 | |||||||||||||||||||||||||||||
| AC Moore | 20,932 | |||||||||||||||||||||||||||||
| Oakland Commons |
CT | 100 | % | 2007 | 89,850 | 100.0 | % | 11.02 | Shaw’s | 54,661 | ||||||||||||||||||||
| Bristol Ten Pin | 35,189 | |||||||||||||||||||||||||||||
| Southington Shopping Center |
CT | 100 | % | 2003 | 155,842 | 98.7 | % | 6.72 | Wal-Mart | 95,482 | ||||||||||||||||||||
| NAMCO | 20,000 | |||||||||||||||||||||||||||||
| The Brickyard |
CT | 100 | % | 2004 | 249,553 | 59.7 | % | 8.39 | Home Depot | 103,003 | ||||||||||||||||||||
| Syms | 38,000 | |||||||||||||||||||||||||||||
|
|
|
|||||||||||||||||||||||||||||
| Total Connecticut |
1,054,254 | 88.1 | % | 10.65 | ||||||||||||||||||||||||||
|
|
|
|||||||||||||||||||||||||||||
| Maryland |
||||||||||||||||||||||||||||||
| Kenley Village |
MD | 100 | % | 2005 | 51,894 | 76.6 | % | 9.00 | Food Lion | 29,000 | ||||||||||||||||||||
| Metro Square |
MD | 100 | % | 2008 | 71,896 | 100.0 | % | 18.68 | Shoppers Food Warehouse | 58,668 | ||||||||||||||||||||
| Oakland Mills |
MD | 100 | % | 2005 | 58,224 | 100.0 | % | 13.30 | Food Lion | 43,470 | ||||||||||||||||||||
| San Souci Plaza |
MD | 40 | % | 2009 | 264,134 | 86.9 | % | 10.21 | Shoppers Food Warehouse | 61,466 | ||||||||||||||||||||
| Marshalls | 27,000 | |||||||||||||||||||||||||||||
| Maximum Health and Fitness | 15,612 | |||||||||||||||||||||||||||||
| St. James Square |
MD | 100 | % | 2005 | 39,903 | 100.0 | % | 11.38 | Food Lion | 33,000 | ||||||||||||||||||||
| Valley Plaza |
MD | 100 | % | 2003 | 190,939 | 97.2 | % | 4.75 | K-Mart | 95,810 | ||||||||||||||||||||
| Ollie’s Bargain Outlet | 41,888 | |||||||||||||||||||||||||||||
| Tractor Supply | 32,095 | |||||||||||||||||||||||||||||
| Yorktowne Plaza |
MD | 100 | % | 2007 | 158,982 | 96.8 | % | 13.85 | Food Lion | 37,692 | ||||||||||||||||||||
|
|
|
|||||||||||||||||||||||||||||
| Total Maryland |
835,972 | 93.2 | % | 10.64 | ||||||||||||||||||||||||||
|
|
|
|||||||||||||||||||||||||||||
| Massachusetts |
||||||||||||||||||||||||||||||
| Fieldstone Marketplace |
MA | 20 | % | 2005 | 193,970 | 95.8 | % | 11.09 | Shaw’s | 68,000 | ||||||||||||||||||||
| Flagship Cinema | 41,975 | |||||||||||||||||||||||||||||
| New Bedford Wine and Spirits | 15,180 | |||||||||||||||||||||||||||||
| Kings Plaza |
MA | 100 | % | 2007 | 168,243 | 95.2 | % | 6.22 | Work Out World | 42,997 | ||||||||||||||||||||
| CW Price | 28,504 | |||||||||||||||||||||||||||||
| Ocean State Job Lot | 20,300 | |||||||||||||||||||||||||||||
| Savers | 19,339 | |||||||||||||||||||||||||||||
| Norwood Shopping Center |
MA | 100 | % | 2006 | 102,459 | 98.2 | % | 7.71 | Hannaford Brothers | 42,598 | ||||||||||||||||||||
| Rocky’s Ace Hardware | 18,830 | |||||||||||||||||||||||||||||
| Dollar Tree | 16,798 | |||||||||||||||||||||||||||||
| Price Chopper Plaza |
MA | 100 | % | 2007 | 101,824 | 91.1 | % | 10.87 | Price Chopper | 58,545 | ||||||||||||||||||||
| The Shops at Suffolk Downs |
MA | 100 | % | 2005 | 121,251 | 86.8 | % | 12.64 | Stop & Shop | 74,977 | ||||||||||||||||||||
| Timpany Plaza |
MA | 100 | % | 2007 | 183,775 | 91.8 | % | 6.60 | Stop & Shop | 59,947 | ||||||||||||||||||||
| Big Lots | 28,027 | |||||||||||||||||||||||||||||
| Gardner Theater | 27,576 | |||||||||||||||||||||||||||||
| West Bridgewater Plaza |
MA | 100 | % | 2007 | 133,039 | 96.9 | % | 8.55 | Shaw’s | 57,315 | ||||||||||||||||||||
| Big Lots | 25,000 | |||||||||||||||||||||||||||||
| Planet Fitness | 15,000 | |||||||||||||||||||||||||||||
|
|
|
|||||||||||||||||||||||||||||
| Total Massachusetts |
1,004,561 | 93.8 | % | 8.90 | ||||||||||||||||||||||||||
|
|
|
|||||||||||||||||||||||||||||
| New Jersey |
||||||||||||||||||||||||||||||
| Carll’s Corner |
NJ | 100 | % | 2007 | 129,582 | 88.5 | % | 8.92 | Acme Markets | 55,000 | ||||||||||||||||||||
| Peebles | 18,858 | |||||||||||||||||||||||||||||
| Pine Grove Plaza |
NJ | 100 | % | 2003 | 86,089 | 94.4 | % | 10.44 | Peebles | 24,963 | ||||||||||||||||||||
| Washington Center Shoppes |
NJ | 100 | % | 2001 | 157,394 | 95.6 | % | 8.86 | Acme Markets | 66,046 | ||||||||||||||||||||
| Planet Fitness | 20,742 | |||||||||||||||||||||||||||||
|
|
|
|||||||||||||||||||||||||||||
| Total New Jersey |
373,065 | 92.9 | % | 9.25 | ||||||||||||||||||||||||||
|
|
|
|||||||||||||||||||||||||||||
12
CEDAR REALTY TRUST, INC.
Real Estate Summary (Continued)
As of December 31, 2011
| Average | ||||||||||||||||||||||||||||||
| Percent | Year | % | base rent per | Major Tenants (a) |
||||||||||||||||||||||||||
| Property Description |
State | owned | acquired | GLA | occupied | leased sq. ft. | Name |
GLA | ||||||||||||||||||||||
| New York |
||||||||||||||||||||||||||||||
| Carman’s Plaza |
NY | 100 | % | 2007 | 194,806 | 91.1 | % | 17.12 | Pathmark | 52,211 | ||||||||||||||||||||
| Extreme Fitness | 27,598 | |||||||||||||||||||||||||||||
| Home Goods | 25,806 | |||||||||||||||||||||||||||||
| Department of Motor Vehicle | 19,310 | |||||||||||||||||||||||||||||
| Kingston Plaza |
NY | 100 | % | 2006 | 5,324 | 100.0 | % | 26.67 | Taco Bell | 2,924 | ||||||||||||||||||||
|
|
|
|||||||||||||||||||||||||||||
| Total New York |
200,130 | 91.4 | % | 17.40 | ||||||||||||||||||||||||||
|
|
|
|||||||||||||||||||||||||||||
| Pennsylvania |
||||||||||||||||||||||||||||||
| Academy Plaza |
PA | 100 | % | 2001 | 151,977 | 81.3 | % | 13.20 | Acme Markets | 50,918 | ||||||||||||||||||||
| Camp Hill |
PA | 100 | % | 2002 | 472,717 | 98.8 | % | 13.44 | Boscov’s | 167,597 | ||||||||||||||||||||
| Giant Foods | 92,939 | |||||||||||||||||||||||||||||
| LA Fitness | 45,000 | |||||||||||||||||||||||||||||
| Orthopedic Inst of PA | 40,904 | |||||||||||||||||||||||||||||
| Barnes & Noble | 24,908 | |||||||||||||||||||||||||||||
| Staples | 20,000 | |||||||||||||||||||||||||||||
| Carbondale Plaza |
PA | 100 | % | 2004 | 121,135 | 91.8 | % | 6.97 | Weis Markets | 52,720 | ||||||||||||||||||||
| Peebles | 18,000 | |||||||||||||||||||||||||||||
| Circle Plaza |
PA | 100 | % | 2007 | 92,171 | 100.0 | % | 2.74 | K-Mart | 92,171 | ||||||||||||||||||||
| Colonial Commons |
PA | 100 | % | 2011 | 474,765 | 84.1 | % | 12.60 | Giant Foods | 67,815 | ||||||||||||||||||||
| Dick’s Sporting Goods | 56,000 | |||||||||||||||||||||||||||||
| L.A. Fitness | 41,325 | |||||||||||||||||||||||||||||
| Ross Dress For Less | 30,000 | |||||||||||||||||||||||||||||
| Marshalls | 27,000 | |||||||||||||||||||||||||||||
| JoAnn Fabrics | 25,500 | |||||||||||||||||||||||||||||
| David’s Furniture | 24,970 | |||||||||||||||||||||||||||||
| Office Max | 23,500 | |||||||||||||||||||||||||||||
| Crossroads II |
PA | 60 | % (b) | 2008 | 133,188 | 91.4 | % | 19.51 | Giant Foods | 76,415 | ||||||||||||||||||||
| East Chestnut |
PA | 100 | % | 2005 | 21,180 | 100.0 | % | 15.42 | Rite Aid | 11,180 | ||||||||||||||||||||
| Fairview Commons |
PA | 100 | % | 2007 | 59,578 | 68.9 | % | 6.87 | Giant Foods | 17,264 | ||||||||||||||||||||
| Fairview Plaza |
PA | 100 | % | 2003 | 69,579 | 100.0 | % | 12.31 | Giant Foods | 59,237 | ||||||||||||||||||||
| Fort Washington |
PA | 100 | % | 2002 | 41,000 | 100.0 | % | 19.90 | LA Fitness | 41,000 | ||||||||||||||||||||
| Gold Star Plaza |
PA | 100 | % | 2006 | 71,720 | 82.2 | % | 8.91 | Redner’s | 48,920 | ||||||||||||||||||||
| Golden Triangle |
PA | 100 | % | 2003 | 202,943 | 97.4 | % | 12.30 | LA Fitness | 44,796 | ||||||||||||||||||||
| Marshalls | 30,000 | |||||||||||||||||||||||||||||
| Staples | 24,060 | |||||||||||||||||||||||||||||
| Just Cabinets | 18,665 | |||||||||||||||||||||||||||||
| Aldi | 15,242 | |||||||||||||||||||||||||||||
| Halifax Plaza |
PA | 100 | % | 2003 | 51,510 | 100.0 | % | 11.77 | Giant Foods | 32,000 | ||||||||||||||||||||
| Hamburg Commons |
PA | 100 | % | 2004 | 99,580 | 97.3 | % | 6.59 | Redner’s | 56,780 | ||||||||||||||||||||
| Peebles | 19,683 | |||||||||||||||||||||||||||||
| Huntingdon Plaza |
PA | 100 | % | 2004 | 142,845 | 68.1 | % | 5.49 | Sears | 26,150 | ||||||||||||||||||||
| Peebles | 22060 | |||||||||||||||||||||||||||||
| Lake Raystown Plaza |
PA | 100 | % | 2004 | 140,159 | 95.6 | % | 12.51 | Giant Foods | 61,435 | ||||||||||||||||||||
| Tractor Supply | 32,711 | |||||||||||||||||||||||||||||
| Liberty Marketplace |
PA | 100 | % | 2005 | 68,200 | 91.2 | % | 17.45 | Giant Foods | 55,000 | ||||||||||||||||||||
| Meadows Marketplace |
PA | 20 | % | 2004 | 91,518 | 100.0 | % | 15.28 | Giant Foods | 67,907 | ||||||||||||||||||||
| Mechanicsburg Giant |
PA | 100 | % | 2005 | 51,500 | 100.0 | % | 21.78 | Giant Foods | 51,500 | ||||||||||||||||||||
| Newport Plaza |
PA | 100 | % | 2003 | 64,489 | 100.0 | % | 11.51 | Giant Foods | 43,400 | ||||||||||||||||||||
| Northside Commons |
PA | 100 | % | 2008 | 64,710 | 96.1 | % | 9.88 | Redner’s Market | 48,519 | ||||||||||||||||||||
| Palmyra Shopping Center |
PA | 100 | % | 2005 | 110,970 | 89.3 | % | 5.60 | Weis Markets | 46,912 | ||||||||||||||||||||
| Rite Aid | 18,104 | |||||||||||||||||||||||||||||
| Port Richmond Village |
PA | 100 | % | 2001 | 154,908 | 96.1 | % | 12.33 | Thriftway | 40,000 | ||||||||||||||||||||
| Pep Boys | 20,615 | |||||||||||||||||||||||||||||
| City Stores, Inc. | 15,200 | |||||||||||||||||||||||||||||
| River View Plaza I, II and III |
PA | 100 | % | 2003 | 244,034 | 83.1 | % | 18.44 | United Artists | 77,700 | ||||||||||||||||||||
| Avalon Carpet | 25,000 | |||||||||||||||||||||||||||||
| Pep Boys | 22,000 | |||||||||||||||||||||||||||||
| Staples | 18,000 | |||||||||||||||||||||||||||||
| South Philadelphia |
PA | 100 | % | 2003 | 283,415 | 82.3 | % | 14.02 | Shop Rite | 54,388 | ||||||||||||||||||||
| Ross Dress For Less | 31,349 | |||||||||||||||||||||||||||||
| Bally’s Total Fitness | 31,000 | |||||||||||||||||||||||||||||
| Modell’s | 20,000 | |||||||||||||||||||||||||||||
13
CEDAR REALTY TRUST, INC.
Real Estate Summary (Continued)
As of December 31, 2011
| Average | ||||||||||||||||||||||||||||||
| Percent | Year | % | base rent per | Major Tenants (a) |
||||||||||||||||||||||||||
| Property Description |
State | owned | acquired | GLA | occupied | leased sq. ft. | Name |
GLA | ||||||||||||||||||||||
| Pennsylvania (continued) |
||||||||||||||||||||||||||||||
| Swede Square |
PA | 100 | % | 2003 | 100,816 | 95.0 | % | 15.51 | LA Fitness | 37,200 | ||||||||||||||||||||
| The Commons |
PA | 100 | % | 2004 | 203,426 | 87.5 | % | 9.84 | Bon-Ton | 54,500 | ||||||||||||||||||||
| Shop ‘n Save | 52,654 | |||||||||||||||||||||||||||||
| TJ Maxx | 24,000 | |||||||||||||||||||||||||||||
| The Point |
PA | 100 | % | 2000 | 268,037 | 99.0 | % | 12.30 | Burlington Coat Factory | 76,665 | ||||||||||||||||||||
| Giant Foods | 73,042 | |||||||||||||||||||||||||||||
| AC Moore | 24,890 | |||||||||||||||||||||||||||||
| Staples | 24,000 | |||||||||||||||||||||||||||||
| Townfair Center |
PA | 100 | % | 2004 | 218,662 | 99.1 | % | 8.56 | Lowe’s Home Centers | 95,173 | ||||||||||||||||||||
| Giant Eagle | 83,821 | |||||||||||||||||||||||||||||
| Michael’s Store | 17,592 | |||||||||||||||||||||||||||||
| Trexler Mall |
PA | 100 | % | 2005 | 339,363 | 98.5 | % | 8.67 | Kohl’s | 88,248 | ||||||||||||||||||||
| Bon-Ton | 62,000 | |||||||||||||||||||||||||||||
| Giant Foods | 56,753 | |||||||||||||||||||||||||||||
| Lehigh Wellness Partners | 30,594 | |||||||||||||||||||||||||||||
| Trexlertown Fitness Club | 28,870 | |||||||||||||||||||||||||||||
| Trexlertown Plaza |
PA | 100 | % | 2006 | 316,143 | 78.1 | % | 13.18 | Giant Foods | 78,335 | ||||||||||||||||||||
| Redner’s | 47,900 | |||||||||||||||||||||||||||||
| Big Lots | 33,824 | |||||||||||||||||||||||||||||
| Sears | 22,500 | |||||||||||||||||||||||||||||
| Tractor Supply | 19,097 | |||||||||||||||||||||||||||||
| Upland Square |
PA | 60 | % (b) | 2007 | 382,578 | 93.6 | % | 16.55 | Giant Foods | 78,900 | ||||||||||||||||||||
| Carmike Cinema | 45,276 | |||||||||||||||||||||||||||||
| LA Fitness | 42,000 | |||||||||||||||||||||||||||||
| Best Buy | 30,000 | |||||||||||||||||||||||||||||
| TJ Maxx | 25,000 | |||||||||||||||||||||||||||||
| Bed, Bath & Beyond | 24,721 | |||||||||||||||||||||||||||||
| A.C. Moore | 21,600 | |||||||||||||||||||||||||||||
| Staples | 18,336 | |||||||||||||||||||||||||||||
|
|
|
|||||||||||||||||||||||||||||
| Total Pennsylvania |
5,308,816 | 91.1 | % | 12.37 | ||||||||||||||||||||||||||
|
|
|
|||||||||||||||||||||||||||||
| Virginia |
||||||||||||||||||||||||||||||
| Annie Land Plaza |
VA | 100 | % | 2006 | 42,500 | 97.2 | % | 9.30 | Food Lion | 29,000 | ||||||||||||||||||||
| Coliseum Marketplace |
VA | 100 | % | 2005 | 103,069 | 80.7 | % | 15.59 | Farm Fresh | 57,662 | ||||||||||||||||||||
| Elmhurst Square |
VA | 100 | % | 2006 | 66,250 | 89.1 | % | 9.26 | Food Lion | 38,272 | ||||||||||||||||||||
| General Booth Plaza |
VA | 100 | % | 2005 | 73,320 | 95.1 | % | 12.53 | Farm Fresh | 53,758 | ||||||||||||||||||||
| Kempsville Crossing |
VA | 100 | % | 2005 | 94,477 | 98.7 | % | 11.13 | Farm Fresh | 73,878 | ||||||||||||||||||||
| Martin’s at Glen Allen |
VA | 100 | % | 2005 | 63,328 | 100.0 | % | 6.61 | Martin’s | 63,328 | ||||||||||||||||||||
| Oak Ridge Shopping Center |
VA | 100 | % | 2006 | 38,700 | 100.0 | % | 10.62 | Food Lion | 33,000 | ||||||||||||||||||||
| Smithfield Plaza |
VA | 100 | % | 2005/2008 | 134,664 | 95.3 | % | 9.25 | Farm Fresh | 45,544 | ||||||||||||||||||||
| Maxway | 21,600 | |||||||||||||||||||||||||||||
| Peebles | 21,600 | |||||||||||||||||||||||||||||
| Suffolk Plaza |
VA | 100 | % | 2005 | 67,216 | 100.0 | % | 9.40 | Farm Fresh | 67,216 | ||||||||||||||||||||
| Ukrop’s at Fredericksburg |
VA | 100 | % | 2005 | 63,000 | 100.0 | % | 17.42 | Ukrop’s Supermarket | 63,000 | ||||||||||||||||||||
| Virginia Little Creek |
VA | 100 | % | 2005 | 69,620 | 100.0 | % | 11.12 | Farm Fresh | 66,120 | ||||||||||||||||||||
|
|
|
|||||||||||||||||||||||||||||
| Total Virginia |
816,144 | 95.2 | % | 11.15 | ||||||||||||||||||||||||||
|
|
|
|||||||||||||||||||||||||||||
| Total Consolidated Properties, Excluding Held for Sale/Conveyance Properties—“Operating Portfolio” |
9,592,942 | 91.6 | % | 11.54 | ||||||||||||||||||||||||||
| Total Cedar/RioCan Unconsolidated Joint Venture (c) |
20 | % | 3,708,038 | 96.9 | % | 13.24 | ||||||||||||||||||||||||
|
|
|
|||||||||||||||||||||||||||||
| Total “Managed Portfolio” |
13,300,980 | 93.1 | % | $ | 12.03 | |||||||||||||||||||||||||
|
|
|
|||||||||||||||||||||||||||||
| (a) | Major tenants are determined as tenants with 15,000 or more sq.ft of GLA, tenants at single-tenant properties, or the largest tenant at a property. |
| (b) | The Company has included 100% of this joint venture’s debt and results of operations in its pro-rata calculations, based on a loan guaranty and/or the terms of the related joint ventu agreement. |
| (c) | See “Joint Venture Real Estate Summary”, for details of the Cedar/RioCan portfolio. |
14
CEDAR REALTY TRUST, INC.
Leasing Activity
Renewals (a)
| Contractual | Prior | Annual | ||||||||||||||||||||||||||
| Quarter | Leases | Aggregate | Rent Per | Rent Per | Increase | Cash Basis | Average | |||||||||||||||||||||
| ended |
Signed | GLA | Sq. Ft (b) | Sq. Ft (c) | in Rent | % Increase | Lease Term (c) | |||||||||||||||||||||
| 12/31/2011 |
31 | 82,000 | $ | 16.03 | $ | 15.25 | $ | 64,000 | 5.1 | % | 3.4 | yrs | ||||||||||||||||
| 9/30/2011 |
28 | 203,000 | 10.53 | 10.01 | 104,000 | 5.1 | % | 6.2 | yrs | |||||||||||||||||||
| 6/30/2011 |
23 | 64,000 | 13.05 | 12.43 | 40,000 | 5.0 | % | 3.7 | yrs | |||||||||||||||||||
| 3/31/2011 |
26 | 359,000 | 8.96 | 8.45 | 183,000 | 6.0 | % | 4.2 | yrs | |||||||||||||||||||
|
|
|
|
|
|
|
|
|
|
|
|
|
|
|
|||||||||||||||
| 108 | 708,000 | $ | 10.60 | $ | 10.05 | $ | 391,000 | 5.6 | % | 4.6 | yrs | |||||||||||||||||
|
|
|
|
|
|
|
|
|
|
|
|
|
|
|
|||||||||||||||
New Leases
| Contractual | ||||||||||||||||
| Quarter | Leases | Aggregate | Rent Per | Average | ||||||||||||
| ended |
Signed | GLA | Sq. Ft (b) | Lease Term | ||||||||||||
| 12/31/2011 |
21 | 146,000 | $ | 15.89 | 14.5 | yrs | ||||||||||
| 9/30/2011 |
32 | 183,000 | 14.02 | 8.9 | yrs | |||||||||||
| 6/30/2011 |
11 | 36,000 | 17.57 | 7.7 | yrs | |||||||||||
| 3/31/2011 |
11 | 43,000 | 11.87 | 10.4 | yrs | |||||||||||
|
|
|
|
|
|
|
|
|
|||||||||
| 75 | 408,000 | $ | 14.78 | 11.0 | yrs | |||||||||||
|
|
|
|
|
|
|
|
|
|||||||||
Renewal and New Leases
| Contractual | ||||||||||||||||
| Quarter | Leases | Aggregate | Rent Per | Average | ||||||||||||
| ended |
Signed | GLA | Sq. Ft (b) | Lease Term | ||||||||||||
| 12/31/2011 |
52 | 228,000 | $ | 15.94 | 10.5 | yrs | ||||||||||
| 9/30/2011 |
60 | 386,000 | 12.18 | 7.5 | yrs | |||||||||||
| 6/30/2011 |
34 | 100,000 | 14.68 | 5.1 | yrs | |||||||||||
| 3/31/2011 |
37 | 402,000 | 9.27 | 4.9 | yrs | |||||||||||
|
|
|
|
|
|
|
|
|
|||||||||
| 183 | 1,116,000 | $ | 12.13 | 6.9 | yrs | |||||||||||
|
|
|
|
|
|
|
|
|
|||||||||
| (a) | Includes leases that renewed with no increase pursuant to their terms. The renewal results, excluding such leases with no contractual increase, would have been as follows: |
| Quarter | Leases | Aggregate | Cash Basis | |||||||||
| ended |
Signed | GLA | % Increase | |||||||||
| 12/31/2011 |
28 | 73,000 | 5.5 | % | ||||||||
| 9/30/2011 |
25 | 174,000 | 5.8 | % | ||||||||
| 6/30/2011 |
20 | 58,000 | 6.0 | % | ||||||||
| 3/31/2011 |
17 | 303,000 | 7.4 | % | ||||||||
|
|
|
|
|
|
|
|||||||
| 90 | 608,000 | 6.6 | % | |||||||||
|
|
|
|
|
|
|
|||||||
| (b) | Contractual rent per sq. ft. represents the minimum cash rent under the new lease for the first 12 months of the term. |
| (c) | Prior rent per sq. ft. represents the minimum cash rent under the prior lease for the last 12 months of the previous term. |
15
CEDAR REALTY TRUST, INC.
Tenant Concentration (By Annualized Base Rent)
As of December 31, 2011
| Number | Annualized | Percentage | ||||||||||||||||||||||
| of | Annualized | base rent | annualized | |||||||||||||||||||||
| Tenant |
stores | GLA | % of GLA | base rent | per sq. ft. | base rents | ||||||||||||||||||
| Top twenty tenants (a): |
||||||||||||||||||||||||
| Giant Foods |
16 | 981,000 | 10.2 | % | $ | 14,144,000 | $ | 14.42 | 13.9 | % | ||||||||||||||
| LA Fitness |
6 | 251,000 | 2.6 | % | 4,028,000 | 16.05 | 4.0 | % | ||||||||||||||||
| Farm Fresh |
6 | 364,000 | 3.8 | % | 3,909,000 | 10.74 | 3.9 | % | ||||||||||||||||
| Shaw’s |
3 | 180,000 | 1.9 | % | 2,323,000 | 12.91 | 2.3 | % | ||||||||||||||||
| Food Lion |
7 | 243,000 | 2.5 | % | 1,925,000 | 7.92 | 1.9 | % | ||||||||||||||||
| Dollar Tree |
19 | 194,000 | 2.0 | % | 1,908,000 | 9.84 | 1.9 | % | ||||||||||||||||
| Stop & Shop |
3 | 196,000 | 2.0 | % | 1,802,000 | 9.19 | 1.8 | % | ||||||||||||||||
| Shop Rite |
2 | 118,000 | 1.2 | % | 1,695,000 | 18.80 | 1.7 | % | ||||||||||||||||
| Staples |
5 | 104,000 | 1.1 | % | 1,682,000 | 16.17 | 1.7 | % | ||||||||||||||||
| Redner’s |
4 | 202,000 | 2.1 | % | 1,514,000 | 7.50 | 1.5 | % | ||||||||||||||||
| United Artists |
1 | 78,000 | 0.8 | % | 1,456,000 | 18.67 | 1.4 | % | ||||||||||||||||
| Shoppers Food Warehouse |
2 | 120,000 | 1.3 | % | 1,237,000 | 10.31 | 1.2 | % | ||||||||||||||||
| Ukrop’s |
1 | 63,000 | 0.7 | % | 1,098,000 | 17.43 | 1.1 | % | ||||||||||||||||
| Carmike Cinema |
1 | 45,000 | 0.5 | % | 1,034,000 | 22.98 | 1.0 | % | ||||||||||||||||
| Rite Aid |
7 | 83,000 | 0.9 | % | 995,000 | 11.99 | 1.0 | % | ||||||||||||||||
| Giant Eagle |
1 | 84,000 | 0.9 | % | 922,000 | 10.98 | 0.9 | % | ||||||||||||||||
| Marshalls |
4 | 114,000 | 1.2 | % | 819,000 | 7.18 | 0.8 | % | ||||||||||||||||
| Dick’s Sporting Goods |
1 | 56,000 | 0.6 | % | 812,000 | 14.50 | 0.8 | % | ||||||||||||||||
| Home Depot |
1 | 103,000 | 1.1 | % | 773,000 | 7.50 | 0.8 | % | ||||||||||||||||
| Acme Markets |
3 | 172,000 | 1.8 | % | 756,000 | 4.40 | 0.7 | % | ||||||||||||||||
|
|
|
|
|
|
|
|
|
|
|
|
|
|||||||||||||
| Sub-total top twenty tenants |
93 | 3,751,000 | 39.1 | % | 44,832,000 | 11.95 | 44.2 | % | ||||||||||||||||
| Remaining tenants |
779 | 5,039,000 | 52.5 | % | 56,604,000 | 11.23 | 55.8 | % | ||||||||||||||||
|
|
|
|
|
|
|
|
|
|
|
|
|
|||||||||||||
| Sub-total all tenants (b) |
872 | 8,790,000 | 91.6 | % | $ | 101,436,000 | $ | 11.54 | 100.0 | % | ||||||||||||||
|
|
|
|
|
|
|
|||||||||||||||||||
| Vacant space |
N/A | 803,000 | 8.4 | % | ||||||||||||||||||||
|
|
|
|
|
|
|
|||||||||||||||||||
| Total |
872 | 9,593,000 | 100.0 | % | ||||||||||||||||||||
|
|
|
|
|
|
|
|||||||||||||||||||
| (a) | Several of the tenants listed above share common ownership with other tenants: |
| (1) | Giant Foods, Stop & Shop, and Martin’s at Glen Allen (GLA of 63,000; annualized base rent of $418,000), and (2) Farm Fresh, Shaw’s, Shop ‘n Save (GLA of 53,000; annualized base rent of $532,000) , Shoppers Food Warehouse, and Acme Markets. |
| (b) | Comprised of large tenants (greater than 15,000 sq. ft.) and small tenants as follows: |
| Annualized | Percentage | |||||||||||||||||||
| Annualized | base rent | annualized | ||||||||||||||||||
| GLA | % of GLA | base rent | per sq. ft. | base rents | ||||||||||||||||
| Large tenants |
6,224,000 | 70.8 | % | $ | 61,853,000 | $ | 9.94 | 61.0 | % | |||||||||||
| Small tenants |
2,566,000 | 29.2 | % | 39,583,000 | 15.43 | 39.0 | % | |||||||||||||
|
|
|
|
|
|
|
|
|
|
|
|||||||||||
| Total |
8,790,000 | 100.0 | % | $ | 101,436,000 | $ | 11.54 | 100.0 | % | |||||||||||
|
|
|
|
|
|
|
|
|
|
|
|||||||||||
16
CEDAR REALTY TRUST, INC.
Lease Expirations
As of December 31, 2011
| Percentage | ||||||||||||||||||||||||
| Number | Percentage | Annualized | Annualized | of annualized | ||||||||||||||||||||
| Year of lease | of leases | GLA | of GLA | expiring | expiring base | expiring | ||||||||||||||||||
| expiration |
expiring | expiring | expiring | base rents | rents per sq. ft. | base rents | ||||||||||||||||||
| Month-To-Month |
18 | 47,000 | 0.5 | % | $ | 562,000 | $ | 11.96 | 0.6 | % | ||||||||||||||
| 2012 |
107 | 377,000 | 4.3 | % | 4,364,000 | 11.58 | 4.3 | % | ||||||||||||||||
| 2013 |
119 | 520,000 | 5.9 | % | 6,985,000 | 13.43 | 6.9 | % | ||||||||||||||||
| 2014 |
132 | 1,185,000 | 13.5 | % | 10,642,000 | 8.98 | 10.5 | % | ||||||||||||||||
| 2015 |
135 | 1,267,000 | 14.4 | % | 13,465,000 | 10.63 | 13.3 | % | ||||||||||||||||
| 2016 |
117 | 1,025,000 | 11.7 | % | 11,112,000 | 10.84 | 11.0 | % | ||||||||||||||||
| 2017 |
67 | 815,000 | 9.3 | % | 9,712,000 | 11.92 | 9.6 | % | ||||||||||||||||
| 2018 |
36 | 480,000 | 5.5 | % | 6,478,000 | 13.50 | 6.4 | % | ||||||||||||||||
| 2019 |
25 | 330,000 | 3.8 | % | 3,745,000 | 11.35 | 3.7 | % | ||||||||||||||||
| 2020 |
32 | 884,000 | 10.1 | % | 8,123,000 | 9.19 | 8.0 | % | ||||||||||||||||
| 2021 |
29 | 404,000 | 4.6 | % | 5,698,000 | 14.10 | 5.6 | % | ||||||||||||||||
| 2022 |
6 | 40,000 | 0.5 | % | 540,000 | 13.50 | 0.5 | % | ||||||||||||||||
| Thereafter |
49 | 1,416,000 | 16.1 | % | 20,010,000 | 14.13 | 19.7 | % | ||||||||||||||||
|
|
|
|
|
|
|
|
|
|
|
|
|
|||||||||||||
| All tenants |
872 | 8,790,000 | 100.0 | % | $ | 101,436,000 | $ | 11.54 | 100.0 | % | ||||||||||||||
|
|
|
|
|
|
|
|||||||||||||||||||
| Vacant space |
N/A | 803,000 | N/A | |||||||||||||||||||||
|
|
|
|
|
|
|
|||||||||||||||||||
| Total portfolio |
872 | 9,593,000 | N/A | |||||||||||||||||||||
|
|
|
|
|
|
|
|||||||||||||||||||
17
CEDAR REALTY TRUST, INC.
Property Net Operating Income (“NOI”)
Same-Property (a)
| Three months ended December 31, | Percent | Years ended December 31, | Percent | |||||||||||||||||||||
| 2011 | 2010 | Change | 2011 | 2010 | Change | |||||||||||||||||||
| Rental revenues (b) |
$ | 25,839,000 | $ | 25,441,000 | 1.6 | % | $ | 103,044,000 | $ | 101,727,000 | 1.3 | % | ||||||||||||
| Operating expenses (c) |
7,433,000 | 7,554,000 | -1.6 | % | 31,194,000 | 30,667,000 | 1.7 | % | ||||||||||||||||
|
|
|
|
|
|
|
|
|
|||||||||||||||||
| $ | 18,406,000 | $ | 17,887,000 | 2.9 | % | $ | 71,850,000 | $ | 71,060,000 | 1.1 | % | |||||||||||||
|
|
|
|
|
|
|
|
|
|||||||||||||||||
| Occupancy |
93.3 | % | 93.0 | % | 93.3 | % | 93.0 | % | ||||||||||||||||
| No. of properties |
63 | 63 | 63 | 63 | ||||||||||||||||||||
| (a) | Same properties include only those consolidated properties that were owned and operated for the entirity of both comparative periods, and exclude ground-up developments and redevelopment properties, and properties treated as “held for sale/conveyance”. |
| (b) | Property revenues exclude the effects of straight-line rent adjustments and amortization of intangible lease liabilities. |
| (c) | Property operating expenses include intercompany management fee expense. |
18
CEDAR REALTY TRUST, INC.
Significant 2011 Acquisitions and Dispositions
Acquisitions
| GLA / | Date | Purchase | ||||||||||||
| Property |
Location |
Acreage | Acquired | Price | ||||||||||
| Colonial Commons |
Lower Paxton Township, PA | 474,765 | 1/14/2011 | $ | 49,100,000 | |||||||||
|
|
|
|||||||||||||
Dispositions
| GLA / | Date | Sales | ||||||||||||
| Property |
Location |
Acreage | Sold | Price | ||||||||||
| Bergstrasse Land |
Ephrata, PA | 7.7 acres | 2/14/2011 | $ | 1,900,000 | |||||||||
| Enon Discount Drug Mart Plaza |
Enon, OH | 42,876 | 3/30/2011 | 2,125,000 | ||||||||||
| Hills & Dales Discount Drug Mart Plaza |
Canton, OH | 33,553 | 3/30/2011 | 1,907,000 | ||||||||||
| Fairfield Plaza |
Fairfield, CT | 72,279 | 4/15/2011 | 10,840,000 | ||||||||||
| CVS at Kingston |
Kingston, NY | 13,013 | 11/14/2011 | 5,250,000 | ||||||||||
| CVS at Kinderhook |
Kinderhook, NY | 13,225 | 12/8/2011 | 4,000,000 | ||||||||||
| Shoppes at Salem Run |
Fredericksburg, VA | 15,100 | 12/12/2011 | 1,675,000 | ||||||||||
| Virginia Center Commons |
Glen Allen, VA | 9,763 | 12/21/2011 | 3,550,000 | ||||||||||
| Centerville Discount Drug Mart Plaza |
Centerville, OH | 49,287 | 12/28/2011 | 2,743,000 | ||||||||||
| Clyde Discount Drug Mart Plaza |
Clyde, OH | 34,592 | 12/28/2011 | 1,903,000 | ||||||||||
| FirstMerit Bank at Cuyahoga Falls |
Cuyahoga Falls, OH | 3,200 | 12/28/2011 | 915,000 | ||||||||||
| Lodi Discount Drug Mart Plaza |
Lodi, OH | 38,576 | 12/28/2011 | 2,319,000 | ||||||||||
| Mason Discount Drug Mart Plaza |
Mason, OH | 52,896 | 12/28/2011 | 4,653,000 | ||||||||||
| Ontario Discount Drug Mart Plaza |
Ontario, OH | 38,623 | 12/28/2011 | 2,141,000 | ||||||||||
| Pickerington Discount Drug Mart Plaza |
Pickerington, OH | 47,810 | 12/28/2011 | 4,072,000 | ||||||||||
| Polaris Discount Drug Mart Plaza |
Polaris, OH | 50,283 | 12/28/2011 | 4,370,000 | ||||||||||
| Shelby Discount Drug Mart Plaza |
Shelby, OH | 36,596 | 12/28/2011 | 2,141,000 | ||||||||||
|
|
|
|||||||||||||
| Total |
$ | 56,504,000 | ||||||||||||
|
|
|
|||||||||||||
19

Cedar/RioCan Unconsolidated 20%-Owned Joint Venture
CEDAR REALTY TRUST, INC.
Cedar/RioCan Joint Venture
Combined Balance Sheets
| December 31, | ||||||||
| 2011 | 2010 | |||||||
| Assets: |
||||||||
| Real estate, net |
$ | 532,071,000 | $ | 524,447,000 | ||||
| Cash and cash equivalents |
12,797,000 | 5,934,000 | ||||||
| Restricted cash |
3,689,000 | 4,464,000 | ||||||
| Rents and other receivables |
2,419,000 | 2,074,000 | ||||||
| Straight-line rents |
2,743,000 | 1,000,000 | ||||||
| Deferred charges, net |
12,682,000 | 13,269,000 | ||||||
| Other assets |
5,549,000 | 8,514,000 | ||||||
|
|
|
|
|
|||||
| Total assets |
$ | 571,950,000 | $ | 559,702,000 | ||||
|
|
|
|
|
|||||
| Liabilities and partners’ capital: |
||||||||
| Mortgage loans payable |
$ | 317,293,000 | $ | 293,400,000 | ||||
| Due to Cedar |
1,203,000 | 6,036,000 | ||||||
| Unamortized intangible lease liabilities |
22,182,000 | 24,573,000 | ||||||
| Other liabilities |
8,248,000 | 7,738,000 | ||||||
|
|
|
|
|
|||||
| Total liabilities |
348,926,000 | 331,747,000 | ||||||
|
|
|
|
|
|||||
| Preferred stock |
97,000 | 97,000 | ||||||
|
|
|
|
|
|||||
| Accumulated other comprehensive (loss) |
(590,000 | ) | — | |||||
|
|
|
|
|
|||||
| Partners’ capital: |
||||||||
| RioCan |
178,774,000 | 181,239,000 | ||||||
| Cedar |
44,743,000 | 46,619,000 | ||||||
|
|
|
|
|
|||||
| Total partners’ capital |
223,517,000 | 227,858,000 | ||||||
|
|
|
|
|
|||||
| Total liabilities and partners’ capital |
$ | 571,950,000 | $ | 559,702,000 | ||||
|
|
|
|
|
|||||
21
CEDAR REALTY TRUST, INC.
Cedar/RioCan Joint Venture
Combined Statements of Operations
| Three months ended December 31, | ||||||||
| 2011 | 2010 | |||||||
| Revenues |
$ | 15,673,000 | $ | 15,136,000 | ||||
| Property operating and other expenses |
(1,304,000 | ) | (799,000 | ) | ||||
| Management fees |
(555,000 | ) | (470,000 | ) | ||||
| Real estate taxes |
(1,837,000 | ) | (1,627,000 | ) | ||||
| Acquisition transaction costs |
(4,000 | ) | (2,658,000 | ) | ||||
| General and administrative |
(89,000 | ) | (467,000 | ) | ||||
| Depreciation and amortization |
(5,137,000 | ) | (6,063,000 | ) | ||||
| Interest and other non-operating expenses, net |
(4,164,000 | ) | (3,737,000 | ) | ||||
|
|
|
|
|
|||||
| Net income (loss) |
$ | 2,583,000 | $ | (685,000 | ) | |||
|
|
|
|
|
|||||
| RioCan |
2,064,000 | (547,000 | ) | |||||
| Cedar |
519,000 | (138,000 | ) | |||||
|
|
|
|
|
|||||
| $ | 2,583,000 | $ | (685,000 | ) | ||||
|
|
|
|
|
|||||
| Years ended December 31, | ||||||||
| 2011 | 2010 | |||||||
| Revenues |
$ | 62,500,000 | $ | 30,194,000 | ||||
| Property operating and other expenses |
(6,631,000 | ) | (2,636,000 | ) | ||||
| Management fees |
(2,006,000 | ) | (973,000 | ) | ||||
| Real estate taxes |
(7,214,000 | ) | (3,286,000 | ) | ||||
| Acquisition transaction costs |
(917,000 | ) | (7,119,000 | ) | ||||
| General and administrative |
(308,000 | ) | (622,000 | ) | ||||
| Depreciation and amortization |
(20,616,000 | ) | (9,523,000 | ) | ||||
| Interest and other non-operating expenses, net |
(18,078,000 | ) | (7,903,000 | ) | ||||
|
|
|
|
|
|||||
| Net income (loss) |
$ | 6,730,000 | $ | (1,868,000 | ) | |||
|
|
|
|
|
|||||
| RioCan |
5,384,000 | (1,493,000 | ) | |||||
| Cedar |
1,346,000 | (375,000 | ) | |||||
|
|
|
|
|
|||||
| $ | 6,730,000 | $ | (1,868,000 | ) | ||||
|
|
|
|
|
|||||
22
CEDAR REALTY TRUST, INC.
Cedar/RioCan Joint Venture
Real Estate Summary — As of December 31, 2011
| Property Description |
Percent owned by Cedar |
State | GLA | % occupied |
Average base rent per leased sq. ft. |
Major Tenants (a) | ||||||||||||||||||
| Name | GLA | |||||||||||||||||||||||
| Connecticut |
||||||||||||||||||||||||
| Montville Commons |
20 | % | CT | 117,916 | 97.5 | % | $ | 15.00 | Stop & Shop | 63,000 | ||||||||||||||
| Stop & Shop Plaza |
20 | % | CT | 54,510 | 100.0 | % | 16.69 | Stop & Shop | 54,510 | |||||||||||||||
|
|
|
|||||||||||||||||||||||
| Total Connecticut |
172,426 | 98.3 | % | 15.54 | ||||||||||||||||||||
|
|
|
|||||||||||||||||||||||
| Maryland |
||||||||||||||||||||||||
| Marlboro Crossroads |
20 | % | MD | 67,975 | 100.0 | % | 15.07 | Giant Foods | 60,951 | |||||||||||||||
|
|
|
|||||||||||||||||||||||
| Massachusetts |
||||||||||||||||||||||||
| Franklin Village Plaza |
20 | % | MA | 304,347 | 93.2 | % | 19.72 | Stop & Shop | 75,000 | |||||||||||||||
| Marshalls | 26,890 | |||||||||||||||||||||||
| Team Fitness | 15,807 | |||||||||||||||||||||||
| Northwoods Crossing |
20 | % | MA | 159,562 | 100.0 | % | 11.70 | BJ’s Wholesale Club | 115,367 | |||||||||||||||
| Tractor Supply | 19,097 | |||||||||||||||||||||||
| Raynham Commons |
20 | % | MA | 176,609 | 97.7 | % | 11.57 | Shaw’s | 60,748 | |||||||||||||||
| Marshall’s | 25,752 | |||||||||||||||||||||||
| JoAnn Fabrics | 15,775 | |||||||||||||||||||||||
|
|
|
|||||||||||||||||||||||
| Total Massachusetts |
640,518 | 96.2 | % | 15.36 | ||||||||||||||||||||
|
|
|
|||||||||||||||||||||||
| New Jersey |
||||||||||||||||||||||||
| Cross Keys Place |
20 | % | NJ | 148,173 | 100.0 | % | 16.21 | Sports Authority | 42,000 | |||||||||||||||
| Bed Bath & Beyond | 35,005 | |||||||||||||||||||||||
| AC Moore | 21,305 | |||||||||||||||||||||||
| Old Navy | 19,234 | |||||||||||||||||||||||
| Petco | 16,500 | |||||||||||||||||||||||
| Sunrise Plaza |
20 | % | NJ | 261,060 | 97.1 | % | 7.63 | Home Depot | 130,601 | |||||||||||||||
| Kohl’s Department Store | 96,171 | |||||||||||||||||||||||
| Staples | 20,388 | |||||||||||||||||||||||
|
|
|
|||||||||||||||||||||||
| Total New Jersey |
409,233 | 98.2 | % | 10.79 | ||||||||||||||||||||
|
|
|
|||||||||||||||||||||||
| Pennsylvania |
||||||||||||||||||||||||
| Blue Mountain Commons |
20 | % | PA | 123,353 | 92.6 | % | 25.50 | Giant Foods | 97,707 | |||||||||||||||
| Columbus Crossing |
20 | % | PA | 142,166 | 100.0 | % | 17.21 | Super Fresh | 61,506 | |||||||||||||||
| Old Navy | 25,000 | |||||||||||||||||||||||
| AC Moore | 22,000 | |||||||||||||||||||||||
| Creekview Plaza |
20 | % | PA | 136,423 | 100.0 | % | 15.36 | Giant Foods | 48,966 | |||||||||||||||
| L.A. Fitness | 38,000 | |||||||||||||||||||||||
| Bed Bath & Beyond | 25,000 | |||||||||||||||||||||||
| Exeter Commons |
20 | % | PA | 361,321 | 97.9 | % | 12.84 | Lowe’s | 171,069 | |||||||||||||||
| Giant Foods | 81,715 | |||||||||||||||||||||||
| Staples | 18,008 | |||||||||||||||||||||||
| Gettysburg Marketplace |
20 | % | PA | 82,784 | 93.9 | % | 20.23 | Giant Foods | 66,674 | |||||||||||||||
| Loyal Plaza |
20 | % | PA | 293,825 | 98.3 | % | 8.06 | K-Mart | 102,558 | |||||||||||||||
| Giant Foods | 66,935 | |||||||||||||||||||||||
| Staples | 20,555 | |||||||||||||||||||||||
| Monroe Marketplace |
20 | % | PA | 340,930 | 96.2 | % | 10.52 | Giant Food | 79,500 | |||||||||||||||
| Kohl’s Department Store | 68,430 | |||||||||||||||||||||||
| Dick’s Sporting Goods | 51,119 | |||||||||||||||||||||||
| Best Buy | 22,504 | |||||||||||||||||||||||
| Bed Bath & Beyond | 21,324 | |||||||||||||||||||||||
| Michael’s | 20,649 | |||||||||||||||||||||||
| Pet Smart | 18,156 | |||||||||||||||||||||||
| Northland Center |
20 | % | PA | 108,260 | 97.6 | % | 9.83 | Giant Foods | 65,075 | |||||||||||||||
| Pitney Road Plaza |
20 | % | PA | 45,915 | 100.0 | % | 19.75 | Best Buy | 45,915 | |||||||||||||||
| Sunset Crossing |
20 | % | PA | 74,142 | 88.7 | % | 14.52 | Giant Foods | 54,332 | |||||||||||||||
| Town Square Plaza |
20 | % | PA | 127,678 | 100.0 | % | 13.01 | Giant Foods | 75,727 | |||||||||||||||
| A.C. Moore | 21,600 | |||||||||||||||||||||||
| Pet Smart | 18,343 | |||||||||||||||||||||||
| York Marketplace |
20 | % | PA | 305,410 | 96.1 | % | 8.53 | Lowe’s | 125,353 | |||||||||||||||
| Giant Foods | 74,600 | |||||||||||||||||||||||
| Office Max | 23,500 | |||||||||||||||||||||||
| Super Shoes | 20,000 | |||||||||||||||||||||||
|
|
|
|||||||||||||||||||||||
| Total Pennsylvania |
2,142,207 | 97.1 | % | 12.70 | ||||||||||||||||||||
|
|
|
|||||||||||||||||||||||
| Virginia |
||||||||||||||||||||||||
| New River Valley |
20 | % | VA | 164,663 | 96.1 | % | 13.78 | Best Buy | 30,041 | |||||||||||||||
| Ross Stores | 30,037 | |||||||||||||||||||||||
| Bed Bath & Beyond | 24,152 | |||||||||||||||||||||||
| Staples | 20,443 | |||||||||||||||||||||||
| Petsmart | 17,878 | |||||||||||||||||||||||
| Old Navy | 15,413 | |||||||||||||||||||||||
| Towne Crossing |
20 | % | VA | 111,016 | 90.6 | % | 15.29 | Bed Bath & Beyond | 40,000 | |||||||||||||||
| Michael’s | 20,000 | |||||||||||||||||||||||
| Total Virginia |
275,679 | 93.9 | % | 14.37 | ||||||||||||||||||||
|
|
|
|||||||||||||||||||||||
| Total Cedar/RioCan Joint Venture |
3,708,038 | 96.9 | % | $ | 13.24 | |||||||||||||||||||
|
|
|
|||||||||||||||||||||||
| (a) | Major tenants are determined as tenants with 15,000 or more sq.ft of GLA. |
23
CEDAR REALTY TRUST, INC.
Cedar/RioCan Joint Venture
Summary of Outstanding Debt
| Stated contract amounts | ||||||||||||||||
| Property |
Maturity Date |
Interest rate |
December 31, 2011 |
December 31, 2010 |
||||||||||||
| Raynham Commons |
Mar 2014 | 5.6 | % | $ | 14,200,000 | $ | 14,200,000 | |||||||||
| Columbus Crossing |
Jun 2014 | 6.8 | % | 16,308,000 | 16,604,000 | |||||||||||
| Blue Mountain Commons |
Jul 2015 | 5.0 | % | 17,379,000 | 17,646,000 | |||||||||||
| Sunset Crossing |
Jul 2015 | 5.0 | % | 4,167,000 | 4,231,000 | |||||||||||
| Town Square Plaza |
Jul 2015 | 5.0 | % | 10,757,000 | 10,922,000 | |||||||||||
| Creekview Plaza |
Oct 2015 | 4.8 | % | 14,183,000 | 14,398,000 | |||||||||||
| Monroe Marketplace |
Oct 2015 | 4.8 | % | 22,696,000 | 23,040,000 | |||||||||||
| New River Valley |
Oct 2015 | 4.8 | % | 14,903,000 | 15,127,000 | |||||||||||
| Pitney Road Valley |
Oct 2015 | 4.8 | % | 5,978,000 | 6,068,000 | |||||||||||
| Sunrise Plaza |
Oct 2015 | 4.8 | % | 13,491,000 | 13,695,000 | |||||||||||
| Northwoods Crossing |
Feb 2016 | 6.4 | % | 14,182,000 | — | |||||||||||
| Franklin Village |
Aug 2016 | 4.1 | % | 43,751,000 | 43,500,000 | |||||||||||
| Stop & Shop Plaza |
Apr 2017 | 6.2 | % | 6,870,000 | 6,950,000 | |||||||||||
| Exeter Commons |
Aug 2020 | 5.3 | % | 29,436,000 | 29,863,000 | |||||||||||
| Cross Keys Place |
Dec 2020 | 5.1 | % | 14,401,000 | 14,600,000 | |||||||||||
| Gettysburg Marketplace |
Dec 2020 | 5.0 | % | 10,765,000 | 10,918,000 | |||||||||||
| Marlboro Crossroads |
Dec 2020 | 5.1 | % | 6,781,000 | 6,875,000 | |||||||||||
| Northland Center |
Dec 2020 | 5.0 | % | 6,209,000 | 6,298,000 | |||||||||||
| Towne Crossings |
Dec 2020 | 5.0 | % | 10,304,000 | 10,450,000 | |||||||||||
| York Marketplace |
Dec 2020 | 5.0 | % | 15,836,000 | 16,060,000 | |||||||||||
| Montville Commons |
Jan 2021 | 5.8 | % | 10,393,000 | — | |||||||||||
| Loyal Plaza |
Jul 2021 | 5.0 | % | 14,717,000 | 12,388,000 | |||||||||||
|
|
|
|
|
|||||||||||||
| Total mortgages at stated contract amounts |
5.0 years | 5.1 | % | 317,707,000 | 293,833,000 | |||||||||||
| [weighted average] | ||||||||||||||||
| Unamortized discount |
(414,000 | ) | (433,000 | ) | ||||||||||||
|
|
|
|
|
|||||||||||||
| Total mortgage debt (including unamortized discount) |
|
$ | 317,293,000 | $ | 293,400,000 | |||||||||||
|
|
|
|
|
|||||||||||||
| Cedar’s pro-rata share of total debt |
|
$ | 63,459,000 | $ | 58,680,000 | |||||||||||
|
|
|
|
|
|||||||||||||
24
CEDAR REALTY TRUST, INC.
Cedar/RioCan Joint Venture
Summary of Debt Maturities
As of December 31, 2011
| Maturity schedule by year |
Cedar pro-rata share of: | RioCan pro-rata share of: | Cedar/RioCan Total |
|||||||||||||||||||||||||
| Scheduled Amortization |
Balloon Payments |
Total | Scheduled Amortization |
Balloon Payments |
Total | |||||||||||||||||||||||
| 2012 |
$ | 971,000 | $ | — | $ | 971,000 | $ | 3,884,000 | $ | — | $ | 3,884,000 | $ | 4,855,000 | ||||||||||||||
| 2013 |
1,021,000 | — | 1,021,000 | 4,084,000 | — | 4,084,000 | 5,105,000 | |||||||||||||||||||||
| 2014 |
1,040,000 | 5,941,000 | 6,981,000 | 4,160,000 | 23,763,000 | 27,923,000 | 34,904,000 | |||||||||||||||||||||
| 2015 |
937,000 | 19,411,000 | 20,348,000 | 3,747,000 | 77,642,000 | 81,389,000 | 101,737,000 | |||||||||||||||||||||
| 2016 |
3,049,000 | 7,990,000 | 11,039,000 | 12,194,000 | 31,960,000 | 44,154,000 | 55,193,000 | |||||||||||||||||||||
| 2017 |
473,000 | 1,271,000 | 1,744,000 | 1,890,000 | 5,085,000 | 6,975,000 | 8,719,000 | |||||||||||||||||||||
| 2018 |
465,000 | — | 465,000 | 1,861,000 | — | 1,861,000 | 2,326,000 | |||||||||||||||||||||
| 2019 |
503,000 | — | 503,000 | 2,014,000 | — | 2,014,000 | 2,517,000 | |||||||||||||||||||||
| 2020 |
385,000 | 15,758,000 | 16,143,000 | 1,541,000 | 63,034,000 | 64,575,000 | 80,718,000 | |||||||||||||||||||||
| 2021 |
— | 4,244,000 | 4,244,000 | — | 16,975,000 | 16,975,000 | 21,219,000 | |||||||||||||||||||||
| Thereafter |
— | — | — | — | — | — | — | |||||||||||||||||||||
|
|
|
|
|
|
|
|
|
|
|
|
|
|
|
|||||||||||||||
| $ | 8,844,000 | $ | 54,615,000 | $ | 63,459,000 | $ | 35,375,000 | $ | 218,459,000 | $ | 253,834,000 | $ | 317,293,000 | |||||||||||||||
|
|
|
|
|
|
|
|
|
|
|
|
|
|
|
|||||||||||||||
25
CEDAR REALTY TRUST, INC.
Cedar/RioCan Joint Venture
Significant 2011 Acquisitions and Dispositions
Acquisitions
| Property |
Location | GLA / Acreage |
Date Acquired |
Purchase Price |
||||||||||
| Northwoods Crossing |
Taunton, MA | 159,562 | 4/15/2011 | $ | 23,400,000 | |||||||||
Dispositions
| Property |
Location | GLA / Acreage |
Date Sold |
Sales Price | ||||
| None |
26
Properties Held For Sale/Conveyance
CEDAR REALTY TRUST, INC.
Summary of Real Estate Held for Sale/Conveyance
As of December 31, 2011
| Average | ||||||||||||||||||||||||||
| Percent | % | base rent per | Major Tenants (a) | |||||||||||||||||||||||
| Property Description |
State | owned | GLA | occupied | leased sq. ft. | Name | GLA | |||||||||||||||||||
| Ohio Discount Drug Mart Portfolio |
||||||||||||||||||||||||||
| Gahanna Discount Drug Mart Plaza |
OH | 100 | % | 48,667 | 85.7 | % | 14.10 | Discount Drug Mart | 24,592 | |||||||||||||||||
| Grove City Discount Drug Mart Plaza |
OH | 100 | % | 40,848 | 64.5 | % | 11.06 | Discount Drug Mart | 24,596 | |||||||||||||||||
| Hilliard Discount Drug Mart Plaza |
OH | 100 | % | 40,988 | 80.3 | % | 10.61 | Discount Drug Mart | 24,592 | |||||||||||||||||
| Westlake Discount Drug Mart Plaza |
OH | 100 | % | 55,775 | 88.0 | % | 5.83 | BG Storage | 24,600 | |||||||||||||||||
| Discount Drug Mart | 24,480 | |||||||||||||||||||||||||
|
|
|
|||||||||||||||||||||||||
| Total Ohio Discount Drug Mart Portfolio |
186,278 | 80.5 | % | 10.10 | ||||||||||||||||||||||
|
|
|
|||||||||||||||||||||||||
| Single-Tenant/Triple-Net-Lease Properties |
||||||||||||||||||||||||||
| CVS at Bradford |
OH | 100 | % | 10,722 | 100.0 | % | 12.80 | CVS | 10,722 | |||||||||||||||||
| CVS at Celina |
OH | 100 | % | 10,195 | 100.0 | % | 18.54 | CVS | 10,195 | |||||||||||||||||
| CVS at Erie |
OH | 100 | % | 10,125 | 100.0 | % | 16.50 | CVS | 10,125 | |||||||||||||||||
| CVS at Naugatuck |
CT | 50 | % | 13,225 | 100.0 | % | 35.01 | CVS | 13,225 | |||||||||||||||||
| CVS at Portage Trail |
OH | 100 | % | 10,722 | 100.0 | % | 13.00 | CVS | 10,722 | |||||||||||||||||
| FirstMerit Bank at Akron |
OH | 100 | % | 3,200 | 100.0 | % | 23.51 | FirstMerit Bank | 3,200 | |||||||||||||||||
| McCormick Place |
OH | 100 | % | 46,000 | 100.0 | % | 4.50 | Sam Levin Furniture | 46,000 | |||||||||||||||||
| Rite Aid at Massillon |
OH | 100 | % | 10,125 | 100.0 | % | 18.99 | Rite Aid | 10,125 | |||||||||||||||||
|
|
|
|||||||||||||||||||||||||
| Total Single-Tenant/Triple-Net-Lease Properties |
114,314 | 100.0 | % | 13.74 | ||||||||||||||||||||||
|
|
|
|||||||||||||||||||||||||
| Malls |
||||||||||||||||||||||||||
| Columbia Mall |
PA | 100 | % | 348,358 | 86.0 | % | 4.26 | Sears | 64,264 | |||||||||||||||||
| Dunham Sports | 61,178 | |||||||||||||||||||||||||
| Bon-Ton | 45,000 | |||||||||||||||||||||||||
| J.C. Penny | 34,076 | |||||||||||||||||||||||||
| Shore Mall |
NJ | 100 | % | 459,058 | 99.4 | % | 7.44 | Boscov’s | 172,200 | |||||||||||||||||
| Burlington Coat Factory | 85,000 | |||||||||||||||||||||||||
| The Point at Carlisle |
PA | 100 | % | 182,859 | 88.1 | % | 6.69 | Bon-Ton | 59,925 | |||||||||||||||||
| Office Max | 22,645 | |||||||||||||||||||||||||
| Dunham Sports | 21,300 | |||||||||||||||||||||||||
| Dollar Tree | 16,300 | |||||||||||||||||||||||||
|
|
|
|||||||||||||||||||||||||
| Total Malls |
990,275 | 92.6 | % | 6.27 | ||||||||||||||||||||||
|
|
|
|||||||||||||||||||||||||
| Other Non-Core Assets |
||||||||||||||||||||||||||
| Dunmore Shopping Center |
PA | 100 | % | 101,000 | 66.2 | % | 3.69 | Enyon Furniture Outlet | 40,000 | |||||||||||||||||
| Big Lots | 26,902 | |||||||||||||||||||||||||
| Heritage Crossing |
PA | 60 | % (b) | 39,048 | 72.0 | % | 23.59 | Walgreens | 14,748 | |||||||||||||||||
| Oakhurst Plaza |
PA | 100 | % | 111,869 | 61.9 | % | 13.14 | Gold’s Gym | 31,699 | |||||||||||||||||
| Roosevelt II |
PA | 100 | % | 180,088 | 0.0 | % | — | Vacant | N/A | |||||||||||||||||
| Stadium Plaza |
MI | 100 | % | 77,688 | 100.0 | % | 7.63 | Hobby Lobby Stores | 54,650 | |||||||||||||||||
|
|
|
|||||||||||||||||||||||||
| Total Other Non-Core Assets |
509,693 | 47.5 | % | 9.97 | ||||||||||||||||||||||
|
|
|
|||||||||||||||||||||||||
| Homburg Joint Venture: |
||||||||||||||||||||||||||
| Aston Center |
PA | 20 | % | 55,000 | 100.0 | % | 25.45 | Giant Foods | 55,000 | |||||||||||||||||
| Ayr Town Center |
PA | 20 | % | 58,000 | 94.5 | % | 15.36 | Giant Foods | 52,400 | |||||||||||||||||
| Parkway Plaza |
PA | 20 | % | 111,028 | 92.6 | % | 14.59 | Giant Foods | 71,335 | |||||||||||||||||
| Pennsboro Commons |
PA | 20 | % | 107,384 | 85.4 | % | 14.61 | Giant Foods | 66,224 | |||||||||||||||||
| Scott Town Center |
PA | 20 | % | 67,933 | 94.1 | % | 18.21 | Giant Foods | 54,333 | |||||||||||||||||
| Spring Meadow Shopping Center |
PA | 20 | % | 70,350 | 100.0 | % | 20.23 | Giant Foods | 67,400 | |||||||||||||||||
| Stonehedge Square |
PA | 20 | % | 88,677 | 97.1 | % | 12.21 | Nell’s Market | 51,687 | |||||||||||||||||
|
|
|
|||||||||||||||||||||||||
| Total Homburg Joint Venture |
558,372 | 94.0 | % | 16.62 | ||||||||||||||||||||||
|
|
|
|||||||||||||||||||||||||
| Total Properties Held for Sale |
2,358,932 | 82.6 | % | $ | 10.25 | |||||||||||||||||||||
|
|
|
|||||||||||||||||||||||||
| Land Parcels Previously Acquired for Development |
||||||||||||||||||||||||||
| Seven land parcels in Pennsylvania |
PA | 100 | % | 84 acres | ||||||||||||||||||||||
| Shore Mall |
NJ | 100 | % | 50 acres | ||||||||||||||||||||||
| Trindle Springs |
NY | 100 | % | 2 acres | ||||||||||||||||||||||
| Wyoming |
MI | 100 | % | 12 acres | ||||||||||||||||||||||
|
|
|
|||||||||||||||||||||||||
| Total Land Parcels Previously Acquired for Development |
148 acres | |||||||||||||||||||||||||
|
|
|
|||||||||||||||||||||||||
| (a) | Major tenants are determined as tenants with 15,000 or more sq.ft. of GLA, tenants at single-tenant properties, or the largest tenant at a property. |
| (b) | The Company has included 100% of this joint venture’s result of operations in its-pro-rata calculations, based on the terms of the related joint venture agreement. |
28
CEDAR REALTY TRUST, INC.
Properties Held for Sale/Conveyance — Summary of Outstanding Debt
| Stated contract amounts | ||||||||||||||||||||
| Property |
Percent Owned |
Maturity Date |
Interest rate (a) |
Dec 31, 2011 |
Dec 31, 2010 |
|||||||||||||||
| Fixed-rate mortgages: |
||||||||||||||||||||
| Roosevelt II |
100 | % | Mar 2012 | 6.5 | % (c) | $ | 12,865,000 | $ | 12,940,000 | |||||||||||
| Spring Meadow Shopping Center |
20 | % | Nov 2014 | 5.9 | % | 12,053,000 | 12,279,000 | |||||||||||||
| Ayr Town Center |
20 | % | Jun 2015 | 5.6 | % | 6,926,000 | 7,056,000 | |||||||||||||
| Scott Town Center |
20 | % | Aug 2015 | 4.9 | % | 8,521,000 | 8,697,000 | |||||||||||||
| Aston Center |
20 | % | Nov 2015 | 5.9 | % | 12,148,000 | 12,358,000 | |||||||||||||
| Pennsboro Commons |
20 | % | Mar 2016 | 5.5 | % | 10,578,000 | 10,769,000 | |||||||||||||
| Gahanna DDM |
100 | % | Nov 2016 | 5.8 | % (c) | 4,845,000 | 4,924,000 | |||||||||||||
| Westlake DDM |
100 | % | Dec 2016 | 5.6 | % (c) | 3,113,000 | 3,165,000 | |||||||||||||
| CVS at Bradford |
100 | % | Mar 2017 | 7.1 | % | 564,000 | 649,000 | |||||||||||||
| Parkway Plaza |
20 | % | May 2017 | 5.5 | % | 14,300,000 | 14,300,000 | |||||||||||||
| Stonehedge Square |
20 | % | Jul 2017 | 6.2 | % | 8,700,000 | 8,700,000 | |||||||||||||
| CVS at Portage Trail |
100 | % | Aug 2017 | 7.8 | % | 612,000 | 694,000 | |||||||||||||
| McCormick Place |
100 | % | Aug 2017 | 6.1 | % (c) | 2,550,000 | 2,587,000 | |||||||||||||
| CVS at Erie |
100 | % | Nov 2018 | 7.1 | % | 857,000 | 950,000 | |||||||||||||
| CVS at Naugatuck |
50 | % | Nov 2019 | 5.3 | % | 2,348,000 | 2,402,000 | |||||||||||||
| CVS at Celina |
100 | % | Jan 2020 | 7.5 | % | 1,120,000 | 1,210,000 | |||||||||||||
| Rite Aid at Massillon |
100 | % | Jan 2020 | 7.7 | % | 1,111,000 | 1,201,000 | |||||||||||||
| Centerville DDM (b) |
100 | % | n/a | n/a | — | 2,743,000 | ||||||||||||||
| Clyde DDM (b) |
100 | % | n/a | n/a | — | 1,903,000 | ||||||||||||||
| CVS at Kingston (b) |
100 | % | n/a | n/a | — | 3,128,000 | ||||||||||||||
| CVS at Kinderhook (b) |
100 | % | n/a | n/a | — | 2,429,000 | ||||||||||||||
| Fairfield Plaza (b) |
100 | % | n/a | n/a | — | 5,009,000 | ||||||||||||||
| Lodi DDM (b) |
100 | % | n/a | n/a | — | 2,319,000 | ||||||||||||||
| Ontario DDM (b) |
100 | % | n/a | n/a | — | 2,141,000 | ||||||||||||||
| Pickerington DDM (b) |
100 | % | n/a | n/a | — | 4,072,000 | ||||||||||||||
| Polaris DDM (b) |
100 | % | n/a | n/a | — | 4,369,000 | ||||||||||||||
| Shelby DDM (b) |
100 | % | n/a | n/a | — | 2,141,000 | ||||||||||||||
|
|
|
|
|
|||||||||||||||||
| Total fixed-rate mortgages |
3.9 years | 5.8 | % | 103,211,000 | 135,135,000 | |||||||||||||||
| [weighted average] | ||||||||||||||||||||
| Variable-rate mortgage: |
||||||||||||||||||||
| Shore Mall |
100 | % | Sept 2012 | 5.9 | % | 18,900,000 | 21,000,000 | |||||||||||||
|
|
|
|
|
|||||||||||||||||
| Total mortgages at stated contract amounts |
3.5 years | 5.9 | % | 122,111,000 | 156,135,000 | |||||||||||||||
| [weighted average] | ||||||||||||||||||||
| Unamortized premium |
493,000 | 856,000 | ||||||||||||||||||
|
|
|
|
|
|||||||||||||||||
| Total mortgage debt (including unamortized premium) |
$ | 122,604,000 | $ | 156,991,000 | ||||||||||||||||
|
|
|
|
|
|||||||||||||||||
| Cedar’s pro-rata share of total debt |
$ | 62,703,000 | $ | 91,260,000 | ||||||||||||||||
|
|
|
|
|
|||||||||||||||||
| (a) | For variable rate debt, rate in effect as of December 31, 2011. |
| (b) | Property was sold during 2011. |
| (c) | With respect to the Company’s plans to convey these properties to their respective lenders, until such conveyances are completed, interest will be recorded (but not paid) at approximately 500 basis points higher than the stated rates. |
29
CEDAR REALTY TRUST, INC.
Properties Held for Sale/Conveyance — Summary of Debt Maturities
As of December 31, 2011
| Maturity | Cedar pro-rata share of: | JV Partners pro-rata share of: | ||||||||||||||||||||||||||
| schedule by year |
Scheduled Amortization |
Balloon Payments |
Total | Scheduled Amortization |
Balloon Payments |
Total | Total | |||||||||||||||||||||
| 2012 |
$ | 991,000 | $ | 31,765,000 | $ | 32,756,000 | $ | 971,000 | $ | — | $ | 971,000 | $ | 33,727,000 | ||||||||||||||
| 2013 |
1,073,000 | — | 1,073,000 | 1,140,000 | — | 1,140,000 | 2,213,000 | |||||||||||||||||||||
| 2014 |
1,131,000 | 2,267,000 | 3,398,000 | 1,161,000 | 9,069,000 | 10,230,000 | 13,628,000 | |||||||||||||||||||||
| 2015 |
1,106,000 | 5,091,000 | 6,197,000 | 826,000 | 20,364,000 | 21,190,000 | 27,387,000 | |||||||||||||||||||||
| 2016 |
1,008,000 | 9,137,000 | 10,145,000 | 336,000 | 7,730,000 | 8,066,000 | 18,211,000 | |||||||||||||||||||||
| 2017 |
690,000 | 6,594,000 | 7,284,000 | 151,000 | 17,184,000 | 17,335,000 | 24,619,000 | |||||||||||||||||||||
| 2018 |
527,000 | — | 527,000 | 41,000 | — | 41,000 | 568,000 | |||||||||||||||||||||
| 2019 |
401,000 | 892,000 | 1,293,000 | 36,000 | 892,000 | 928,000 | 2,221,000 | |||||||||||||||||||||
| 2020 |
30,000 | — | 30,000 | — | — | — | 30,000 | |||||||||||||||||||||
| 2021 |
— | — | — | — | — | — | — | |||||||||||||||||||||
| Thereafter |
— | — | — | — | — | — | — | |||||||||||||||||||||
|
|
|
|
|
|
|
|
|
|
|
|
|
|
|
|||||||||||||||
| $ | 6,957,000 | $ | 55,746,000 | $ | 62,703,000 | $ | 4,662,000 | $ | 55,239,000 | $ | 59,901,000 | $ | 122,604,000 | |||||||||||||||
|
|
|
|
|
|
|
|
|
|
|
|
|
|
|
|||||||||||||||
30
CEDAR REALTY TRUST, INC.
Portfolio Map
As of December 31, 2011
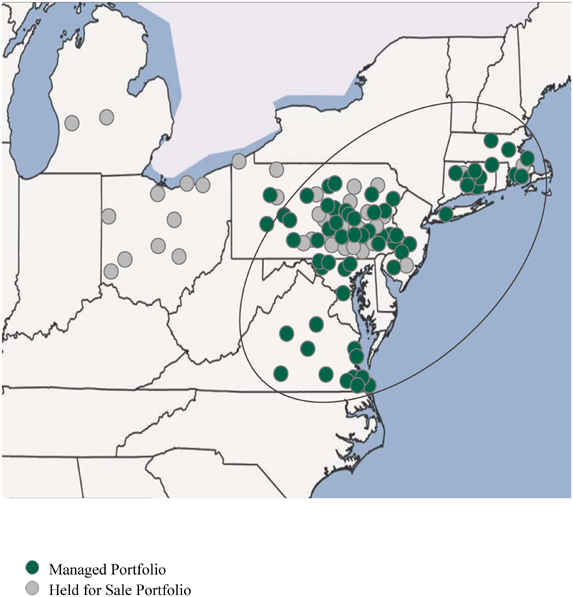
31
CEDAR REALTY TRUST, INC.
Non-GAAP Financial Disclosures
Use of Funds From Operations (“FFO”)
FFO is a widely-recognized non-GAAP financial measure for REITs that the Company believes, when considered with financial statements determined in accordance with GAAP, is useful to investors in understanding financial performance and providing a relevant basis for comparison among REITs. In addition, FFO is useful to investors as it captures features particular to real estate performance by recognizing that real estate generally appreciates over time or maintains residual value to a much greater extent than do other depreciable assets. Investors should review FFO, along with GAAP net income, when trying to understand a REIT’s operating performance. The Company considers FFO an important supplemental measure of its operating performance and believes that it is frequently used by securities analysts, investors and other interested parties in the evaluation of REITs.
The Company computes FFO in accordance with the “White Paper” published by the National Association of Real Estate Investment Trusts (“NAREIT”), which defines FFO as net income applicable to common shareholders (determined in accordance with GAAP), excluding gains or losses from debt restructurings and sales of properties, plus real estate-related depreciation and amortization, and after adjustments for partnerships and joint ventures (which are computed to reflect FFO on the same basis). In addition, NAREIT has recently clarified its computation of FFO so as to exclude impairment charges for all periods presented. FFO does not represent cash generated from operating activities and should not be considered as an alternative to net income applicable to common shareholders or to cash flow from operating activities. FFO is not indicative of cash available to fund ongoing cash needs, including the ability to make cash distributions. Although FFO is a measure used for comparability in assessing the performance of REITs, as the NAREIT White Paper only provides guidelines for computing FFO, the computation of FFO may vary from one company to another.
The Company also presents “Recurring FFO”, which excludes certain items that are not indicative of the results provided by the Company’s operating portfolio and that affect the comparability of the Company’s period-over-period performance, such as management transition charges and employee termination costs, the accelerated write-off of deferred financing costs, mark-to-market adjustments related to stock-based compensation, impairment charges, the write-off of the interest in an unconsolidated joint venture, acquisition transaction costs, and costs related to terminated projects.
Use of Earnings Before Interest, Taxes, Depreciation and Amortization (“EBITDA”)
EBITDA is another widely-recognized non-GAAP financial measure that the Company believes, when considered with financial statements determined in accordance with GAAP, is useful to investors and lenders in understanding financial performance and providing a relevant basis for comparison among other companies, including REITs. While EBITDA should not be considered as a substitute for net income attributable to the Company’s common shareholders, net operating income, cash flow from operating activities, or other income or cash flow data prepared in accordance with GAAP, the Company believes that EBITDA may provide additional information with respect to the Company’s performance or ability to meet its future debt service requirements, capital expenditures and working capital requirements. The Company computes EBITDA by excluding interest expense and amortization of deferred financing costs, and depreciation and amortization, from income from continuing operations.
The Company also presents “Adjusted EBITDA”, which excludes certain items that are not indicative of the results provided by the Company’s operating portfolio and that affect the comparability of the Company’s period-over-period performance, such as mark-to-market adjustments relating to stock-based compensation, impairment charges and the write-off of the interest in an unconsolidated joint venture, management transition charges, and acquisition transaction costs, and costs related to terminated projects. The ratios of debt to Adjusted EBITDA, Adjusted EBITDA to interest expense, and Adjusted EBITDA to fixed charges are additional related measures of financial performance. Because EBITDA from one company to another excludes some, but not all, items that affect net income, the computations of EBITDA may vary from one company to another.
32