Attached files
| file | filename |
|---|---|
| 8-K - FORM 8-K - Amtrust Financial Services, Inc. | v304247_8k.htm |
| EX-10.3 - EXHIBIT 10.3 - Amtrust Financial Services, Inc. | v304247_ex10-3.htm |
| EX-10.1 - EXHIBIT 10.1 - Amtrust Financial Services, Inc. | v304247_ex10-1.htm |
| EX-10.2 - EXHIBIT 10.2 - Amtrust Financial Services, Inc. | v304247_ex10-2.htm |
AmTrust Financial Investor Update Fourth Quarter 2011
Forward Looking Statements This presentation contains certain forward - looking statements that are intended to be covered by the safe harbors created by The Private Securities Litigation Reform Act of 1995 . All statements other than statements of historical fact included in this presentation are forward - looking statements, including statements accompanied by words such as “believe,” “expect,” “anticipate,” “intend,” “estimate,” “plan,” “project” and “continue” or future or conditional verbs such as “will,” “would,” “should,” “could” or “may . ” These statements include the plans and objectives of management for future operations, including those relating to future growth of the Company’s business activities and availability of funds, and are based on current expectations that involve assumptions that are difficult or impossible to predict accurately and many of which are beyond the control of the Company . There can be no assurance that actual developments will be those anticipated by the Company . Actual results may differ materially from those expressed or implied in these statements as a result of significant risks and uncertainties, including the factors set forth in the Company’s filings with the Securities and Exchange Commission, including its Annual Report on Form 10 - K and its quarterly reports on Form 10 - Q . The projections and statements in this presentation speak only as of the date of this presentation and the Company undertakes no obligation to update or revise any forward - looking statement, whether as a result of new information, future developments or otherwise, except as may be required by law . 2
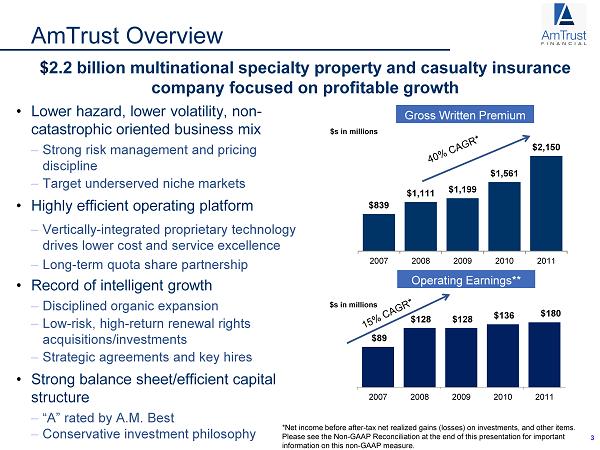
*Net income before after - tax net realized gains (losses) on investments, and other items. Please see the Non - GAAP Reconciliation at the end of this presentation for important information on this non - GAAP measure. $839 $1,111 $1,199 $1,561 $2,150 2007 2008 2009 2010 2011 AmTrust Overview • Lower hazard, lower volatility, non - catastrophic oriented business mix – Strong risk management and pricing discipline – Target underserved niche markets • Highly efficient operating platform – Vertically - integrated proprietary technology drives lower cost and service excellence – Long - term quota share partnership • Record of intelligent growth – Disciplined organic expansion – Low - risk, high - return renewal rights acquisitions/investments – Strategic agreements and key hires • Strong balance sheet/efficient capital structure – “A” rated by A.M. Best – Conservative investment philosophy $ 2.2 billion multinational specialty property and casualty insurance company focused on profitable growth Gross Written Premium $s in millions $89 $128 $128 $136 2007 2008 2009 2010 2011 $s in millions Operating Earnings** 3 $180
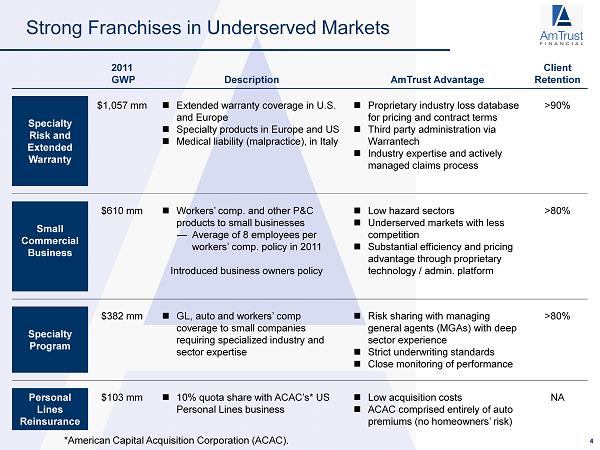
Strong Franchises in Underserved Markets 2011 GWP Description AmTrust Advantage Client Retention Specialty Risk and Extended Warranty $1,057 mm Extended warranty coverage in U.S. and Europe Specialty products in Europe and US Medical liability (malpractice), in Italy Proprietary industry loss database for pricing and contract terms Third party administration via Warrantech Industry expertise and actively managed claims process >90% Small Commercial Business $610 mm Workers’ comp. and other P&C products to small businesses — Average of 8 employees per workers’ comp. policy in 2011 Introduced business owners policy Low hazard sectors Underserved markets with less competition Substantial efficiency and pricing advantage through proprietary technology / admin. platform >80% Specialty Program $382 mm GL, auto and workers’ comp coverage to small companies requiring specialized industry and sector expertise Risk sharing with managing general agents (MGAs) with deep sector experience Strict underwriting standards Close monitoring of performance >80% Personal Lines Reinsurance $103 mm 10% quota share with ACAC’s* US Personal Lines business Low acquisition costs ACAC comprised entirely of auto premiums (no homeowners’ risk) NA 4 *American Capital Acquisition Corporation (ACAC).
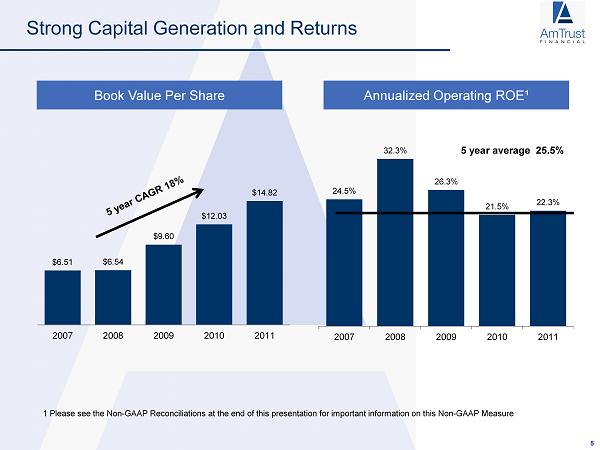
Strong Capital Generation and Returns Book Value Per Share Annualized Operating ROE¹ 5 $6.51 $6.54 $9.60 $12.03 $14.82 2007 2008 2009 2010 2011 24.5% 32.3% 26.3% 21.5% 22.3% 2007 2008 2009 2010 2011 1 Please see the Non - GAAP Reconciliations at the end of this presentation for important information on this Non - GAAP Measure 5 year average 25.5%
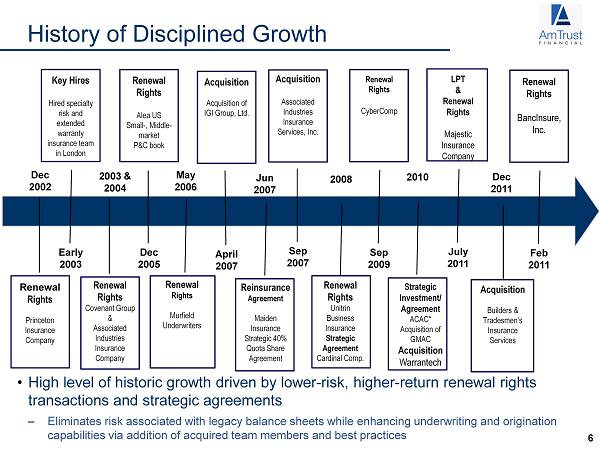
• High level of historic growth driven by lower - risk , higher - return renewal rights transactions and strategic agreements – Eliminates risk associated with legacy balance sheets while enhancing underwriting and origination capabilities via addition of acquired team members and best practices Dec 2002 Renewal Rights Princeton Insurance Company 2003 & 2004 Renewal Rights Covenant Group & Associated Industries Insurance Company May 2006 Renewal Rights Murfield Underwriters Jun 2007 Reinsurance Agreement Maiden Insurance Strategic 40% Quota Share Agreement 2008 Renewal Rights Unitrin Business Insurance Strategic Agreement Cardinal Comp. 2010 Strategic Investment/ Agreement ACAC* Acquisition of GMAC Acquisition Warrantech Early 2003 Key Hires Hired specialty risk and extended warranty insurance team in London April 2007 Acquisition Acquisition of IGI Group, Ltd. Dec 2005 Renewal Rights Alea US Small - , Middle - market P&C book Sep 2007 Acquisition Associated Industries Insurance Services, Inc. Sep 2009 Renewal Rights CyberComp July 2011 LPT & Renewal Rights Majestic Insurance Company Dec 2011 Acquisition Builders & Tradesmen’s Insurance Services Feb 2011 Renewal Rights BancInsure , Inc. History of Disciplined Growth 6
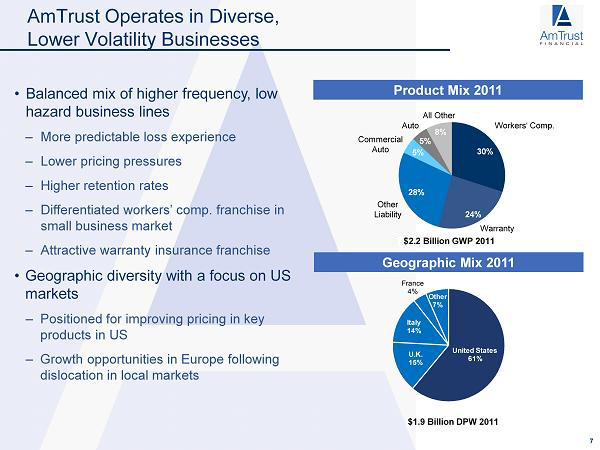
AmTrust Operates in Diverse, Lower Volatility Businesses Product Mix 2011 Geographic Mix 2011 30% 24% 28% 5 % 5 % 8 % All Other Workers‘ Comp. Warranty Other Liability Commercial Auto Auto • Balanced mix of higher frequency, low hazard business lines – More predictable loss experience – Lower pricing pressures – Higher retention rates – Differentiated workers’ comp. franchise in small business market – Attractive warranty insurance franchise • Geographic diversity with a focus on US markets – Positioned for improving pricing in key products in US – Growth opportunities in Europe following dislocation in local markets $2.2 Billion GWP 2011 $1.9 Billion DPW 2011 United States 61% U.K. 15% Italy 14% France 4% Other 7% 7
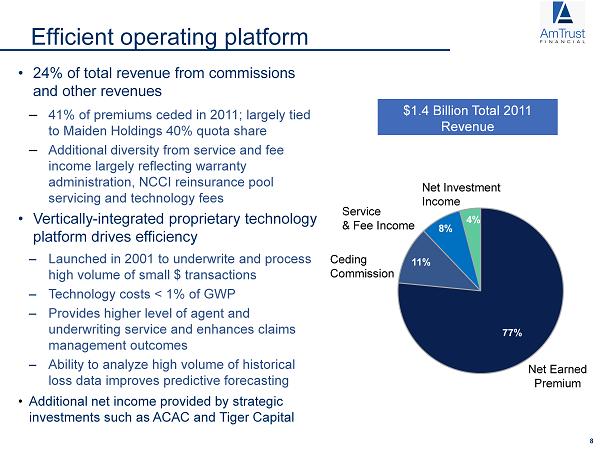
77% 11% 8% 4% Net Earned Premium Ceding Commission Net Investment Income Service & Fee Income Efficient operating platform $1.4 Billion Total 2011 Revenue YTD 3Q11 8 • 24% of total revenue from commissions and other revenues – 41% of premiums ceded in 2011; largely tied to Maiden Holdings 40% quota share – Additional diversity from service and fee income largely reflecting warranty administration, NCCI reinsurance pool servicing and technology fees • Vertically - integrated proprietary technology platform drives efficiency – Launched in 2001 to underwrite and process high volume of small $ transactions – Technology costs < 1% of GWP – Provides higher level of agent and underwriting service and enhances claims management outcomes – Ability to analyze high volume of historical loss data improves predictive forecasting • Additional net income provided by strategic investments such as ACAC and Tiger Capital
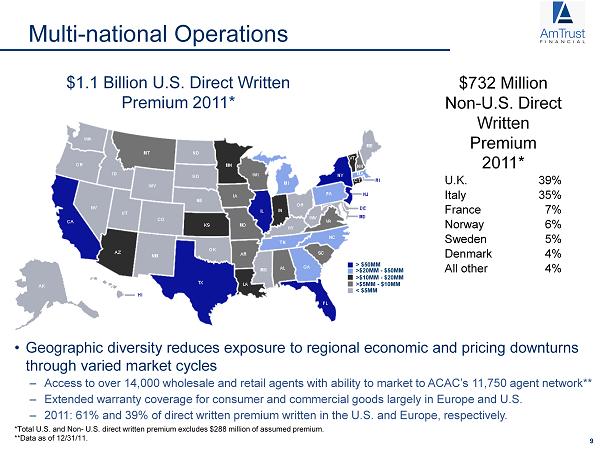
9 • Geographic diversity reduces exposure to regional economic and pricing downturns through varied market cycles – Access to over 14,000 wholesale and retail agents with ability to market to ACAC’s 11,750 agent network** – Extended warranty coverage for consumer and commercial goods largely in Europe and U.S. – 2011: 61% and 39% of direct written premium written in the U.S. and Europe, respectively. Multi - national Operations $1.1 Billion U.S. Direct Written Premium 2011* *Total U.S. and Non - U.S. direct written premium excludes $288 million of assumed premium. **Data as of 12/31/11. $732 Million Non - U.S. Direct Written Premium 2011* U.K. 39% Italy 35% France 7% Norway 6% Sweden 5% Denmark 4% All other 4% > $50MM >$20MM - $50MM >$10MM - $20MM >$5MM - $10MM < $5MM
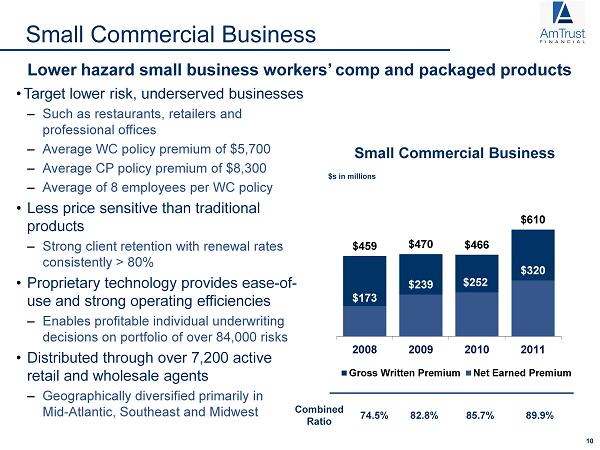
10 Combined Ratio 74.5% 82.8% 85.7% 89.9% $459 $470 $466 $610 $173 $239 $252 $320 2008 2009 2010 2011 Gross Written Premium Net Earned Premium Lower hazard small business workers’ comp and packaged products • Target lower risk, underserved businesses – Such as restaurants, retailers and professional offices – Average WC policy premium of $5,700 – Average CP policy premium of $8,300 – Average of 8 employees per WC policy • Less price sensitive than traditional products – Strong client retention with renewal rates consistently > 80% • Proprietary technology provides ease - of - use and strong operating efficiencies – Enables profitable individual underwriting decisions on portfolio of over 84,000 risks • Distributed through over 7,200 active retail and wholesale agents – Geographically diversified primarily in Mid - Atlantic , Southeast and Midwest Small Commercial Business $s in millions Small Commercial Business
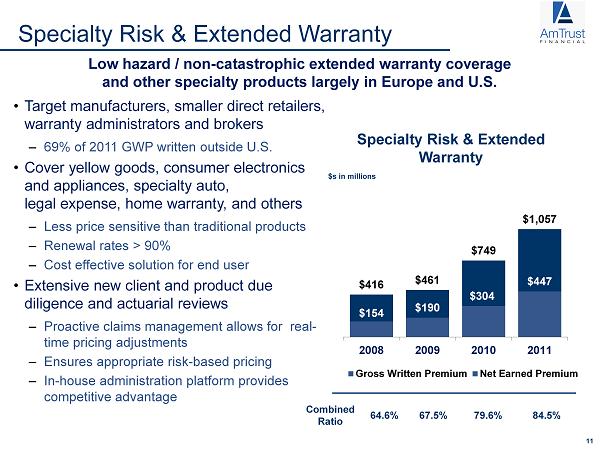
11 $416 $461 $749 $1,057 $154 $190 $304 $447 2008 2009 2010 2011 Gross Written Premium Net Earned Premium Specialty Risk & Extended Warranty $s in millions Low hazard / non - catastrophic extended warranty coverage and other specialty products largely in Europe and U.S. • Target manufacturers, smaller direct retailers, warranty administrators and brokers – 69% of 2011 GWP written outside U.S. • Cover yellow goods, consumer electronics and appliances, specialty auto, legal expense, home warranty, and others – Less price sensitive than traditional products – Renewal rates > 90% – Cost effective solution for end user • Extensive new client and product due diligence and actuarial reviews – Proactive claims management allows for real - time pricing adjustments – Ensures appropriate risk - based pricing – In - house administration platform provides competitive advantage Specialty Risk & Extended Warranty Combined Ratio 64.6% 67.5% 79.6% 84.5%
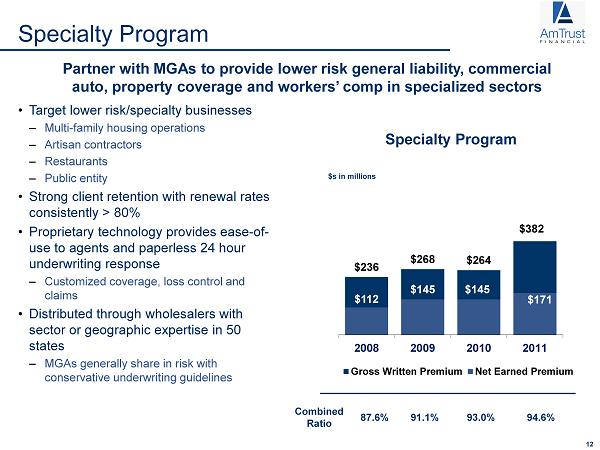
$236 $268 $264 $382 $112 $145 $145 $171 2008 2009 2010 2011 Gross Written Premium Net Earned Premium Specialty Program $s in millions Partner with MGAs to provide lower risk general liability, commercial auto, property coverage and workers’ comp in specialized sectors • Target lower risk/specialty businesses – Multi - family housing operations – Artisan contractors – Restaurants – Public entity • Strong client retention with renewal rates consistently > 80% • Proprietary technology provides ease - of - use to agents and paperless 24 hour underwriting response – Customized coverage, loss control and claims • Distributed through wholesalers with sector or geographic expertise in 50 states – MGAs generally share in risk with conservative underwriting guidelines Specialty Program 12 Combined Ratio 87.6% 91.1% 93.0% 94.6%
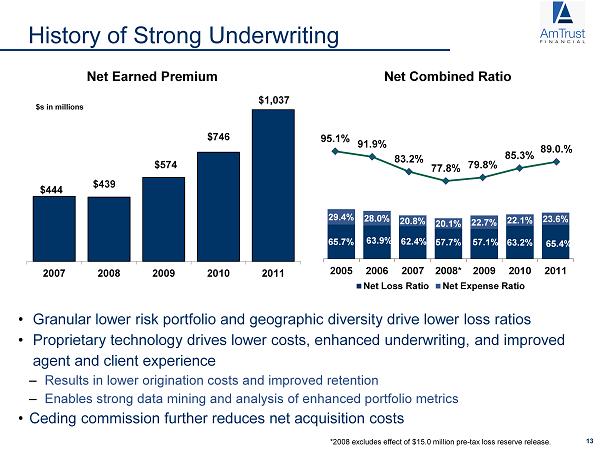
95.1% 91.9% 83.2% 77.8% 79.8% 85.3% 89.0.% 65.7% 63.9% 62.4% 57.7% 57.1% 63.2% 65.4% 29.4% 28.0% 20.8% 20.1% 22.7% 22.1% 23.6% 2005 2006 2007 2008* 2009 2010 2011 Net Loss Ratio Net Expense Ratio History of Strong Underwriting • Granular lower risk portfolio and geographic diversity drive lower loss ratios • Proprietary technology drives lower costs, enhanced underwriting, and improved agent and client experience – Results in lower origination costs and improved retention – Enables strong data mining and analysis of enhanced portfolio metrics • Ceding commission further reduces net acquisition costs $444 $439 $574 $746 $1,037 2007 2008 2009 2010 2011 Net Earned Premium Net Combined Ratio $s in millions *2008 excludes effect of $15.0 million pre - tax loss reserve release. 13
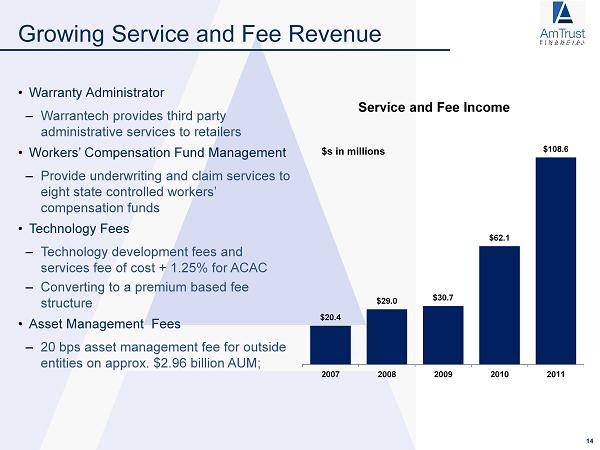
• Warranty Administrator – Warrantech provides third party administrative services to retailers • Workers’ Compensation Fund Management – Provide underwriting and claim services to eight state controlled workers’ compensation funds • Technology Fees – Technology development fees and services fee of cost + 1.25 % for ACAC – Converting to a premium based fee structure • Asset Management Fees – 20 bps asset management fee for outside entities on approx. $2.96 billion AUM; Growing Service and Fee Revenue 14 $20.4 $29.0 $30.7 $62.1 $108.6 2007 2008 2009 2010 2011 Service and Fee Income $s in millions
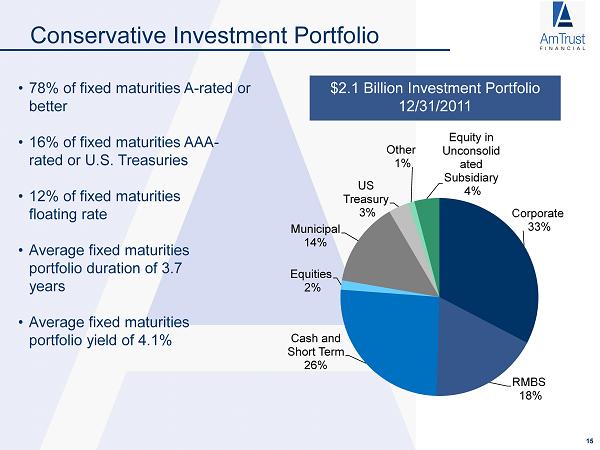
Conservative Investment Portfolio $2.1 Billion Investment Portfolio 12/31/2011 • 78% of fixed maturities A - rated or better • 16% of fixed maturities AAA - rated or U.S. Treasuries • 12% of fixed maturities floating rate • Average fixed maturities portfolio duration of 3.7 years • Average fixed maturities portfolio yield of 4.1% Corporate 33% RMBS 18% Cash and Short Term 26% Equities 2 % Municipal 14 % US Treasury 3% Other 1% Equity in Unconsolid ated Subsidiary 4% 15
Efficient Capital Structure • Successful Reinsurance Agreement – 41% of 2011 premiums ceded to Maiden Holdings, Inc. (MHLD) • $200 million capital raise – December 2011, issued $175 million in convertible debt due 2021. An additional $25 million was issued in January 2012 – Conversion price is $31.83, interest rate is fixed at 5.5% • Debt leverage – As of December 31, 2011, debt to total capital was 23.9% 16
Focus On Delivering Strong ROE • Diversified balanced business model drives solid results in varying economic cycles – Target lower - risk niche business lines – Highly efficient capital structure • Focus on driving consistently strong underwriting profits – Disciplined pricing and risk selection – Data mining enables enhanced risk management – In - house claims management drives excellent results • Lower expense ratio – Proprietary technology platform drives lower costs and provides capacity for continued expansion opportunities – Strategic long - term quota share agreement further enhances efficiency • Proven ability to capitalize on unique lower - risk market opportunities • Committed to conservative investing and reserving philosophy • Management and shareholder interests aligned 17
Appendix
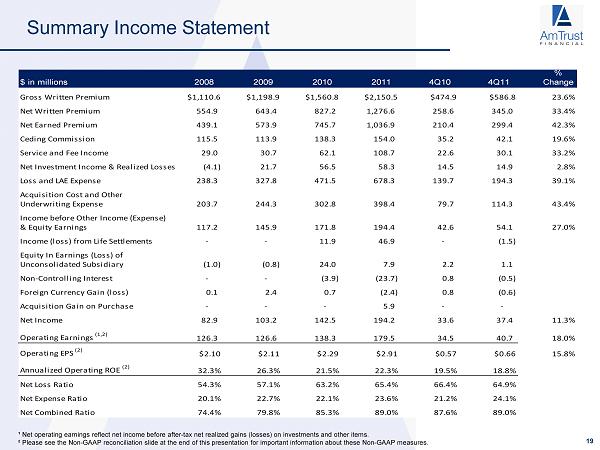
Summary Income Statement ¹ Net operating earnings reflect net income before after - tax net realized gains (losses) on investments and other items. ² Please see the Non - GAAP reconciliation slide at the end of this presentation for important information about these Non - GAAP measures. 19 %$ in millions 2008 2009 2010 2011 4Q10 4Q11 Change Gross Written Premium $1,110.6 $1,198.9 $1,560.8 $2,150.5 $474.9 $586.8 23.6% Net Written Premium 554.9 643.4 827.2 1,276.6 258.6 345.0 33.4% Net Earned Premium 439.1 573.9 745.7 1,036.9 210.4 299.4 42.3% Ceding Commission 115.5 113.9 138.3 154.0 35.2 42.1 19.6% Service and Fee Income 29.0 30.7 62.1 108.7 22.6 30.1 33.2% Net Investment Income & Realized Losses (4.1) 21.7 56.5 58.3 14.5 14.9 2.8% Loss and LAE Expense 238.3 327.8 471.5 678.3 139.7 194.3 39.1% Acquisition Cost and Other Underwriting Expense 203.7 244.3 302.8 398.4 79.7 114.3 43.4% Income before Other Income (Expense) & Equity Earnings 117.2 145.9 171.8 194.4 42.6 54.1 27.0% Income (loss) from Life Settlements - - 11.9 46.9 - (1.5) Equity In Earnings (Loss) of Unconsolidated Subsidiary (1.0) (0.8) 24.0 7.9 2.2 1.1 Non-Controlling Interest - - (3.9) (23.7) 0.8 (0.5) Foreign Currency Gain (loss) 0.1 2.4 0.7 (2.4) 0.8 (0.6) Acquisition Gain on Purchase - - - 5.9 - - Net Income 82.9 103.2 142.5 194.2 33.6 37.4 11.3% Operating Earnings (1,2) 126.3 126.6 138.3 179.5 34.5 40.7 18.0% Operating EPS (2) $2.10 $2.11 $2.29 $2.91 $0.57 $0.66 15.8% Annualized Operating ROE (2) 32.3% 26.3% 21.5% 22.3% 19.5% 18.8% Net Loss Ratio 54.3% 57.1% 63.2% 65.4% 66.4% 64.9% Net Expense Ratio 20.1% 22.7% 22.1% 23.6% 21.2% 24.1% Net Combined Ratio 74.4% 79.8% 85.3% 89.0% 87.6% 89.0%
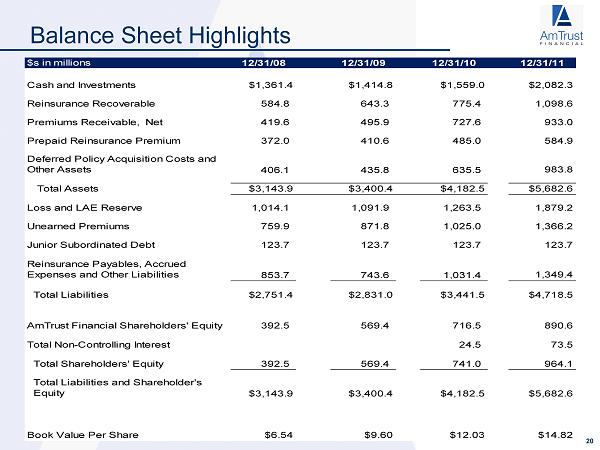
Balance Sheet Highlights 20 $s in millions 12/31/08 12/31/09 12/31/10 12/31/11 Cash and Investments $1,361.4 $1,414.8 $1,559.0 $2,082.3 Reinsurance Recoverable 584.8 643.3 775.4 1,098.6 Premiums Receivable, Net 419.6 495.9 727.6 933.0 Prepaid Reinsurance Premium 372.0 410.6 485.0 584.9 Deferred Policy Acquisition Costs and Other Assets 406.1 435.8 635.5 983.8 Total Assets $3,143.9 $3,400.4 $4,182.5 $5,682.6 Loss and LAE Reserve 1,014.1 1,091.9 1,263.5 1,879.2 Unearned Premiums 759.9 871.8 1,025.0 1,366.2 Junior Subordinated Debt 123.7 123.7 123.7 123.7 Reinsurance Payables, Accrued Expenses and Other Liabilities 853.7 743.6 1,031.4 1,349.4 Total Liabilities $2,751.4 $2,831.0 $3,441.5 $4,718.5 AmTrust Financial Shareholders' Equity 392.5 569.4 716.5 890.6 Total Non-Controlling Interest 24.5 73.5 Total Shareholders' Equity 392.5 569.4 741.0 964.1 Total Liabilities and Shareholder's Equity $3,143.9 $3,400.4 $4,182.5 $5,682.6 Book Value Per Share $6.54 $9.60 $12.03 $14.82
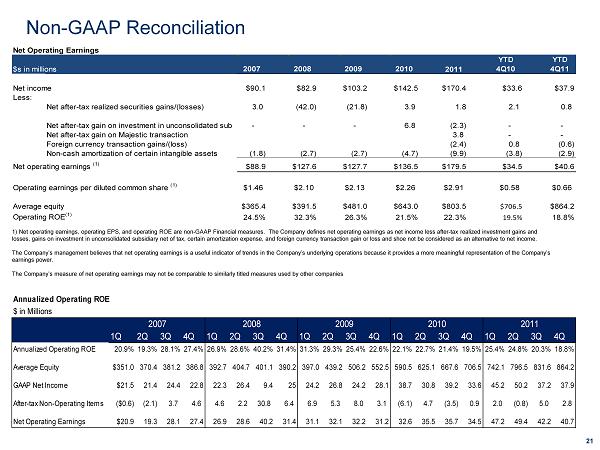
Non - GAAP Reconciliation 21 1) Net operating earnings, operating EPS, and operating ROE are non - GAAP Financial measures. The Company defines net operating earnings as net income less after - tax realized investment gains and losses, gains on investment in unconsolidated subsidiary net of tax, certain amortization expense, and foreign currency trans act ion gain or loss and shoe not be considered as an alternative to net income. The Company’s management believes that net operating earnings is a useful indicator of trends in the Company’s underlying ope rat ions because it provides a more meaningful representation of the Company’s earnings power. The Company’s measure of net operating earnings may not be comparable to similarly titled measures used by other companies Annualized Operating ROE $ in Millions 1Q 2Q 3Q 4Q 1Q 2Q 3Q 4Q 1Q 2Q 3Q 4Q 1Q 2Q 3Q 4Q 1Q 2Q 3Q 4Q Annualized Operating ROE 20.9% 19.3% 28.1% 27.4% 26.9% 28.6% 40.2% 31.4% 31.3% 29.3% 25.4% 22.6% 22.1% 22.7% 21.4% 19.5% 25.4% 24.8% 20.3% 18.8% Average Equity $351.0 370.4 381.2 386.8 392.7 404.7 401.1 390.2 397.0 439.2 506.2 552.5 590.5 625.1 667.6 706.5 742.1 796.5 831.6 864.2 GAAP Net Income $21.5 21.4 24.4 22.8 22.3 26.4 9.4 25 24.2 26.8 24.2 28.1 38.7 30.8 39.2 33.6 45.2 50.2 37.2 37.9 After-tax Non-Operating Items ($0.6) (2.1) 3.7 4.6 4.6 2.2 30.8 6.4 6.9 5.3 8.0 3.1 (6.1) 4.7 (3.5) 0.9 2.0 (0.8) 5.0 2.8 Net Operating Earnings $20.9 19.3 28.1 27.4 26.9 28.6 40.2 31.4 31.1 32.1 32.2 31.2 32.6 35.5 35.7 34.5 47.2 49.4 42.2 40.7 2007 2008 2009 2010 2011 Net Operating Earnings $s in millions 2007 2008 2009 2010 2011 YTD 4Q10 YTD 4Q11 Net income $90.1 $82.9 $103.2 $142.5 $170.4 $33.6 $37.9 Less: Net after-tax realized securities gains/(losses) 3.0 (42.0) (21.8) 3.9 1.8 2.1 0.8 Net after-tax gain on investment in unconsolidated sub - - - 6.8 (2.3) - - Net after-tax gain on Majestic transaction 3.8 - - Foreign currency transaction gains/(loss) (2.4) 0.8 (0.6) Non-cash amortization of certain intangible assets (1.8) (2.7) (2.7) (4.7) (9.9) (3.8) (2.9) Net operating earnings (1) $88.9 $127.6 $127.7 $136.5 $179.5 $34.5 $40.6 Operating earnings per diluted common share (1) $1.46 $2.10 $2.13 $2.26 $2.91 $0.58 $0.66 Average equity $365.4 $391.5 $481.0 $643.0 $803.5 $706.5 $864.2 Operating ROE (1) 24.5% 32.3% 26.3% 21.5% 22.3% 19.5% 18.8%