Attached files
| file | filename |
|---|---|
| 8-K - CURRENT REPORT - First California Financial Group, Inc. | firstcal-8k_030112.htm |
Investor Presentation March 2012
This presentation contains certain forward - looking information about First California Financial Group, Inc. (“First California” or “FCAL” that is intended to be covered by the safe harbor for "forward - looking statements" provided by the Private Securities Litigation Reform Act of 1995. All statements other than statements of historical fact are forward - looking statements. Such statements involve inherent risks and uncertainties, many of which are difficult to predict and are generally beyond the cont rol of First California. First California cautions that a number of important factors could cause actual results to differ materiall y f rom those expressed in, or implied or projected by, such forward - looking statements. Risks and uncertainties include, but are not limited to, revenues are lower than expected, credit quality deterioration which could cause an increase in the provision for credit losses, First California’s ability to complete future acquisitions, successfully integrate such acquired entities, or ach ieve expected beneficial synergies and/or operating efficiencies within expected time - frames or at all, changes in consumer spending, borrowing and savings habits, technological changes, the cost of additional capital is more than expected, a change in the interest rate environment reduces interest margins, asset/liability repricing risks and liquidity risks, general economic conditions, particularly those affecting real estate values, either nationally or in the market areas in which First Californ ia does or anticipates doing business are less favorable than expected, a slowdown in construction activity, recent volatility in the cr edi t or equity markets and its effect on the general economy, legislative or regulatory requirements or changes adversely affecting F irs t California’s business, the effects of and changes in monetary and fiscal policies and laws including the interest rate policies of the Board of Governors of the Federal Reserve , demand for the products or services of First California as well as their ability to attract and retain qualified people, competition with other banks and financial institutions, the costs and effects of legal, accounting and regulatory developments, the inability to obtain regulatory approvals for acquisitions on the terms expected or on the anticipated schedule , First California’s level of small business lending, and other factors. If any of these risks or uncertainties materialize or if any of the assumptions underlying such forward - looking statements prove to be incorrect, Firs t California's results could differ materially from those expressed in, or implied or projected by, such forward - looking statement s. First California assumes no obligation to update such forward - looking statements. For a more complete discussion of risks and uncertainties, investors and security holders are urged to read the section titled "Risk Factors" in First California's Annua l R eport on Form 10 - K, Quarterly Reports on Form 10 - Q and any other reports filed by it with the Securities and Exchange Commission ("SEC"). 2 Safe Harbor
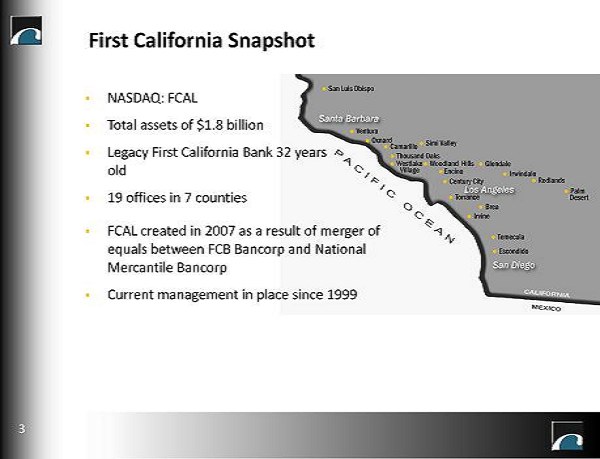
First California Snapshot ▪ NASDAQ: FCAL ▪ Total assets of $1.8 billion ▪ Legacy First California Bank 32 years old ▪ 19 offices in 7 counties 3 ▪ FCAL created in 2007 as a result of merger of equals between FCB Bancorp and National Mercantile Bancorp ▪ Current management in place since 1999
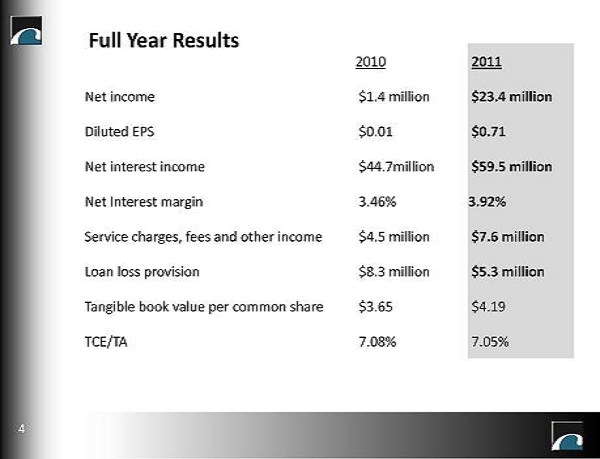
2010 2011 Net income $1.4 million $23.4 million Diluted EPS $0.01 $0.71 Net interest income $44.7million $59.5 million Net Interest margin 3.46% 3.92% Service charges, fees and other income $4.5 million $7.6 million Loan loss provision $8.3 million $5.3 million Tangible book value per common share $3.65 $4.19 TCE/TA 7.08% 7.05% Full Year Results 4
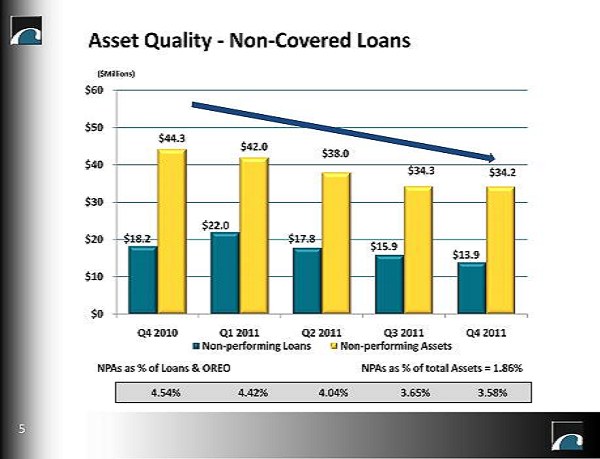
Asset Quality - Non - Covered Loans 4.54% 4.42% 4.04% 3.65% 3.58% $18.2 $22.0 $17.8 $15.9 $13.9 $44.3 $42.0 $38.0 $34.3 $34.2 $0 $10 $20 $30 $40 $50 $60 Q4 2010 Q1 2011 Q2 2011 Q3 2011 Q4 2011 Non - performing Loans Non - performing Assets 5 NPAs as % of Loans & OREO ($Millions) NPAs as % of total Assets = 1.86%
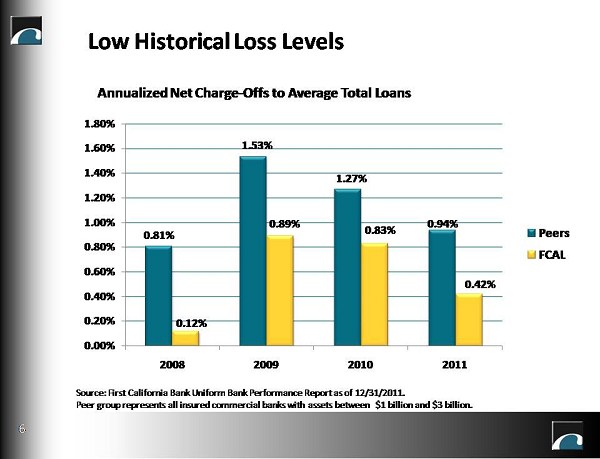
Low Historical Loss Levels Annualized Net Charge - Offs to Average Non - Covered Loans 0.81% 1.53% 1.27% 0.94% 0.12% 0.89% 0.85% 0.51% 0.00% 0.20% 0.40% 0.60% 0.80% 1.00% 1.20% 1.40% 1.60% 1.80% 2008 2009 2010 2011 Peers FCAL 6 Source: First California Bank Uniform Bank Performance Report as of 12/31/2011 . Peer group represents all insured commercial banks with assets between $1 billion and $3 billion.
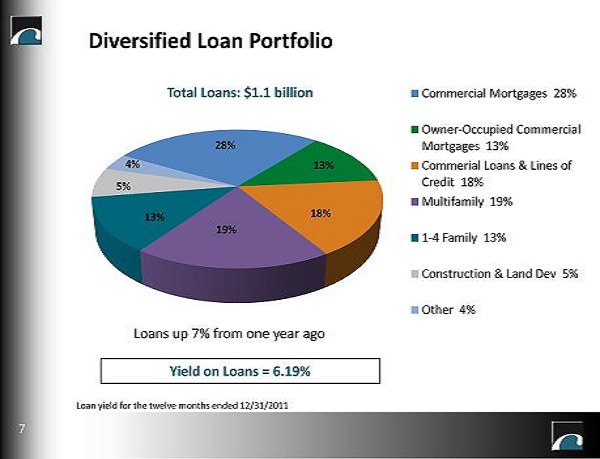
Diversified Loan Portfolio 13% 28% 13% 5% 19% 4% Commercial Mortgages 28% Owner - Occupied Commercial Mortgages 13% Commerial Loans & Lines of Credit 18% Multifamily 19% 1 - 4 Family 13% Construction & Land Dev 5% Other 4% Loans up 7% from one year ago Yield on Loans = 6.19% Total Loans: $1.1 b illion 7 18% Loan yield for the twelve months ended 12/31/2011
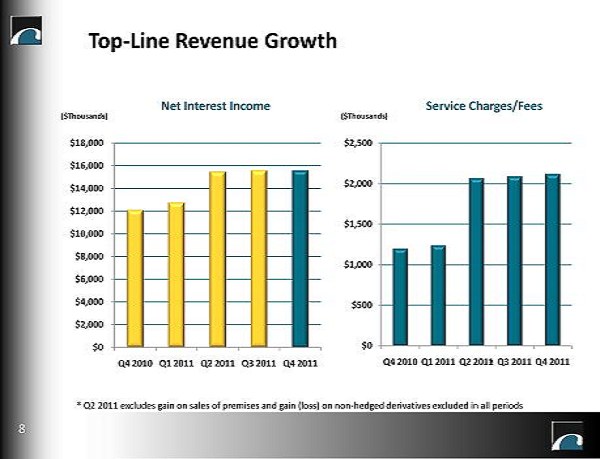
Top - Line Revenue Growth $0 $2,000 $4,000 $6,000 $8,000 $10,000 $12,000 $14,000 $16,000 $18,000 Q4 2010 Q1 2011 Q2 2011 Q3 2011 Q4 2011 $0 $500 $1,000 $1,500 $2,000 $2,500 Q4 2010 Q1 2011 Q2 2011 Q3 2011 Q4 2011 Net Interest Income Service Charges/Fees ($Thousands) ($Thousands) 8 * * Q2 2011 excludes gain on sales of premises and gain (loss) on non - hedged derivatives excluded in all periods
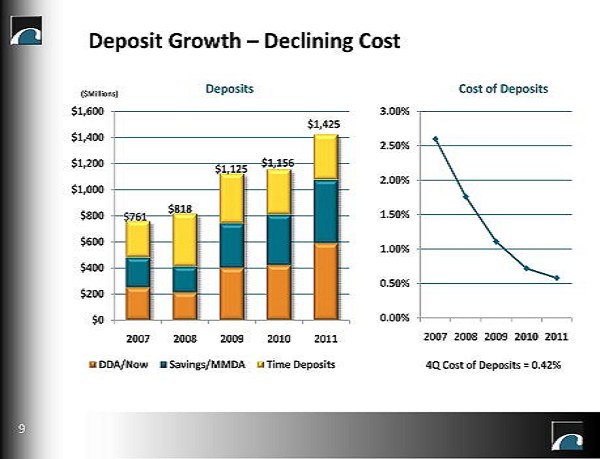
$0 $200 $400 $600 $800 $1,000 $1,200 $1,400 $1,600 2007 2008 2009 2010 2011 DDA/Now Savings/MMDA Time Deposits 0.00% 0.50% 1.00% 1.50% 2.00% 2.50% 3.00% 2007 2008 2009 2010 2011 $761 $818 $1,125 $1,156 $1,425 ($Millions) Deposit Growth – Declining Cost 4Q Cost of Deposits = 0.42% Deposits Cost of Deposits 9
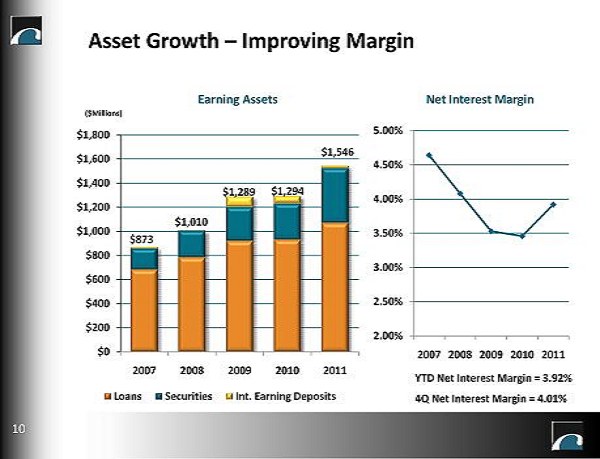
Asset Growth – Improving Margin Earning Assets Net Interest Margin ($Millions) $0 $200 $400 $600 $800 $1,000 $1,200 $1,400 $1,600 $1,800 2007 2008 2009 2010 2011 Loans Securities Int. Earning Deposits $1,546 $1,294 $1,289 $1,010 $873 2.00% 2.50% 3.00% 3.50% 4.00% 4.50% 5.00% 2007 2008 2009 2010 2011 YTD Net Interest Margin = 3.92% 10 4Q Net Interest Margin = 4.01%
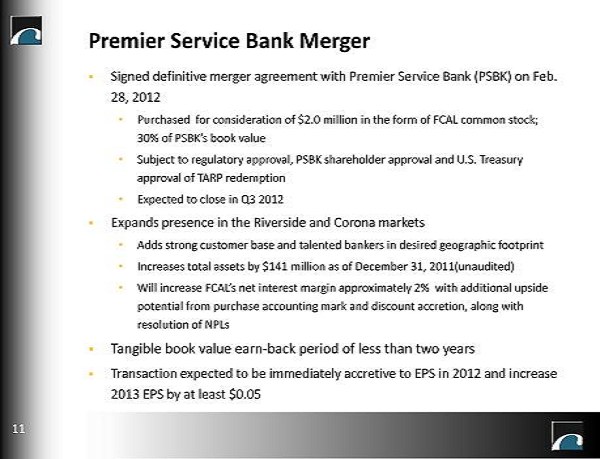
▪ Signed definitive merger agreement with Premier Service Bank (PSBK) on Feb. 28, 2012 • Purchased for consideration of $2.0 million in the form of FCAL common stock; 30% of PSBK’s book value • Subject to regulatory approval, PSBK shareholder approval and U.S. Treasury approval of TARP redemption • Expected to close in Q3 2012 ▪ Expands presence in the Riverside and Corona markets • Adds strong customer base and talented bankers in desired geographic footprint • Increases total assets by $141 million as of December 31, 2011(unaudited ) • Will increase FCAL’s net interest margin approximately 2% with additional upside potential from purchase accounting mark and discount accretion, along with resolution of NPLs ▪ Tangible book value earn - back period of less than two years ▪ Transaction expected to be immediately accretive to EPS in 2012 and increase 2013 EPS by at least $0.05 Premier Service Bank Merger 11
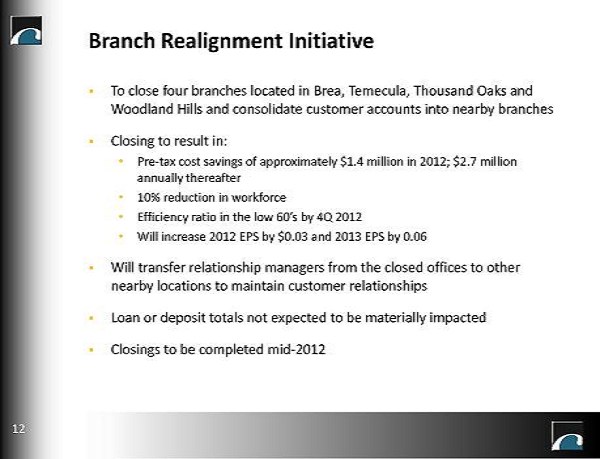
▪ To close four branches located in Brea, Temecula, Thousand Oaks and Woodland Hills and consolidate customer accounts into nearby branches ▪ Closing to result in: • Pre - tax cost savings of approximately $1.4 million in 2012; $2.7 million annually thereafter • 10% reduction in workforce • Efficiency ratio in the low 60’s by 4Q 2012 • Will increase 2012 EPS by $0.03 and 2013 EPS by 0.06 ▪ Will transfer relationship managers from the closed offices to other nearby locations to maintain customer relationships ▪ Loan or deposit totals not expected to be materially impacted ▪ Closings to be completed mid - 2012 Branch Realignment Initiative 12
Appendix 13
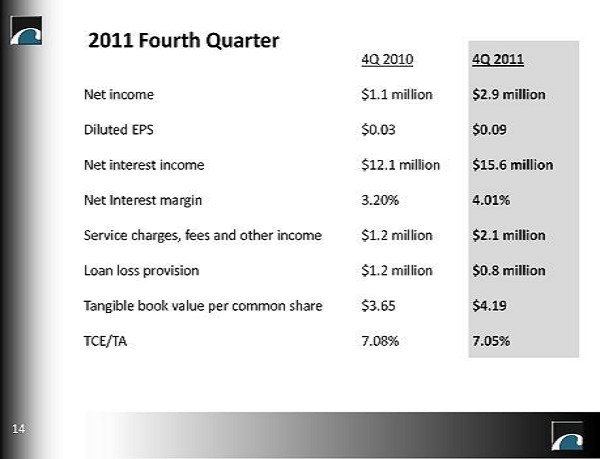
4Q 2010 4Q 2011 Net income $1.1 million $2.9 million Diluted EPS $0.03 $0.09 Net interest income $12.1 million $15.6 million Net Interest margin 3.20% 4.01% Service charges, fees and other income $1.2 million $2.1 million Loan loss provision $1.2 million $0.8 million Tangible book value per common share $3.65 $4.19 TCE/TA 7.08% 7.05% 2011 Fourth Quarter 14
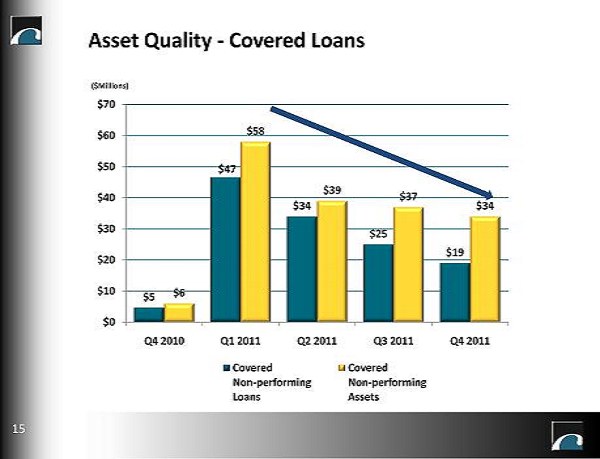
$5 $47 $34 $25 $19 $6 $58 $39 $37 $34 $0 $10 $20 $30 $40 $50 $60 $70 Q4 2010 Q1 2011 Q2 2011 Q3 2011 Q4 2011 Covered Non - performing Loans Covered Non - performing Assets Asset Quality - Covered Loans ($Millions) 15
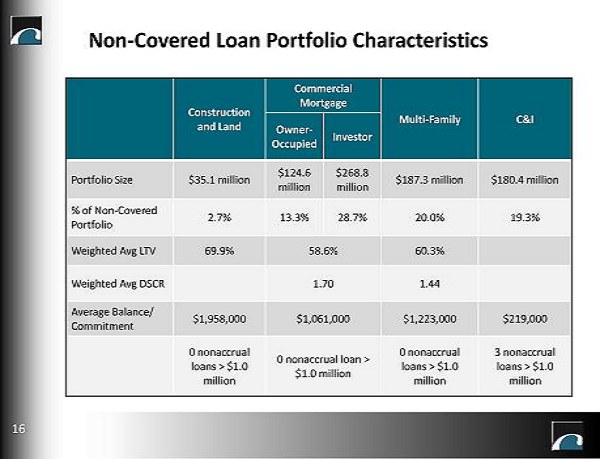
Construction and Land Commercial Mortgage Multi - Family C&I Owner - Occupied Investor Portfolio Size $35.1 million $124.6 million $268.8 million $187.3 million $180.4 million % of Non - Covered Portfolio 2.7% 13.3% 28.7% 20.0% 19.3% Weighted Avg LTV 69.9% 58.6% 60.3% Weighted Avg DSCR 1.70 1.44 Average Balance/ Commitment $1,958,000 $1,061,000 $1,223,000 $219,000 0 nonaccrual loans > $1.0 million 0 nonaccrual loan > $1.0 million 0 nonaccrual loans > $1.0 million 3 nonaccrual loans > $1.0 million Non - Covered Loan Portfolio Characteristics 16
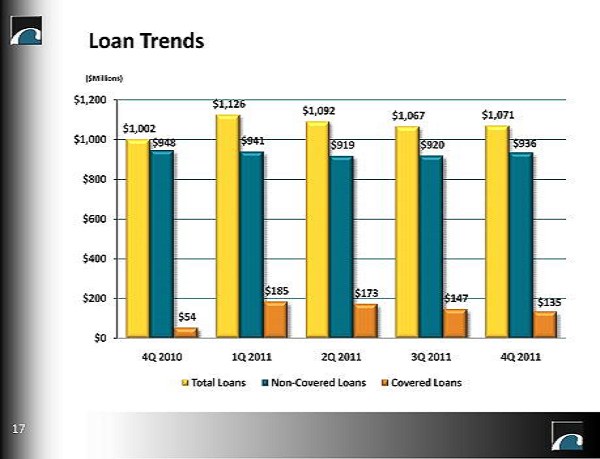
Loan Trends ($Millions) $1,002 $1,126 $1,092 $1,067 $1,071 $948 $941 $919 $920 $936 $54 $185 $173 $147 $135 $0 $200 $400 $600 $800 $1,000 $1,200 4Q 2010 1Q 2011 2Q 2011 3Q 2011 4Q 2011 Total Loans Non - Covered Loans Covered Loans 17
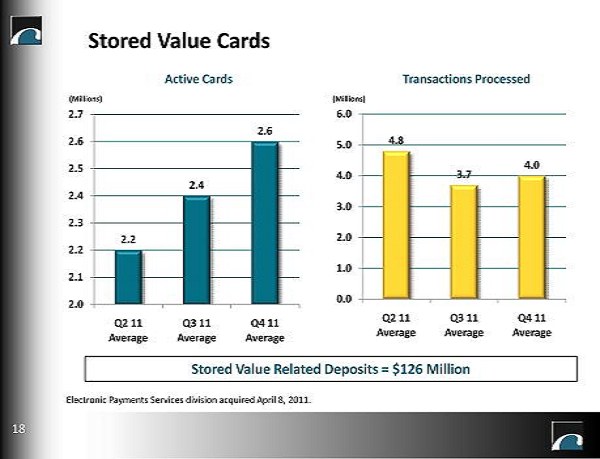
Electronic Payments Services division acquired April 8, 2011. Stored Value Cards 18 (Millions) (Millions) 2.2 2.4 2.6 2.0 2.1 2.2 2.3 2.4 2.5 2.6 2.7 Q2 11 Average Q3 11 Average Q4 11 Average 4.8 3.7 4.0 0.0 1.0 2.0 3.0 4.0 5.0 6.0 Q2 11 Average Q3 11 Average Q4 11 Average Active Cards Transactions Processed Stored V alue R elated D eposits = $126 Million
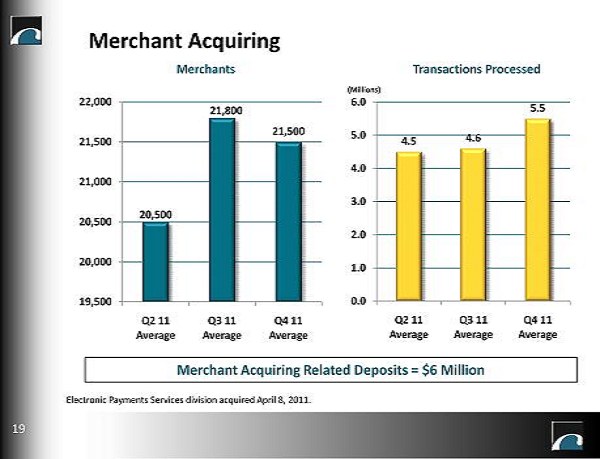
Merchant Acquiring 20,500 21,800 21,500 19,500 20,000 20,500 21,000 21,500 22,000 Q2 11 Average Q3 11 Average Q4 11 Average 4.5 4.6 5.5 0.0 1.0 2.0 3.0 4.0 5.0 6.0 Q2 11 Average Q3 11 Average Q4 11 Average (Millions) 19 Merchants Transactions Processed Merchant A cquiring R elated Deposits = $6 Million Electronic Payments Services division acquired April 8, 2011.
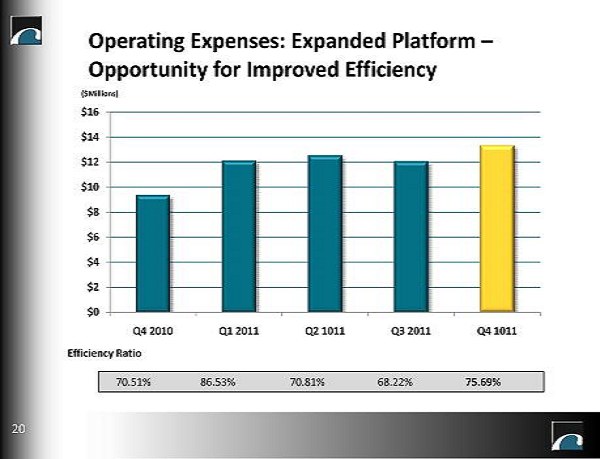
$0 $2 $4 $6 $8 $10 $12 $14 $16 Q4 2010 Q1 2011 Q2 1011 Q3 2011 Q4 1011 Operating Expenses: Expanded Platform – Opportunity for Improved Efficiency 70.51% 86.53% 70.81% 68.22% 75.69% ($Millions) Efficiency Ratio 20
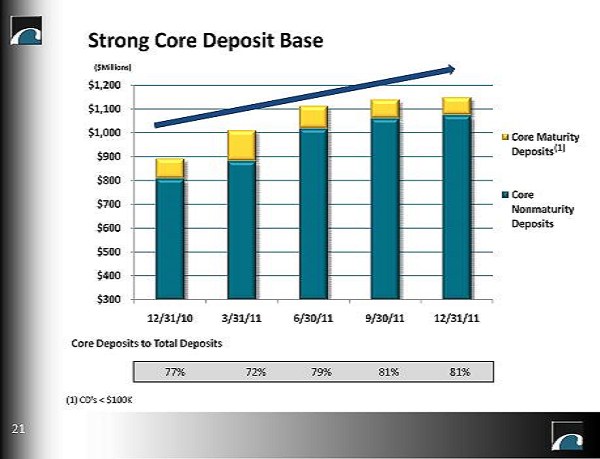
$300 $400 $500 $600 $700 $800 $900 $1,000 $1,100 $1,200 12/31/10 3/31/11 6/30/11 9/30/11 12/31/11 Core Maturity Deposits Core Nonmaturity Deposits Strong Core Deposit Base (1 ) ($Millions) 77% 72% 79% 81% 81% Core Deposits to Total Deposits 21 (1 ) CD’s < $100K
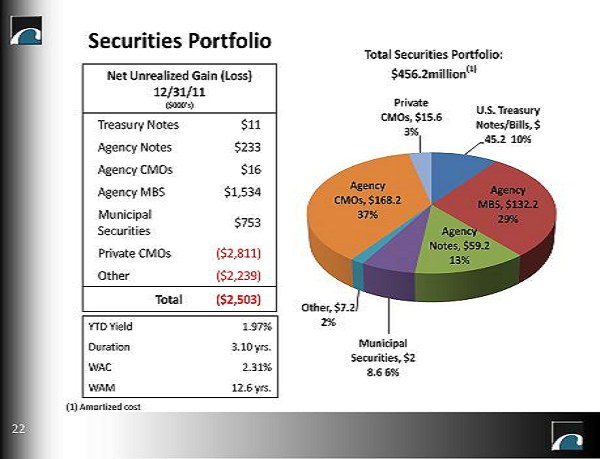
N et U nrealized G ain ( L oss) 12/31/11 ($000’s) Treasury Notes $11 Agency Notes $233 Agency CMOs $16 Agency MBS $1,534 Municipal Securities $753 Private CMOs ($2,811) Other ($2,239) Total ($2,503) Securities Portfolio Total Securities Portfolio: $456.2 million (1) 22 YTD Yield 1.97% Duration 3.10 yrs. WAC 2.31% WAM 12.6 yrs. (1 ) Amortized cost U.S. Treasury Notes/Bills, $ 45.2 10% Agency MBS, $ 132.2 29 % Agency Notes, $59.2 13% Municipal Securities, $ 2 8.6 6 % Other, $7.2 2% Agency CMOs, $ 168.2 37 % Private CMOs, $15.6 3 %
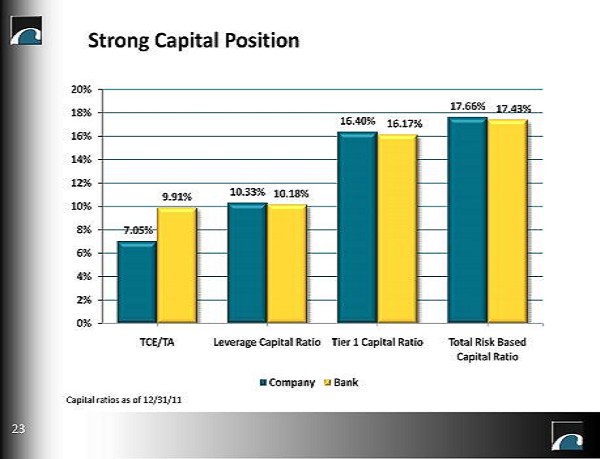
7.05% 10.33% 16.40% 17.66% 9.91% 10.18% 16.17% 17.43% 0% 2% 4% 6% 8% 10% 12% 14% 16% 18% 20% TCE/TA Leverage Capital Ratio Tier 1 Capital Ratio Total Risk Based Capital Ratio Company Bank Strong Capital Position Capital ratios as of 12/31/11 23
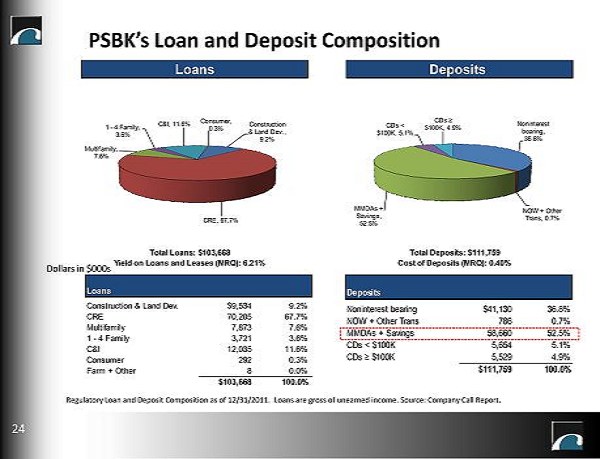
PSBK’s Loan and Deposit Composition Loans Total Loans: $103,668 Yield on Loans and Leases (MRQ): 6.21% Construction & Land Dev., 9.2% CRE, 67.7% Multifamily, 7.6% 1 - 4 Family, 3.6% C&I, 11.6% Consumer, 0.3% Deposits Total Deposits: $111,759 Cost of Deposits (MRQ): 0.40% Noninterest bearing, 36.8% NOW + Other Trans, 0.7% MMDAs + Savings, 52.5% CDs < $100K, 5.1% CDs ≥ $100K, 4.9% Loans PRWT Construction & Land Dev. $9,534 9.2% CRE 70,205 67.7% Multifamily 7,873 7.6% 1 - 4 Family 3,721 3.6% C&I 12,035 11.6% Consumer 292 0.3% Farm + Other 8 0.0% $103,668 100.0% Deposits PRWT Noninterest bearing $41,130 36.8% NOW + Other Trans 786 0.7% MMDAs + Savings 58,660 52.5% CDs < $100K 5,654 5.1% CDs ≥ $100K 5,529 4.9% $111,759 100.0% Dollars in $000s Regulatory Loan and Deposit Composition as of 12/31/2011. Loans are gross of unearned income. Source : Company Call Report . 24
▪ Proactively and diligently addressed asset quality • Only three non - covered nonaccrual loans greater than $1 million • Non - performing assets continue to decrease ▪ Strengthened market presence with skilled banking teams ▪ Re - entry into SBA lending ▪ Largest loan pipeline at end of quarter since beginning of recession 25 Strong Quarter … On Solid Footing
▪ Employee headcount increased from 248 to 304 at year end due to • Acquisition of EPS division • Acquisition of San Luis Trust Bank from FDIC • Successful recruitment of 3 lending teams • Increase in special assets personnel due to covered loans from 2 FDIC assisted transactions ▪ Non recurring legal expenses totaling $1.9 million ▪ Non recurring expenses associated with a branding initiative of $0.2 million Items Impacting 2011 non - interest expense/efficiency 26
How to get there? ▪ Workforce reduction ▪ Reduction of legal expenses ▪ EPS revenues expected to more than double compared to 2011 actuals without adding significant expenses ▪ Increased revenues expected from growing earning asset base and introduction of SBA gains 4Q 2012 Target Efficiency Ratio of Low 60’s 27
▪ Growing and sustainable top - line revenues ▪ Improved net interest margin • $25.5 million of FHLB advances mature in 2012 with weighted average rate of 3.56% • Jr. subordinated debenture reprices from 6.80% fixed to 3 - month libor + 1.60% in 3/2012 • Repurchase agreements mature in 2/2013 and 12/2014 ▪ Excess liquidity deployed into quality loans & securities in Q4 2011 ▪ Positive impact to NIM from resolution of NPL’s ▪ Ongoing benefit from attracting low - cost core deposits Continued Earnings Momentum 28
▪ Significant market opportunities for institution of our size • Many smaller institutions looking for strategic partner • Infrastructure in place for further efficiencies and economies of scale ▪ EPS division brings significant new revenue stream • Adds new products and services – prepaid debit cards and merchant card acquiring • Adds low - cost core deposits ▪ Two new lending teams ▪ New SBA department ▪ Demonstrated capability in: • FDIC - assisted transactions • Whole bank acquisitions • De novo branches and business lines Foundation for Our Future 29