Attached files
| file | filename |
|---|---|
| 8-K - CURRENT REPORT - Wendy's Co | d307528d8k.htm |
 Fourth
Quarter 2011
Earnings Call
March 1, 2012
©2012 Oldemark LLC
Exhibit 99.1 |
 JOHN
BARKER
CHIEF COMMUNICATIONS OFFICER |
 TODAY’S AGENDA
The Wendy’s Company
Financial Update
Steve Hare
CEO Overview
Emil Brolick
Q&A Session
3 |
 Forward-Looking
Statements and
Non-GAAP Financial Measures
This presentation, and certain information that management may discuss in connection
with this presentation, contains certain statements that are not historical
facts, including information concerning possible or assumed future results of our
operations.
Those
statements
constitute
“forward-looking
statements”
within the meaning of the Private Securities Litigation Reform
Act of 1995 (The “Reform Act”). For all forward-looking statements, we
claim the protection of the safe harbor for forward-looking statements
contained in the Reform Act. Many
important
factors
could
affect
our
future
results
and
could
cause
those
results
to
differ
materially
from
those
expressed
in
or
implied by our forward-looking statements. Such factors, all of which are difficult
or impossible to predict accurately, and many of which
are
beyond
our
control,
include
but
are
not
limited
to
those
identified
under
the
caption
“Forward-Looking
Statements”
in our
news
release
issued
on
March
1,
2012
and
in
the
“Special
Note
Regarding
Forward-Looking
Statements
and
Projections”
and “Risk
Factors”
sections of our most recent Form 10-K / Form 10-Qs.
In addition, this presentation and certain information management may discuss in
connection with this presentation reference non- GAAP financial measures,
such as adjusted earnings before interest, taxes, depreciation and amortization, or adjusted EBITDA, and
adjusted earnings per share. Adjusted EBITDA and adjusted earnings per share exclude
certain expenses, net of certain benefits. Reconciliations of non-GAAP
financial measures to the most directly comparable GAAP financial measures are provided in the
Appendix to this presentation, and are included in our news release issued on March 1,
2012 and posted on www.aboutwendys.com. The Wendy’s Company
4 |
 STEVE
HARE
CHIEF FINANCIAL OFFICER |
 Q4 2011
Financial Highlights Q4 2011 N.A. Same-
Store Sales
Company-owned +5.1%
Franchise
+4.2%
Systemwide +4.4%
Company Restaurant
Margin
Q4 2011 15.0%
Q4 2010
14.0%
+100 bps
Q4 2011 Adjusted EBITDA*
* See reconciliation of Adjusted EBITDA (earnings before interest, taxes,
depreciation and amortization) in the appendix. Q4
2011 $80.9 million Q4
2010 $73.2 million |
  2011
Full-Year Highlights ($ in Millions)
2011
2010
Better/
(Worse)
Sales
2,126.6
$
2,079.1
$
47.5
$
Franchise revenues
304.8
296.3
8.5
Total revenues
2,431.4
$
2,375.4
$
56.0
$
Adjusted EBITDA*
331.1
$
341.9
$
(10.8)
$
(Less) plus:
Transaction related and other costs
(45.7)
-
(45.7)
Arby's indirect corporate overhead in general and administrative (G&A)
(14.6)
(32.7)
18.1
SSG purchasing cooperative expenses in G&A
2.2
(5.2)
7.4
Integration costs in G&A
-
(5.5)
5.5
Reversal of pension withdrawal expense in cost of sales
-
5.0
(5.0)
Depreciation and amortization
(123.0)
(126.8)
3.8
Impairment of long-lived assets
(12.9)
(26.3)
13.4
Operating profit
137.1
$
150.4
$
(13.3)
$
* See reconciliation of Adjusted EBITDA (earnings before interest, taxes,
depreciation and amortization) in the appendix. |
  2011 Income
from Continuing Operations and Special Items
($ in Millions, except per share amounts)
per share
per share
Adjusted income from continuing operations and adjusted earnings per share*
62.1
$
0.15
$
71.7
$
0.17
$
(Less) plus:
Arby's transaction related and other costs
(28.5)
(0.07)
-
-
Impairment of long-lived assets
(7.9)
(0.02)
(16.3)
(0.04)
Arby's indirect corporate overhead in G&A
(9.2)
(0.02)
(20.5)
(0.05)
SSG purchasing cooperative expenses in G&A
1.4
-
(3.2)
(0.01)
Integration costs in G&A
-
-
(3.5)
(0.01)
Reversal of pension withdrawal expense in cost of sales
-
-
3.1
0.01
Loss on early extinguishment of debt
-
-
(16.3)
(0.04)
Gain on collection of note receivable
-
-
3.1
0.01
(44.2)
(0.11)
(53.6)
(0.13)
Income from continuing operations and earnings per share
17.9
$
0.04
$
18.1
$
0.04
$
2011
2010
* See reconciliation of Adjusted Income from Continuing Operations and
Adjusted Earnings Per Share in the appendix. |
 2011 Cash
Flow ($ in Millions)
2011
Cash flow from operations
246.7
$
Capital expenditures
(146.8)
Restaurant acquisitions
(11.2)
Proceeds from dispositions, net
104.9
Repurchases of common stock
(157.6)
Dividends paid
(32.4)
Other financing / investing activities
(2.2)
Net cash flow before debt payments
1.4
Repayments of long-term debt
(38.7)
Net decrease in cash after debt payments
(37.3)
Beginning cash balance
512.5
Ending cash balance
475.2
$
9 |
  2011
Consolidated Debt ($ in Millions)
Senior Debt
1,327.9
$
Capital Leases and Other Debt
29.1
Total Debt
1,357.0
Less: Cash and Cash Equivalents
475.2
Net Debt
881.8
$
2011 Adjusted EBITDA*
331.1
$
Total Debt / 2011 Adjusted EBITDA*
4.1x
Net Debt / 2011 Adjusted EBITDA*
2.7x
Y/E 2011
* See reconciliation of Adjusted EBITDA (earnings before interest, taxes,
depreciation and amortization) in the appendix. |
    Stock
Repurchases and Dividends (In Millions, except per share amounts)
2009-2011
2011
Total
Shares purchased
31
83
Average price per share
$5.07
$4.83
Repurchase amount
$157
$402
Authorization expired at 2011 year end.
Quarterly Cash Dividend
•
$0.02 per share
•
Payable on March 15, 2012 to stockholders of
record as of March 1, 2012
Quarterly Cash Dividend
•
$0.02 per share
•
Payable on March 15, 2012 to stockholders of
record as of March 1, 2012
11 |
 2012
OUTLOOK The Wendy’s Company
Company-Operated Same-Store Sales
2 to 3%
Company-Operated Restaurant Margin
Flat to +50 bps
Commodity Basket Increase
115 to 145 bps
Adjusted EBITDA
$335 to $345
million |
 2012
Capital Expenditures The Wendy’s Company
Investing to increase long-term shareholder value
New Units
$40
Remodels
40
Restaurant Equipment/Maintenance
65
Product Development
20
Technology
30
Other
30
Total Estimated Capex
$225
$ IN MILLIONS |
 The Wendy’s Company
* International Growth (outside of North America)
2012
Low-single
digit Adjusted
EBITDA
growth rate
2013 & Beyond
High-single to
low-double digit
Adjusted
EBITDA
growth rate
14
Breakfast
Image Activation: New
North America Business
Improvement
Financial
Strategies
Image Activation: Remodels
Int’l* |
 EMIL
BROLICK
PRESIDENT & CHIEF EXECUTIVE OFFICER |
 WENDY’S
RECIPE
TO WIN
The Wendy’s Company |
 A CUT
ABOVE A CUT ABOVE
Foundation
of
Recipe
to
Win
BRAND VISION
Foundation
of
Recipe
to
Win
BRAND VISION |
 A CUT
ABOVE Why it will work
Reimaging the Restaurants
Reimaging the People
Reimaging the Experience
Reimaging the Food
Reimaging the Brand Communications |
 A CUT
ABOVE A Quick Casual Experience at a QSR Price! |
 IMAGE
ACTIVATION Contemporizing Wendy’s
is key to growth
Moves us from a functional
to an emotional experience
Makes other Ps work better
P
LACE
The Wendy’s Company |
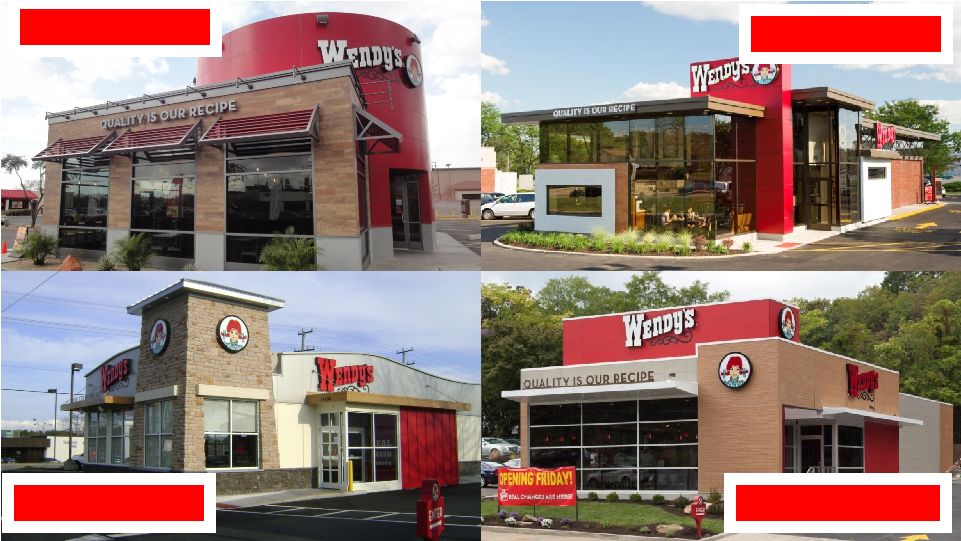 TRADITIONAL
ULTRA-MODERN
URBAN
CONTEMPORARY |
 Image
Activation Strategy 22
2011
Initial 10 remodels
•
Customer feedback very positive
•
Sales exceeding expectations
2012
50 remodels
•
$750 to $850K investment
•
Targeting 15% ROI
•
Develop financing sources for franchisees
20 new restaurants
2013
and
beyond
Accelerate growth
•
Value-engineered investment / lower costs
•
Meet return target |
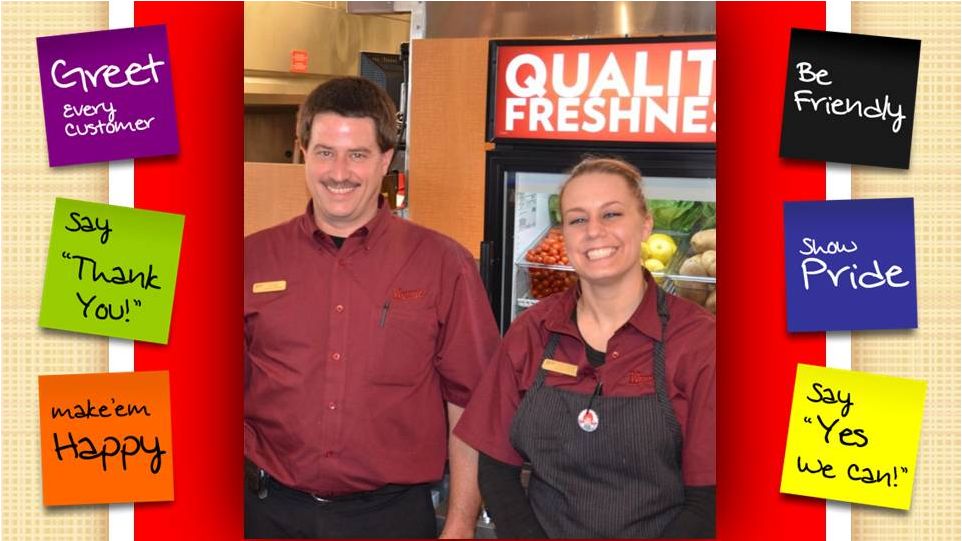
 In
each Image Activation restaurant: The Wendy’s Company
P
EOPLE
Re-interview staff
Change leadership if needed
Focus on “Five-Stars”
/ hire exceptional
new employees
IMPROVING RELIABILITY AND PREDICTABILITY |
 Win with “Five-Star Athletes” |
 RESTAURANT OPERATING LEVELS
U.S. Company and Franchise Restaurants
The Wendy’s Company
2008
2011
2008
2011
A & B LEVEL
F LEVEL
P
ERFORMANCE
83.5%
32.5%
24.8%
0.6% |
 |
 P
ROMOTION
Message
Creative
Media
The Wendy’s Company |
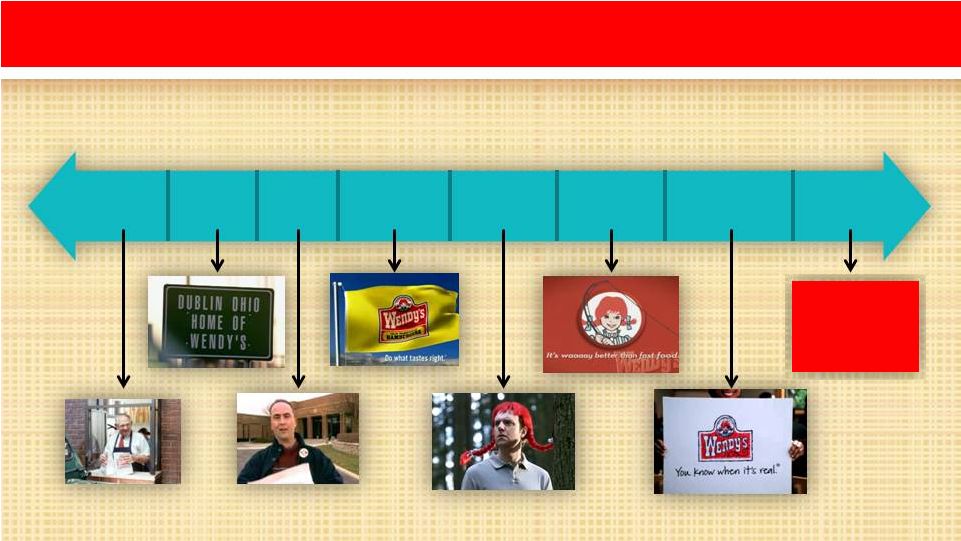 PROMOTION…Creative
Ad Campaign Chronology…There was Dave and then…
24 Ads
30 Ads
55 Ads
50 Ads
9 Ads
700+ Ads
1989-2002
2004
2005-2006
2007
2008-2009
2009-2011
2012
Dave
Mr.
Wendy
Do What
Tastes Right
Red Wig/
That’s Right
Waaaay
Better
You Know
When It’s Real
Code Name:
RED
The Wendy’s Company
2003
Town of
Dublin
15 Ads
2
nd
Qtr
New
Campaign
2
nd
Qtr
New
Campaign |
 NEW
CAMPAIGN SUCCESS CRITERIA
GOAL
Win the Hearts and Minds of Consumers
Competing for share of mind, not just selling products
HOW
Tactically and Strategically Brilliant
Creates emotional connection to “Big Brand,”
gains trial of promoted idea
Unique
look,
tone
and
feel
…
you
will
know
it
is
Wendy’s
The Wendy’s Company |
 The Wendy’s Company
P
RODUCT
Successful launch of new
core product in 2011 |
 The Wendy’s Company
PREMIUM
HAMBURGER
TASTES
PREMIUM
HAMBURGER
TASTES
PREMIUM
SEASONAL
SALAD
PREMIUM
SEASONAL
SALAD
NEW NEWS
ON A
CLASSIC
NEW NEWS
ON A
CLASSIC
NEW TWIST
ON NATURAL
CUT FRIES
NEW TWIST
ON NATURAL
CUT FRIES
P
RODUCT
2012 HIGHLIGHTS
2012 HIGHLIGHTS |
 DIFFERENTIATED MENU OFFERINGS
FRESH INGREDIENTS AND FRESH PREPARATION
SANDWICHES
BEVERAGES
SIDES
The Wendy’s Company
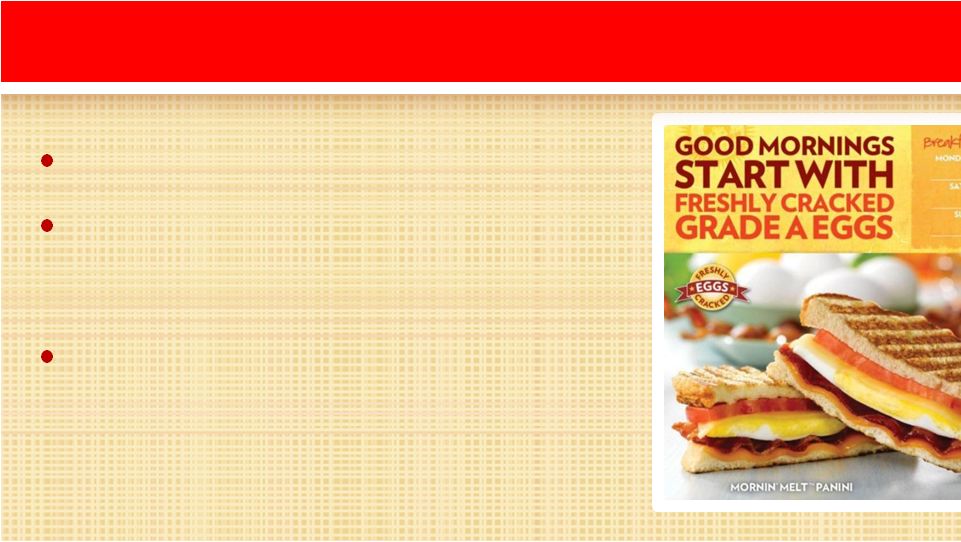
Consumers rate Wendy’s breakfast products
notably higher than the competition’s
P
RODUCT
|
 The Wendy’s Company
BREAKFAST
OPERATIONALLY SUCCESSFUL
breakfast business
Committed to earning our share of the
Able to execute at various volumes
among our best
Operational attribute scores at breakfast are
P
RODUCT
|
 The Wendy’s Company
BREAKFAST EXPANSION –
2012
New market in Northeast
Adding breakfast to
select company remodels
and new builds
Focused on building
awareness and driving
sales growth |
 OUR
COMPETITIVE ADVANTAGES The Wendy’s Company
35
Iconic brand, latent equities
Clear brand vision …
A CUT ABOVE
Well-defined growth platforms
We have the RECIPE TO WIN
Focused on EXECUTION |
 Upcoming
Investor Calendar 36
March
7:
Bank
of
America
Merrill
Lynch
Conference
March 12:
Roth
Growth
Stock
Conference
March 15:
UBS
Global
Consumer
Conference
May 8:
1Q Earnings Release |
 Q&A |
 The Wendy’s Company
©2012 Oldemark LLC |
 Appendix |
  Reconciliation of Adjusted EBITDA to Income from
Continuing Operations
(Unaudited)
(In Millions)
2011
2010
2011
2010
Adjusted EBITDA
80.9
$
73.2
$
331.1
$
341.9
$
(Less) plus:
Transaction related and other costs
(15.0)
-
(45.7)
-
Arby's indirect corporate overhead in general and administrative (G&A)
-
(7.9)
(14.6)
(32.7)
SSG purchasing cooperative expenses in G&A
-
(0.3)
2.2
(5.2)
Integration costs in G&A
-
(1.2)
-
(5.5)
Reversal of pension withdrawal expense in cost of sales
-
5.0
-
5.0
Depreciation and amortization
(32.0)
(30.4)
(123.0)
(126.8)
Impairment of long-lived assets
(4.6)
(4.9)
(12.9)
(26.3)
Operating profit
29.3
33.5
137.1
150.4
Interest expense
(28.2)
(28.6)
(114.1)
(118.4)
Loss on early extinguishment of debt
-
-
-
(26.2)
Investment income, net
0.3
0.0
0.5
5.3
Other income, net
0.2
0.3
0.9
2.5
Income from continuing operations before income taxes
1.6
5.2
24.4
13.6
Benefit from (provision for) income taxes
2.7
0.9
(6.5)
4.5
Income from continuing operations
4.3
$
6.1
$
17.9
$
18.1
$
Fourth Quarter
Twelve Months |
 Reconciliation of Adjusted Income from Continuing Operations
and Adjusted Earnings per Share to Income from Continuing
Operations and Earnings per Share
(Unaudited)
(in millions, except per share amounts)
per share
per share
per share
per share
Adjusted income from continuing operations and adjusted earnings per share
16.4
$
0.04
$
12.0
$
0.03
$
62.1
$
0.15
$
71.7
$
0.17
$
(Less) plus:
Arby's transaction related and other costs
(9.3)
(0.02)
-
-
(28.5)
(0.07)
-
-
Impairment of long-lived assets
(2.8)
(0.01)
(3.0)
(0.01)
(7.9)
(0.02)
(16.3)
(0.04)
Arby's indirect corporate overhead in G&A
-
-
(5.0)
(0.02)
(9.2)
(0.02)
(20.5)
(0.05)
SSG purchasing cooperative expenses in G&A
-
-
(0.2)
-
1.4
-
(3.2)
(0.01)
Integration costs in G&A
-
-
(0.8)
-
-
-
(3.5)
(0.01)
Reversal of pension withdrawal expense in cost of sales
-
-
3.1
0.01
-
-
3.1
0.01
Loss on early extinguishment of debt
-
-
-
-
-
-
(16.3)
(0.04)
Gain on collection of Deerfield Capital Corp. note receivable
-
-
-
-
-
-
3.1
0.01
(12.1)
(0.03)
(5.9)
(0.02)
(44.2)
(0.11)
(53.6)
(0.13)
Income from continuing operations and earnings per share
4.3
$
0.01
$
6.1
$
0.01
$
17.9
$
0.04
$
18.1
$
0.04
$
Fourth Quarter
Twelve Months
2011
2010
2011
2010 |