Attached files
| file | filename |
|---|---|
| EX-99.1 - EXHIBIT 99.1 - DEX ONE Corp | a50187402ex99_1.htm |
| 8-K - DEX ONE CORPORATION 8-K - DEX ONE Corp | a50187402.htm |
Exhibit 99.2
Slide: 0 Title: 2011 Results Package March 1, 2012
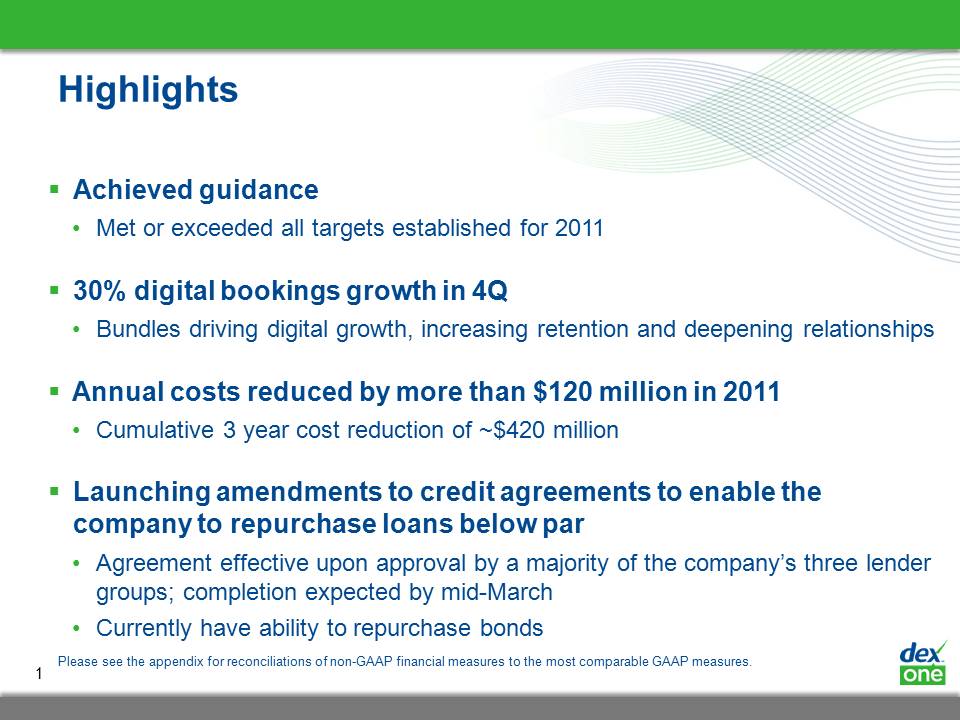
Slide: 1 Title: Highlights Achieved guidanceMet or exceeded all targets established for 201130% digital bookings growth in 4QBundles driving digital growth, increasing retention and deepening relationshipsAnnual costs reduced by more than $120 million in 2011Cumulative 3 year cost reduction of ~$420 millionLaunching amendments to credit agreements to enable the company to repurchase loans below parAgreement effective upon approval by a majority of the company’s three lender groups; completion expected by mid-March Currently have ability to repurchase bonds Please see the appendix for reconciliations of non-GAAP financial measures to the most comparable GAAP measures.
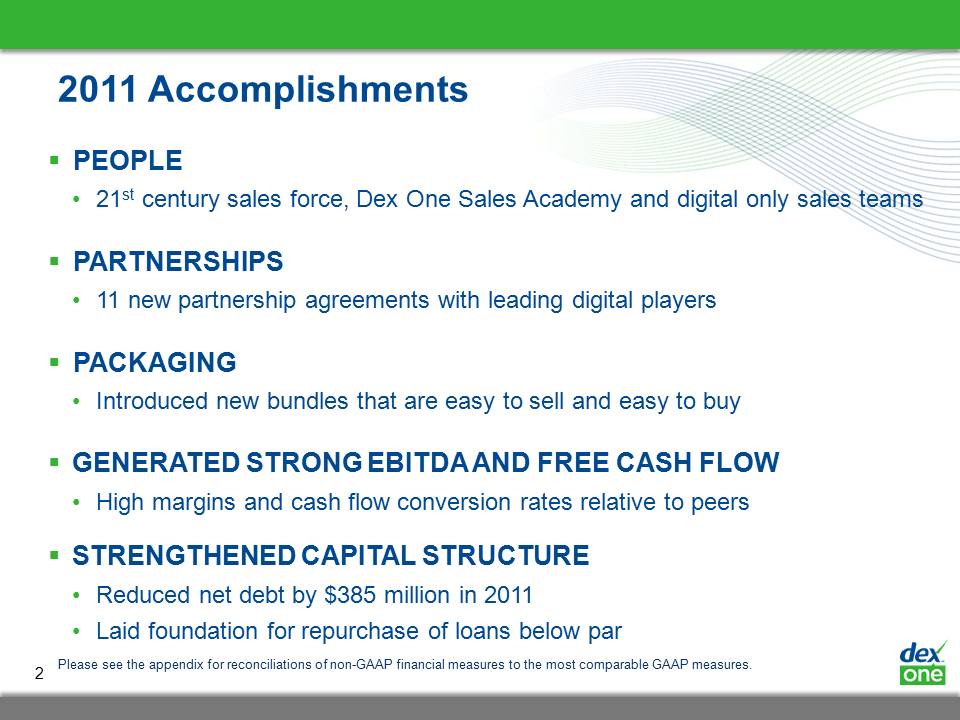
Slide: 2 Title: 2011 Accomplishments PEOPLE21st century sales force, Dex One Sales Academy and digital only sales teamsPARTNERSHIPS11 new partnership agreements with leading digital playersPACKAGINGIntroduced new bundles that are easy to sell and easy to buyGenerated strong EBITDA and free cash flowHigh margins and cash flow conversion rates relative to peersStrengthened capital structureReduced net debt by $385 million in 2011Laid foundation for repurchase of loans below par Please see the appendix for reconciliations of non-GAAP financial measures to the most comparable GAAP measures.
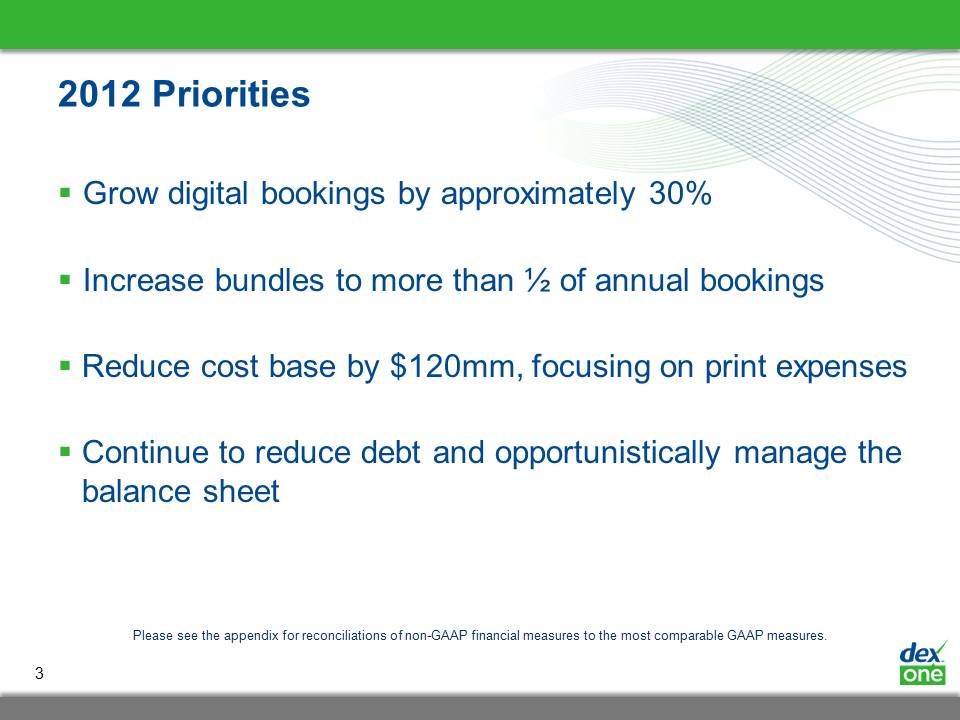
Slide: 3 2012 Priorities Grow digital bookings by more than 30%Increase bundles to more than ½ of annual bookingsReduce cost base by $120mm, focusing on print expensesContinue to reduce debt and opportunistically manage the balance sheet Please see the appendix for reconciliations of non-GAAP financial measures to the most comparable GAAP measures
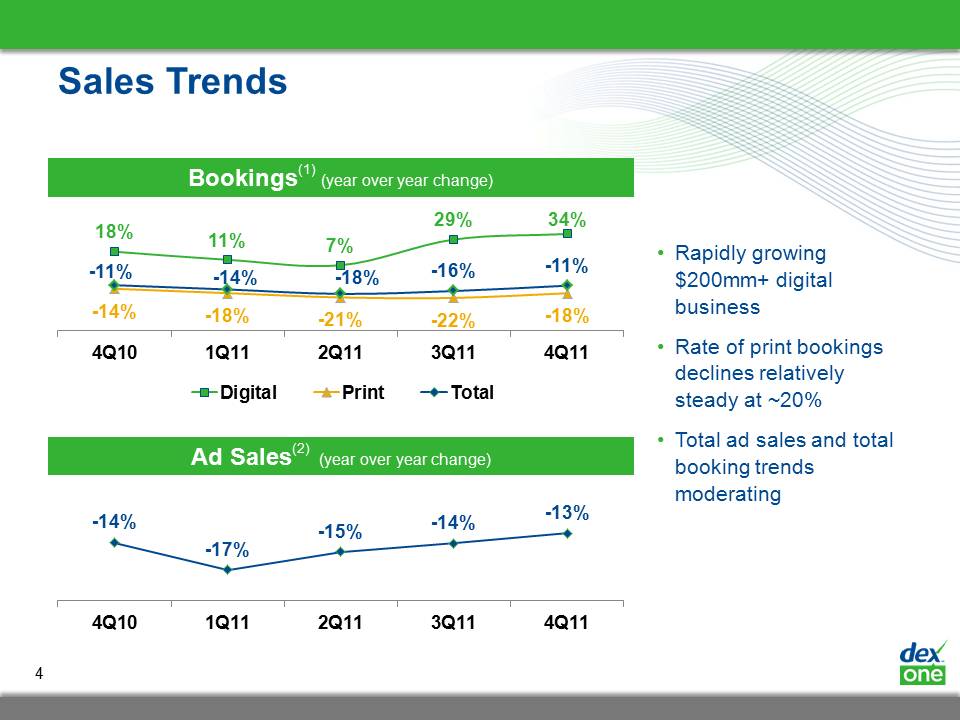
Slide: 4 Title: Sales Trends Bookings(1) (year over year change) Ad Sales(2) (year over year change) Rapidly growing $200mm+ digital businessRate of print bookings declines relatively steady at ~20%Total ad sales and total booking trends moderating
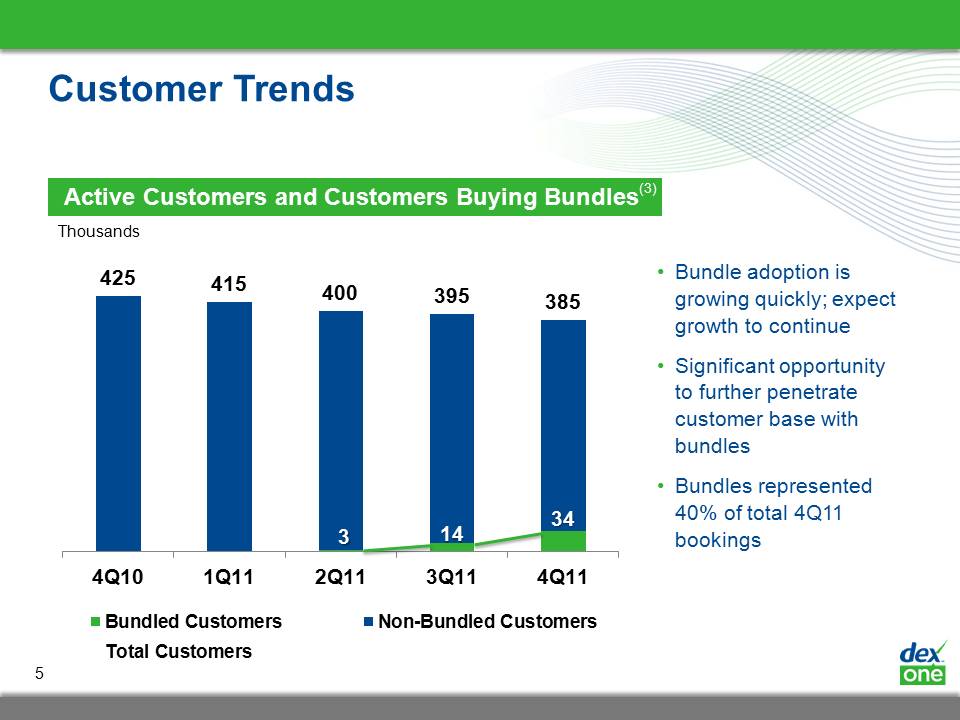
Slide: 5 Title: Customer Trends Bundle adoption is growing quickly; expect growth to continueSignificant opportunity to further penetrate customer base with bundlesBundles represented 40% of total 4Q11 bookings Active Customers and Customers Buying Bundles(3) Thousands
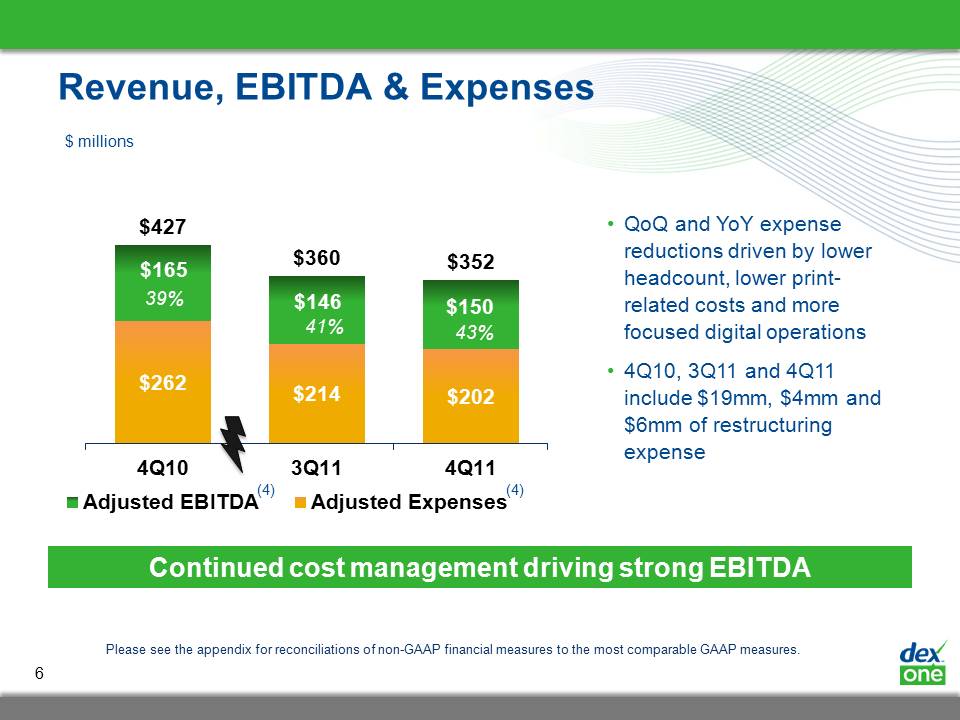
Slide: 6 Title: Revenue, EBITDA & Expenses QoQ and YoY expense reductions driven by lower headcount, lower print-related costs and more focused digital operations4Q10, 3Q11 and 4Q11 include $19mm, $4mm and $6mm of restructuring expense 39% 41% 43% (4) (4) Please see the appendix for reconciliations of non-GAAP financial measures to the most comparable GAAP measures. $ millions Continued cost management driving strong EBITDA
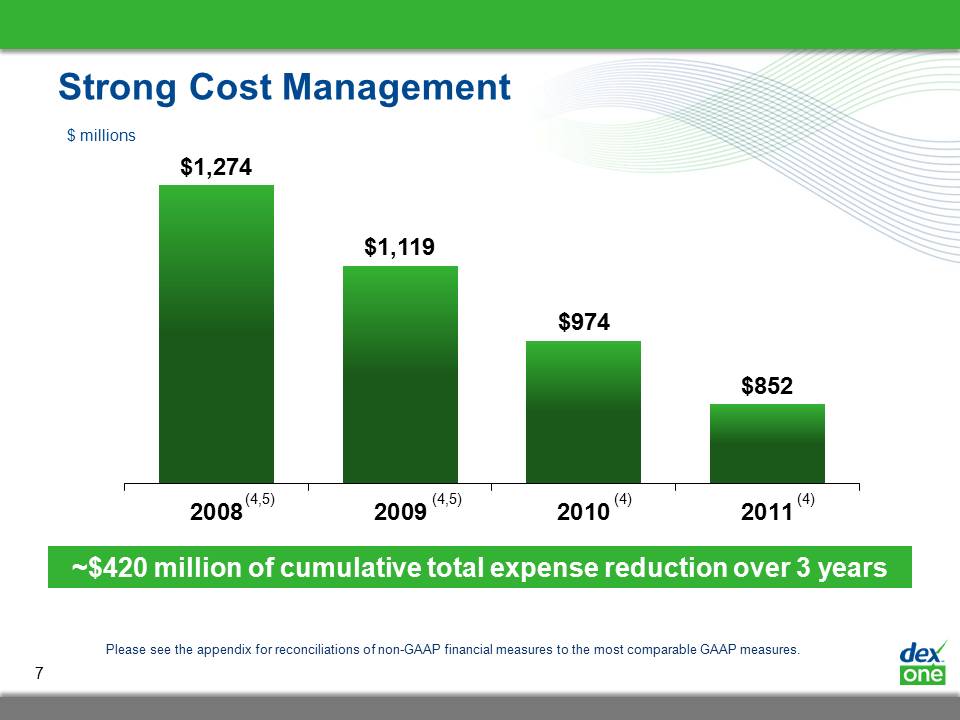
Slide: 7 Title: Strong Cost Management Please see the appendix for reconciliations of non-GAAP financial measures to the most comparable GAAP measures. $ millions (4,5) (4) (4) (4,5) ~$420 million of cumulative total expense reduction over 3 years
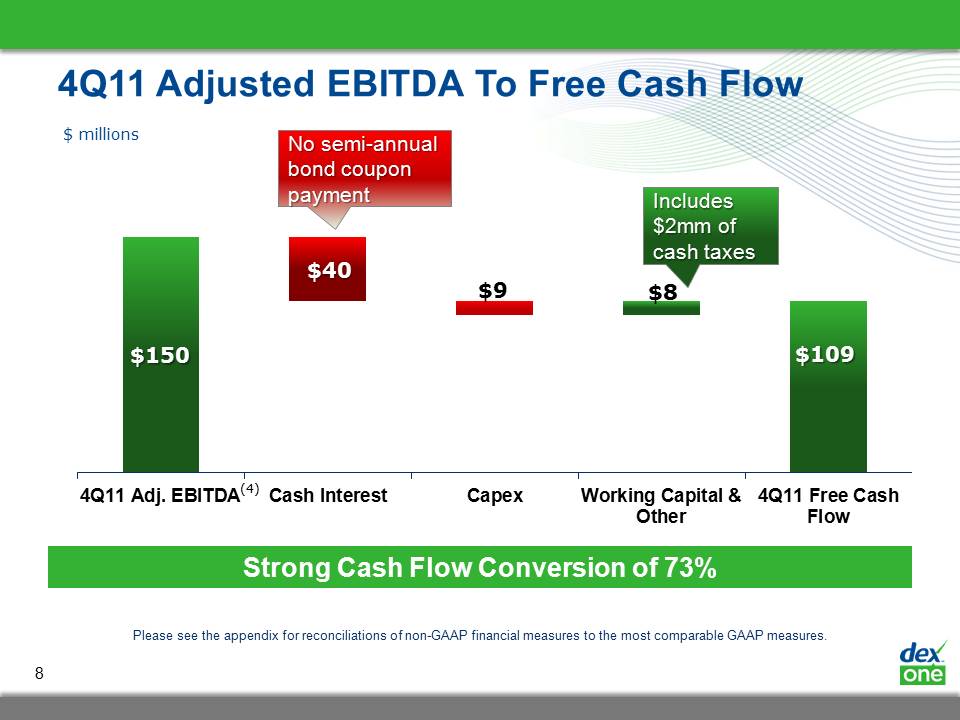
Slide: 8 Title: 4Q11 Adjusted EBITDA To Free Cash Flow $ millions (4) Please see the appendix for reconciliations of non-GAAP financial measures to the most comparable GAAP measures. Strong Cash Flow Conversion of 73% Includes $2mm of cash taxes No semi-annual bond coupon payment
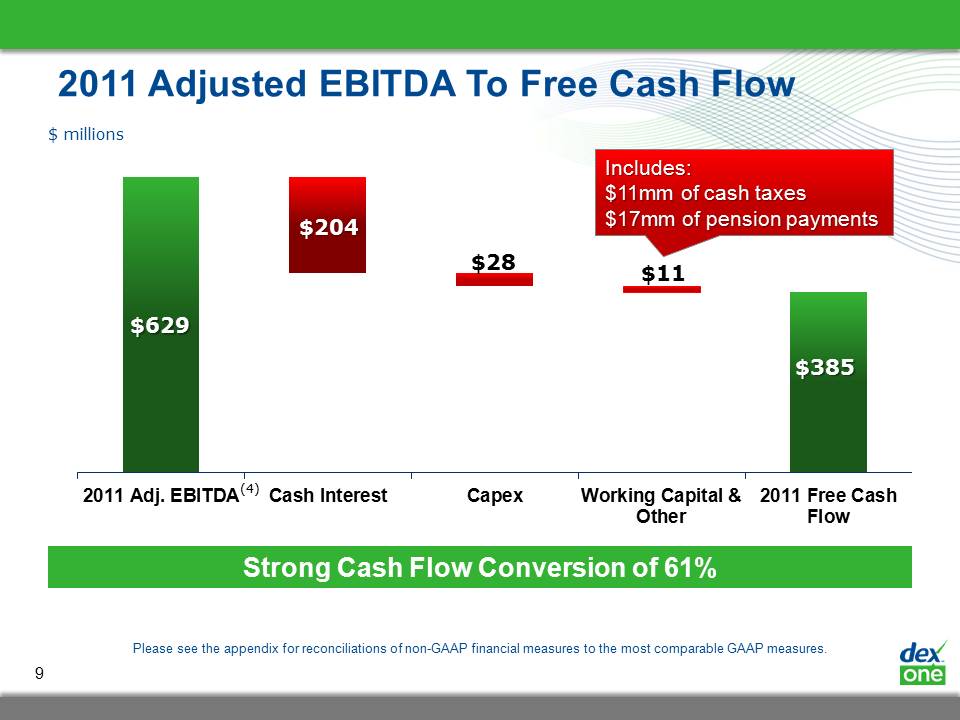
Slide: 9 Title: 2011 Adjusted EBITDA To Free Cash Flow $ millions (4) Please see the appendix for reconciliations of non-GAAP financial measures to the most comparable GAAP measures. Strong Cash Flow Conversion of 61% Includes: $11mm of cash taxes$17mm of pension payments
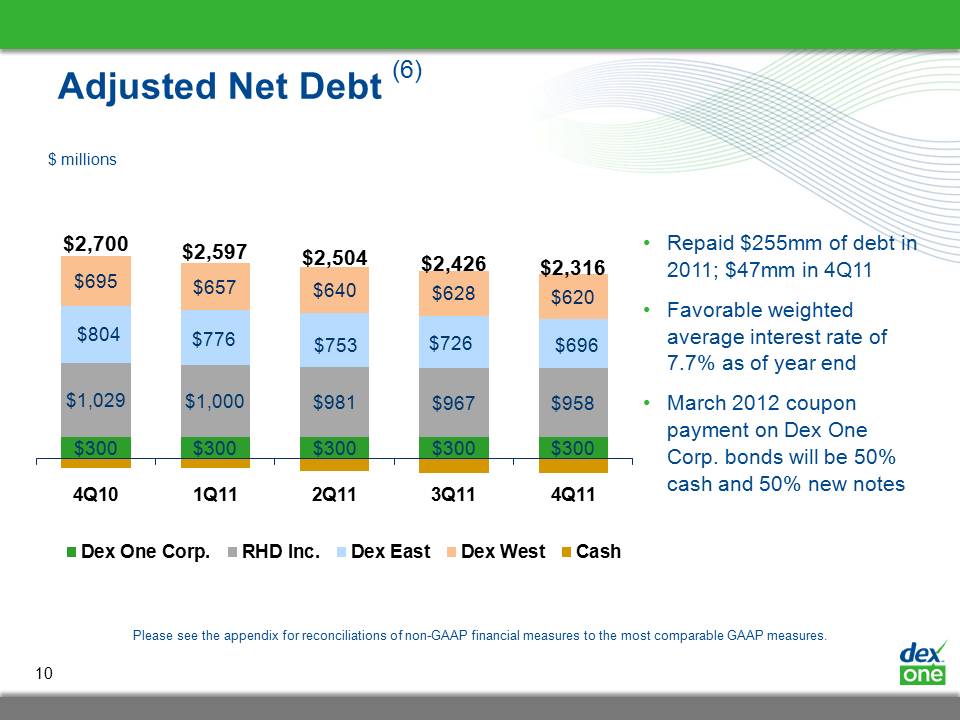
Slide: 10 $ millions Title: Adjusted Net Debt (6) Repaid $255mm of debt in 2011; $47mm in 4Q11Favorable weighted average interest rate of 7.7% as of year endMarch 2012 coupon payment on Dex One Corp. bonds will be 50% cash and 50% new notes Please see the appendix for reconciliations of non-GAAP financial measures to the most comparable GAAP measures.
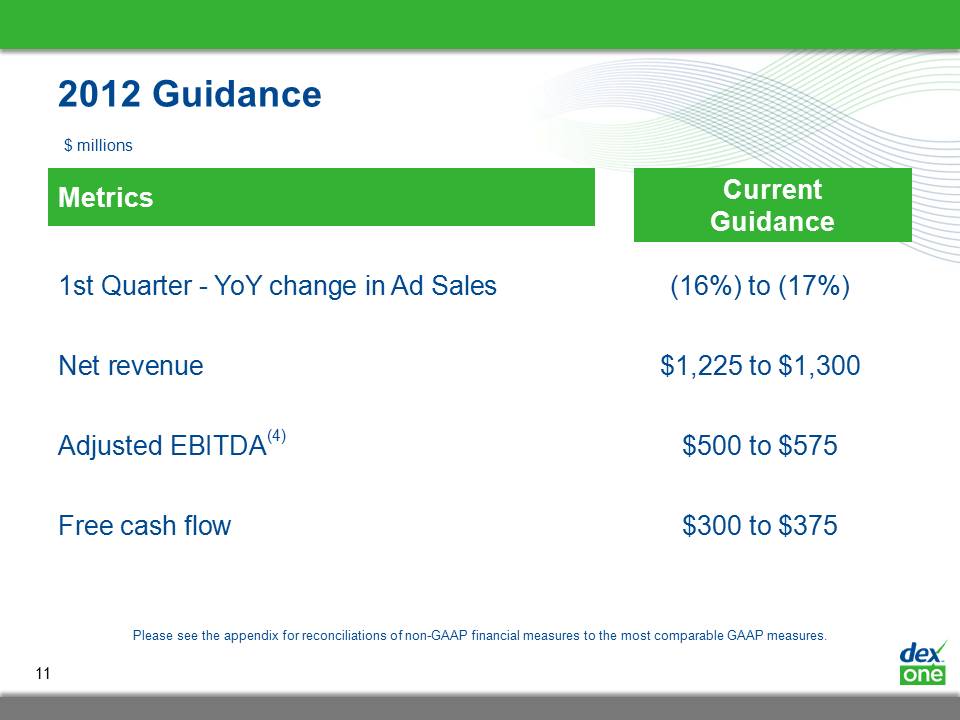
Slide: 11 2012 Guidance 1st Quarter - YoY change in Ad Sales (16%) to (17%)Net revenue $1,225 to $1,300Adjusted EBITDA(4) $500 to $575Free cash flow $300 to $375 Metrics Current Guidance Please see the appendix for reconciliations of non-GAAP financial measures to the most comparable GAAP measures. $ millions
Slide: 12 Title: Safe Harbor Statement Certain statements contained in this presentation regarding Dex One Corporation's future operating results, performance, business plans, prospects, guidance and any other statements not constituting historical fact are “forward-looking statements” subject to the safe harbor created by the Private Securities Litigation Reform Act of 1995. Where possible, the words “believe,” “expect,” “anticipate,” “intend,” “should,” “will,” “would,” “planned,” “estimated,” “potential,” “goal,” “outlook,” “may,” “predicts,” “could,” or the negative of such terms, or other comparable expressions, as they relate to Dex One Corporation or its management, have been used to identify such forward-looking statements. All forward-looking statements reflect only Dex One Corporation's current beliefs and assumptions with respect to future business plans, prospects, decisions and results, and are based on information currently available to Dex One Corporation. Accordingly, the statements are subject to significant risks, uncertainties and contingencies, which could cause Dex One Corporation's actual operating results, performance or business plans or prospects to differ materially from those expressed in, or implied by, these statements.Factors that could cause actual results to differ materially from current expectations include risks and other factors described in Dex One Corporation's publicly available reports filed with the SEC, which contain a discussion of various factors that may affect Dex One Corporation's business or financial results. Such risks and other factors, which in some instances are beyond Dex One Corporation's control, include: the continuing decline in the use of print directories; increased competition, particularly from existing and emerging online technologies; ongoing weak economic conditions and continued decline in advertising sales; our ability to collect trade receivables from customers to whom we extend credit; our ability to generate sufficient cash to service our debt; our ability to comply with the financial covenants contained in our debt agreements and the potential impact to operations and liquidity as a result of restrictive covenants in such debt agreements; our ability to refinance or restructure our debt on reasonable terms and conditions as might be necessary from time to time; increasing interest rates; changes in the company's and the company's subsidiaries credit ratings; changes in accounting standards; regulatory changes and judicial rulings impacting our business; adverse results from litigation, governmental investigations or tax related proceedings or audits; the effect of labor strikes, lock-outs and negotiations; successful realization of the expected benefits of acquisitions, divestitures and joint ventures; our ability to maintain agreements with CenturyLink and AT&T and other major Internet search and local media companies; our reliance on third-party vendors for various services; and other events beyond our control that may result in unexpected adverse operating results. Dex One Corporation is not responsible for updating the information contained in this presentation beyond the published date, or for changes made to this document by wire services or Internet service providers. This presentation is being furnished to the SEC through a Form 8-K. The Company's Annual Report on Form 10-K for the period ended December 31, 2011 to be filed with the SEC may contain updates to the information included in this presentation.We reference non-GAAP financial measures in this presentation. Please see the appendix for a reconciliation of non-GAAP measures to the most comparable GAAP measures.
Slide: 13 Title: Endnotes Bookings is a non-GAAP statistical measure that represents sales activity associated with our print directories and Internet-based marketing solutions during the period. Bookings associated with our local customers represent signed contracts during the period. Bookings associated with our national customers represent what has been published or fulfilled during the period. The year over year change in bookings is calculated by dividing the difference between bookings in the current period and bookings generated in the prior year divided by the bookings generated in the prior year.Advertising sales is another non-GAAP statistical measure and consists of sales of advertising in print directories distributed during the period and Internet-based products and services with respect to which such advertising first appeared publicly during the period. The year over year change in ad sales is calculated by dividing the difference between ad sales in the current period and the adjusted ad sales in the prior year divided by the adjusted ad sales in the prior year. The adjustments made to the prior year’s ad sales are made in an attempt to create a same store sales metric.Figures are calculated on a rolling 4 quarter basis. Total and non-bundled customers are measured on a published basis. Bundled customers are counted on a contract basis.Adjusted EBITDA and adjusted costs exclude the following items in the applicable periods: impairment charges, fresh start accounting (for periods in which it had a material impact on results of operations), gains and losses on debt transactions, and stock based compensation and long-term incentive costs.2008 expenses exclude a one-time curtailment gain of $40 million gain related to the elimination of retiree health care and life insurance benefits for non-union employees. 2009 expenses exclude a one-time curtailment gain of $52 million gain related to the elimination of retiree health care and life insurance benefits for CWA and IBEW represented employees.Represents principal outstanding, which includes the fair value discount. These figures differ from GAAP balances.
Slide: 14 Title: APPENDIX
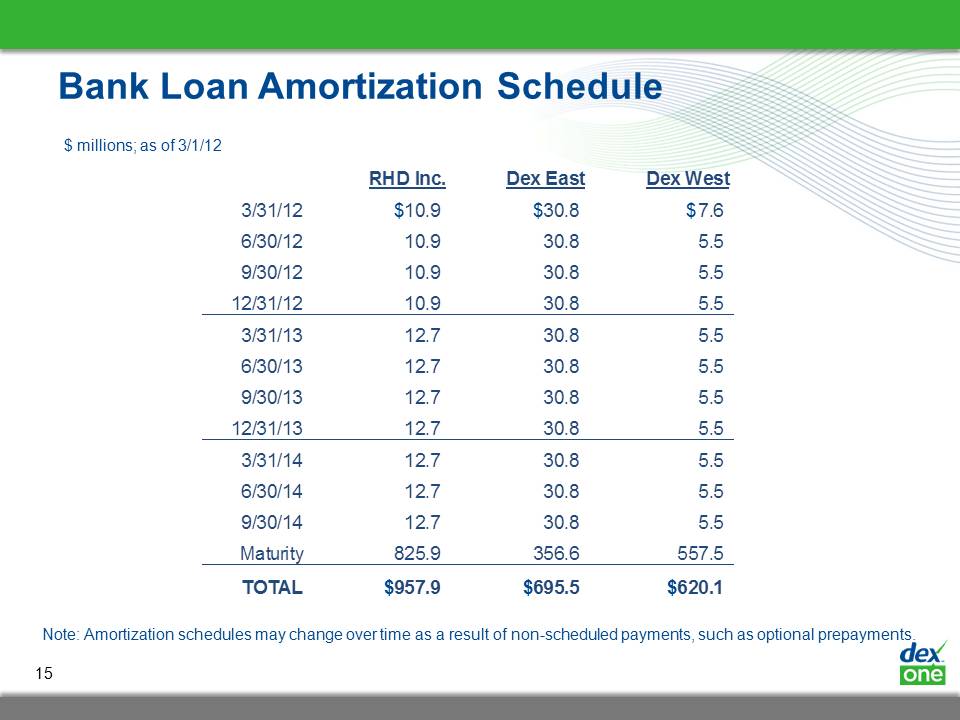
Slide: 15 Title: Bank Loan Amortization Schedule Note: Amortization schedules may change over time as a result of non-scheduled payments, such as optional prepayments. $ millions; as of 3/1/12 (Gp:) $ (Gp:) $ (Gp:) $ (Gp:) $ (Gp:) $ (Gp:) $
Slide: 16 Title: GAAP Reconciliations – Fresh Start And Other Adjustments The Company adopted fresh start accounting and reporting effective February 1, 2010, the Fresh Start Reporting Date. The financial statements as of the Fresh Start Reporting Date report the results of Dex One with no beginning retained earnings or accumulated deficit. Any presentation of Dex One represents the financial position and results of operations of a new reporting entity and is not comparable to prior periods presented by the Predecessor Company. The financial statements for periods ended prior to the Fresh Start Reporting Date do not include the effect of any changes in the Predecessor Company's capital structure or changes in the fair value of assets and liabilities as a result of fresh start accounting. As a result of the deferral and amortization method of revenue recognition, recognized gross advertising revenues reflect the amortization of advertising sales consummated in prior periods as well as in the current period. The adoption of fresh start accounting had a significant impact on the financial position and results of operations of the Company subsequent to the Fresh Start Reporting Date. Fresh start accounting precluded us from recognizing deferred revenue of $69.0 million and $790.9 million and certain deferred expenses of $15.5 million and $172.6 million during the three and eleven months ended December 31, 2010, respectively, associated with advertising sales fulfilled prior to the Fresh Start Reporting Date. Thus, our reported results for the three and eleven months ended December 31, 2010 were not indicative of our underlying operating and financial performance and are not comparable to any current period presentation. Accordingly, management has provided a non-GAAP analysis that compares the Company's (1) GAAP results for the three months ended December 31, 2011 to Non-GAAP Adjusted Results for the three months ended December 31, 2010 and (2) GAAP results for the year ended December 31, 2011 to Non-GAAP Combined Adjusted Results for the year ended December 31, 2010 for net revenue through depreciation and amortization expenses.Management believes that these non-GAAP financial measures are important indicators of our operations because they exclude items that may not be indicative of, or related to, our core operating results, and provide a better baseline for analyzing our underlying business. Non-GAAP Adjusted Results adjusts GAAP results of the Company for the three months ended December 31, 2010 to (i) eliminate the fresh start accounting impact on revenue and certain related expenses noted above and (ii) exclude cost-uplift recorded under fresh start accounting of $3.6 million for the three months ended December 31, 2010. Non-GAAP Combined Adjusted Results (1) combines GAAP results of the Company for the eleven months ended December 31, 2010 and GAAP results of the Predecessor Company for the one month ended January 31, 2010 and (2) adjusts these combined amounts to (i) eliminate the fresh start accounting impact on revenue and certain related expenses noted above and (ii) exclude cost-uplift recorded under fresh start accounting of $12.3 million for the eleven months ended December 31, 2010. Deferred directory costs, such as print, paper, distribution and commissions, relate to directories that have not yet been published and have been recorded at fair value, determined as (a) the estimated billable value of the published directory less (b) the expected costs to complete the directory, plus (c) a normal profit margin. This incremental fresh start accounting adjustment to step up the recorded value of the deferred directory costs to fair value is hereby referred to as “cost-uplift.” Cost-uplift has been amortized over the terms of the applicable directories, not to exceed twelve months. Fresh start accounting had an immaterial impact on our results of operations for the three months and year ended December 31, 2011. Therefore, we have not adjusted our GAAP results for these periods. Management believes that the presentation of Non-GAAP Adjusted and Combined Adjusted Results will help financial statement users better understand the material impact fresh start accounting had on the Company's results of operations for the three and eleven months ended December 31, 2010 and also offers a non-GAAP normalized comparison to GAAP results of the Company for the three months and year ended December 31, 2011. The Non-GAAP Adjusted and Combined Adjusted Results presented below are reconciled to the most comparable GAAP measures. While the Non-GAAP Adjusted and Combined Adjusted Results exclude the effects of fresh start accounting, it must be noted that the Non-GAAP Adjusted and Combined Adjusted Results are not comparable to the Company's GAAP results for the three months and year ended December 31, 2011 and should not be treated as such. We strongly encourage investors and stockholders to review our financial statements and publicly filed reports in their entirety and not rely on any single financial measure.
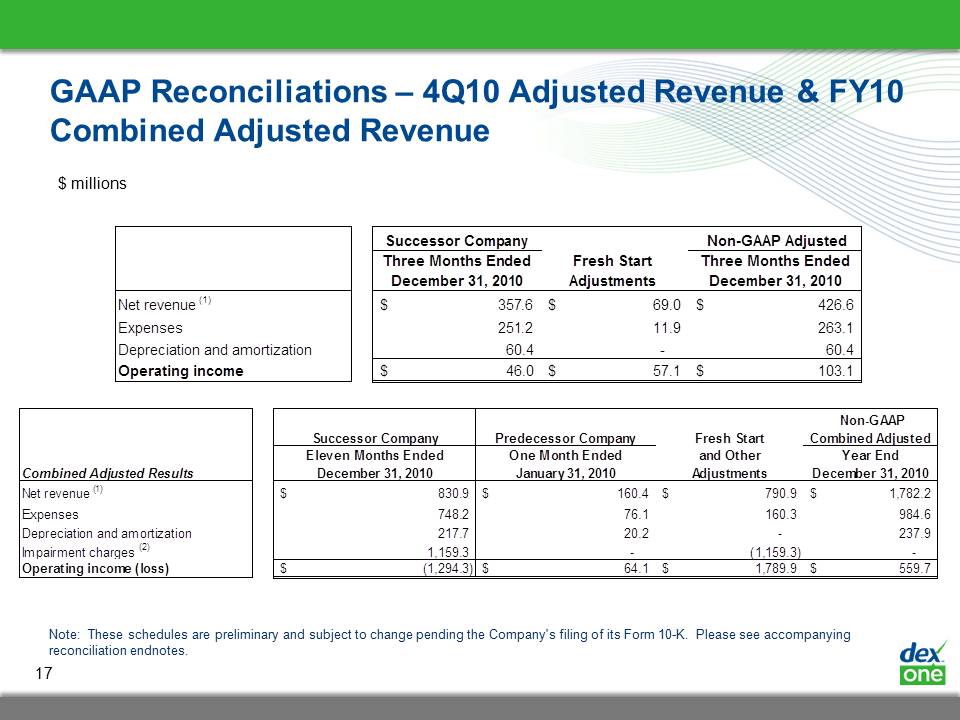
Slide: 17 Title: GAAP Reconciliations – 4Q10 Adjusted Revenue & FY10 Combined Adjusted Revenue Note: These schedules are preliminary and subject to change pending the Company's filing of its Form 10-K. Please see accompanying reconciliation endnotes. $ millions
Slide: 18 Title: GAAP Reconciliations – FY08, FY09, 4Q10, 3Q11, 4Q11 & FY11 Adjusted EBITDA and FY10 Combined Adjusted EBITDA EBITDA, Adjusted EBITDA and Combined Adjusted EBITDA are not measurements of operating performance computed in accordance with GAAP and should not be considered as a substitute for net income (loss) prepared in conformity with GAAP. In addition, EBITDA may not be comparable to similarly titled measures of other companies. Management believes that these non-GAAP financial measures are important indicators of our operations because they exclude items that may not be indicative of, or related to, our core operating results, and provide a better baseline for analyzing our underlying business. Adjusted EBITDA of the Successor Company for the three months ended September 30, 2011 and December 31, 2011 is determined by adjusting EBITDA for stock-based compensation expense and long-term incentive program. Adjusted EBITDA of the Successor Company for the year ended December 31, 2011 is determined by adjusting EBITDA for (i) impairment charges, (ii) stock-based compensation expense and long-term incentive program and (iii) gain on sale of assets. Adjusted EBITDA of the Successor Company for the three months ended December 31, 2010 is determined by adjusting EBITDA to (i) eliminate the fresh start accounting impact on revenue and certain expenses, (ii) exclude the impact of cost-uplift recorded under fresh start accounting and (iii) adjust for stock-based compensation expense and long-term incentive program. Adjusted EBITDA of the Successor Company for the eleven months ended December 31, 2010 is determined by adjusting EBITDA to (i) eliminate the fresh start accounting impact on revenue and certain expenses, (ii) exclude the impact of cost-uplift recorded under fresh start accounting, (iii) exclude goodwill and non-goodwill intangible asset impairment charges and (iv) adjust for stock-based compensation expense and long-term incentive program. Adjusted EBITDA of the Predecessor Company for the year ended December 31, 2008 is determined by adjusting EBITDA (i) for stock-based compensation expense, long-term incentive program and restricted stock units related to acquisitions, (ii) impairment charges and (iii) gains / losses on debt transactions. Adjusted EBITDA of the Predecessor Company for the year ended December 31, 2009 is determined by adjusting EBITDA (i) for stock-based compensation expense and long-term incentive program, (ii) for restricted stock unit expense related to the Business.com Acquisition, (iii) for reorganization items, net and (iv) to exclude the intangible asset impairment charge during the year ended December 31, 2009. Adjusted EBITDA of the Predecessor Company for the one month ended January 31, 2010 is determined by adjusting EBITDA for (i) reorganization items, net and (ii) stock-based compensation expense and long-term incentive program. Combined Adjusted EBITDA for the year ended December 31, 2010 combines the Adjusted EBITDA of the Successor Company for the eleven months ended December 31, 2010 and the Predecessor Company for the one month ended January 31, 2010.
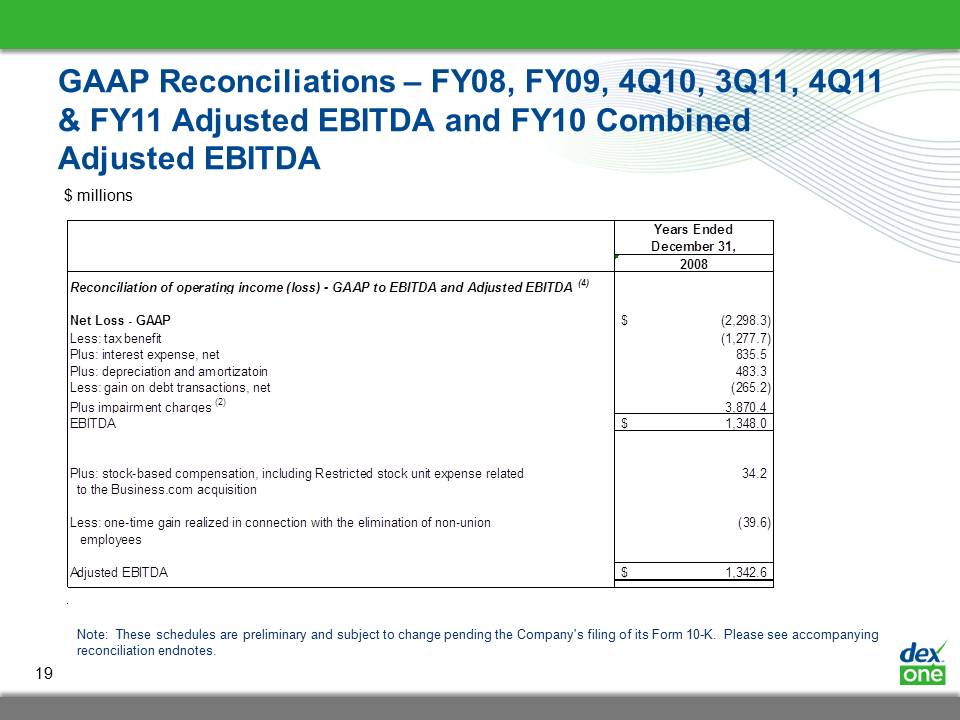
Slide: 19 Title: GAAP Reconciliations – FY08, FY09, 4Q10, 3Q11, 4Q11 & FY11 Adjusted EBITDA and FY10 Combined Adjusted EBITDA Note: These schedules are preliminary and subject to change pending the Company's filing of its Form 10-K. Please see accompanying reconciliation endnotes. $ millions
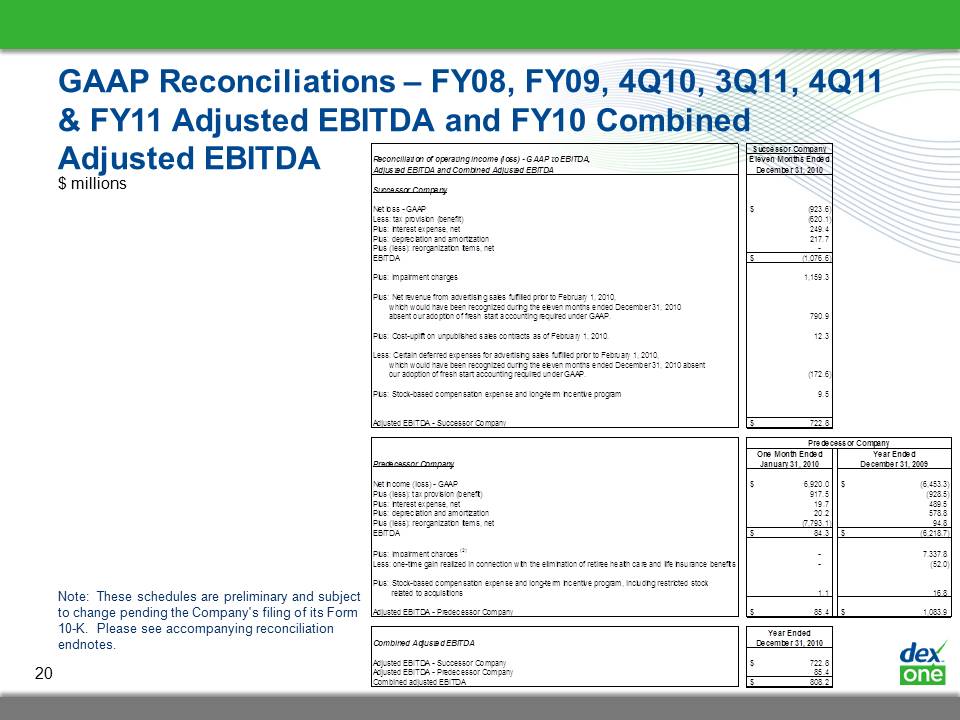
Slide: 20 Title: GAAP Reconciliations – FY08, FY09, 4Q10, 3Q11, 4Q11 & FY11 Adjusted EBITDA and FY10 Combined Adjusted EBITDA Note: These schedules are preliminary and subject to change pending the Company's filing of its Form 10-K. Please see accompanying reconciliation endnotes. $ millions
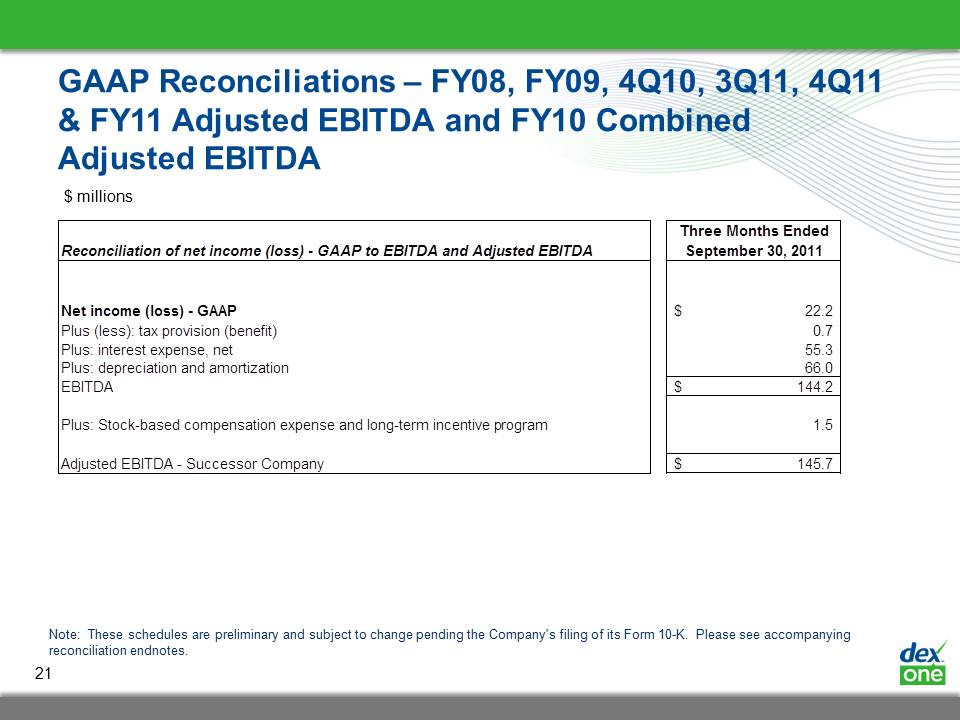
Slide: 21 Title: GAAP Reconciliations – FY08, FY09, 4Q10, 3Q11, 4Q11 & FY11 Adjusted EBITDA and FY10 Combined Adjusted EBITDA Note: These schedules are preliminary and subject to change pending the Company's filing of its Form 10-K. Please see accompanying reconciliation endnotes. $ millions
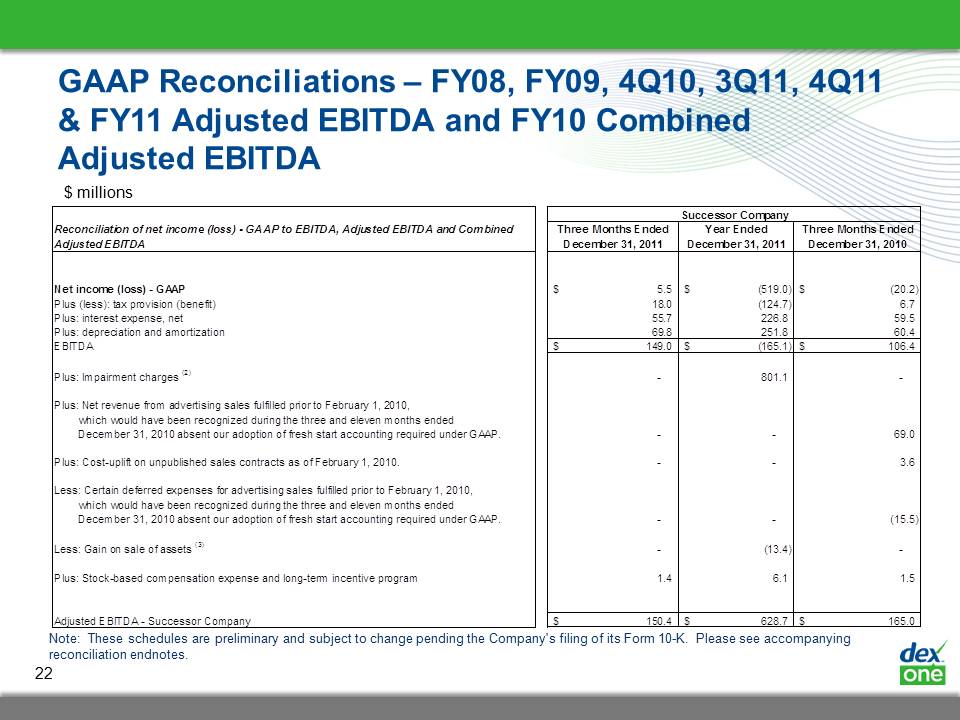
Slide: 22 Title: GAAP Reconciliations – FY08, FY09, 4Q10, 3Q11, 4Q11 & FY11 Adjusted EBITDA and FY10 Combined Adjusted EBITDA Note: These schedules are preliminary and subject to change pending the Company's filing of its Form 10-K. Please see accompanying reconciliation endnotes. $ millions
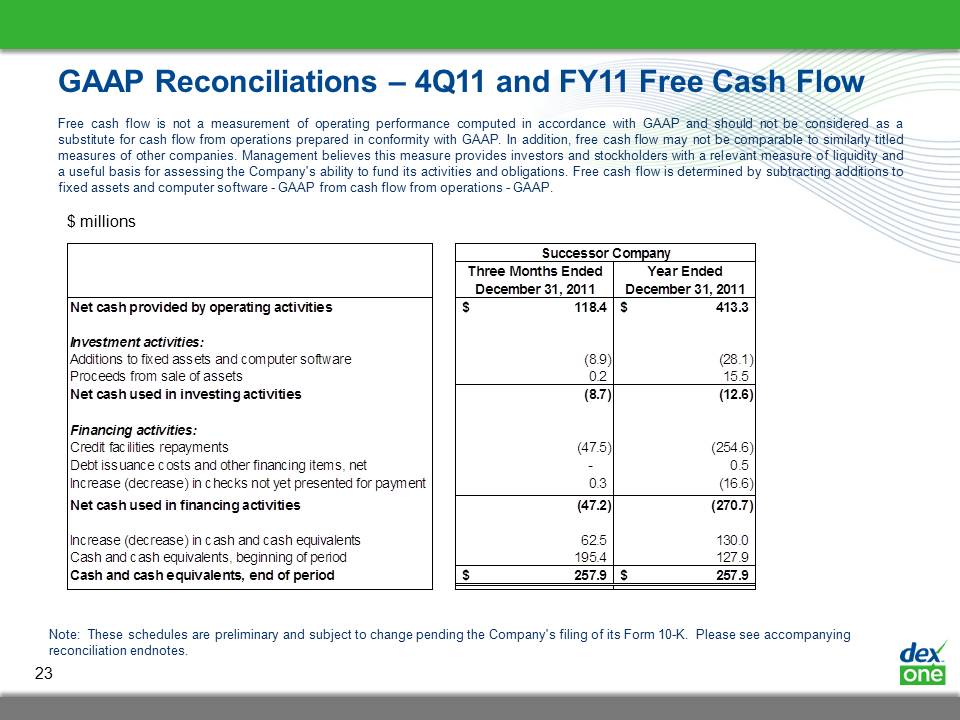
Slide: 23 Title: GAAP Reconciliations – 4Q11 and FY11 Free Cash Flow Free cash flow is not a measurement of operating performance computed in accordance with GAAP and should not be considered as a substitute for cash flow from operations prepared in conformity with GAAP. In addition, free cash flow may not be comparable to similarly titled measures of other companies. Management believes this measure provides investors and stockholders with a relevant measure of liquidity and a useful basis for assessing the Company's ability to fund its activities and obligations. Free cash flow is determined by subtracting additions to fixed assets and computer software - GAAP from cash flow from operations - GAAP. Note: These schedules are preliminary and subject to change pending the Company's filing of its Form 10-K. Please see accompanying reconciliation endnotes. $ millions
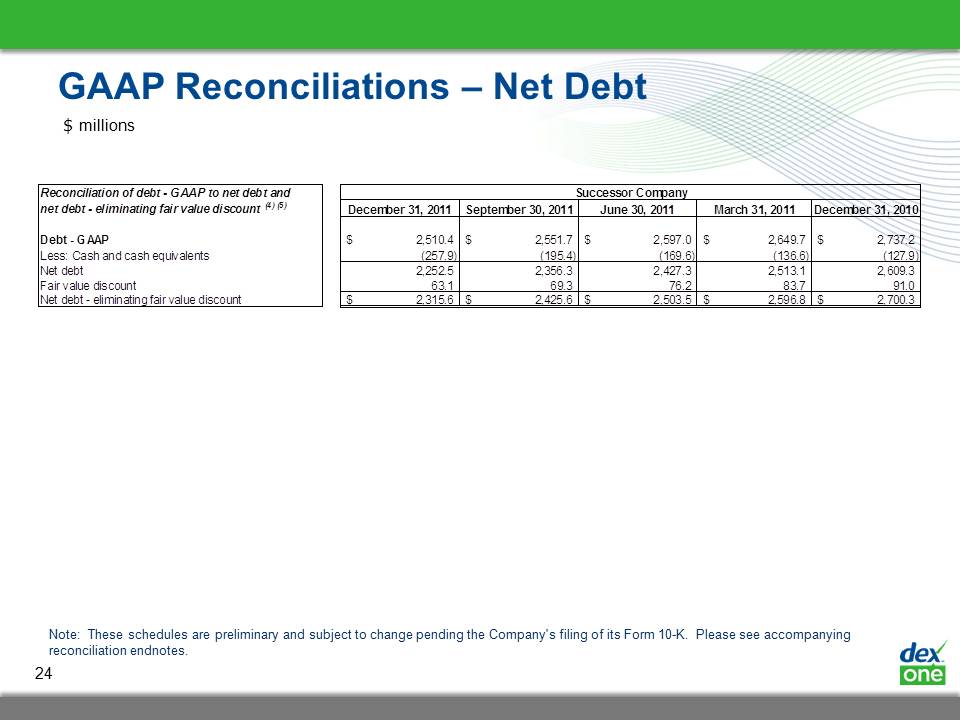
Slide: 24 Title: GAAP Reconciliations – Net Debt $ millions Note: These schedules are preliminary and subject to change pending the Company's filing of its Form 10-K. Please see accompanying reconciliation endnotes.
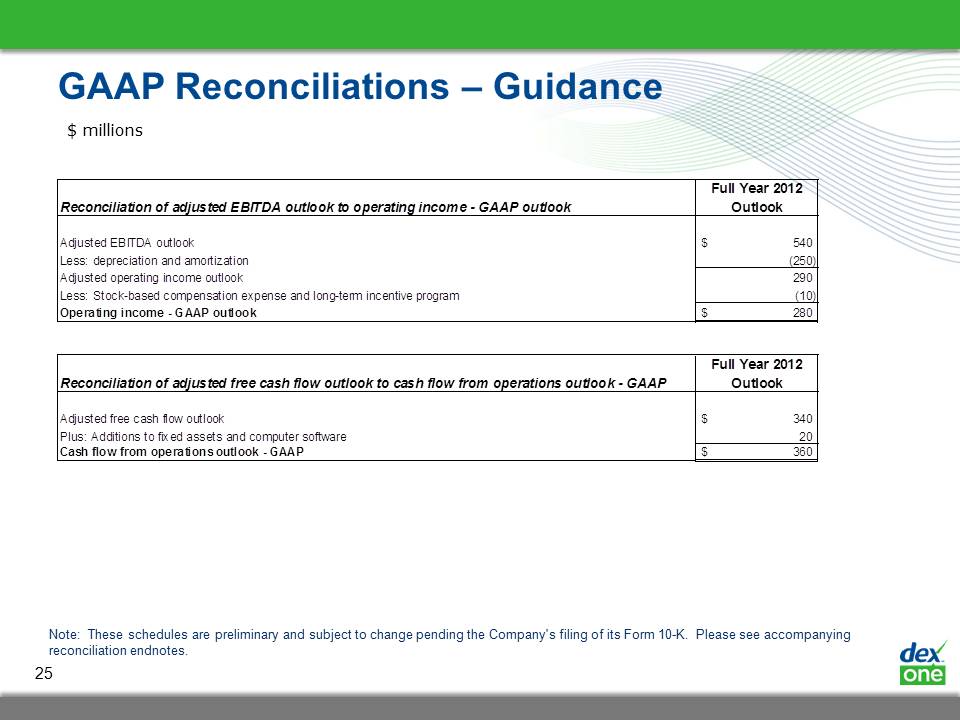
Slide: 25 Title: GAAP Reconciliations – Guidance $ millions Note: These schedules are preliminary and subject to change pending the Company's filing of its Form 10-K. Please see accompanying reconciliation endnotes.
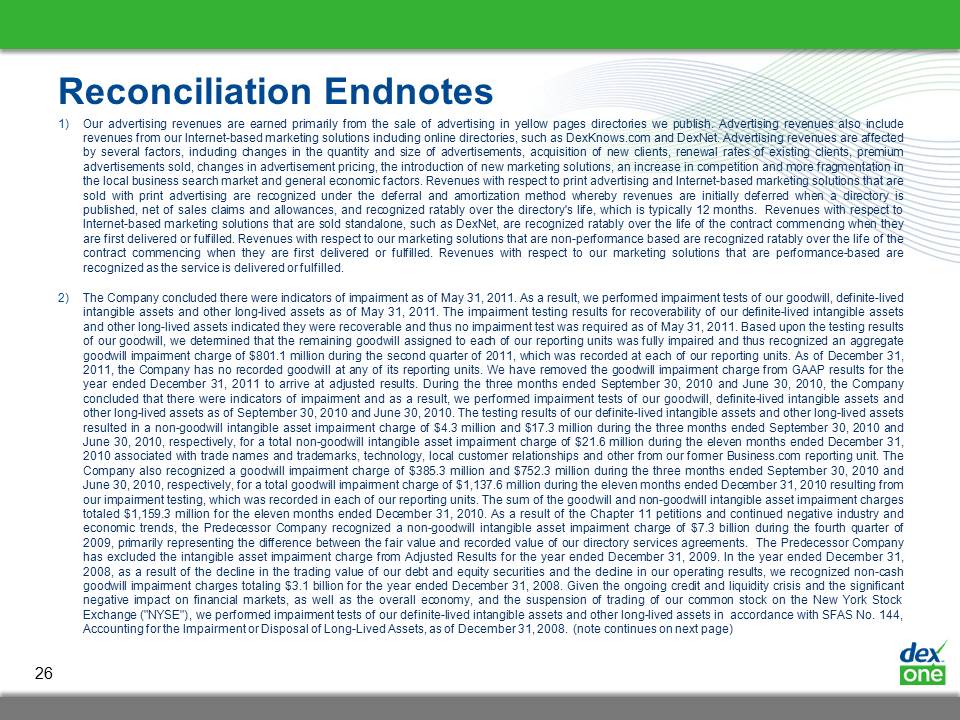
Slide: 26 Title: Reconciliation Endnotes Our advertising revenues are earned primarily from the sale of advertising in yellow pages directories we publish. Advertising revenues also include revenues from our Internet-based marketing solutions including online directories, such as DexKnows.com and DexNet. Advertising revenues are affected by several factors, including changes in the quantity and size of advertisements, acquisition of new clients, renewal rates of existing clients, premium advertisements sold, changes in advertisement pricing, the introduction of new marketing solutions, an increase in competition and more fragmentation in the local business search market and general economic factors. Revenues with respect to print advertising and Internet-based marketing solutions that are sold with print advertising are recognized under the deferral and amortization method whereby revenues are initially deferred when a directory is published, net of sales claims and allowances, and recognized ratably over the directory's life, which is typically 12 months. Revenues with respect to Internet-based marketing solutions that are sold standalone, such as DexNet, are recognized ratably over the life of the contract commencing when they are first delivered or fulfilled. Revenues with respect to our marketing solutions that are non-performance based are recognized ratably over the life of the contract commencing when they are first delivered or fulfilled. Revenues with respect to our marketing solutions that are performance-based are recognized as the service is delivered or fulfilled.The Company concluded there were indicators of impairment as of May 31, 2011. As a result, we performed impairment tests of our goodwill, definite-lived intangible assets and other long-lived assets as of May 31, 2011. The impairment testing results for recoverability of our definite-lived intangible assets and other long-lived assets indicated they were recoverable and thus no impairment test was required as of May 31, 2011. Based upon the testing results of our goodwill, we determined that the remaining goodwill assigned to each of our reporting units was fully impaired and thus recognized an aggregate goodwill impairment charge of $801.1 million during the second quarter of 2011, which was recorded at each of our reporting units. As of December 31, 2011, the Company has no recorded goodwill at any of its reporting units. We have removed the goodwill impairment charge from GAAP results for the year ended December 31, 2011 to arrive at adjusted results. During the three months ended September 30, 2010 and June 30, 2010, the Company concluded that there were indicators of impairment and as a result, we performed impairment tests of our goodwill, definite-lived intangible assets and other long-lived assets as of September 30, 2010 and June 30, 2010. The testing results of our definite-lived intangible assets and other long-lived assets resulted in a non-goodwill intangible asset impairment charge of $4.3 million and $17.3 million during the three months ended September 30, 2010 and June 30, 2010, respectively, for a total non-goodwill intangible asset impairment charge of $21.6 million during the eleven months ended December 31, 2010 associated with trade names and trademarks, technology, local customer relationships and other from our former Business.com reporting unit. The Company also recognized a goodwill impairment charge of $385.3 million and $752.3 million during the three months ended September 30, 2010 and June 30, 2010, respectively, for a total goodwill impairment charge of $1,137.6 million during the eleven months ended December 31, 2010 resulting from our impairment testing, which was recorded in each of our reporting units. The sum of the goodwill and non-goodwill intangible asset impairment charges totaled $1,159.3 million for the eleven months ended December 31, 2010. As a result of the Chapter 11 petitions and continued negative industry and economic trends, the Predecessor Company recognized a non-goodwill intangible asset impairment charge of $7.3 billion during the fourth quarter of 2009, primarily representing the difference between the fair value and recorded value of our directory services agreements. The Predecessor Company has excluded the intangible asset impairment charge from Adjusted Results for the year ended December 31, 2009. In the year ended December 31, 2008, as a result of the decline in the trading value of our debt and equity securities and the decline in our operating results, we recognized non-cash goodwill impairment charges totaling $3.1 billion for the year ended December 31, 2008. Given the ongoing credit and liquidity crisis and the significant negative impact on financial markets, as well as the overall economy, and the suspension of trading of our common stock on the New York Stock Exchange ("NYSE"), we performed impairment tests of our definite-lived intangible assets and other long-lived assets in accordance with SFAS No. 144, Accounting for the Impairment or Disposal of Long-Lived Assets, as of December 31, 2008. (note continues on next page)
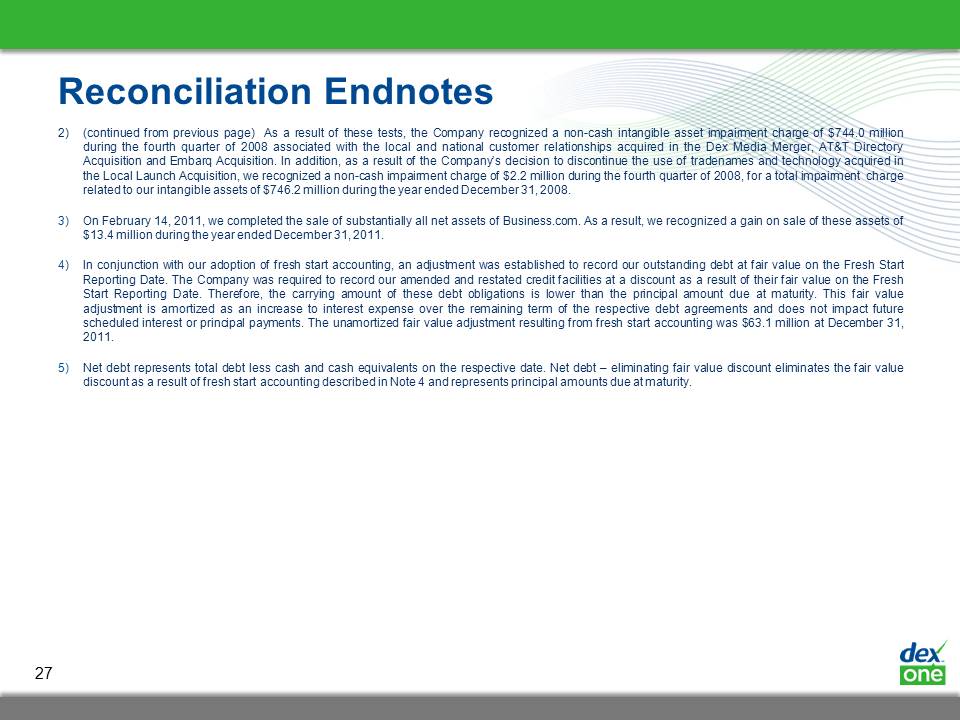
Slide: 27 Title: Reconciliation Endnotes 2) (continued from previous page) As a result of these tests, the Company recognized a non-cash intangible asset impairment charge of $744.0 million during the fourth quarter of 2008 associated with the local and national customer relationships acquired in the Dex Media Merger, AT&T Directory Acquisition and Embarq Acquisition. In addition, as a result of the Company’s decision to discontinue the use of tradenames and technology acquired in the Local Launch Acquisition, we recognized a non-cash impairment charge of $2.2 million during the fourth quarter of 2008, for a total impairment charge related to our intangible assets of $746.2 million during the year ended December 31, 2008. On February 14, 2011, we completed the sale of substantially all net assets of Business.com. As a result, we recognized a gain on sale of these assets of $13.4 million during the year ended December 31, 2011.In conjunction with our adoption of fresh start accounting, an adjustment was established to record our outstanding debt at fair value on the Fresh Start Reporting Date. The Company was required to record our amended and restated credit facilities at a discount as a result of their fair value on the Fresh Start Reporting Date. Therefore, the carrying amount of these debt obligations is lower than the principal amount due at maturity. This fair value adjustment is amortized as an increase to interest expense over the remaining term of the respective debt agreements and does not impact future scheduled interest or principal payments. The unamortized fair value adjustment resulting from fresh start accounting was $63.1 million at December 31, 2011. Net debt represents total debt less cash and cash equivalents on the respective date. Net debt – eliminating fair value discount eliminates the fair value discount as a result of fresh start accounting described in Note 4 and represents principal amounts due at maturity.