Attached files
| file | filename |
|---|---|
| 8-K - 8-K - ACCURIDE CORP | acw11-8kq4.htm |
| EX-99.1 - EX-99.1 - ACCURIDE CORP | acw11-99d1.htm |

Fourth Quarter 2011
Earnings Call
Earnings Call
1

Statements contained in this news release that are not purely historical are forward-
looking statements within the meaning of Section 27A of the Securities Act of 1933,
as amended, and Section 21E of the Securities Exchange Act of 1934, as amended,
including statements regarding Accuride’s expectations, hopes, beliefs and
intentions with respect to future results. Such statements are subject to the impact
on Accuride’s business and prospects generally of, among other factors, market
demand in the commercial vehicle industry, general economic, business and
financing conditions, labor relations, governmental action, competitor pricing activity,
expense volatility and other risks detailed from time to time in Accuride’s Securities
and Exchange Commission filings, including those described in Item 1A of
Accuride’s Annual Report on Form 10-K for the fiscal year ended December 31,
2010. Any forward-looking statement reflects only Accuride’s belief at the time the
statement is made. Although Accuride believes that the expectations reflected in
these forward-looking statements are reasonable, it cannot guarantee its future
results, levels of activity, performance or achievements. Except as required by law,
Accuride undertakes no obligation to update any forward-looking statements to
reflect events or developments after the date of this news release.
Forward Looking Statements
2

Fourth Quarter 2011 Earnings
Ø Opening Comments
• CEO Update
• Industry Highlights
• Plan Execution
Ø Financial Information
• Fourth Quarter Results
• 2012 Outlook
Ø Q&A
Ø Closing Comments
Rick Dauch
President & CEO
Greg Risch
Vice President & CFO
Rick Dauch
Greg Risch
Rick Dauch
3

4

4th Quarter Highlights
• Imperial consolidation results behind schedule 60-90 days
• Aluminum demand remains stronger than installed capacity base
• Weaker seasonal Gunite AM demand
• Accuride-wide scheduling, MRP and IT systems
• Improved liquidity: ABL expansion ($25M); Capital lease ($15M); AP terms ($10M+)
• Gunite operationally stable & pricing activity complete
• Wheels & Gunite CAPEX projects on schedule and on-budget
• Key analytical work in-process:
• Steel wheel capacity consolidation & capability studies (London & Mexico facilities)
• Gunite manufacturing footprint consolidation options (Hubs, Rotors, Spoke Wheels)
• Supply chain cost analysis
5
6

Economic Indicators
Real GDP Growth Rate (Annual)
Labor Market
7
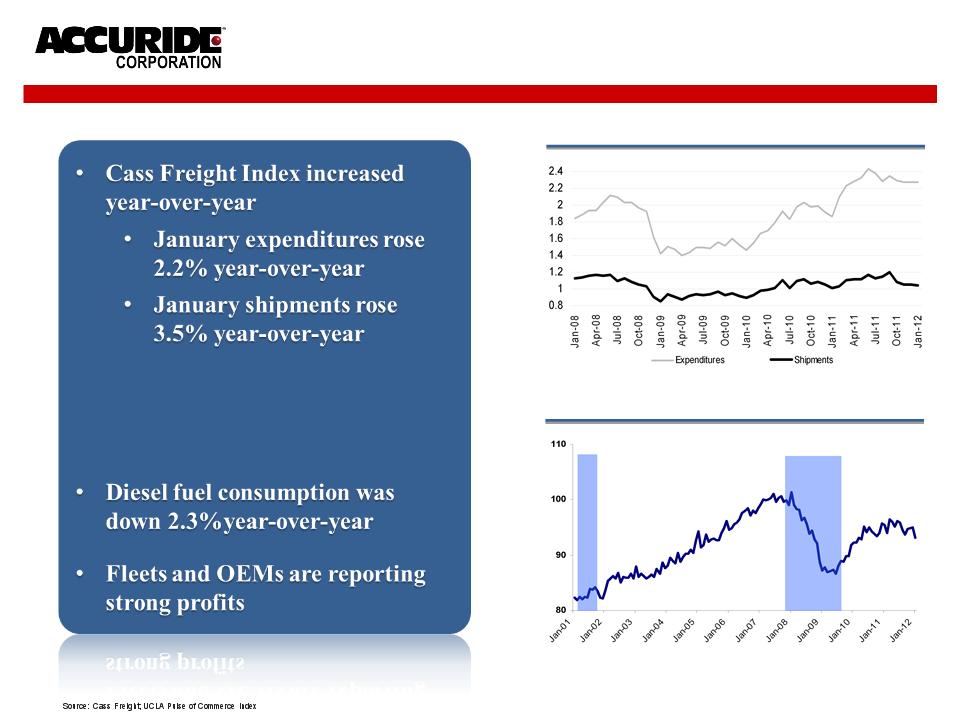
Trucking Indicators
Cass Freight Index
Diesel Fuel Consumption
8
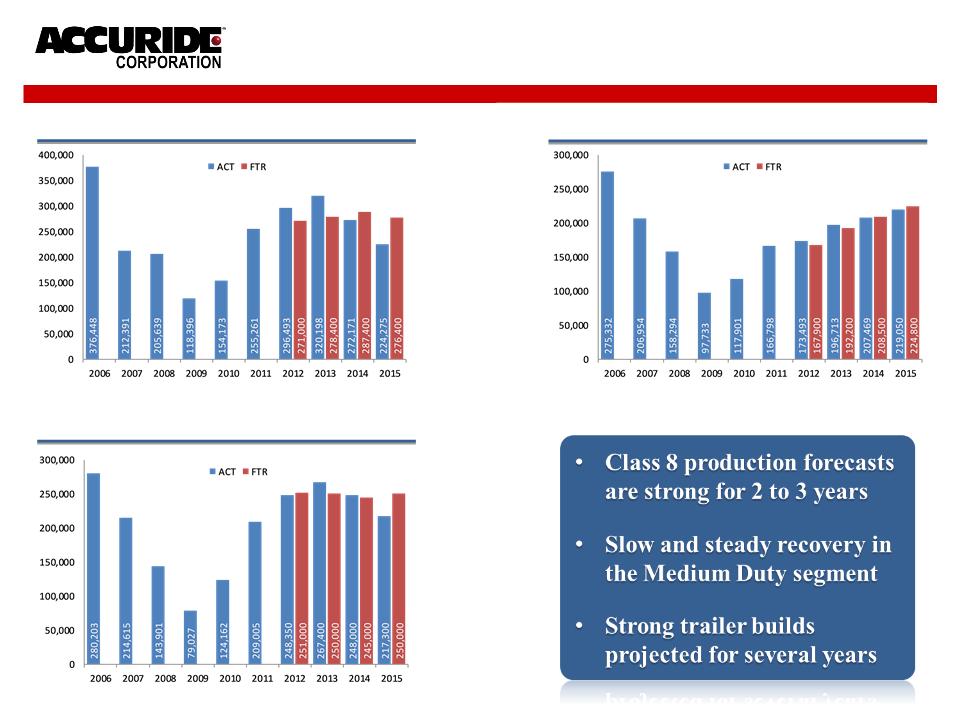
Source: ACT & FTR
Industry Builds
Class 8 Truck Production
Medium Duty Truck Production
Trailer Production
9

10
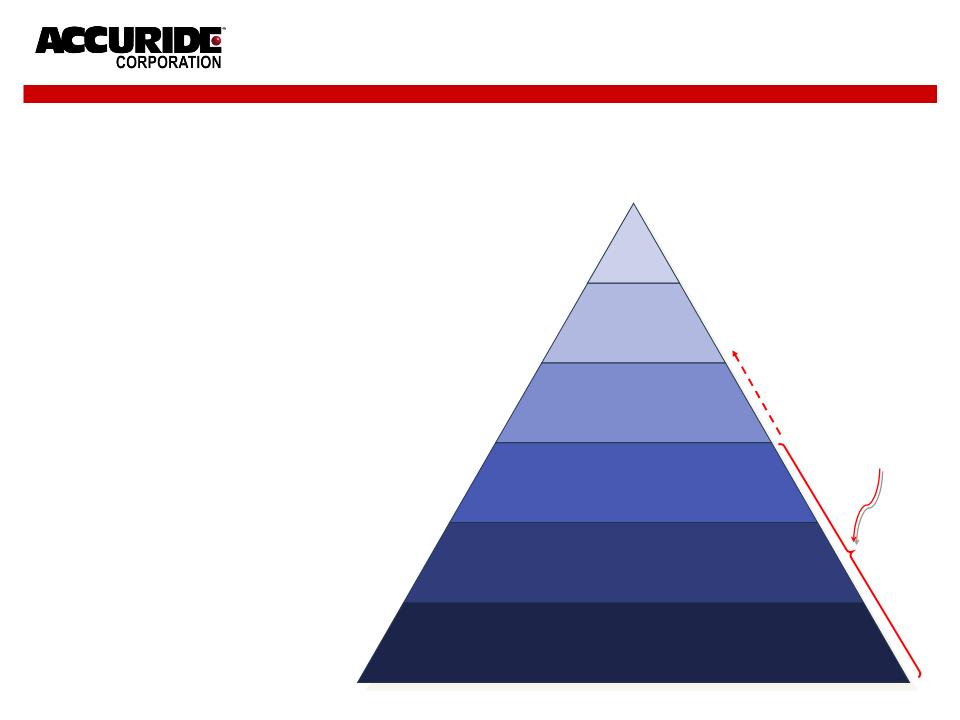
Strategic Objectives
Share
Price
Grow Globally
Create a Competitive
Cost Structure &
LEAN Operating Culture
Divest Non-Core Assets
Fix Core Business & Operations
Customer Centric, Technology Leadership
Ethical People, Selfless Leaders, Team Oriented
Ø #1-2 globally in wheel-end systems
Ø ROIC > 20% through a cycle
Ø >80% of revenue from CORE products
Ø Balanced geographical revenues:
• 40% North America
• 30% Asia
• 20% Europe
• 10% South America
Ø >25% of annual revenues from new &
evolutionary products
evolutionary products
Ø >95% retention of personnel
Ø Maximize ACW share price
Accuride Vision: Accuride will be the premier supplier of wheel-end system
solutions to the global commercial vehicle industry
solutions to the global commercial vehicle industry
Our Focus
11
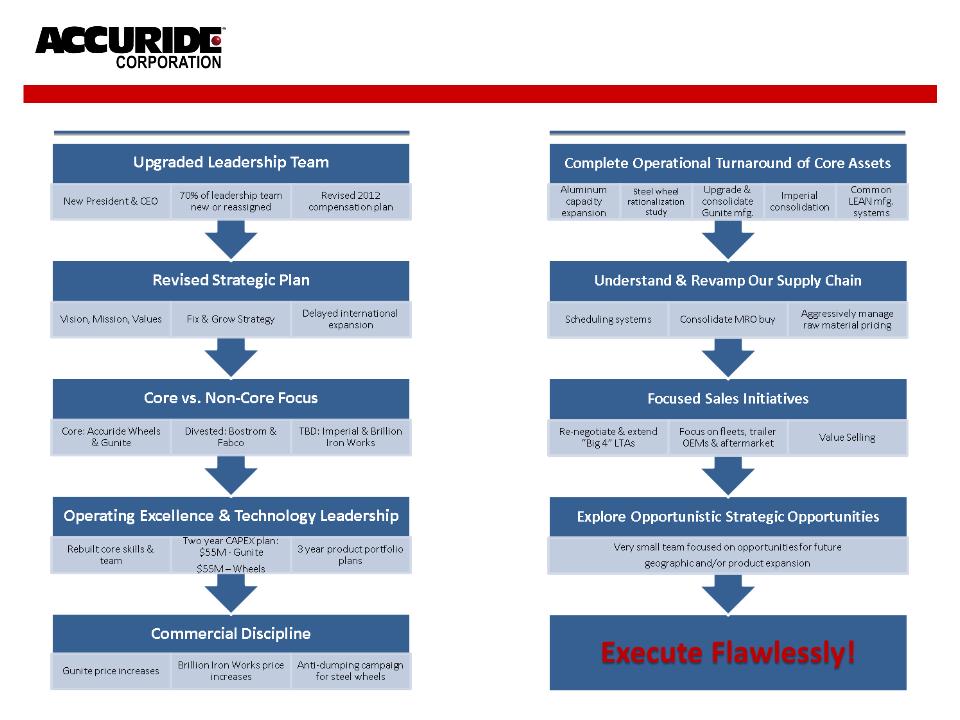
Transformation & Execution
2011 - A Year of Transformation
2012 - A Year of Execution
12

Project Timeline
Q3
Q4
Q1
Q2
Q3
Q4
2011
2012
On Schedule
&
On Budget
13
14
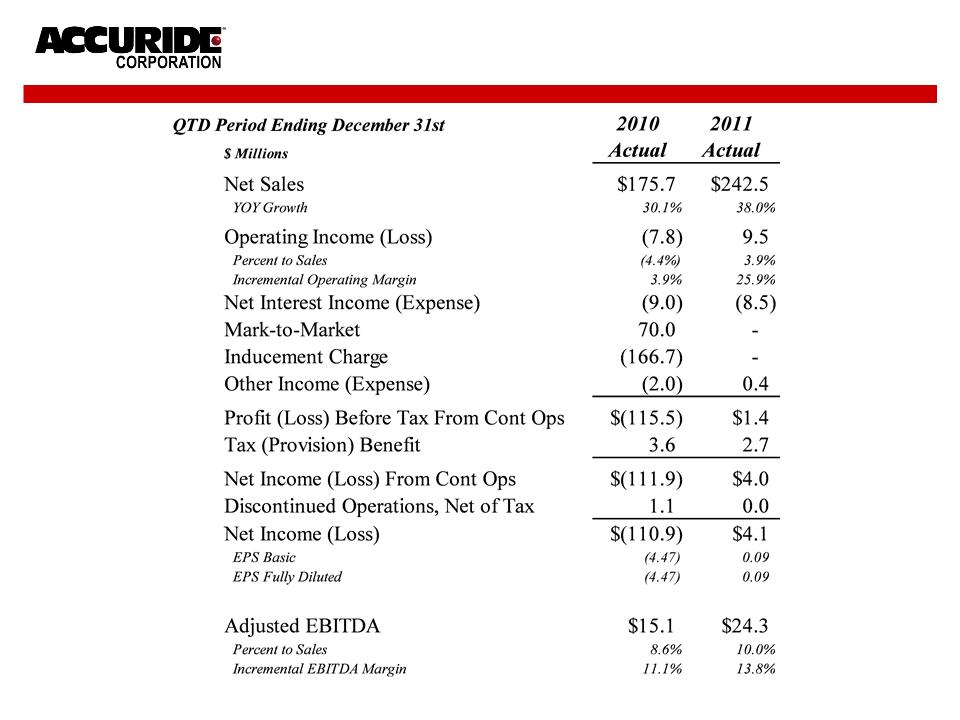
Summary Income Statement
15

Summary Income Statement
16

Consolidated Results
Consolidated Annual Revenue
Consolidated Annual EBITDA (1)
(1) EBITDA before corporate allocations
Consolidated Revenue Breakout
Business Segment
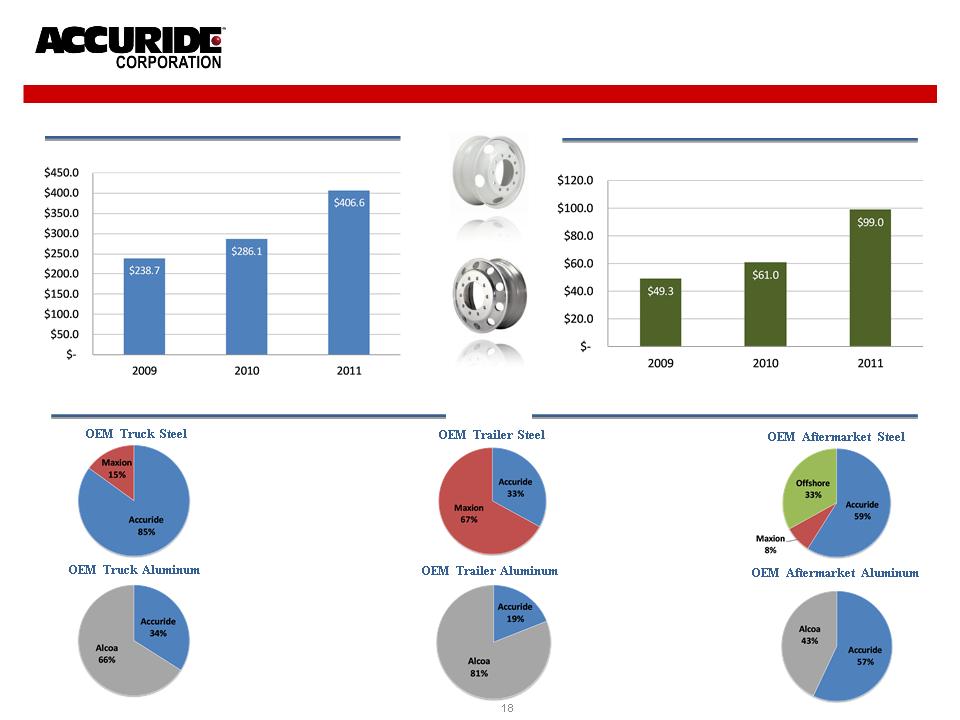
Wheels Segment
Wheel Market Share (2)
Wheels Annual Revenue
Wheels Annual EBITDA (1)
(1) EBITDA before corporate allocations
(2) Based on company estimates

Gunite Segment
Gunite Annual Revenue
Gunite Annual EBITDA (1)
(1) EBITDA before corporate allocations
Cast Drum Market Share (2)
OEM Truck Cast Drum
OEM Trailer Cast Drum
Aftermarket Cast Drum
(2) Based on company estimates
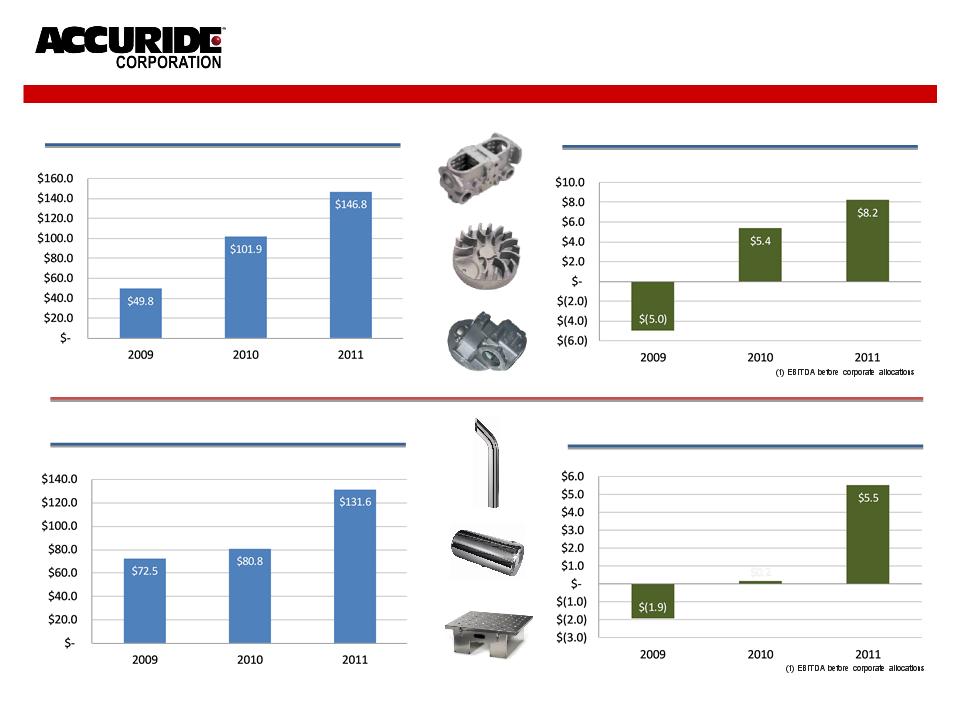
Imperial & Brillion Segments
Brillion Annual Revenue
Brillion Annual EBITDA (1)
Imperial Annual Revenue
Imperial Annual EBITDA (1)
20
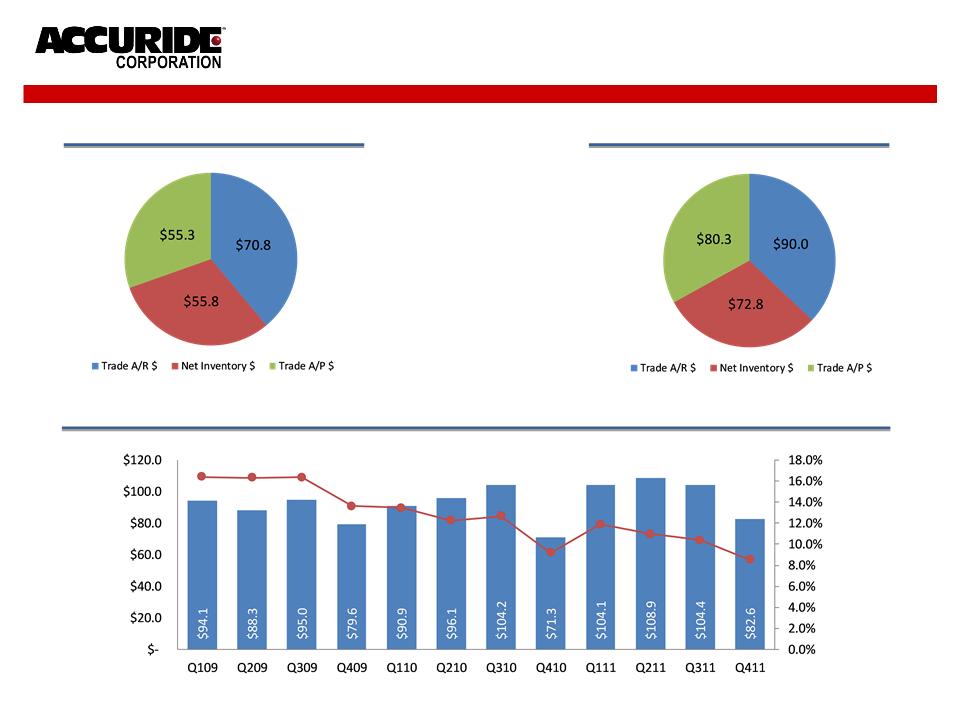
Trade Working Capital
Historical Working Capital Requirements
Q4 2011 Working Capital Breakout
Q4 2010 Working Capital Breakout
21

Free Cash Flow
22
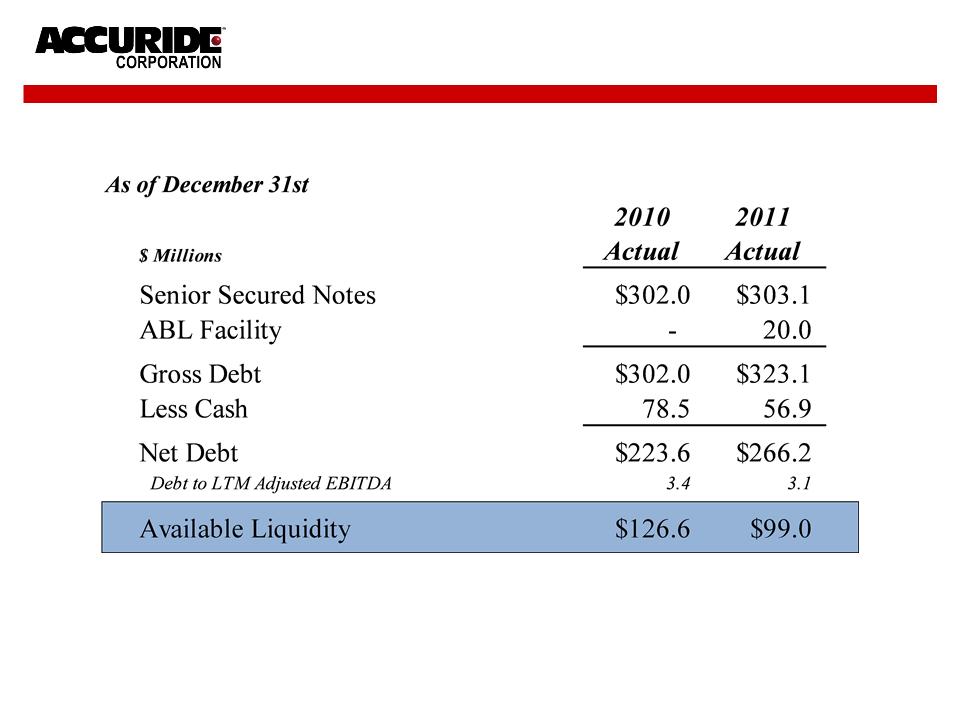
Net Debt & Liquidity
23

24

Full Year Guidance
Class 8 270K to 280K
Class 5-7 165K to 175K
Trailer 230K to 250K
Net Sales $1,000 to $1,025
Adjusted EBITDA $100 to $105
EPS - Diluted $0.07 to $0.15
CAPEX $75
Depreciation & Amortization $55
Cash Interest Expense $31
Excess Pension Contributions $12
Trade Working Capital Source of Cash $13
Free Cash Flow $(5) to $0
25

Summary
• “Fix & Grow” Strategy developed &
being executed
being executed
• “Fix & Grow” Strategy developed &
being executed
being executed
• Experienced leadership team on-
board & performing
board & performing
• Experienced leadership team on-
board & performing
board & performing
• Resources focused on key priorities
• Resources focused on key priorities
• All major initiatives, except Imperial
results, on-schedule and on-budget
results, on-schedule and on-budget
• All major initiatives, except Imperial
results, on-schedule and on-budget
results, on-schedule and on-budget
• Market trends favorable heading into
2012 and beyond
2012 and beyond
• Market trends favorable heading into
2012 and beyond
2012 and beyond
• Adequate liquidity and initiatives to
improve it
improve it
• Adequate liquidity and initiatives to
improve it
improve it
• Strategic opportunities exist to “Fix &
Grow” the company
Grow” the company
• Strategic opportunities exist to “Fix &
Grow” the company
Grow” the company
• We are executing our plan!
• We are executing our plan!
26

27

28

Segment Revenue
29
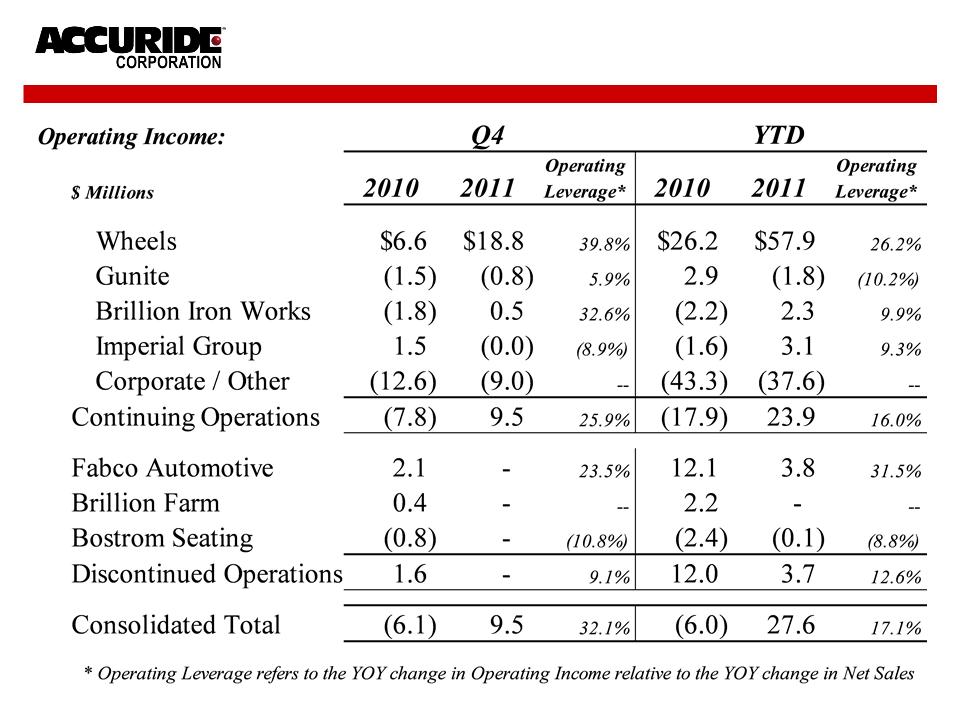
Segment Operating Income
30

Segment Adjusted EBITDA
31

Sales & Adjusted EBITDA
32
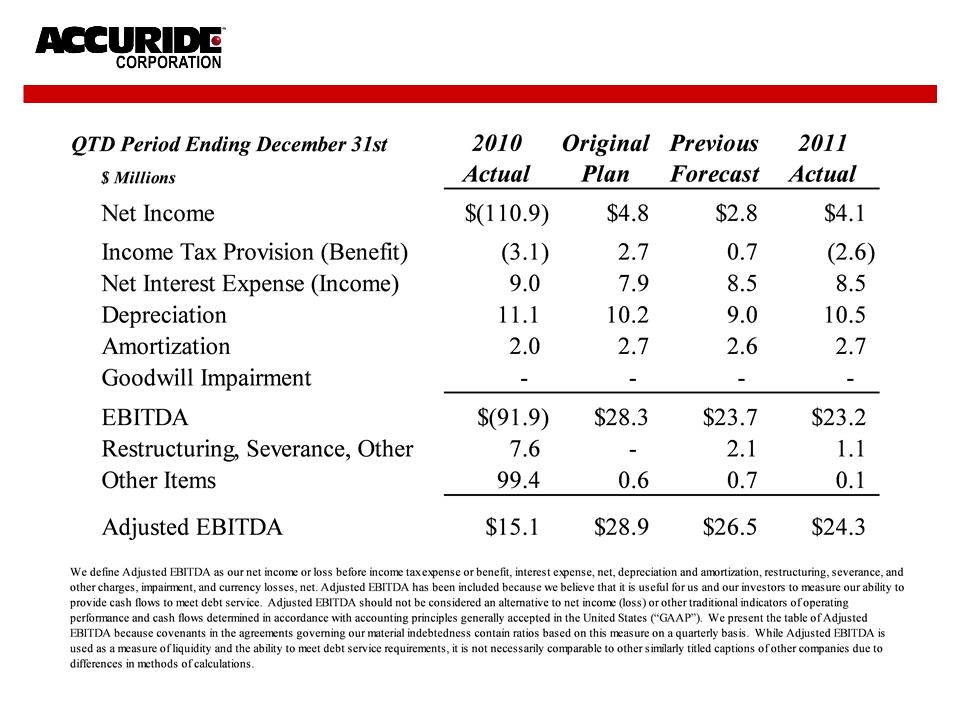
Net Income to EBITDA Reconciliation
33

Trade Working Capital
34
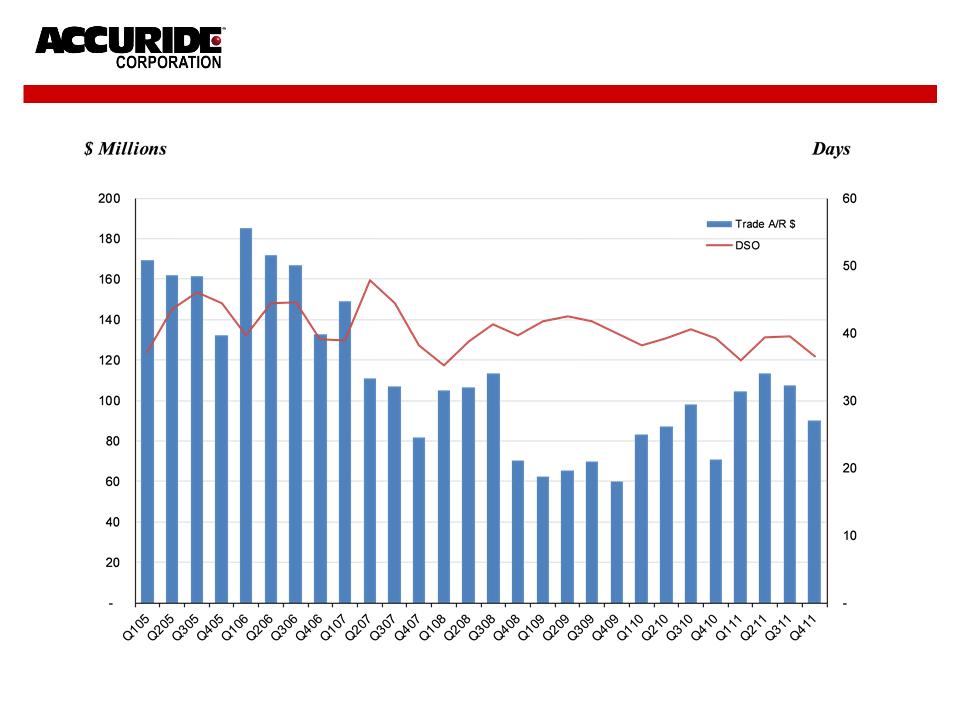
Customer Receivables - Net
35

Inventories - Net
36
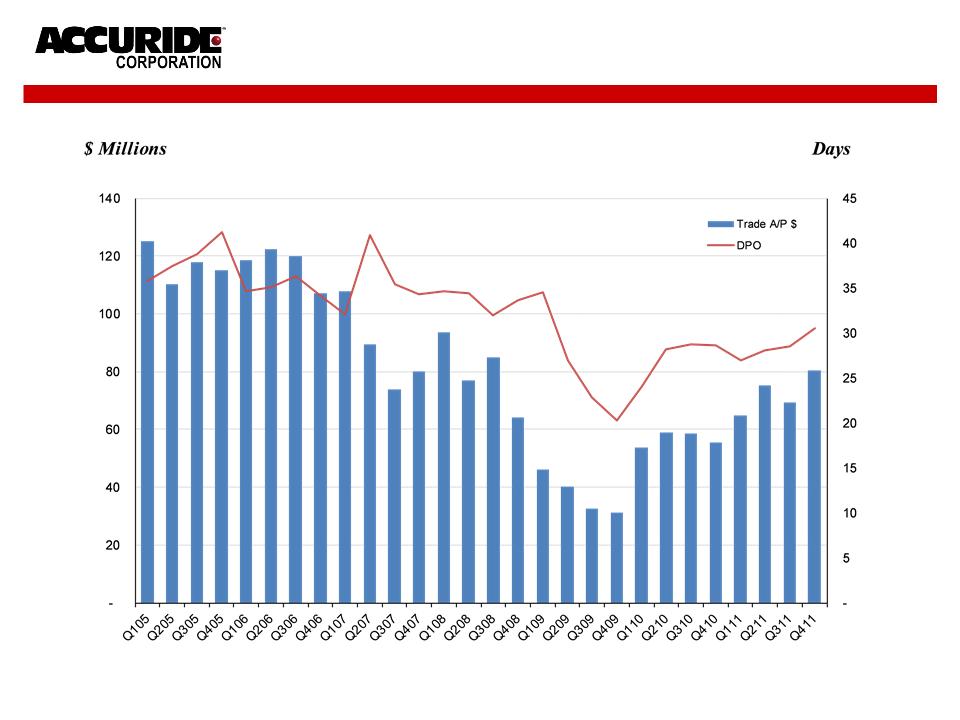
Accounts Payable
37