Attached files
| file | filename |
|---|---|
| 8-K - CURRENT REPORT OF MATERIAL EVENTS OR CORPORATE CHANGES - Helmerich & Payne, Inc. | a12-6084_18k.htm |
Exhibit 99.1
|
|
Helmerich & Payne, Inc. Simmons & Co. International Twelfth Annual Energy Conference March 1-2, 2012 |
|
|
Statements within this presentation are “forward-looking statements” within the meaning of the Securities Act of 1933 and the Securities Exchange Act of 1934, and are based on current expectations and assumptions that are subject to risks and uncertainties. All statements other than statements of historical facts included in this release, including, without limitation, statements regarding the registrant’s future financial position, business strategy, budgets, projected costs and plans and objectives of management for future operations, are forward looking statements. For information regarding risks and uncertainties associated with the Company’s business, please refer to the “Risk Factors” and “Management’s Discussion & Analysis of Financial Condition and Results of Operations” sections of the Company’s SEC filings, including but not limited to, its annual report on Form 10-K and quarterly reports on Form 10-Q. As a result of these factors, Helmerich & Payne, Inc.’s actual results may differ materially from those indicated or implied by such forward-looking statements. We undertake no duty to update or revise our forward-looking statements based on changes in internal estimates, expectations or otherwise, except as required by law. Forward-looking Statements |
|
|
Comments on Today’s Market As natural gas prices remain low in the U.S., the transition towards liquids-rich gas and oil directed drilling continues. Spot pricing remains steady in the U.S. Land market, especially for AC drive rigs. We continue to deliver new FlexRigs at the rate of four per month. Encouraging conversations with customers continue regarding additional new build commitments. Our operational outlook for all three segments corresponding to the second fiscal quarter remains unchanged. |
|
|
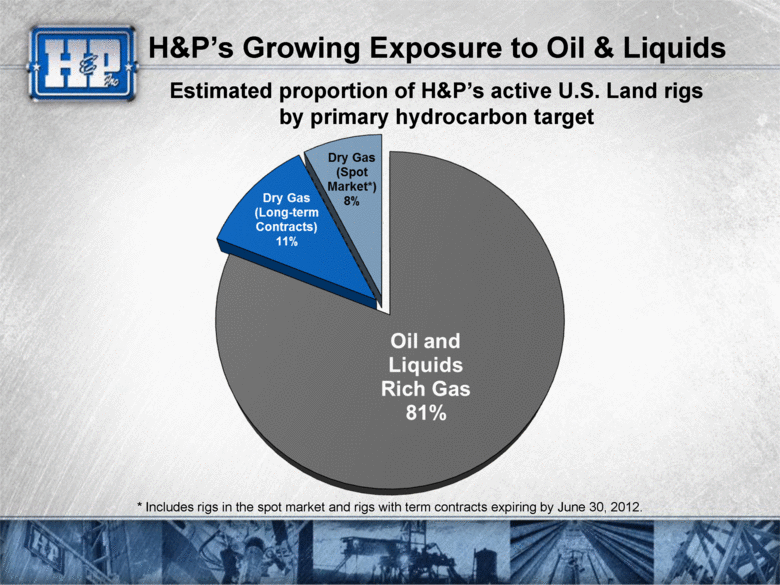
H&P’s Growing Exposure to Oil & Liquids Estimated proportion of H&P’s active U.S. Land rigs by primary hydrocarbon target * Includes rigs in the spot market and rigs with term contracts expiring by June 30, 2012. |
|
|
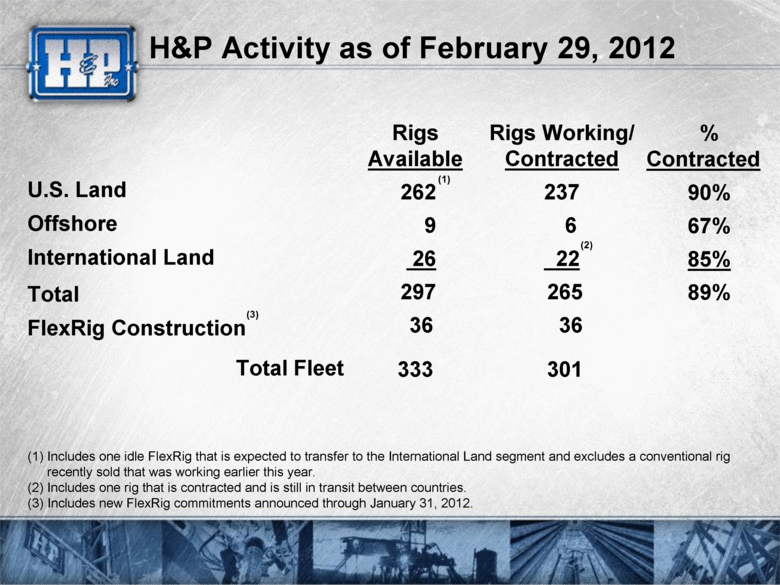
H&P Activity as of February 29, 2012 Rigs Working/ Contracted 237 6 22 265 36 301 Rigs Available 262 9 26 297 36 333 % Contracted 90% 67% 85% 89% U.S. Land Offshore International Land Total FlexRig Construction Total Fleet (3) Includes one idle FlexRig that is expected to transfer to the International Land segment and excludes a conventional rig recently sold that was working earlier this year. Includes one rig that is contracted and is still in transit between countries. (3) Includes new FlexRig commitments announced through January 31, 2012. (1) (2) (1) (2) |
|
|
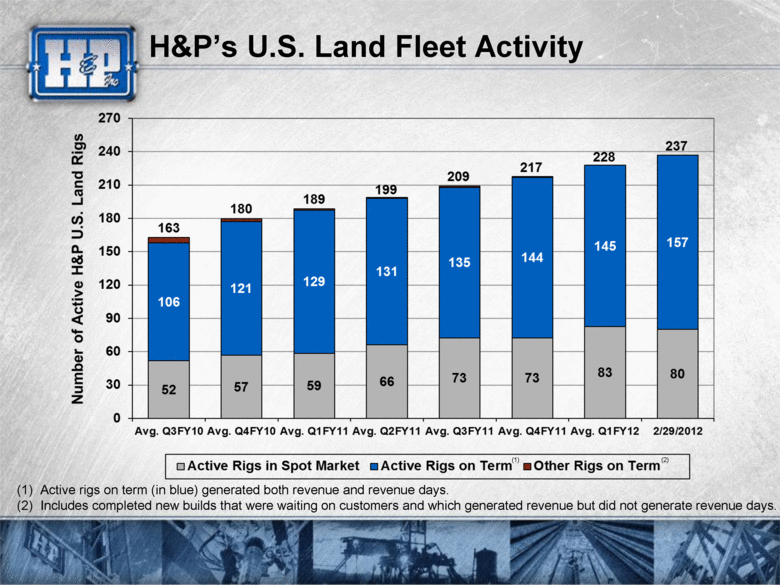
H&P’s U.S. Land Fleet Activity (1) Active rigs on term (in blue) generated both revenue and revenue days. (2) Includes completed new builds that were waiting on customers and which generated revenue but did not generate revenue days. (1) (2) |
|
|
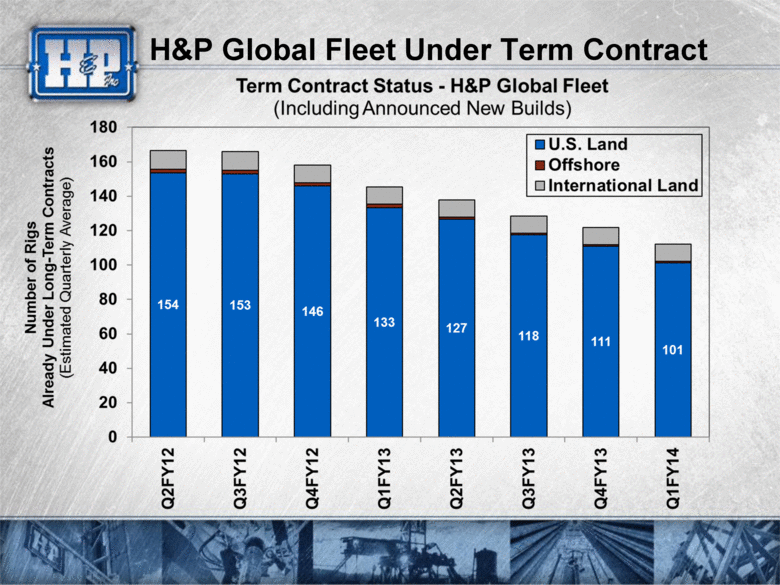
H&P Global Fleet Under Term Contract |
|
|
End of Document |

