Attached files
| file | filename |
|---|---|
| 8-K - FORM 8-K - W. P. Carey Inc. | d306999d8k.htm |
Exhibit 99.1
Filed by W. P. Carey & Co. LLC
Pursuant to Rule 425 under the Securities Act of 1933
and deemed filed pursuant to Rule 14a-12 of the Securities Exchange Act of 1934
Subject Company: W. P. Carey & Co. LLC
(Commission File Number: 001-13779)

W. P. Carey & Co. LLC
Supplemental Operating and Financial Data
As of December 31, 2011

Important Disclosures About this Supplemental Package
As used in this supplemental package, the terms “W. P. Carey,” “WPC LLC,” “the Company,” “we,” “us” and “our” include W. P. Carey & Co. LLC, its consolidated subsidiaries and predecessors, unless otherwise indicated. “GAAP” means generally accepted accounting principles in the United States. “CPA® REITs” means Corporate Property Associates 15 Incorporated (“CPA®:15”), Corporate Property Associates 16 – Global Incorporated (“CPA®:16 – Global”) and Corporate Property Associates 17 – Global Incorporated (“CPA®:17 – Global”). The “REITs” means the CPA® REITs and Carey Watermark Investors Incorporated (“CWI”). Corporate Property Associates 14 Incorporated (“CPA®:14”) was part of the CPA® REITs until its merger with a subsidiary of CPA®:16 – Global on May 2, 2011 (the “CPA®:14/16 Merger”).
Important Note Regarding Non-GAAP Financial Measures
This supplemental package includes non-GAAP financial measures, including earnings before interest, taxes, depreciation and amortization (“EBITDA”), funds from operations—as adjusted (“AFFO”), adjusted cash flow from operating activities and revenue stability analysis. A description of these non-GAAP financial measures and reconciliations to the most directly comparable GAAP measures are provided in this supplemental package.
Cautionary Statement Concerning Forward-Looking Statements:
Certain of the matters discussed in this communication constitute forward-looking statements within the meaning of the Act and the Exchange Act, both as amended by the Private Securities Litigation Reform Act of 1995. The forward-looking statements include, among other things, statements regarding the intent, belief or expectations of W. P. Carey & Co. LLC (“W. P. Carey”) and can be identified by the use of words such as “may,” “will,” “should,” “would,” “assume,” “outlook,” “seek,” “plan,” “believe,” “expect,” “anticipate,” “intend,” “estimate,” “forecast,” and other comparable terms. These forward-looking statements include, but are not limited to, statements regarding the anticipated future financial and operating performance and results, including estimates of growth. These statements are based on the current expectations of the management of W. P Carey. It is important to note that W. P. Carey’s actual results could be materially different from those projected in such forward-looking statements. There are a number of risks and uncertainties that could cause actual results to differ materially from the forward-looking statements. These risks include, but are not limited to, the general economic climate, the supply of and demand for office and industrial properties, interest rate levels, the availability of financing, and other risks associated with the acquisition and ownership of properties, including risks that the tenants will not pay rent, or that costs may be greater than anticipated. Other unknown or unpredictable factors could also have material adverse effects on future results, performance or achievements of the company. Discussions of some of these other important factors and assumptions are contained in W. P. Carey’s filings with the Securities and Exchange Commission (the “SEC”) and are available at the SEC’s website at http://www.sec.gov, including: (a) Item 1A. Risk Factors in our Annual Report on Form 10-K for the year ended December 31, 2010 as filed with the SEC on February 25, 2011 and (b) in the Current Report on Form 8-K filed with the SEC on June 10, 2011. In light of these risks, uncertainties, assumptions and factors, the forward-looking events discussed in this communication may not occur. Readers are cautioned not to place undue reliance on these forward-looking statements, which speak only as of the date of this communication. Except as required under the federal securities laws and the rules and regulations of the SEC, W. P. Carey does not undertake any obligation to release publicly any revisions to the forward-looking statements to reflect events or circumstances after the date of this communication or to reflect the occurrence of unanticipated events.
W. P. CAREY & CO. LLC
Supplemental Unaudited Operating and Financial Data
As of December 31, 2011
| Contents |
Page No. | |||
| Company Overview |
1 | |||
| Financial Highlights |
2 | |||
| Reconciliation of Net Income to EBITDA |
3 | |||
| Reconciliation of Net Income to Funds from Operations — as Adjusted (AFFO) |
4 | |||
| Adjusted Cash Flow from Operating Activities |
6 | |||
| Revenue Stability Analysis |
7 | |||
| Portfolio Debt Overview |
9 | |||
| Detailed Debt Summary |
10 | |||
| 2011 Investment Activity |
11 | |||
| Portfolio Analysis — Rent Contribution and Historical Occupancy |
15 | |||
| Portfolio and Diversification Analysis by Property Type |
16 | |||
| Portfolio and Diversification Analysis by Tenant Industry |
17 | |||
| Portfolio and Diversification Analysis by Geography |
18 | |||
| Portfolio Lease Maturity Analysis |
19 | |||
| Consolidated Balance Sheets |
20 | |||
| Consolidated Statements of Income |
21 | |||
| Consolidated Statements of Cash Flows |
22 | |||
| Detailed Property Summary |
23 | |||
W. P. CAREY & CO. LLC
Company Overview
December 31, 2011
| Key Company Contacts |
Executive Offices | |||
| Trevor P. Bond |
President, Chief Executive Officer and Director | 50 Rockefeller Plaza | ||
| Mark J. DeCesaris |
Managing Director, Chief Financial Officer | New York, NY 10020 | ||
| Thomas E. Zacharias |
Managing Director, Chief Operating Officer | Tel: 1-800-WPCAREY or (212) 492-1100 | ||
| Susan C. Hyde |
Managing Director, Director of Investor Relations | Fax: (212) 492-8922 | ||
| Web Site Address: www.wpcarey.com | ||||
| Banks |
||||
| Bank of America, N.A. |
Administrative and Documentation Agent | |||
| The Bank of New York Mellon |
Syndication Agent | |||
| JPMorgan Chase Bank, N.A. |
Syndication Agent | |||
| PNC Bank, N.A. |
Syndication Agent | |||
| Analyst Coverage |
||||
| Andrew T. DiZio |
Janney Montgomery Scott LLC | |||
| Fourth Quarter | Third Quarter | Second Quarter | First Quarter | Fourth Quarter | ||||||||||||||||
| Stock Data (NYSE: WPC) | 2011 | 2011 | 2011 | 2011 | 2010 | |||||||||||||||
| High Price |
$ | 44.71 | $ | 42.72 | $ | 41.82 | $ | 38.00 | $ | 33.97 | ||||||||||
| Low Price |
34.50 | 32.76 | 34.75 | 29.75 | 28.83 | |||||||||||||||
| Closing Price |
40.94 | 36.43 | 40.50 | 35.70 | 31.29 | |||||||||||||||
| Distributions declared per share — annualized |
$ | 2.25 | $ | 2.24 | $ | 2.20 | $ | 2.05 | $ | 2.04 | ||||||||||
| Distribution yield (annualized distribution / closing stock price) |
5.50 | % | 6.15 | % | 5.43 | % | 5.74 | % | 6.52 | % | ||||||||||
| Shares outstanding at quarter end |
39,729,018 | 39,717,286 | 39,707,156 | 39,614,250 | 39,454,847 | |||||||||||||||
| Market value of outstanding shares at quarter end (in thousands) |
$ | 1,626,506 | $ | 1,446,901 | $ | 1,608,140 | $ | 1,414,229 | $ | 1,234,542 | ||||||||||
W. P. Carey 2011 Supplemental 8-K — 1
W. P. CAREY & CO. LLC
Financial Highlights
(in thousands, except per share amounts)
These financial highlights include non-GAAP financial measures, including EBITDA, AFFO and adjusted cash flow from operating activities. A description of these non-GAAP financial measures and reconciliations to the most directly comparable GAAP measures is provided on the following pages.
| Three Months Ended | Years Ended December 31, | |||||||||||||||||||||||||||||||
| December 31, 2011 | September 30, 2011 | June 30, 2011 (b) | March 31, 2011 | December 31, 2010 | 2011 (b) | 2010 | 2009 | |||||||||||||||||||||||||
| EBITDA (a) |
||||||||||||||||||||||||||||||||
| Investment management |
$ | 10,531 | $ | 21,631 | $ | 58,912 | $ | 21,359 | $ | 27,562 | $ | 112,433 | $ | 69,886 | $ | 56,679 | ||||||||||||||||
| Real estate ownership |
13,098 | 23,017 | 57,673 | 19,513 | 14,172 | 115,908 | 70,603 | 75,174 | ||||||||||||||||||||||||
|
|
|
|
|
|
|
|
|
|
|
|
|
|
|
|
|
|||||||||||||||||
| Total |
$ | 23,629 | $ | 44,648 | $ | 116,585 | $ | 40,872 | $ | 41,734 | $ | 228,341 | $ | 140,489 | $ | 131,853 | ||||||||||||||||
|
|
|
|
|
|
|
|
|
|
|
|
|
|
|
|
|
|||||||||||||||||
| AFFO (a) |
||||||||||||||||||||||||||||||||
| Investment management |
$ | 14,290 | $ | 18,546 | $ | 48,157 | $ | 20,650 | $ | 18,194 | $ | 101,643 | $ | 50,239 | $ | 37,541 | ||||||||||||||||
| Real estate ownership |
20,919 | 23,004 | 24,611 | 18,492 | 18,083 | 87,210 | 80,631 | 85,335 | ||||||||||||||||||||||||
|
|
|
|
|
|
|
|
|
|
|
|
|
|
|
|
|
|||||||||||||||||
| Total |
$ | 35,209 | $ | 41,550 | $ | 72,768 | $ | 39,142 | $ | 36,277 | $ | 188,853 | $ | 130,870 | $ | 122,876 | ||||||||||||||||
|
|
|
|
|
|
|
|
|
|
|
|
|
|
|
|
|
|||||||||||||||||
| EBITDA Per Share (Diluted) (a) |
||||||||||||||||||||||||||||||||
| Investment management |
$ | 0.26 | $ | 0.54 | $ | 1.46 | $ | 0.53 | $ | 0.69 | $ | 2.80 | $ | 1.75 | $ | 1.43 | ||||||||||||||||
| Real estate ownership |
0.33 | 0.57 | 1.44 | 0.49 | 0.35 | 2.89 | 1.76 | 1.89 | ||||||||||||||||||||||||
|
|
|
|
|
|
|
|
|
|
|
|
|
|
|
|
|
|||||||||||||||||
| Total |
$ | 0.59 | $ | 1.11 | $ | 2.90 | $ | 1.02 | $ | 1.04 | $ | 5.69 | $ | 3.51 | $ | 3.32 | ||||||||||||||||
|
|
|
|
|
|
|
|
|
|
|
|
|
|
|
|
|
|||||||||||||||||
| AFFO Per Share (Diluted) (a) |
||||||||||||||||||||||||||||||||
| Investment management |
$ | 0.36 | $ | 0.46 | $ | 1.20 | $ | 0.51 | $ | 0.45 | $ | 2.54 | $ | 1.26 | $ | 0.94 | ||||||||||||||||
| Real estate ownership |
0.52 | 0.57 | 0.61 | 0.46 | 0.45 | 2.17 | 2.01 | 2.15 | ||||||||||||||||||||||||
|
|
|
|
|
|
|
|
|
|
|
|
|
|
|
|
|
|||||||||||||||||
| Total |
$ | 0.88 | $ | 1.03 | $ | 1.81 | $ | 0.97 | $ | 0.90 | $ | 4.71 | $ | 3.27 | $ | 3.09 | ||||||||||||||||
|
|
|
|
|
|
|
|
|
|
|
|
|
|
|
|
|
|||||||||||||||||
| Years Ended December 31, | ||||||||||||||||||||||||||||||||
| 2011 | 2010 | 2009 | ||||||||||||||||||||||||||||||
| Adjusted Cash Flow From Operating Activities |
|
|||||||||||||||||||||||||||||||
| Adjusted cash flow |
|
$ | 98,588 | $ | 88,634 | $ | 93,880 | |||||||||||||||||||||||||
|
|
|
|
|
|
|
|||||||||||||||||||||||||||
| Adjusted cash flow per share (diluted) |
|
$ | 2.46 | $ | 2.22 | $ | 2.36 | |||||||||||||||||||||||||
|
|
|
|
|
|
|
|||||||||||||||||||||||||||
| Distributions declared per share |
|
$ | 2.185 | $ | 2.028 | $ | 1.996 | |||||||||||||||||||||||||
|
|
|
|
|
|
|
|||||||||||||||||||||||||||
| Payout ratio (distributions per share/adjusted cash flow per share) |
|
89 | % | 91 | % | 85 | % | |||||||||||||||||||||||||
|
|
|
|
|
|
|
|||||||||||||||||||||||||||
| (a) | Effective January 1, 2011, we include our equity investments in the REITs in our real estate ownership segment. The equity income (loss) from the REITs that is now included in our real estate ownership segment represents our proportionate share of the revenue less expenses of the properties held by the REITs. This treatment is consistent with that of our directly-owned properties. Results for the three months ended December 31, 2010 as well as the years ended December 31, 2010 and 2009 have been adjusted to reflect this reclassification. |
| (b) | Results for the three months ended June 30, 2011 and the year ended December 31, 2011 include the impact of the CPA®14/16 Merger in May 2011. |
W. P. Carey 2011 Supplemental 8-K — 2
W. P. CAREY & CO. LLC
Reconciliation of Net Income to EBITDA
(in thousands, except share and per share amounts)
| Three Months Ended | Years Ended December 31, | |||||||||||||||||||||||||||||||
| December 31, 2011 | September 30, 2011 | June 30, 2011 (b) | March 31, 2011 | December 31, 2010 | 2011 (b) | 2010 | 2009 | |||||||||||||||||||||||||
| Investment Management |
||||||||||||||||||||||||||||||||
| Net income from investment management attributable to W.P. Carey members (a) |
$ | 13,095 | $ | 15,737 | $ | 31,989 | $ | 13,177 | $ | 15,731 | $ | 73,998 | $ | 41,573 | $ | 31,059 | ||||||||||||||||
| Adjustments: |
||||||||||||||||||||||||||||||||
| Provision for income taxes |
(3,540 | ) | 5,075 | 26,056 | 7,380 | 10,668 | 34,971 | 23,661 | 21,813 | |||||||||||||||||||||||
| Depreciation and amortization |
976 | 819 | 867 | 802 | 1,163 | 3,464 | 4,652 | 3,807 | ||||||||||||||||||||||||
|
|
|
|
|
|
|
|
|
|
|
|
|
|
|
|
|
|||||||||||||||||
| EBITDA — investment management |
$ | 10,531 | $ | 21,631 | $ | 58,912 | $ | 21,359 | $ | 27,562 | $ | 112,433 | $ | 69,886 | $ | 56,679 | ||||||||||||||||
|
|
|
|
|
|
|
|
|
|
|
|
|
|
|
|
|
|||||||||||||||||
| EBITDA per share (diluted) |
$ | 0.26 | $ | 0.54 | $ | 1.46 | $ | 0.53 | $ | 0.69 | $ | 2.80 | $ | 1.75 | $ | 1.43 | ||||||||||||||||
|
|
|
|
|
|
|
|
|
|
|
|
|
|
|
|
|
|||||||||||||||||
| Real Estate Ownership |
||||||||||||||||||||||||||||||||
| Net (loss) income from real estate ownership attributable to W. P. Carey members (a) |
$ | (4,004 | ) | $ | 9,465 | $ | 47,123 | $ | 10,166 | $ | 4,050 | $ | 65,081 | $ | 32,399 | $ | 37,964 | |||||||||||||||
| Adjustments: |
||||||||||||||||||||||||||||||||
| Interest expense |
6,260 | 5,989 | 5,396 | 4,440 | 4,334 | 21,920 | 15,725 | 14,462 | ||||||||||||||||||||||||
| Provision for income taxes |
2,227 | 856 | (1,296 | ) | 194 | 914 | 2,257 | 2,161 | 980 | |||||||||||||||||||||||
| Depreciation and amortization |
8,416 | 6,361 | 6,438 | 4,648 | 4,210 | 25,054 | 17,952 | 17,072 | ||||||||||||||||||||||||
| Reconciling items attributable to discontinued operations |
199 | 346 | 12 | 65 | 664 | 1,596 | 2,366 | 4,696 | ||||||||||||||||||||||||
|
|
|
|
|
|
|
|
|
|
|
|
|
|
|
|
|
|||||||||||||||||
| EBITDA — real estate ownership |
$ | 13,098 | $ | 23,017 | $ | 57,673 | $ | 19,513 | $ | 14,172 | $ | 115,908 | $ | 70,603 | $ | 75,174 | ||||||||||||||||
|
|
|
|
|
|
|
|
|
|
|
|
|
|
|
|
|
|||||||||||||||||
| EBITDA per share (diluted) |
$ | 0.33 | $ | 0.57 | $ | 1.44 | $ | 0.49 | $ | 0.35 | $ | 2.89 | $ | 1.76 | $ | 1.89 | ||||||||||||||||
|
|
|
|
|
|
|
|
|
|
|
|
|
|
|
|
|
|||||||||||||||||
| Total Company |
||||||||||||||||||||||||||||||||
| EBITDA |
$ | 23,629 | $ | 44,648 | $ | 116,585 | $ | 40,872 | $ | 41,734 | $ | 228,341 | $ | 140,489 | $ | 131,853 | ||||||||||||||||
|
|
|
|
|
|
|
|
|
|
|
|
|
|
|
|
|
|||||||||||||||||
| EBITDA per share (diluted) |
$ | 0.59 | $ | 1.11 | $ | 2.90 | $ | 1.02 | $ | 1.04 | $ | 5.69 | $ | 3.51 | $ | 3.32 | ||||||||||||||||
|
|
|
|
|
|
|
|
|
|
|
|
|
|
|
|
|
|||||||||||||||||
| Diluted weighted average shares outstanding |
40,152,444 | 40,404,520 | 40,243,548 | 40,242,706 | 40,104,715 | 40,098,095 | 40,007,894 | 39,712,735 | ||||||||||||||||||||||||
|
|
|
|
|
|
|
|
|
|
|
|
|
|
|
|
|
|||||||||||||||||
| (a) | Effective January 1, 2011, we include our equity investments in the REITs in our real estate ownership segment. The equity income (loss) from the REITs that is now included in our real estate ownership segment represents our proportionate share of the revenue less expenses of the properties held by the REITs. This treatment is consistent with that of our directly-owned properties. Results for the three months ended December 31, 2010 as well as the years ended December 31, 2010 and 2009 have been adjusted to reflect this reclassification. |
| (b) | Results for the three months ended June 30, 2011 and the year ended December 31, 2011 include the impact of the CPA®14/16 Merger in May 2011. |
Non-GAAP Financial Disclosure
EBITDA as disclosed represents earnings before interest, taxes, depreciation and amortization. We believe that EBITDA is a useful supplemental measure to investors and analysts for assessing the performance of our business segments, although it does not represent net income that is computed in accordance with GAAP, because it removes the impact of our capital structure and asset base from our operating results and because it is helpful when comparing our operating performance to that of companies in our industry without regard to such items, which can vary substantially from company to company. Accordingly, EBITDA should not be considered as an alternative to net income as an indicator of our financial performance. EBITDA may not be comparable to similarly titled measures of other companies. Therefore, we use EBITDA as one measure of our operating performance when we formulate corporate goals, evaluate the effectiveness of our strategies and determine executive compensation.
W. P. Carey 2011 Supplemental 8-K — 3
W. P. CAREY & CO. LLC
Reconciliation of Net Income to Funds from Operations – as Adjusted (AFFO)
(in thousands, except share and per share amounts)
| Three Months Ended | Years Ended December 31, | |||||||||||||||||||||||||||||||
| December 31, 2011 | September 30, 2011 | June 30, 2011 (d) | March 31, 2011 | December 31, 2010 | 2011 (d) | 2010 | 2009 | |||||||||||||||||||||||||
| Investment Management |
||||||||||||||||||||||||||||||||
| Net Income from investment management attributable to W. P. Carey members (a) |
$ | 13,095 | $ | 15,737 | $ | 31,989 | $ | 13,177 | $ | 15,731 | $ | 73,998 | $ | 41,573 | $ | 31,059 | ||||||||||||||||
|
|
|
|
|
|
|
|
|
|
|
|
|
|
|
|
|
|||||||||||||||||
| FFO — as defined by NAREIT (b) |
13,095 | 15,737 | 31,989 | 13,177 | 15,731 | 73,998 | 41,573 | 31,059 | ||||||||||||||||||||||||
|
|
|
|
|
|
|
|
|
|
|
|
|
|
|
|
|
|||||||||||||||||
| Adjustments: |
||||||||||||||||||||||||||||||||
| Amortization and other non-cash charges |
3,297 | 4,953 | 17,583 | 7,473 | 2,463 | 33,306 | 8,666 | 6,482 | ||||||||||||||||||||||||
| Proportionate share of adjustments to equity in net income of partially owned entities to arrive at AFFO: |
||||||||||||||||||||||||||||||||
| AFFO adjustments to equity earnings from equity investments |
(2,102 | ) | (2,144 | ) | (1,415 | ) | — | — | (5,661 | ) | — | — | ||||||||||||||||||||
|
|
|
|
|
|
|
|
|
|
|
|
|
|
|
|
|
|||||||||||||||||
| Total adjustments |
1,195 | 2,809 | 16,168 | 7,473 | 2,463 | 27,645 | 8,666 | 6,482 | ||||||||||||||||||||||||
|
|
|
|
|
|
|
|
|
|
|
|
|
|
|
|
|
|||||||||||||||||
| AFFO — Investment Management |
$ | 14,290 | $ | 18,546 | $ | 48,157 | $ | 20,650 | $ | 18,194 | $ | 101,643 | $ | 50,239 | $ | 37,541 | ||||||||||||||||
|
|
|
|
|
|
|
|
|
|
|
|
|
|
|
|
|
|||||||||||||||||
| Real Estate Ownership |
||||||||||||||||||||||||||||||||
| Net Income from real estate ownership attributable to W. P. Carey members (a) |
$ | (4,004 | ) | $ | 9,465 | $ | 47,123 | $ | 10,166 | $ | 4,050 | $ | 65,081 | $ | 32,399 | $ | 37,964 | |||||||||||||||
| Adjustments: |
||||||||||||||||||||||||||||||||
| Depreciation and amortization of real property |
8,415 | 6,194 | 6,240 | 4,475 | 4,565 | 25,324 | 19,022 | 18,948 | ||||||||||||||||||||||||
| Impairment charges |
5,498 | 4,934 | 41 | — | 6,763 | 10,473 | 15,381 | 10,424 | ||||||||||||||||||||||||
| Loss (gain) on sale of real estate, net |
3,655 | 396 | 121 | (781 | ) | — | 3,391 | (460 | ) | (7,701 | ) | |||||||||||||||||||||
| Proportionate share of adjustments to to equity in net income of partially owned entities to arrive at FFO: |
||||||||||||||||||||||||||||||||
| Depreciation and amortization of real property |
1,208 | 1,173 | 1,328 | 1,548 | 1,550 | 5,257 | 6,477 | 10,598 | ||||||||||||||||||||||||
| Impairment charges |
— | — | — | 1,090 | — | 1,090 | 1,394 | — | ||||||||||||||||||||||||
| Loss (gain) on sale of real estate, net |
— | — | 34 | — | — | 34 | (38 | ) | — | |||||||||||||||||||||||
| Proportionate share of adjustments for noncontrolling interests to arrive at FFO |
(508 | ) | (1,157 | ) | (123 | ) | (196 | ) | (195 | ) | (1,984 | ) | (727 | ) | (586 | ) | ||||||||||||||||
|
|
|
|
|
|
|
|
|
|
|
|
|
|
|
|
|
|||||||||||||||||
| Total adjustments |
18,268 | 11,540 | 7,641 | 6,136 | 12,683 | 43,585 | 41,049 | 31,683 | ||||||||||||||||||||||||
|
|
|
|
|
|
|
|
|
|
|
|
|
|
|
|
|
|||||||||||||||||
| FFO — as defined by NAREIT (b) |
14,264 | 21,005 | 54,764 | 16,302 | 16,733 | 108,666 | 73,448 | 69,647 | ||||||||||||||||||||||||
|
|
|
|
|
|
|
|
|
|
|
|
|
|
|
|
|
|||||||||||||||||
| Adjustments: |
||||||||||||||||||||||||||||||||
| Gain on change in control of interests (c) |
— | — | (27,859 | ) | — | — | (27,859 | ) | — | — | ||||||||||||||||||||||
| Gain on deconsolidation of a subsidiary |
— | (1,008 | ) | — | — | — | (1,008 | ) | — | — | ||||||||||||||||||||||
| Other gains, net |
(1,118 | ) | 135 | — | — | (755 | ) | (983 | ) | (755 | ) | (2,796 | ) | |||||||||||||||||||
| Other depreciation, amortization and non-cash charges |
853 | 168 | (2,443 | ) | (635 | ) | (14 | ) | (1,780 | ) | (934 | ) | (4,122 | ) | ||||||||||||||||||
W. P. Carey 2011 Supplemental 8-K — 4
| Three Months Ended | Years Ended December 31, | |||||||||||||||||||||||||||||||
| December 31, 2011 | September 30, 2011 | June 30, 2011 (d) | March 31, 2011 | December 31, 2010 | 2011 (d) | 2010 | 2009 | |||||||||||||||||||||||||
| Straight-line and other rent adjustments |
(1,804 | ) | (1,014 | ) | (1,020 | ) | (417 | ) | 128 | (4,255 | ) | 295 | 1,273 | |||||||||||||||||||
| Proportionate share of adjustments to equity in net income of partially owned entities to arrive at AFFO: |
||||||||||||||||||||||||||||||||
| Other depreciation, amortization and other non-cash charges |
— | — | — | — | — | — | 25 | 24 | ||||||||||||||||||||||||
| Straight-line and other rent adjustments |
(414 | ) | (463 | ) | (142 | ) | (622 | ) | (532 | ) | (1,641 | ) | (2,260 | ) | (1,371 | ) | ||||||||||||||||
| AFFO adjustments to equity earnings from equity investments |
9,084 | 4,122 | 1,238 | 3,778 | 2,485 | 15,798 | 10,696 | 22,675 | ||||||||||||||||||||||||
| Proportionate share of adjustments for noncontrolling interests to arrive at AFFO |
54 | 59 | 73 | 86 | 38 | 272 | 116 | 5 | ||||||||||||||||||||||||
|
|
|
|
|
|
|
|
|
|
|
|
|
|
|
|
|
|||||||||||||||||
| Total adjustments |
6,655 | 1,999 | (30,153 | ) | 2,190 | 1,350 | (21,456 | ) | 7,183 | 15,688 | ||||||||||||||||||||||
|
|
|
|
|
|
|
|
|
|
|
|
|
|
|
|
|
|||||||||||||||||
| AFFO — Real Estate Ownership |
$ | 20,919 | 23,004 | 24,611 | 18,492 | 18,083 | 87,210 | 80,631 | 85,335 | |||||||||||||||||||||||
|
|
|
|
|
|
|
|
|
|
|
|
|
|
|
|
|
|||||||||||||||||
| Total Company |
||||||||||||||||||||||||||||||||
| FFO — as defined by NAREIT |
$ | 27,359 | $ | 36,742 | $ | 86,753 | $ | 29,479 | $ | 32,464 | $ | 182,664 | $ | 115,021 | $ | 100,706 | ||||||||||||||||
|
|
|
|
|
|
|
|
|
|
|
|
|
|
|
|
|
|||||||||||||||||
| FFO — as defined by NAREIT (diluted) |
$ | 0.68 | $ | 0.91 | $ | 2.16 | $ | 0.73 | $ | 0.81 | $ | 4.56 | $ | 2.87 | $ | 2.54 | ||||||||||||||||
|
|
|
|
|
|
|
|
|
|
|
|
|
|
|
|
|
|||||||||||||||||
| AFFO |
$ | 35,209 | $ | 41,550 | $ | 72,768 | $ | 39,142 | $ | 36,277 | $ | 188,853 | $ | 130,870 | $ | 122,876 | ||||||||||||||||
|
|
|
|
|
|
|
|
|
|
|
|
|
|
|
|
|
|||||||||||||||||
| AFFO per share (diluted) |
$ | 0.88 | $ | 1.03 | $ | 1.81 | $ | 0.97 | $ | 0.90 | $ | 4.71 | $ | 3.27 | $ | 3.09 | ||||||||||||||||
|
|
|
|
|
|
|
|
|
|
|
|
|
|
|
|
|
|||||||||||||||||
| Diluted weighted average shares outstanding |
40,152,444 | 40,404,520 | 40,243,548 | 40,242,706 | 40,104,715 | 40,098,095 | 40,007,894 | 39,712,735 | ||||||||||||||||||||||||
|
|
|
|
|
|
|
|
|
|
|
|
|
|
|
|
|
|||||||||||||||||
| (a) | Effective January 1, 2011, we include our equity investments in the REITs in our real estate ownership segment. The equity income (loss) from the REITs that is now included in our real estate ownership segment represents our proportionate share of the revenue less expenses of the properties held by the REITs. This treatment is consistent with that of our directly-owned properties. Results for the three months ended December 31, 2010 as well as the years ended December 31, 2010 and 2009 have been adjusted to reflect this reclassification. |
| (b) | The SEC Staff has recently advised that they take no position on the inclusion or exclusion of impairment write-downs in arriving at Funds from Operations (“FFO”). Since 2003, the National Association of Real Estate Investment Trusts (“NAREIT”) has taken the position that the exclusion of impairment charges is consistent with its definition of FFO. Accordingly, we have revised our computation of FFO to exclude impairment charges, if any, in arriving at FFO for all periods presented. |
| (c) | Represents gain recognized on purchase of the remaining interests in two ventures from CPA®:14, which we had previously accounted for under the equity method. In connection with purchasing these properties, we recognized a net gain of $27.9 million during the year ended December 31, 2011 to adjust the carrying value of our existing interests in these ventures to their estimated fair values. |
| (d) | Results for the three months ended June 30, 2011 and the year ended December 31, 2011 include the impact of the CPA®14/16 Merger in May 2011. |
Non-GAAP Financial Disclosure
FFO is a non-GAAP measure defined by NAREIT. NAREIT defines FFO as net income or loss (as computed in accordance with GAAP) excluding: depreciation and amortization expense from real estate assets, impairment charges on real estate, gains or losses from sales of depreciated real estate assets and extraordinary items; however, FFO related to assets held for sale, sold or otherwise transferred and included in the results of discontinued operations are included. These adjustments also incorporate the pro rata share of unconsolidated subsidiaries. FFO is used by management, investors and analysts to facilitate meaningful comparisons of operating performance between periods and among our peers. Although NAREIT has published this definition of FFO, companies often modify this definition as they seek to provide financial measures that meaningfully reflect their distinctive operations.
We modify the NAREIT computation of FFO to include other adjustments to GAAP net income to adjust for certain non-cash charges such as amortization of intangibles, deferred income tax benefits and expenses, straight-line rents, stock compensation, gains or losses from extinguishment of debt and deconsolidation of subsidiaries and unrealized foreign currency exchange gains and losses. We refer to our modified definition of FFO as AFFO. We exclude these items from GAAP net income as they are not the primary drivers in our decision making process. Our assessment of our operations is focused on long-term sustainability and not on such non-cash items, which may cause short-term fluctuations in net income but have no impact on cash flows, and we therefore use AFFO as one measure of our operating performance when we formulate corporate goals, evaluate the effectiveness of our strategies, and determine executive compensation. We believe that AFFO is a useful supplemental measure for investors to consider because it will help them to better assess the sustainability of our operating performance without the potentially distorting impact of these short-term fluctuations. However, there are limits on the usefulness of AFFO to investors. For example, impairment charges and unrealized foreign currency losses that we exclude may become actual realized losses upon the ultimate disposition of the properties in the form of lower cash proceeds or other considerations.
W. P. Carey 2011 Supplemental 8-K — 5
W. P. Carey & Co. LLC
Adjusted Cash Flow from Operating Activities
(in thousands, except share and per share amounts)
| Years Ended December 31, | ||||||||||||
| 2011 | 2010 | 2009 | ||||||||||
| Cash flow provided by operating activities |
$ | 80,116 | $ | 86,417 | $ | 74,544 | ||||||
| Adjustments: |
||||||||||||
| Distributions received from equity investments in real estate in excess of equity income (a) |
17,033 | 9,253 | 18,503 | |||||||||
| Distributions paid to noncontrolling interests, net (b) |
(946 | ) | (614 | ) | (568 | ) | ||||||
| Changes in working capital (c) |
12,718 | (6,422 | ) | 1,401 | ||||||||
|
CPA®:14/16 Merger - revenue net of costs/taxes (d) |
(10,333 | ) | — | — | ||||||||
|
|
|
|
|
|
|
|||||||
| Adjusted cash flow from operating activities |
$ | 98,588 | $ | 88,634 | $ | 93,880 | ||||||
|
|
|
|
|
|
|
|||||||
| Adjusted cash flow per share (diluted) |
$ | 2.46 | $ | 2.22 | $ | 2.36 | ||||||
|
|
|
|
|
|
|
|||||||
| Distributions declared per share |
$ | 2.185 | $ | 2.028 | $ | 1.996 | ||||||
|
|
|
|
|
|
|
|||||||
| Payout ratio (distributions per share/adjusted cash flow per share) |
89 | % | 91 | % | 85 | % | ||||||
|
|
|
|
|
|
|
|||||||
| Diluted weighted average shares outstanding |
40,098,095 | 40,007,894 | 39,712,735 | |||||||||
|
|
|
|
|
|
|
|||||||
| (a) | We take a substantial portion of our asset management revenue in shares of the CPA® REITs. To the extent we receive distributions in excess of the equity income that we recognize, we include such amounts in our evaluation of cash flow from core operations. |
| (b) | Represents noncontrolling interests’ share of distributions made by ventures that we consolidate in our financial statements. |
| (c) | Timing differences arising from the payment of certain liabilities and the receipt of certain receivables in a period other than that in which the item is recognized in determining net income may distort the actual cash flow that our core operations generate. We adjust our GAAP cash flow from operating activities to record such amounts in the period in which the item was actually recognized. |
| (d) | Amounts represent termination and subordinated disposition revenue, net of a 45% tax provision, earned in connection with the CPA®:14/16 Merger. This revenue is generally earned in connection with events that provide liquidity or alternatives to the CPA® REIT shareholders. In determining cash flow generated from our core operations, we believe it is more appropriate to normalize cash flow for the impact of the net revenue earned in connection with the CPA®:14/16 Merger. |
Non-GAAP Financial Disclosure
Adjusted cash flow from operating activities refers to our cash flow from operating activities (as computed in accordance with GAAP) adjusted, where applicable, primarily to: add cash distributions that we receive from our investments in unconsolidated real estate joint ventures in excess of our equity income; subtract cash distributions that we make to our noncontrolling partners in real estate joint ventures that we consolidate; and eliminate changes in working capital. We hold a number of interests in real estate joint ventures, and we believe that adjusting our GAAP cash flow provided by operating activities to reflect these actual cash receipts and cash payments, as well as eliminating the effect of timing differences between the payment of certain liabilities and the receipt of certain receivables in a period other than that in which the item is recognized may give investors additional information about our actual cash flow that is not incorporated in cash flow from operating activities as defined by GAAP.
We believe that adjusted cash flow from operating activities is a useful supplemental measure for assessing the cash flow generated from our core operations as it gives investors important information about our liquidity that is not provided within cash flow from operating activities as defined by GAAP, and we use this measure when evaluating distributions to shareholders. Adjusted cash flow from operating activities should not be considered as an alternative to cash provided by operating activities computed on a GAAP basis as a measure of our liquidity.
W. P. Carey 2011 Supplemental 8-K — 6
W. P. CAREY & CO. LLC
Revenue Stability Analysis (Pro rata Basis)
(in thousands)
| Three Months Ended | Years Ended December 31, | |||||||||||||||||||||||||||||||||||||||||||||||||||||||||||||||
| December 31, 2011 | September 30, 2011 | June 30, 2011 | March 31, 2011 | December 31, 2010 | 2011 | 2010 | 2009 | |||||||||||||||||||||||||||||||||||||||||||||||||||||||||
| Revenue | % | Revenue | % | Revenue | % | Revenue | % | Revenue | % | Revenue | % | Revenue | % | Revenue | % | |||||||||||||||||||||||||||||||||||||||||||||||||
| Asset management revenue |
$ | 15,529 | 30 | % | $ | 14,840 | 22 | % | $ | 16,619 | 16 | % | $ | 19,820 | 31 | % | $ | 19,127 | 28 | % | $ | 66,808 | 23 | % | $ | 76,246 | 34 | % | $ | 76,621 | 38 | % | ||||||||||||||||||||||||||||||||
| Incentive, termination and subordinated disposition revenue (a) |
— | 0 | % | — | 0 | % | 52,515 | 50 | % | — | 0 | % | — | 0 | % | 52,515 | 19 | % | — | 0 | % | — | 0 | % | ||||||||||||||||||||||||||||||||||||||||
| Pro rata net lease revenues |
32,021 | 62 | % | 31,255 | 46 | % | 29,727 | 29 | % | 27,453 | 44 | % | 26,739 | 38 | % | 119,394 | 42 | % | 105,542 | 46 | % | 100,428 | 50 | % | ||||||||||||||||||||||||||||||||||||||||
|
|
|
|
|
|
|
|
|
|
|
|
|
|
|
|
|
|
|
|
|
|
|
|
|
|
|
|
|
|
|
|
|
|||||||||||||||||||||||||||||||||
| 47,550 | 92 | % | 46,095 | 68 | % | 98,861 | 95 | % | 47,273 | 75 | % | 45,866 | 66 | % | 238,717 | 84 | % | 181,788 | 80 | % | 177,049 | 88 | % | |||||||||||||||||||||||||||||||||||||||||
|
|
|
|
|
|
|
|
|
|
|
|
|
|
|
|
|
|
|
|
|
|
|
|
|
|
|
|
|
|
|
|
|
|||||||||||||||||||||||||||||||||
| Structuring revenue (b) |
3,930 | 8 | % | 21,221 | 32 | % | 5,735 | 5 | % | 15,945 | 25 | % | 23,881 | 34 | % | 46,831 | 16 | % | 44,525 | 20 | % | 23,273 | 12 | % | ||||||||||||||||||||||||||||||||||||||||
|
|
|
|
|
|
|
|
|
|
|
|
|
|
|
|
|
|
|
|
|
|
|
|
|
|
|
|
|
|
|
|
|
|||||||||||||||||||||||||||||||||
| Total Adjusted Revenue |
$ | 51,480 | 100 | % | $ | 67,316 | 100 | % | $ | 104,596 | 100 | % | $ | 63,218 | 100 | % | $ | 69,747 | 100 | % | $ | 285,548 | 100 | % | $ | 226,313 | 100 | % | $ | 200,322 | 100 | % | ||||||||||||||||||||||||||||||||
|
|
|
|
|
|
|
|
|
|
|
|
|
|
|
|
|
|
|
|
|
|
|
|
|
|
|
|
|
|
|
|
|
|||||||||||||||||||||||||||||||||
| Reconciliation of Total Adjusted Revenue |
||||||||||||||||||||||||||||||||||||||||||||||||||||||||||||||||
| Total revenue — as reported |
$ | 63,169 | $ | 78,372 | $ | 118,398 | $ | 77,532 | $ | 81,969 | $ | 336,409 | $ | 269,854 | $ | 228,381 | ||||||||||||||||||||||||||||||||||||||||||||||||
| Less: Reimbursed costs from affiliates (c) |
(15,344 | ) | (14,707 | ) | (17,059 | ) | (17,719 | ) | (13,713 | ) | (64,829 | ) | (60,023 | ) | (47,534 | ) | ||||||||||||||||||||||||||||||||||||||||||||||||
| Less: Wholesaling revenue (c) |
(2,876 | ) | (2,586 | ) | (2,922 | ) | (3,280 | ) | (4,503 | ) | (11,664 | ) | (11,096 | ) | (7,691 | ) | ||||||||||||||||||||||||||||||||||||||||||||||||
| Add: Pro rata share of revenues from equity investments |
6,967 | 6,689 | 6,844 | 7,760 | 6,889 | 28,260 | 31,291 | 31,124 | ||||||||||||||||||||||||||||||||||||||||||||||||||||||||
| Less: Pro rata share of revenues due to noncontrolling interests |
(436 | ) | (452 | ) | (665 | ) | (1,075 | ) | (895 | ) | (2,628 | ) | (3,713 | ) | (3,958 | ) | ||||||||||||||||||||||||||||||||||||||||||||||||
|
|
|
|
|
|
|
|
|
|
|
|
|
|
|
|
|
|||||||||||||||||||||||||||||||||||||||||||||||||
| Total Adjusted Revenue |
$ | 51,480 | $ | 67,316 | $ | 104,596 | $ | 63,218 | $ | 69,747 | $ | 285,548 | $ | 226,313 | $ | 200,322 | ||||||||||||||||||||||||||||||||||||||||||||||||
|
|
|
|
|
|
|
|
|
|
|
|
|
|
|
|
|
|||||||||||||||||||||||||||||||||||||||||||||||||
| Reconciliation of Total Pro Rata Net Lease Revenues |
||||||||||||||||||||||||||||||||||||||||||||||||||||||||||||||||
| Lease revenues – as reported |
$ | 19,360 | $ | 18,609 | $ | 17,839 | $ | 15,460 | $ | 15,403 | $ | 70,206 | $ | 59,881 | $ | 58,564 | ||||||||||||||||||||||||||||||||||||||||||||||||
| Add: Pro rata share of revenues from equity investments |
6,967 | 6,689 | 6,844 | 7,760 | 6,889 | 28,260 | 31,291 | 31,124 | ||||||||||||||||||||||||||||||||||||||||||||||||||||||||
| Less: Pro rata share of revenues due to noncontrolling interests |
(436 | ) | (452 | ) | (665 | ) | (1,075 | ) | (895 | ) | (2,628 | ) | (3,713 | ) | (3,958 | ) | ||||||||||||||||||||||||||||||||||||||||||||||||
| Add: Other real estate income (d) |
6,130 | 6,409 | 5,709 | 5,308 | 5,342 | 23,556 | 18,083 | 14,698 | ||||||||||||||||||||||||||||||||||||||||||||||||||||||||
|
|
|
|
|
|
|
|
|
|
|
|
|
|
|
|
|
|||||||||||||||||||||||||||||||||||||||||||||||||
| Total Pro Rata Net Lease Revenues |
$ | 32,021 | $ | 31,255 | $ | 29,727 | $ | 27,453 | $ | 26,739 | $ | 119,394 | $ | 105,542 | $ | 100,428 | ||||||||||||||||||||||||||||||||||||||||||||||||
|
|
|
|
|
|
|
|
|
|
|
|
|
|
|
|
|
|||||||||||||||||||||||||||||||||||||||||||||||||
| (a) | Upon consummation of the CPA®:14/16 Merger, we earned revenues of $31.2 million in connection with the termination of the advisory agreement with CPA®:14, which we received in the form of shares of CPA®:16 – Global common stock, and $21.3 million of subordinated disposition revenues. |
| (b) | We earn structuring revenue on acquisitions structured on behalf of the REITs we manage and expect significant period-to-period variation in such revenue based on changes in investment volume. Investments structured on behalf of the REITs totaled approximately $132 million, $498 million, $249 million, $345 million and $593 million for the three months ended December 31, 2011, September 30, 2011, June 30, 2011, March 31, 2011 and December 31, 2010, respectively, and approximately $1.2 billion, $1.0 billion and $508 million for the years ended December 31, 2011, 2010 and 2009, respectively. |
| (c) | Total adjusted revenue excludes reimbursements of costs received from the affiliated REITs as they have no impact on net income. Also excluded is wholesaling revenue earned in connection with CPA®:17 – Global’s and CWI’s public offerings, which is substantially offset by underwriting costs incurred in connection with the offerings. |
| (d) | Other real estate income generally consists of revenue from Carey Storage Management LLC (“Carey Storage”), a subsidiary that invests in domestic self-storage properties, and Livho, Inc., a subsidiary that operates a hotel franchise. Other real estate income also includes lease termination payments and other non-rent related revenues from real estate ownership, and as a result, we expect Other real estate income to fluctuate period-to-period. |
| Note: | Amounts presented for prior periods do not reflect subsequent adjustments to historical amounts presented for assets reclassified as held for sale or sold. |
W. P. Carey 2011 Supplemental 8-K — 7
Non-GAAP Financial Disclosure
Total adjusted revenue is a non-GAAP financial measure that represents revenues on a GAAP basis adjusted for our pro rata share of revenues from equity investments as well as the pro rata share of revenues due to noncontrolling interests. We believe that total adjusted revenue is useful to investors and analysts as a supplemental measure of revenues from our core operations, and we use it to evaluate the stability of our underlying revenue streams. Total adjusted revenue should not be considered as an alternative to revenues computed on a GAAP basis as a measure of our profitability. Total adjusted revenue may not be comparable to similarly titled measures of other companies.
W. P. Carey 2011 Supplemental 8-K — 8
W. P. CAREY & CO. LLC
Portfolio Debt Overview (Pro rata Basis)
As of December 31, 2011
(in thousands)
Portfolio Debt Maturity
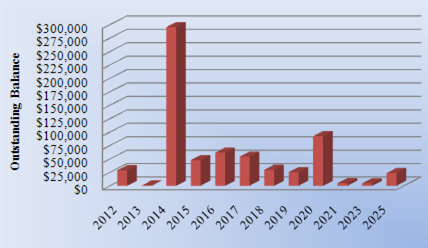
| Year of Maturity |
Outstanding Balance | |||
| 2012 |
$ | 29,104 | ||
| 2013 |
817 | |||
| 2014 |
295,566 | (a) | ||
| 2015 |
47,718 | |||
| 2016 |
61,779 | |||
| 2017 |
54,598 | |||
| 2018 |
30,017 | |||
| 2019 |
25,399 | |||
| 2020 |
92,582 | |||
| 2021 |
4,927 | |||
| 2022 |
— | |||
| 2023 |
4,823 | |||
| 2024 |
— | |||
| 2025 |
24,000 | |||
|
|
|
|||
| Total |
$ | 671,330 | ||
|
|
|
|||
Debt Maturity Analysis
Year of Maturity
Fixed and Variable Rate Debt Analysis
| Non-Recourse Debt | Outstanding Balance | |||
| Fixed |
$ | 288,816 | ||
| Fixed — Future Rate Reset |
62,155 | |||
| Variable — Capped |
21,775 | |||
| Variable — Floating |
14,047 | |||
| Fixed — Swap Agreement |
47,017 | |||
| Variable |
4,360 | |||
|
|
|
|||
| 438,170 | ||||
|
|
|
|||
| Recourse Debt |
||||
| Variable — Line of Credit |
233,160 | |||
|
|
|
|||
| Total Debt |
$ | 671,330 | ||
|
|
|
|||
| (a) | Amount includes outstanding recourse debt on the unsecured line of credit. |
W. P. Carey 2011 Supplemental 8-K — 9
W. P. CAREY & CO. LLC
Detailed Debt Summary (Pro rata Basis)
As of December 31, 2011
(in thousands)
| Tenant/Lease Guarantor / Percent Ownership |
Rate Type | Current Interest Rate |
Maturity Date | Outstanding Balance | ||||||||||
| Qwest Communications, Inc. |
Fixed | 7.50 | % | Jun-2012 | $ | 1,304 | ||||||||
| AutoZone, Inc. — Series C |
Fixed | 6.85 | % | Aug-2012 | 154 | |||||||||
| Anthony’s Manufacturing Company |
Fixed | 5.11 | % | Oct-2012 | 8,020 | |||||||||
| BE Aerospace, Inc. |
Fixed | 6.11 | % | Nov-2012 | 7,990 | |||||||||
| Faurecia Exhaust Systems, Inc. |
Fixed | 5.16 | % | Nov-2012 | 2,313 | |||||||||
| Alstom Power, Inc. and Werner Co. |
Fixed | 5.18 | % | Dec-2012 | 9,323 | |||||||||
| AutoZone, Inc. — Series D |
Fixed | 6.85 | % | Aug-2013 | 817 | |||||||||
| US Airways Group, Inc. (75%) |
Variable - Floating | 4.27 | % | Apr-2014 | 14,047 | |||||||||
| Billipp Portfolio |
Variable | 2.75 | % | May-2014 | 4,360 | |||||||||
| Carrefour France, SAS (46%) (a) |
Fixed - Future Rate Reset | 5.55 | % | Dec-2014 | 43,999 | |||||||||
| Hibbett Sports |
Fixed - Swap | 6.45 | % | May-2015 | 4,557 | |||||||||
| Lowe’s Home Improvement Warehouse |
Fixed | 4.87 | % | Sep-2015 | 8,532 | |||||||||
| Bouygues Telecom, S.A. (Tours) (95%) (a) |
Fixed | 3.07 | % | Oct-2015 | 5,293 | |||||||||
| The American Bottling Company |
Fixed | 5.13 | % | Nov-2015 | 29,336 | |||||||||
| World Color Printing |
Fixed | 5.30 | % | May-2016 | 4,939 | |||||||||
| CheckFree Holdings, Inc. (b) |
Fixed | 6.18 | % | Jun-2016 | 28,752 | |||||||||
| Self-Storage Facility — Bentonville, AR (40%) |
Fixed | 6.41 | % | Jul-2016 | 823 | |||||||||
| Sprint Spectrum, LP |
Fixed | 4.85 | % | Aug-2016 | 8,418 | |||||||||
| Self-Storage Facility — Tallahassee, FL (40%) |
Fixed | 6.05 | % | Oct-2016 | 1,559 | |||||||||
| Bouygues Telecom, S.A. (Illkirch-Graffenstaden) (75%) (a) (c) |
Fixed | 5.01 | % | Oct-2016 | 10,574 | |||||||||
| Consolidated Systems, Inc. (60%) |
Fixed | 5.87 | % | Nov-2016 | 6,714 | |||||||||
| Hellweg Die Profi-Baumärkte GmbH & Co. KG (5%) (a) |
Fixed | 5.49 | % | Jan-2017 | 896 | |||||||||
| 24 Hour Fitness USA, Inc. |
Fixed | 5.50 | % | Jun-2017 | 3,314 | |||||||||
| Amylin Pharmaceuticals, Inc. (b) |
Fixed | 6.20 | % | Jul-2017 | 34,800 | |||||||||
| Medica France, S.A. (46%) (a) |
Fixed | 4.50 | % | Oct-2017 | 15,588 | |||||||||
| The New York Times Company (17.75%) |
Variable - Capped | 2.87 | % | Apr-2018 | 21,775 | |||||||||
| OBI Wroclaw (a) |
Fixed - Swap | 5.48 | % | May-2018 | 8,242 | |||||||||
| Self-Storage Portfolio (40%) (c) |
Fixed - Future Rate Reset | 7.03 | % | Feb-2019/Mar-2019 | 12,714 | |||||||||
| Orbital Sciences Corporation |
Fixed | 7.75 | % | Jul-2019 | 12,685 | |||||||||
| JPMorgan Chase Bank, N.A. |
Fixed - Swap | 5.47 | % | Jul-2020 | 34,218 | |||||||||
| Self-Storage Facilities — Chicago, IL (40%) |
Fixed - Future Rate Reset | 6.25 | % | Aug-2020 | 2,757 | |||||||||
| Self-Storage Facility — Pensacola, FL |
Fixed - Future Rate Reset | 6.25 | % | Nov-2020 | 1,838 | |||||||||
| Self-Storage Facility — Chicago, IL (40%) |
Fixed - Future Rate Reset | 6.62 | % | Dec-2020 | 847 | |||||||||
| Federal Express Corporation (b) |
Fixed | 5.48 | % | Dec-2020 | 52,922 | |||||||||
| Information Resources, Inc. (33%) |
Fixed | 5.92 | % | Feb-2021 | 4,927 | |||||||||
| Hologic, Inc. (36%) |
Fixed | 6.40 | % | May-2023 | 4,823 | |||||||||
| Google, Inc. |
Fixed | 5.15 | % | Nov-2025 | 24,000 | |||||||||
|
|
|
|
|
|||||||||||
| Total Non-Recourse Debt |
5.41 | %(c) | 438,170 | |||||||||||
|
|
|
|
|
|||||||||||
| Unsecured Line of Credit |
Variable | 4.00 | % | Dec-2014 | 233,160 | |||||||||
|
|
|
|
|
|||||||||||
| Total Debt |
4.92 | %(c) | $ | 671,330 | ||||||||||
|
|
|
|
|
|||||||||||
| (a) | Debt balance calculated using an exchange rate of 1.2950 EUR/USD as of December 31, 2011. |
| (b) | In connection with the CPA®:14/16 Merger, we purchased the remaining interest in the property, in which we already had an equity interest, from CPA®:14. |
| (c) | Reflects the weighted-average interest rate for the applicable debt. |
W. P. Carey 2011 Supplemental 8-K — 10
W. P. CAREY & CO. LLC
2011 Investment Activity
As of December 31, 2011
(in thousands, except square footage)
Investment Activity
Acquisitions—REITs (a)
| Portfolio(s) |
Tenant/Lease Guarantor |
Property Location(s) |
Purchase Price | Closing Date |
Property Type |
Gross Square Footage |
||||||||||
| CPA®:17 – Global |
Terminal Freezers, LLC | Oxnard & Watsonville, CA | $ | 99,634 | January-11 | Warehouse/Distribution | 866,525 | |||||||||
| CPA®:15 (15%), CPA®:17 – Global (85%) |
C1000 Logistiek Vastgoed B.V. (b) | Various locations in The Netherlands | 207,635 | January-11 | Warehouse/Distribution | 2,046,858 | ||||||||||
| CPA®:17 – Global |
Harbor Freight Tools USA, Inc. | Dillon, SC | 32,060 | March-11 | Warehouse/Distribution | 1,010,859 | ||||||||||
| CPA®:17 – Global |
Dolgencorp, LLC (c) | Richwood, LA; Vass, NC & Hot Springs, VA | 2,893 | March-11 | Retail | BTS | ||||||||||
| CPA®:17 – Global |
Curtiss-Wright Flow Control Service | Middleburg Heights, OH | 2,585 | March-11 | Industrial | 28,185 | ||||||||||
| CPA®:17 – Global |
Flanders Corporation | Ardmore, OK; Smithfield, NC; Bartow, FL & Momence, IL | 50,790 | April-11 | Warehouse/Distribution | 722,108 | ||||||||||
| CPA®:17 – Global |
Berry Plastics Corporation | Evansville, IN | 2,723 | April-11 | Industrial | 263,088 | ||||||||||
| CPA®:17 – Global |
Dolgencorp, LLC (c) | Hopewell & Chesterfield, VA; Mount Hermon & Mangham, LA | 4,311 | April-11; May-11 & June-11 | Retail | BTS | ||||||||||
| CPA®:17 – Global |
ICF International, Inc. (c) | Martinsville, VA | 14,819 | May-11 | Office | BTS | ||||||||||
| CPA®:15 (75%), CPA®:16 – Global (25%) |
Hellweg Die Profi-Baumärkte GmbH & Co. KG (b) | Bad Salzungen, Germany | 4,394 | May-11 | Retail | 72,490 | ||||||||||
| CPA®:17 – Global |
CRO - San Luis Development, LLC | Chicago, IL | 7,414 | June-11 | Retail | 17,000 | ||||||||||
| CPA®:17 – Global |
Dolgencorp, LLC (c) | Choudrant, LA | 882 | July-11 | Retail | BTS | ||||||||||
| CPA®:17 – Global |
Precision Printing and Packing, Inc. | Clarksville, TN | 7,960 | August-11 | Industrial | 189,300 | ||||||||||
| CPA®:17 – Global |
Dolgencorp, LLC (c) | Gardner, LA | 979 | August-11 | Retail | BTS | ||||||||||
| CPA®:17 – Global |
Faurecia International System, Inc. | Fraser, MI | 6,775 | September-11 | Industrial | 164,153 | ||||||||||
| CPA®:17 – Global |
Metro AG (b) | Various locations in Italy | 395,511 | September-11 | Retail | 2,415,163 | ||||||||||
| CPA®:16 – Global |
IDS Manufacturing Sdn. Bhd. (b) | Shah Alam, Malaysia | 3,475 | October-11 | Industrial | 391,972 | ||||||||||
| CPA®:17 – Global |
Agrokor d.d (b) (c) | Various locations in Croatia | 57,509 | November-11 | Retail | BTS | ||||||||||
| CPA®:16 – Global |
Mantsinen Group Ltd. (b) | Ylämylly, Finland | 1,519 | November-11 | Industrial | 20,498 | ||||||||||
| CPA®:17 – Global |
American Air Liquide Holdings, Inc. | Countryside, IL | 2,250 | December-11 | Industrial | 18,264 | ||||||||||
| CPA®:17 – Global |
Flanders Corporation | Hudson, NY | 5,217 | December-11 | Industrial | 195,000 | ||||||||||
|
|
|
|
|
|||||||||||||
| Total Acquisitions—Leased Properties |
911,335 | 8,421,463 | ||||||||||||||
|
|
|
|
|
|||||||||||||
W. P. Carey 2011 Supplemental 8-K — 11
| Portfolio(s) |
Property Type |
Property Location(s) |
Purchase Price | Closing Date |
||||||||||
| CPA®:17 – Global |
Self-Storage Facility | Fort Worth, TX | 3,400 | April-11 | ||||||||||
| CWI |
Hospitality | Long Beach, CA | 43,600 | May-11 | ||||||||||
| CPA®:17 – Global |
Self-Storage Facilities | Various locations in California, Hawaii and Illinois | 86,015 | June-11 | ||||||||||
| CPA®:17 – Global |
Self-Storage Facility | Kihei, HI | 11,069 | August-11 | ||||||||||
| CPA®:17 – Global |
Self-Storage Facilities | Various locations in California and Illinois | 20,292 | August-11 | ||||||||||
| CPA®:17 – Global |
Self-Storage Facility | Pearl City, HI | 6,064 | August-11 | ||||||||||
| CWI |
Hospitality | New Orleans, LA | 32,300 | September-11 | ||||||||||
| CPA®:17 – Global |
Self-Storage Facilities | Various locations in California and Illinois | 8,428 | September-11 | ||||||||||
| CPA®:17 – Global |
Self-Storage Facility | Chicago, IL | 7,891 | September-11 | ||||||||||
| CPA®:17 – Global |
Self-Storage Facilities | Various locations in California and Illinois | 23,700 | November-11 | ||||||||||
| CPA®:17 – Global |
Self-Storage Facility | Hesperia, CA | 2,414 | December-11 | ||||||||||
|
|
|
|||||||||||||
| Total Acquisitions—Hospitality/Self Storage Properties |
245,173 | |||||||||||||
|
|
|
|||||||||||||
| Notes Receivable |
||||||||||||||
| Portfolio |
Borrower/Guarantor |
Interest Rate |
Note Amount | Closing Date |
Maturity Date |
|||||||||
| CPA®:17 – Global |
BPS Partners | 8.00% |
30,000 | June-11 |
June-16 | |||||||||
| CPA®:17 – Global |
IShops LLC | 8.00% |
43,000 | December-11 |
December-14 | |||||||||
|
|
|
|||||||||||||
| 73,000 | ||||||||||||||
|
|
|
|||||||||||||
| Total Acquisitions |
$ | 1,229,508 | ||||||||||||
|
|
|
|||||||||||||
| (a) | There were no acquisitions in our owned portfolio, except for those properties acquired in the CPA®:14/16 Merger in May 2011. |
| (b) | Acquisition price reflects applicable foreign exchange rate. |
| (c) | Acquisition includes a build-to-suit (“BTS”) transaction. Gross square footage cannot be determined at this time. |
W. P. Carey 2011 Supplemental 8-K — 12
Disposition Activity
Dispositions — CPA® REITs
| Portfolio(s) |
Tenant/Lease Guarantor |
Property Location(s) |
Gross Sale Price | Disposition Date |
Property Type |
Gross Square Footage | ||||||||||
| CPA®:15 |
Childtime Childcare, Inc. | Centreville, VA | $ | 788 | February-11 | Other | 6,360 | |||||||||
| CPA®:15 |
Childtime Childcare, Inc. | Century Oaks, VA | 1,700 | March-11 | Other | 6,360 | ||||||||||
| CPA®:14 |
Metaldyne Company | Niles, IL | 1,250 | April-11 | Industrial | 125,880 | ||||||||||
| CPA®:14 |
Westell Technologies, Inc. | Aurora, IL | 14,900 | April-11 | Industrial | 204,235 | ||||||||||
| CPA®:14 |
Amerix Corp. | Columbia, MD | 26,000 | April-11 | Office | 154,394 | ||||||||||
| CPA®:16 – Global (50%), CPA®:15 (50%) |
Goertz & Schiele (a) | Puttlingen, Germany | 438 | April-11 | Industrial | 33,314 | ||||||||||
| CPA®:14 |
Special Devices, Inc. | Mesa, AZ | 22,000 | April-11 | Industrial | 79,275 | ||||||||||
| CPA®:16 – Global |
Production Resources Group | Burbank, CA | 6,785 | May-11 | Leisure, Amusement, Entertainment | 49,374 | ||||||||||
| CPA®:15 |
Childtime Childcare, Inc. | Manassas, VA | 1,765 | May-11 | Other | 8,854 | ||||||||||
| CPA®:16 – Global |
International Garden | Lakewood, NJ | 6,000 | May-11 | Warehouse/Distribution | 218,201 | ||||||||||
| CPA®:17 – Global |
Carquest Canada Ltd. (a) | New Brunswick and Quebec, Canada | 19,773 | May-11 | Warehouse/Distribution | 231,870 | ||||||||||
| CPA®:16 – Global |
NutraMax Products, Inc. | Houston, TX | 6,874 | June-11 | Industrial | 253,215 | ||||||||||
| CPA®:15 (67%) |
Information Resources | Chicago, IL | 3,170 | June-11 | Office | 61,603 | ||||||||||
| CPA®:16 – Global |
Celadon Group, Inc. | Indianapolis, IN | 11,180 | July-11 | Industrial | 76,326 | ||||||||||
| CPA®:16 – Global (70%), CPA®:15 (30%) |
PETsMART, Inc. | Various locations in California, Florida, Illinois, Massachusetts, Maryland, Michigan and Texas | 74,000 | July-11 | Retail | 209,964 | ||||||||||
| CPA®:15 (67%), CPA®:16 – Global (33%) |
Best Buy Stores, L.P. | Various locations in Colorado, Illinois, Massachusetts, New Hampshire, New Mexico, Texas and Virginia | 53,250 | September-11 | Retail | 322,737 | ||||||||||
| CPA®:15 |
Childtime Childcare, Inc. | Newport News, VA | 1,685 | September-11 | Other | 7,893 | ||||||||||
| CPA®:16 – Global |
Tower Automotive | Kendallville, IN | 1,175 | October-11 | Industrial | 131,000 | ||||||||||
| CPA®:16 – Global |
Fraikin SAS (a) | Various locations in France | 6,423 | October-11 | Industrial | 90,943 | ||||||||||
| CPA®:16 – Global |
International Aluminum Corp. (a) | Langley, Canada | 4,802 | October-11 | Industrial | 60,134 | ||||||||||
| CPA®:16 – Global |
McLane Foodservice, Inc. | Shawnee, KS | 14,485 | December-11 | Warehouse/Distribution | 244,272 | ||||||||||
| CPA®:15 (44%), CPA®:16 – Global (56%) |
Life Time Fitness, Inc. | Various locations in Florida and Minnesota | 108,000 | December-11 | Other | 428,750 | ||||||||||
| CPA®:15 |
Worthington Precious Metals | Mentor, OH | 1,000 | December-11 | Industrial | 123,960 | ||||||||||
|
|
|
|
|
|||||||||||||
| Total REIT Dispositions |
387,443 | 3,128,914 | ||||||||||||||
|
|
|
|
|
|||||||||||||
| Dispositions — Owned Portfolio |
||||||||||||||||
| WPC LLC |
AT&T Corp. | Bridgeton, MO | 8,250 | February-11 | Industrial | 85,510 | ||||||||||
| WPC LLC |
Wal-Mart Stores, Inc. | West Mifflin, PA | 1,032 | February-11 | Retail | 121,054 | ||||||||||
| WPC LLC (33%) |
Information Resources | Chicago, IL | 1,575 | June-11 | Office | 30,797 | ||||||||||
| WPC LLC |
Honeywell | Houston, TX | 1,595 | June-11 | Warehouse/Distribution | 32,320 | ||||||||||
| WPC LLC |
Cypress Creek Partners, LLC | Little Rock, AR | 350 | August-11 | Retail | 21,932 | ||||||||||
| WPC LLC |
Penberthy, Inc. | Prophetstown, IL | 50 | September-11 | Industrial | 161,878 | ||||||||||
| WPC LLC |
Vacant | Salisbury, NC | 1,600 | December-11 | Warehouse/Distribution | 301,284 | ||||||||||
|
|
|
|
|
|||||||||||||
| Total Owned Portfolio Dispositions |
14,452 | 754,775 | ||||||||||||||
|
|
|
|
|
|||||||||||||
| Total Dispositions |
$ | 401,895 | 3,883,689 | |||||||||||||
|
|
|
|
|
|||||||||||||
W. P. Carey 2011 Supplemental 8-K — 13
Foreclosure and Receivership Activity
| Portfolio(s) |
Tenant/Lease Guarantor |
Property Location(s) |
Outstanding Mortgage Balance |
Date |
Event |
Gross Square Footage | ||||||||||
| CPA®:15 |
Vacant | Port Huron & Shelby Township, MI | $ | 6,143 | February-11 | Receivership | 294,883 | |||||||||
| CPA®:14 |
Vacant | Duluth, GA | 7,141 | March-11 | Foreclosure | 221,374 | ||||||||||
| CPA®:14 |
Vacant | Eagan, MN | 19,363 | April-11 | Foreclosure | 99,342 | ||||||||||
| CPA®:16 – Global |
Vacant | Various locations in Arizona, California, Illinois, South Carolina and Texas | 38,668 | August-11 | Receivership | 132,486 | ||||||||||
| WPC LLC |
GTM, Inc. | Mendota Heights, MN | 6,311 | September-11 | Receivership | 136,400 | ||||||||||
|
|
|
|
|
|||||||||||||
| $ | 77,626 | 884,485 | ||||||||||||||
|
|
|
|
|
|||||||||||||
| (a) | Disposition price reflects applicable foreign exchange rate. |
| (b) | Disposition activity did not include properties sold by CPA®:14 to WPC LLC and CPA®:17 – Global in connection with the CPA®:14/16 Merger in May 2011. |
W. P. Carey 2011 Supplemental 8-K — 14
W. P. Carey & Co. LLC
Owned Portfolio Analysis – Diversification by Rent and Historical Occupancy (Pro rata Basis)
As of December 31, 2011
(in thousands, except percentages)
Top Ten Tenants by Annualized Contractual Minimum Base Rent
| Tenant/Lease Guarantor |
Annualized Contractual Minimum Base Rent |
Percent | ||||||
| Federal Express Corporation (a) |
$ | 7,535 | 8 | % | ||||
| Carrefour France, SAS (b) |
7,419 | 8 | % | |||||
| CheckFree Holdings, Inc. (a) |
5,216 | 6 | % | |||||
| The American Bottling Company |
4,972 | 5 | % | |||||
| The New York Times Company |
4,423 | 5 | % | |||||
| JP Morgan Chase Bank, N.A. |
3,862 | 4 | % | |||||
| Amylin Pharmaceuticals, Inc. (a) |
3,741 | 4 | % | |||||
| Orbital Sciences Corporation |
3,307 | 4 | % | |||||
| U.S. Airways Group, Inc. |
3,297 | 4 | % | |||||
| Titan Corporation |
3,055 | 3 | % | |||||
|
|
|
|
|
|||||
| Total |
$ | 46,827 | 51 | % | ||||
|
|
|
|
|
|||||
| Weighted Average Lease Term for Portfolio: 6.4 years |
||||||||
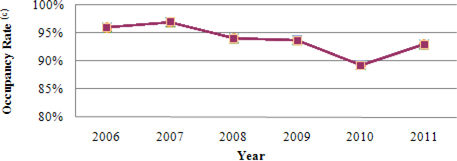
W. P. Carey & Co. LLC Historical Occupancy
| (a) | In connection with the CPA®:14/16 Merger in May 2011, we purchased the remaining interest in the property, in which we already had a joint interest, from CPA®:14. |
| (b) | Rent amounts are subject to fluctuations in foreign currency exchange rates. |
| (c) | Percentage of the portfolio’s total pro rata square footage that was subject to lease. |
W. P. Carey 2011 Supplemental 8-K — 15
W. P. Carey & Co. LLC
Owned Portfolio Analysis – Diversification by Property Type (Pro rata Basis)
As of December 31, 2011
(in thousands, except percentages)
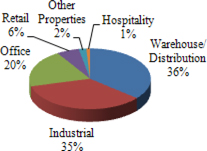
| Property Type |
Square Footage | Percent | ||||||
| Warehouse/Distribution |
4,825 | 36 | % | |||||
| Industrial |
4,694 | 35 | % | |||||
| Office |
2,639 | 20 | % | |||||
| Retail |
852 | 6 | % | |||||
| Other Properties (a) |
279 | 2 | % | |||||
| Hospitality |
158 | 1 | % | |||||
|
|
|
|
|
|||||
| Total (b) |
13,447 | 100 | % | |||||
|
|
|
|
|
|||||
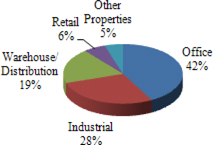
| Property Type |
Annualized Contractual Minimum Base Rent |
Percent | ||||||
| Office |
$ | 38,613 | 42 | % | ||||
| Industrial |
25,526 | 28 | % | |||||
| Warehouse/Distribution |
17,994 | 19 | % | |||||
| Retail |
5,412 | 6 | % | |||||
| Other Properties (a) |
4,557 | 5 | % | |||||
|
|
|
|
|
|||||
| Total (b) |
$ | 92,102 | 100 | % | ||||
|
|
|
|
|
|||||
| Portfolio Diversification by Property Type (based on square footage) |
Portfolio Diversification by Property Type (based on annualized contractual minimum base rent) | |
|
| |
| (a) | Reflects properties used for health care; education, child care and social services; leisure, amusement and recreation; self storage; and unoccupied land. |
| (b) | Excludes 20 domestic self-storage properties in our Carey Storage subsidiary, totaling approximately 0.5 million square feet (on a pro rata basis). |
W. P. Carey 2011 Supplemental 8-K — 16
W. P. Carey & Co. LLC
Owned Portfolio Analysis – Diversification by Tenant Industry (Pro rata Basis)
As of December 31, 2011
(in thousands, except percentages)
| Industry Type (a) |
Annualized Contractual Minimum Base Rent |
Percent | ||||||
| Business and Commercial Services |
$ | 14,070 | 15 | % | ||||
| Retail Trade |
13,854 | 15 | % | |||||
| Transportation — Cargo |
7,535 | 8 | % | |||||
| Media: Printing and Publishing |
7,003 | 8 | % | |||||
| Healthcare, Education and Childcare |
5,628 | 6 | % | |||||
| Telecommunications |
5,228 | 6 | % | |||||
| Beverages, Food, and Tobacco |
5,025 | 5 | % | |||||
| Aerospace and Defense |
4,931 | 5 | % | |||||
| Electronics |
4,428 | 5 | % | |||||
| Banking |
3,862 | 4 | % | |||||
| Forest Products and Paper |
3,772 | 4 | % | |||||
| Transportation — Personal |
3,505 | 4 | % | |||||
| Machinery |
2,430 | 3 | % | |||||
| Grocery |
1,686 | 2 | % | |||||
| Consumer and Durable Goods |
1,471 | 2 | % | |||||
| Mining, Metals, and Primary Metal Industries |
1,213 | 1 | % | |||||
| Chemicals, Plastics, Rubber, and Glass |
1,179 | 1 | % | |||||
| Leisure, Amusement, Entertainment |
952 | 1 | % | |||||
| Construction and Building |
878 | 1 | % | |||||
| Textiles, Leather, and Apparel |
872 | 1 | % | |||||
|
Other (b) |
2,580 | 3 | % | |||||
|
|
|
|
|
|||||
| Total (c) |
$ | 92,102 | 100 | % | ||||
|
|
|
|
|
|||||
| (a) | Based on the Moody’s Investors Service, Inc. classification system and information provided by the tenant. |
| (b) | Includes revenue from tenants in the following industries: federal, state and local government (0.8%), consumer non-durable goods (0.7%), automobile (0.7%), multi-tenant properties (0.5%) and hotels and gaming (0.01%). |
| (c) | Excludes 20 domestic self-storage properties in our Carey Storage subsidiary, totaling approximately 0.5 million square feet (on a pro rata basis). |
W. P. Carey 2011 Supplemental 8-K — 17
W. P. Carey & Co. LLC
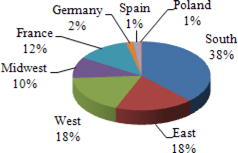
Owned Portfolio Analysis – Diversification by Geography (Pro rata basis)
As of December 31, 2011
(in thousands, except percentages)
| Region |
Square Footage | Percent | ||||||
| U.S. |
||||||||
| South |
5,061 | 38 | % | |||||
| East |
2,481 | 18 | % | |||||
| West |
2,412 | 18 | % | |||||
| Midwest |
1,325 | 10 | % | |||||
|
|
|
|
|
|||||
| U.S. Total |
11,279 | 84 | % | |||||
|
|
|
|
|
|||||
| International |
||||||||
| France |
1,670 | 12 | % | |||||
| Germany |
246 | 2 | % | |||||
| Spain |
138 | 1 | % | |||||
| Poland |
114 | 1 | % | |||||
|
|
|
|
|
|||||
| International Total |
2,168 | 16 | % | |||||
|
|
|
|
|
|||||
| Total (a) |
13,447 | 100 | % | |||||
|
|
|
|
|
|||||
| Region |
Annualized Contractual Minimum Base Rent |
Percent | ||||||
| U.S. |
||||||||
| South |
$ | 33,357 | 36 | % | ||||
| West |
22,568 | 25 | % | |||||
| East |
12,453 | 14 | % | |||||
| Midwest |
5,685 | 6 | % | |||||
|
|
|
|
|
|||||
| U.S. Total |
74,063 | 81 | % | |||||
|
|
|
|
|
|||||
| International |
||||||||
| France |
13,111 | 14 | % | |||||
| Germany |
2,251 | 2 | % | |||||
| Spain |
1,686 | 2 | % | |||||
| Poland |
991 | 1 | % | |||||
|
|
|
|
|
|||||
| International Total |
18,039 | 19 | % | |||||
|
|
|
|
|
|||||
| Total (a) |
$ | 92,102 | 100 | % | ||||
|
|
|
|
|
|||||
| Portfolio Diversification by Geography (based on square footage) |
Portfolio Diversification by Geography (based on annualized contractual minimum base rent) | |
|
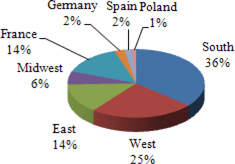
| |
| (a) | Excludes 20 domestic self-storage properties in our Carey Storage subsidiary, totaling approximately 0.5 million square feet (on a pro rata basis). |
W. P. Carey 2011 Supplemental 8-K — 18
W. P. CAREY & CO. LLC
Owned Portfolio Analysis – Lease Maturities (Pro rata Basis)
As of December 31, 2011
(in thousands, except percentages)
| Year of Lease Expiration (a) |
Annualized Contractual Minimum Base Rent |
Percent | ||||||
|
2012 (b) |
$ | 8,980 | 10 | % | ||||
| 2013 |
3,791 | 4 | % | |||||
| 2014 |
11,716 | 13 | % | |||||
| 2015 |
13,100 | 14 | % | |||||
| 2016 |
6,633 | 7 | % | |||||
| 2017 |
6,435 | 7 | % | |||||
| 2018 |
4,626 | 5 | % | |||||
| 2019 |
14,414 | 16 | % | |||||
| 2020 |
2,767 | 3 | % | |||||
| 2021 |
3,500 | 4 | % | |||||
| 2022 |
1,761 | 2 | % | |||||
| 2023 |
— | 0 | % | |||||
| 2024 |
4,423 | 5 | % | |||||
| 2025 |
1,200 | 1 | % | |||||
| 2026 |
948 | 1 | % | |||||
| 2027 |
2,251 | 2 | % | |||||
| 2028 |
— | 0 | % | |||||
| 2029 |
— | 0 | % | |||||
| 2030 |
5,557 | 6 | % | |||||
|
|
|
|
|
|||||
| Total (c) |
$ | 92,102 | 100 | % | ||||
|
|
|
|
|
|||||
Weighted Average Years to Maturity: 6.4
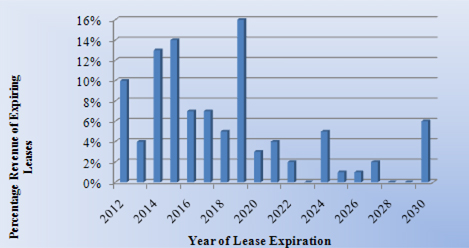
| (a) | Assumes tenant does not exercise renewal option. |
| (b) | Month-to-month properties are counted in 2011 revenue stream. |
| (c) | Excludes 20 domestic self-storage properties in our Carey Storage subsidiary, totaling approximately 0.5 million square feet (on a pro rata basis). |
W. P. Carey 2011 Supplemental 8-K — 19
W. P. CAREY & CO. LLC
CONSOLIDATED BALANCE SHEETS
(in thousands, except share amounts)
| December 31, | ||||||||
| 2011 | 2010 | |||||||
| Assets |
|
|||||||
| Investments in real estate: |
||||||||
| Real estate, at cost (inclusive of amounts attributable to consolidated VIEs of $41,032 and $39,718, respectively) |
$ | 646,482 | $ | 560,592 | ||||
| Operating real estate, at cost (inclusive of amounts attributable to consolidated VIEs of $26,318 and $25,665, respectively) |
109,875 | 109,851 | ||||||
| Accumulated depreciation (inclusive of amounts attributable to consolidated VIEs of $22,350 and $20,431, respectively) |
(135,175 | ) | (122,312 | ) | ||||
|
|
|
|
|
|||||
| Net investments in properties |
621,182 | 548,131 | ||||||
| Net investments in direct financing leases |
58,000 | 76,550 | ||||||
| Equity investments in real estate and the REITs |
538,749 | 322,294 | ||||||
|
|
|
|
|
|||||
| Net investments in real estate |
1,217,931 | 946,975 | ||||||
| Cash and cash equivalents (inclusive of amounts attributable to consolidated VIEs of $230 and $86, respectively) |
29,297 | 64,693 | ||||||
| Due from affiliates |
38,369 | 38,793 | ||||||
| Intangible assets and goodwill, net |
125,957 | 87,768 | ||||||
| Other assets, net (inclusive of amounts attributable to consolidated VIEs of $2,773 and $1,845, respectively) |
51,069 | 34,097 | ||||||
|
|
|
|
|
|||||
| Total assets |
$ | 1,462,623 | $ | 1,172,326 | ||||
|
|
|
|
|
|||||
| Liabilities and Equity |
||||||||
| Liabilities: |
||||||||
| Non-recourse and limited-recourse debt (inclusive of amounts attributable to consolidated VIEs of $14,261 and $9,593, respectively) |
$ | 356,209 | $ | 255,232 | ||||
| Line of credit |
233,160 | 141,750 | ||||||
| Accounts payable, accrued expenses and other liabilities (inclusive of amounts attributable to consolidated VIEs of $1,651 and $2,275, respectively) |
82,055 | 40,808 | ||||||
| Income taxes, net |
44,783 | 41,443 | ||||||
| Distributions payable |
22,314 | 20,073 | ||||||
|
|
|
|
|
|||||
| Total liabilities |
738,521 | 499,306 | ||||||
|
|
|
|
|
|||||
| Redeemable noncontrolling interest |
7,700 | 7,546 | ||||||
|
|
|
|
|
|||||
| Equity: |
||||||||
| W. P. Carey members’ equity: |
||||||||
| Listed shares, no par value, 100,000,000 shares authorized; 39,717,286 and 39,454,847 shares issued and outstanding, respectively |
779,071 | 763,734 | ||||||
| Distributions in excess of accumulated earnings |
(95,046 | ) | (145,769 | ) | ||||
| Deferred compensation obligation |
7,063 | 10,511 | ||||||
| Accumulated other comprehensive loss |
(8,507 | ) | (3,463 | ) | ||||
|
|
|
|
|
|||||
| Total W. P. Carey members’ equity |
682,581 | 625,013 | ||||||
| Noncontrolling interests |
33,821 | 40,461 | ||||||
|
|
|
|
|
|||||
| Total equity |
716,402 | 665,474 | ||||||
|
|
|
|
|
|||||
| Total liabilities and equity |
$ | 1,462,623 | $ | 1,172,326 | ||||
|
|
|
|
|
|||||
W. P. Carey 2011 Supplemental 8-K — 20
W. P. CAREY & CO. LLC
CONSOLIDATED STATEMENTS OF INCOME
(in thousands, except share and per share amounts)
| Years Ended December 31, | ||||||||||||
| 2011 | 2010 | 2009 | ||||||||||
| Revenues |
||||||||||||
| Asset management revenue |
$ | 66,808 | $ | 76,246 | $ | 76,621 | ||||||
| Structuring revenue |
46,831 | 44,525 | 23,273 | |||||||||
| Incentive, termination and subordinated disposition revenue |
52,515 | — | — | |||||||||
| Wholesaling revenue |
11,664 | 11,096 | 7,691 | |||||||||
| Reimbursed costs from affiliates |
64,829 | 60,023 | 47,534 | |||||||||
| Lease revenues |
70,206 | 59,881 | 58,564 | |||||||||
| Other real estate income |
23,556 | 18,083 | 14,698 | |||||||||
|
|
|
|
|
|
|
|||||||
| 336,409 | 269,854 | 228,381 | ||||||||||
|
|
|
|
|
|
|
|||||||
| Operating Expenses |
||||||||||||
| General and administrative |
(93,707 | ) | (73,429 | ) | (63,818 | ) | ||||||
| Reimbursable costs |
(64,829 | ) | (60,023 | ) | (47,534 | ) | ||||||
| Depreciation and amortization |
(28,518 | ) | (22,604 | ) | (20,879 | ) | ||||||
| Property expenses |
(13,241 | ) | (10,416 | ) | (6,699 | ) | ||||||
| Other real estate expenses |
(10,784 | ) | (8,121 | ) | (7,308 | ) | ||||||
| Impairment charges |
(10,432 | ) | (1,140 | ) | (3,516 | ) | ||||||
|
|
|
|
|
|
|
|||||||
| (221,511 | ) | (175,733 | ) | (149,754 | ) | |||||||
|
|
|
|
|
|
|
|||||||
| Other Income and Expenses |
||||||||||||
| Other interest income |
2,001 | 1,268 | 1,713 | |||||||||
| Income from equity investments in real estate and the REITs |
51,228 | 30,992 | 13,425 | |||||||||
| Gain on change in control of interests |
27,859 | — | — | |||||||||
| Other income and (expenses) |
4,550 | 1,407 | 7,357 | |||||||||
| Interest expense |
(21,920 | ) | (15,725 | ) | (14,462 | ) | ||||||
|
|
|
|
|
|
|
|||||||
| 63,718 | 17,942 | 8,033 | ||||||||||
|
|
|
|
|
|
|
|||||||
| Income from continuing operations before income taxes |
178,616 | 112,063 | 86,660 | |||||||||
| Provision for income taxes |
(37,228 | ) | (25,822 | ) | (22,793 | ) | ||||||
|
|
|
|
|
|
|
|||||||
| Income from continuing operations |
141,388 | 86,241 | 63,867 | |||||||||
|
|
|
|
|
|
|
|||||||
| Discontinued Operations |
||||||||||||
| Income from operations of discontinued properties |
174 | 2,491 | 5,908 | |||||||||
| Gain on deconsolidation of a subsidiary |
1,008 | — | — | |||||||||
| (Loss) gain on sale of real estate |
(3,391 | ) | 460 | 7,701 | ||||||||
| Impairment charges |
(41 | ) | (14,241 | ) | (6,908 | ) | ||||||
|
|
|
|
|
|
|
|||||||
| (Loss) income from discontinued operations |
(2,250 | ) | (11,290 | ) | 6,701 | |||||||
|
|
|
|
|
|
|
|||||||
| Net Income |
139,138 | 74,951 | 70,568 | |||||||||
| Add: Net loss attributable to noncontrolling interests |
1,864 | 314 | 713 | |||||||||
| Less: Net income attributable to redeemable noncontrolling interest |
(1,923 | ) | (1,293 | ) | (2,258 | ) | ||||||
|
|
|
|
|
|
|
|||||||
| Net Income Attributable to W. P. Carey Members |
$ | 139,079 | $ | 73,972 | $ | 69,023 | ||||||
|
|
|
|
|
|
|
|||||||
| Basic Earnings Per Share |
||||||||||||
| Income from continuing operations attributable to W. P. Carey members |
$ | 3.50 | $ | 2.14 | $ | 1.57 | ||||||
| (Loss) income from discontinued operations attributable to W. P. Carey members |
(0.06 | ) | (0.28 | ) | 0.17 | |||||||
|
|
|
|
|
|
|
|||||||
| Net income attributable to W. P. Carey members |
$ | 3.44 | $ | 1.86 | $ | 1.74 | ||||||
|
|
|
|
|
|
|
|||||||
| Diluted Earnings Per Share |
||||||||||||
| Income from continuing operations attributable to W. P. Carey members |
$ | 3.47 | $ | 2.14 | $ | 1.57 | ||||||
| (Loss) income from discontinued operations attributable to W. P. Carey members |
(0.05 | ) | (0.28 | ) | 0.17 | |||||||
|
|
|
|
|
|
|
|||||||
| Net income attributable to W. P. Carey members |
$ | 3.42 | $ | 1.86 | $ | 1.74 | ||||||
|
|
|
|
|
|
|
|||||||
| Weighted Average Shares Outstanding |
||||||||||||
| Basic |
39,819,475 | 39,514,746 | 39,019,709 | |||||||||
|
|
|
|
|
|
|
|||||||
| Diluted |
40,098,095 | 40,007,894 | 39,712,735 | |||||||||
|
|
|
|
|
|
|
|||||||
| Amounts Attributable to W. P. Carey Members |
||||||||||||
| Income from continuing operations, net of tax |
$ | 141,329 | $ | 85,262 | $ | 62,322 | ||||||
| (Loss) income from discontinued operations, net of tax |
(2,250 | ) | (11,290 | ) | 6,701 | |||||||
|
|
|
|
|
|
|
|||||||
| Net income |
$ | 139,079 | $ | 73,972 | $ | 69,023 | ||||||
|
|
|
|
|
|
|
|||||||
W. P. Carey 2011 Supplemental 8-K — 21
W. P. CAREY & CO. LLC
CONSOLIDATED STATEMENTS OF CASH FLOWS
(in thousands)
| Years Ended December 31, | ||||||||||||
| 2011 | 2010 | 2009 | ||||||||||
| Cash Flows — Operating Activities |
||||||||||||
| Net income |
$ | 139,138 | $ | 74,951 | $ | 70,568 | ||||||
| Adjustments to net income: |
||||||||||||
| Depreciation and amortization, including intangible assets and deferred financing costs |
29,616 | 24,443 | 24,476 | |||||||||
| Loss (income) from equity investments in real estate and the REITs in excess of distributions received |
310 | (4,920 | ) | (2,258 | ) | |||||||
| Straight-line rent and financing lease adjustments |
(3,698 | ) | 286 | 2,223 | ||||||||
| Amortization of deferred revenue |
(6,291 | ) | — | — | ||||||||
| Gain on deconsolidation of a subsidiary |
(1,008 | ) | — | — | ||||||||
| Loss (gain) on sale of real estate |
3,391 | (460 | ) | (7,701 | ) | |||||||
| Gain on extinguishment of debt |
— | — | (6,991 | ) | ||||||||
| Unrealized loss (gain) on foreign currency transactions and others |
138 | 300 | (174 | ) | ||||||||
| Realized gain on foreign currency transactions and others |
(965 | ) | (731 | ) | (257 | ) | ||||||
| Allocation of (loss) earnings to profit-sharing interest |
— | (781 | ) | 3,900 | ||||||||
| Management and disposition income received in shares of affiliates |
(73,936 | ) | (35,235 | ) | (31,721 | ) | ||||||
| Gain on conversion of shares |
(3,806 | ) | — | — | ||||||||
| Gain on change in control of interests |
(27,859 | ) | — | — | ||||||||
| Impairment charges |
10,473 | 15,381 | 10,424 | |||||||||
| Stock-based compensation expense |
17,716 | 7,082 | 9,336 | |||||||||
| Deferred acquisition revenue received |
21,546 | 21,204 | 25,068 | |||||||||
| Increase in structuring revenue receivable |
(19,537 | ) | (20,237 | ) | (11,672 | ) | ||||||
| Increase (decrease) in income taxes, net |
244 | (1,288 | ) | (9,276 | ) | |||||||
| Net changes in other operating assets and liabilities |
(5,356 | ) | 6,422 | (1,401 | ) | |||||||
|
|
|
|
|
|
|
|||||||
| Net cash provided by operating activities |
80,116 | 86,417 | 74,544 | |||||||||
|
|
|
|
|
|
|
|||||||
| Cash Flows — Investing Activities |
||||||||||||
| Distributions received from equity investments in real estate and the REITs in excess of equity income |
20,807 | 18,758 | 39,102 | |||||||||
| Capital contributions to equity investments |
(2,297 | ) | — | (2,872 | ) | |||||||
| Purchase of interests in CPA®:16 — Global |
(121,315 | ) | — | — | ||||||||
| Purchases of real estate and equity investments in real estate |
(24,315 | ) | (96,884 | ) | (39,632 | ) | ||||||
| VAT paid in connection with acquisition of real estate |
— | (4,222 | ) | — | ||||||||
| VAT refunded in connection with acquisitions of real estate |
5,035 | — | — | |||||||||
| Capital expenditures |
(13,239 | ) | (5,135 | ) | (7,775 | ) | ||||||
| Cash acquired on acquisition of subsidiaries |
57 | — | — | |||||||||
| Proceeds from sale of real estate |
12,516 | 14,591 | 43,487 | |||||||||
| Proceeds from sale of securities |
818 | — | — | |||||||||
| Proceeds from transfer of profit-sharing interest |
— | — | 21,928 | |||||||||
| Funding of short-term loans to affiliates |
(96,000 | ) | — | — | ||||||||
| Proceeds from repayment of short-term loans to affiliates |
96,000 | — | — | |||||||||
| Funds released from escrow |
2,584 | 36,620 | — | |||||||||
| Funds placed in escrow |
(6,735 | ) | (1,571 | ) | (36,132 | ) | ||||||
|
|
|
|
|
|
|
|||||||
| Net cash (used in) provided by investing activities |
(126,084 | ) | (37,843 | ) | 18,106 | |||||||
|
|
|
|
|
|
|
|||||||
| Cash Flows — Financing Activities |
||||||||||||
| Distributions paid |
(85,814 | ) | (92,591 | ) | (78,618 | ) | ||||||
| Contributions from noncontrolling interests |
3,223 | 14,261 | 2,947 | |||||||||
| Distributions to noncontrolling interests |
(7,258 | ) | (4,360 | ) | (5,505 | ) | ||||||
| Contributions from profit-sharing interest |
— | 3,694 | — | |||||||||
| Distributions to profit-sharing interest |
— | (693 | ) | (5,645 | ) | |||||||
| Purchase of noncontrolling interest |
(7,502 | ) | — | (15,380 | ) | |||||||
| Scheduled payments of mortgage principal |
(25,327 | ) | (14,324 | ) | (9,534 | ) | ||||||
| Prepayments of mortgage principal |
— | — | (13,974 | ) | ||||||||
| Proceeds from mortgage financing |
45,491 | 56,841 | 42,495 | |||||||||
| Proceeds from lines of credit |
251,410 | 83,250 | 150,500 | |||||||||
| Repayments of lines of credit |
(160,000 | ) | (52,500 | ) | (148,518 | ) | ||||||
| Proceeds from loans from affiliates |
— | — | 1,625 | |||||||||
| Repayments of loans from affiliates |
— | — | (1,770 | ) | ||||||||
| Payment of financing costs |
(7,778 | ) | (1,204 | ) | (862 | ) | ||||||
| Proceeds from issuance of shares |
1,488 | 3,724 | 1,507 | |||||||||
| Windfall tax benefit associated with stock-based compensation awards |
2,569 | 2,354 | 143 | |||||||||
| Repurchase and retirement of shares |
— | — | (10,686 | ) | ||||||||
|
|
|
|
|
|
|
|||||||
| Net cash provided by (used in) financing activities |
10,502 | (1,548 | ) | (91,275 | ) | |||||||
|
|
|
|
|
|
|
|||||||
| Change in Cash and Cash Equivalents During the Year |
||||||||||||
| Effect of exchange rate changes on cash |
70 | (783 | ) | 276 | ||||||||
|
|
|
|
|
|
|
|||||||
| Net (decrease) increase in cash and cash equivalents |
(35,396 | ) | 46,243 | 1,651 | ||||||||
| Cash and cash equivalents, beginning of year |
64,693 | 18,450 | 16,799 | |||||||||
|
|
|
|
|
|
|
|||||||
| Cash and cash equivalents, end of year |
$ | 29,297 | $ | 64,693 | $ | 18,450 | ||||||
|
|
|
|
|
|
|
|||||||
W. P. Carey 2011 Supplemental 8-K — 22
W. P. CAREY & CO. LLC
Owned Portfolio Detailed Property Summary (Pro rata Basis)
As of December 31, 2011
| Tenant/Lease Guarantor |
Percent Ownership | Property Location | Property Type | Tenant Industry | Region | Square Footage (e) | Annualized Contractual Minimum Base Rent (in thousands) |
Percentage of Total Rent (e) |
Increase Factor | Lease Expiration | Maximum Term | |||||||||||||||||||
| Federal Express Corporation |
100 | % | Collierville, TN | Office | Transportation - Cargo | South | 97,595 | $ | 1,813 | 1.97 | % | CPI | Nov-2019 | Aug-2039 | ||||||||||||||||
| Federal Express Corporation |
100 | % | Collierville, TN | Office | Transportation - Cargo | South | 97,595 | 1,813 | 1.97 | % | CPI | Nov-2019 | Aug-2039 | |||||||||||||||||
| Federal Express Corporation |
100 | % | Collierville, TN | Office | Transportation - Cargo | South | 97,595 | 1,813 | 1.97 | % | CPI | Nov-2019 | Aug-2039 | |||||||||||||||||
| Federal Express Corporation |
100 | % | Collierville, TN | Office | Transportation - Cargo | South | 97,595 | 1,813 | 1.97 | % | CPI | Nov-2019 | Aug-2039 | |||||||||||||||||
| Federal Express Corporation |
100 | % | Corpus Christi, TX | Warehouse/Distribution | Transportation - Cargo | South | 30,212 | 213 | 0.23 | % | Fixed | May-2012 | May-2017 | |||||||||||||||||
| Federal Express Corporation |
100 | % | College Station, TX | Warehouse/Distribution | Transportation - Cargo | South | 12,080 | 70 | 0.08 | % | Fixed | Apr-2012 | Apr-2017 | |||||||||||||||||
|
|
|
|
|
|
|
|||||||||||||||||||||||||
| Federal Express Corporation Total |
432,672 | 7,535 | 8.18 | % | ||||||||||||||||||||||||||
| Carrefour France, SAS (a) |
46 | % | Colomiers, France | Warehouse/Distribution | Retail Trade | Europe | 174,267 | 1,003 | 1.09 | % | INSEE (b) | Jun-2015 | Jun-2018 | |||||||||||||||||
| Carrefour France, SAS (a) |
46 | % | Nimes, France | Warehouse/Distribution | Retail Trade | Europe | 177,792 | 1,001 | 1.09 | % | INSEE (b) | Jun-2016 | Jun-2019 | |||||||||||||||||
| Carrefour France, SAS (a) |
46 | % | Crepy en Valois, France | Warehouse/Distribution | Retail Trade | Europe | 152,370 | 915 | 0.99 | % | INSEE (b) | Jun-2015 | Jun-2018 | |||||||||||||||||
| Carrefour France, SAS (a) |
46 | % | Lens, France | Warehouse/Distribution | Retail Trade | Europe | 126,929 | 731 | 0.79 | % | INSEE (b) | Jun-2015 | Jun-2018 | |||||||||||||||||
| Carrefour France, SAS (a) |
46 | % | Nîmes, France | Warehouse/Distribution | Retail Trade | Europe | 134,942 | 676 | 0.73 | % | INSEE (b) | Jun-2015 | Jun-2018 | |||||||||||||||||
| Carrefour France, SAS (a) |
46 | % | Ploufragan, France | Warehouse/Distribution | Retail Trade | Europe | 122,596 | 629 | 0.68 | % | INSEE (b) | Jun-2015 | Jun-2018 | |||||||||||||||||
| Carrefour France, SAS (a) |
46 | % | Crepy en Valois, France | Warehouse/Distribution | Retail Trade | Europe | 101,252 | 608 | 0.66 | % | INSEE (b) | Jun-2015 | Jun-2018 | |||||||||||||||||
| Carrefour France, SAS (a) |
46 | % | Thuit Hebert, France | Warehouse/Distribution | Retail Trade | Europe | 107,962 | 541 | 0.59 | % | INSEE (b) | Jun-2015 | Jun-2018 | |||||||||||||||||
| Carrefour France, SAS (a) |
46 | % | Cholet, France | Warehouse/Distribution | Retail Trade | Europe | 99,265 | 509 | 0.55 | % | INSEE (b) | Jun-2015 | Jun-2018 | |||||||||||||||||
| Carrefour France, SAS (a) |
46 | % | Colomiers, France | Warehouse/Distribution | Retail Trade | Europe | 60,294 | 347 | 0.38 | % | INSEE (b) | Jun-2015 | Jun-2018 | |||||||||||||||||
| Carrefour France, SAS (a) |
46 | % | Thuit Hebert, France | Warehouse/Distribution | Retail Trade | Europe | 68,479 | 343 | 0.37 | % | INSEE (b) | Jun-2015 | Jun-2018 | |||||||||||||||||
| Carrefour France, SAS (a) |
46 | % | Colomiers, France | Warehouse/Distribution | Retail Trade | Europe | 7,524 | 43 | 0.05 | % | INSEE (b) | Jun-2015 | Jun-2018 | |||||||||||||||||
| Carrefour France, SAS (a) |
46 | % | Lens, France | Warehouse/Distribution | Retail Trade | Europe | 4,349 | 25 | 0.03 | % | INSEE (b) | Jun-2015 | Jun-2018 | |||||||||||||||||
| Carrefour France, SAS (a) |
46 | % | Colomiers, France | Warehouse/Distribution | Retail Trade | Europe | 2,899 | 17 | 0.02 | % | INSEE (b) | Jun-2015 | Jun-2018 | |||||||||||||||||
| Carrefour France, SAS (a) |
46 | % | Lens, France | Warehouse/Distribution | Retail Trade | Europe | 2,599 | 15 | 0.02 | % | INSEE (b) | Jun-2015 | Jun-2018 | |||||||||||||||||
| Carrefour France, SAS (a) |
46 | % | Nîmes, France | Warehouse/Distribution | Retail Trade | Europe | 2,554 | 13 | 0.01 | % | INSEE (b) | Jun-2015 | Jun-2018 | |||||||||||||||||
| Carrefour France, SAS (a) |
46 | % | Nîmes, France | Warehouse/Distribution | Retail Trade | Europe | 596 | 3 | 0.00 | % | INSEE (b) | Jun-2015 | Jun-2018 | |||||||||||||||||
|
|
|
|
|
|
|
|||||||||||||||||||||||||
| Carrefour France, SAS Total |
1,346,669 | 7,419 | 8.05 | % | ||||||||||||||||||||||||||
| CheckFree Corporation |
100 | % | Norcross, GA | Office | Business and Commercial Services |
South | 100,125 | 2,032 | 2.21 | % | CPI | Dec-2015 | Dec-2030 | |||||||||||||||||
| CheckFree Corporation |
100 | % | Norcross, GA | Office | Business and Commercial Services |
South | 68,300 | 1,724 | 1.87 | % | CPI | Dec-2015 | Dec-2030 | |||||||||||||||||
| CheckFree Corporation |
100 | % | Norcross, GA | Office | Business and Commercial Services |
South | 52,250 | 1,301 | 1.41 | % | CPI | Dec-2015 | Dec-2030 | |||||||||||||||||
| CheckFree Corporation |
100 | % | Norcross, GA | Land | Business and Commercial Services |
South | 1 | 159 | 0.17 | % | CPI | Dec-2015 | Dec-2030 | |||||||||||||||||
|
|
|
|
|
|
|
|||||||||||||||||||||||||
| CheckFree Corporation Total |
220,676 | 5,216 | 5.66 | % | ||||||||||||||||||||||||||
W. P. Carey 2011 Supplemental 8-K — 23
| Tenant/Lease Guarantor |
Percent Ownership | Property Location |
Property Type |
Tenant Industry |
Region |
Square Footage (e) | Annualized Contractual Minimum Base Rent (in thousands) |
Percentage of Total Rent (e) |
Increase Factor |
Lease Expiration |
Maximum Term | |||||||||||||||||||
| The American Bottling Company |
100 | % | Irving, TX | Industrial | Beverages, Food, and Tobacco | South | 459,497 | 3,016 | 3.27 | % | CPI | Jul-2014 | Jul-2029 | |||||||||||||||||
| The American Bottling Company |
100 | % | Houston, TX | Industrial | Beverages, Food, and Tobacco | South | 262,450 | 1,956 | 2.12 | % | CPI | Jul-2014 | Jul-2029 | |||||||||||||||||
|
|
|
|
|
|
|
|||||||||||||||||||||||||
| The American Bottling Company Total |
721,947 | 4,972 | 5.40 | % | ||||||||||||||||||||||||||
| The New York Times Company |
18 | % | New York, NY | Office | Media: Printing and Publishing | East | 126,420 | 4,423 | 4.80 | % | Fixed | Mar-2024 | Mar-2044 | |||||||||||||||||
| JP Morgan Chase Bank, N.A. |
100 | % | Fort Worth, TX | Office | Banking | South | 384,246 | 3,862 | 4.19 | % | None | Feb-2030 | Feb-2050 | |||||||||||||||||
| Amylin Pharmaceuticals, Inc. |
100 | % | San Diego, CA | Office | Business and Commercial Services | West | 71,902 | 1,870 | 2.03 | % | Fixed | Jul-2019 | Jul-2029 | |||||||||||||||||
| Amylin Pharmaceuticals, Inc. |
100 | % | San Diego, CA | Industrial | Business and Commercial Services | West | 72,409 | 1,870 | 2.03 | % | Fixed | Jul-2019 | Jul-2029 | |||||||||||||||||
|
|
|
|
|
|
|
|||||||||||||||||||||||||
| Amylin Pharmaceuticals, Inc. Total |
144,311 | 3,741 | 4.06 | % | ||||||||||||||||||||||||||
| Orbital Sciences Corporation |
100 | % | Chandler, AZ | Industrial | Aerospace and Defense | West | 355,307 | 3,307 | 3.59 | % | CPI | Sep-2019 | Sep-2029 | |||||||||||||||||
| US Airways Group, Inc. |
75 | % | Tempe, AZ | Office | Transportation - Personal | West | 167,890 | 3,297 | 3.58 | % | CPI | Apr-2014 | Nov-2029 | |||||||||||||||||
| The Titan Corporation |
100 | % | San Diego, CA | Office | Electronics | West | 166,403 | 3,055 | 3.32 | % | CPI | Jul-2012 | Jul-2017 | |||||||||||||||||
| Medica France S.A. (a) |
46 | % | Paris, France | Other | Healthcare, Education and Childcare | Europe | 24,770 | 602 | 0.65 | % | INSEE (b) | Sep-2021 | Sep-2030 | |||||||||||||||||
| Medica France S.A. (a) |
46 | % | Sarcelles, France | Other | Healthcare, Education and Childcare | Europe | 34,621 | 602 | 0.65 | % | INSEE (b) | Sep-2021 | Sep-2030 | |||||||||||||||||
| Medica France S.A. (a) |
46 | % | Chatou, France | Other | Healthcare, Education and Childcare | Europe | 24,667 | 376 | 0.41 | % | INSEE (b) | Sep-2021 | Sep-2030 | |||||||||||||||||
| Medica France S.A. (a) |
46 | % | Poissy, France | Other | Healthcare, Education and Childcare | Europe | 24,593 | 376 | 0.41 | % | INSEE (b) | Sep-2021 | Sep-2030 | |||||||||||||||||
| Medica France S.A. (a) |
46 | % | Rosny sous Bois, France | Other | Healthcare, Education and Childcare | Europe | 21,847 | 376 | 0.41 | % | INSEE (b) | Sep-2021 | Sep-2030 | |||||||||||||||||
| Medica France S.A. (a) |
46 | % | Rueil Malmaison, France | Other | Healthcare, Education and Childcare | Europe | 23,814 | 376 | 0.41 | % | INSEE (b) | Sep-2021 | Sep-2030 | |||||||||||||||||
|
|
|
|
|
|
|
|||||||||||||||||||||||||
| Medica France S.A. Total |
154,312 | 2,708 | 2.94 | % | ||||||||||||||||||||||||||
| Bouygues Telecom, S.A. (a) |
75 | % | Illkirch-Graffenstaden, France | Office | Telecommunications | Europe | 45,459 | 1,664 | 1.81 | % | INSEE (b) | Feb-2013 | Feb-2013 | |||||||||||||||||
| Bouygues Telecom, S.A. (a) |
95 | % | Tours, France | Office | Telecommunications | Europe | 57,264 | 907 | 0.98 | % | INSEE (b) | Sep-2012 | Sep-2012 | |||||||||||||||||
| Bouygues Telecom, S.A. (a) |
75 | % | Illkirch-Graffenstaden, France | Office | Telecommunications | Europe | 3,689 | — | 0.00 | % | INSEE (b) | Dec-2015 | May-2020 | |||||||||||||||||
|
|
|
|
|
|
|
|||||||||||||||||||||||||
| Bouygues Telecom, S.A. Total |
106,412 | 2,571 | 2.79 | % | ||||||||||||||||||||||||||
| Schuler AG (a) |
33 | % | Göppingen, Germany | Industrial | Machinery | Europe | 246,380 | 2,251 | 2.44 | % | CPI | Oct-2027 | Oct-2047 | |||||||||||||||||
W. P. Carey 2011 Supplemental 8-K — 24
| Tenant/Lease Guarantor |
Percent Ownership | Property Location | Property Type | Tenant Industry | Region | Square Footage (e) | Annualized Contractual Minimum Base Rent (in thousands) |
Percentage of Total Rent (e) |
Increase Factor | Lease Expiration | Maximum Term | |||||||||||||||||||||||
| AutoZone, Inc. |
100 | % | San Antonio, TX | Retail | Retail Trade | South | 5,400 | 56 | 0.06 | % | None | Aug-2013 | Aug-2038 | |||||||||||||||||||||
| AutoZone, Inc. |
100 | % | Albuquerque, NM | Retail | Retail Trade | West | 5,400 | 55 | 0.06 | % | None | Aug-2013 | Aug-2038 | |||||||||||||||||||||
| AutoZone, Inc. |
100 | % | Jacksonville, FL | Retail | Retail Trade | South | 5,400 | 54 | 0.06 | % | None | Aug-2013 | Aug-2038 | |||||||||||||||||||||
| AutoZone, Inc. |
100 | % | Houston, TX | Retail | Retail Trade | South | 5,400 | 53 | 0.06 | % | None | Aug-2013 | Aug-2038 | |||||||||||||||||||||
| AutoZone, Inc. |
100 | % | Gastonia, NC | Retail | Retail Trade | East | 5,400 | 52 | 0.06 | % | None | Jan-2016 | Jan-2026 | |||||||||||||||||||||
| AutoZone, Inc. |
100 | % | Corpus Christi, TX | Retail | Retail Trade | South | 6,600 | 52 | 0.06 | % | None | Jan-2016 | Jan-2026 | |||||||||||||||||||||
| AutoZone, Inc. |
100 | % | Statesville, NC | Retail | Retail Trade | East | 5,400 | 51 | 0.06 | % | None | Jan-2016 | Jan-2026 | |||||||||||||||||||||
| AutoZone, Inc. |
100 | % | Lenoir, NC | Retail | Retail Trade | East | 5,400 | 51 | 0.06 | % | None | Jan-2016 | Jan-2026 | |||||||||||||||||||||
| AutoZone, Inc. |
100 | % | Corpus Christi, TX | Retail | Retail Trade | South | 6,480 | 51 | 0.06 | % | None | Jan-2016 | Jan-2026 | |||||||||||||||||||||
| AutoZone, Inc. |
100 | % | Victoria, TX | Retail | Retail Trade | South | 6,480 | 51 | 0.06 | % | None | Jan-2016 | Jan-2026 | |||||||||||||||||||||
| AutoZone, Inc. |
100 | % | Lexington, SC | Retail | Retail Trade | East | 5,400 | 50 | 0.05 | % | None | Aug-2013 | Aug-2038 | |||||||||||||||||||||
| AutoZone, Inc. |
100 | % | Macon, GA | Retail | Retail Trade | South | 5,400 | 50 | 0.05 | % | None | Aug-2013 | Aug-2038 | |||||||||||||||||||||
| AutoZone, Inc. |
100 | % | St. Peters, MO | Retail | Retail Trade | Midwest | 5,400 | 49 | 0.05 | % | Fixed | Aug-2012 | Aug-2037 | |||||||||||||||||||||
| AutoZone, Inc. |
100 | % | St. Peters, MO | Retail | Retail Trade | Midwest | 6,660 | 49 | 0.05 | % | Fixed | Aug-2012 | Aug-2037 | |||||||||||||||||||||
| AutoZone, Inc. |
100 | % | Jacksonville, FL | Retail | Retail Trade | South | 5,400 | 48 | 0.05 | % | None | Aug-2013 | Aug-2038 | |||||||||||||||||||||
| AutoZone, Inc. |
100 | % | Decatur, AL | Retail | Retail Trade | South | 5,400 | 45 | 0.05 | % | None | Feb-2016 | Feb-2026 | |||||||||||||||||||||
| AutoZone, Inc. |
100 | % | Phenix City, AL | Retail | Retail Trade | South | 5,400 | 45 | 0.05 | % | None | Feb-2016 | Feb-2026 | |||||||||||||||||||||
| AutoZone, Inc. |
100 | % | Mobile, AL | Retail | Retail Trade | South | 5,400 | 45 | 0.05 | % | None | Feb-2016 | Feb-2026 | |||||||||||||||||||||
| AutoZone, Inc. |
100 | % | Alton, IL | Retail | Retail Trade | Midwest | 5,400 | 45 | 0.05 | % | None | Feb-2016 | Feb-2026 | |||||||||||||||||||||
| AutoZone, Inc. |
100 | % | Belleville, IL | Retail | Retail Trade | Midwest | 5,400 | 45 | 0.05 | % | None | Feb-2016 | Feb-2026 | |||||||||||||||||||||
| AutoZone, Inc. |
100 | % | Breckenridge, MO | Retail | Retail Trade | Midwest | 5,400 | 44 | 0.05 | % | None | Feb-2016 | Feb-2026 | |||||||||||||||||||||
| AutoZone, Inc. |
100 | % | Chickasaw, AL | Retail | Retail Trade | South | 5,400 | 43 | 0.05 | % | None | Feb-2016 | Feb-2026 | |||||||||||||||||||||
| AutoZone, Inc. |
100 | % | Montgomery, AL | Retail | Retail Trade | South | 5,400 | 43 | 0.05 | % | None | Feb-2016 | Feb-2026 | |||||||||||||||||||||
| AutoZone, Inc. |
100 | % | Columbus, GA | Retail | Retail Trade | South | 5,400 | 43 | 0.05 | % | None | Feb-2016 | Feb-2026 | |||||||||||||||||||||
| AutoZone, Inc. |
100 | % | West Monroe, LA | Retail | Retail Trade | South | 5,400 | 43 | 0.05 | % | None | Feb-2016 | Feb-2026 | |||||||||||||||||||||
| AutoZone, Inc. |
100 | % | Baton Rouge, LA | Retail | Retail Trade | South | 5,400 | 43 | 0.05 | % | None | Feb-2016 | Feb-2026 | |||||||||||||||||||||
| AutoZone, Inc. |
100 | % | Lake Charles, LA | Retail | Retail Trade | South | 6,480 | 43 | 0.05 | % | None | Feb-2016 | Feb-2026 | |||||||||||||||||||||
| AutoZone, Inc. |
100 | % | Lake Charles, LA | Retail | Retail Trade | South | 6,480 | 43 | 0.05 | % | None | Feb-2016 | Feb-2026 | |||||||||||||||||||||
| AutoZone, Inc. |
100 | % | Maplewood, MO | Retail | Retail Trade | Midwest | 6,480 | 43 | 0.05 | % | None | Feb-2016 | Feb-2026 | |||||||||||||||||||||
| AutoZone, Inc. |
100 | % | Overland, MO | Retail | Retail Trade | Midwest | 6,480 | 43 | 0.05 | % | None | Feb-2016 | Feb-2026 | |||||||||||||||||||||
| AutoZone, Inc. |
100 | % | Albany, GA | Retail | Retail Trade | South | 5,400 | 43 | 0.05 | % | None | Aug-2013 | Aug-2038 | |||||||||||||||||||||
| AutoZone, Inc. |
100 | % | Charlotte, NC | Retail | Retail Trade | East | 5,400 | 42 | 0.05 | % | None | Jan-2016 | Jan-2026 | |||||||||||||||||||||
| AutoZone, Inc. |
100 | % | San Antonio, TX | Retail | Retail Trade | South | 5,400 | 42 | 0.05 | % | None | Jan-2016 | Jan-2026 | |||||||||||||||||||||
| AutoZone, Inc. |
100 | % | Farmington, NM | Retail | Retail Trade | West | 5,400 | 41 | 0.05 | % | None | Aug-2013 | Aug-2038 | |||||||||||||||||||||
| AutoZone, Inc. |
100 | % | Hammond, LA | Retail | Retail Trade | South | 6,480 | 40 | 0.04 | % | Fixed | Aug-2012 | Aug-2037 | |||||||||||||||||||||
| AutoZone, Inc. |
100 | % | Brunswick, GA | Retail | Retail Trade | South | 5,400 | 40 | 0.04 | % | None | Aug-2013 | Aug-2038 | |||||||||||||||||||||
| AutoZone, Inc. |
100 | % | Waco, TX | Retail | Retail Trade | South | 4,800 | 38 | 0.04 | % | None | Jan-2016 | Jan-2026 | |||||||||||||||||||||
| AutoZone, Inc. |
100 | % | Collinsville, IL | Retail | Retail Trade | Midwest | 5,400 | 36 | 0.04 | % | None | Feb-2016 | Feb-2026 | |||||||||||||||||||||
| AutoZone, Inc. |
100 | % | Wood River, IL | Retail | Retail Trade | Midwest | 5,400 | 36 | 0.04 | % | None | Feb-2016 | Feb-2026 | |||||||||||||||||||||
| AutoZone, Inc. |
100 | % | St. Louis, MO | Retail | Retail Trade | Midwest | 5,400 | 36 | 0.04 | % | None | Feb-2016 | Feb-2026 | |||||||||||||||||||||
| AutoZone, Inc. |
100 | % | Panama City, FL | Retail | Retail Trade | South | 5,401 | 35 | 0.04 | % | Fixed | Aug-2012 | Aug-2037 | |||||||||||||||||||||
| AutoZone, Inc. |
100 | % | Jacksonville, FL | Retail | Retail Trade | South | 5,000 | 35 | 0.04 | % | Fixed | Aug-2012 | Aug-2037 | |||||||||||||||||||||
W. P. Carey 2011 Supplemental 8-K — 25
| Tenant/Lease Guarantor |
Percent Ownership | Property Location | Property Type | Tenant Industry | Region | Square Footage (e) | Annualized Contractual Minimum Base Rent (in thousands) |
Percentage of Total Rent (e) |
Increase Factor | Lease Expiration | Maximum Term | |||||||||||||||||||
| AutoZone, Inc. |
100 | % | Augusta, GA | Retail | Retail Trade | South | 5,400 | 34 | 0.04 | % | None | Aug-2013 | Aug-2038 | |||||||||||||||||
| AutoZone, Inc. |
100 | % | Bessemer, AL | Retail | Retail Trade | South | 5,400 | 32 | 0.03 | % | None | Feb-2016 | Feb-2026 | |||||||||||||||||
| AutoZone, Inc. |
100 | % | Austin, TX | Retail | Retail Trade | South | 4,000 | 31 | 0.03 | % | None | Jan-2016 | Jan-2026 | |||||||||||||||||
| AutoZone, Inc. |
100 | % | Nederland, TX | Retail | Retail Trade | South | 4,000 | 31 | 0.03 | % | None | Jan-2016 | Jan-2026 | |||||||||||||||||
| AutoZone, Inc. |
100 | % | West Orange, TX | Retail | Retail Trade | South | 4,000 | 31 | 0.03 | % | None | Jan-2016 | Jan-2026 | |||||||||||||||||
| AutoZone, Inc. |
100 | % | Shelby, NC | Retail | Retail Trade | East | 6,660 | 31 | 0.03 | % | Fixed | Aug-2012 | Aug-2037 | |||||||||||||||||
| AutoZone, Inc. |
100 | % | Kannapolis, NC | Retail | Retail Trade | East | 6,408 | 24 | 0.03 | % | Fixed | Oct-2015 | Oct-2025 | |||||||||||||||||
| AutoZone, Inc. |
100 | % | Baton Rouge, LA | Retail | Retail Trade | South | 5,401 | 23 | 0.03 | % | Fixed | Apr-2014 | Apr-2019 | |||||||||||||||||
| AutoZone, Inc. |
100 | % | Knoxville, TN | Retail | Retail Trade | South | 6,660 | 23 | 0.02 | % | Fixed | May-2014 | May-2024 | |||||||||||||||||
| AutoZone, Inc. |
100 | % | Baton Rouge, LA | Retail | Retail Trade | South | 6,600 | 22 | 0.02 | % | Fixed | Mar-2014 | Mar-2024 | |||||||||||||||||
| AutoZone, Inc. |
100 | % | East Ridge, TN | Retail | Retail Trade | South | 6,480 | 21 | 0.02 | % | Fixed | Oct-2013 | Oct-2023 | |||||||||||||||||
| AutoZone, Inc. |
100 | % | Morgantown, NC | Retail | Retail Trade | East | 5,400 | 19 | 0.02 | % | Fixed | Oct-2015 | Aug-2019 | |||||||||||||||||
|
|
|
|
|
|
|
|||||||||||||||||||||||||
| AutoZone, Inc. Total |
302,230 | 2,217 | 2.41 | % | ||||||||||||||||||||||||||
| Sybron Dental Specialties, Inc. |
100 | % | Romulus, MI | Industrial | Healthcare, Education and Childcare |
Midwest | 220,000 | 1,454 | 1.58 | % | CPI | Dec-2018 | Dec-2043 | |||||||||||||||||
| Sybron Dental Specialties, Inc. |
100 | % | Glendora, CA | Office | Healthcare, Education and Childcare |
West | 25,000 | 555 | 0.60 | % | CPI | Dec-2018 | Dec-2043 | |||||||||||||||||
|
|
|
|
|
|
|
|||||||||||||||||||||||||
| Sybron Dental Specialties, Inc. Total |
245,000 | 2,009 | 2.18 | % | ||||||||||||||||||||||||||
| Unisource Worldwide, Inc. |
100 | % | Commerce, CA | Warehouse/Distribution | Forest Products and Paper | West | 411,561 | 1,564 | 1.70 | % | Fixed | Apr-2020 | Apr-2030 | |||||||||||||||||
| Unisource Worldwide, Inc. |
100 | % | Anchorage, AK | Warehouse/Distribution | Forest Products and Paper | West | 44,712 | 362 | 0.39 | % | Fixed | Dec-2014 | Dec-2029 | |||||||||||||||||
|
|
|
|
|
|
|
|||||||||||||||||||||||||
| Unisource Worldwide, Inc. Total |
456,273 | 1,926 | 2.09 | % | ||||||||||||||||||||||||||
| Eroski Sociedad Cooperativa |
70 | % | Mallorca, Spain | Warehouse/Distribution | Retail Trade | Europe | 432,559 | 1,720 | 1.87 | % | 3% or CPI | Jun-2030 | Jun-2045 | |||||||||||||||||
| World Color Printing (USA) Corp. |
100 | % | Doraville, GA | Industrial | Media: Printing and Publishing | South | 138,383 | 1,686 | 1.83 | % | CPI | Dec-2017 | Dec-2042 | |||||||||||||||||
| BE Aerospace, Inc. |
100 | % | Lenexa, KS | Industrial | Aerospace and Defense | Midwest | 130,094 | 676 | 0.73 | % | Fixed | Sep-2017 | Sep-2037 | |||||||||||||||||
| BE Aerospace, Inc. |
100 | % | Winston-Salem, NC | Warehouse/Distribution | Aerospace and Defense | East | 90,800 | 272 | 0.30 | % | Fixed | Sep-2017 | Sep-2037 | |||||||||||||||||
| BE Aerospace, Inc. |
100 | % | Winston-Salem, NC | Industrial | Aerospace and Defense | East | 74,026 | 221 | 0.24 | % | Fixed | Sep-2017 | Sep-2037 | |||||||||||||||||
| BE Aerospace, Inc. |
100 | % | Winston-Salem, NC | Industrial | Aerospace and Defense | East | 50,200 | 150 | 0.16 | % | Fixed | Sep-2017 | Sep-2037 | |||||||||||||||||
| BE Aerospace, Inc. |
100 | % | Winston-Salem, NC | Office | Aerospace and Defense | East | 43,788 | 131 | 0.14 | % | Fixed | Sep-2017 | Sep-2037 | |||||||||||||||||
| BE Aerospace, Inc. |
100 | % | Dallas, TX | Industrial | Aerospace and Defense | South | 22,680 | 129 | 0.14 | % | Fixed | Sep-2017 | Sep-2037 | |||||||||||||||||
| BE Aerospace, Inc. |
100 | % | Winston-Salem, NC | Industrial | Aerospace and Defense | East | 15,402 | 46 | 0.05 | % | Fixed | Sep-2017 | Sep-2037 | |||||||||||||||||
|
|
|
|
|
|
|
|||||||||||||||||||||||||
| BE Aerospace, Inc. Total |
426,990 | 1,625 | 1.76 | % | ||||||||||||||||||||||||||
| Lowe’s Home Improvement Warehouse |
100 | % | Bellevue, WA | Retail | Retail Trade | West | 143,352 | 1,572 | 1.71 | % | CPI | Aug-2018 | Aug-2018 | |||||||||||||||||
W. P. Carey 2011 Supplemental 8-K — 26
| Tenant/Lease Guarantor |
Percent Ownership | Property Location | Property Type | Tenant Industry | Region | Square Footage (e) | Annualized Contractual Minimum Base Rent (in thousands) |
Percentage of Total Rent (e) |
Increase Factor | Lease Expiration | Maximum Term | |||||||||||||||||||
| Sprint Spectrum Realty Company, L.P. |
100 | % | Rio Rancho, NM | Office | Telecommunications | West | 94,730 | 1,530 | 1.66 | % | Fixed | May-2016 | May-2021 | |||||||||||||||||
| Hologic, Inc. |
36 | % | Bedford, MA | Industrial | Electronics | East | 74,520 | 1,119 | 1.22 | % | CPI | Aug-2022 | Aug-2042 | |||||||||||||||||
| Hologic, Inc. |
36 | % | Danbury, CT | Industrial | Electronics | East | 22,335 | 255 | 0.28 | % | CPI | Aug-2022 | Aug-2042 | |||||||||||||||||
|
|
|
|
|
|
|
|||||||||||||||||||||||||
| Hologic, Inc. Total |
96,855 | 1,374 | 1.49 | % | ||||||||||||||||||||||||||
| Cleo, Inc. |
100 | % | Memphis, TN | Warehouse/Distribution | Forest Products and Paper | South | 614,274 | 891 | 0.97 | % | CPI | Dec-2011 | Dec-2011 | |||||||||||||||||
| Cleo, Inc. |
100 | % | Memphis, TN | Warehouse/Distribution | Forest Products and Paper | South | 391,896 | 411 | 0.45 | % | CPI | Dec-2011 | Dec-2011 | |||||||||||||||||
|
|
|
|
|
|
|
|||||||||||||||||||||||||
| Cleo, Inc. Total |
1,006,170 | 1,302 | 1.41 | % | ||||||||||||||||||||||||||
| Fiskars Brands, Inc. |
100 | % | Apopka, FL | Industrial | Chemicals, Plastics, Rubber, and Glass | South | 260,160 | 1,108 | 1.20 | % | Fixed | Mar-2015 | Mar-2015 | |||||||||||||||||
| Fiskars Brands, Inc. |
100 | % | Apopka, FL | Industrial | Chemicals, Plastics, Rubber, and Glass | South | 109,377 | 71 | 0.08 | % | Fixed | Mar-2015 | Mar-2015 | |||||||||||||||||
|
|
|
|
|
|
|
|||||||||||||||||||||||||
| Fiskars Brands, Inc. Total |
369,537 | 1,179 | 1.28 | % | ||||||||||||||||||||||||||
| The United States Playing Card Company |
100 | % | Erlanger, KY | Warehouse/Distribution | Media: Printing and Publishing | East | 409,600 | 859 | 0.93 | % | Fixed | Jun-2017 | Jun-2020 | |||||||||||||||||
| The United States Playing Card Company |
100 | % | Erlanger, KY | Warehouse/Distribution | Consumer and Durable Goods | East | 162,604 | 309 | 0.34 | % | Fixed | Jun-2017 | Jun-2020 | |||||||||||||||||
|
|
|
|
|
|
|
|||||||||||||||||||||||||
| The United States Playing Card Company Total |
572,204 | 1,169 | 1.27 | % | ||||||||||||||||||||||||||
| Anthony’s Manufacturing Company, Inc. |
100 | % | San Fernando, CA | Industrial | Consumer and Durable Goods | West | 95,420 | 606 | 0.66 | % | CPI | May-2012 | May-2012 | |||||||||||||||||
| Anthony’s Manufacturing Company, Inc. |
100 | % | San Fernando, CA | Industrial | Consumer and Durable Goods | West | 40,285 | 256 | 0.28 | % | CPI | May-2012 | May-2012 | |||||||||||||||||
| Anthony’s Manufacturing Company, Inc. |
100 | % | San Fernando, CA | Industrial | Consumer and Durable Goods | West | 39,920 | 254 | 0.28 | % | CPI | May-2012 | May-2012 | |||||||||||||||||
| Anthony’s Manufacturing Company, Inc. |
100 | % | San Fernando, CA | Industrial | Consumer and Durable Goods | West | 7,220 | 46 | 0.05 | % | CPI | May-2012 | May-2012 | |||||||||||||||||
|
|
|
|
|
|
|
|||||||||||||||||||||||||
| Anthony’s Manufacturing Company, Inc. Total |
182,845 | 1,162 | 1.26 | % | ||||||||||||||||||||||||||
| OBI Group (a) |
100 | % | Wroclaw, Poland | Retail | Retail Trade | Europe | 113,570 | 991 | 1.08 | % | CPI | Dec-2025 | Dec-2040 | |||||||||||||||||
| 24 Hour Fitness USA, Inc. |
100 | % | Austin, TX | Other | Leisure, Amusement, Entertainment | South | 43,935 | 952 | 1.03 | % | CPI | Jun-2017 | Jun-2037 | |||||||||||||||||
| Consolidated Systems, Inc. |
60 | % | Columbia, SC | Industrial | Mining, Metals, and Primary Metal Industries | East | 294,249 | 823 | 0.89 | % | Fixed | Oct-2026 | Oct-2046 | |||||||||||||||||
| Consolidated Systems, Inc. |
60 | % | Columbia, SC | Office | Mining, Metals, and Primary Metal Industries | East | 24,459 | 68 | 0.07 | % | Fixed | Oct-2026 | Oct-2046 | |||||||||||||||||
| Consolidated Systems, Inc. |
60 | % | Columbia, SC | Warehouse/Distribution | Mining, Metals, and Primary Metal Industries | East | 13,791 | 39 | 0.04 | % | Fixed | Oct-2026 | Oct-2046 | |||||||||||||||||
| Consolidated Systems, Inc. |
60 | % | Columbia, SC | Warehouse/Distribution | Mining, Metals, and Primary Metal Industries | East | 6,266 | 18 | 0.02 | % | Fixed | Oct-2026 | Oct-2046 | |||||||||||||||||
|
|
|
|
|
|
|
|||||||||||||||||||||||||
| Consolidated Systems, Inc. Total |
338,765 | 948 | 1.03 | % | ||||||||||||||||||||||||||
W. P. Carey 2011 Supplemental 8-K — 27
| Tenant/Lease Guarantor |
Percent Ownership | Property Location | Property Type | Tenant Industry | Region | Square Footage (e) | Annualized Contractual Minimum Base Rent (in thousands) |
Percentage of Total Rent (e) |
Increase Factor | Lease Expiration | Maximum Term | |||||||||||||||||||
| Sports Wholesale, Inc. |
100 | % | Birmingham, AL | Warehouse/Distribution | Retail Trade | South | 219,312 | 924 | 1.00 | % | CPI | Dec-2014 | Dec-2029 | |||||||||||||||||
| Lockheed Martin Corporation |
100 | % | Webster, TX | Industrial | Business and Commercial Services | South | 48,207 | 482 | 0.52 | % | Fixed | May-2018 | May-2025 | |||||||||||||||||
| Lockheed Martin Corporation |
100 | % | Webster, TX | Industrial | Business and Commercial Services | South | 30,176 | 309 | 0.34 | % | Fixed | Jun-2012 | Jun-2012 | |||||||||||||||||
| Lockheed Martin Corporation |
100 | % | Webster, TX | Warehouse/Distribution | Business and Commercial Services | South | 8,921 | 91 | 0.10 | % | Fixed | Dec-2014 | Dec-2017 | |||||||||||||||||
|
|
|
|
|
|
|
|||||||||||||||||||||||||
| Lockheed Martin Corporation Total |
87,304 | 883 | 0.97 | % | ||||||||||||||||||||||||||
| NVR, Inc. |
100 | % | Thurmont, MD | Industrial | Construction and Building | East | 150,468 | 735 | 0.80 | % | CPI | Apr-2014 | Apr-2039 | |||||||||||||||||
| NVR, Inc. |
100 | % | Farmington, NY | Industrial | Construction and Building | East | 29,273 | 143 | 0.16 | % | CPI | Apr-2014 | Apr-2039 | |||||||||||||||||
|
|
|
|
|
|
|
|||||||||||||||||||||||||
| NVR, Inc. Total |
179,741 | 878 | 0.95 | % | ||||||||||||||||||||||||||
| Swat-Fame, Inc. |
100 | % | City of Industry, CA | Industrial | Textiles, Leather, and Apparel | West | 233,205 | 872 | 0.95 | % | CPI | Jun-2020 | Jun-2020 | |||||||||||||||||
| The SI Organization, Inc. |
100 | % | King of Prussia, PA | Office | Business and Commercial Services | East | 88,578 | 864 | 0.94 | % | Fixed | Jul-2013 | Jul-2023 | |||||||||||||||||
| SymphonyIRI Group, Inc. |
33 | % | Chicago, IL | Office | Business and Commercial Services | Midwest | 53,195 | 791 | 0.86 | % | CPI | Jan-2021 | Jan-2021 | |||||||||||||||||
| United States Postal Service |
100 | % | Bloomingdale, IL | Office | Federal, State and Local Government | Midwest | 60,000 | 698 | 0.76 | % | Fixed | Apr-2016 | Apr-2016 | |||||||||||||||||
| BellSouth Telecommunications, Inc. |
100 | % | Fort Lauderdale, FL | Warehouse/Distribution | Telecommunications | South | 80,450 | 632 | 0.69 | % | Fixed | Jun-2016 | Jun-2021 | |||||||||||||||||
| Childtime Childcare, Inc. |
34 | % | Alhambra, CA | Other | Healthcare, Education and Childcare | West | 2,262 | 58 | 0.06 | % | CPI | Jan-2016 | Jan-2041 | |||||||||||||||||
| Childtime Childcare, Inc. |
34 | % | Tustin, CA | Other | Healthcare, Education and Childcare | West | 2,264 | 57 | 0.06 | % | CPI | Jan-2016 | Jan-2041 | |||||||||||||||||
| Childtime Childcare, Inc. |
34 | % | Canton, MI | Other | Healthcare, Education and Childcare | Midwest | 2,311 | 52 | 0.06 | % | CPI | Jan-2016 | Jan-2041 | |||||||||||||||||
| Childtime Childcare, Inc. |
34 | % | Chino, CA | Other | Healthcare, Education and Childcare | West | 2,166 | 50 | 0.05 | % | CPI | Jan-2016 | Jan-2041 | |||||||||||||||||
| Childtime Childcare, Inc. |
34 | % | Carrollton, TX | Other | Healthcare, Education and Childcare | South | 2,438 | 50 | 0.05 | % | CPI | Jan-2016 | Jan-2041 | |||||||||||||||||
| Childtime Childcare, Inc. |
34 | % | Duncanville, TX | Other | Healthcare, Education and Childcare | South | 2,438 | 50 | 0.05 | % | CPI | Jan-2016 | Jan-2041 | |||||||||||||||||
| Childtime Childcare, Inc. |
34 | % | Lewisville, TX | Other | Healthcare, Education and Childcare | South | 2,440 | 50 | 0.05 | % | CPI | Jan-2016 | Jan-2041 | |||||||||||||||||
W. P. Carey 2011 Supplemental 8-K — 28
| Tenant/Lease Guarantor |
Percent Ownership | Property Location | Property Type | Tenant Industry | Region | Square Footage (e) | Annualized Contractual Minimum Base Rent (in thousands) |
Percentage of Total Rent (e) |
Increase Factor | Lease Expiration | Maximum Term | |||||||||||||||||||
| Childtime Childcare, Inc. |
34 | % | Garden Grove, CA | Other | Healthcare, Education and Childcare | West | 2,848 | 49 | 0.05 | % | CPI | Jan-2016 | Jan-2041 | |||||||||||||||||
| Childtime Childcare, Inc. |
34 | % | Tucson, AZ | Other | Healthcare, Education and Childcare | West | 2,165 | 40 | 0.04 | % | CPI | Jan-2016 | Jan-2041 | |||||||||||||||||
| Childtime Childcare, Inc. |
34 | % | Chandler, AZ | Other | Healthcare, Education and Childcare | West | 2,026 | 38 | 0.04 | % | CPI | Jan-2016 | Jan-2041 | |||||||||||||||||
| Childtime Childcare, Inc. |
34 | % | Westland, MI | Other | Healthcare, Education and Childcare | Midwest | 2,787 | 38 | 0.04 | % | CPI | Jan-2016 | Jan-2041 | |||||||||||||||||
| Childtime Childcare, Inc. |
34 | % | Westland, MI | Other | Healthcare, Education and Childcare | Midwest | 2,472 | 29 | 0.03 | % | CPI | Jan-2016 | Jan-2041 | |||||||||||||||||
|
|
|
|
|
|
|
|||||||||||||||||||||||||
| Childtime Childcare, Inc. Total |
28,617 | 560 | 0.61 | % | ||||||||||||||||||||||||||
| Jada Toys, Inc. |
100 | % | City of Industry, CA | Industrial | Consumer Non-durable Goods | West | 92,595 | 500 | 0.54 | % | Fixed | Apr-2012 | Apr-2017 | |||||||||||||||||
| United Stationers Supply Company |
100 | % | San Antonio, TX | Warehouse/Distribution | Forest Products and Paper | South | 63,098 | 256 | 0.28 | % | CPI | Mar-2014 | Mar-2017 | |||||||||||||||||
| United Stationers Supply Company |
100 | % | New Orleans, LA | Warehouse/Distribution | Forest Products and Paper | South | 59,560 | 241 | 0.26 | % | CPI | Sep-2012 | Sep-2012 | |||||||||||||||||
|
|
|
|
|
|
|
|||||||||||||||||||||||||
| United Stationers Supply Company Total |
122,658 | 497 | 0.54 | % | ||||||||||||||||||||||||||
| Alstom Power |
100 | % | Erlanger, KY | Warehouse/Distribution | Business and Commercial Services | East | 197,400 | 485 | 0.53 | % | Fixed | Jun-2017 | Jun-2020 | |||||||||||||||||
| United Space Alliance, LLC |
100 | % | Webster, TX | Warehouse/Distribution | Business and Commercial Services | South | 36,629 | 211 | 0.22 | % | None | Sep-2013 | Sep-2013 | |||||||||||||||||
| United Space Alliance, LLC |
100 | % | Webster, TX | Warehouse/Distribution | Business and Commercial Services | South | 32,503 | 219 | 0.24 | % | None | Sep-2015 | Sep-2020 | |||||||||||||||||
|
|
|
|
|
|
|
|||||||||||||||||||||||||
| United Space Alliance, LLC |
69,132 | 430 | 0.45 | % | ||||||||||||||||||||||||||
| Pioneer Credit Recovery, Inc. |
100 | % | Moorestown, NJ | Office | Business and Commercial Services | East | 30,000 | 405 | 0.44 | % | Fixed | Apr-2012 | Apr-2018 | |||||||||||||||||
| Kmart Corporation |
100 | % | Drayton Plains, MI | Retail | Retail Trade | Midwest | 103,018 | 210 | 0.23 | % | None | Mar-2016 | Mar-2026 | |||||||||||||||||
| Kmart Corporation |
100 | % | Citrus Heights, CA | Retail | Retail Trade | West | 89,760 | 180 | 0.20 | % | None | May-2016 | May-2026 | |||||||||||||||||
|
|
|
|
|
|
|
|||||||||||||||||||||||||
| Kmart Corporation Total |
192,778 | 390 | 0.42 | % | ||||||||||||||||||||||||||
| Faurecia Exhaust Systems |
100 | % | Toledo, OH | Office | Automobile | Midwest | 61,000 | 387 | 0.42 | % | CPI | Nov-2022 | Nov-2022 | |||||||||||||||||
| S&ME, Inc. |
100 | % | Raleigh, NC | Office | Business and Commercial Services | East | 27,770 | 338 | 0.37 | % | Fixed | Jul-2016 | Jul-2026 | |||||||||||||||||
| Wal-Mart Stores, Inc. |
100 | % | Greenfield, IN | Warehouse/Distribution | Retail Trade | Midwest | 82,620 | 331 | 0.36 | % | None | Jan-2020 | Jan-2025 | |||||||||||||||||
| Richard Design Services, Inc. |
100 | % | Beaumont, TX | Office | Business and Commercial Services | South | 34,300 | 300 | 0.33 | % | Other | Feb-2012 | May-2012 | |||||||||||||||||
W. P. Carey 2011 Supplemental 8-K — 29
| Tenant/Lease Guarantor |
Percent Ownership | Property Location | Property Type | Tenant Industry | Region | Square Footage (e) | Annualized Contractual Minimum Base Rent (in thousands) |
Percentage of Total Rent (e) |
Increase Factor | Lease Expiration | Maximum Term | |||||||||||||||||||
| Tubular Metal Systems |
100 | % | Pinconning, MI | Industrial | Automobile | Midwest | 220,588 | 298 | 0.32 | % | CPI | Jul-2013 | Dec-2022 | |||||||||||||||||
| Groupe SOFEMO |
75 | % | Illkirch-Graffenstaden, France | Office | Business and Commercial Services | Europe | 16,631 | 298 | 0.32 | % | INSEE (b) | Jan-2014 | Jan-2020 | |||||||||||||||||
| Qwest Communications, Inc. |
100 | % | Scottsdale, AZ | Industrial | Telecommunications | West | 2,900 | 178 | 0.19 | % | Fixed | Feb-2012 | Feb-2017 | |||||||||||||||||
| Qwest Communications, Inc. |
100 | % | Scottsdale, AZ | Industrial | Telecommunications | West | 1,560 | 96 | 0.10 | % | Fixed | Feb-2012 | Feb-2017 | |||||||||||||||||
|
|
|
|
|
|
|
|||||||||||||||||||||||||
| Qwest Communications, Inc. Total |
4,460 | 274 | 0.30 | % | ||||||||||||||||||||||||||
| Deloro Satellite Company, Inc. |
100 | % | Goshen, IN | Industrial | Mining, Metals, and Primary Metal Industries |
Midwest | 52,000 | 265 | 0.29 | % | Fixed | Feb-2018 | Feb-2023 | |||||||||||||||||
| Fairpoint Communications, Inc. |
100 | % | Milton, VT | Industrial | Telecommunications | East | 30,624 | 221 | 0.24 | % | Fixed | Feb-2013 | Feb-2013 | |||||||||||||||||
| Lincoln Technical Institute, Inc. |
100 | % | Moorestown, NJ | Office | Healthcare, Education and Childcare | East | 35,567 | 209 | 0.23 | % | Fixed | Apr-2025 | Apr-2025 | |||||||||||||||||
| Multi-Tenant Building |
100 | % | Broomfield, CO | Office | Various | West | 80,692 | 208 | 0.23 | % | Various | Various | Various | |||||||||||||||||
| Continental Airlines, Inc. |
100 | % | Houston, TX | Warehouse/Distribution | Transportation - Personal | South | 25,125 | 207 | 0.22 | % | Fixed | Jul-2013 | Jul-2013 | |||||||||||||||||
| Continental Airlines, Inc. |
100 | % | Houston, TX | Land | Transportation - Personal | South | 1 | — | 0.00 | % | Fixed | Jul-2013 | Jul-2013 | |||||||||||||||||
|
|
|
|
|
|
|
|||||||||||||||||||||||||
| Continental Airlines, Inc. |
25,126 | 207 | 0.22 | % | ||||||||||||||||||||||||||
| Candle Lamp Company, LLC |
100 | % | Memphis, TN | Warehouse/Distribution | Consumer Non-durable Goods | South | 75,000 | 190 | 0.21 | % | CPI | Mar-2014 | Mar-2014 | |||||||||||||||||
| Xerox Corporation |
100 | % | Hot Springs, AR | Retail | Machinery | South | 36,850 | 179 | 0.19 | % | Fixed | Mar-2014 | Mar-2017 | |||||||||||||||||
| USA Self Storage, LLC |
100 | % | Pensacola, FL | Self Storage | Buildings and Real Estate | South | 51,867 | 176 | 0.19 | % | Fixed | Dec-2012 | Dec-2012 | |||||||||||||||||
| SUPINFO International University |
75 | % | Illkirch-Graffenstaden, France | Office | N/A | Europe | 6,999 | 114 | 0.12 | % | None | Mar-2019 | Mar-2019 | |||||||||||||||||
| Golder Associates Inc. |
100 | % | Houston, TX | Office | Business and Commercial Services | South | 8,066 | 56 | 0.06 | % | Fixed | Oct-2017 | Oct-2022 | |||||||||||||||||
| Golder Associates Inc. |
100 | % | Houston, TX | Office | Business and Commercial Services | South | 7,730 | 54 | 0.06 | % | Fixed | Oct-2017 | Oct-2022 | |||||||||||||||||
|
|
|
|
|
|
|
|||||||||||||||||||||||||
| Golder Associates Inc. Total |
15,796 | 110 | 0.12 | % | ||||||||||||||||||||||||||
| Kenyon International Emergency Services |
100 | % | Houston, TX | Warehouse/Distribution | Healthcare, Education and Childcare | South | 17,725 | 96 | 0.10 | % | None | Oct-2014 | Oct-2019 | |||||||||||||||||
W. P. Carey 2011 Supplemental 8-K — 30
| Tenant/Lease Guarantor |
Percent Ownership | Property Location |
Property Type |
Tenant Industry |
Region |
Square Footage (e) | Annualized Contractual Minimum Base Rent (in thousands) |
Percentage of Total Rent (e) |
Increase Factor | Lease Expiration | Maximum Term | |||||||||||||||||||
| Raytheon Company |
100 | % | Webster, TX | Industrial | Business and Commercial Services | South | 9,138 | 91 | 0.10 | % | Fixed | Jul-2012 | Sep-2016 | |||||||||||||||||
| EnGlobal U.S. |
100 | % | Beaumont, TX | Office | N/A | South | 8,580 | 84 | 0.09 | % | N/A | Sep-2014 | Sep-2024 | |||||||||||||||||
| Moran Foods, Inc. |
100 | % | Montgomery, AL | Retail | Beverages, Food, and Tobacco | South | 32,690 | 53 | 0.06 | % | None | Oct-2017 | Oct-2037 | |||||||||||||||||
| Olmsted Kirk Paper Co. |
100 | % | Beaumont, TX | Office | Forest Products and Paper | South | 5,760 | 47 | 0.05 | % | Fixed | Dec-2017 | Dec-2022 | |||||||||||||||||
| SBH Holdings, LLC |
100 | % | Houston, TX | Office | Healthcare, Education and Childcare | South | 5,632 | 45 | 0.05 | % | Fixed | Aug-2013 | Aug-2016 | |||||||||||||||||
| RGIS, LLC |
100 | % | Bloomingdale, IL | Office | Business and Commercial Services | Midwest | 2,550 | 23 | 0.02 | % | Fixed | Nov-2014 | Nov-2014 | |||||||||||||||||
| Knight Security Systems |
100 | % | Houston, TX | Office | Business and Commercial Services | South | 4,456 | 13 | 0.01 | % | Fixed | Jun-2016 | Jun-2021 | |||||||||||||||||
| Classic Cuisines Catering |
100 | % | Bloomingdale, IL | Office | Hotels and Gaming | Midwest | 1,000 | 10 | 0.01 | % | None | Apr-2012 | Apr-2012 | |||||||||||||||||
| Action Buys Cars, Inc. (c) |
100 | % | Montgomery, AL | Retail | Retail Trade | South | 1 | 10 | 0.01 | % | None | MTM | MTM | |||||||||||||||||
| LIVHO, Inc. |
100 | % | Livonia, MI | Hospitality | Hotels and Gaming | Midwest | 158,000 | — | 0.00 | % | Fixed | Jan-2014 | Jan-2014 | |||||||||||||||||
| Google, Inc. |
100 | % | Venice, CA | Office | Telecommunications | West | 67,681 | — | 0.00 | % | Fixed | Oct-2025 | Oct-2035 | |||||||||||||||||
| Juniper Networks, Inc. |
100 | % | Sunnyvale, CA | Industrial | Electronics | West | 50,311 | — | 0.00 | % | Fixed | Nov-2011 | Nov-2021 | |||||||||||||||||
| Common Area (c) |
95 | % | Tours, France | Office | N/A | Europe | 10,655 | — | 0.00 | % | None | Sep-2012 | Sep-2012 | |||||||||||||||||
| Vacant |
100 | % | Charlotte, NC | Industrial | N/A | East | 437,500 | — | — | N/A | N/A | N/A | ||||||||||||||||||
| Vacant |
100 | % | Jacksonville, FL | Warehouse/Distribution | N/A | South | 240,000 | — | — | N/A | N/A | N/A | ||||||||||||||||||
| Vacant |
100 | % | Bridgeton, MO | Office | N/A | Midwest | 78,080 | — | — | N/A | N/A | N/A | ||||||||||||||||||
| Vacant |
100 | % | Bloomingdale, IL | Office | N/A | Midwest | 37,450 | — | — | N/A | N/A | N/A | ||||||||||||||||||
| Vacant |
100 | % | Webster, TX | Warehouse/Distribution | N/A | South | 34,804 | — | — | N/A | N/A | N/A | ||||||||||||||||||
| Vacant |
100 | % | Broomfield, CO | Office | N/A | West | 32,045 | — | — | N/A | N/A | N/A | ||||||||||||||||||
| Vacant |
100 | % | Brewton, AL | Retail | N/A | South | 30,625 | — | — | N/A | N/A | N/A | ||||||||||||||||||
| Vacant |
95 | % | Tours, France | Office | N/A | Europe | 28,284 | — | — | N/A | N/A | N/A | ||||||||||||||||||
| Vacant |
100 | % | Houston, TX | Office | N/A | South | 23,756 | — | — | N/A | N/A | N/A | ||||||||||||||||||
|
|
|
|
|
|
|
|||||||||||||||||||||||||
| Vacant Total |
942,545 | — | — | |||||||||||||||||||||||||||
| Grand Total (d) |
13,446,622 | $ | 92,102 | 100 | % | |||||||||||||||||||||||||
|
|
|
|
|
|
|
|||||||||||||||||||||||||
| (a) | Rents reflect a conversion rate of 1.2950 EUR/USD as of December 31, 2011. |
| (b) | INSEE construction index, an index published quarterly by the French Government. |
| (c) | Tenant is occupying property on a month-to-month (MTM) basis. |
| (d) | Excludes 20 domestic self-storage properties in our Carey Storage subsidiary, totaling approximately 0.5 million square feet (on a pro rata basis). |
| (e) | Numbers may not add due to rounding. |
W. P. Carey 2011 Supplemental 8-K — 31