Attached files
| file | filename |
|---|---|
| 8-K - FORM 8-K - Tower Group International, Ltd. | d307882d8k.htm |
 1.
Fourth Quarter 2011
Earnings Call Presentation
Exhibit 99.1 |
| 1
Forward-Looking Statements
The Private Securities Litigation Reform Act of 1995 provides a "safe
harbor" for forward-looking statements. This presentation and any
other written or oral statements made by or on behalf of Tower may
include forward-looking statements that reflect Tower's current views
with respect to future events and financial performance. All statements
other than statements of historical fact included in this presentation are
forward-looking statements. Forward-looking statements can
generally be identified by the use of forward-looking terminology such as "may," "will," "plan," "expect,"
"project," "intend," "estimate," "anticipate,"
"believe" and "continue" or their negative or variations or similar terminology.
All forward-looking statements address matters that involve risks and
uncertainties. Accordingly, there are or will be important factors that
could cause the actual results of Tower to differ materially from those indicated in these
statements. Please refer to Tower’s filings with the SEC, including
among others Tower’s Annual Report on Form 10-K for the year
ended December 31, 2011 and subsequent filings on Form 10-Q, for a description of the important factors that
could cause the actual results of Tower to differ materially from those
indicated in these statements. Forward-looking statements
speak only as of the date on which they are made, and Tower undertakes
no obligation to update publicly or revise any forward-looking
statement, whether as a result of new information, future developments or otherwise.
Notes on Non-GAAP Financial Measures
Operating income excludes realized gains and losses, acquisition-related
transaction costs and the results of the reciprocal business, net of
tax. This is a common measurement for property and casualty insurance companies. We
believe this presentation enhances the understanding of our results of
operations by highlighting the underlying profitability of our insurance
business. Additionally, these measures are a key internal management performance
standard. Operating earnings per share is operating income divided by diluted
weighted average shares outstanding. Operating return on equity is
annualized operating income divided by average common stockholders' equity.
Total premiums include gross premiums written through our insurance
subsidiaries and produced as managing general agent on behalf of other
insurance companies, including the reciprocal exchanges. Other Notes
In October 2010, the Financial Accounting Standards Board issued
new guidance concerning the accounting for costs
associated with acquiring or renewing insurance contracts. Under the new
guidance, only direct incremental costs associated with successful
insurance contract acquisitions or renewals are deferrable. We have adopted this guidance
early, effective January 1, 2011, and have retrospectively adjusted our
previously issued financial information. Adoption of this guidance
reduced the carrying value of our deferred acquisition costs as of December 31, 2010, by $78.7 million
and Tower Group, Inc. stockholders’
equity by $42.6 million. Diluted earnings per share for the fourth quarter
2010 were reduced by $0.04 per share as a result of this change in
accounting. |
 2
Fourth Quarter and 2011 Snapshot
Fourth Quarter:
•
Operating earnings of $25.0 million in Q4, on track with original 2011
assumptions
•
Positive market trends becoming more pronounced in fourth quarter
2011:
•
Strong operating results despite storm losses
»
Excluding
Irene
and
other
severe
storm
losses,
the
core
business
remains
strong with a full year combined ratio of 95.2% and 9.8% operating ROE
•
Premium growth driven organically
»
Developed a comprehensive strategy to generate organic growth to
supplement external growth through selective acquisitions and strategic
investments
»
Two newly created business units generated $158 million GPW in 2011
•
Made significant progress towards completion of key technology and integration
projects
»
Anticipate new personal lines rollout in first half of 2012
|
 3
2011 and 4Q11 Highlights
Excluding the effect of storm losses, operating earnings would have been $104.3
million in 2011 compared to $109.2 million in 2010
Excluding the effect of storm losses, operating EPS would have been $2.55 in
2011 compared to $2.50 in 2010
33.3
25.0
56.0
104.3
48.3
4Q10
4Q11
2011
Storms
Operating Earnings ($ millions)
33.3
33.3
0.80
0.63
1.37
2.55
1.18
4Q10
4Q11
2011
Storms
Operating EPS ($)
33.3
33.3
33.3
33.3
33.3
33.3
Pro -
Forma
2011
Pro -
Forma
2011
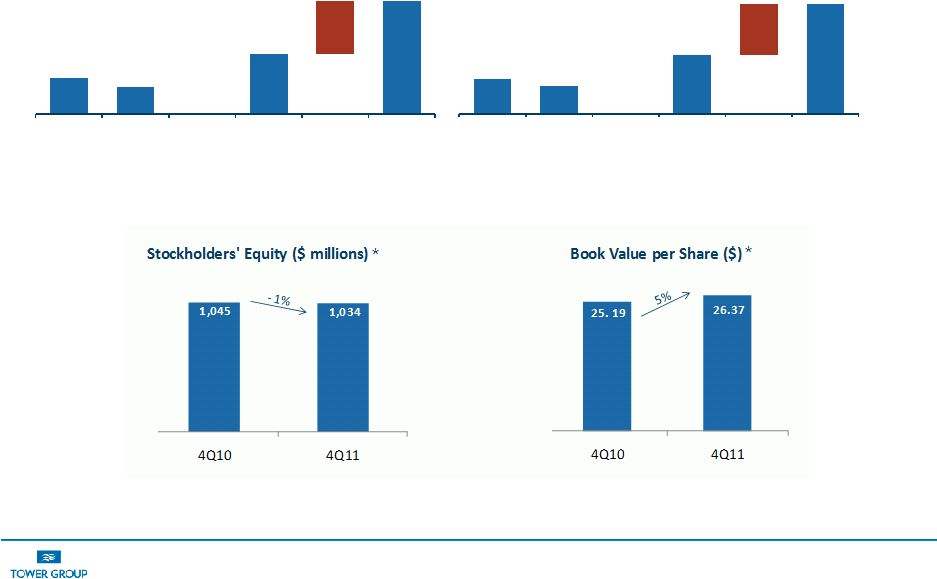
*
Tower has repurchased $64.6 million of its common
stock (2.9 million shares) and has paid $0.69 per share ($28 million) in dividends since 4Q 2010 . |
 4
2011 and 4Q11 Highlights
Organic growth of 6% in 4Q11 was offset by $23 million commutation of assumed
reinsurance treaty
Excluding the effect of storm losses, operating ROE would have been 9.8%
in 2011 and 10.4% in 2010.
Excluding the effect of storm losses , Combined Ratio Excluding the
Reciprocals would have been 95.5% in 2011 and
93.9% in 2010.
|
 5
Organic Growth Initiative
Expand Products
Broaden product lines in profitable niche markets
Develop new products for targeted customers and markets
Leverage products through nationwide distribution to new customer groups
Develop Entrepreneurial Businesses
Transform existing businesses into self-sufficient operating units
Establish new business units to expand into new products and markets
»
Customized solutions and assumed reinsurance generated GPW of $20 million in
the 4 th
quarter and $158 million in 2011.
Acquire high-caliber underwriting talent
Improve Growth-Related Business Functions
Create new department to research, identify and analyze profitable growth
opportunities Improve product development capabilities
Enhance corporate marketing and communications
Redesign business development function to better understand and meet producer
needs Build independent customer service department to ensure
customer satisfaction |
 6
Business Segment Results
Commercial
Personal
Insurance
General
Specialty
Services
Business Units / Products
Small business;
Middle market
National Programs, E&S,
Customized Solutions,
Transportation and
Assumed Reinsurance
Homeowners and
private passenger
auto
4Q11 GPW ($ millions)
$168.8
$110.9
$154.6
$7.9*
4Q10 GPW ($ millions)
158.7
118.7
156.5
10.1*
4Q11 % of total GPW
39%
25%
36%
n/a
Commercial Consolidated
Loss Ratio
65.1%
64.4%
n/a
Expense Ratio
30.2%
40.3%
n/a
Combined Ratio
95.3%
104.7%
n/a
Retention
78%
91%
n/a
Renewal Premium Change
2.2%
2.5%
n/a
Segment
Summary
* Total revenue for the segment
Expanding small
workers
compensation
business
Seeing signs of
pricing improvement
in the middle
market business
Focus on expanding
relationships with
MGA’s writing
specialty business
Customized
solutions and
assumed
reinsurance
generating organic
growth
Focus on reducing
expenses by
replacing OBPL
systems; rollout of
the new personal
lines system in 1st
half of 2012
Expanding licensing
to expand writings
in other states and
thereby increasing
fee income |
 7
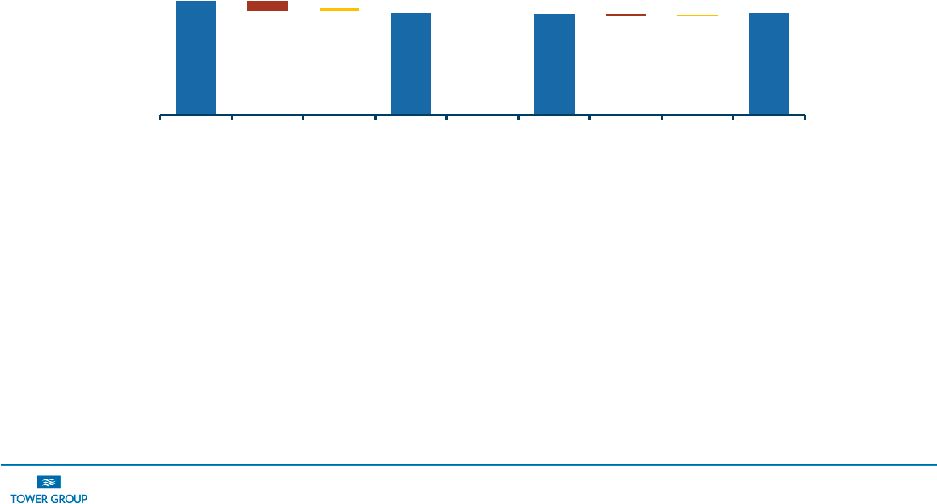
Net Loss and Loss Expense Ratio, Excluding Reciprocals
•
2011 net adverse development of $17.0 million at Tower stock companies
was primarily from development on discontinued programs
60.2
59.0
-5.3
-1.26
-1.4
0.2
2011
Storms
Dev.
Pro -
Forma
2011
2010
Storms
Dev.
67.6
61.1
Pro -
Forma
2010
Full Year Loss Ratio (%)
2011
2010 |
 8
Declining Expense Ratio
Increase in premium volume is creating scale advantages for Tower
As systems initiatives relating to personal lines are completed,
we expect this scale advantage
to increase |
 9
Improving Investment Performance
Strategy
•
Alternative investment commitment remains modest but should provide higher
yield and diversification from interest rate risk inherent in
fixed-income investments, and reduce capital markets
volatility •
Operating cash flows also invested in opportunistic repurchases of Tower
common stock since March 2010
Examples of Alternative Investments
•
Private equity type investments in small real estate projects
•
Minority ownership in distribution partners that have a strategic fit with
Tower $2,615
$2,701
12-31-2010
12-31-2011
Cash and Invested Assets
($millions)
4.7
4.6
4.8
6-30-2011
9-30-2011
12-31-2011
Tax-
Equivalent Fixed Income
Yield (%)
$106
$128
YTD 2010
YTD 2011
Net Investment Income
($millions) |
 10
Positive Trends and Guidance
($ in millions)
2010*
2011*
2012 Target*
Trend
beyond 2012
Annual GPW Growth
38.2%
21.0%
5% -
10%
Organic growth of 5% to 10% excluding growth from acquisitions
Loss Ratio
58.8%
62.3%
62% -
63%
Loss ratio has stabilized close to 62% to 63% range
Expense Ratio
35.1%
33.2%
33.5% -
34.5%
Expected decrease due to improved scale, automation and
lower acquisition cost
Combined Ratio
93.9%
95.5%
96% -
98%
Future improvement will be driven primarily by expense ratio
savings from improved scale.
Investment Yield
4.7%
4.8%
4.7% -
5.0%
Continued growth in invested assets with yield stabilization due
to alternative and strategic investments
Operating ROE & 2012
Guidance
10.4%
9.9%
9% -
10%
$2.60 -
$2.70
Expect to see ROE’s below 10% in first half of 2012, with
improvements to 10%-12% range occurring in second half of
year and continuing beyond year end 2012.
*Excludes reciprocals and impact of Severe Weather Related Losses;
|