Attached files
| file | filename |
|---|---|
| EX-32.2 - SECTION 906 CFO CERTIFICATION - HEARTLAND PAYMENT SYSTEMS INC | hpyexhibit32210k2011.htm |
| EX-31.2 - SECTION 302 CFO CERTIFICATION - HEARTLAND PAYMENT SYSTEMS INC | hpyexhibit31210k2011.htm |
| EX-23.1 - CONSENT OF DELOITTE & TOUCHE LLP - HEARTLAND PAYMENT SYSTEMS INC | hpyexhibit23110k2011.htm |
| EX-31.1 - SECTION 302 CEO CERTIFICATION - HEARTLAND PAYMENT SYSTEMS INC | hpyexhibit31110k2011.htm |
| EX-32.1 - SECTION 906 CEO CERTIFICATION - HEARTLAND PAYMENT SYSTEMS INC | hpyexhibit32110k2011.htm |
| EX-21.1 - LIST OF SUBSIDIARIES OF REGISTRANT - HEARTLAND PAYMENT SYSTEMS INC | hpyexhibit21110k2011.htm |
| EX-10.74 - TIME VESTED RSU AWARD AGREEMENT - HEARTLAND PAYMENT SYSTEMS INC | hpyexhibit1074timevestingr.htm |
| EX-10.75 - PERFORMANCE BASED RSU AWARD AGREEMENT - HEARTLAND PAYMENT SYSTEMS INC | hpyexhibit1075performancer.htm |
UNITED STATES
SECURITIES AND EXCHANGE COMMISSION
WASHINGTON, D.C. 20549
__________________________________
FORM 10-K
__________________________________
(Mark One)
x | ANNUAL REPORT PURSUANT TO SECTION 13 OR 15(d) OF THE SECURITIES EXCHANGE ACT OF 1934 |
For the fiscal year ended December 31, 2011
OR
o | TRANSITION REPORT PURSUANT TO SECTION 13 OR 15(d) OF THE SECURITIES EXCHANGE ACT OF 1934 |
For the transition period from to
Commission File No. 001-32594
______________________________________________

HEARTLAND PAYMENT SYSTEMS, INC.
(Exact name of registrant as specified in its charter)
Delaware | 22-3755714 | |
(State or other jurisdiction of incorporation or organization) | (I.R.S. Employer Identification Number) | |
90 Nassau Street, Princeton, New Jersey 08542
(Address of principal executive offices) (Zip Code)
(609) 683-3831
(Registrant’s telephone number, including area code)
____________________________________________________________
Title of each class | Name of each exchange on which registered | |
Common Stock, $0.001 par value | New York Stock Exchange | |
(NONE) | ||
(title of Class) | ||
Indicate by check mark if the registrant is a well-known seasoned issuer, as defined in Rule 405 of the Securities Act. o YES x NO
Indicate by check mark if the registrant is not required to file reports pursuant to Section 13 or Section 15(d) of the Act. o YES x NO
Indicate by check mark whether the registrant (1) has filed all reports required to be filed by Section 13 or 15(d) of the Securities Exchange Act of 1934 during the preceding 12 months (or for such shorter period that the registrant was required to file such reports), and (2) has been subject to such filing requirements for the past 90 days. x YES o NO
Indicate by check mark whether the registrant has submitted electronically and posted on its corporate Web site, if any,
every Interactive Data File required to be submitted and posted pursuant to Rule 405 of Regulation S-T (§232.405 of this chapter) during the preceding 12 months (or for such shorter period that the registrant was required to submit and post such files). x YES o NO
Indicate by check mark if disclosure of delinquent filer pursuant to Item 405 of Regulation S-K is not contained herein, and will not be contained, to the best of registrant's knowledge, in definitive proxy or information statements incorporated by reference in Part III of this Form 10-K or any amendment to this Form 10-K. [ ]
Indicate by check mark whether the registrant is a large accelerated filer, an accelerated filer, a non-accelerated filer, or a smaller reporting company. See definitions of “large accelerated filer,” “accelerated filer,” and “smaller reporting company” in Rule 12b-2 of the Exchange Act. (Check one):
Large accelerated filer | x | Accelerated filer | o | |||
Non-accelerated filer | o (Do not check if a smaller reporting company) | Smaller reporting company | o | |||
Indicate by check mark whether the registrant is a shell company (as defined in Rule 12b-2 of the Exchange Act). o YES x NO
The aggregate market value of the voting and non-voting common stock held by non-affiliates computed by reference to the price at which the common stock was last sold on the New York Stock Exchange on June 30, 2011 was approximately $775 million.
As of February 24, 2012, there were 38,901,939 shares of the registrant’s Common Stock, $0.001 par value, outstanding.
DOCUMENTS INCORPORATED BY REFERENCE
Specifically identified portions of the registrant's definitive proxy statement to be filed with the Securities and Exchange Commission pursuant to Regulation 14A in connection with the 2012 annual meeting of shareholders are incorporated by reference into Part III of this Annual Report on Form 10-K for fiscal year ended December 31, 2011.
Heartland Payment Systems, Inc.
Annual Report on Form 10-K
For the Year Ended December 31, 2011
TABLE OF CONTENTS
Page | ||
Item 1. | ||
Item 1A. | ||
Item 1B. | ||
Item 2. | ||
Item 3. | ||
Item 4. | MINE SAFETY DISCLOSURES | |
Item 5. | ||
Item 6. | ||
Item 7. | ||
Item 7A. | ||
Item 8. | ||
Item 9. | ||
Item 9A. | ||
Item 9B. | ||
Item 10. | ||
Item 11. | ||
Item 12. | ||
Item 13. | ||
Item 14. | ||
Item 15. | ||
FORWARD LOOKING STATEMENTS
Unless the context requires otherwise, references in this report to “the Company,” “we,” “us,” and “our” refer to
Heartland Payment Systems, Inc. and our subsidiaries.
Some of the information in this Annual Report on Form 10-K may contain forward‑looking statements that are based on our management's beliefs and assumptions and on information currently available to our management. Forward-looking statements include the information concerning our possible or assumed future results of operations, business strategies, financing plans, competitive position, industry environment, potential growth opportunities, the effects of future regulation and the effects of competition. Forward-looking statements include all statements that are not historical facts and can be identified by the use of forward-looking terminology such as the words “believe,” “expect,” “anticipate,” “intend,” “plan,” “estimate” or similar expressions.
Forward-looking statements involve risks, uncertainties and assumptions. Actual results may differ materially from those expressed in the forward-looking statements. You should understand that many important factors, in addition to those discussed elsewhere in this report, could cause our results to differ materially from those expressed in the forward-looking statements. Certain of these factors are described in Item 1A. Risk Factors and include, without limitation, our competitive environment, the business cycles and credit risks of our merchants, chargeback liability, merchant attrition, problems with our bank sponsor, our relationships with third-party bankcard payment processors, our inability to pass increased interchange fees along to our merchants, economic conditions, systems failures and government regulation.
PART I
ITEM 1. BUSINESS
Overview of Our Company
We were incorporated in Delaware in June 2000. Our headquarters are located at 90 Nassau Street, Princeton, NJ 08542, and our telephone number is (609) 683-3831.
Our primary business is to provide bankcard payment processing services to merchants in the United States and Canada. This involves facilitating the exchange of information and funds between merchants and cardholders' financial institutions, providing end-to-end electronic payment processing services to merchants, including merchant set-up and training, transaction authorization and electronic draft capture, clearing and settlement, merchant accounting, merchant assistance and support and risk management. Our merchant customers primarily fall into two categories; our core small and mid-sized merchants (referred to as "Small and Midsized Enterprises," or “SME merchants”) and Network Services' large national and mid-tier merchants, primarily in the petroleum industry (referred to as “Network Services Merchants”). We also provide additional services to our merchants, such as payroll processing, gift and loyalty programs, prepaid and stored-value solutions, and we sell and rent point-of-sale devices and supplies. In addition, we provide closed and open-loop payment solutions, and other transactional services to the college market, and in the past twelve months, we added K to 12 School Solutions, including school nutrition and point-of-sale solutions.
Bankcard Payment Processing
At December 31, 2011, we provided bankcard payment processing services to 171,801 active SME bankcard merchants located across the United States. This compares to 173,860 active SME bankcard merchants at December 31, 2010. At December 31, 2011, we provided bankcard payment processing services to 179 Network Services Merchants with approximately 54,826 locations. Our total bankcard processing volume for the year ended December 31, 2011 was $83.7 billion, an 11.7% increase from the $74.9 billion processed during the year ended December 31, 2010. Our 2011 SME bankcard processing volume was $67.5 billion, a 7.0% increase over $63.1 billion in 2010. Bankcard processing volume for 2011 includes $15.5 billion of settled volume for Network Services Merchants, compared to $11.3 billion for 2010. In addition to settling Visa and MasterCard transactions, Network Services processes a wide range of payment transactions for its predominantly petroleum customer base, including providing 2.7 billion transaction authorizations through its front-end card processing systems (primarily for Visa and MasterCard) in 2011 and 2.6 billion such transactions for the year ended December 31, 2010. We also provided bankcard processing services to approximately 10,287 merchants in Canada through our majority-owned Canadian subsidiary, Collective Point of Sale Solutions Ltd. (“CPOS”).
According to The Nilson Report, in 2010 we were the 5th largest card acquirer in the United States ranked by transaction count and the 8th largest acquirer by processed dollar volume, which consists of both credit and debit Visa and MasterCard transactions. These rankings represented 2.6 billion transactions and 4% of the total bankcard processing market, respectively. In 2011, 2010 and 2009, our bankcard processing dollar volume was $83.7 billion, $74.9 billion and $69.3 billion, respectively.
Our bankcard processing revenue from SME merchants is recurring in nature. We typically enter into three-year service contracts with our SME merchants that, in order to qualify for the agreed-upon pricing, require the achievement of agreed bankcard processing volume minimums from our merchants. Our SME gross bankcard processing revenue is driven by cardholders making purchases at our SME merchants using mostly Visa and MasterCard credit and signature-debit cards, but also American Express and Discover PIN debit cards. In December 2007, we signed a sales and servicing program agreement (“OnePoint”) with American Express Travel Related Services Company, Inc. (referred to as “American Express”) under which we sign up and service new merchants on behalf of American Express. In June 2008, we signed an agreement with DFS Services, LLC (referred to as “Discover”) to offer bankcard merchants a streamlined process that enables them to accept Discover Network cards on our processing platform.
We generally benefit from consumers' increasing use of bankcards in place of cash and checks, and sales growth (if any) experienced by our retained SME merchants. Most of our SME revenue is from gross processing fees, which are primarily a combination of a percentage of the dollar amount of each card transaction we process plus a flat fee per transaction. We make mandatory payments of interchange fees to card issuing banks through card networks and dues, assessments and transaction authorization fees to Visa, MasterCard and Discover, and we retain the remainder as net revenue. For example, in a transaction using a Visa or MasterCard credit card, the allocation of funds resulting from a $100 transaction is depicted below.
1

Our bankcard processing revenue from our Network Services Merchants is also recurring in nature. We typically enter into five-year contracts with our large national merchants and three year contracts with our mid-tier merchants. However, in contrast to SME merchants, our processing revenues from Network Services Merchants generally consist of a flat fee per transaction and thus revenues are driven primarily by the number of transactions we process (whether settled, or only authorized), not bankcard processing volume.
We sell and market our SME bankcard payment processing services through a nationwide direct sales force of 790 Relationship Managers and Territory Managers. We focus our sales efforts on low-risk bankcard merchants and have developed systems and procedures designed to minimize our exposure to potential merchant losses. In 2011, 2010 and 2009, we experienced merchant losses in amounts equal to 0.76 basis points (0.0076%), 1.44 basis points (0.0144%) and 1.01 basis points (0.0101%) of SME bankcard processing volume, respectively. The relatively higher loss rates in 2009 and 2010 tracked with overall deteriorating economic conditions in those years, which contributed to increased incidences of merchant fraud. We attribute the improved merchant loss rate in 2011 to the combination of a stronger economy and our improved credit monitoring. We have developed significant expertise in industries that we believe present relatively low risks as the customers are generally present and the products or services are generally delivered at the time the transaction is processed. These industries include restaurants, brick and mortar retailers, convenience and liquor stores, automotive sales, repair shops and gas stations, professional service providers, lodging establishments and others. As of December 31, 2011, approximately 26.3% of our SME bankcard merchants were restaurants, approximately 19.0% were brick and mortar retailers, approximately 11.5% were convenience and liquor stores, approximately 7.8% were automotive sales and repair shops, approximately 10.4% were professional service providers, approximately 3.4% were lodging establishments, and approximately 1.5% were gas stations.
We have developed a number of proprietary payment processing systems to increase our operating efficiencies and distribute our processing and merchant data to our three main constituencies: our merchant base, our sales force and our customer service staff. We provide authorization and data capture services to our SME merchants through our own front-end processing system, which we call HPS Exchange. We provide clearing, settlement and merchant accounting services through our own internally developed back-end processing system, which we call Passport. Our control over our front-end and back-end systems enables us to more effectively customize these services to the needs of our Relationship Managers and merchants. At December 31, 2011, our internally developed systems are providing substantially all aspects of a merchant's processing needs for most of our SME merchants. At December 31, 2011, our internal systems are providing all aspects of our Network Services Merchants' processing needs.
In addition to our core processing platforms, we are constantly innovating and developing new technologies to provide state-of-the-art payments solutions. Our End-to-End Encryption solution (known as E3™) was launched in May 2010 to protect sensitive card data as it moves through the merchant's network and our platforms, resulting in a more secure payments network. Approximately 20,000 small and mid-sized business owners across the country are now using E3-enabled terminals to protect their businesses and their customers.
In 2011, we launched our next generation of sales productivity tools we call atlas. atlas is revolutionizing the way our Relationship Managers interact with merchants by using mobile tablets to reduce paperwork, analyze pricing, and manage sales opportunities.
2
Payroll Processing Services
Through our wholly-owned subsidiary, Heartland Payroll Company, we operate a full-service nationwide payroll processing service, including check printing, direct deposit, related federal, state and local tax deposits and providing accounting documentation. We developed a new comprehensive payroll management system, which we refer to as PlusOne Payroll, that streamlines all aspects of the payroll process to enable time and cost savings. PlusOne Payroll was made available to new and existing customers beginning in 2010, and during 2011 we fully converted our existing payroll customers to PlusOne Payroll.
At December 31, 2011, 2010 and 2009, we processed payroll for 11,841, 11,131 and 9,382 customers, respectively. Our nationwide direct sales force sells our payroll processing services solely on a commission basis. In 2011, 2010 and 2009, we installed 3,723, 4,858 and 4,303 new payroll processing customers, respectively.
Other Products and Services
Other products and services which we offer, such as K to 12 School Solutions, Micropayment, Campus Solutions, and Loyalty and Heartland Gift Marketing, are discussed in “—Our Services and Products.”
Processing System Intrusion
On January 20, 2009, the we publicly announced the discovery of a criminal breach of our payment systems environment (the “Processing System Intrusion”). The Processing System Intrusion involved malicious software that appears to have been used to collect in-transit, unencrypted payment card data while it was being processed by us during the transaction authorization process. We believe the breach has been contained and did not extend beyond 2008.
Since our announcement of the Processing System Intrusion on January 20, 2009 and through December 31, 2011, we have expensed a total of $147.1 million, before reducing those charges by $31.2 million of total insurance recoveries. The majority of the total charges, or approximately $114.7 million, related to settlements of claims. Approximately $32.4 million of the total charges were for legal fees and costs we incurred for investigations, defending various claims and actions, remedial actions and crisis management services.
The following table summarizes our Provision for Processing System Intrusion, which we recorded for settlement accruals, legal fees and costs we incurred for defending various claims and actions associated with the Processing System Intrusion, and amounts we recovered from our insurance providers for the years ended December 31, 2011, 2010 and 2009:
Year Ended December 31, | ||||||||||||
2011 | 2010 | 2009 | ||||||||||
(in millions, except per share data) | ||||||||||||
(Charges) for settlement accruals, legal fees and costs | $ | (1.0 | ) | $ | (13.1 | ) | $ | (132.9 | ) | |||
Insurance recoveries | — | 27.2 | 4.0 | |||||||||
(Provision for) recovery of processing system intrusion costs | $ | (1.0 | ) | $ | 14.1 | $ | (128.9 | ) | ||||
Per share | $ | (0.02 | ) | $ | 0.22 | $ | (2.16 | ) | ||||
During the year ended December 31, 2010, we settled the following claims and disputes related to the Processing System Intrusion:
• | On January 7, 2010, we entered into a settlement agreement with Heartland Bank, KeyBank National Association (“KeyBank,” and, together with Heartland Bank, the “Sponsor Banks”), and Visa U.S.A. Inc., Visa International Service Association and Visa Inc. (collectively, “Visa”) to resolve potential claims and other disputes among us, the Sponsor Banks and Visa with respect to the potential rights and claims of Visa and certain issuers of Visa-branded credit and debit cards related to the Processing System Intrusion (the “Visa Settlement Agreement”). After including a $780,000 credit for fines previously collected by Visa during 2009, the amount we paid under the Visa Settlement Agreement was $59.3 million. The costs of this settlement were included in our Provision for Processing System Intrusion on our Consolidated Statement of Operations for the year ended December 31, 2009 and in our Reserve for Processing System Intrusion on our Consolidated Balance Sheet as of December 31, 2009. Financial institutions representing more than 97 percent of eligible Visa-branded credit and debit cards have accepted the offers they received pursuant to the settlement entered into between and among the us, Visa, and the Sponsor Banks. |
3
On February 18, 2010, we entered into a bridge loan agreement (the “Bridge Loan Agreement”) with KeyBank, as administrative agent, and KeyBank and Heartland Bank as bridge lenders. On that date, KeyBank made a bridge loan to us in the amount of $20.0 million and Heartland Bank made a bridge loan in the amount of $8.0 million (collectively, the “Bridge Loan”). See Note 11, Credit Facilities for additional terms of the Bridge Loan.
On February 18, 2010, we also entered into a Commitment Increase Agreement pursuant to the Amended and Restated Credit Agreement dated as of May 30, 2008 (the “Commitment Increase Agreement”) whereby KeyBank, as one of the lenders under the Amended and Restated Credit Agreement, agreed to increase our revolving credit commitment to us under the Amended and Restated Credit Agreement by $25.0 million (the “Increased Credit Commitment”). See Note 11, Credit Facilities for additional terms of the Commitment Increase Agreement.
The proceeds of the Bridge Loan and the Increased Credit Commitment, together with a portion of our cash reserves, were used to fund the settlement with Visa. The Visa Settlement Agreement was consummated on February 18, 2010, with a payment of $58.6 million.
• | On May 19, 2010, we entered into a settlement agreement with MasterCard Worldwide (“MasterCard”) to resolve potential claims and other disputes among us, the Sponsor Banks and MasterCard related to the Processing System Intrusion (the “MasterCard Settlement Agreement”). Under the MasterCard Settlement Agreement, alternative recovery offers totaling $41.4 million were made to eligible MasterCard issuers with respect to losses alleged to have been incurred by them as a result of the Processing System Intrusion. The $41.4 million included a $6.6 million credit for fines previously collected by MasterCard during 2009, so the maximum amount payable under the settlement was $34.8 million if all MasterCard issuers had accepted the settlement. On September 3, 2010 and September 14, 2010, we paid approximately $34.4 million because certain issuers did not accept settlement. Those issuers, who represent less than 1% of the accounts eligible for the settlement, have been preliminarily awarded $367,172 by MasterCard, and we are contesting that award. |
• | On August 31, 2010, we entered into an agreement of settlement and release with DFS Services, LLC ("Discover") to resolve potential claims and other disputes among us and Discover (and its affiliates and certain of its issuers) with respect to the Processing System Intrusion (the “Discover Settlement Agreement”). On September 2, 2010, we paid Discover $5.0 million in full and final satisfaction of any and all claims of Discover, its affiliates and certain of its issuers arising from or relating to the Processing System Intrusion. The Discover Settlement Agreement contains mutual releases by and between us and Discover (on behalf of itself and its affiliates) relating to the Processing System Intrusion. |
During the year ended December 31, 2009, we settled the following claims and disputes related to the Processing System Intrusion:
• | On December 17, 2009, we entered into a settlement agreement and release with American Express to resolve potential claims and other disputes among us and American Express (and its issuers) with respect to the Processing System Intrusion, and subsequently we paid approximately $3.5 million in full and final satisfaction of any and all claims of American Express and its issuers arising from or relating to the Processing System Intrusion (the "AMEX Settlement Agreement"). The AMEX Settlement Agreement contains mutual releases by and between us and American Express (on behalf of itself and its issuers) relating to the Processing System Intrusion. |
These settlement amounts were previously provided for in our Provision for Processing System Intrusion and carried in our Reserve for Processing System Intrusion. We do not consider it a reasonable possibility that losses exceeding the amounts already recognized on the matters subject to the settlement agreements will be incurred. With regard to the unsettled claims related to the Processing System Intrusion, which we describe in “—Item 3 Legal Proceedings,” we determined material losses in addition to those previously accrued are not considered reasonably possible on any such claim disclosed. We are prepared to vigorously defend ourselves against any unsettled claims relating to the Processing System Intrusion that have been asserted against us and our Sponsor Banks to date. We feel we have strong defenses to all the claims that have been asserted against us and our Sponsor Banks relating to the Processing System Intrusion.
Additional costs we expect to incur for legal fees and costs for defending the unsettled claims and actions associated with the Processing System Intrusion will be recognized as incurred. Such costs are not expected to be material to our results of operations, financial condition and cash flow.
4
Payment Processing Industry Overview
The payment processing industry provides merchants with credit, debit, gift and loyalty card and other payment processing services, along with related information services. The industry continues to grow as a result of wider merchant acceptance, increased consumer use of bankcards and advances in payment processing and telecommunications technology. According to The Nilson Report, total expenditures for all card type transactions by U.S. consumers were $3.3 trillion in 2010, and are expected to grow to $5.2 trillion by 2015, representing a compound annual growth rate of 9.9%. The proliferation of bankcards has made the acceptance of bankcard payments a virtual necessity for many businesses, regardless of size, in order to remain competitive. This use of bankcards, enhanced technology initiatives, efficiencies derived from economies of scale and the availability of more sophisticated products and services to all market segments has led to a highly competitive and specialized industry.
Segmentation of Merchant Service Providers
The payment processing industry is dominated by a small number of large, fully-integrated payment processors that sell directly to, and handle the processing needs of, the nation's largest merchants. Large national merchants (i.e., those with multiple locations and high volumes of bankcard transactions) typically demand and receive the full range of payment processing services at low per-transaction costs.
Payment processing services are generally sold to the SME merchant market segment through banks and Independent Sales Organizations that generally procure most of the payment processing services they offer from large payment processors. It is difficult, however, for banks and Independent Sales Organizations to customize payment processing services for the SME merchant on a cost-effective basis or to provide sophisticated value-added services. Accordingly, services to the SME merchant market segment historically have been characterized by basic payment processing without the availability of the more customized and sophisticated processing, information-based services or customer service that is offered to large merchants. The continued growth in bankcard transactions is expected to cause SME merchants to increasingly value sophisticated payment processing and information services similar to those provided to large merchants.
The following table sets forth the typical range of services provided directly (in contrast to using outsourced providers) by fully integrated transaction processors, traditional Independent Sales Organizations and us.
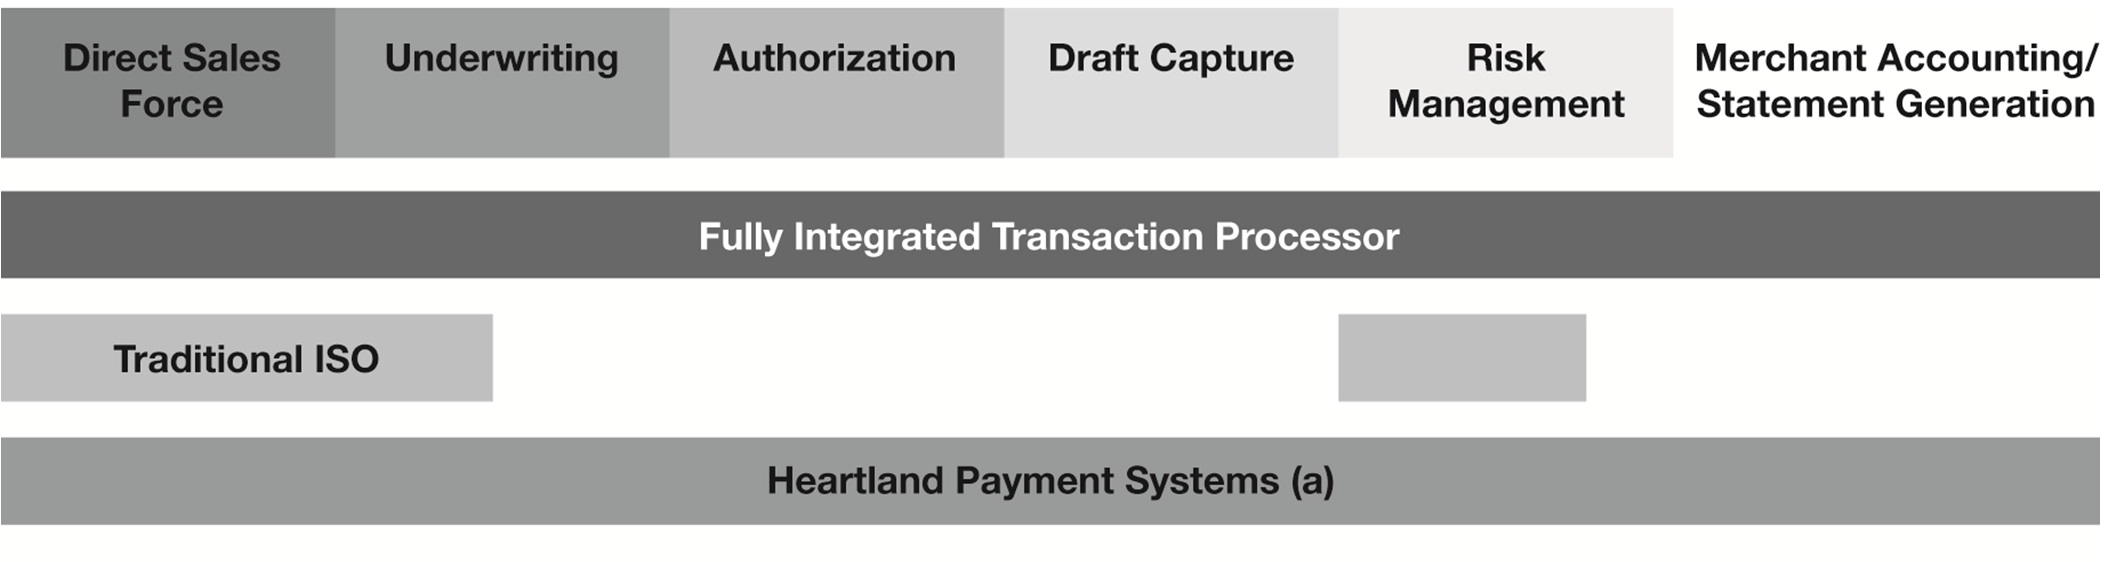
(a) HPS Exchange: 93% of our SME merchant bankcard transactions
Passport: 99% of our SME merchants
We believe that the card-based payment processing industry will continue to benefit from the following trends:
Growth in Card Transactions
The proliferation in the uses and types of cards, including in particular debit and prepaid cards, the rapid growth of the Internet, significant technological advances in payment processing and financial incentives offered by issuers have contributed greatly to wider merchant acceptance and increased consumer use of such cards.
Technology
At present, many large payment processors provide customer service and applications via legacy systems that are difficult and costly to alter or otherwise customize. In contrast to these systems, recent advances in mobile and cloud computing provide payment processors with the opportunity to deploy less costly technology that has improved flexibility and
5
responsiveness. In addition, the dramatic increase in merchants' use of the Internet to process their transactions further enhances the ability of payment processors to provide faster and more reliable service at lower per-transaction costs than previously possible.
Advances in personal computers, mobile technology, and point-of-sale terminal technology, including integrated cash registers and networked systems, have increasingly allowed access to a greater array of sophisticated services at the point of sale and have contributed to the demand for such services. These trends have created the opportunity for payment processors to leverage technology by developing business management and other software application products and services.
Our Competitive Strengths
We believe our competitive strengths related to Bankcard Payment Processing, particularly SME, include the following:
Large, Experienced, Efficient, Direct Sales Force
We sell and market our SME bankcard payment processing services through a nationwide direct sales force of 790 Relationship Managers and Territory Managers who work exclusively for us. Many of our competitors rely on Independent Sales Organizations that often generate merchant accounts for multiple payment processing companies simultaneously. Our sales professionals have local merchant relationships and industry-specific knowledge that allow them to effectively compete for merchants; these relationships are also supported by our 114 Account Managers, who are focused on installing new merchants and responding to any ongoing servicing needs. We compensate our sales force primarily through commissions, which are based upon the performance of their SME merchant accounts. Our sales professionals have considerable latitude in pricing a new account, but we believe that the shared economics motivate them to sign attractively priced contracts with SME merchants generating significant bankcard processing volume. The residual commissions our sales force receives from their SME merchant accounts give them an incentive to maintain a continuing dialogue and servicing presence with their SME merchants. We believe that our compensation structure is atypical in our industry and contributes to building profitable, long-term relationships with our SME merchants. In 2011, our sales force generated approximately 44,960 SME bankcard merchant applications and installed approximately 39,700 new SME bankcard merchants.
Recurring and Predictable Revenue
We generate recurring revenue through our payment processing services. Our revenue is recurring in nature because we typically enter into multi-year service contracts with our SME and Network Services Merchants. Our recurring revenue grows as the number of transactions or dollar volume processed for an SME merchant increases or as we add new SME merchants. In 2011, approximately 92% of our SME bankcard processing volume came from merchants we installed in 2010 and earlier.
Internal Growth
We grew our SME payment processing business exclusively through internal expansion by generating new SME merchant contracts submitted by our own direct sales force. Substantially all of our SME merchants were originally underwritten by our staff, and we have substantial experience responding to the SME merchants' processing needs and the risks associated with them. We believe this practice both enhances our SME merchant retention and reduces our risks. We believe that internally generated SME merchant contracts generally are of a higher quality and are more predictable than contracts acquired from third parties, and the costs associated with such contracts generally are lower than the costs associated with contracts acquired from third parties.
While we continue to pursue internal growth, we have selectively taken advantage of acquisition opportunities, for example Network Services in 2008, and continue to expand into other markets that we previously did not have the technical capabilities to support. See “—Our Strategy — Pursue Strategic Acquisitions” and “—Our Services and Products” later in this section for descriptions of these acquisitions.
Strong Position and Substantial Experience in Our Target Markets
As of December 31, 2011, we were providing payment processing services to 171,801 active SME merchants located across the United States. We believe our understanding of the needs of SME merchants and the risks inherent in doing business with them, combined with our efficient direct sales force, provides us with a competitive advantage over larger service
6
providers that access this market segment indirectly. We also believe that we have a competitive advantage over service providers of a similar or smaller size that may lack our extensive experience and resources, and so do not benefit from the economies of scale that we have achieved.
Also at December 31, 2011, we provided bankcard payment processing services to approximately 179 Network Services Merchants with approximately 54,826 locations. These Network Services Merchants are primarily in the petroleum industry. We believe that our understanding of the processing needs of petroleum merchants and the products we offer them provides us with a competitive advantage.
Industry Expertise
Historically, we have focused our sales efforts on SME merchants who have certain key attributes and on industries in which we believe our direct sales model is most effective and the risks associated with bankcard processing are relatively low. These attributes include owners who are typically on location, interact with customers in person, value a local sales and servicing presence and often consult with trade associations and other civic groups to help make purchasing decisions.
To further promote our products and services, we have entered into referral arrangements with various trade associations, with an emphasis on state restaurant and hospitality groups. We believe that these partnerships have enabled us to gain exposure and credibility within the restaurant industry and have provided us with opportunities to market our products to new merchants. On January 19, 2010, we formed a strategic partnership with The National Restaurant Association to foster our delivery of a unified payments processing platform to the restaurant industry. This alliance has provided restaurateurs nationwide with effective tools, solutions and resources that help them reduce their expenses, improve operations and increase profitability all from one source with integrated technology product platforms.
In December 2011, the restaurant industry represented approximately 34.8% of our SME bankcard processing volume and 49.7% of our SME transactions, consistent with prior years. We believe that the restaurant industry will remain an area of focus, though its growth will likely approximate the growth in the overall portfolio. Restaurants represent an attractive segment for us: according to a report by the National Restaurant Association, restaurant industry sales are expected to reach approximately $631.8 billion in 2012, which would represent a 3.5% increase over projected industry sales for 2011 and the twentieth consecutive year of growth. The projected restaurant industry growth for 2012 is in spite of a challenging economy and this steady growth profile, combined with the industry's low seasonality, makes restaurant merchant bankcard processing volume very stable and predictable. In addition, the incidence of chargebacks is very low among restaurants, as the service typically is provided before the card is used. Our industry focus not only differentiates us from other payment processors, but also allows us to forge relationships with key trade associations that attract merchants to our business. Our industry focus also allows us to better understand a merchant's needs and tailor our services accordingly.
Although we have historically focused significant sales and marketing efforts on the restaurant industry, our SME merchant base also includes a broad range of brick and mortar retailers, lodging establishments, automotive repair shops, convenience and liquor stores, professional service providers, and gas stations. See “—Our Merchant Base” for detail on December 2011 bankcard processing volume by merchant category.
Our historical focus on SME merchants has diversified our merchant portfolio and we believe has reduced the risks associated with revenue concentration. In 2011, no single SME merchant represented more than 1.02% of our total bankcard processing volume, consistent with prior years.
Our Network Services business has further diversified our total merchant portfolio adding a substantial base of large national merchants, primarily in the petroleum industry.
Merchant Focused Culture
We have built a corporate culture and established practices that we believe improve the quality of services and products we provide to our merchants. We developed and endorsed The Merchant Bill of Rights, an advocacy initiative that details ten principles we believe should characterize all merchants' processing relationships. The Merchant Bill of Rights allows our sales team to differentiate our approach to bankcard processing from alternative approaches, and we believe that a focus on these principles by our merchants will enhance our merchant relationships. We believe that our culture and practices allow us to maintain strong merchant relationships and differentiate ourselves from our competitors in obtaining new merchants.
Our merchant-focused culture spans from our sales force, which maintains a local market presence to provide rapid,
7
personalized customer service, through our service center, which is segmented into regional teams to optimize responsiveness, and to our technology organization, which has developed a customer management interface and information system that alerts our Relationship Managers to any problems a merchant has reported and provides them with detailed information on the merchants in their portfolio. Additionally, we believe that we are one of the few companies that discloses our pricing to SME merchants. We think this approach contributes substantially to building long-term merchant relationships.
Scalable Operating Structure
Our scalable operating structure generally allows us to expand our operations without proportionally increasing our fixed and semi-fixed support costs. In addition, our technology platform, including both HPS Exchange and Passport, was designed with the flexibility to support significant growth and drive economies of scale with relatively low incremental costs. Most of our operating costs are related to the number of individuals we employ. We have in the past used, and expect in the future to use, technology to leverage our personnel, which should cause our personnel costs to increase at a slower rate than our bankcard processing volume.
Advanced Technology
We employ information technology systems which use the Internet to improve management reporting, enrollment processes, customer service, sales management, productivity, merchant reporting and problem resolution. We believe that these systems help attract both new merchants and Relationship Managers and provide us with a competitive advantage over many of our competitors who rely on less flexible legacy systems.
We provide authorization and data capture services to our SME merchants through our internally-developed front-end processing system, HPS Exchange. This system incorporates real time reporting tools through interactive point-of-sale database maintenance via the Internet. These tools enable merchants, and our employees, to change the messages on credit card receipts and to view sale and return transactions entered into the point-of-sale device with a few second delay on any computer linked to the Internet. During the years ended December 31, 2011, 2010 and 2009, approximately 93%, 90% and 88%, respectively, of our SME transactions were processed through HPS Exchange.
We provide clearing, settlement and merchant accounting services through our own internally developed back-end processing system, Passport. Passport enables us to customize these services to the needs of our Relationship Managers and merchants. At both December 31, 2011 and 2010, approximately 99% of total SME bankcard merchants were processing on Passport. In the fourth quarter of 2010, the clearing, settlement and merchant accounting services for Network Services' settled transactions were converted onto Passport. At December 31, 2011 and 2010, our internally developed systems have been providing substantially all aspects of a merchant's processing needs for most of our SME merchants and all of our Network Services Merchants' processing needs.
We actively leverage the latest advances in technology to provide the best payments experience for merchants with reliability levels that we believe exceed industry norms. In 2011, we enabled our first cloud computing datacenter and consolidated several legacy data centers. This consolidation reduced processing costs while giving us even more flexibility, scalability, leverage and availability for our front-end processing, back-end processing, and other products.
Comprehensive Underwriting and Risk Management System
Through our experience in assessing risks associated with providing payment processing services to SME merchants, we have developed procedures and systems that provide risk management and fraud prevention solutions designed to minimize losses. Our underwriting processes help us to evaluate merchant applications and balance the risks of accepting a merchant against the benefit of the bankcard processing volume we anticipate the merchant will generate. We believe our systems and procedures enable us to identify potentially fraudulent activity and other questionable business practices quickly, thereby minimizing both our losses and those of our merchants. As evidence of our ability to manage these risks, and notwithstanding the challenging economic environment faced by our SME merchants in recent years, in 2011, 2010 and 2009 we experienced SME merchant losses in amounts equal to 0.76 basis points, 1.44 basis points and 1.01 basis points of SME bankcard processing volume, respectively. The 2009 and 2010 year-over-year increases in our merchant losses tracked the overall deteriorating economic conditions in those years, which contributed to increased incidences of merchant fraud.
8
Our Strategy
Our current growth strategy is to increase our market share as a provider of payment processing services to merchants in the United States and Canada. We believe that the forecasted increase in the use of bankcards as a payment method, combined with our sales and marketing approaches, will continue to present us with significant growth opportunities. Additionally, we intend to continue growing our payroll processing business, and enhance our other products such as K to 12 School Solutions, Micro Payments, Campus Solutions, and Loyalty and Heartland Gift Marketing. Key elements of our strategy include:
Expand Our Direct Sales Force
Unlike many of our competitors who rely on Independent Sales Organizations or salaried salespeople and telemarketers, we have built a direct, commission-only sales force. Our sales model divides the United States into 11 primary geographic regions overseen by Regional Directors. The Regional Directors are primarily responsible for hiring Relationship Managers and increasing the number of installed merchants in their territory.
Historically, we compensated our sales managers based on their success in growing the sales force and increasing the total SME merchant base in their regions. Prior to the economic downturn, increases in our direct sales force, including our Relationship Managers, had led to significant growth in the total SME merchants for which we process and the gross margin generated by those merchants. However, during the third quarter of 2010, we refocused our sales organization toward improving individual sales persons' productivity, and so we reduced our Relationship Manager count, but at the same time, more fully engaged our Territory Managers in the sales process by requiring them to achieve individual minimum monthly gross margin install targets. Combining our Relationship Managers and Territory Managers gives us a count of 790 at December 31, 2011, compared to 917 at December 31, 2010 and 1,069 at December 31, 2009. We anticipate renewed growth in our sales force in the next few years in order to increase our share of our target markets, while maintaining the enhanced sales productivity levels of recent quarters.
Further Penetrate Existing SME Bankcard Target Markets and Enter Into New Markets
We believe that we have an opportunity to grow our business by further penetrating the SME market through our direct sales force and alliances with local trade organizations, banks and value-added resellers. We believe that our sales model, combined with our community-based strategy that involves our Relationship Managers building relationships with various trade groups and other associations in their territory, will enable our Relationship Managers to continuously add new merchants. We intend to further expand our bankcard processing sales efforts into new target markets with relatively low risk characteristics, including markets that have not traditionally accepted electronic payment methods. These markets include governments, schools and the business-to-business market.
Expand Our Services and Product Offerings
We have focused on offering a broad set of payment-related products to our customers. In addition to our bankcard processing services, our current product offerings include payroll processing, K to 12 School Solutions, Micropayments, Campus Solutions, and Loyalty and Heartland Gift Marketing. See “— Our Services and Products” for descriptions of these services. In 2010 and 2011 in a series of four acquisitions, we added K to 12 School Solutions to our product set, expanding our customer base by offering school nutrition and point-of-sale solutions, including Internet payment capability, to a wide base of schools, students and their parents (see “— Our Services and Products —K to 12 School Solutions” for more information).
We also distribute products that will help our merchants reduce their costs and grow their businesses, such as SmartLink. SmartLink is our state of the art technology for consolidating multiple in-store devices onto a single lower-cost, high-speed broadband circuit. SmartLink transmits both transactional data as well as integral back-office information. It streamlines networked services, reduces costs and enhances operational efficiency for our merchants.
We may develop new products and services internally, enter into arrangements with third-party providers of these products or selectively acquire new technology and products. Many of these new service offerings are designed to work on the same point-of-sale devices that are currently in use, enabling merchants to purchase a greater volume of their services from us and eliminating their need to purchase additional hardware. We believe that these new products and services will enable us to leverage our existing infrastructure and create opportunities to cross-sell our products and services among our various merchant bases, as well as enhance merchant retention and increase processing revenue.
9
Leverage Our Technology
We intend to continue leveraging our technology platforms to increase operating efficiencies and provide real-time processing and data to our merchants, sales force and customer service staff. Since our inception, we have been developing Internet-based systems to improve and streamline our information systems, including customer-use reporting, management reporting, enrollment, customer service, sales management and risk management reporting tools. We continually develop enriched back office solutions which allow merchants to integrate their payment processing data into any of the major small business accounting software packages, and remain on the leading edge of the merchant marketplace. We continue to make material investments in our payment processing capabilities, which allows us to offer a differentiated payment processing product that is faster, less expensive, and more comprehensive than competing products.
Enhance Merchant Retention
By providing our merchants with a consistently high level of service and support, we strive to enhance merchant retention. We recognize that our ability to maintain strong merchant relationships is important to not only maintaining our recurring revenues, but to our growth. We believe that our practice of fully disclosing our pricing policies to our merchants creates goodwill. We developed and endorsed The Merchant Bill of Rights, an advocacy initiative that details ten principles we believe should characterize all merchants' processing relationships.
We have passed on to our merchants the benefits of reductions in debit interchange rates mandated by the “Durbin Amendment,” which was part of the July 2010 Dodd-Frank Wall Street Reform and Consumer Protection Act and went into effect on October 1, 2011. The Durbin Amendment places limits on debit card interchange rates that card issuing banks with assets in excess of $10 billion may charge. We believe that the Merchant Bill of Rights and our approach to passing along the benefits of the Durbin Amendment to our merchants allows our sales force to differentiate our approach to bankcard processing from alternative approaches, and we believe that a focus on these principles by our merchants will enhance our merchant relationships.
We have developed a customer management interface that alerts our Relationship Managers and Account Managers to any problems an SME merchant has reported and provides them with detailed information on the merchants in their portfolio. In addition, we believe that our flexible back-end processing platform, Passport, allows us to tailor our services to the needs of our sales force and merchants, which we believe will further enhance merchant retention. Passport's flexibility allows us to enhance the information available to our merchants, and to offer new services to them.
Pursue Strategic Acquisitions
Although we intend to continue to pursue growth through the efforts of our direct sales force, we may also expand our merchant base or gain access to other target markets by acquiring complementary businesses, products or technologies, including other providers of payment processing. Our 2006 acquisition of Debitek, Inc. and 2007 acquisition of General Meters Corp, are examples of expanding by acquiring complementary businesses. In 2008, we acquired CPOS, a Canadian provider of payment processing services and secure point-of-sale solutions, that provided us with an entrance into the Canadian credit and debit card processing market. In 2008, we also acquired Network Services which handles a wide range of payment transactions for its predominantly petroleum customer base. Our acquisition of Chockstone in 2008 provided for expansion into the loyalty marketing and gift card solutions market.
On December 30, 2010, we purchased the K to 12 School Solutions business previously operated by Lunchbox. Lunchbox provided an initial customer base of approximately 4,400 schools. Lunchbox was the first of four acquisitions we made in the K to 12 School Solutions business. K to 12 School Solutions develops, manufactures, sells and services and maintains computer software designed to facilitate accounting and management functions of food service operations of schools. On January 12, 2011, February 4, 2011 and September 30, 2011, we acquired the K to 12 School Solutions businesses of Comalex, Inc., mySchoolBucks, LLC, and School-Link Technologies, Inc, respectively. Comalex, mySchoolBucks and School-Link added approximately 3,700, 900 and 10,000 schools, respectively, to our K to 12 School Solutions product. These acquisitions have given us an almost 20% market share in this industry and enable us to offer school nutrition and point-of-sale solutions, including Internet payment capability enabling on-line deposits of funds into student accounts, to over 19,000 public and private schools.
10
Our Services and Products
SME Merchant Bankcard Payment Processing
We derive the majority of our SME processing revenues from fee income relating to Visa and MasterCard payment processing, which is primarily comprised of a percentage of the dollar amount of each transaction we process, as well as a flat fee per transaction. The percentage we charge is typically a fixed margin over interchange, which is the percentage set by Visa and MasterCard depending on the type of card used and the way the transaction is handled by the merchant. On average, the gross revenue we generate from processing a Visa or MasterCard transaction equals approximately $2.50 for every $100 we process. We also receive fees from American Express, Discover, and JCB for facilitating their transactions with our SME merchants. Our American Express agreement includes a compensation model which provides us percentage-based residual on the American Express volume we process, plus fees for every transaction we process. Under our agreement with Discover, our revenue model is similar to our Visa and MasterCard models.
We receive revenues as compensation for providing bankcard payment processing services to merchants, including merchant set-up and training, transaction authorization and electronic draft capture, clearing and settlement, merchant accounting, merchant support and chargeback resolution. In 2005, we began providing clearing, settlement and accounting services through Passport, our own internally developed back-end processing system. Passport enables us to customize these services to the needs of our Relationship Managers and merchants. At December 31, 2011 and 2010, approximately 99% of our SME bankcard merchants were processing on Passport. In addition, we sell and rent point-of-sale devices and supplies and provide additional services to our merchants, such as gift and loyalty programs, paper check authorization and chargeback processing. These payment-related services and products are described in more detail below:
Merchant Set-up and Training— After we establish a contract with a merchant, we create the software configuration that is downloaded to the merchant's existing, newly purchased or rented point-of-sale terminal, cash register or computer. This configuration includes the merchant identification number, which allows the merchant to accept Visa and MasterCard as well as any other cards, such as American Express, Discover and JCB, provided for in the contract. The configuration might also accommodate check verification, gift and loyalty programs and allow the terminal or computer to communicate with a pin-pad or other device. Once the download has been completed by the Relationship Manager or Account Manager, we conduct a training session on use of the system. We also offer our merchants flexible low-cost financing options for point-of-sale terminals, including installment sale and monthly rental programs.
Authorization and Draft Capture— We provide electronic payment authorization and draft capture services for all major bankcards. Authorization generally involves approving a cardholder's purchase at the point of sale after verifying that the bankcard is not lost or stolen and that the purchase amount is within the cardholder's credit or account limit. The electronic authorization process for a bankcard transaction begins when the merchant “swipes” the card through its point-of-sale terminal and enters the dollar amount of the purchase. After capturing the data, the point-of-sale terminal transmits the authorization request through HPS Exchange or the third-party processor to the card-issuing bank for authorization. The transaction is approved or declined by the card-issuing bank and the response is transmitted back through HPS Exchange or the third-party processor to the merchant. At the end of each day, and, in certain cases, more frequently, the merchant will “batch out” a group of authorized transactions, transmitting them through us to the bankcard networks for payment.
We introduced HPS Exchange, our internally developed front-end processing system, in August 2001. During the years ended December 31, 2011, 2010 and 2009, approximately 93%, 90% and 88%, respectively, of our SME transactions were processed through HPS Exchange. The remainder of our front-end processing is outsourced to third-party processors, primarily TSYS Acquiring Solutions. Although we will continue to install new SME merchants on TSYS' systems, we anticipate that the percentage of SME transactions that are outsourced will continue to decline as we install a high percentage of new merchants on HPS Exchange. Additionally, in the fourth quarter of 2010 we sold many of our remaining merchant accounts that had not been converted onto HPS Exchange and were still processing on third party front-end platforms other than TSYS. The sale's purpose was to eliminate servicing inefficiencies associated with these merchant accounts.
Clearing and Settlement— Clearing and settlement processes, along with Merchant Accounting, represent the “back-end” of a transaction. Once a transaction has been “batched out” for payment, the payment processor transfers the merchant data to Visa or MasterCard who then collect funds from the card issuing banks. This is typically referred to as “clearing.” After a transaction has been cleared, the transaction is “settled” by Visa or MasterCard by payment of funds to the payment processor's sponsor bank the next day. The payment processor creates an electronic payment file in ACH format for that day's cleared activity and sends the ACH file to its sponsor bank. The ACH payments system generates a credit to the merchants' bank accounts for the
11
value of the file. The merchant thereby receives payment for the value of the purchased goods or services, generally two business days after the sale. Under the terms of the agreements with American Express and Discover, the process is substantially similar to the Visa and MasterCard process, and the merchant receives one deposit for all cards accepted, in contrast to the previously existing arrangement, where an acceptor of Visa and MasterCard, American Express and Discover would have received three deposits.
Passport, our internally developed back-end system, enables us to customize these services to the needs of our merchants and Relationship Managers. For example, in 2011 we launched Optimized Funding for SME merchants. Optimized Funding allows for our merchants to get paid for their transactions faster than they would previously and compliments our Next Day Funding relationships with certain banks.
Merchant Accounting— Utilizing Passport, we organize our SME merchants' transaction data into various files for merchant accounting and billing purposes. We send our SME merchants detailed monthly statements itemizing daily deposits and fees, and summarizing activity by bankcard type. These detailed statements allow our SME merchants to monitor sales performance, control expenses, disseminate information and track profitability. We also provide information related to exception item processing and various other items of information, such as volume, discounts, chargebacks, interchange qualification levels and funds held for reserves to help them track their account activity. SME merchants may access this archived information through our customer service representatives or online through our Internet-based customer service reporting system.
Merchant Support Services— We provide merchants with ongoing service and support for their processing needs. Customer service and support includes answering billing questions, responding to requests for supplies, resolving failed payment transactions, troubleshooting and repair of equipment, educating merchants on Visa and MasterCard compliance and assisting merchants with pricing changes and purchases of additional products and services. We maintain a toll-free help-line 24 hours a day, seven days a week, which is staffed by our customer service representatives and, during 2011, answered an average of approximately 137,000 customer calls per month. The information access and retrieval capabilities of our intranet-based systems provide our customer service representatives prompt access to merchant account information and call history. This data allows them to quickly respond to inquiries relating to fees, charges and funding of accounts, as well as technical issues.
Chargeback Services— In the event of a billing dispute between a cardholder and a merchant, we assist the merchant in investigating and resolving the dispute as quickly and accurately as possible with card issuers and the bankcard networks, ensuring that the merchant is adequately represented under the bankcard network rules. We immediately notify the merchant and pass through a debit to the merchant's account for the chargeback. For Visa and MasterCard, the merchant is reimbursed as soon as they provide us with a valid response, as the act of representing the items allows us to reclaim the funds. Under American Express and Discover rules, the funds are reimbursed to us, and to the merchant, as soon as the case is resolved in the merchant's favor. After a merchant incurs three chargebacks per anniversary year, we typically charge our merchants a $25 fee for each subsequent chargeback they incur.
Network Services Merchant Bankcard Payment Processing
Network Services is a provider of payment processing solutions, serving large national merchants in a variety of industries such as petroleum, convenience store, parking and retail. More recently, we have added mid-tier petroleum merchants to our Network Services' merchant base and have made SmartLink available to our merchants. Services include payment processing, prepaid services, POS terminals, helpdesk services and merchant bankcard services. In addition to Visa and MasterCard transactions, Network Services handles a wide range of payment transactions for its predominantly petroleum customer base. SmartLink is our platform for consolidating multiple in-store devices onto a single lower-cost, high-speed broadband circuit. SmartLink transmits both transactional data as well as integral back-office information. It streamlines networked services, reduces costs and enhances operational efficiency for our merchants.
Our bankcard processing revenue from Network Services Merchants is recurring in nature. In contrast to SME merchants, our processing revenues from Network Services Merchants generally consist of a flat fee per transaction and thus are primarily driven by the number of transactions we process (whether settled, or only authorized), not processing volume.
Authorization and Draft Capture— Network Services provides electronic payment authorization and draft capture for all major bankcards, client private label cards and fleet cards. Authorization generally involves approving a cardholder's purchase at the point of sale after verifying that the purchase amount is within the cardholder's credit or account limit and that the card is not lost or stolen. The electronic authorization process for a card transaction begins when the merchant “swipes” the card through its point-of-sale terminal and enters the dollar amount of the purchase. Network Services offers two front-end processing hosts,
12
VAPS and NWS. After capturing the data, the point-of-sale terminal transmits the authorization request through the VAPS or NWS host to the card-issuing entity for authorization. The transaction is approved or declined by the card-issuing entity and the response is transmitted back through the VAPS or NWS host or the third-party processor to the merchant. At the end of each day, and, in certain cases, more frequently, the merchant will “batch out” a group of authorized transactions, transmitting them through us to the bankcard networks for payment.
VAPS and NWS provide distinct functionality and processing options for our large corporate customers. These hosts provide efficient transaction payment processing and real-time authorizations using fully redundant routing paths. Our Network Services Merchants can rely on quick response times and high availability. We maintain two redundant data centers for our Network Services Merchant transaction processing. If one site fails, the other site is capable of supporting 100% of the workload so this assures uninterrupted transaction processing. Each data center maintains direct connections to Visa, MasterCard, Discover, Fiserv and American Express. The Fiserv connection is our gateway for PIN debit and EBT processing.
Clearing and Settlement— Clearing and settlement processes represent the “back-end” of a transaction. Once a transaction has been “batched out” for payment, we transfer the completed transaction detail file to our Passport back-end processing system for clearing and settlement. During the “clearing” process, the transaction detail is split out and sent to Visa or MasterCard who then collect funds from the card issuing banks. After a transaction has been cleared, the transaction is “settled” by Visa or MasterCard by payment of funds to our sponsor bank the next day. We then create either electronic payment files for wire or ACH for that day's cleared activity and send the files to our sponsor bank. The payments system generates a wire or credit to the merchants' bank accounts for the value of the file.
We provide deposit information to our Network Services settlement merchants each day via our Internet-based settlement reporting system. Deposits are broken out by card type and show gross sales, less chargebacks, interchange, and miscellaneous adjustments.
Merchant Boarding— The Merchant Support area supports new site setup requests, changes to existing locations, and any deletions. In addition, we provide Network Services Merchants with a web-based system, Prometheus, that allows merchants to manage their sites' data in the mainframe database after their initial setup has been completed. The benefits of Prometheus include reducing complexity, decreasing delay in boarding, allowing merchants to control their data entry, and minimizing the learning curve and data entry. The only requirements are Windows and a user ID. Boarding merchants using Prometheus access allows direct connect into Prometheus through a network connection.
Merchant Reporting—Merchants interested in flexible reporting alternatives have been provided with InfoCentral, an information database. InfoCentral is an architecture that consists of various technologies, which include relational and multi-dimensional databases and user reporting tools. Other than a suitable web browser, no additional software is required to access InfoCentral. Users can access InfoCentral from any location anywhere and at any time from any PC that has access to the Internet. Heartland InfoCentral Reporting allows the users to view their back-end settlement reporting to include funding, interchange qualifications, fees and disputes. These reports are viewable at the client and location level. Some merchants choose to receive a Daily Activity File (DAF), and Daily Dispute File (DDF) to import into their accounting systems.
Help Desk Services— The large national merchant Help Desk manages merchant trouble ticket initiation, escalation and resolution. The Help Desk also provides vendor and technician support, password resets, supply order servicing, and assists with special projects.
Our Help Desk's operating philosophy focuses on providing the highest level of quality support to our customers. To provide this high level of support, we train our Help Desk agents to focus on resolving the caller's issue or concern during the first call. As a result, our agents are not limited by restrictive and unproductive talk time limits so that they can focus on delivering a working solution to the caller. Our merchant Help Desk is open 24 hours a day, seven days a week with full Help Desk support.
The Help Desk provides three possible levels of support on all point-of-sale (“POS”) solutions that are certified to process on our network:
• | 1st level support includes full support of all of the POS functions, downloading of the POS, and replacement of the POS (when applicable), as well as all of the support functions provided at 2nd and 3rd level. |
• | 2nd level support includes full support of the communication between the POS and our network and minor support of the POS functions, mostly limited to those functions related to communication or network identification, as well as any support provided at 3rd level. |
• | 3rd level support includes research and analysis of data being sent by the POS to our network. |
13
Chargeback Services— In the event of a billing dispute between a cardholder and a merchant, we assist the merchant in investigating and resolving the dispute as quickly and accurately as possible with card issuers and the bankcard networks, ensuring that the merchant is adequately represented under the bankcard network rules. We provide detailed online reporting to help our Network Services Merchants manage chargebacks received from Visa, MasterCard and Discover.
Collective Point of Sale Solutions Ltd.
In March 2008, we acquired a majority interest in CPOS, a Canadian provider of bankcard payment processing services and secure point-of-sale solutions. This acquisition provides us with an entrance into the Canadian credit and debit bankcard processing market. As of December 31, 2011 and 2010, we provided bankcard processing services to approximately 10,287 and 8,300 merchants, respectively, in Canada. Revenues for our CPOS services were $11.4 million, $8.5 million and $6.0 million, respectively, in 2011, 2010 and 2009.
Payroll Processing Services
Through our wholly-owned subsidiary, Heartland Payroll Company, we operate a full-service nationwide payroll processing service. Revenues for our Payroll Processing Services were $19.5 million, $17.3 million and $15.0 million, respectively, in 2011, 2010 and 2009. Our payroll services include check printing, direct deposit, related federal, state and local tax deposits and providing accounting documentation. In addition, we offer a “PayAdvantage” card, which provides employees the opportunity to have all, or a portion, of their payroll deposited to a Visa debit card account. In order to improve operating efficiencies and ease-of-use for our customers and to decrease our own processing costs, we offer electronic and paperless payroll processing that allows an employer to submit its periodic payroll information to us via the Internet. If a customer chooses the online option, all reports and interactions between the employer and us can be managed electronically, eliminating the need for cumbersome paperwork. Approximately 53% of our payroll customers currently submit their information electronically. However, if a customer chooses not to submit their payroll data online, they may submit such information via phone or facsimile. Regardless of input method, clients can choose to have Heartland Payroll Company print and ship their payroll package or to receive this information electronically. As of December 31, 2011, 2010 and 2009, we provided payroll processing services to 11,841, 11,131 and 9,382 customers, respectively. In 2011, 2010 and 2009, we installed 3,723, 4,858 and 4,303 new payroll processing customers, respectively.
We developed a new comprehensive payroll management system, which we refer to as PlusOne Payroll, that streamlines all aspects of the payroll process to enable time and cost savings. PlusOne Payroll was made available to new and existing customers beginning in 2010. At December 31, 2011, all of our payroll processing customers were processing on PlusOne Payroll. We consider our PlusOne Payroll platform to be state-of-the art, enabling us to process payroll on a large scale and provide customizable solutions for businesses of all sizes. PlusOne Payroll enables faster processing and continuous updates to help businesses remain compliant with payroll, tax and human resources regulations. The platform features web-hosted access, enabling businesses and their accountants to securely access all payroll data from virtually anywhere with SSL-encryption protection. It also provides robust, easy-to-use reporting for better business analysis. PlusOne Payroll is equipped to interface with the leading providers of accounting and time and attendance applications, as well as restaurant and retail point-of-sale systems. During 2011, we have continued to build upon this platform and have completed the Employee Self Serve web portal that allows employees to review copies of their paychecks, vouchers, payroll detail and maintain their individual demographic information.
K to 12 School Solutions
Our K to 12 School Solutions focus on providing school nutrition programs with solutions to manage their operations, and provides online payment and information portals that are used daily.
On December 30, 2010, we purchased the K to 12 School Solutions business previously operated by Lunchbox. On January 12, 2011, February 4, 2011 and September 30, 2011, we acquired the K to 12 School Solutions businesses of Comalex, Inc., mySchoolBucks, LLC, and School-Link Technologies, Inc, respectively. K to 12 School Solutions develops, manufactures, sells and services and maintains computer software designed to facilitate accounting and management functions of school food service operations. We offer school nutrition and point-of-sale solutions including Internet payment capability enabling on-line deposits of funds into student accounts, to over 19,000 public and private schools, students and their parents. Lunchbox, Comalex, mySchoolBucks and School-Link added approximately 4,400, 3,700, 900 and 10,000 schools, respectively, to our K to 12 School Solutions product. These acquisitions have given us an almost 20% market share in this industry.
14
During 2011, we introduced a number of new products and technologies such as SeeMyPlateTM, enhanced strategic partnerships with industry associations, and added online payments capabilities to the schools we serve. Our technology allows parents to pay electronically for a wide range of products and services, from school meals to student activity fees and other school-related purchases, eliminating the need for checks and cash for such transactions.
Micropayments
We began providing payment solutions within the small value transaction market in 2006. Revenues for Micropayments were $6.6 million, $6.8 million and $4.8 million, respectively, in 2011, 2010 and 2009. We manufacture and sell solutions comprising unattended online wireless credit card based payment systems, and unattended value top up systems for off-line closed loop smart (chip) card based payment systems. Our electronic cash systems provide small value transaction processing for laundromat machines, vending machines, and cash registers, in apartment laundries, cruise ships, corporate and university campuses, and penitentiaries. These systems offer consumers convenient ways to use their credit cards in laundromats with our new Waverider system, purchase and reload electronic cash cards, and spend the value on the card for small value purchases in both attended and unattended point of sale locations. In addition, we provide merchants financial settlement between the value (electronic cash card) issuer and the vendor/merchant who accepts the card as payment. We believe that there is increasing consumer demand for, and merchant interest in, card-based solutions for small denomination transactions, and expect to make additional investments in the future in developing solutions in this area.
Campus Solutions
Our campus solutions product provides an open or closed networked payments solution for a college or university campus to efficiently process small value electronic transactions. Revenues for Campus Solutions were $5.8 million, $5.7 million and $4.8 million, respectively, in 2011, 2010 and 2009. Besides payment processing, our solutions enable personal identification, door access, cashless vending transactions, cashless laundry, meal plans and cashless printing. Our innovative Give Something Back Network adds Internet and phone accessible debit card based financial services to the students, faculty, staff and local community merchants of an educational institution. In addition, our Acceluraid program, which we introduced in 2010, addresses a major operational need for campuses by providing a debit card based platform for reimbursing financial aid refunds. At December 31, 2011, we have twenty colleges enrolled, representing 110,000 students and over $290 million in annual reimbursement. We currently have 182 OneCard and Acceluraid college and university accounts.
Loyalty and Heartland Gift Marketing
We continue to leverage our November 2008 acquisition of Chockstone, Inc., to provide gift and loyalty card programs. Revenues for Loyalty and Gift Marketing were $12.0 million, $9.2 million and $6.4 million, respectively, in 2011, 2010 and 2009. Through our Loyalty Group, we deliver a full suite of card-based marketing services to merchant locations through real-time communications with the merchant point-of-sale, enabling us to leverage existing installations across our merchant base and enhancing our overall value proposition to the merchant community. In addition to servicing the SME merchant market, the Loyalty Group also provides gift and loyalty services to regional and national brands.
In September 2009, we initiated a card program called Heartland Gift Marketing, which strengthens an SME merchant's marketing initiatives by combining traditional, loyalty and promotional gift and loyalty card features into one integrated card program. Merchants are using Heartland Gift Marketing to increase customer loyalty and acquire new customers through the use of real-time offers and rewards delivered at the merchant point-of-sale. As of December 31, 2011, Heartland Gift Marketing has signed 8,300 merchant locations and loaded $49 million on approximately 1,452,000 consumer gift cards, compared to 5,300 merchant locations and $22 million loaded on approximately 620,000 cards in 2010.
Sales
We sell and market our products and services to our SME merchants exclusively through our sales force. As of December 31, 2011, we employed 790 Relationship Managers and Territory Managers in 50 states plus the District of Columbia. We employ a geographic sales model that divides the United States into 11 regions overseen by Regional Directors, who are responsible for sales and service in their region and ultimately responsible for increasing the number of installed merchants in their territory. Regional Directors manage their territories through Division Managers and Territory Managers. Division Managers do not sell our products and services. Instead, their sole responsibility is to hire, train and manage Territory and Relationship Managers in their assigned geography. In contrast, Territory Managers are Relationship Managers who are also responsible for hiring and training a small number of Relationship Managers in their territory. Our Relationship Managers employ a community-based strategy that involves cold calling, obtaining referrals from existing merchants and building
15
relationships with various trade groups, banks and value-added resellers to create sales opportunities.
We designed our sales force compensation structure to motivate our Relationship Managers to establish profitable long-term relationships with low-risk merchants and create a predictable and recurring revenue stream. Compensation for Relationship Managers is entirely commission-based, with commissions paid as a percentage of the financial value of new merchant accounts installed, which is measured in terms of the annual gross margin we estimate we will receive from the merchant accounts installed. Gross Margin is calculated by deducting interchange fees, dues, assessments and fees and all of our costs incurred in underwriting, processing and servicing an account from expected gross processing revenues. Relationship Managers are permitted to price accounts as they deem appropriate, subject to minimum and maximum gross margin guidelines.
We pay our Relationship Managers, Territory Managers, Division Managers, and Regional Directors a percentage of the gross margin we derive from the payments we process for the SME merchant accounts they generate and service. Typically, when a new merchant account is signed at an acceptable estimated gross margin level, the Relationship Manager will be paid a signing bonus equal to 50% of the first 12 months' estimated gross margin. The Relationship Manager will also receive 15% of the gross margin generated from the merchant each month as residual commissions for as long as the merchant remains our customer, and in situations where there is no Account Manager assigned to the merchant account, 5% of gross margin is paid for the Relationship Manager's continued servicing of the account. In addition, the Division Manager will receive an amount equal to 25% of the amount paid to the Relationship Manager (split with a Territory Manager, if one exists for the account), and the Regional Director will receive an amount equal to 25% of the amount paid to the Division Manager. For example, if a merchant account has $1,000 of estimated annual gross margin for the first twelve months and estimated monthly gross margin of $83.33, our sales force would be compensated as follows:
Signing Bonus: | ||||||
Estimated Gross Margin for first 12 months | $ | 1,000 | ||||
Signing bonus paid to: | ||||||
Relationship Manager | $ | 500 | 50.0 | % | ||
Division Manager (plus Territory Manager) | $ | 125 | 12.5 | % | ||
Regional Director | $ | 31 | 3.125 | % | ||
Residual Commission: | ||||||
Estimated monthly Gross Margin | $ | 83.33 | ||||
Monthly residual commission paid to: | ||||||
Relationship Manager | $ | 12.50 | 15.0 | % | ||
Division Manager | $ | 3.12 | 3.75 | % | ||
Regional Director | $ | 0.78 | 0.94 | % | ||
In certain cases, no signing bonus will be paid to a Relationship Manager, but the residual commission is 30% (excluding the 5% servicing fee) of the ongoing monthly gross margin generated by such merchant.
When a Relationship Manager has established merchant relationships that generate the equivalent of $10,000 of monthly gross margin, he or she will be deemed to have a vested equity interest (known as portfolio equity), and will be guaranteed the “owned” portion (all but the 5% servicing portion) of the ongoing monthly gross margin generated by such merchants for as long as the merchant processes with us. See “Management's Discussion And Analysis of Financial Condition And Results of Operations —Critical Accounting Policies— Accrued Buyout Liability” for more information regarding portfolio equity. At the end of the first 12 months of processing for a new merchant, we compare the actual gross margin generated from that merchant with the estimated gross margin used to calculate the signing bonus. If the merchant was more profitable than expected, we increase the signing bonus amount paid to the Relationship Manager. However, if the merchant was less profitable than anticipated, the Relationship Manager must return a pro-rata portion of his or her signing bonus to us. See “Management's Discussion And Analysis of Financial Condition And Results of Operations —Critical Accounting Policies —Capitalized Customer Acquisition Costs” for more information regarding signing bonuses.
We maintain a team of Account Managers who are assigned a specific geographic territory for which they are responsible for servicing and completing installation activities. We believe that the Account Manager role allows our Relationship Managers and Territory Managers to leverage their sales efforts, while allowing us to offer merchants two local relationship contacts including an Account Manager who is more attuned to the merchants' service and technical needs. The majority of Account Managers' compensation represents a shift of the 5% servicing portion associated with the merchants he or she is servicing. The 5% is distributed in compensation to the Account Manager in the form of a weekly salary, a monthly
16
expense allotment and monthly bonus. Compensation for these activities is deducted from Relationship Manager and Territory Manager compensation. At December 31, 2011, we had 114 Account Managers.
In 2011, Heartland hired an Executive Director of Major Accounts, with strong connections with mid-market and large scale merchants, to manage our overall national accounts strategy. Reporting to the Executive Director is a Senior Director, a Director, and a Senior Vertical Market Strategy Manager. The goal of this major accounts team is to generate brand awareness of Heartland and to market its products/services to Retail, Grocery, Restaurant, and Hotel and Lodging companies with annual revenues between $100 million and $25 billion. Because the business requirements of the larger merchant can be quite complex, the sales cycles typically extend for longer periods of time than those of a smaller merchant.
Marketing
Our marketing efforts have historically focused on industry verticals and marketing partnerships. We focus our marketing efforts on industries in which we believe our direct sales model is most effective and on merchants with certain key attributes. These attributes include owners who are typically on location, interact with customers, value a local sales presence, and consult with trade associations and other civic groups to make purchasing decisions. We also determine which additional markets to enter into based on the following criteria:
• | average potential customer revenue; |
• | number of locations to be serviced; |
• | underwriting risk; and |
• | required technological upgrades. |
We have focused significantly on the hospitality industry and, in particular, independent restaurants. The number of independent restaurants to which we provide our products and services was 45,219 as of December 31, 2011 and 46,700 as of December 31, 2010. In December 2011, the restaurant industry represented approximately 34.8% of our SME bankcard processing volume and 49.7% of our SME transactions. In December 2010 and December 2009, the restaurant industry represented approximately 34.1% and 34.8% of our bankcard processing volume and 49.8% and 50.3% of our SME transactions, respectively. In addition to restaurants, our merchant base includes brick and mortar retailers, lodging establishments, automotive repair shops, convenience and liquor stores, and professional service providers.
We have also historically had success in marketing our products and services through relationships with key trade associations, agent banks and value-added resellers.
Trade Associations
As of December 31, 2011, we also had preferred partner agreements with more than 250 trade associations, approximately 45% of which are in the hospitality industry. Of these partnerships, 45 are state restaurant associations and another 41 are state lodging associations. In addition, we are the American Hotel & Lodging Association and National Restaurant Association's endorsed provider for credit card processing, gift card marketing and payroll services. Our agreements with trade associations typically include our commitment to be a member of the association, a sponsor of the association's events, trade show exhibitor and an advertiser in the association's publications. In exchange for an association's recommendation of our products and services to their members, upon the installation of a new merchant that is a member of the association, we pay to the trade association a portion of the signing bonus or residual payment that otherwise would be paid to the Relationship Manager responsible for that merchant.
Agent Banks
Heartland offers programs to banks across the United States that allows them access to leverage Heartland's extensive sales and support teams and other resources. The program provides Heartland's partner banks a source to refer their customers for merchant services, payroll processing and other electronic payments processing services. Heartland provides on-site sales, training, installation, and on-going service and support to the referred merchants. In exchange for a bank's endorsement of Heartland's products Heartland typically pays the bank a monthly residual fee based on the referred merchant's processing volumes or margins. As of December 31, 2011, we provide these services to more than 1,000 banking locations in the United States.
17
Value-Added Resellers and Third-Party Software Providers
In order to further market our products and services, we enter into arrangements with value-added resellers and third-party software developers. Value-added resellers typically sell complementary products and services such as hardware and software applications and point-of-sale hardware, software and communication network services to merchants in markets similar to ours. Our agreements with value-added resellers provide that, in exchange for their endorsement of our products and services and upon the installation of a new merchant referred by them, we will pay the value-added reseller a portion of the sales commission from the Relationship Manager responsible for that merchant and/or a transaction fee. As we continue to expand our product offerings, we intend to introduce capabilities that will allow our systems to be compatible with third-party software developers while working to reduce merchants' third-party up-front costs for processing with us. We are committed to passing along our cost efficiencies to our merchants and their point-of-sale providers to encourage joint technology partnerships. In addition we will continue to consult with industry groups such as The National Restaurant Association to advocate for fair treatment to merchants from point-of-sale software providers and their dealers. As of December 31, 2011, we had arrangements with more than 2,000 value-added resellers and referral services providers, including agreements with many third-party developers in the hospitality industry. From time to time, we have also entered into direct alliances with original equipment manufacturers and vendors.
Relationships with Sponsor Banks and Processors
In order to provide payment processing services for Visa and MasterCard transactions, we must be sponsored by a financial institution that is a principal member of the Visa and MasterCard networks. The sponsor bank must register us with Visa as an Independent Sales Organization and with MasterCard as a Member Service Provider. We also contract with third-party processors to provide critical payment processing services.
Sponsor Banks
Following is a breakout of our total Visa and MasterCard settled bankcard processing volume for the month of December 2011 by percentage processed under our individual bank sponsorship agreements:
Sponsor Bank | % of December 2011 Bankcard Processing Volume | |
KeyBank, National Association | 65% | |
The Bancorp Bank | 14% | |
Barclay Bank Delaware | 12% | |
Heartland Bank | 9% | |
Because we are not a ''member bank'' as defined by Visa and MasterCard, we have entered into sponsorship agreements with member banks. Visa and MasterCard rules restrict us from performing funds settlement or accessing merchant settlement funds and require that these funds be in the possession of a member bank until the merchant is funded. A sponsorship agreement enables us to route Visa and MasterCard bankcard transactions under the member bank's control and identification numbers to clear credit bankcard transactions through Visa and MasterCard. A sponsorship agreement also enables us to settle funds between cardholders and merchants by delivering funding files to the member bank, which in turn transfers settlement funds to the merchants' bank accounts.
The sponsorship agreements with the member banks require, among other things, that we abide by the by-laws and regulations of the Visa and MasterCard networks, and certain of the bank sponsors require a certificate of deposit or a cash balance in a deposit account. If we breach a sponsorship agreement, the sponsor bank may terminate the agreement and, under the terms of the agreement, we would have 180 days to convert the associated processing activity to an alternative sponsor bank. We are dependent on our sponsor banks, Visa and MasterCard for notification of any compliance breaches. As of December 31, 2011, we have not been notified of any such issues by our sponsor banks, Visa or MasterCard.
At December 31, 2011, we were party to four bank sponsorship agreements. Our primary sponsor bank for SME merchant processing is KeyBank, National Association, referred to as “KeyBank” in this document. Either KeyBank or we can terminate the agreement if the other party materially breaches the agreement, including non-payment of fees due for processing our monthly settlement of transactions. The agreement may also be terminated if the other party files for or enters bankruptcy, if either party is required to discontinue performing its services under the agreement based upon a final order of a state or
18
federal court or regulatory body or if there is a change in the majority ownership of the other party. KeyBank may terminate the agreement with us if we breach the by-laws and regulations of Visa or MasterCard, if either our registration or KeyBank's membership with Visa or MasterCard terminates, if any federal or state regulatory authority requests that the agreement be terminated or that KeyBank terminate its services or if applicable laws or regulations change to prevent KeyBank from performing its services under the agreement. Upon termination of the agreement for any reason, we will have 180 days to convert to another sponsor bank. The agreement, which we entered into with KeyBank on April 1, 1999, has been extended to October 1, 2012.
The sponsorship agreements we have with our other three sponsor banks involve substantially the same terms as apply with KeyBank. In 2007, we entered into a sponsor bank agreement with Heartland Bank, which is based in Saint Louis, Missouri. Heartland Bank is not related to or associated with Heartland Payment Systems. Our agreement with Heartland Bank has been renewed through September 2013. In November 2009, we entered into a sponsorship agreement with The Bancorp Bank to sponsor our Network Services settlement merchants and transferred sponsorship from SunTrust Bank, its previous sponsor, to The Bancorp Bank in February 2010. The agreement with The Bancorp Bank expires in November 2014. On March 24, 2011, we entered into a sponsor bank agreement with Barclays Bank Delaware to sponsor certain of our Network Services Merchants. The agreement with Barclays Bank Delaware expires in March 2016, with an automatic one year renewal.
On February 8, 2012, we entered into a sponsor bank agreement with Wells Fargo Bank, N.A. The sponsorship agreement with Wells Fargo involves substantially the same terms as apply with KeyBank.
Third-Party Processors
We have agreements with several third-party processors to provide to us on a non-exclusive basis payment processing and transmittal, transaction authorization and data capture services, and access to various reporting tools. These third-party processors include Fujitsu America, TSYS, and Global Payments, Inc. Certain agreements with third-party processors may be terminated by the third-party processors if we materially breach certain sections of the agreements, including our failure to pay fees due, and we do not cure the breach within 30 days, if our registration with Visa or MasterCard terminates, or if we file for or enter bankruptcy.
In the fourth quarter of 2010, we sold many of our remaining merchant accounts that had not been converted onto HPS Exchange and were processing on other third party front-end platforms. The sale's purpose was to eliminate servicing inefficiencies associated with these merchant accounts.
Our Merchant Base
Our merchant customers primarily fall into two categories: our core small and mid-sized merchants (referred to as "Small and Midsized Enterprises", or “SME merchants”) and Network Services' large national and mid-tier merchants (referred to as "Network Services Merchants"), primarily in the petroleum industry. At December 31, 2011, we provided our bankcard payment processing services to 171,801 active SME bankcard merchants and 179 Network Services Merchants having 54,826 locations across the United States.
SME Merchant Base
While restaurants represent a significant portion of our SME merchant base, we also provide payment processing services to a wide variety of merchants, with a focus on those merchants whose typical customer is present when using a bankcard to pay for products or services. We define SME merchants as generating annual Visa and MasterCard bankcard processing volume between $50,000 and $5,000,000. With the added functionality and cost benefits that our back-end processing system, Passport, affords us, we market to merchants with annual processing volume above $5,000,000.
The following chart summarizes our SME processing volume by merchant category for the month of December 2011, compared to the months of December 2010 and December 2009.
19
Processing Volume by Merchant Category
December 2011
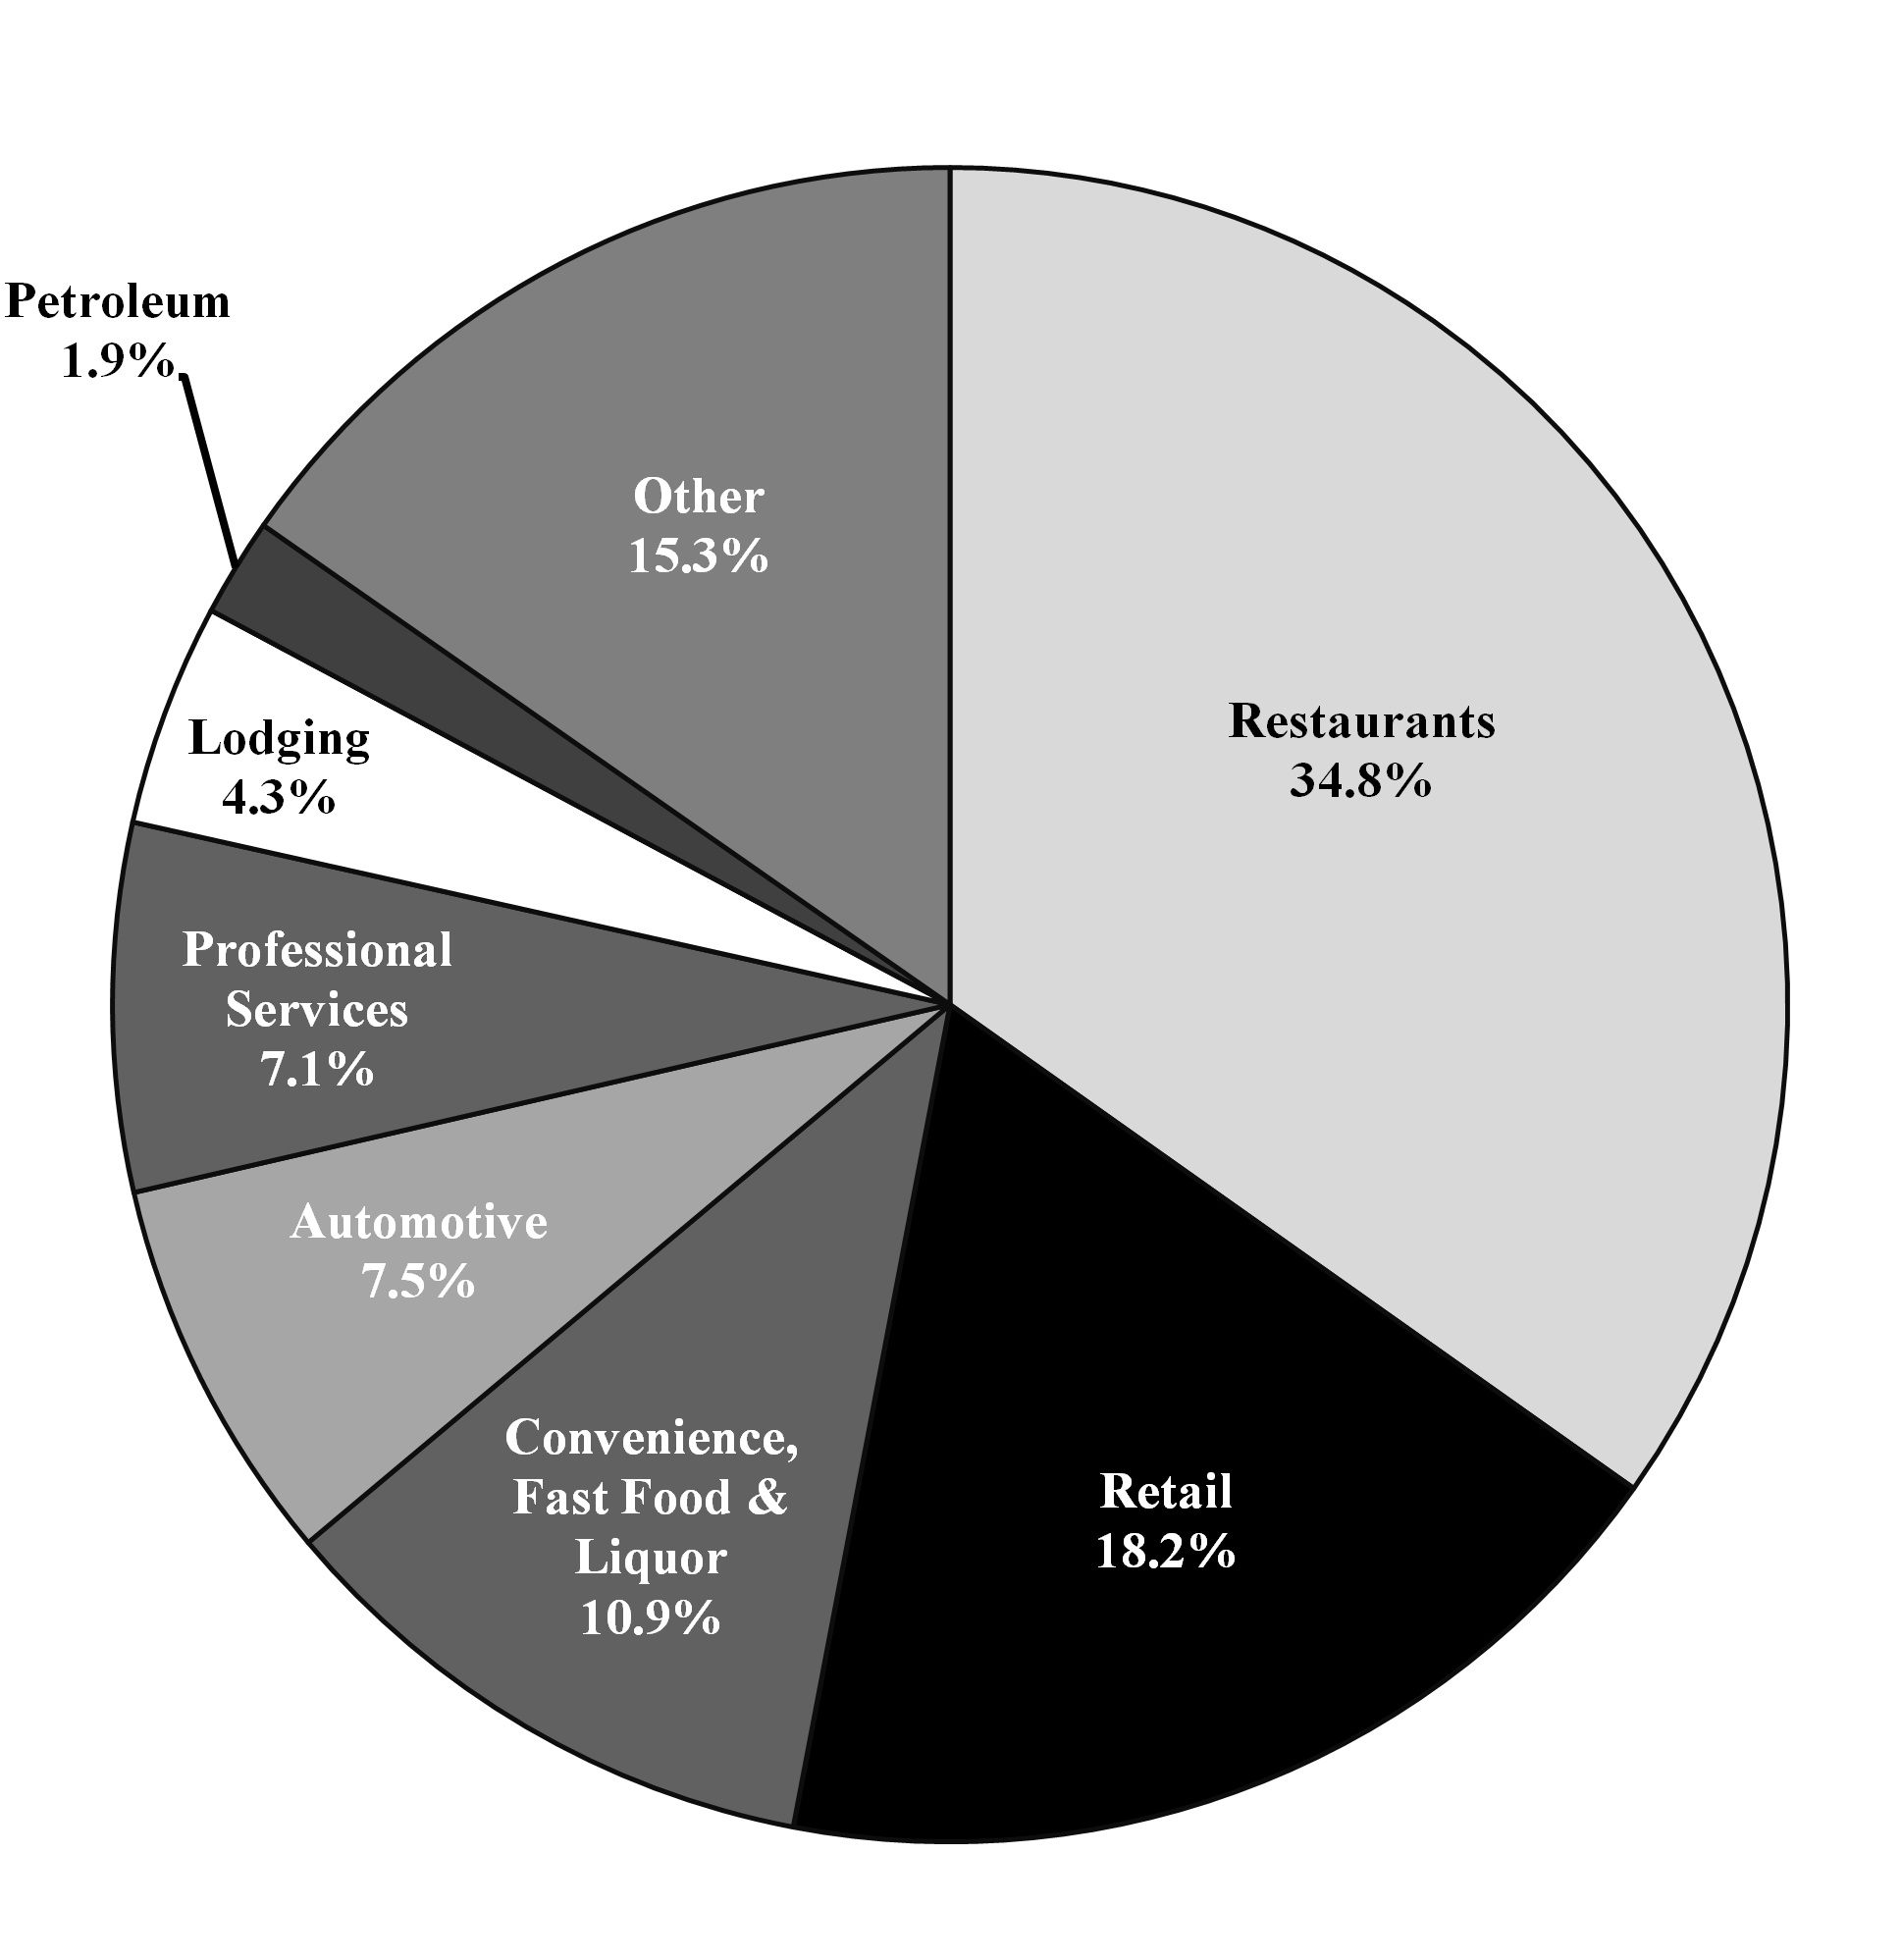
Month of December | ||||
2011 | 2010 | 2009 | ||
 | Restaurants | 34.8% | 34.1% | 34.8% |
 | Retail | 18.2% | 18.7% | 19.0% |
 | Convenience, Fast Food & Liquor | 10.9% | 10.6% | 10.5% |
 | Automotive | 7.5% | 7.9% | 7.7% |
 | Professional Services | 7.1% | 6.9% | 6.5% |
 | Lodging | 4.3% | 4.2% | 4.3% |
 | Petroleum | 1.9% | 2.2% | 2.1% |
 | Other | 15.3% | 15.4% | 15.1% |
Total SME processing volume $5.6 billion $5.2 billion $4.9 billion
No single SME merchant accounted for more than 1.02% of our total SME Visa and MasterCard bankcard processing volume in 2011, and during 2011, our top 25 merchants represented only 3.21% of our SME Visa and MasterCard bankcard processing volume and 2.56% of our SME Visa and MasterCard gross processing revenue. In 2010 and 2009, no single
20
merchant represented more than 1.01% and 0.87% of our total SME Visa and MasterCard bankcard processing volume, respectively. In both 2010 and 2009 our top 25 merchants represented only 3.0% of our SME Visa and MasterCard bankcard processing volume and 2.54% and 2.40%, respectively, of our SME Visa and MasterCard gross processing revenue.
In December 2011, SME merchants in California represented 10.8%, in Texas represented 5.8%, in New York represented 5.5%, in Florida represented 4.8%, and in New Jersey represented 4.0% of our respective SME bankcard processing volume. No other state represented more than 4% of our total bankcard processing volume. Our geographic concentration tends to reflect the states with the highest economic activity, as well as certain states where we have historically maintained a stronger sales force. This merchant and geographic diversification makes us less sensitive to changing economic conditions in any particular industry or region. We believe that the loss of any single SME merchant would not have a material adverse effect on our financial condition or results of operations.
Generally, our agreements with SME merchants are for three years and automatically renew for additional one-year periods unless otherwise terminated. Our sponsor bank is also a party to these agreements. The SME merchants are obligated to pay for all chargebacks, fines, assessments, and fees associated with their account, and in some cases, annual fees. Our sponsor bank may terminate an SME merchant agreement for any reason on 30 days' notice, and the SME merchant may terminate the agreement at any time without notice, subject to the payment of any applicable early termination fees. Typically, the agreement may also be terminated immediately upon a breach by the SME merchant of any of its terms. The agreement may not be assigned by the SME merchant without the prior written consent of the sponsor bank and us.
Network Services Merchants
At December 31, 2011, we provided bankcard payment processing services to 179 Network Services Merchants with 54,826 locations. Network Services provides processing of credit and debit cards to large national and mid-tier merchants, primarily in the petroleum industry. For the month of December 2011, approximately 95% of Network Services Merchant processing volume was in the petroleum industry. In addition to settling Visa and MasterCard transactions, Network Services processes a wide range of payment transactions, including providing approximately 2.7 billion transaction authorizations through our front-end card processing systems (primarily for Visa and MasterCard) in 2011. Network Services added $15.5 billion to our bankcard processing volume on 553 million settled transactions in 2011.
Risk Management
We believe that we have significant experience in assessing the risks associated with providing payment processing services to SME merchants. These risks include the limited operating history of many of the SME merchants we serve and the risk that these merchants could be subject to a higher rate of insolvency, which could adversely affect us financially. We apply varying levels of scrutiny in our application evaluation and underwriting of prospective merchant accounts, ranging from basic due diligence for merchants with a low risk profile to a more thorough and detailed review for higher risk merchants. In addition, through Network Services, we are also one of the leading providers of payment processing to the petroleum industry.
Merchant attrition is expected in the payment processing industry in the ordinary course of business. During the year ended December 31, 2011, we experienced an improved 13.5% average annualized attrition in our SME bankcard processing volume compared to an average attrition of 15.3% and 22.6% for the years ended December 31, 2010 and 2009, respectively. Much of our attrition is related to business closures, which accelerated in 2008 and 2009 due to weak economic conditions, and in 2009 our volume attrition was significantly impacted by overall contraction in same stores sales. See “—Management's Discussion and Analysis of Financial Condition and Results of Operations —Overview —General” for a discussion of same stores sales.
As a result of our exposure to potential liability for merchant fraud, chargebacks, reject and other losses created by our merchant services business, we view our risk management and fraud avoidance practices as integral to our operations and overall success. We believe that the risks associated with our merchant base are generally not significant as our merchants consist primarily of companies conducting card-present transactions and whose chargeback levels are generally not significant as a percentage of their sales volume. As a result of their low risk profile, we can employ underwriting and set-up procedures that are less extensive than if these merchants had higher risk profiles and can typically ensure that these merchants will be approved and set up on our systems within 24 hours of our receiving their application.
However, for our merchants conducting card-not-present (CNP) transactions, which we view as having a higher risk profile, we employ an extended underwriting and due diligence period and special account monitoring procedures. The underwriting process for these merchants' applications may take three to five days while we evaluate the applicants' financial
21
condition, previous processing history and credit reports and/or OFAC (Office of Foreign Assets Control reports). Credit reports and OFAC are processed on all businesses and signers submitted on the Merchant Processing Agreement, not just CNP applications. All ecommerce businesses undergo a website scan during the underwriting due diligence process to validate that all required Card Brand website policies are compliant as required and ensure the website content meets the defined rules of HPS Underwriting policies and TOS (terms of services).
Effective risk management helps us minimize merchant losses for the mutual benefit of our merchants and ourselves. Our risk management procedures also help protect us from fraud perpetrated by our merchants. We believe our knowledge and experience in dealing with attempted fraud has resulted in our development and implementation of effective risk management and fraud prevention systems and procedures for the types of fraud discussed in this section. In 2011, 2010 and 2009, we experienced losses of 0.76 basis points, 1.44 basis points and 1.01 basis points, respectively, of our SME bankcard processing volume. The 2009 and 2010 year-over-year increases in our merchant losses tracked the overall deteriorating economic conditions in those years, which contributed to increased incidences of merchant fraud.
We employ the following systems and procedures to minimize our exposure to merchant and transaction fraud:
Underwriting
Our Relationship Managers send new applications for low-risk merchants to their regional service team for scoring and account set up. Higher-risk applications are routed to our underwriting department for review and screening. Our underwriting department's review of these applications serves as the basis for our decision whether to accept or reject a merchant account. The review also provides the criteria for establishing cash deposit or letter of credit requirements, processing limits, average transaction amounts and pricing, which assists us in monitoring merchant transactions for those accounts that exceed those pre-determined thresholds. The criteria set by our underwriting department also assist our risk management staff in advising merchants with respect to identifying and avoiding fraudulent transactions. Depending upon their experience level, our underwriting staff has the authority to render judgment on new applications or to take additional actions such as adjusting processing limits supported by prior processing history, analyzing average charge per transaction information or establishing cash deposits/letters of credit, reserves, and delayed funding requirements for new and existing merchants. Our underwriting department prepares accounts that are risk sensitive for our Credit Committee review. The Credit Committee consists of a Manager of Underwriting, Manager of Risk Review, Executive Director of Core Support Group and Executive Director of HSC Operations. Merchant accounts that exceed certain committee thresholds are reviewed by either our CEO, President or Chief of Operations. Our sponsor banks also review and approve our merchant underwriting policies and procedures to ensure compliance with Visa and MasterCard operating rules and regulations.
Merchant Monitoring
We employ several levels of merchant account monitoring to help us identify suspicious transactions and trends. Daily merchant activity is obtained from two sources: HPS Exchange (where the information is downloaded from HPS Exchange to our monitoring systems) and TSYS (where the information is downloaded from our third-party processors onto TSYS' risk system and then accessed by us on the Internet), and is sorted into a number of customized reports by our systems. Our risk management team reviews any unusual activity highlighted by these reports, such as larger than normal transactions or credits, and monitors other parameters that are helpful in identifying suspicious activity. We have daily windows between 10:00 a.m. and 7:30 p.m. Eastern time to decide if any transactions should be held for further review, which provides us time to interview a merchant or issuing bank to determine the validity of suspicious transactions. We have also developed a fraud management system for HPS Exchange that is fully integrated with our internal customer relationship management software and has detailed review capabilities to further streamline our monitoring of those transactions. We also place merchants who require special monitoring on alert status and have engaged a web crawling solution that scans all merchant websites for content and integrity.
Investigation and Loss Prevention
If a merchant exceeds any parameters established by our underwriting and/or risk management staff or violates regulations established by the applicable bankcard network or the terms of our merchant agreement, one of our investigators will identify the incident and take appropriate action to reduce our exposure to loss and the exposure of our merchant. This action may include requesting additional transaction information, withholding or diverting funds, verifying delivery of merchandise or even deactivating the merchant account. Additionally, Account Managers or Relationship Managers may be instructed to retrieve equipment owned by us.
22
Collateral
We require some of our merchants to establish cash deposits or letters of credit that we use to offset against liabilities we may incur. We hold such cash deposits or letters of credit for as long as we are exposed to a loss resulting from a merchant's payment processing activity. In addition, we maintain a 5-day delayed deposit policy on transactions processed by our Internet merchants and newly established merchants who have not previously processed bankcards to allow for additional risk monitoring. We also place a “hold” on batches containing questionable transactions, diverting the funds to a separate account pending review. As of December 31, 2011, these cash deposits and delayed and “held” batches totaled approximately $9.4 million.
Servicing and Processing Technology
We have developed a number of systems that are designed to improve the effectiveness of our sales force, customer service and the management of our business. In 2011, 2010 and 2009 we spent $22.6 million, $15.3 million and $12.2 million, respectively, on capitalized software development costs to make electronic payments easier for our sales force and merchants. Many of the following systems are accessible over the Internet through www.e-hps.com.
Our Servicing Technology platforms include:
atlas
atlas is our web-based application launched in 2011, which is designed to help our sales professionals more effectively prospect new accounts, price accounts, board merchants, and manage their prospects pipeline. atlas, developed in-house exclusively for our Relationship Managers and Territory Managers, greatly reduces paperwork and speeds the sales cycle. It is a key innovation for enhancing our Relationship Managers' productivity and our overall sales recruiting efforts.
Portfolio Manager
Portfolio Manager is designed to allow each of our Relationship, Territory and Division Managers and Regional Directors to manage many aspects of his or her business, including portfolio monitoring and management, compensation review, training and professional development and the ability to communicate with others within our company. Portfolio Manager consists of a set of merchant relationship management tools. These tools include detailed merchant data, such as historical bankcard processing volume, updates on merchant contracts that will soon expire, losses, merchants who may have attrited and data that can be used by our Relationship Managers to assist merchants in understanding interchange fee structures and the risks associated with certain types of transactions. Portfolio Manager also includes an estimated gross margin calculator and a merchant profitability analysis that allows Relationship Managers to optimize gross margin generated from a new SME merchant account. In addition, Portfolio Manager provides our Relationship Managers with the ability to view their residual commission stream from their merchant portfolio, track their productivity and compare their sales statistics with those of other Relationship Managers.
Merchant Center
Merchant Center, and our newly-developed InfoCentral, is designed to improve our merchants' efficiency, cash management, interchange management and dispute resolution by providing them with real-time access to their transaction data, including clearinghouse records, deposits and transactions. The functionality and Business Intelligence reporting in Merchant Center and InfoCentral can replace paper merchant statements and provide automated customer self-service. Affiliate Manager also provides similar information tools to our strategic relationships, such as trade associations, banks and value-added resellers.
Client Manager
Information regarding all of our interactions with our SME merchants and all of their documents and transaction records are immediately available to our customer service department and management through Client Manager. Each new account is entered into this database during the initial application and underwriting process, and all documents regarding a merchant are scanned into the database. Subsequently, all of a merchant's transactions and statements, and records of all calls to our customer service representatives as well as their resolution, are maintained in the database. Client Manager is also the tool by which we make any pricing adjustments and manage any equipment-related transactions. Integrating many of our customer management tools into one database provides service center employees with the same information regarding a merchant, which enables us to provide consistent, rapid problem resolution and optimal customer service. We believe that reliance on the system has allowed considerable productivity gains in recent years.
23
Our Processing Technology platforms include:
HPS Exchange, VAPS, and NWS
Our front-end authorization systems, HPS Exchange, VAPS and NWS, provide us greater control of the electronic transaction process, allow us to offer our merchants a differentiated product offering, and offer economies of scale that we expect will increase our long-term profitability.
During 2011, approximately 93% of the transactions of our SME merchants were processed on HPS Exchange, and 97% of all merchant accounts established in 2011 were placed on the system. When a merchant uses HPS Exchange on certain hardware platforms, the resulting authorization speed for dial-up transactions can be six seconds or less and IP transactions can be two seconds or less, which we believe is faster than industry norms for comparable terminals. This increased speed not only benefits the merchant but also reduces the telecommunications costs we incur in connection with a transaction.
HPS Exchange, VAPS and NWS enable us to provide more customized solutions to merchants that demand customized front-end solutions and take advantage of new terminal hardware platforms and technology like End-to-End Encryption, as well as NFC and EMV as they become available. HPS Exchange, VAPS and NWS offer our merchants authorization and capture services in multiple industry verticals to a variety of point-of-sale systems including legacy terminals, petroleum pumps, middleware technologies, PC-integrated POS systems and a web-based virtual terminal. In addition, HPS Exchange, VAPS and NWS offer third-party point-of-sale developers multiple protocols to meet their needs for integration.
Passport
Our internally-developed back-end processing system, Passport, provides one settlement platform for SME and Network Services merchants providing value-add features such as Optimized Funding, multi-bank Next Day Funding, automated dispute resolution system, advanced interchange management and single portal integration via InfoCentral. In addition, Passport provides significant cost savings and results in greater economies of scale, by replacing third party processors' per-transaction charges with more of a fixed-cost structure. This structure allows per-transaction savings as increasing numbers of transactions are processed on Passport. In addition, Passport provides us the opportunity to offer our merchants significantly greater amounts of information regarding their processing characteristics, in more usable formats, and to offer our services to larger merchants. At December 31, 2011 and 2010, approximately 99% of our SME merchants were processing on Passport, and all of our Network Services settlement merchants were on Passport.
We provide settlement services to 136 Network Services Merchants, representing 16.9% of Network Services' transactions in 2011. In the fourth quarter of 2010, the clearing, settlement and merchant accounting services for Network Services' settled transactions were converted onto Passport. Prior to then, these settlement transactions were processed by a third party.
Network Security
In the course of our operations, we compile and maintain a large database of information relating to our merchants and their transactions, and large amounts of card information crosses our network as we authorize transactions. We have placed significant emphasis on maintaining a high level of security in order to attempt to protect the information of our merchants and their customers. We maintain current updates of network and operating system security releases and virus definitions, and have engaged a third party to regularly test our systems for vulnerability to unauthorized access. Further, we encrypt the cardholder numbers and merchant data that are stored in our databases using the highest commercially available encryption methods.
Our internal network configuration provides multiple layers of security to isolate our databases from unauthorized access and implements detailed security rules to limit access to all critical systems. In November 2003, we were certified by Visa as having successfully completed their Cardholder Information Security Program (CISP) review of our payment processing and Internet-based reporting systems. In 2004, the Visa CISP requirements were combined with security guidelines of the other card networks into a comprehensive Payment Card Industry Data Security Standard (PCI-DSS). We received confirmation of our compliance with PCI-DSS from a third party assessor in April 2008. Notwithstanding our implementation and utilization of the network security measures described in this section, we suffered the Processing System Intrusion described elsewhere in this annual report. Subsequent to the discovery of the Processing System Intrusion, we were advised by Visa that based on Visa's investigation of the Processing System Intrusion, Visa had removed us from Visa's published list of PCI-DSS compliant service providers. We were similarly advised by MasterCard that, based on MasterCard's investigation of the Processing System Intrusion MasterCard believed we were in violation of the MasterCard Standards and that, based on that belief, MasterCard removed us from MasterCard's published list of Compliant Service Providers. In April 2009, we were re-certified as PCI-DSS compliant and the assessor's report attesting to such re-certification was reviewed and approved by Visa. Visa placed us in a “probationary status” for the two years following our re-certification as being PCI-DSS compliant, during
24
which time our failure to comply with the probationary requirements set forth by Visa or with the Visa operating regulations could have resulted in Visa seeking to impose further risk conditions on us, including but not limited to our disconnection from VisaNet or our disqualification from the Visa payment system. In July 2011 Visa lifted that probationary status. In April 2009, MasterCard returned us to its published list of Compliant Service Providers.
Visa, Star, NYCE and other debit card networks have established security guidelines for PIN-based debit transaction processing that is based upon ANSI standards that are published as the “ASC X9 TG-3 PIN Security Compliance Guideline.” We have regularly scheduled Security Review of our Key Management Procedures against this standard that is performed by an external auditor.
We also have engaged external auditors to perform an annual SSAE 16 review and publish our “Report on Controls Placed in Operation and Tests of Operating Effectiveness.”
Disaster Recovery and Back-up Systems
We operate our front-end processing, back-end processing, and other product platforms in two geographically dispersed outsourced data centers: located in Texas and California. We establish system service level operational thresholds based on our large national merchants' requirements, and regularly exceed those levels, with system availability of greater than 99.9%. To achieve this standard, transactions are mirrored between the two data centers, and each center has the capacity to handle our full merchant transaction load. This duplicate processing capability ensures uninterrupted transaction processing during maintenance windows and other times processing may not be available. We regularly process through both data centers.
Competition
The payment processing industry is highly competitive. We compete with other providers of payment processing services on the basis of the following factors:
• | sales force effectiveness |
• | quality of service; |
• | reliability of service; |
• | Professional Association endorsements; |
• | ability to evaluate, undertake and manage risk; |
• | speed in approving merchant applications; and |
• | price. |
We compete with both small and large companies in providing payment processing and related services to a wide range of merchants. Our competitors sell their services either through a direct sales force, generally concentrating on larger accounts, or through Independent Sales Organizations, telemarketers or banks, generally concentrating on smaller accounts.
There are a number of large payment processors, including First Data Corporation, Global Payments Inc., Vantiv, Inc., Chase Paymentech Solutions, Bank of America Merchant Services, Wells Fargo and Elavon, Inc., that serve a broad market spectrum from large to small merchants; further, certain of these provide banking, ATM and other payment-related services and systems in addition to bankcard payment processing. There are also a large number of smaller payment processors that provide various services to small and mid-sized merchants.
Some of our competitors have substantially greater capital resources than we have and operate as subsidiaries of financial institutions or bank holding companies, which may allow them on a consolidated basis to own and conduct depository and other banking activities that we do not have the regulatory authority to own or conduct. Since they are affiliated with financial institutions or banks, these competitors do not incur the costs associated with being sponsored by a bank for registration with card networks and they can settle transactions quickly for their own merchants. We do not, however, currently contemplate acquiring or merging with a financial institution in order to increase our competitiveness. We believe that our direct sales focus on SME merchants, our competitive payments product set, and our understanding of the needs and risks associated with providing payment processing services to those merchants, gives us a competitive advantage over larger competitors, which do not have our focus, and over competitors of a similar or smaller size that may lack our experience and sales resources.
Intellectual Property
We own and are pursuing several patents with the United States Patent and Trademark Office. In addition, we own
25
various trademarks and have applied for numerous others. Most of our services and products are based on proprietary software or processes that are updated to meet merchant needs and remain competitive. Protecting our rights to our proprietary software is critical, as it allows us to offer distinctive services and products to merchants, which differentiates us from our competitors.
Employees
As of December 31, 2011, we employed 2,667 full- and part-time personnel, including 690 customer service, risk management, financial and operations support and underwriting employees, 423 systems and technology employees, 147 payroll services employees, 73 prepaid and stored-value solutions employees, 133 school solutions employees, 171 accounting and administration employees and 1,030 sales professionals. None of our employees are represented by a labor union, and we have experienced no work stoppages. We consider our employee relations to be good.
WHERE YOU CAN GET ADDITIONAL INFORMATION
We file annual, quarterly and current reports, proxy statements and other information with the SEC. You may read and copy our reports or other filings made with the SEC at the SEC's Public Reference Room, located at 100 F Street, N.E., Washington, DC 20549. You can obtain information on the operation of the Public Reference Room by calling the SEC at 1-800-SEC-0330. You can also access these reports and other filings electronically on the SEC's web site, www.sec.gov.
In addition, certain of our SEC filings, including our Annual Report on Form 10-K, our Quarterly Reports on Form 10-Q and Current Reports on Form 8-K, and amendments to these reports, can be viewed and printed from the investor information section of our website at www.heartlandpaymentsystems.com, as soon as reasonably practicable after filing with the SEC. Certain materials relating to our corporate governance, including our senior financial officers' code of ethics, are also available in the investor relations section of our website.
The information on the websites listed above, is not and should not be considered part of this Annual Report on Form 10-K and is not incorporated by reference in this document. These websites are, and are only intended to be, inactive textual references.
In June 2011, we submitted to the New York Stock Exchange the CEO certification required by Section 303A.12(a) of the New York Stock Exchange Listed Company Manual without qualification.
26
ITEM 1A. RISK FACTORS
An investment in our common stock involves a high degree of risk. You should consider carefully the following risks and other information contained in this Annual Report on Form 10-K and other SEC filings before you decide whether to buy our common stock. If any of the events contemplated by the following discussion of risks should occur, our business, results of operations and financial condition could suffer significantly. As a result, the market price of our common stock could decline, and you may lose all or part of the money you paid to buy our common stock.
Risks Relating to Our Business
Unauthorized disclosure of merchant and cardholder data, whether through breach of our computer systems (such as the Processing System Intrusion) or otherwise, could expose us to liability and protracted and costly litigation.
We collect and store sensitive data about merchants, including names, addresses, social security numbers, driver's license numbers and checking account numbers. In addition, we maintain a database of cardholder data relating to specific transactions, including bankcard numbers, in order to process the transactions and for fraud prevention. Any loss of cardholder data by us or our merchants could result in significant fines and sanctions by the card networks or governmental bodies, which could have a material adverse effect upon our financial position and/or results of operations. In addition, a significant breach could result in our being prohibited from processing transactions for card networks.
Our computer systems have been, and could be in the future, subject to penetration by hackers and our encryption of data may not prevent unauthorized use (See "Item 1.Business — Processing System Intrusion"). In this event, we may be subject to liability, including claims for unauthorized purchases with misappropriated bankcard information, impersonation or other similar fraud claims. We could also be subject to liability for claims relating to misuse of personal information, such as unauthorized marketing purposes. These claims also could result in protracted and costly litigation. In addition, we could be subject to penalties or sanctions from the card networks.
Although we generally require that our agreements with our service providers who have access to merchant and customer data include confidentiality obligations that restrict these parties from using or disclosing any customer or merchant data except as necessary to perform their services under the applicable agreements, we cannot assure you that these contractual measures will prevent the unauthorized use or disclosure of data. In addition, our agreements with financial institutions require us to take certain protective measures to ensure the confidentiality of merchant and consumer data. Any failure to adequately enforce these protective measures could result in protracted and costly litigation.
If we fail to comply with the applicable requirements of the Visa and MasterCard bankcard networks, Visa or MasterCard could seek to fine us, suspend us or terminate our registrations. Fines could have an adverse effect on our operating results and financial condition, and if these registrations are terminated, we will not be able to conduct our primary business.
If we are unable to comply with Visa and MasterCard bankcard network requirements, Visa or MasterCard could seek to fine us, suspend us or terminate our registrations. On occasion, we have received notices of non-compliance and fines, which have typically related to excessive chargebacks by a merchant or data security failures on the part of a merchant. If we are unable to recover fines from our merchants, we will experience a financial loss. The termination of our registration, or any changes in the Visa or MasterCard rules that would impair our registration, could require us to stop providing Visa and MasterCard payment processing services, which would make it impossible for us to conduct our business on its current scale.
Subsequent to the discovery of the Processing System Intrusion, we were advised by Visa that based on Visa's investigation of the Processing System Intrusion, Visa had removed us from Visa' published list of PCI-DSS compliant service providers. We were similarly advised by MasterCard that, based on MasterCard's investigation of the Processing System Intrusion, MasterCard believed we were in violation of the MasterCard Standards and that, based on that belief, MasterCard removed us from MasterCard's published list of Compliant Service Providers. In April 2009, we were re-certified as PCI-DSS compliant and the assessor's report attesting to such re-certification was reviewed and approved by Visa. Visa placed us in a “probationary status” for the two years following our re-certification as being PCI-DSS compliant, during which time our failure to comply with the probationary requirements set forth by Visa or with the Visa operating regulations could have resulted in Visa seeking to impose further risk conditions on us, including but not limited to our disconnection from VisaNet or our disqualification from the Visa payment system. In July 2011 Visa lifted that probationary status. In April 2009, MasterCard returned us to its published list of Compliant Service Providers.
27
We are subject to the business cycles and credit risk of our merchants, which could negatively impact our financial results.
A recessionary economic environment could have a negative impact on our merchants, which could, in turn, negatively impact our financial results, particularly if the recessionary environment disproportionately affects some of the market segments that represent a larger portion of our bankcard processing volume, like restaurants. If our merchants make fewer sales of their products and services, we will have fewer transactions to process, resulting in lower revenue. In addition, we have a certain amount of fixed and semi-fixed costs, including rent, processing contractual minimums and salaries, which could limit our ability to quickly adjust costs and respond to changes in our business and the economy.
In a recessionary environment our merchants could also experience a higher rate of business closures, which could adversely affect our business and financial condition. During prior recessions, including the 2008-2009 recession, we experienced a slowdown in the rate of same-store sales growth and an increase in business closures. In the event of a closure of a merchant, we are unlikely to receive our fees for any transactions processed by that merchant in its final month of operation.
While we service a broad range of merchants, restaurants represent a significant portion of our merchant base. The failure rate of restaurants is typically high, which increases our merchant attrition and reject losses. A reduction in consumer spending, particularly at restaurants, would further increase our rate of merchant attrition and reject losses.
The payment processing industry is highly competitive and we compete with certain firms that are larger and that have greater financial resources. Such competition could increase, which would adversely influence our prices to merchants, and as a result, our operating margins.
The market for payment processing services is highly competitive. Other providers of payment processing services have established a sizable market share in the small and mid-sized merchant processing sector. Maintaining our historic growth will depend on a combination of the continued growth in electronic payment transactions and our ability to increase our market share. The weakness of the current economic recovery could cause future growth in electronic payment transactions to slow compared to historical rates of growth and the Processing System Intrusion could negatively impact our ability to increase our market share. According to The Nilson Report, we accounted for approximately 2.8% of the $2.6 trillion of total dollar volume (which we refer to as bankcard processing volume) processed by all bankcard acquirers in 2010. This competition may influence the prices we are able to charge. If the competition causes us to reduce the prices we charge, we will have to aggressively control our costs in order to maintain acceptable profit margins. In addition, some of our competitors are financial institutions, subsidiaries of financial institutions or well-established payment processing companies, including First Data Corporation, Global Payments Inc., Vantiv, Inc., Chase Paymentech Solutions, Bank of America Merchant Services, Wells Fargo and Elavon, Inc. Our competitors that are financial institutions or subsidiaries of financial institutions do not incur the costs associated with being sponsored by a bank for registration with the card networks and can settle transactions more quickly for their merchants than we can for ours. These competitors have substantially greater financial, technological, management and marketing resources than we have. This may allow our competitors to offer more attractive fees to our current and prospective merchants, or other products or services that we do not offer. This could result in a loss of customers, greater difficulty attracting new customers, and a reduction in the price we can charge for our services.
We have faced, and will in the future face, chargeback liability when our merchants refuse or cannot reimburse chargebacks resolved in favor of their customers, reject losses when our merchants go out of business, and merchant fraud. We cannot accurately anticipate these liabilities, which may adversely affect our results of operations and financial condition.
In the event a billing dispute between a cardholder and a merchant is not resolved in favor of the merchant, the transaction is normally “charged back” to the merchant and the purchase price is credited or otherwise refunded to the cardholder. If we or our clearing banks are unable to collect such amounts from the merchant's account, or if the merchant refuses or is unable, due to closure, bankruptcy or other reasons, to reimburse us for the chargeback, we bear the loss for the amount of the refund paid to the cardholder. The risk of chargebacks is typically greater with those merchants that promise future delivery of goods and services rather than delivering goods or rendering services at the time of payment. We may experience significant losses from chargebacks in the future. Any increase in chargebacks not paid by our merchants may adversely affect our financial condition and results of operations.
Reject losses arise from the fact that we collect our fees from our SME merchants on the first day after the monthly billing period. This results in the build-up of a substantial receivable from our customers, which significantly exceeds the receivables of any of our competitors which assess their fees on a daily basis. If a merchant has gone out of business during the
28
billing period, we may be unable to collect such fees. In addition, if our sponsor bank is unable, due to system disruption or other failure, to collect our fees from our merchants, we would face a substantial loss.
We have potential liability for fraudulent bankcard transactions initiated by merchants. Merchant fraud occurs when a merchant knowingly uses a stolen or counterfeit bankcard or card number to record a false sales transaction, processes an invalid bankcard or intentionally fails to deliver the merchandise or services sold in an otherwise valid transaction. We have established systems and procedures designed to detect and reduce the impact of merchant fraud, but we cannot assure you that these measures are or will be effective. It is possible that incidents of fraud could increase in the future. Failure to effectively manage risk and prevent fraud would increase our chargeback liability. Increases in chargebacks could have an adverse effect on our operating results and financial condition.
We incurred charges relating to chargebacks, reject losses and merchant fraud of $5.1 million, $9.1 million and $5.9 million in the years ended December 31, 2011, 2010 and 2009, respectively. The 2009 and 2010 year-over-year increases in our merchant losses tracked the overall deteriorating economic conditions in those years which contributed to increased incidences of merchant fraud.
Increased merchant attrition that we cannot offset with increased bankcard processing volume from same store sales growth or new accounts would cause our revenues to decline.
We experience attrition in merchant bankcard processing volume resulting from several factors, including business closures, transfers of merchants' accounts to our competitors and account closures that we initiate due to heightened credit risks relating to, or contract breaches by, merchants, and when applicable same store sales contraction. During the year ended December 31, 2011, we experienced an improved 13.5% average annualized attrition in our SME bankcard processing volume compared to an average annualized attrition of 15.3% and 22.6% for the years ended December 31, 2010 and 2009, respectively. Substantially all of our SME processing contracts may be terminated by either party on relatively short notice. We cannot predict the level of attrition in the future, and it could increase. Increased attrition in merchant bankcard processing volume may have an adverse effect on our financial condition and results of operations. If we are unable to establish accounts with new merchants or otherwise increase our bankcard processing volume in order to counter the effect of this attrition, our revenues will decline.
We rely on sponsor banks, which have substantial discretion with respect to certain elements of our business practices, in order to process bankcard transactions. If these sponsorships are terminated and we are unable to secure new bank sponsors, we will not be able to conduct our business.
Over 85% of our revenue is derived from processing Visa and MasterCard bankcard transactions. Because we are not a bank, we are not eligible for membership in the Visa and MasterCard networks and are, therefore, unable to directly access the bankcard networks, which are required to process Visa and MasterCard transactions. Visa and MasterCard operating regulations require us to be sponsored by a member bank in order to process bankcard transactions. We are currently registered with Visa and MasterCard through KeyBank, which has maintained that registration since 1999, Heartland Bank, which has been a sponsor since December 2007, The Bancorp Bank, which has been a sponsor since February 2010, and Barclays Bank Delaware which has been a sponsor since March 2011. Our agreements with KeyBank, Heartland Bank, The Bancorp Bank and Barclays Bank Delaware expire September 2012, September 2013, November 2014 and March 2016, respectively. On February 8, 2012, we entered into a sponsor bank agreement with Wells Fargo Bank, N.A. If our sponsorships are terminated and we are unable to secure another bank sponsor or sponsors, we will not be able to process Visa and MasterCard transactions. Furthermore, some agreements give the sponsor banks substantial discretion in approving certain aspects of our business practices, including our solicitation, application and qualification procedures for merchants, the terms of our agreements with merchants and our customer service levels. Our sponsor banks' discretionary actions under these agreements could be detrimental to our operations.
If we cannot pass increases in bankcard network interchange fees, assessments and transaction fees along to our merchants, our operating margins will be reduced.
We pay interchange fees and other network fees set by the bankcard networks to the card issuing bank and the bankcard networks for each transaction we process. From time to time, the bankcard networks increase the interchange fees and other network fees that they charge payment processors and the sponsor banks. At their sole discretion, our sponsor banks have the right to pass any increases in interchange fees on to us and have consistently done so in the past. We are allowed to, and in the past we have been able to, pass these fee increases along to our merchants through corresponding increases in our processing fees. However, if we are unable to do so in the future, our operating margins will be reduced.
29
Current or future bankcard network rules and practices could adversely affect our business.
We are registered with the Visa and MasterCard networks through our bank sponsors as an Independent Sales Organization with Visa and a Member Service Provider with MasterCard. We are currently a sales agent for American Express and a registered Acquirer with Discover. The rules of the bankcard networks are set by their boards, which may be strongly influenced by card issuers, and some of those card issuers are our competitors with respect to these processing services. Many banks directly or indirectly sell processing services to merchants in direct competition with us. These banks could attempt, by virtue of their influence on the networks, to alter the networks' rules or policies to the detriment of non-members like us. The bankcard networks or issuers who maintain our registrations or arrangements or the current bankcard network or issuer rules allowing us to market and provide payment processing services may not remain in effect. The termination of our registration or our status as an Independent Sales Organization or Member Service Provider, or any changes in card network or issuer rules that limit our ability to provide payment processing services, could have an adverse effect on our bankcard processing volumes, revenues or operating costs. In addition, if we were precluded from processing Visa and MasterCard bankcard transactions, we would lose substantially all of our revenues.
Any new laws and regulations, or revisions made to existing laws, regulations, or other industry standards affecting our business may have an unfavorable impact on our operating results and financial condition.
Our business is impacted by laws and regulations that affect the bankcard industry. The number of new and proposed regulations has increased significantly, particularly pertaining to interchange fees on bankcard transactions, which are paid to the bank card issuer. In July 2010, Congress passed The Dodd-Frank Wall Street Reform and Consumer Protection Act (the “Dodd-Frank Act”), which significantly changed financial regulation. Changes included restricting amounts of debit card fees that certain issuer banks can charge merchants and allowing merchants to offer discounts for different payment methods. The impact, which new requirements imposed by the Dodd-Frank Act or other new regulation will have on our operating results, is difficult to determine, as their implementation could result in the need for us to modify our services and processing platforms. As new requirements are mandated, these regulations could adversely affect our operating results and financial condition.
Governmental regulations designed to protect or limit access to consumer information could adversely affect our ability to effectively provide our services to merchants.
Governmental bodies in the United States and abroad have adopted, or are considering the adoption of, laws and regulations restricting the transfer of, and safeguarding, non-public personal information. For example, in the United States, all financial institutions must undertake certain steps to ensure the privacy and security of consumer financial information. While our operations are subject to certain provisions of these privacy laws, we have limited our use of consumer information solely to providing services to other businesses and financial institutions. We limit sharing of non-public personal information to that necessary to complete the transactions on behalf of the consumer and the merchant and to that permitted by federal and state laws. In connection with providing services to the merchants and financial institutions that use our services, we are required by regulations and contracts with our merchants to provide assurances regarding the confidentiality and security of non-public consumer information. These contracts require periodic audits by independent companies regarding our compliance with industry standards and best practices established by regulatory guidelines. The compliance standards relate to our infrastructure, components, and operational procedures designed to safeguard the confidentiality and security of non-public consumer personal information shared by our clients with us. Our ability to maintain compliance with these standards and satisfy these audits will affect our ability to attract and maintain business in the future. The cost of such systems and procedures may increase in the future and could adversely affect our ability to compete effectively with other similarly situated service providers.
Our systems and our third-party providers' systems may fail due to factors beyond our control, which could interrupt our service, cause us to lose business and increase our costs.
We depend on the efficient and uninterrupted operation of our computer network systems, software, data center and telecommunications networks, as well as the systems of third parties. Our systems and operations or those of our third-party providers could be exposed to damage or interruption from, among other things, fire, natural disaster, power loss, telecommunications failure, unauthorized entry and computer viruses. Our property and business interruption insurance may not be adequate to compensate us for all losses or failures that may occur. Defects in our systems or those of third parties, errors or delays in the processing of payment transactions, telecommunications failures or other difficulties could result in:
• | loss of revenues; |
• | loss of merchants, although our contracts with merchants do not expressly provide a right to terminate for business |
30
interruptions;
• | loss of merchant and cardholder data; |
• | harm to our business or reputation; |
• | exposure to fraud losses or other liabilities; |
• | negative publicity; |
• | additional operating and development costs; and/or |
• | diversion of technical and other resources. |
If we fail to protect our intellectual property rights and defend ourselves from potential patent infringement claims, our competitive advantages may diminish or our ability to offer services to our customers could be restricted.
Our patents, trademarks, proprietary software and other intellectual property are critical to our future success. We rely on proprietary technology. It is possible that others will independently develop the same or similar technologies. Assurance of protecting our rights and proprietary information cannot be guaranteed. Our patents could be challenged, invalidated or circumvented by others and may not be of sufficient scope or strength to provide any meaningful protection or advantage. If we are unable to maintain the proprietary nature of our technologies, we could lose competitive advantages and be materially adversely affected. Adverse determinations in judicial or administrative proceedings could prevent us from selling our services or prevent us from precluding others from selling competing services, and thereby may have a material adverse affect on the business and results of operations. Additionally, claims have been made, are currently pending, and other claims may be made in the future, with regard to our technology infringing on a patent or other intellectual property rights of others. Unfavorable resolution of these claims could either result in our being restricted from delivering the related service or result in an unfavorable settlement that could be material to our operating results, financial condition and cash flow.
Adverse conditions in markets in which we obtain a substantial amount of our bankcard processing volume, such as our largest SME merchant markets of California, New York, Texas, Florida, and New Jersey, could negatively affect our results of operations.
Adverse economic or other conditions in California, Texas, New York, Florida, and New Jersey would negatively affect our revenue and could materially and adversely affect our results of operations. In December 2011, SME merchants in California represented 10.8%, in Texas represented 5.8%, in New York represented 5.5%, in Florida represented 4.8%, and in New Jersey represented 4.0% of our SME bankcard processing volume. As a result of this geographic concentration of our merchants in these markets, we are exposed to the risks of downturns in these local economies and to other local conditions, which could adversely affect the operating results of our merchants in these markets. No other state represented more than 4% of our SME bankcard processing volume in December 2011.
If we lose key personnel or are unable to attract additional qualified personnel as we grow, our business could be adversely affected.
We are dependent upon the ability and experience of a number of our key personnel who have substantial experience with our operations, the rapidly changing payment processing industry and the selected markets in which we offer our services. It is possible that the loss of the services of one or a combination of our senior executives or key managers, particularly Robert O. Carr, our Chief Executive Officer, would have an adverse effect on our operations. Our success also depends on our ability to continue to attract, manage and retain other qualified middle management and technical and clerical personnel as we grow. We may not continue to attract or retain such personnel.
If we are unable to attract and retain qualified sales people, our business and financial results may suffer.
Unlike many of our competitors who rely on Independent Sales Organizations or salaried salespeople and telemarketers, we rely on a direct sales force whose compensation is entirely commission-based. Through our direct sales force of approximately 790 Relationship Managers and Territory Managers, we seek to increase the number of merchants using our products and services. We intend to significantly increase the size of our sales force. Our success partially depends on the skill and experience of our sales force. If we are unable to retain and attract sufficiently experienced and capable Relationship Managers, our business and financial results may suffer.
Any acquisitions or portfolio buyouts that we make could disrupt our business and harm our financial condition.
We expect to evaluate potential strategic acquisitions of complementary businesses, products or technologies. We may not be able to successfully finance or integrate any businesses, products or technologies that we acquire. Furthermore, the integration of any acquisition may divert management's time and resources from our core business and disrupt our operations.
31
We may spend time and money on projects that do not increase our revenue. To the extent we pay the purchase price of any acquisition in cash, it would reduce our cash reserves, and to the extent the purchase price is paid with our stock, it could be dilutive to our stockholders. While we, from time to time, evaluate potential acquisitions of businesses, products and technologies, and anticipate continuing to make these evaluations, we have no present understandings, commitments or agreements with respect to any acquisitions.
We also regularly buy out the residual commissions of our Relationship Managers and sales managers, at multiples that typically amount to 21/2 years of such commissions. If the merchants included in the portfolios we purchase do not generate sufficient incremental margin after the purchase, we will not achieve a positive return on the cash expended.
Our operating results are subject to seasonality, which could result in fluctuations in our quarterly net income.
We have experienced in the past, and expect to continue to experience, seasonal fluctuations in our revenues as a result of consumer spending patterns. Historically our revenues have been strongest in our second and third quarters, and weakest in our first quarter.
We may become subject to additional U.S., state or local taxes that cannot be passed through to our merchants, which could negatively affect our results of operations.
Companies in the payment processing industry, including us, may become subject to taxation in various tax jurisdictions on our net income or revenues. Taxing jurisdictions have not yet adopted uniform positions on taxation. If we are required to pay additional taxes on our revenues and are unable to pass the tax expense through to our merchants, our costs would increase and our net income would be reduced.
We may need to raise additional funds to finance our future capital needs, which may prevent us from growing our business.
We may need to raise additional funds to finance our future capital needs, including developing new products and technologies, and operating expenses. We may need additional financing earlier than we anticipate if we:
• | experience material costs to mitigate the impacts of, and resolve remaining claims originating from, the Processing System Intrusion; |
• | expand faster than our internally generated cash flow can support; |
• | purchase portfolio equity (the portion of our commissions that we have committed to our sales force for as long as the merchant processes with us, which we may buy out at an agreed multiple) from a large number of Relationship Managers or sales managers; |
• | add new merchant accounts faster than expected; |
• | need to reduce pricing in response to competition; |
• | repurchase our common stock; or |
• | acquire complementary products, business or technologies. |
If we raise additional funds through the sale of equity securities, these transactions may dilute the value of our outstanding common stock. We may also decide to issue securities, including debt securities that have rights, preferences and privileges senior to our common stock. We may be unable to raise additional funds on terms favorable to us or at all. If financing is not available or is not available on acceptable terms, we may be unable to fund our future needs. This may prevent us from increasing our market share, capitalizing on new business opportunities or remaining competitive in our industry.
Risks Related to Our Company
Borrowings under our Second Amended and Restated Credit Agreement could adversely affect our financial condition, and the related debt service obligations may adversely affect our cash flow and ability to invest in and grow our businesses.
The interest rates on debt outstanding under our Second Amended and Restated Credit Agreement are floating based on the LIBOR rate; accordingly, if the LIBOR rate increases, our interest expense will be higher on the portion of our debt outstanding not managed with interest rate swaps. At December 31, 2011, there was $85.0 million outstanding under the Term Credit Facility. The Term Credit Facility requires amortization payments in the amount of $3.75 million for each fiscal quarter during the fiscal years ended December 31, 2011 and 2012, $5.0 million for each fiscal quarter during the fiscal years ended
32
December 31, 2013 and 2014, and $7.5 million for each fiscal quarter during the period commencing on January 1, 2015 through the maturity date on November 24, 2015. In January 2011, we entered into fixed-pay amortizing interest rate swaps having an initial notional amount of $50 million, or 50% of the variable rate debt outstanding under the Term Credit Facility. These interest rate swaps convert that initial notional amount to fixed rate. At December 31, 2011, the remaining notional amount of these interest rate swaps was $42.5 million and the fair value of these interest rate swaps, a liability of $0.9 million, was recorded in accrued expenses and other liabilities. The related deferred tax benefit was $0.3 million.
We intend to fulfill our total debt service obligations primarily from cash generated by our operations. Such funds will not be available to use in future operations, or investing in our businesses. This may adversely impact our ability to expand our businesses or make other investments. If we are unable to meet our debt obligations, we could be forced to restructure or refinance our obligations, to seek additional equity financing or to sell assets, which we may not be able to do on satisfactory terms or at all. As a result, we could default on those obligations and in the event of such default, our lenders could accelerate our debt or take other actions that could restrict our operations.
Our borrowing agreements contain restrictions which may limit our flexibility in operating and growing our business.
Our borrowing agreements contain covenants, including the maintenance of certain leverage and fixed charge coverage ratios, limitations on the amount of our indebtedness, liens on our properties and assets, investments in, and loans to, other business units, our ability to enter into business combinations and asset sales, and certain other financial and non-financial covenants. We were in compliance with these covenants as of December 31, 2011.
These covenants limit our ability to engage in specified types of transactions, including among other things:
• | incur additional indebtedness or issue equity; |
• | pay dividends on, repurchase or make distributions in respect of our common stock; |
• | make certain investments; |
• | sell certain assets; |
• | create liens; |
• | consolidate, merge, sell or otherwise dispose of all or substantially all of our assets; and |
• | enter into certain transactions with respect to our subsidiaries. |
Future sales of our common stock, or the perception in the public markets that these sales may occur, could depress our stock price.
Sales of substantial amounts of our common stock in the public market, or the perception in the public markets that these sales may occur, could cause the market price of our common stock to decline. This could also impair our ability to raise additional capital through the sale of our equity securities. At December 31, 2011, we had 38,847,957 shares of our common stock outstanding. In addition, as of December 31, 2011, we had outstanding stock options and restricted share units totaling 7,069,167 shares issued under our 2008 Incentive Stock Option Plan and our 2000 Incentive Stock Option Plan, of which 2,264,769 were vested. Assuming the exercise of all outstanding options to acquire our common stock and the vesting of all restricted share units, our current stockholders would own on a fully-diluted basis 85% of the outstanding shares of our common stock, and the number of shares of our common stock available to trade could cause the market price of our common stock to decline. In addition to the adverse effect a price decline could have on holders of our common stock, such a decline could impede our ability to raise capital or to make acquisitions through the issuance of additional shares of our common stock or other equity securities.
Failure to maintain effective systems of internal control over financial reporting and disclosure controls and procedures could cause a loss of confidence in our financial reporting and adversely affect the trading price of our common stock.
Effective control over financial reporting is necessary for us to provide accurate financial information. Section 404 of the Sarbanes-Oxley Act requires us to evaluate the effectiveness of our internal controls over financial reporting as of the end of each fiscal year and to include a management report assessing the effectiveness of our internal controls over financial reporting in our Annual Report on Form 10-K. If we fail to maintain the adequacy of our internal controls, we may not be able to conclude and report that we have effective internal control over financial reporting. If we are unable to adequately maintain our internal controls over financial reporting, we may not be able to accurately report our financial results, which could cause investors to lose confidence in our reported financial information, negatively effecting the trading price of our common stock, or our ability to access the capital markets.
Provisions in our charter documents and Delaware law could discourage a takeover that our shareholders may consider favorable or could cause current management to become entrenched and difficult to replace.
33
Provisions in our amended and restated certificate of incorporation, in our bylaws and under Delaware law could make it more difficult for other companies to acquire us, even if doing so would benefit our stockholders. Our amended and restated certificate of incorporation and bylaws contain the following provisions, among others, which may inhibit an acquisition of our company by a third party:
• | advance notification procedures for matters to be brought before stockholder meetings; |
• | a limitation on who may call stockholder meetings; |
• | a prohibition on stockholder action by written consent; and |
• | the ability of our Board of Directors to issue up to 10 million shares of preferred stock without a stockholder vote. |
If any shares of preferred stock are issued that contain an extraordinary dividend or special voting power, a change in control could be impeded.
We are also subject to provisions of Delaware law that prohibit us from engaging in any business combination with any “interested stockholder,” meaning, generally, that a stockholder who beneficially owns more than 15% of our stock cannot acquire us for a period of three years from the date this person became an interested stockholder unless various conditions are met, such as approval of the transaction by our Board of Directors. Any of these restrictions could have the effect of delaying or preventing a change in control.
We may be unable or we may decide not to pay dividends on our common stock at a level anticipated by shareholders, which could depress our stock price.
The payment of dividends on our common stock in the future will be at the discretion of our Board of Directors and will depend on, among other factors, our earnings, stockholders' equity, cash position and financial condition. No assurance can be given that we will be able to or will choose to pay any dividends in the foreseeable future.
ITEM 1B. UNRESOLVED STAFF COMMENTS
Not Applicable.
ITEM 2. PROPERTIES
At December 31, 2011, we owned one facility and leased sixteen facilities which we use for operational, sales and administrative purposes.
Our principal executive offices are located in approximately 9,300 square feet of leased office space on Nassau Street in Princeton, New Jersey. The Nassau Street lease expires in May 2013.
We own 35 acres of land in Jeffersonville, Indiana, on which we constructed our credit card operations and service center. The state-of-the-art facility is comprised of 238,000 square feet of space supporting customer service, operations, deployment, day care, fitness, cafeteria, and large company meetings.
The Heartland Payroll Company and the corporate human resources department, located in Cleveland, will be moving into a larger office space in the first half of 2012. This will consolidate several non-contiguous spaces into a more efficient office layout while allowing for future growth.
We also leased the following facilities as of December 31, 2011:
34
Location | Square Feet | Expiration | ||
Alpharetta, Georgia | 150 | Month-to-month | ||
Auburn, Alabama | 2,382 | April 30, 2014 | ||
Chattanooga, Tennessee | 9,461 | June 30, 2014 | ||
Cleveland, Ohio | 24,229 | June 30, 2012 | ||
Cleveland, Ohio | 41,595 | June 30, 2019 | ||
Colorado Springs, Colorado | 9,920 | February 28, 2015 | ||
Johnson City, Tennessee | 5,252 | April 17, 2014 | ||
Phoenix, Arizona | 1,284 | April 30, 2013 | ||
Phoenix, Arizona | 1,930 | October 31, 2012 | ||
Plano, Texas | 53,976 | May 31, 2015 for 26,988 square feet. January 14, 2019 for 26,988 square feet. | ||
Plano, Texas | 26,020 | January 31, 2015 | ||
Portland, Oregon | 11,564 | September 30, 2013 | ||
Tempe, Arizona | 14,315 | September 30, 2014 | ||
Toronto, Ontario, Canada | 14,094 | July 31, 2020 | ||
West Windsor Township, New Jersey | 5,288 | May 31, 2013 | ||
We believe that our facilities are suitable and adequate for our current business operations and, if necessary, could be replaced with little disruption to our company. We periodically review our space requirements and may acquire new space to meet our business needs or consolidate and dispose of or sublet facilities which are no longer required.
ITEM 3. LEGAL PROCEEDINGS
Processing System Intrusion Legal Proceedings
To date, we have had several lawsuits filed against us and additional lawsuits may be filed. These include lawsuits which assert claims against us by cardholders (including various putative class actions seeking in the aggregate to represent all cardholders in the United States whose transaction information is alleged to have been placed at risk in the course of the Processing System Intrusion) and banks that issued payment cards to cardholders whose transaction information is alleged to have been placed at risk in the course of the Processing System Intrusion (including various putative class actions seeking to represent all financial institutions that issued payment cards to cardholders whose transaction information is alleged to have been placed at risk in the course of the Processing System Intrusion), seeking damages allegedly arising out of the Processing System Intrusion and other related relief. The actions generally assert various common-law claims such as claims for negligence and breach of contract, as well as, in some cases, statutory claims such as violation of the Fair Credit Reporting Act, state data breach notification statutes, and state unfair and deceptive practices statutes. The putative cardholder class actions seek various forms of relief including damages, injunctive relief, multiple or punitive damages, attorneys' fees and costs. The putative financial institution class actions seek compensatory damages, including recovery of the cost of issuance of replacement cards and losses by reason of unauthorized transactions, as well as injunctive relief, attorneys' fees and costs.
The putative consumer class actions and putative financial institution class actions filed against us through February 24, 2012 are described below.
Putative Consumer Class Actions
Name of the Court | Date Filed | Principal Parties |
United States District Court for the District of New Jersey | January 23, 2009 | Sansom and Engel v. Heartland Payment Systems, Inc. et al., 3:09-cv-00335 |
United States District Court for the Northern District of Florida | January 26, 2009 | Read v. Heartland Payment Systems, Inc. et al., 3:09-cv-00035 |
United States District Court for the District of Arizona | January 29, 2009 | Swenka v. Heartland Payment Systems, Inc. et al., 2:09-cv-00179 |
United States District Court for the District of Kansas | January 29, 2009 | Barrett v. Heartland Payment Systems, Inc. et al., 09-cv-2053 |
35
Putative Consumer Class Actions (continued)
Name of the Court | Date Filed | Principal Parties |
United States District Court for the District of New Jersey | January 29, 2009 | Merino v. Heartland Payment Systems, Inc. et al., 3:09-cv-00439 |
United States District Court for the Middle District of Alabama | February 2, 2009 | Brown, Latham and Spencer v. Heartland Payment Systems, Inc. et al., 2:09-cv-00086 |
United States District Court for the Eastern District of California | February 2, 2009 | Hilliard v. Heartland Payment Systems, Inc. et al., 1:09-cv-00179 |
United States District Court for the District of New Jersey | February 2, 2009 | Kaissi v. Heartland Payment Systems, Inc. et al., 3:09-cv-00540 |
United States District Court for the Northern District of Ohio | February 3, 2009 | McGinty and Carr v. Heartland Payment Systems, Inc. et al., 1:09-cv-00244 |
United States District Court for the Southern District of Texas | February 4, 2009 | Watson v. Heartland Payment Systems, Inc. et al., 4:09-cv-00325 |
United States District Court for the Eastern District of Wisconsin | February 4, 2009 | Anderson and Hoven v. Heartland Payment Systems, Inc. et al., 2:09-cv-00113 |
United States District Court for the Southern District of Florida | February 6, 2009 | Balloveras v. Heartland Payment Systems, Inc. et al., 1:09-cv-20326 |
United States District Court for the Southern District of California | February 25, 2009 | Mata v. Heartland Payment Systems, Inc. et al., 3:09-cv-00376 |
United States District Court for the Western District of Missouri | February 26, 2009 | McLaughlin v. Heartland Payment Systems, Inc. et al., 6:09-cv-3069 |
United States District Court for the District of New Jersey | February 27, 2009 | Rose v. Heartland Payment Systems, Inc. et al., 3:09-cv-00917 |
United States District Court for the Southern District of Illinois | April 21, 2009 | Leavell v. Heartland Payment Systems, Inc. et al., 3:09-cv-00270 |
United States District Court for the Eastern District of Arkansas | April 30, 2009 | Brown v. Heartland Payment Systems, Inc. et al., 4:09-cv-00384 |
Putative Financial Institution Class Actions
Name of the Court | Date Filed | Principal Parties |
United States District Court for the District of New Jersey | February 6, 2009 | Lone Summit Bank v. Heartland Payment Systems, Inc. et al., 3:09-cv-00581 |
United States District Court for the District of New Jersey | February 13, 2009 | TriCentury Bank et al. v. Heartland Payment Systems, Inc. et al., 3:09-cv-00697 |
United States District Court for the Southern District of Texas | February 16, 2009 | Lone Star National Bank v. Heartland Payment Systems, Inc. et al., 7:09-cv-00064 |
United States District Court for the District of New Jersey | February 20, 2009 | Amalgamated Bank et al. v. Heartland Payment Systems, Inc. et al., 3:09-cv-00776 |
United States District Court for the Southern District of Florida | March 19, 2009 | First Bankers Trust Co., N.A. v. Heartland Payment Systems, Inc. et al., 4:09-cv-00825 |
United States District Court for the Southern District of Florida | March 31, 2009 | PBC Credit Union et al. v. Heartland Payment Systems, Inc. et al., 9:09-cv-80481 |
36
Putative Financial Institution Class Actions (Continued)
Name of the Court | Date Filed | Principal Parties |
United States District Court for the Southern District of Florida | March 19, 2009 | First Bankers Trust Co., N.A. v. Heartland Payment Systems, Inc. et al., 4:09-cv-00825 |
United States District Court for the Southern District of Florida | March 31, 2009 | PBC Credit Union et al. v. Heartland Payment Systems, Inc. et al., 9:09-cv-80481 |
United States District Court for the Southern District of Texas | April 22, 2009 | Community West Credit Union, et al. v. Heartland Payment Systems, Inc. et al., 4:09-cv-01201 |
United States District Court for the Southern District of Texas | April 22, 2009 | Eden Financial Corp. v. Heartland Payment Systems, Inc. et al., 4:09-cv-01203 |
United States District Court for the Southern District of Texas | April 28, 2009 | Heritage Trust Federal Credit Union v. Heartland Payment Systems, Inc. et al., 4:09-cv-01284 |
United States District Court for the Southern District of Texas | May 1, 2009 | Pennsylvania State Employees Credit Union v. Heartland Payment Systems, Inc. et al., 4:09-cv-01330 |
On June 10, 2009, the Judicial Panel on Multidistrict Litigation (the “JPML”) entered an order centralizing the class action cases for pre-trial proceedings before the United States District Court for the Southern District of Texas, under the caption In re Heartland Payment Systems, Inc. Customer Data Security Breach Litigation, MDL No. 2046, 4:09-md-2046. On August 24, 2009, the court appointed interim co-lead and liaison counsel for the financial institution and consumer plaintiffs. On September 23, 2009, the financial institution plaintiffs filed a Master Complaint in the MDL proceedings, which we moved to dismiss on October 23, 2009. Briefing on that motion to dismiss concluded on February 1, 2010 and the motion remains pending. On December 18, 2009, we and interim counsel for the consumer plaintiffs filed with the Court a proposed settlement agreement, subject to court approval, of the consumer class action claims. On May 3, 2010, the Court entered an order preliminarily certifying the settlement class, authorizing notice to the class to proceed, and scheduling a fairness hearing for December 10, 2010, which was later adjourned to December 13, 2010. We and interim consumer plaintiffs' counsel provided additional information requested by the Court following the hearing, and the Court has taken the proposed settlement under advisement.
Other actions have been filed against us seeking damages allegedly arising out of the Processing System Intrusion and other related relief on an individual basis. On December 28, 2009, Putnam Bank of Putnam, Connecticut filed a complaint in Connecticut Superior Court, Putnam Bank v. Heartland Payment Systems, Inc., case no. WWM-CV-10-6001208-S. On January 20, 2010, we removed the action to the United States District Court for the District of Connecticut, case no. 3:10-cv-0061 (JBA), and, on January 27, 2010, filed a Notice of Potential Tag-Along Action, requesting centralization of the action with the MDL proceedings. On March 17, 2010, the action was centralized with the MDL proceedings. On February 9, 2010, OmniAmerican Bank filed a complaint in the District Court for Collin County, Texas, Civ. No. 380-00563-2012. The complaint identifies as a party in interest the Federal Insurance Company, which is alleged to have insured plaintiff and reimbursed it for $1,005,077.50, less a $100,000 deductible. On March 15, 2010, we filed an answer to the complaint and removed the action to the United States District Court for the Eastern District of Texas, case no. 4:10-cv-114, and, on March 16, 2010, filed a Notice of Potential Tag-Along Action, requesting centralization of the action with the MDL proceedings. On April 29, 2010, the action was centralized with the MDL proceedings. On February 18, 2010, Quad City Bank and Trust filed a complaint in the District Court for Collin County, Texas, Civ. No. 380-00721-2010. The complaint identifies as a party in interest the Federal Insurance Company, which is alleged to have insured plaintiff and reimbursed it for $432,420.32, less a $100,000 deductible. On March 15, 2010, we filed an answer to the complaint and removed the action to the United States District Court for the Eastern District of Texas, case no. 4:10-cv-115 and, on March 16, 2010, filed a Notice of Potential Tag-Along Action, requesting centralization of the action with the MDL proceedings. On April 29, 2010, the action was centralized with the MDL proceedings. On May 5, 2010, Napus Federal Credit Union filed a complaint in the United States District Court for the Southern District of Texas, case no. 4:10-cv-1616, and the action was consolidated with the MDL proceedings on June 9, 2010.
On January 19, 2010, financial institution plaintiffs, including certain of the named plaintiffs in the MDL proceedings, commenced an action against our sponsor banks in the United States District Court for the Southern District of Texas, captioned Lonestar National Bank, N.A. et al. v. KeyBank NA, et al., Civ. No. 4:10-cv-00171. This action against our sponsor
37
banks asserts common-law claims similar to those asserted against us, and likewise seeks to represent all financial institutions that issued payment cards to cardholders whose transaction information is alleged to have been placed at risk in the course of the Processing System Intrusion. On March 4, 2010, this action was transferred to the judge overseeing the MDL proceedings. On April 9, 2010, our sponsor banks moved to dismiss the complaint. On March 31, 2011, the Court entered an order granting the sponsor banks' motions to dismiss the complaint and invited additional briefing on the effect of the Court's order on our pending motion to dismiss. On May 18, 2011, the plaintiffs filed an amended complaint against KeyBank, NA, which KeyBank, NA moved to dismiss on July 7, 2011. Briefing has concluded and the Court has not yet ruled on the motion. On April 18, 2011, in accordance with its order dismissing the claims against Heartland Bank for lack of personal jurisdiction, the court transferred the action against Heartland Bank to the United States District Court for the Eastern District of Missouri. Heartland Bank filed a notice with the Judicial Panel on Multidistrict Litigation on July 27, 2011 designating the transferred action as a potential tag-along action to the MDL proceedings. The sponsor banks could seek indemnification from us in regard to the claims asserted in this action. On December 1, 2011, the Court entered an order granting in part our motion to dismiss the financial institution plaintiffs' master complaint against us, but allowing the plaintiffs leave to amend to re-plead certain claims. Plaintiffs' amended complaint was due on February 21, 2012, and plaintiffs' counsel have filed a motion seeking an extension to file an amended complaint on April 6, 2012. A status conference with the court currently is set for March, 5, 2012.
We were advised by the United States Attorney for the District of New Jersey that it commenced an investigation to determine whether there have been any violations of the federal securities laws in connection with our disclosure of the Processing Systems Intrusion and the alleged trading in our securities by certain of our employees, including certain executive officers. We cooperated with this inquiry and have received no further communication from the United States Attorney for the District of New Jersey since 2010. In addition, on June 17, 2011, the SEC informed us that its parallel investigation of us and certain of our employees has been completed and it does not intend to recommend any enforcement action.
We were contacted by the Federal Financial Institutions Examination Council and informed that it would make inquiries into the Processing System Intrusion, and the Federal Trade Commission, by letters dated February 19, 2009, August 4, 2009, and March 10, 2010, has requested that we provide information about our payment processing services and information security practices. Additionally, we have received written or telephonic inquiries relating to the Processing System Intrusion from a number of state Attorneys General's offices, including a Civil Investigative Demand from the Louisiana Department of Justice Office of the Attorney General, the Canadian Privacy Commission, and other government officials. We are cooperating with the government officials in response to each of these inquiries. Additional lawsuits may be filed against us relating to the Processing System Intrusion and that additional inquiries from governmental agencies may be received or investigations may be commenced.
Although we intend to defend the lawsuits, investigations and inquiries described above vigorously, we cannot predict the outcome of such lawsuits, investigations and inquiries. Apart from damages claimed in such lawsuits and in other lawsuits relating to the Processing System Intrusion that may be filed, we may be subject to fines or other obligations as a result of the government inquiries and investigations described above and additional governmental inquiries or investigations relating to the Processing System Intrusion that may be commenced.
Since its announcement of the Processing System Intrusion on January 20, 2009 and through December 31, 2011, we have expensed a total of $147.1 million, before reducing those charges by $31.2 million of total insurance recoveries. The majority of the total charges, or approximately $114.7 million, related to settlements of claims. Approximately $32.4 million of the total charges were for legal fees and costs we incurred for investigations, defending various claims and actions, remedial actions and crisis management services. In 2009 and 2010, we had entered into settlements with the bankcard networks for various claims and disputes related to the Processing System Intrusion. See “—Item 1. Business —Processing System Intrusion” for a discussion of these settlements.
We do not consider it a reasonable possibility that losses exceeding the amounts already recognized on the matters subject to the settlement agreements will be incurred. With regard to the unsettled claims related to the Processing System Intrusion, we determined material losses in addition to those previously accrued are not considered reasonably possible on any such claim disclosed. We are prepared to vigorously defend ourselves against any unsettled claims relating to the Processing System Intrusion that have been asserted against us and our sponsor banks to date. We feel we have strong defenses to all the claims that have been asserted against us and our sponsor banks relating to the Processing System Intrusion.
Additional costs we expect to incur for legal fees and costs for defending the unsettled claims and actions associated with the Processing System Intrusion will be recognized as incurred. Such costs are not expected to be material to our results of operations, financial condition and cash flow.
38
Other Legal Proceedings
On December 16, 2008, a putative class action was filed against us in the Superior Court of California, County of San Diego, Ryan McInerney, Hossein Vazir Zand v. Heartland Payment Systems, Inc. The plaintiffs purport to represent a putative class of individuals who allegedly were not reimbursed by us for business expenses and whose compensation was allegedly reduced for their costs of doing business. We entered into a settlement agreement with the plaintiffs to resolve the claims against us and we paid the plaintiffs $4.0 million in full and final satisfaction of the claims.
In the ordinary course of our business, we are party to various legal actions, which we believe are incidental to the operation of our business. We believe that the outcome of the proceedings to which we are currently a party will not have a material adverse effect on our financial position, results of operations or cash flows.
ITEM 4. MINE SAFETY DISCLOSURES
Not applicable.
PART II.
ITEM 5. MARKET FOR REGISTRANT'S COMMON EQUITY, RELATED STOCKHOLDER MATTERS AND ISSUER PURCHASES OF EQUITY SECURITIES
Market Information
Our common stock trades on the New York Stock Exchange under the ticker symbol “HPY.” The following table sets forth the high and low sales prices of our common stock and dividend paid per share for the four quarters during the years ended December 31, 2011 and 2010:
High | Low | Dividend Per Share | |
2010 | |||
Quarter Ended: | |||
March 31, 2010 | $19.03 | $12.95 | $0.01 |
June 30, 2010 | $19.51 | $14.78 | $0.01 |
September 30, 2010 | $16.81 | $13.48 | $0.01 |
December 31, 2010 | $16.82 | $13.57 | $0.01 |
2011 | |||
Quarter Ended: | |||
March 31, 2011 | $19.91 | $15.39 | $0.04 |
June 30, 2011 | $22.06 | $16.74 | $0.04 |
September 30, 2011 | $23.00 | $18.45 | $0.04 |
December 31, 2011 | $24.73 | $18.49 | $0.04 |
Holders of Common Stock
The number of shareholders of record of our common stock as of February 24, 2012 was 23.
Dividends
Until the third quarter of 2006, we had not paid any cash dividends on our common stock. On August 1, 2006, our Board of Directors declared the first quarterly cash dividend on our common stock. We have paid quarterly dividends on our common stock each subsequent quarter. The payment of dividends on our common stock in the future will be at the discretion of our Board of Directors and will depend on, among other factors, our earnings, stockholders' equity, cash position and financial condition. On February 8, 2012, our Board of Directors declared a quarterly cash dividend of $0.06 per share of common stock, payable on March 15, 2012 to stockholders of record as of March 2, 2012.
39
Securities Authorized For Issuance Under Equity Compensation Plans
We maintain the Heartland Payment Systems, Inc. Amended and Restated 2008 Equity Incentive Plan under which shares of our common stock are authorized for issuance. For more information on this plan, see Note 15, “Stock Incentive Plan.” Information regarding the common stock issuable under this plan as of December 31, 2011 is set forth in the following table:
Plan category | Number of securities to be issued upon exercise of outstanding options, warrants and rights | Weighted- average exercise price of outstanding options, warrants and rights | Number of securities remaining available for future issuance under equity compensation plans (excluding securities reflected in the first column) | |||
Equity compensation plans approved by security holders | 7,069,167 | $16.39 | 7,069,167 | |||
Equity compensation plans not approved by security holders | None | N/A | None | |||
Total | 7,069,167 | $16.39 | 7,069,167 | |||
Purchases of Equity Securities by the Issuer
On October 21, 2011, our Board of Directors authorized the repurchase of up to $50 million worth of our common stock. Under this authorization, in 2011 we repurchased an aggregate of 778,889 shares of our common stock at a cost of $16.8 million, or an average cost of $21.61 per share. At December 31, 2011, we have remaining authorization to repurchase up to an additional $33.2 million of our common stock.
Under authorizations from our Board of Directors received in 2006 and 2007, we repurchased an aggregate of 2,924,684 shares of our common stock at a cost of $65.1 million, or an average cost of $22.25 per share. This includes 350,400 shares repurchased at a cost of $3.2 million, or $9.14 per share, during 2009 and 781,584 shares repurchased at a cost of $18.0 million, or $23.02 per share, during 2008. No common stock was repurchased in 2010.
The following table presents information with respect to those purchases of our common stock made during the three months ended December 31, 2011:
Total Number of Shares Purchased | Average Price Paid Per Share | Total number of shares purchased as part of publicly announced plans or programs | Maximum number (or approximate dollar value) of shares that may yet be purchased under the plans or programs | |||||
(in thousands) | ||||||||
October 1—31, 2011 | — | $ — | — | $50,000 | ||||
November 1—30, 2011 | 577,640 | 21.00 | 577,640 | 37,869 | ||||
December 1 — 31, 2011 | 201,249 | 23.34 | 201,249 | 33,172 | ||||
778,889 | $21.61 | 778,889 | ||||||
40
Performance Graph
The following graph compares the percentage change in cumulative total stockholder return on our common stock for the past five years with the cumulative total returns over the same period of (i) the S&P 500 Index and (ii) the S&P Information Technology Index.
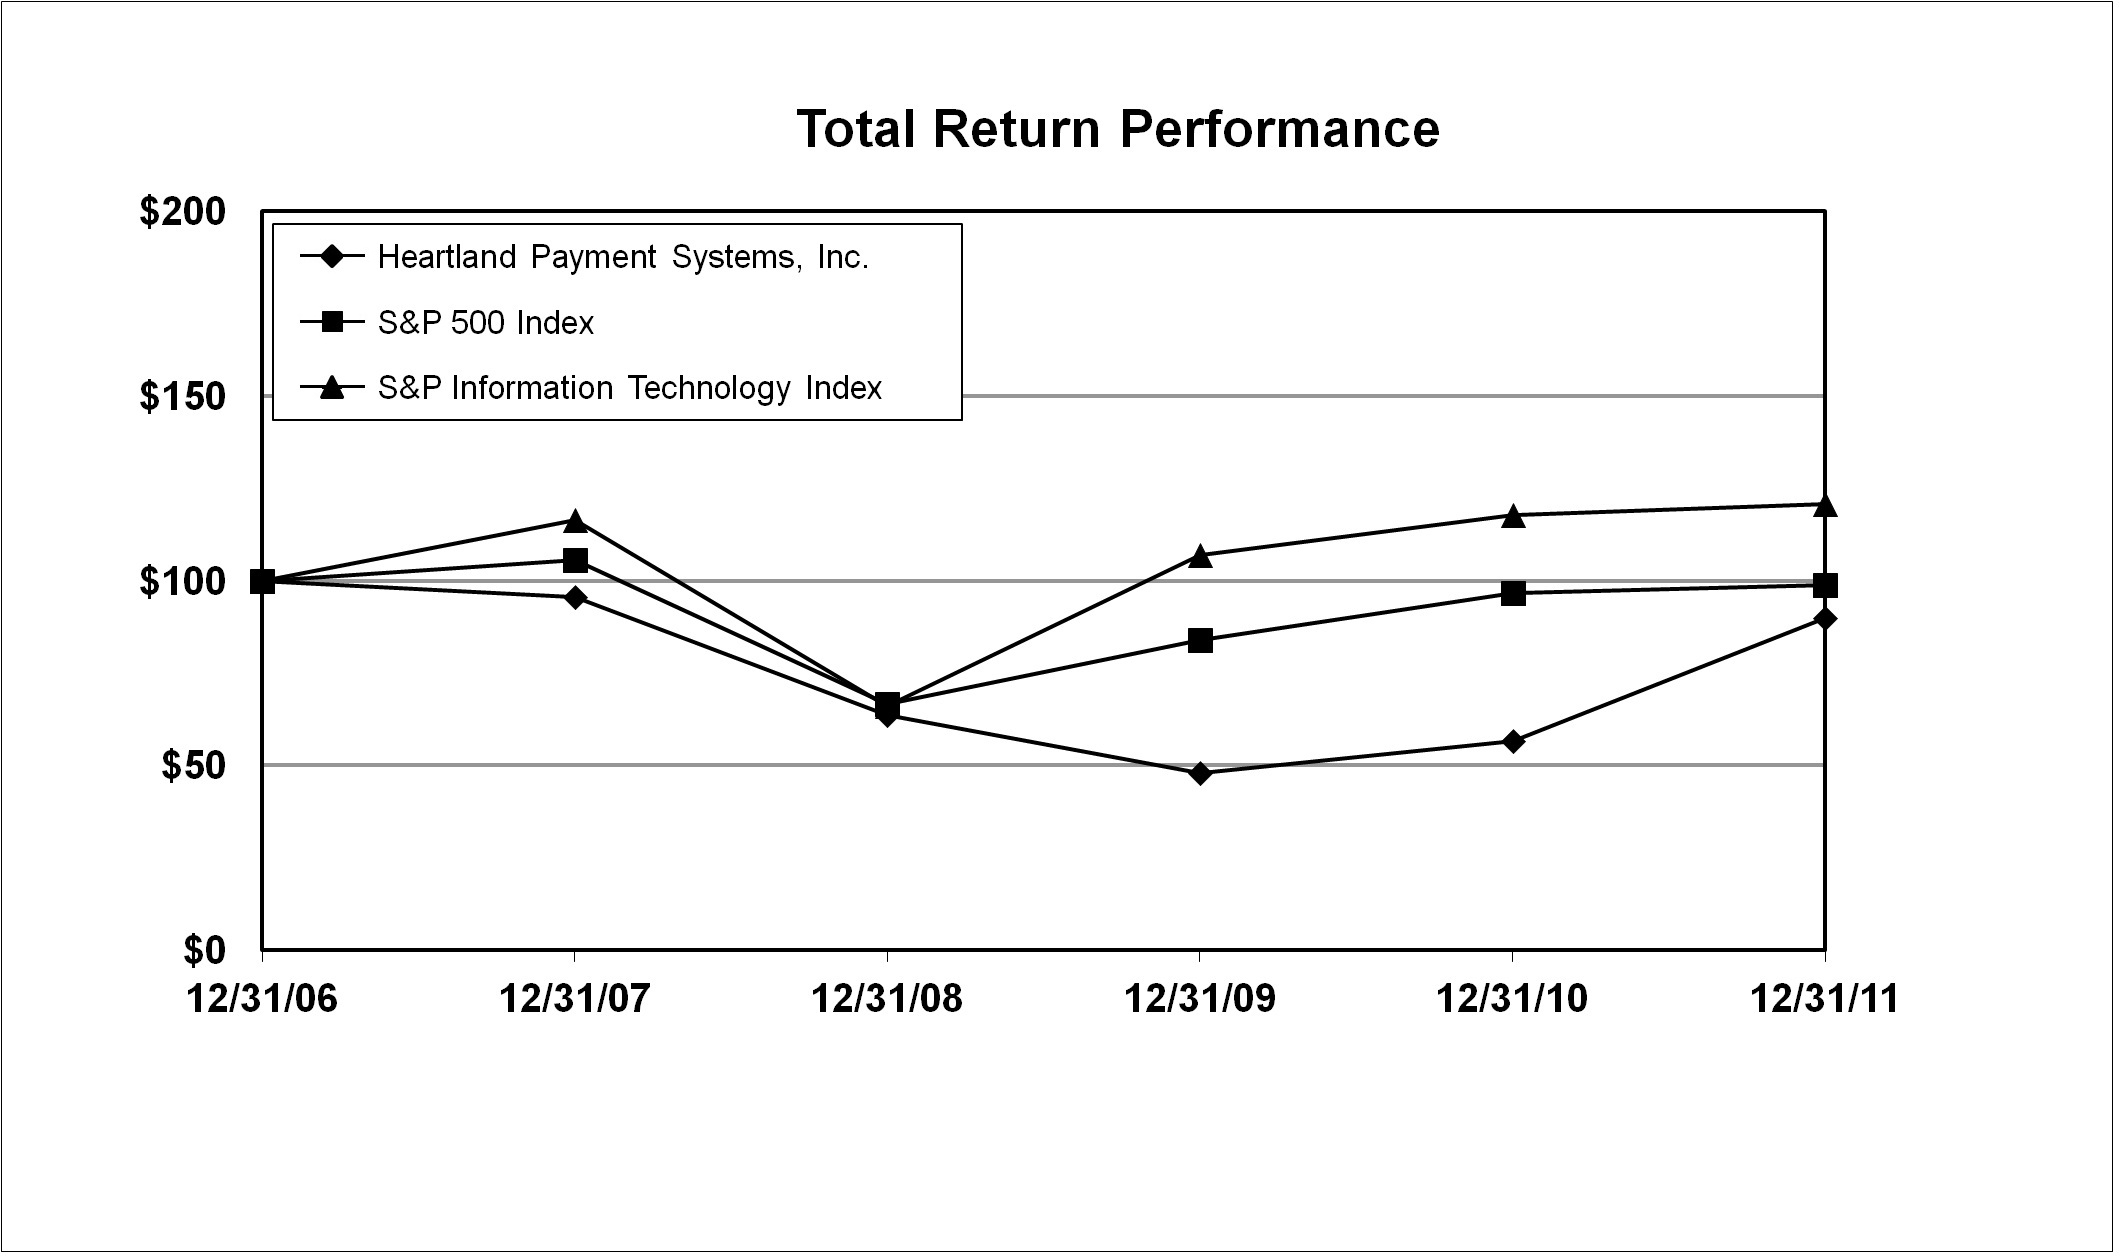
The below comparison assumes $100 was invested on December 31, 2006 in our common stock and in the S&P 500 Index and the S&P Information Technology Index, and assumes reinvestment of dividends, if any. Historical stock prices are not indicative of future stock price performance.
Base Period | Period Ended | ||||||||||
12/31/2006 | 12/31/2007 | 12/31/2008 | 12/31/2009 | 12/31/2010 | 12/31/2011 | ||||||
Heartland Payment Systems, Inc. | 100.00 | 95.71 | 63.55 | 48.01 | 56.52 | 90.01 | |||||
S&P 500 | 100.00 | 105.49 | 66.46 | 84.05 | 96.71 | 98.76 | |||||
S&P Information Technology Index | 100.00 | 116.31 | 66.13 | 106.95 | 117.85 | 120.69 | |||||
41
ITEM 6. SELECTED FINANCIAL DATA
The following table sets forth our selected historical consolidated financial information and other data for the years ended December 31, 2011, 2010, and 2009, which are derived from our consolidated financial statements included elsewhere in this report. Historical consolidated financial information for 2008 and 2007 are derived from our consolidated financial statements for those years (not included herein). The information in the following table should be read together with “Management's Discussion and Analysis of Financial Condition and Results of Operations” and our consolidated financial statements and the related notes included elsewhere in this report.
Year Ended December 31, | |||||||||||||||||||
2011 | 2010 | 2009 | 2008 | 2007 | |||||||||||||||
Statement of Operations Data: | (in thousands, except per share data) | ||||||||||||||||||
Total revenues | $ | 1,996,950 | $ | 1,864,337 | $ | 1,652,139 | $ | 1,544,902 | $ | 1,313,846 | |||||||||
Costs of services: | |||||||||||||||||||
Interchange | 1,359,448 | 1,299,631 | 1,142,112 | 1,093,546 | 962,025 | ||||||||||||||
Dues, assessments and fees | 155,233 | 119,834 | 89,844 | 67,648 | 57,050 | ||||||||||||||
Processing and servicing | 212,747 | 228,953 | 199,934 | 179,106 | 131,944 | ||||||||||||||
Customer acquisition costs | 46,140 | 50,415 | 50,362 | 48,522 | 44,193 | ||||||||||||||
Depreciation and amortization | 14,675 | 15,201 | 15,786 | 11,006 | 6,806 | ||||||||||||||
Total costs of services | 1,788,243 | 1,714,034 | 1,498,038 | 1,399,828 | 1,202,018 | ||||||||||||||
General and administrative | 130,724 | 104,088 | 104,154 | 74,434 | 52,059 | ||||||||||||||
Total expenses | 1,918,967 | 1,818,122 | 1,602,192 | 1,474,262 | 1,254,077 | ||||||||||||||
Income from operations | 77,983 | 46,215 | 49,947 | 70,640 | 59,769 | ||||||||||||||
Other income (expense): | |||||||||||||||||||
Interest income | 177 | 148 | 117 | 755 | 1,934 | ||||||||||||||
Interest expense | (4,125 | ) | (4,778 | ) | (2,698 | ) | (3,206 | ) | (785 | ) | |||||||||
Gain (loss) on investments | — | 25 | (31 | ) | (395 | ) | (1,650 | ) | |||||||||||
(Provision for) recovery of processing system intrusion | (1,012 | ) | 14,138 | (128,943 | ) | — | — | ||||||||||||
Other, net | (1,550 | ) | 47 | (41 | ) | (5 | ) | (2,108 | ) | ||||||||||
Total other (expense) income | (6,510 | ) | 9,580 | (131,596 | ) | (2,851 | ) | (2,609 | ) | ||||||||||
Income (loss) before income taxes | 71,473 | 55,795 | (81,649 | ) | 67,789 | 57,160 | |||||||||||||
Provision for income taxes | 27,126 | 21,135 | (29,919 | ) | 25,918 | 21,290 | |||||||||||||
Net income (loss) | 44,347 | 34,660 | (51,730 | ) | 41,871 | 35,870 | |||||||||||||
Less: Net income attributable to noncontrolling interests | 408 | 123 | 66 | 31 | — | ||||||||||||||
Net income (loss) attributable to Heartland | $ | 43,939 | $ | 34,537 | $ | (51,796 | ) | $ | 41,840 | $ | 35,870 | ||||||||
Earnings (loss) per common share: | |||||||||||||||||||
Basic | $1.13 | $0.91 | $(1.38) | $1.12 | $0.95 | ||||||||||||||
Diluted | $1.09 | $0.88 | $(1.38) | $1.08 | $0.90 | ||||||||||||||
Weighted average number of common shares outstanding: | |||||||||||||||||||
Basic | 38,931 | 37,994 | 37,483 | 37,521 | 37,686 | ||||||||||||||
Diluted | 40,233 | 39,310 | 38,028 | 38,698 | 39,980 | ||||||||||||||
Cash dividends declared per common share | $0.16 | $0.04 | $0.055 | $0.36 | $0.25 | ||||||||||||||
Other Data: | |||||||||||||||||||
Net Revenue | $482,269 | $444,872 | $420,183 | $383,708 | $294,771 | ||||||||||||||
Operating Margin | 16.2% | 10.4% | 11.9% | 18.4% | 20.3% | ||||||||||||||
Number of active bankcard merchants serviced (at period end - in thousands) | 237 | 236 | 234 | 230 | 155 | ||||||||||||||
Bankcard processing volume for the period (in millions) | $83,698 | $74,939 | $69,262 | $69,925 | $51,936 | ||||||||||||||
42
As of December 31, | |||||||||||||||||||
2011 | 2010 | 2009 | 2008 | 2007 | |||||||||||||||
Balance Sheet Data: | (in thousands) | ||||||||||||||||||
Cash and cash equivalents | $ | 40,301 | $ | 41,729 | $ | 32,113 | $ | 27,589 | $ | 35,508 | |||||||||
Receivables, net | 176,535 | 175,530 | 149,403 | 140,145 | 122,613 | ||||||||||||||
Total assets | 596,921 | 561,464 | 562,206 | 463,619 | 329,189 | ||||||||||||||
Due to sponsor banks | 63,881 | 72,573 | 80,007 | 68,212 | 49,798 | ||||||||||||||
Accounts payable | 47,373 | 42,126 | 32,305 | 25,864 | 20,495 | ||||||||||||||
Current portion of borrowings | 15,003 | 38,286 | 58,547 | 58,522 | — | ||||||||||||||
Long term portion of borrowings | 70,000 | 85,000 | 8,419 | 16,984 | — | ||||||||||||||
Total liabilities | 376,869 | 383,870 | 432,251 | 284,256 | 163,520 | ||||||||||||||
Total Stockholders' Equity | 219,410 | 177,293 | 129,741 | 179,244 | 165,669 | ||||||||||||||
ITEM 7. MANAGEMENT'S DISCUSSION AND ANALYSIS OF FINANCIAL CONDITION AND RESULTS OF OPERATIONS
The following discussion and analysis of our financial condition and results of operations should be read in conjunction with the consolidated financial statements and the accompanying notes to consolidated financial statements and the risk factors included elsewhere in this report.
Overview
General
Our primary business is to provide bankcard payment processing services to merchants in the United States and Canada. This involves facilitating the exchange of information and funds between merchants and cardholders' financial institutions, providing end-to-end electronic payment processing services to merchants, including merchant set-up and training, transaction authorization and electronic draft capture, clearing and settlement, merchant accounting, merchant assistance and support, and risk management. Our merchant customers primarily fall into two categories: our core small and mid-sized merchants (referred to as "Small and Midsized Enterprises," or “SME merchants”) and Network Services' large national and mid-tier merchants, primarily in the petroleum industry (referred to as “Network Services Merchants”). We also provide additional services to our merchants, such as payroll processing, gift and loyalty programs, paper check processing, and we sell and rent point-of-sale devices and supplies.
At December 31, 2011, we provided our bankcard payment processing services to approximately 171,801 active SME bankcard merchants located across the United States. This represents a slight decrease over the 173,860 active SME bankcard merchants at December 31, 2010. At December 31, 2011, we provided bankcard payment processing services to approximately 179 Network Services Merchants with approximately 54,826 locations. Additionally, at December 31, 2011, we provided bankcard payment processing services to approximately 10,287 merchants in Canada through our 70% owned subsidiary Collective POS Solutions Ltd. (“CPOS”).
Our total bankcard processing volume for the years ended December 31, 2011 was $83.7 billion, an 11.7% increase from the $74.9 billion processed during the year ended December 31, 2010. Our SME bankcard processing volume for the year ended December 31, 2011 was $67.5 billion, a 7.0% increase over $63.1 billion in 2010, and included increases for American Express and Discover card processing, which were initiated in 2009. Our Discover processing volume also continued to benefit from our purchase of an existing merchant portfolio from Discover during the third quarter of 2009. We include American Express volume in our SME bankcard processing volume only where we receive percentage-based residual compensation for that volume. Our bankcard processing volume for 2011 also includes $15.5 billion of settled volume for Network Services Merchants, compared to $11.3 billion for 2010. Bankcard processing volume for the years ended December 31, 2011, 2010 and 2009 was as follows:
43
Year Ended December 31, | ||||||||||||
2011 | 2010 | 2009 | ||||||||||
(in millions) | ||||||||||||
SME merchants | $ | 67,499 | $ | 63,058 | $ | 58,952 | ||||||
Network Services Merchants | 15,533 | 11,319 | 9,850 | |||||||||
Canada | 666 | 562 | 460 | |||||||||
Total bankcard processing volume (a) | $ | 83,698 | $ | 74,939 | $ | 69,262 | ||||||
(a) | Bankcard processing volume includes volume for credit and signature debit transactions. |
Merchant attrition is expected in the card payment processing industry in the ordinary course of business. We experience attrition in merchant bankcard processing volume resulting from several factors, including business closures, transfers of merchants' accounts to our competitors and account closures that we initiate due to heightened credit risks relating to, or contract breaches by, merchants, and (when applicable) same store sales contraction. We measure SME processing volume attrition against all SME merchants that were processing with us in the same month a year earlier. During the year ended December 31, 2011, we experienced an improved 13.5% average annualized attrition in our SME bankcard processing volume compared to an average attrition of 15.3% and 22.6% for the years ended December 31, 2010 and 2009, respectively. Historically, much of our attrition is related to business closures, which accelerated in 2009 and 2008 due to weak economic conditions, and in 2009 and 2008 our volume attrition was also significantly impacted by overall contraction in same store sales.
In our SME business, we measure same store sales growth, or contraction, as the change in bankcard processing volume for all bankcard merchants that were processing with us in the same month a year earlier. In 2011, same store sales grew 2.6% on average, compared to a 1.3% growth and a 7.8% contraction in 2010 and 2009, respectively. Same store sales growth or contraction results from the combination of the increasing or decreasing use by consumers of bankcards for the purchase of goods and services at the point of sale, and sales growth or contraction experienced by our retained SME bankcard merchants. The following table compares our same store sales growth or contraction during 2011, 2010, 2009 and 2008:
Same Store Sales Growth (Contraction) | 2011 | 2010 | 2009 | 2008 | ||||
First Quarter | 3.2% | (1.5)% | (7.6)% | 0.6% | ||||
Second Quarter | 2.5% | 1.1% | (9.7)% | (0.1)% | ||||
Third Quarter | 2.3% | 2.0% | (8.6)% | (2.0)% | ||||
Fourth Quarter | 2.5% | 3.8% | (5.2)% | (6.8)% | ||||
Full Year | 2.6% | 1.3% | (7.8)% | (2.1)% | ||||
Our same store sales experience has tracked overall economic conditions, contracting from the second quarter of 2008
through the first quarter of 2010 as a result of the declining economic conditions during the 2008-2009 recession, followed by
growth beginning in the second quarter of 2010 as the general economy slowly improved. Management believes that the
challenging economic conditions may continue to result in modest near-term improvements in our existing SME
merchants' businesses.
We measure the overall production of our sales force by new gross margin installed, which reflects the expected annual gross profit from a merchant contract after deducting processing and servicing costs associated with that revenue. Our newly installed gross margin for the year ended December 31, 2011 increased 4.6% from the gross margin we installed during the year ended December 31, 2010; this represents the first new margin installed growth since 2008. We attribute this increase in newly installed gross margin to the improved economy and refocusing our sales organization on improving individual salespersons' productivity.
Historically, we compensated our sales managers based on their success in growing the sales force and increasing the total SME merchant base in their regions. Prior to the economic downturn, increases in our direct sales force, including our Relationship Managers, had led to significant growth in the total SME merchants for which we process and the gross margin generated by those merchants. However, during the third quarter of 2010 we refocused our sales organization toward improving individual sales persons' productivity, and so we reduced our Relationship Manager count, but at the same time more fully engaged our Territory Managers in the sales process by requiring them to achieve individual minimum monthly gross margin install targets. Combining our Relationship Managers and Territory Managers gives us a count of 790 at December 31, 2011, compared to 917 at December 31, 2010 and 1,069 at December 31, 2009. We expect to drive improvement in year-over-year installed margin growth rates in future years principally by increasing our Relationship Manager and Territory Manager count.
44
The bankcard revenue we earn in our SME business is recurring in nature, as we typically enter into three-year service contracts with our card processing SME merchants that, in order to qualify for the agreed-upon pricing, require the merchant to achieve bankcard processing volume minimums. Most of our SME revenue is from payment processing fees, which are a combination of a fee equal to a percentage of the dollar amount of each transaction we process plus a flat fee per transaction. We make mandatory payments of interchange fees to card-issuing banks through the card networks and dues, assessments and other network fees to Visa, MasterCard and Discover. Our SME gross bankcard processing revenue is largely driven by Visa and MasterCard volume processed by our merchants. More recently, we have increased card processing revenues by processing transactions for SME merchants new to accepting American Express and from processing Discover transactions.
In contrast to SME card processing revenues, revenues from our Network Services Merchants are largely driven by the number of transactions we process (whether settled, or only authorized), not our processing volume, as the merchants which comprise Network Services' customer base pay on a per transaction basis for processing services. Additionally, we provide authorization, settlement and account servicing services on our front and back end systems for American Express transactions for larger merchants, and merchants signed to American Express by other processors; for those services we receive compensation from American Express on a per transaction basis. The number of transactions we processed for Network Services Merchants and American Express for the years ended December 31, 2011, 2010 and 2009 were as follows:
Year Ended December 31, | |||||||||
2011 | 2010 | 2009 | |||||||
(in thousands) | |||||||||
Network Services Merchants: | |||||||||
Settled | 553,078 | 487,972 | 462,342 | ||||||
Authorized | 2,720,595 | 2,611,830 | 2,374,735 | ||||||
Total Network Services | 3,273,673 | 3,099,802 | 2,837,077 | ||||||
American Express (SME) | 31,704 | 20,703 | — | ||||||
Total | 3,305,377 | 3,120,505 | 2,837,077 | ||||||
We have developed a number of proprietary payment processing systems to increase our operating efficiencies and distribute our processing and merchant data to our three main constituencies: our merchant base, our sales force and our customer service staff. We provide authorization and data capture services to our SME merchants through our internally-developed front-end processing system, HPS Exchange. This system incorporates real time reporting tools through interactive point-of-sale database maintenance via the Internet. These tools enable merchants, and our employees, to change the messages on credit card receipts and to view sale and return transactions entered into the point-of-sale device with a few second delay on any computer linked to the Internet. During the years ended December 31, 2011, 2010 and 2009, approximately 93%, 90% and 88%, respectively, of our SME transactions were processed through HPS Exchange.
We provide clearing, settlement and merchant accounting services through our own internally developed back-end processing system, Passport. Passport enables us to customize these services to the needs of our Relationship Managers and merchants. At both December 31, 2011 and 2010, approximately 99% of total SME bankcard merchants were processing on Passport. In the fourth quarter of 2010, the clearing, settlement and merchant accounting services for Network Services' settled transactions were converted onto Passport, so that at December 31, 2010, our internal systems are providing all aspects of our Network Services Merchants' processing needs.
We also provide payroll processing services throughout the United States. At December 31, 2011, we processed payroll for 11,841 customers, an increase of 6.4% from 11,131 payroll customers at December 31, 2010. Our nationwide direct sales force sells our payroll processing services solely on a commission basis. In 2011, 2010 and 2009, we installed 3,723, 4,858 and 4,303 new payroll processing customers, respectively. We developed a new comprehensive payroll management system, which we refer to as PlusOne Payroll, that streamlines all aspects of the payroll process to enable time and cost savings. PlusOne Payroll was made available to new and existing customers beginning in 2010. We fully converted all of our existing payroll customers to PlusOne Payroll in 2011. The PlusOne Payroll platform enables us to process payroll on a large scale and provide customizable solutions for businesses of all sizes.
Processing System Intrusion
On January 20, 2009, we publicly announced the discovery of a criminal breach of our payment systems environment (the “Processing System Intrusion”). The Processing System Intrusion involved malicious software that appears to have been
45
used to collect in-transit, unencrypted payment card data while it was being processed by us during the transaction authorization process. We believe the breach has been contained and did not extend beyond 2008. See “—Legal and Regulatory Considerations” for further detail and related events.
Since our announcement of the Processing System Intrusion on January 20, 2009 and through December 31, 2011, we have expensed a total of $147.1 million, before reducing those charges by $31.2 million of total insurance recoveries. The majority of the total charges, or approximately $114.7 million, related to settlements of claims. Approximately $32.4 million of the total charges were for legal fees and costs we incurred for investigations, defending various claims and actions, remedial actions and crisis management services.
The following table summarizes our Provision for Processing System Intrusion, which we recorded for settlement accruals, legal fees and costs we incurred for defending various claims and actions associated with the Processing System Intrusion, and amounts we recovered from our insurance providers for the years ended December 31, 2011, 2010 and 2009:
Year Ended December 31, | ||||||||||||
2011 | 2010 | 2009 | ||||||||||
(in millions, except per share data) | ||||||||||||
(Charges) for settlement accruals, legal fees and costs | $ | (1.0 | ) | $ | (13.1 | ) | $ | (132.9 | ) | |||
Insurance recoveries | — | 27.2 | 4.0 | |||||||||
(Provision for) recovery of processing system intrusion costs | $ | (1.0 | ) | $ | 14.1 | $ | (128.9 | ) | ||||
Per share | $ | (0.02 | ) | $ | 0.22 | $ | (2.16 | ) | ||||
In 2009 and 2010, we had entered into settlements with the bankcard networks for various claims and disputes related to the Processing System Intrusion. During the year ended December 31, 2010, we settled the following claims and disputes related to the Processing System Intrusion:
• | On January 7, 2010, we entered into a settlement agreement with Heartland Bank, KeyBank National Association (“KeyBank,” and, together with Heartland Bank, the “Sponsor Banks”), and Visa U.S.A. Inc., Visa International Service Association and Visa Inc. (collectively, “Visa”) to resolve potential claims and other disputes among us, the Sponsor Banks and Visa with respect to the potential rights and claims of Visa and certain issuers of Visa-branded credit and debit cards related to the Processing System Intrusion (the “Visa Settlement Agreement”). After including a $780,000 credit for fines previously collected by Visa during 2009, the amount we paid under the Visa Settlement Agreement was $59.3 million. The costs of this settlement were included in our Provision for Processing System Intrusion on our Consolidated Statement of Operations for the year ended December 31, 2009 and in our Reserve for Processing System Intrusion on our Consolidated Balance Sheet as of December 31, 2009. Financial institutions representing more than 97 percent of eligible Visa-branded credit and debit cards have accepted the offers they received pursuant to the settlement entered into between and among us, Visa, and our sponsoring acquirers. |
On February 18, 2010, we entered into a bridge loan agreement (the “Bridge Loan Agreement”) with KeyBank, as administrative agent, and KeyBank and Heartland Bank as bridge lenders. On that date, KeyBank made a bridge loan to us in the amount of $20.0 million and Heartland Bank made a bridge loan in the amount of $8.0 million (collectively, the “Bridge Loan”). See Note 11, Credit Facilities for additional terms of the Bridge Loan.
On February 18, 2010, we also entered into a Commitment Increase Agreement pursuant to the Amended and Restated Credit Agreement dated as of May 30, 2008 (the “Commitment Increase Agreement”) whereby KeyBank, as one of the lenders under the Amended and Restated Credit Agreement, agreed to increase our revolving credit commitment to us under the Amended and Restated Credit Agreement by $25.0 million (the “Increased Credit Commitment”). See Note 11, Credit Facilities for additional terms of the Commitment Increase Agreement.
The proceeds of the Bridge Loan and the Increased Credit Commitment, together with a portion of our cash reserves, were used to fund the settlement with Visa. The Visa Settlement Agreement was consummated on February 18, 2010, with a payment of $58.6 million.
• | On May 19, 2010, we entered into a settlement agreement with MasterCard Worldwide (“MasterCard”) to resolve potential claims and other disputes among us, the Sponsor Banks and MasterCard related to the Processing System Intrusion (the “MasterCard Settlement Agreement”). Under the MasterCard Settlement Agreement, alternative recovery offers totaling $41.4 million were made to eligible MasterCard issuers with respect to losses alleged to have been incurred by them as a result of the Processing System Intrusion. The $41.4 million included a $6.6 million credit |
46
for fines previously collected by MasterCard during 2009, so the maximum amount payable under the settlement was $34.8 million if all MasterCard issuers had accepted the settlement. On September 3, 2010 and September 14, 2010, we paid approximately $34.4 million because certain issuers did not accept settlement. Those issuers, who represent less than 1% of the accounts eligible for the settlement, have been preliminarily awarded $367,172 by MasterCard, and we are contesting that award.
• | On August 31, 2010, we entered into an agreement of settlement and release with DFS Services, LLC (”Discover”) to resolve potential claims and other disputes among us and Discover (and its affiliates and certain of its issuers) with respect to the Processing System Intrusion (the “Discover Settlement Agreement”). On September 2, 2010, we paid Discover $5.0 million in full and final satisfaction of any and all claims of Discover, its affiliates and certain of its issuers arising from or relating to the Processing System Intrusion. The Discover Settlement Agreement contains mutual releases by and between us and Discover (on behalf of itself and its affiliates) relating to the Processing System Intrusion. |
During the year ended December 31, 2009, we settled the following claims and disputes related to the Processing System Intrusion:
• | On December 17, 2009, we entered into a settlement agreement and release with American Express to resolve potential claims and other disputes among us and American Express (and its issuers) with respect to the Processing System Intrusion, and subsequently we paid approximately $3.5 million in full and final satisfaction of any and all claims of American Express and its issuers arising from or relating to the Processing System Intrusion. Such settlement agreement and release contains mutual releases by and between us and American Express (on behalf of itself and its issuers) relating to the Processing System Intrusion. |
These settlement amounts were previously provided for in our Provision for Processing System Intrusion and carried
in our Reserve for Processing System Intrusion. We do not consider it a reasonable possibility that losses exceeding the
amounts already recognized on the matters subject to the settlement agreements will be incurred. With regard to the unsettled
claims related to the Processing System Intrusion, which we describe in “Item 3 Legal Proceedings,” we
determined material losses in addition to those previously accrued are not considered reasonably possible on any such claim
disclosed. We are prepared to vigorously defend ourselves against any unsettled claims relating to the Processing System
Intrusion that have been asserted against us and our Sponsor Banks to date. We feel we have strong defenses to all the claims
that have been asserted against us and our Sponsor Banks relating to the Processing System Intrusion.
Additional costs we expect to incur for legal fees and costs for defending the unsettled claims and actions associated
with the Processing System Intrusion will be recognized as incurred. Such costs are not expected to be material to our results of
operations, financial condition and cash flow.
2011 Financial Highlights
Our financial results for the year ended December 31, 2011 benefited from an improved operating margin, reflecting 8.4% year-over-year growth in Net revenues and a 7.1% decrease in processing and servicing costs compared to December 31, 2010. For 2011, we recorded net income of $43.9 million, or $1.09 per share compared to a net income of $34.5 million, or $0.88 per share, in 2010. During the year ended December 31, 2011, we expensed $1.0 million, or $0.02 per share for accruals, legal fees and costs we incurred for defending various claims and actions associated with the Processing System Intrusion. During the year ended December 31, 2010, we recovered from our insurance providers $27.2 million of the costs previously incurred for the Processing System Intrusion and expensed $13.1 million for legal fees and costs incurred for defending various claims and actions, resulting in net recovery of $14.1 million, or about $0.22 per share for the year. See “—Processing System Intrusion” for more detail. The following is a summary of our financial results for the year ended December 31, 2011.
• | Net revenue, which we define as total revenues less interchange fees and dues, assessments and fees, increased 8.4% to $482.3 million during 2011 from $444.9 million during 2010. The increase in net revenue was driven by the increase in SME merchant processing revenues and increases in card processing revenues at CPOS, loyalty and gift processing revenues, recently acquired K to 12 School Solutions processing revenues, payroll processing revenues and equipment-related revenues. |
• | Our SME bankcard processing volume increased 7.0% to $67.5 billion, compared to $63.1 billion in 2010. This increase in SME bankcard processing volume was primarily attributable to same store sales growth and reduced merchant attrition in 2011, and growth in American Express and Discover processing volume. |
• | Processing and servicing expense for 2011 decreased by $16.2 million or 7.1%, compared with 2010. The decrease in processing and servicing expense for the year ended December 31, 2011 was primarily due to reductions in transaction processing costs on Network Services' front-end transactions, lower SME residual commission expense, reduced |
47
merchant losses and reduced costs of support personnel, particularly account managers. Lower residual commissions were the result of exercising our right to buy out a substantial amount of portfolio equity owned by our Relationship Managers and sales managers during the third quarter of 2010. We continue to buy out portfolio equity. Partially offsetting these reductions were increased costs associated with servicing higher bankcard processing volume and increased costs of sales and servicing related to the higher payroll, loyalty and gift marketing, and equipment-related revenues as well as cost of sales and service for the K to 12 School Solutions businesses.
• | Our general and administrative expenses for the year ended December 31, 2011 increased $26.6 million, or 25.6%, from $104.1 million in 2010 to $130.7 million in 2011. This increase reflects costs we incurred in consolidating our data centers, expenses related to acquisitions, restoration of incentive compensation and increased staff in 2011. |
• | Our income from operations, which we also refer to as operating income, increased 68.7% to $78.0 million for 2011 from $46.2 million in 2010 primarily due to the growth of our net revenues and the decrease in processing and servicing expense. Our operating margin, which is measured as operating income divided by net revenue, was 16.2% for 2011, compared to 10.4% for 2010. |
See “—Results of Operations —Year Ended December 31, 2011 Compared to Year Ended December 31, 2010” for a more detailed discussion of our full year operating results.
Components of Revenues and Expenses
Revenues. Our revenues fall into three categories: gross processing revenue, payroll processing revenue and equipment-related income. Our gross processing revenue primarily consists of discount, per-transaction and periodic (primarily monthly) fees from the processing of Visa, MasterCard, American Express and Discover transactions for our SME merchants and per-transaction fees for the authorization and settlement of transactions by Network Services. Gross processing revenue also includes American Express and Discover servicing fees, customer service fees, fees for processing chargebacks, termination fees on terminated contracts, K to 12 School Solutions fees, gift and loyalty card fees and other miscellaneous revenue. Revenues are recorded at the time service is provided.
Payroll processing revenue includes fees charged by our subsidiary, Heartland Payroll Company, for payroll processing services, including check printing, direct deposit, related federal, state and local tax deposits and providing accounting documentation and interest income earned on funds held for customers. Revenues are recorded at the time service is provided.
Equipment-related income includes revenues from the sale, rental and deployment of bankcard and check processing terminals. Our equipment-related income also includes revenues from the sale of hardware, software and associated services for prepaid card and stored-value card payment systems and from the sale of hardware, software and associated services for campus and K to 12 payment solutions. Equipment revenues are recorded at the time of shipment, or the provision of service. Most of these revenue items tend to grow with our overall merchant growth.
Expenses. Our most significant expense is interchange fees, which are set by the card networks, and are paid to the card issuing banks. For our SME bankcard processing, we do not offset bankcard processing revenues and interchange fees because our business practice is to advance the interchange fees to most of our merchants when settling their daily transactions (thus paying the full amount of the transaction to the merchant), and then to collect our full discount fees from our merchants on the first business day of the next month. As Network Services does not advance interchange fees to its merchants, we record its portion of our processing revenues net of interchange fees. Interchange fees are calculated as a percentage of the dollar volume processed plus a per transaction fee. We also pay Visa, MasterCard and Discover network dues, assessments and fees, which are a combination of a percentage of the dollar volume processed and per-transaction fees. Interchange fees and dues, assessments and fees are recognized at the time transactions are processed. It is our policy to pass along to our merchants any changes in interchange fees and card network dues, assessments and fees. Since the card networks regularly adjust those rates, our gross processing revenue will increase or decrease, but all the impact of such changes will be paid to the card issuing banks and our income from operations will not be affected.
Costs of services also include processing and servicing costs, customer acquisition costs, and depreciation and amortization. Processing and servicing costs include:
• | processing costs, which are either paid to third parties, including our bank sponsors, or represent the cost of our own authorization/capture and accounting/settlement systems. During 2011, third party costs represented about 59% of our processing costs. During 2010, third party costs represented about 64% of our processing costs, compared to 76% during 2009. Approximately 18% and 22%, respectively, of our third-party processing costs in 2011 and 2010 were |
48
paid to Fujitsu for processing Network Services Transactions. Approximately 19%, 30% and 29%, respectively, of our third-party processing costs in 2011, 2010 and 2009 were paid to TSYS Acquiring Solutions;
• | residual commission payments to our Relationship Managers, sales managers, trade associations, agent banks and value-added resellers, which are a percentage of the gross margin we generated from our merchant contracts during the accounting period; |
• | the costs of operating our service centers, including telecommunications costs, personnel costs, occupancy costs, losses due to merchant defaults, depreciation and amortization, and other direct merchant servicing costs; and |
• | the costs of bankcard terminals, prepaid card and stored value hardware deployed, and merchant supplies. |
Customer acquisition costs reflect the amortization over the initial three-year contract term of the cash signing bonus paid and the deferred acquisition costs for vested Relationship Managers and sales managers, as well as changes in the accrued buyout liability, which reflect the impact of buying out residual commissions (see “—Critical Accounting Estimates —Accrued Buyout Liability”) and volume attrition.
Depreciation and amortization expenses are primarily recognized on a straight-line basis over the estimated useful life of the asset. We have made significant capital expenditures for computer hardware and software and such costs are generally depreciated over three to five years.
General and administrative expenses include personnel and other administrative expenses related to our information technology infrastructure costs, our marketing expenses and other administrative functions.
Other income (expense) consists of interest income on cash and investments, the interest cost on our borrowings, gain from the sale of merchant bankcard processing contracts, legal settlements accrued or received, exit costs, and other non-operating income or expense items.
Critical Accounting Estimates
The discussion and analysis of our financial condition and results of operations are based on our consolidated financial statements, which have been prepared in accordance with accounting principles generally accepted in the United States. The preparation of these financial statements requires us to make estimates and judgments that affect the reported amounts of assets, liabilities, revenue and expenses. Actual results could differ from those estimates. Our significant accounting policies are more fully described in Note 2 to our consolidated financial statements included elsewhere in this report. The critical accounting estimates described here are those that are most important to the depiction of our financial condition and results of operations, including those whose application requires management's most subjective judgment in making estimates about the effect of matters that are inherently uncertain. The line items on our income statement and balance sheet impacted by management's estimates are described below.
Revenues
Our bank card processing revenue is derived from processing and settling Visa, MasterCard, American Express and Discover bank card transactions for our merchant customers. Our most significant expense related to the generation of those revenues is interchange fees, which are set by the card networks, and paid to the card issuing banks. For our SME merchant bank card processing, we do not offset bank card processing revenues and interchange fees because our business practice is to advance the interchange fees to most of our merchants when settling their daily transactions (thus paying the full amount of the transaction to the merchant), and then to collect our full discount fees from our merchants on the first business day of the next month. We believe this policy aids in new business generation, as our merchants benefit from bookkeeping simplicity. However, this results in our carrying a large receivable from our merchants at each period-end, and a corresponding but smaller payable to our sponsor banks, which are settled on the first business day after the period-end. As we are at risk for the receivables, we record the associated revenues on a gross processing revenue basis in our consolidated income statements. Certain of our competitors report their processing revenue net of interchange fees. This is because the card issuing banks make their payments to these competitors net of those interchange fees, and these acquirers pay this reduced amount to their merchants. Since the acquisition of Network Services, we also record a portion of our processing revenues net of interchange fees because the daily cash settlement with Network Services' merchants is net of interchange fees.
Capitalized Customer Acquisition Costs
Capitalized customer acquisition costs consist of (1) up-front signing bonuses paid to Relationship Managers and sales managers, referred to as the salesperson or salespersons, for the establishment of new merchant relationships, and (2) deferred acquisition cost representing the estimated cost of buying out the commissions of vested salespersons at some point in the future. Capitalized customer acquisition costs represent incremental, direct customer acquisition costs that are recoverable
49
through gross margins associated with SME merchant contracts. The capitalized customer acquisition costs are amortized using a method which approximates a proportional revenue approach over the initial three-year term of the merchant contract.
The amount of the up-front signing bonus paid for new SME bankcard, payroll and check processing accounts is based on the estimated gross margin for the first year of the merchant contract. The gross signing bonuses paid during 2011, 2010 and 2009 were $30.5 million, $28.6 million and $34.7 million, respectively. The signing bonus paid, amount capitalized, and related amortization are adjusted at the end of the first year to reflect the actual gross margin generated by the merchant contract during that year. The net signing bonus adjustments made during 2011, 2010 and 2009 were $(1.5) million, $(2.1) million and $(1.5) million, respectively. Negative signing bonus adjustments occur when the actual gross margin generated by the merchant contract during the first year is less than the estimated gross margin for that year, resulting in the overpayment of the up-front signing bonus and would be recovered from the relevant sales person. Positive signing bonus adjustments result from prior underpayments of up-front signing bonuses, and would be paid to the relevant salesperson. The amount of signing bonuses paid which remained subject to adjustment at December 31, 2011 and 2010 was $30.3 million and $26.5 million, respectively.
The deferred acquisition cost component is accrued for vested salespersons over the first year of SME bankcard merchant processing, consistent with the build-up in the accrued buyout liability, which is described below.
Management evaluates the capitalized customer acquisition costs for impairment at each balance sheet date by comparing, on a pooled basis by vintage month of origination, the expected future net cash flows from underlying merchant relationships to the carrying amount of the capitalized customer acquisition costs. If the estimated future net cash flows are lower than the recorded carrying amount, indicating an impairment of the value of the capitalized customer acquisition costs, the impairment loss will be charged to operations. At December 31, 2011, we recognized an impairment charge related to the decision to discontinue Express Funds, our remote deposit check capture product. We have not recognized an impairment loss in 2010 or 2009.
Accrued Buyout Liability
We pay our salespersons residual commissions based on the gross margin generated from the monthly processing activity of SME merchants signed by them. We refer to these residual commissions as the ''owned'' portion of such commissions, or ''portfolio equity.'' The salesperson has no obligation to perform additional services for the merchant for so long as the merchant continues processing with us. We accrue the buyout liability, which represents the estimated current settlement cost of buying out all vested and expected-to-vest salespersons for the owned portion of such commissions. We also record a deferred acquisition cost asset related to those buyouts, and amortize that asset as an expense over the initial 3-year contract term.
We consider a salesperson to be vested once they have established merchant relationships that generate the equivalent of $10,000 of monthly gross margin. Vested status entitles the salesperson to his or her residual commissions for as long as the merchant processes with us, even if the salesperson is no longer employed by us.
The accrued buyout liability is based on the SME merchants we have under contract at the balance sheet date, the gross margin we generated from those accounts in the prior twelve months, the “owned” commission rate, and the fixed buyout multiple of 2.5 times the commissions. The liability related to a new merchant is therefore zero when the merchant is installed, and increases over the twelve months following the installation date.
For unvested salespersons, the accrued buyout liability is accrued over the expected vesting period; however, no deferred acquisition cost is capitalized as future services are required in order to vest. In calculating the accrued buyout liability for unvested salespersons, we have assumed that 31% of unvested salespersons will vest in the future, which represents our historical vesting rate. A 5% increase to 36% in the expected vesting rate would have increased the accrued buyout liability for unvested salespersons by $0.1 million and $0.2 million respectively, at December 31, 2011 and 2010.
Buyout payments made to salespersons reduce the outstanding accrued buyout liability. Given our view of the duration of the cash flows associated with a pool of merchant contracts, we believe that the benefits of such buyouts significantly exceed the cost, which typically represents 2 ½ years of commissions. If the cash flows associated with a pool of bought out contracts does not exceed this cost, we will incur an economic loss on our decision to buyout the contracts. During 2011, 2010, and 2009, we made buyout payments of approximately $10.4 million, $25.2 million and $8.1 million, respectively.
During the third quarter of 2010, we exercised our rights to buy out a substantial amount of portfolio equity owned by our Relationship Managers and sales managers. As a result of these buyouts, we reduced our Accrued Buyout Liability recorded on the Consolidated Balance Sheet by the approximately $17.7 million of cash payments we made. The amount of
50
future annual reductions in residual commission expense will be impacted by merchant attrition. We expect to make significant buyout payments in the future, subject to available cash, as such buyouts reduce the monthly payments we will have to make to our salespersons for such merchants in the future.
Processing Liabilities and Loss Reserves
The majority of our processing liabilities include funds in transit associated with bankcard and check processing. At December 31, 2011 and 2010, these funds in transit totaled $18.9 million and $17.9 million, respectively. In addition, we maintain merchant deposits to offset potential liabilities from merchant chargeback processing.
Disputes between a cardholder and a merchant periodically arise as a result of, among other things, the cardholder's
dissatisfaction with merchandise quality or merchant services. Such disputes may not be resolved in the merchant's favor. In
these cases, the transaction is ''charged back'' to the merchant, which means the purchase price is refunded to the customer by
the card-issuing bank and charged to the merchant. If the merchant is unable to fund the refund, we must do so. We also bear
the risk of reject losses arising from the fact that we collect our fees from our merchants on the first day after the monthly
billing period. If the merchant has gone out of business during such period, we may be unable to collect such fees. We maintain cash deposits or require the pledge of a letter of credit from certain merchants, generally those with higher average transaction size where the card is not present when the charge is made or the product or service is delivered after the charge is made, in order to offset potential contingent liabilities such as chargebacks and reject losses that would arise if the merchant went out of business. At December 31, 2011 and 2010, we held SME merchant deposits totaling $9.8 million and $9.2 million, respectively. Most chargeback and reject losses are charged to processing and servicing as they are incurred. However, we also maintain a loss reserve against losses including major fraud losses, which are both less predictable and involve larger amounts. The loss reserve was established using historical loss rates, applied to recent bankcard processing volume. At December 31, 2011 and 2010, our loss reserve totaled $2.0 million and $1.7 million, respectively. Aggregate SME bankcard merchant losses, including losses charged to operations and the loss reserve, were $5.1 million, $9.1 million and $5.9 million for the years ended December 31, 2011, 2010 and 2009.
During the fourth quarter of 2010, we converted Network Services' settled transactions from a third party processor
and began settling Network Services Merchant accounts, and processing chargebacks originating from these merchants, on
Passport. Prior to this, these chargebacks were processed and carried by Vantiv, Inc., which was our third party outsourced processor for settling Network Services Merchant accounts. Chargeback losses originating from Network
Services bankcard processing on Passport during the year ended December 31, 2011 was approximately $17,000.
Stock-based Compensation
We expense employee share-based payments under the fair value method. Share-based compensation cost is measured at the grant date, based on the fair value of the award, and is recognized as expense over the requisite service period. Under the modified-prospective-transition method, we are required to record compensation expense for all awards granted after the date of adoption using grant-date fair value estimate and for the unvested portion of previously granted awards using the grant-date fair value estimate.
We estimate the grant date fair value of the stock options we issue using a Black-Scholes valuation model for “plain-vanilla” stock options and performance-based stock options, and we use a lattice valuation model to measure grant date fair value for stock options containing market vesting conditions. Our assumption for expected volatility is based on our historical volatility data related to market trading of our own Common Stock. We base our assumptions for the expected life of new stock option grants on our analysis of the historical exercise patterns of our stock options. Previously, we estimated the expected life of a stock option based on the simplified method for “plain-vanilla” stock options as provided by the staff of the SEC. Our dividend yield assumption is based on dividends expected to be paid over the expected life of the stock option. Our risk-free interest rate assumption for stock options granted is determined by using U.S. treasury rates of the same period as the expected option term of each stock option.
The weighted-average fair value of options we granted during 2011, 2010 and 2009 were $7.95, $6.12 and $3.12, respectively. The fair value of options granted during 2011, 2010 and 2009 was estimated at the grant date using the following weighted average assumptions:
51
Year Ended December 31, | ||||||||
2011 | 2010 | 2009 | ||||||
Expected volatility | 55 | % | 54 | % | 48 | % | ||
Expected life | 3.65 years | 3.75 years | 3.75 to 4.0 years | |||||
Expected Dividends | 0.80 | % | 0.40 | % | 0.47 | % | ||
Risk-free interest rate | 0.55 | % | 1.21 | % | 1.76 | % | ||
In the second quarter of 2009, our Board of Directors approved grants of 930,000 stock options subject to multiple vesting conditions. Under these stock options, the employee must provide continuous service over four years and a market price condition must be satisfied within those four years. These stock options have a five-year term and could vest in equal amounts in 2010, 2011, 2012 and 2013 only if during the four-year service period, the price of our common stock as reported by the New York Stock Exchange exceeds two or three times the exercise price for 30 consecutive trading days. The grant date fair values of these multiple vesting condition options are recognized as compensation expense over their four-year service periods. At December 31, 2011, 232,500 of the 930,000 stock options have vested.
In the third quarter of 2008, our Board of Directors approved a performance-based stock option program. Under this program, we granted 2.5 million performance-based stock options to our employees. These stock options were granted to those employees who the Board of Directors determined could have significant impact on successfully integrating the recently acquired Network Services business and effectively executing our growth plan. These stock options have a five-year term and will vest in equal amounts in 2011, 2012 and 2013 only if over the term of the stock options, both of the following performance conditions are achieved:
• | Consolidated net revenue grows at a compound annual rate of at least 15%; and |
• | Fully diluted EPS grows at a compound annual rate of at least 25%. |
As of December 31, 2011, 2010 and 2009, management believed that achieving these performance conditions was not “more likely than not” to occur; therefore, no share-based compensation expense was recorded for these stock options for these years. The evaluation of the likelihood of achieving these performance conditions will be repeated quarterly, and if vesting of some or all of the options becomes more likely than not, share-based compensation expense will be recorded.
In the fourth quarter of 2010, our Board of Directors approved grants of 508,800 performance-based Restricted Share Units. These Restricted Share Units are nonvested share awards which would vest 50% in 2013, 25% in 2014, and 25% in 2015 only if over the term of these Restricted Share Units, the following diluted earnings per share targets for the years ended December 31, 2012, 2013 and 2014 are achieved:
2012 | 2013 | 2014 | |
Diluted Earnings Per Share (a) | $1.48 | $1.74 | $2.04 |
(a) | Calculated on a Pro Forma basis to exclude non-operating gains and losses, if any, and excluding the after-tax impact of stock compensation expense. |
As of December 31, 2011, management believed that achieving these performance targets was “more likely than not” to occur and we began recording share-based compensation expense for these Restricted Share Units. The closing price of our common stock on the grant date equals the grant date fair value of these nonvested Restricted Share Units awards and will be recognized as compensation expense over their vesting periods.
In the fourth quarter of 2011, our Board of Directors approved grants of 164,808 performance-based Restricted Share Units. These Restricted Share Units are nonvested share awards which would vest 50% in 2014 and 50% in 2015 only if we achieve a diluted earnings per share compound annual growth rate ("CAGR") of seventeen percent (17%) for the two-year period ending December 31, 2013. Diluted earnings per share will be calculated on a Pro Forma basis to exclude non-operating gains and losses, if any, and exclude the after-tax impact of Stock Compensation Expense. For each 1% that the CAGR actually achieved for the two year period ending on December 31, 2013 is above the 17% target, the number of shares underlying the Restricted Share Units awarded would be increased by 3.09%; provided, however, that the maximum increase in the number of shares that may be awarded is 100%. Likewise, for each 1% that the CAGR actually achieved for the two-year period ending on December 31, 2013 is below the 17% target, the number of shares underlying the Restricted Share Units awarded would be decreased by 1.13%. If the target CAGR is missed by 80% or more, then the number of shares awarded is zero.
As of December 31, 2011, management believed that achieving the 17% two-year CAGR target was “more likely than not” to occur and began recording share-based compensation expense for these Restricted Share Units. The closing price of our
52
common stock on the grant date equals the grant date fair value of these nonvested Restricted Share Units awards and will be recognized as compensation expense over their vesting periods.
Amounts we recognized in our financial statements during the years ended December 31, 2011, 2010 and 2009 with respect to share-based compensation plans were as follows (in thousands):
Year Ended December 31, | ||||||||||||
2011 | 2010 | 2009 | ||||||||||
Compensation expense recognized on share-based plans before income tax benefit | $ | 9,548 | $ | 6,295 | $ | 4,526 | ||||||
Related income tax benefit recognized in the income statement | 3,635 | 2,379 | 1,723 | |||||||||
Cash received from stock option exercises | 9,685 | 6,303 | 1,045 | |||||||||
Excess tax benefit recorded for tax deductions resulting from the exercise of stock options | 3,454 | 1,910 | 384 | |||||||||
Tax benefit realized as reductions of estimated tax payments during the period | 2,954 | — | 250 | |||||||||
Goodwill
Goodwill represents the excess of acquisition costs over the fair values of net assets acquired in business combinations. We recorded goodwill in connection with our acquisitions, including our recent 2010 and 2011 acquisitions of
Lunchbox, Comalex, mySchoolBucks and School-Link. Goodwill is tested for impairment at least annually and between annual tests if an event occurs or changes in circumstances suggest a potential decline in the fair value of the reporting unit. A significant amount of judgment is involved in determining if an indicator or change in circumstances relating to impairment has occurred. Such changes may include, among others: a significant decline in expected future cash flows; a sustained decline in market capitalization; a significant adverse change in legal factors or in the business climate; unanticipated competition; and slower growth rates. We perform annual goodwill impairment testing in the fourth quarter. Our evaluation indicated that no impairment existed as of December 31, 2011 or 2010. At December 31, 2011 and 2010, goodwill of $103.4 million and $68.3 million, respectively, was recorded on our Consolidated Balance Sheet. We may be required to record goodwill impairment losses in future periods, whether in connection with our next annual impairment testing in the fourth quarter of 2012 or prior to then, if any such indicators constitute a triggering event in other than the quarter in which the annual goodwill impairment test is performed. It is not possible at this time to determine if any such future impairment loss would result or, if it does, whether such charge would be material.
Income Taxes
We account for income taxes by recognizing deferred tax assets and liabilities, which are recorded to reflect the future tax consequences attributable to the effects of differences between the carrying amounts of existing assets and liabilities for financial reporting and for income tax purposes. Judgments are required in determining the amount and probability of future taxable income, which in turn is critical to a determination of whether a valuation reserve against the deferred tax asset is appropriate.
We also account for the recognition and measurement of tax benefits associated with uncertain tax positions. This requires evaluations of individual tax positions to determine whether any part of that position can be recognized or continue to be recognized in the financial statements. An uncertain tax position exists if it is unclear how a transaction will be treated under tax law. We had approximately $1.8 million of total gross unrecognized tax benefits as of December 31, 2011, approximately $1.1 million of which would impact the effective tax rate.
We have recorded income tax expense (benefit) at U.S. tax rates on all taxable income (loss), except undistributed earnings of CPOS, our Canadian subsidiary. We intend to indefinitely reinvest undistributed earnings of CPOS and accordingly, have provided Canadian income tax on those earnings but not U.S. income tax. The amount of undistributed earnings of CPOS for which we have not recorded U.S. income tax was approximately $2.2 million. In the event of distribution of those earnings in the form of dividends or otherwise, we would be subject to U.S. income taxes subject to an adjustment, if any, for foreign tax credits. Determination of the amount of U.S. income tax liability that would be incurred is not practicable because of the complexities associated with this hypothetical calculation.
53
Results of Operations
Year Ended December 31, 2011 Compared to Year Ended December 31, 2010
The following table shows certain income statement data as a percentage of revenue for the periods indicated (in thousands of dollars):
% of Total Revenue | % of Total Revenue | Change | |||||||||||||||||
2011 | 2010 | Amount | % | ||||||||||||||||
Total revenues | $ | 1,996,950 | 100.0 | % | $ | 1,864,337 | 100.0 | % | $ | 132,613 | 7.1 | % | |||||||
Costs of services: | |||||||||||||||||||
Interchange | 1,359,448 | 68.1 | % | 1,299,631 | 69.7 | % | 59,817 | 4.6 | % | ||||||||||
Dues, assessments and fees | 155,233 | 7.8 | % | 119,834 | 6.4 | % | 35,399 | 29.5 | % | ||||||||||
Processing and servicing | 212,747 | 10.7 | % | 228,953 | 12.3 | % | (16,206 | ) | (7.1 | )% | |||||||||
Customer acquisition costs | 46,140 | 2.3 | % | 50,415 | 2.7 | % | (4,275 | ) | (8.5 | )% | |||||||||
Depreciation and amortization | 14,675 | 0.7 | % | 15,201 | 0.8 | % | (526 | ) | (3.5 | )% | |||||||||
Total costs of services | 1,788,243 | 89.5 | % | 1,714,034 | 91.9 | % | 74,209 | 4.3 | % | ||||||||||
General and administrative | 130,724 | 6.5 | % | 104,088 | 5.6 | % | 26,636 | 25.6 | % | ||||||||||
Total expenses | 1,918,967 | 96.1 | % | 1,818,122 | 97.5 | % | 100,845 | 5.5 | % | ||||||||||
Income from operations | 77,983 | 3.9 | % | 46,215 | 2.5 | % | 31,768 | 68.7 | % | ||||||||||
Other income (expense): | |||||||||||||||||||
Interest income | 177 | 148 | 29 | 19.6 | % | ||||||||||||||
Interest expense | (4,125 | ) | (0.2 | )% | (4,778 | ) | (0.3 | )% | 653 | (13.7 | )% | ||||||||
(Provision for) recovery of processing system intrusion costs | (1,012 | ) | (0.1 | )% | 14,138 | 0.8 | % | (15,150 | ) | (107.2 | )% | ||||||||
Other, net | (1,550 | ) | 72 | (1,622 | ) | ||||||||||||||
Total other (expense)income | (6,510 | ) | (0.3 | )% | 9,580 | 0.5 | % | (16,090 | ) | (168.0 | )% | ||||||||
Income before income taxes | 71,473 | 3.6 | % | 55,795 | 3.0 | % | 15,678 | 28.1 | % | ||||||||||
Provision for income taxes | 27,126 | 1.4 | % | 21,135 | 1.1 | % | 5,991 | 28.3 | % | ||||||||||
Net income | 44,347 | 2.2 | % | 34,660 | 1.9 | % | 9,687 | 27.9 | % | ||||||||||
Less: Net income attributable to noncontrolling interests | 408 | 123 | 285 | ||||||||||||||||
Net income attributable to Heartland | $ | 43,939 | 2.2 | % | $ | 34,537 | 1.9 | % | $ | 9,402 | 27.2 | % | |||||||
Total Revenues. Total revenues increased by 7.1% from $1,864.3 million in 2010 to $1,997.0 million in 2011, primarily as a result of a $128.3 million, or 7.1% increase in gross processing revenues. The breakout of our total revenues for the years ended December 31, 2011 and 2010 was as follows (in thousands of dollars):
Year Ended December 31, | Change from Prior Year | |||||||||||||
2011 | 2010 | Amount | % | |||||||||||
Processing revenues, gross (a) | $ | 1,942,920 | $ | 1,814,655 | $ | 128,265 | 7.1 | % | ||||||
Payroll processing revenues | 19,505 | 17,344 | 2,161 | 12.5 | % | |||||||||
Equipment-related income | 34,525 | 32,338 | 2,187 | 6.8 | % | |||||||||
Total Revenues | $ | 1,996,950 | $ | 1,864,337 | $ | 132,613 | 7.1 | % | ||||||
Net revenues | $ | 482,269 | $ | 444,872 | $ | 37,398 | 8.4 | % | ||||||
(a) | Includes Visa, MasterCard, AMEX and Discover bankcard processing revenues, AMEX fees, check processing fees, customer service fees, gift card, loyalty, K to 12 School Solutions and other miscellaneous revenue. |
Processing revenues, gross. The $128.3 million increase in processing revenues from $1,814.7 million in 2010 to $1,942.9 million in 2011 was primarily due to higher SME merchant card processing revenues. Revenues from our SME bankcard processing increased due to higher SME bankcard processing volume. Our SME bankcard processing volume increased 7.0% to $67.5 billion, compared to $63.1 billion in 2010, reflecting increases for same store sales growth, new SME merchants installed, and growth in American Express and Discover processing. We include American Express volume in our SME bankcard processing volume only where we receive percentage-based residual compensation for that volume.
The “Durbin Amendment,” which was part of the July 2010 Dodd-Frank Wall Street Reform and Consumer Protection
54
Act and went into effect on October 1, 2011, places limits on debit card interchange rates that card issuing banks may charge. While not impacting our net revenue (which for SME merchants is presented net of interchange, dues and assessments and fees), beginning in the fourth quarter of 2011, there was a decrease in the interchange expense we record in our Income Statement of approximately $42.1 million as a result of the Durbin Amendment. Since our gross card processing revenues include the interchange that we pass through to our SME merchants, our Total Revenues decreased by an equivalent amount.
Network Services increased its bankcard processing revenues based on the 553 million transactions it settled, representing $15.5 billion in processing volume, and the 2.7 billion transactions it authorized through its front-end card processing systems in 2011, as compared to the 488 million transactions it settled, representing $11.3 billion in processing volume, and the 2.6 billion transactions it authorized through its front-end card processing systems in 2010. We report Network Services’ settled bankcard processing revenues net of credit interchange because the daily cash settlement with Network Services’ merchants is on a net basis.
Also contributing to our growth in processing revenues for the year ended December 31, 2011 were the processing revenues generated by our recently acquired K to 12 School Solutions businesses, and from prepaid card income including loyalty and gift marketing.
Payroll processing revenues. Payroll processing revenues, which include fees earned on payroll processing services and interest income earned on funds held for customers, increased by 12.5%, from $17.3 million in 2010 to $19.5 million in 2011, primarily due to the 6.4% increase in the number of payroll processing customers from 11,131 at December 31, 2010 to 11,841 at December 31, 2011.
Equipment-related income. Equipment-related income increased by $2.2 million, or 6.8%, from $32.3 million in 2010 to $34.5 million in 2011, primarily due to increases in revenues from sales of equipment in our acquired K to 12 School Solutions businesses, as well as at CPOS, our Canadian subsidiary, and from sales of our SmartLink telecommunications equipment which is used to consolidate multiple in-store communication lines into one high speed broadband line.
Net Revenue. Net revenue, which we define as total revenues less interchange fees and dues, assessments and fees, increased 8.4% from $444.9 million in 2010, to $482.3 million in 2011. The increase in net revenue was driven primarily by increases in SME bankcard processing volume, Payroll processing revenues, loyalty and gift marketing processing revenues, newly acquired K to 12 School Solutions processing revenues and equipment-related revenues.
Costs of services. Costs of services increased 4.3% from $1,714.0 million in 2010 to $1,788.2 million in 2011, due primarily to increases in interchange fees, and dues, assessments and fees offset by a reduction in processing and servicing expense. Costs of services represented 89.5% of total revenues in 2011, compared to 91.9% in 2010.
Interchange fees increased 4.6% from $1,299.6 million in 2010 to $1,359.4 million in 2011, and represented 68.1% of total revenues in 2011 compared to 69.7% in 2010. The increase in interchange fees was primarily due to higher SME bankcard processing volume in the year ended December 31, 2011, especially for American Express which generally has higher interchange rates than Visa and MasterCard. The impact of the Durbin Amendment since becoming effective on October 1, 2011 was a decrease in interchange expense of approximately $42.1 million.
Dues, assessments and fees increased 29.5% from $119.8 million in 2010 to $155.2 million in 2011, primarily as a result of increases in Visa, MasterCard and Discover assessments which we pass through to our merchants, and also due to higher SME bankcard processing volume and increased due, assessments and fees on our Network services Merchants. Dues, assessments and fees were 7.8% of total revenues in 2011, compared to 6.4% in 2010.
Processing and servicing expense for 2011 decreased by $16.2 million or 7.1%, compared with 2010. The decrease in processing and servicing expense for the year ended December 31, 2011 was primarily due to reductions in transaction processing costs for Network Services' front-end transactions, lower residual commission expense, reduced merchant losses and reduced costs of support personnel, particularly account managers. Lower residual commissions were the result of exercising our rights to buy out a substantial amount of portfolio equity owned by our Relationship Managers and sales managers during the third quarter of 2010. We continue to buy out portfolio equity. See "— Critical Accounting Estimates — Accrued Buyout Liability" for more detail. Partially offsetting these reductions were increased costs associated with servicing higher bankcard processing volume and increased costs of sales and servicing related to the higher payroll, loyalty and gift marketing, and equipment-related revenues as well as cost of sales and service for the K to 12 School Solutions businesses. Processing and servicing expense as a percentage of total revenues decreased to 10.7% in 2011 compared with 12.3% in 2010.
Customer acquisition costs for the year ended December 31, 2011 decreased by $4.3 million, or 8.5% compared with the year ended December 31, 2010. This decline primarily reflects the impacts of lower signing bonus amortization, as
55
capitalized signing bonuses recorded in periods having higher new gross margin installed, such as 2008, become fully amortized and are replaced with smaller capitalized signing bonuses resulting from our current lower levels of new gross margin installed. Customer acquisition costs for the year ended December 31, 2011 and 2010 included the following components (in thousands of dollars):
Year Ended December 31, | |||||||
2011 | 2010 | ||||||
Amortization of signing bonuses, net (a) | $ | 32,088 | $ | 37,990 | |||
Amortization of capitalized customer deferred acquisition costs | 15,460 | 16,007 | |||||
Increase in accrued buyout liability | 13,228 | 11,133 | |||||
Capitalized customer deferred acquisition costs | (14,276 | ) | (14,715 | ) | |||
Total Customer Acquisition Costs | $ | 46,500 | $ | 50,415 | |||
(a) Includes Other, net impairment expense related to our remote check deposit product, Express Funds.
Depreciation and amortization expenses decreased 3.5% from $15.2 million in 2010 to $14.7 million in 2011. Most of our investments in information technology have been for security-related enhancements and in support of the continuing development of HPS Exchange, Passport and other processing-related initiatives. Depreciation and amortization expense recorded on these investments is included in processing and servicing expense. Additionally, we capitalized salaries, fringe benefits and other expenses incurred by our employees that worked on internally developed software projects and outsourced programming. Amortization does not begin on the internally developed software until the project is complete and placed in service, at which time we begin to amortize the asset over expected lives of three to five years. The amount capitalized increased from $15.6 million in 2010 to $22.6 million in 2011. The total amount of capitalized costs for projects placed in service in 2011 and 2010 was $15.9 million and $15.7 million, respectively.
General and administrative. General and administrative expenses increased $26.6 million, or 25.6%, from $104.1 million in 2010 to $130.7 million in 2011. General and administrative expenses in the 2011 and 2010 periods included $1.3 million and $2.3 million, respectively, for our periodic sales and servicing organization summit. Excluding these summit expenses, our general and administrative expenses in 2011 increased $27.6 million, or 27.2%. This increase primarily resulted from expenses related to acquisitions, restoration of incentive compensation, and increased staff, all of which are reflected in increases of $13.2 million in personnel costs, and from costs we incurred in the process of consolidating our data centers. Additional increases in 2011 included $3.3 million in equipment lease expense, $3.0 million in travel expenses (mostly related to sales incentive travel rewards), $1.9 million in occupancy costs, $1.7 million in legal fees, $1.8 million in telecommunication expenses, $1.6 million in repairs and maintenance expense and $1.4 million in consulting expense. These increases in general and administrative expenses were partially offset by reductions in marketing-related costs of $2.5 million. General and administrative expenses as a percentage of total revenue for 2011 was 6.5%, an increase from 5.6% for 2010.
Income from operations. As a result of the increase in net revenue and reductions in processing and servicing expenses, our income from operations, which we also refer to as operating income, improved to $78.0 million for 2011, from $46.2 million for 2010. Our operating margin, which we measure as operating income divided by Net Revenue, was 16.2% for 2011, compared to 10.4% for 2010.
Interest expense. Interest expense for 2011 and 2010 was $4.1 million and $4.8 million, respectively. Interest expense in both periods includes interest incurred under our Credit Facilities and interest we recorded on payables to our sponsor banks. See “—Liquidity and Capital Resources—Credit Facility” for more detail on our borrowings. Interest expense which we recorded on payables to our sponsor banks resulted from our practice of having our SME sponsor banks advance interchange fees to most of our SME merchants. Generally, we fund these advances to our SME merchants first with our available cash, then by incurring a payable to our sponsor banks when that cash has been expended. We pay our sponsor banks the prime rate on these payables.
(Provision for) recovery of processing system intrusion costs. See “—Overview—Processing System Intrusion and —Critical Accounting Estimates—Reserve for Processing System Intrusion” for more details on the Processing System Intrusion.
During 2011, we recorded total expenses of $1.0 million, or $(0.02) per share, associated with the Processing System Intrusion. During 2010, we recovered from our insurance providers approximately $27.2 million of the costs we incurred for the Processing System Intrusion and expensed approximately $13.1 million for accruals, legal fees and costs we incurred for investigations and defending various claims and actions, for a net recovery of $14.1 million, or $0.22 per share.
56
Other income (expense), net. Other, net for 2011 included pre-tax charges of $0.8 million reflecting the costs (primarily accrued staff termination costs and fixed asset write downs) associated with closing our Johnson City, Tennessee service center and pre-tax charges of $1.1 million relating to the decision to discontinue Express Funds, our remote deposit check capture product. Also included in other, net is pre-tax income of $0.3 million related to an earnout payment relating to the 2010 sale of SME merchant bankcard processing contracts.
Other, net for 2010 reflected a net legal settlement received during that period, a pre-tax gain from the sale of SME merchant bankcard processing contracts, a pre-tax charge for the impairment of an acquisition intangible asset and estimated liability costs associated with the announced closing of our Johnson City, Tennessee service center.
Income taxes. Income tax expense for 2011 was $27.1 million, reflecting an effective tax rate of 38.0%. This compares to income tax expense of $21.1 million for 2010, reflecting an effective tax rate of 37.9%. The increase in the effective tax rate for 2011 was due to state income tax increases.
Net income attributable to Heartland. As a result of the above factors, we recorded net income of $43.9 million for 2011. This compares to a net income of $34.5 million for 2010.
Year Ended December 31, 2010 Compared to Year Ended December 31, 2009
The following table shows certain income statement data as a percentage of revenue for the year ended December 31, 2010 compared to the year ended December 31, 2009 (in thousands of dollars):
% of Total Revenue | % of Total Revenue | Change | |||||||||||||||||
2010 | 2009 | Amount | % | ||||||||||||||||
Total revenues | $ | 1,864,337 | 100.0 | % | $ | 1,652,139 | 100.0 | % | $ | 212,198 | 12.8 | % | |||||||
Costs of services: | |||||||||||||||||||
Interchange | 1,299,631 | 69.7 | % | 1,142,112 | 69.1 | % | 157,519 | 13.8 | % | ||||||||||
Dues, assessments and fees | 119,834 | 6.4 | % | 89,844 | 5.4 | % | 29,990 | 33.4 | % | ||||||||||
Processing and servicing | 228,953 | 12.3 | % | 199,934 | 12.1 | % | 29,019 | 14.5 | % | ||||||||||
Customer acquisition costs | 50,415 | 2.7 | % | 50,362 | 3.0 | % | 53 | 0.1 | % | ||||||||||
Depreciation and amortization | 15,201 | 0.8 | % | 15,786 | 1.0 | % | (585 | ) | (3.7 | )% | |||||||||
Total costs of services | 1,714,034 | 91.9 | % | 1,498,038 | 90.7 | % | 215,996 | 14.4 | % | ||||||||||
General and administrative | 104,088 | 5.6 | % | 104,154 | 6.3 | % | (66 | ) | (0.1 | )% | |||||||||
Total expenses | 1,818,122 | 97.5 | % | 1,602,192 | 97.0 | % | 215,930 | 13.5 | % | ||||||||||
Income from operations | 46,215 | 2.5 | % | 49,947 | 3.0 | % | (3,732 | ) | (7.5 | )% | |||||||||
Other income (expense): | |||||||||||||||||||
Interest income | 148 | 117 | 31 | 26.5 | % | ||||||||||||||
Interest expense | (4,778 | ) | (0.3 | )% | (2,698 | ) | (0.2 | )% | (2,080 | ) | 77.1 | % | |||||||
(Provision for) recovery of processing system intrusion costs | 14,138 | 0.8 | % | (128,943 | ) | (7.8 | )% | 143,081 | (111.0 | )% | |||||||||
Other, net | 72 | (72 | ) | 144 | (200.0 | )% | |||||||||||||
Total other (expense)income | 9,580 | 0.5 | % | (131,596 | ) | (8.0 | )% | 141,176 | (107.3 | )% | |||||||||
Income before income taxes | 55,795 | 3.0 | % | (81,649 | ) | (4.9 | )% | 137,444 | (168.3 | )% | |||||||||
Provision for income taxes | 21,135 | 1.1 | % | (29,919 | ) | (1.8 | )% | 51,054 | (170.6 | )% | |||||||||
Net income | 34,660 | 1.9 | % | (51,730 | ) | (3.1 | )% | 86,390 | (167.0 | )% | |||||||||
Less: Net income attributable to noncontrolling interests | 123 | 66 | 57 | ||||||||||||||||
Net income attributable to Heartland | $ | 34,537 | 1.9 | % | $ | (51,796 | ) | (3.1 | )% | $ | 86,333 | (166.7 | )% | ||||||
Total Revenues. Total revenues increased by 12.8%, from $1,652.1 million in 2009 to $1,864.3 million in 2010, primarily as a result of a $204.5 million, or 12.7%, increase in our bankcard processing revenues. The breakout of our total revenues for the years ended December 31, 2010 and 2009 was as follows (in thousands of dollars):
57
Year Ended December 31, | Change from Prior Year | |||||||||||||
2010 | 2009 | Amount | % | |||||||||||
Processing revenues, gross (a) | $ | 1,814,655 | $ | 1,610,108 | $ | 204,547 | 12.7 | % | ||||||
Payroll processing revenues | 17,344 | 15,046 | 2,298 | 15.3 | % | |||||||||
Equipment-related income | 32,338 | 26,985 | 5,353 | 19.8 | % | |||||||||
Total Revenues | $ | 1,864,337 | $ | 1,652,139 | $ | 212,198 | 12.8 | % | ||||||
Net revenues | $ | 444,872 | $ | 420,183 | $ | 24,688 | 5.9 | % | ||||||
(a) | Includes Visa, MasterCard, AMEX and Discover bankcard processing revenues, AMEX fees, Discover fees, check processing fees, customer service fees, gift card, loyalty and other miscellaneous revenue. |
Processing revenues, gross. The increase in our gross processing revenues from $1,610.1 million in 2009 to $1,814.7 million in 2010 was primarily due to higher SME merchant card processing revenues. Revenues from our SME bankcard processing are primarily earned as a percentage of processing volume. Our SME bankcard processing volume increased 7.0% to $63.1 billion, compared to $59.0 billion in 2009. American Express and Discover processing volume contributed over 40% of this year-over-year increase. Network Services increased its bankcard processing revenues on the 488 million transactions it settled, representing $11.3 billion in processing volume, and the 2.6 billion transactions it authorized through its front-end card processing systems during the year ended December 31, 2010, compared to 462 million transactions it settled, representing $9.9 billion in processing volume, and the 2.4 billion transactions it authorized through its front-end card processing systems during the year ended December 31, 2009. The increase in Network Services' bankcard processing revenues was primarily due to increases in Visa and MasterCard bankcard transaction authorization fees, which we pass through to our merchants, partially offset by reductions in gross processing revenues due to renegotiations of customer contracts. We report Network Services' settled bankcard processing revenues net of credit interchange and dues and assessments because the daily cash settlement with Network Services' merchants is on a net basis.
Payroll processing revenues. Payroll processing revenues, which include fees earned on payroll processing services and interest income earned on funds held for customers, increased by 15.3%, from $15.0 million in 2009 to $17.3 million in 2010, primarily due to the 18.6% increase in the number of payroll processing customers from 9,382 at December 31, 2009 to 11,131 at December 31, 2010, partially offset by the impact of a reduction in the average number of employees at our customers.
Equipment-related income. Equipment-related income increased by 19.8% from $27.0 million in 2009 to $32.3 million in 2010, primarily due to increases in revenues from the laundry vertical in our prepaid and stored-value card business as well as increases in revenues from our campus solutions business, both at our Debitek subsidiary. We also experienced an increase in equipment-related revenues from the sale of SME card terminals, including our proprietary terminals, referred to as E3 Terminals, which encrypt cardholder data as the card is being swiped.
Net revenue. Net revenue, which we define as total revenues less interchange fees and dues, assessments and fees, increased 5.9% from $420.2 million in 2009, to $444.9 million in 2010. The increase in net revenue was driven primarily by increases in SME bankcard processing volume and equipment-related revenues. Net revenue for Network Services' merchants declined in 2010 primarily due to renegotiations of customer contracts. Excluding Network Services' net revenue decline from consideration, our aggregate net revenue would have grown by 8.8% in the year ended December 31, 2010.
Costs of services. Costs of services increased 14.4% from $1.5 billion in 2009 to $1.7 billion in 2010, due primarily to increases in interchange fees, dues, assessments and fees, and processing and servicing expense.
Costs of services represented 91.9% of total revenues in 2010, up slightly from 90.7% in 2009.
Interchange fees increased 13.8% from $1,142.1 million in 2009 to $1,299.6 million in 2010, and represented 69.7% of total revenues in 2010 compared to 69.1% in 2009. The increase in interchange fees was primarily due to higher SME bankcard processing volume in the year ended December 31, 2010, especially for American Express and Discover which generally have higher interchange rates than Visa and MasterCard.
Dues, assessments and fees increased 33.4% from $89.8 million in 2009 to $119.8 million in 2010, primarily as a result of increases in MasterCard and Visa bankcard transaction authorization fees during 2009, as well as increases in MasterCard and Visa assessments during 2010, and also due to higher SME bankcard processing volume. Dues, assessments and fees were 6.4% of total revenues in 2010, compared to 5.4% in 2009.
Processing and servicing expense for 2010 increased by $29.0 million, or 14.5%, compared with 2009. The increase in
58
processing and servicing expense was due to costs associated with processing the higher SME bankcard processing volume, increased costs of sales related to the higher payroll and equipment-related revenues as well as phone card and loyalty and gift related revenues, costs of investments we have made in enhancing our processing systems, an increase in the amount of merchant losses and increases in the costs of operating our service centers, particularly the costs of support personnel, including account managers and depreciation and amortization. As a percentage of total revenue, processing and servicing expense increased slightly to 12.3% in 2010 compared with 12.1% in 2009.
Included in processing and servicing expense was $6.2 million of payroll processing costs in the year ended December 31, 2010, an increase of 43.9% from $4.3 million recorded in the year ended December 31, 2009. This increase was primarily due to increased costs associated with our new PlusOne Payroll system, particularly depreciation and amortization, as well as the 18.6% increase in the number of payroll processing customers from 9,382 at December 31, 2009 to 11,131 at December 31, 2010.
Customer acquisition costs remained flat at $50.4 million in 2010 and in 2009. Customer acquisition costs for the years ended 2010 and 2009 included the following components (in thousands of dollars):
Year Ended December 31, | |||||||
2010 | 2009 | ||||||
Amortization of signing bonuses, net | $ | 37,990 | $ | 40,897 | |||
Amortization of capitalized customer deferred acquisition costs | 16,007 | 15,941 | |||||
Increase in accrued buyout liability | 11,133 | 9,973 | |||||
Capitalized customer deferred acquisition costs | (14,715 | ) | (16,449 | ) | |||
Total Customer Acquisition Costs | $ | 50,415 | $ | 50,362 | |||
Depreciation and amortization expenses decreased 3.7%, from $15.8 million in 2009 to $15.2 million in 2010. Most of our investments in information technology have been for security-related enhancements and in support of the continuing development of HPS Exchange, Passport and other processing-related initiatives. Depreciation and amortization expense recorded on these investments is included in processing and servicing expense. Additionally, we capitalized salaries, fringe benefits and other expenses incurred by our employees that worked on internally developed software projects and outsourced programming. Amortization does not begin on the internally developed software until the project is complete and placed in service, at which time we begin to amortize the asset over expected lives of three to five years. The amount capitalized increased from $12.3 million in 2009 to $15.6 million in 2010. The total amount of capitalized costs for projects placed in service in 2010 and 2009 was $15.7 million and $8.7 million, respectively.
General and administrative. General and administrative expenses decreased slightly from $104.2 million in 2009 to $104.1 million in 2010. This decrease was primarily due to cost containment measures instituted mid-year, resulting in a reduction in legal, consulting and personnel costs. Personnel cost reductions included decreases in bonus and medical benefit costs, as well as an increase in the amount of capitalized salaries, partially offset by higher stock compensation expense. Our payroll operation's general and administrative expenses increased 17.8%, from $6.3 million in 2009 to $7.4 million in 2010. General and administrative expenses as a percentage of total revenue were 5.6% for 2010, a decrease from 6.3% for 2009.
Income from operations. Our income from operations, which we also refer to as operating income, declined to $46.2 million for 2010, from $50.0 million for 2009. This decline was primarily due to the continuing limiting effect which economic conditions had on growth in our net revenues, and to increases in processing and servicing expenses. Our operating margin, which is measured as operating income divided by net revenue, was 10.4% for 2010, compared to 11.9% for 2009.
Interest expense. Interest expense of $4.8 million was recorded in 2010, a 77.1% increase from the $2.7 million recorded in 2009. The increase in interest expense for 2010 was due to higher interest rates incurred on our borrowings under our Credit Facilities, increased borrowings under our Credit Facilities and Bridge Loan, and higher average payables to our sponsor banks. Interest expense for 2010 included approximately $1.7 million related to borrowings we incurred to fund the settlement with Visa in February 2010 (see “—Overview —Processing System Intrusion” for more detail). See “—Liquidity and Capital Resources —Credit Facilities” for more detail on our borrowings. Interest expense which we recorded as payables to our sponsor banks resulted from our practice of having our sponsor banks advance interchange fees to most of our SME merchants. Generally, when we have cash available for investment we fund these advances to our SME merchants first with our cash, then by incurring a payable to our sponsor banks when that cash has been expended. We pay our sponsor banks the prime rate on these payables.
Recovery of (Provision for) processing system intrusion. See “—Overview—Processing System Intrusion and —
59
Critical Accounting Estimates—Reserve for Processing System Intrusion” for more details on the Processing System Intrusion.
During 2010, we recovered from our insurance providers approximately $27.2 million of the costs we incurred for the Processing System Intrusion and expensed approximately $13.1 million for accruals, legal fees and costs we incurred for remediation and defending various claims and actions, for a net recovery of $14.1 million, or $0.22 per share. For 2009, we recorded total expenses of $128.9 million, or $2.16 per share, associated with the Processing System Intrusion.
Other, net. Other, net for 2010 also includes:
• | A pre-tax gain of $3.1 million from the sale of SME merchant bankcard processing contracts. During the fourth quarter of 2010, we sold 636 SME merchant accounts that had not been converted onto HPS Exchange and which were still processing on third-party platforms. This was a strategic sale undertaken to eliminate administrative and servicing inefficiencies associated with random merchant accounts processing on third party platforms. |
• | Net pre-tax charges of $1.7 million for legal settlements accrued or received during 2010. These legal settlements were unrelated to the Processing System Intrusion. |
• | A pre-tax charge of $0.8 million for the impairment of an acquisition intangible asset. |
• | Pre-tax charges of $0.5 million reflecting the estimated liability for costs (primarily accrued staff termination costs and fixed asset write downs) associated with the announced closing of our Johnson City, Tennessee service center. |
Other, net for 2009 included the write down of a debt security and a reduction of Canadian tax rebates.
Income tax. Our income tax expense for 2010 was $21.1 million, reflecting an effective tax rate of 37.9%. This compares to an effective tax rate of 36.6% for 2009, which resulted in income tax benefit of $29.9 million. The increase in the effective tax rate for 2010 primarily reflects the impacts of minimum income tax obligations in certain states. In 2009, we also recognized a one-time tax benefit of $18 million related to a change in the tax treatment of accrued buyout liabilities. Absent this change our effective tax rate for fiscal 2009 would have been 37.6%.
Net income (loss) attributable to Heartland. As a result of the above factors, we recorded net income of $34.5 million for the year ended December 31, 2010. This compares to a net loss of $51.8 million for the year ended December 31, 2009, primarily due to the Provision for Processing System Intrusion.
Balance Sheet Information
December 31, 2011 | December 31, 2010 | ||||||
(in thousands) | |||||||
Selected Balance Sheet Data | |||||||
Cash and cash equivalents | $ | 40,301 | $ | 41,729 | |||
Funds held for payroll customers | 42,511 | 36,523 | |||||
Receivables, net | 176,535 | 175,530 | |||||
Current tax asset | — | 18,652 | |||||
Current deferred tax assets, net | 6,746 | 7,250 | |||||
Capitalized customer acquisition costs, net | 55,014 | 59,251 | |||||
Property and equipment, net | 115,579 | 102,248 | |||||
Goodwill | 103,399 | 68,319 | |||||
Intangible assets, net | 32,498 | 31,160 | |||||
Total assets | 596,921 | 561,464 | |||||
Due to sponsor banks | 63,881 | 72,573 | |||||
Accounts payable | 47,373 | 42,126 | |||||
Deposits held for payroll customers | 42,511 | 36,523 | |||||
Borrowings: | |||||||
Current portion | 15,003 | 38,286 | |||||
Long term portion | 70,000 | 85,000 | |||||
Accrued buyout liability: | |||||||
Current portion | 8,104 | 5,560 | |||||
Long term portion | 23,554 | 23,250 | |||||
Total liabilities | 376,869 | 383,870 | |||||
Total stockholders’ equity | 219,410 | 177,293 | |||||
60
December 31, 2011 Compared to December 31, 2010
Total assets increased $35.5 million, or 6.3%, to $596.9 million at December 31, 2011 from $561.5 million at December 31, 2010, primarily due to increases in goodwill, and property and equipment.
The increases in goodwill resulted from the 2011 acquisitions of the K to 12 School Solutions businesses Comalex, mySchoolBucks and School-Link (see “— Liquidity and Capital Resources” for more detail).
At December 31, 2011, cash on our Balance Sheet totaled $40.3 million, a decrease of $1.4 million, or 3.4%, compared to cash of $41.7 million at December 31, 2010. Our December 31, 2011 cash balance included approximately $28.0 million of processing-related cash in transit and collateral, compared to approximately $25.6 million of cash in transit and collateral at December 31, 2010. Excluding the processing-related cash balances, our operating cash balance decreased $3.9 million, or 24.2%, as we used $15.0 million to repay balances under our Credit Facilities during 2011. See “— Liquidity and Capital Resources” for more detail.
Our receivables, which increased $1.0 million, or 0.6%, to $176.5 million at December 31, 2011 from $175.5 million at December 31, 2010, arise primarily from our bankcard processing merchants and result in large part from our practice of advancing interchange fees to most of our SME merchants during the processing month and collecting those fees from our merchants at the beginning of the following month, as well as from transaction fees we charge all merchants for processing transactions. Generally, the advances of interchange fees to our SME merchants are funded first with our available cash, then by incurring a payable to our sponsor banks when that cash has been expended. At December 31, 2011, we used $40.0 million of available cash to fund merchant advances and at December 31, 2010 we used $29.5 million of cash to fund merchant advances. The amount due to our sponsor banks for funding merchant interchange advances was $45.2 million at December 31, 2011, compared to $63.2 million at December 31, 2010. The payable to sponsor banks is repaid at the beginning of the following month out of the fees we collect from our merchants. Our total receivables from bankcard processing merchants decreased $3.1 million from December 31, 2010. Receivables from merchants also include receivables from the sale of point of sale terminal equipment and check processing terminals. Total receivables also include amounts due from bankcard networks for pre-funding of Discover and American Express transactions to our merchants as well as amounts due from Visa for PIN debit transactions. These amounts are recovered from the networks over the following two business days from the date of processing the transaction.
Our current tax asset shifted from an $18.7 million asset at December 31, 2010 to a current tax liability of $1.4 million at December 31, 2011, primarily due to tax refunds received from the carry back of our 2010 federal tax operating loss to prior years. The 2010 federal tax operating loss resulted from the payment of settlements with card brands and other Processing System Intrusion related expenses, net of recoveries from insurance providers (see “— Processing System Intrusion” for more detail).
Total borrowings decreased $38.3 million, or 31.1%, to $85.0 million at December 31, 2011 from $123.3 million at December 31, 2010, primarily due to paying off $23.2 million that was due under our Revolving Credit Facility and $15.0 million of amortization payments due under our Term Credit Facility. See “—Liquidity and Capital Resources” for discussion of Credit Facilities.
Total stockholders’ equity increased $42.1 million from December 31, 2010 primarily due to recording net income of $43.9 million for the year ended December 31, 2011. Other increases in total stockholders’ equity for the year ended December 31, 2011 included $9.7 million of proceeds received from the exercise of stock options, tax benefits of $3.5 million related to those stock option exercises and $9.5 million of share-based compensation expense.
Liquidity and Capital Resources
General. Liquidity and capital resource management is a process focused on providing the funding we need to meet our short and long-term cash and working capital needs. We have used our funding sources to build our merchant portfolio, our servicing technology platforms, and our Jeffersonville, Indiana service center, and to fund acquisitions with the expectation that these investments will generate cash flows sufficient to cover our working capital needs and other anticipated needs for capital.
Our cash requirements include funding payments to salespersons for signing bonuses, residual commissions and residual buyouts, paying interest expense and other operating expenses, including taxes, expanding our service center, investing in our technology infrastructure, and making acquisitions of businesses or assets. At times, including 2011, we have used cash to repurchase our common stock and in 2012 we expect to use our cash liquidity to repurchase additional shares of our common
61
stock. See “— Common Stock Repurchases” for more details.
Other than borrowings we had used to fund certain acquisitions and settlements of claims related to the Processing System Intrusion, we fund our cash needs primarily with cash flow from our operating activities and through our agreements with our sponsor banks to fund SME merchant advances. We believe that our current cash and investment balances, cash generated from operations and our agreements with our sponsor banks to fund SME merchant advances will provide sufficient liquidity to meet our anticipated needs for operating capital for at least the next twelve months.
Working Capital. Our working capital, defined as current assets less current liabilities, was positive by $29.9 million at December 31, 2011.
At December 31, 2011 we had cash on our Balance Sheet totaling $40.3 million compared to cash of $41.7 million at December 31, 2010. Our cash balance included processing-related cash in transit and collateral of $28.0 million and $25.6 million at December 31, 2011 and 2010, respectively. As of December 31, 2011, we had used $40.0 million of our available cash to fund merchant advances and at December 31, 2010, we had used $29.5 million of our cash to fund advances of interchange. Interchange advances are included in our receivables from bankcard processing merchants and are collected at the beginning of the following month.
On December 31, 2011, we had $50.0 million available under our Revolving Credit Facility. See “— Credit Facilities” for more details. Prior to refinancing of our credit facility in November 2010, our net working capital position was negative, reflecting (i) our previous revolving credit facility with its $75.0 million in borrowings classified as a current liability, and (ii) a $28.0 million Bridge Loan, which was due on February 17, 2011. See “— Credit Facilities” for discussion of our refinancing.
Settlements of Claims Related to the Processing System Intrusion. In 2009 and 2010, we had entered into settlements with the bankcard networks for various claims and disputes related to the Processing System Intrusion. See “— Overview — Processing System Intrusion” for a more detailed discussion of each claim and settlement.
2010 and 2011 Acquisitions. On December 30, 2010, we purchased for a $7.7 million cash payment the net assets of the K to 12 School Solutions business operated by Lunchbox. This acquisition was financed through a combination of cash on hand and our Revolving Credit Facility. We repaid the amount we borrowed under our Revolving Credit Facility in the first quarter of 2011. Lunchbox serves approximately 4,400 schools. Lunchbox develops, manufactures, sells and services and maintains computer software designed to facilitate accounting and management functions of food service operations of K to 12 schools.
On January 12, 2011, February 4, 2011 and September 30, 2011, we acquired the K to 12 School Solutions businesses of Comalex, Inc., mySchoolBucks, LLC, and School-Link Technologies, Inc, respectively. We made cash payments of $6.1 million, $1.5 million, and $15.6 million, respectively, for the net assets of these three businesses. These acquisitions, which were funded with cash on hand, will enable us to offer school nutrition and point-of-sale solutions including Internet payment capability enabling on-line deposits of funds into student accounts, to a wide base of schools, students and their parents. Comalex, mySchoolBucks and School-Link added approximately 3,700, 900 and 10,000 schools, respectively, to our K to 12 School Solutions product. These acquisitions have given us an almost 20% market share in this industry. We plan to consolidate the individual platforms and products of Lunchbox, Comalex, mySchoolBucks, and School-Link to optimize synergies, cost efficiencies and product offerings to our customers.
2009 Acquisition. On July 31, 2009, we purchased for $3.2 million the existing Discover merchant portfolio, which we were already processing. This purchase related to our 2008 agreement with DFS Services, LLC, which enables us to offer bankcard merchants a streamlined process that enables them to accept Discover Network cards on our processing platforms. This asset is being amortized over the next 61 months in proportion to estimated future cash flows.
Cash Flow Provided By (Used In) Operating Activities. We reported net cash provided by operating activities of $107.2 million in 2011, compared to net cash used in operating activities of $22.3 million in 2010 and net cash provided by operating activities of $61.5 million in 2009. Cash provided by operating activities in 2011 reflects our net income for the year ended December 31, 2011 as adjusted for non-cash operating items including depreciation and amortization, and share-based compensation expense. Cash provided by operating activities in 2011 also included a $16.7 million tax refund received from the carry back of our 2010 federal tax operating loss to prior years. The 2010 federal tax operating loss resulted from the payment of settlements with card brands in 2010 and other Processing System Intrusion related expenses, net of recoveries from insurance providers (see “— Processing System Intrusion” for more detail).
The primary reason for the negative operating cash flow for 2010 was the payment of $98.5 million, which is reflected
62
in the reduction of our Reserve for Processing System Intrusion, for the settlements with Visa, MasterCard and Discover. The Visa Settlement Agreement required us to obtain a loan of at least $53.0 million from our Sponsor Banks, the proceeds of which were to be used to fund the settlement amount. The settlements with MasterCard and Discover were funded from our cash reserves. Partially offsetting the impact of these settlements on our 2010 operating cash flow was approximately $27.2 million of cash we recovered from our insurance providers against certain costs we incurred for the Processing System Intrusion.
Other major determinants of operating cash flow in all periods are net signing bonus payments, which consume operating cash as we install new merchants, and payouts on the accrued buyout liability, which represent the costs of buying out residual commissions owned by our salespersons. See “— Critical Accounting Estimates — Capitalized Customer Acquisition Costs” and “— Critical Accounting Estimates — Accrued Buyout Liability” for more information. We paid net signing bonuses of $29.0 million, $26.5 million, and $34.7 million, respectively, in 2011, 2010 and 2009. The increase in net signing bonuses paid during the year ended December 31, 2011 reflects a year-over-year improvement in newly installed gross margin. In 2011, 2010 and 2009, we reduced our accrued buyout liability by making buyout payments of $10.4 million, $25.2 million, and $8.1 million, respectively. See “— Critical Accounting Estimates — Accrued Buyout Liability” for a discussion of buyouts initiated in the third quarter of 2010.
Cash Flow Used In Investing Activities. Net cash used in investing activities was $60.7 million for 2011, compared to $31.1 million for 2010 and $44.7 million in 2009. The amount of cash used in investing activities during 2011 included $23.2 million for the acquisitions of Comalex, mySchoolBucks and School-Link Technologies. During 2010, we acquired Lunchbox for a net cash payment of $7.7 million and in 2009 we purchased a Discover merchant portfolio for $3.2 million.
We made capital expenditures of $36.5 million, $23.3 million and $41.6 million in 2011, 2010, and 2009. Capital expenditures include costs of $6.7 million, $1.9 million and $18.6 million in 2011, 2010 and 2009, respectively, related to capital improvements to our service center facility in Jeffersonville, Indiana. We also continued building our technology infrastructure, primarily for hardware and software needed for the development and expansion of our operating platforms. To further develop our technology, we anticipate that these expenditures will continue near current levels.
Cash Flow (Used In) Provided By Financing Activities. Net cash used in financing activities was $47.8 million for 2011, compared to net cash provided by financing activities of $63.0 million for December 31, 2010, and net cash used in financing activities of $12.4 million in 2009.
During 2011, 2010 and 2009, we made term loan amortization payments of $15.0 million, $6.2 million, and $8.3 million, respectively, due under our Term Credit Facility and Previous Credit Facility, respectively, and during 2011 we paid down $23.2 million on our Revolving Credit Facility. See “— Credit Facilities” for more details. Cash flow provided by financing activities for 2010 included the $53.0 million of proceeds from the loans we obtained from our Sponsor Banks to use in funding the February 18, 2010 settlement with Visa (see “— Overview — Processing System Intrusion” for more detail).
Cash used in financing activities in 2011 and 2009 included cash for common stock repurchases. See “ —Common Stock Repurchases” for more information on our common stock repurchase authorizations. We used $16.4 million of cash to repurchase 778,889 shares of our common stock during 2011 and $3.2 million of cash to repurchase 350,400 shares of our common stock during 2009. No common stock was repurchased during 2010.
Cash dividends paid in 2011 were $6.2 million, compared to cash dividends paid of $1.5 million and $2.1 million, respectively, in 2010 and 2009. See “— Dividends on Common Stock” for more information on our common stock dividends. During 2011, 2010 and 2009, employees exercised stock options generating cash proceeds in the aggregate of $9.7 million, $6.3 million and $1.0 million, respectively, and tax benefits of $3.5 million, $1.9 million and $0.4 million, respectively.
Credit Facilities. On November 24, 2010, we entered into a Second Amended and Restated Credit Agreement (the “Credit Agreement”) with JPMorgan Chase Bank, N.A., as administrative agent, and certain lenders who are a party to the Credit Agreement. Credit extended under the Credit Agreement is guaranteed by our subsidiaries and is secured by substantially all of our assets and the assets of our subsidiaries. The Credit Agreement amended and restated in its entirety our previous amended and restated credit agreement entered into on May 30, 2008, as amended (the “Previous Credit Agreement”), between us and certain of the parties to the Credit Agreement. On February 18, 2010, we entered into the Commitment Increase Agreement with KeyBank as one of the lenders under the Previous Credit Agreement to increase the total commitment under that facility's revolving credit facility by $25 million.
The Credit Agreement provides for a revolving credit facility in the aggregate amount of up to $50 million (the “Revolving Credit Facility”), of which up to $10 million may be used for the issuance of letters of credit and up to $5 million is available for swing line loans. Upon the prior approval of the administrative agent, we may increase the total revolving
63
commitments by $50 million for a total commitment under the Revolving Credit Facility of $100 million. The Revolving Credit Facility is available to us on a revolving basis until November 24, 2015. All principal and interest not previously paid on the Revolving Credit Facility will mature and be due and payable on November 24, 2015.
The Credit Agreement also provides a term credit facility in the aggregate amount of up to $100 million (the “Term Credit Facility”). The Term Credit Facility requires amortization payments in the amount of $3.75 million for each fiscal quarter during the fiscal years ended December 31, 2011 and 2012, $5.0 million for each fiscal quarter during the fiscal years ended December 31, 2013 and 2014, and $7.5 million for each fiscal quarter during the period commencing on January 1, 2015 through the maturity date on November 24, 2015. All principal and interest not previously paid on the Term Credit Facility will mature and be due and payable on November 24, 2015.
The Credit Agreement contains covenants which include: maintenance of certain leverage and fixed charge coverage ratios; limitations on our indebtedness, liens on our properties and assets, investments in, and loans to other business units, our ability to enter into business combinations and asset sales; and certain other financial and non-financial covenants. These covenants also apply to certain of our subsidiaries. We were in compliance with these covenants as of December 31, 2011 and expect we will remain in compliance with these covenants for at least the next twelve months.
At December 31, 2011, there was $85.0 million outstanding under the Term Credit Facility and no borrowings outstanding under the Revolving Credit Facility.
At December 31, 2010, we had $23.2 million outstanding under the Revolving Credit Facility and $100.0 million outstanding under the Term Credit Facility. Amounts previously borrowed and outstanding under the Previous Credit Agreement, the Increased Credit Commitment, and the Bridge Loan were all repaid on November 24, 2010 from the amounts we borrowed under the Revolving Credit Facility and the Term Credit Facility. Additionally, $7.7 million of the total amount outstanding under the Revolving Credit Facility at December 31, 2010 was used in the acquisition of Lunchbox.
Common Stock Repurchases. On October 21, 2011, our Board of Directors authorized the repurchase of up to $50 million worth of our common stock. Repurchases under this program will be made through the open market, or in privately negotiated transactions, from time to time in accordance with applicable laws and regulations. We intend to fund any repurchases with cash flow from operations, existing cash on the balance sheet, and other sources including the proceeds of options exercises. The manner, timing and amount of repurchases, if any, will be determined by our management and will depend on a variety of factors, including price, corporate and regulatory requirements, market conditions and other corporate liquidity requirements. The repurchase program may be modified or discontinued at any time.
Under authorization from our Board of Directors, during the year ended December 31, 2011, we repurchased an aggregate of 778,889 shares of our common stock at a cost of $16.8 million, at an average cost of $21.61 per share. At December 31, 2011, we have remaining authorization to repurchase up to $33.2 million worth of our common stock. No common stock was repurchased during the year ended December 31, 2010. Under a prior authorization from our Board of Directors, we repurchased 350,400 shares of our common stock at an average per share cost of $9.14 during the year ended December 31, 2009.
Dividends on Common Stock. During the years ended December 31, 2011, 2010 and 2009, our Board of Directors declared the following quarterly cash dividends on common stock:
64
Date Declared | Record Date | Date Paid | Amount Paid Per Common Share | |||
Twelve Months Ended December 31, 2011 | ||||||
February 16, 2011 | March 4, 2011 | March 15, 2011 | $0.04 | |||
May 13, 2011 | May 24, 2011 | June 15, 2011 | $0.04 | |||
August 2, 2011 | August 24, 2011 | September 15, 2011 | $0.04 | |||
October 21, 2011 | November 24, 2011 | December 15, 2011 | $0.04 | |||
Twelve Months Ended December 31, 2010 | ||||||
February 18, 2010 | March 5, 2010 | March 15, 2010 | $0.01 | |||
May 4, 2010 | May 25, 2010 | June 15, 2010 | $0.01 | |||
August 3, 2010 | August 25, 2010 | September 15, 2010 | $0.01 | |||
November 2, 2010 | November 23, 2010 | December 15, 2010 | $0.01 | |||
Twelve Months Ended December 31, 2009 | ||||||
February 20, 2009 | March 9, 2009 | March 16, 2009 | $0.025 | |||
May 7, 2009 | May 25, 2009 | June 15, 2009 | $0.01 | |||
August 3, 2009 | August 25, 2009 | September 15, 2009 | $0.01 | |||
November 3, 2009 | November 23, 2009 | December 15, 2009 | $0.01 | |||
On February 8, 2012, our Board of Directors declared a quarterly cash dividend of $0.06 per share of common stock, payable on March 15, 2012 to stockholders of record as of March 2, 2012.
Contractual Obligations. The card brand networks generally allow chargebacks up to four months after the later of the date the transaction is processed or the delivery of the product or service to the cardholder. If the merchant incurring the chargeback is unable to fund the refund to the card issuing bank, we must do so. As the majority of our SME transactions involve the delivery of the product or service at the time of the transaction, a good basis to estimate our exposure to chargebacks is the last four months' bankcard processing volume on our SME portfolio, which was 22.3 billion for the four months ended December 31, 2011 and $21.7 billion for the four months ended December 31, 2010. However, during the four months ended December 31, 2011 and December 31, 2010, we were presented with $12.2 million and $10.1 million, respectively, of chargebacks by issuing banks. In 2011, 2010 and 2009, we incurred merchant credit losses of $5.1 million, $9.1 million and $5.9 million, respectively, on total SME bankcard dollar volumes processed of $67.5 billion, $63.1 billion and $59.0 billion respectively. These credit losses are included in processing and servicing expense in our Consolidated Statement of Operations.
During the fourth quarter of 2010, we converted Network Services' settled transactions from a third party processor and began settling Network Services Merchant accounts, and processing chargebacks originating from these merchants, on Passport. Prior to this, these chargebacks were processed and carried by the third-party processor. Chargeback losses originating from Network Services' bankcard processing on Passport during 2011 were $17,000.
The following table reflects our significant contractual obligations as of December 31, 2011:
Payments Due by Period | |||||||||||||||||||
Contractual Obligations | Total | Less than 1 year | 1 to 3 years | 3 to 5 years | More than 5 years | ||||||||||||||
(in thousands) | |||||||||||||||||||
Processing providers (a) | $ | 25,623 | $ | 8,951 | $ | 11,629 | $ | 5,043 | $ | — | |||||||||
Telecommunications providers | 4,078 | 3,766 | 312 | — | — | ||||||||||||||
Office and equipment leases | 26,611 | 7,886 | 10,114 | 4,055 | 4,556 | ||||||||||||||
Term Credit Facility (b) | 85,000 | 15,000 | 40,000 | 30,000 | — | ||||||||||||||
$ | 141,312 | $ | 35,603 | $ | 62,055 | $ | 39,098 | $ | 4,556 | ||||||||||
(a) | We have agreements with several third-party processors to provide to us on a non-exclusive basis payment processing and transmittal, transaction authorization and data capture services, and access to various reporting tools. Our agreements with third-party processors require us to submit a minimum monthly number of transactions or volume for processing. If we submit a number of transactions or volume that is lower than the minimum, we are required to pay the third-party processors the fees that they would have received if we had submitted the required minimum number or volume of transactions. |
(b) | Interest rates on the Term Credit Facility are variable in nature; however, in January 2011 we entered into fixed-pay amortizing interest rate swaps having a remaining notional amount at December 31, 2011 of $42.5 million. If interest rates were to remain at the December 31, 2011 level, we would make interest payments of $2.6 million in the next year, $3.4 million in the next 1 to 3 years and $0.5 million in the next 3 to 5 years or a total of $6.4 million including net settlements on the fixed-pay amortizing interest rate swaps. |
65
Unrecognized Tax Benefits. At December 31, 2011, we had gross tax-effected unrecognized tax benefits of approximately $1.8 million. See “— Critical Accounting Estimates — Income Taxes.” As of December 31, 2011 we are unable to make reasonably reliable estimates of the period of cash settlement with the respective taxing authority, hence the unrecognized tax benefits have been excluded from the above commitment and contractual obligations table.
Off-Balance Sheet Arrangements
We have not entered into any transactions with third parties or unconsolidated entities whereby we have financial guarantees, subordinated retained interest, derivative instruments, or other contingent arrangements that expose us to material continuing risks, contingent liabilities, or other obligations other than for chargebacks and reject losses described under “— Critical Accounting Estimates.”
Legal and Regulatory Considerations
Processing System Intrusion Legal Proceedings
To date, we have had several lawsuits filed against us and additional lawsuits may be filed. These include lawsuits which assert claims against us by cardholders (including various putative class actions seeking in the aggregate to represent all cardholders in the United States whose transaction information is alleged to have been placed at risk in the course of the Processing System Intrusion) and banks that issued payment cards to cardholders whose transaction information is alleged to have been placed at risk in the course of the Processing System Intrusion (including various putative class actions seeking to represent all financial institutions that issued payment cards to cardholders whose transaction information is alleged to have been placed at risk in the course of the Processing System Intrusion), seeking damages allegedly arising out of the Processing System Intrusion and other related relief. The actions generally assert various common-law claims such as claims for negligence and breach of contract, as well as, in some cases, statutory claims such as violation of the Fair Credit Reporting Act, state data breach notification statutes, and state unfair and deceptive practices statutes. The putative cardholder class actions seek various forms of relief including damages, injunctive relief, multiple or punitive damages, attorneys' fees and costs. The putative financial institution class actions seek compensatory damages, including recovery of the cost of issuance of replacement cards and losses by reason of unauthorized transactions, as well as injunctive relief, attorneys' fees and costs.
On June 10, 2009, the Judicial Panel on Multidistrict Litigation (the “JPML”) entered an order centralizing the class action cases for pre-trial proceedings before the United States District Court for the Southern District of Texas, under the caption In re Heartland Payment Systems, Inc. Customer Data Security Breach Litigation, MDL No. 2046, 4:09-md-2046. On August 24, 2009, the court appointed interim co-lead and liaison counsel for the financial institution and consumer plaintiffs. On September 23, 2009, the financial institution plaintiffs filed a Master Complaint in the MDL proceedings, which we moved to dismiss on October 23, 2009. Briefing on that motion to dismiss concluded on February 1, 2010 and the motion remains pending. On December 18, 2009, we and interim counsel for the consumer plaintiffs filed with the Court a proposed settlement agreement, subject to court approval, of the consumer class action claims. On May 3, 2010, the Court entered an order preliminarily certifying the settlement class, authorizing notice to the class to proceed, and scheduling a fairness hearing for December 10, 2010, which was later adjourned to December 13, 2010. We and interim consumer plaintiffs' counsel provided additional information requested by the Court following the hearing, and the Court has taken the proposed settlement under advisement. The putative consumer class actions and putative financial institution class actions filed against us and pending through February 24 2012 are described in “Legal Proceedings —Processing System Intrusion Legal Proceedings.”
Other actions have been filed against us seeking damages allegedly arising out of the Processing System Intrusion and other related relief on an individual basis. On December 28, 2009, Putnam Bank of Putnam, Connecticut filed a complaint in Connecticut Superior Court, Putnam Bank v. Heartland Payment Systems, Inc., case no. WWM-CV-10-6001208-S. On January 20, 2010, we removed the action to the United States District Court for the District of Connecticut, case no. 3:10-cv-0061 (JBA), and, on January 27, 2010, filed a Notice of Potential Tag-Along Action, requesting centralization of the action with the MDL proceedings. On March 17, 2010, the action was centralized with the MDL proceedings. On February 9, 2010, OmniAmerican Bank filed a complaint in the District Court for Collin County, Texas, Civ. No. 380-00563-2012. The complaint identifies as a party in interest the Federal Insurance Company, which is alleged to have insured plaintiff and reimbursed it for $1,005,077.50, less a $100,000 deductible. On March 15, 2010, we filed an answer to the complaint and removed the action to the United States District Court for the Eastern District of Texas, case no. 4:10-cv-114, and, on March 16, 2010, filed a Notice of Potential Tag-Along Action, requesting centralization of the action with the MDL proceedings. On April 29, 2010, the action was centralized with the MDL proceedings. On February 18, 2010, Quad City Bank and Trust filed a complaint in the District Court for Collin County, Texas, Civ. No. 380-00721-2010. The complaint identifies as a party in interest the Federal Insurance Company, which is alleged to have insured plaintiff and reimbursed it for $432,420.32, less a $100,000 deductible. On March 15, 2010, we filed an answer to the complaint and removed the action to the United States District Court for the Eastern District
66
of Texas, case no. 4:10-cv-115 and, on March 16, 2010, filed a Notice of Potential Tag-Along Action, requesting centralization of the action with the MDL proceedings. On April 29, 2010, the action was centralized with the MDL proceedings. On May 5, 2010, Napus Federal Credit Union filed a complaint in the United States District Court for the Southern District of Texas, case no. 4:10-cv-1616, and the action was consolidated with the MDL proceedings on June 9, 2010.
On January 19, 2010, financial institution plaintiffs, including certain of the named plaintiffs in the MDL proceedings, commenced an action against our sponsor banks in the United States District Court for the Southern District of Texas, captioned Lonestar National Bank, N.A. et al. v. KeyBank NA, et al., Civ. No. 4:10-cv-00171. This action against our sponsor banks asserts common-law claims similar to those asserted against us, and likewise seeks to represent all financial institutions that issued payment cards to cardholders whose transaction information is alleged to have been placed at risk in the course of the Processing System Intrusion. On March 4, 2010, this action was transferred to the judge overseeing the MDL proceedings. On April 9, 2010, our sponsor banks moved to dismiss the complaint. On March 31, 2011, the Court entered an order granting the sponsor banks' motions to dismiss the complaint and invited additional briefing on the effect of the Court's order on our pending motion to dismiss. On May 18, 2011, the plaintiffs filed an amended complaint against KeyBank, NA, which KeyBank, NA moved to dismiss on July 7, 2011. Briefing has concluded and the Court has not yet ruled on the motion. On April 18, 2011, in accordance with its order dismissing the claims against Heartland Bank for lack of personal jurisdiction, the court transferred the action against Heartland Bank to the United States District Court for the Eastern District of Missouri. Heartland Bank filed a notice with the Judicial Panel on Multidistrict Litigation on July 27, 2011 designating the transferred action as a potential tag-along action to the MDL proceedings. The sponsor banks could seek indemnification from us in regard to the claims asserted in this action. On December 1, 2011, the Court entered an order granting in part our motion to dismiss the financial institution plaintiffs' master complaint against us, but allowing the plaintiffs leave to amend to re-plead certain claims. Plaintiffs' amended complaint was due on February 21, 2012, and plaintiffs' counsel have filed a motion seeking an extension to file an amended complaint on April 6, 2012. A status conference with the court currently is set for March, 5, 2012.
We were advised by the United States Attorney for the District of New Jersey that it commenced an investigation to determine whether there have been any violations of the federal securities laws in connection with our disclosure of the Processing Systems Intrusion and the alleged trading in our securities by certain of our employees, including certain executive officers. We cooperated with this inquiry and have received no further communication from the United States Attorney for the District of New Jersey since 2010. In addition, on June 17, 2011, the SEC informed us that its parallel investigation of us and certain of our employees has been completed and it does not intend to recommend any enforcement action.
We were contacted by the Federal Financial Institutions Examination Council and informed that it would make inquiries into the Processing System Intrusion, and the Federal Trade Commission, by letters dated February 19, 2009, August 4, 2009, and March 10, 2010, has requested that we provide information about our payment processing services and information security practices. Additionally, we have received written or telephonic inquiries relating to the Processing System Intrusion from a number of state Attorneys General's offices, including a Civil Investigative Demand from the Louisiana Department of Justice Office of the Attorney General, the Canadian Privacy Commission, and other government officials. We are cooperating with the government officials in response to each of these inquiries. Additional lawsuits may be filed against us relating to the Processing System Intrusion and that additional inquiries from governmental agencies may be received or investigations may be commenced.
Although we intend to defend the lawsuits, investigations and inquiries described above vigorously, we cannot predict the outcome of such lawsuits, investigations and inquiries. Apart from damages claimed in such lawsuits and in other lawsuits relating to the Processing System Intrusion that may be filed, we may be subject to fines or other obligations as a result of the government inquiries and investigations described above and additional governmental inquiries or investigations relating to the Processing System Intrusion that may be commenced.
Since its announcement of the Processing System Intrusion on January 20, 2009 and through December 31, 2011, we have expensed a total of $147.1 million, before reducing those charges by $31.2 million of total insurance recoveries. The majority of the total charges, or approximately $114.7 million, related to settlements of claims. Approximately $32.4 million of the total charges were for legal fees and costs we incurred for investigations, defending various claims and actions, remedial actions and crisis management services. In 2009 and 2010, we had entered into settlements with the bankcard networks for various claims and disputes related to the Processing System Intrusion. See “− Overview - Processing System Intrusion” for a discussion of these settlements.
We do not consider it a reasonable possibility that losses exceeding the amounts already recognized on the matters subject to the settlement agreements will be incurred. With regard to the unsettled claims related to the Processing System
67
Intrusion, we determined material losses in addition to those previously accrued are not considered reasonably possible on any such claim disclosed. We are prepared to vigorously defend ourselves against any unsettled claims relating to the Processing System Intrusion that have been asserted against us and our sponsor banks to date. We feel we have strong defenses to all the claims that have been asserted against us and our sponsor banks relating to the Processing System Intrusion.
Additional costs we expect to incur for legal fees and costs for defending the unsettled claims and actions associated with the Processing System Intrusion will be recognized as incurred. Such costs are not expected to be material to our results of operations, financial condition and cash flow.
Other Legal Proceedings
On December 16, 2008, a putative class action was filed against us in the Superior Court of California, County of San Diego, Ryan McInerney, Hossein Vazir Zand v. Heartland Payment Systems, Inc. The plaintiffs purport to represent a putative class of individuals who allegedly were not reimbursed by us for business expenses and whose compensation was allegedly reduced for their costs of doing business. We entered into a settlement agreement with the plaintiffs to resolve the claims against us and we paid the plaintiffs $4.0 million in full and final satisfaction of the claims.
In the ordinary course of our business, we are party to various legal actions, which we believe are incidental to the operation of our business. We believe that the outcome of the proceedings to which we are currently a party will not have a material adverse effect on our financial position, results of operations or cash flows.
Quantitative and Qualitative Disclosures About Market Risk
Interest Rate Risk. Our primary market risk exposure is to changes in interest rates.
We have interest rate risk related to our payable to our sponsor banks. Within our amount payable to our sponsor banks are balances which KeyBank and Heartland Bank have advanced to our SME merchants for interchange fees. We fund these advances first by applying a portion of our available cash and then by incurring a significant payable to our sponsor banks, bearing interest at the prime rate. At December 31, 2011, our payable to sponsor banks included $45.2 million for funding interchange advances to our SME merchants. This payable is repaid in the beginning of the following month out of fees collected from our merchants. During the quarter ended December 31, 2011 the average daily interest-bearing balance of that payable was approximately $10.0 million. The outstanding balance of our payable to our sponsor banks is directly related to our bankcard processing volume and also will fluctuate depending on the amount of our available cash. A hypothetical 100 basis point change in short-term interest rates applied to our average payable to sponsor banks would result in a change of approximately $100,000 in annual pre-tax income.
We also incur interest rate risk on borrowings under our Second Amended and Restated Credit Agreement. The Second Amended and Restated Credit Agreement provides for a Revolving Credit Facility of $50.0 million and a Term Credit Facility of $100.0 million. At December 31, 2011, there was $85.0 million outstanding under the Term Credit Facility and no borrowings outstanding under the Revolving Credit Facility. The Term Credit Facility requires amortization payments in the amount of $3.75 million for each fiscal quarter during the fiscal years ended December 31, 2011 and 2012, $5.0 million for each fiscal quarter during the fiscal years ended December 31, 2013 and 2014, and $7.5 million for each fiscal quarter during the period commencing on January 1, 2015 through the maturity date on November 24, 2015. Under the terms of the Credit Agreement, we may borrow, at our option, at interest rates equal to one, two, three or six month adjusted LIBOR rates, or equal to the greater of the prime rate, the federal funds rate plus 0.50% and the adjusted LIBOR rate plus 1%, in each case plus a margin determined by our current leverage ratio. In January 2011, we entered into fixed-pay amortizing interest rate swaps having an initial notional amount of $50 million on the variable rate debt outstanding under the Term Credit Facility. These interest rate swaps convert that initial notional amount to fixed rate. At December 31, 2011, the remaining notional amount of these interest rate swaps was $42.5 million. The impact which a hypothetical 100 basis point increase in short-term interest rates would have on our outstanding December 31, 2011 balances under the Second Amended and Restated Credit Agreement would be a decline of approximately $425,000 in annual pre-tax income, including the effect from interest rate swaps.
While the bulk of our cash and cash-equivalents are held in checking accounts or money market funds, we do hold certain fixed-income investments with maturities within three years. At December 31, 2011, a hypothetical 100 basis point increase in short-term interest rates would result in an increase of approximately $53,000 in annual pre-tax income from money market fund holdings, but a decrease in the value of fixed-rate investments of approximately $32,000. A hypothetical 100 basis point decrease in short-term interest rates would result in a decrease of approximately $53,000 in annual pre-tax income from money market funds, but an increase in the value of fixed-rate instruments of approximately $32,000.
68
Foreign Currency Risk. While substantially all of our business is conducted in U.S. dollars, our 70% owned Canadian processing subsidiary, CPOS, conducts its operations in Canadian dollars. Consequently, a portion of CPOS' revenues and expenses may be affected by fluctuations in foreign currency exchange rates. We are also affected by fluctuations in exchange rates on assets and liabilities related to our CPOS subsidiary. We have not hedged our translation risk on foreign currency exposure. For the year ended December 31, 2011, foreign currency exposures had an immaterial impact on our revenues and our net income. For 2011, fluctuations in exchange rates on CPOS' assets and liabilities increased our total other comprehensive loss and noncontrolling interests by $0.2 million.
We do not hold or engage in the trading of foreign exchange instruments.
Recent Accounting Pronouncements
In October 2009, the FASB issued an accounting standard update on multiple deliverable revenue arrangements to establish the accounting for certain revenue arrangements in which the vendor or service provider will perform multiple revenue generating activities (e.g., contracts that require an up-front fee along with fees that recur over the life of the arrangement). Specifically, the update addresses how to separate deliverables and how to measure and allocate arrangement consideration to one or more units of accounting. This update is effective for revenue arrangements entered into or materially altered after January 1, 2011. The implementation of this update did not have a material effect on the Company's consolidated financial statements.
In December 2010, the FASB issued an accounting standard update on when to perform Step 2 of the goodwill impairment test for reporting units with zero or negative carrying amounts. Step 1 requires reporting entities to identify any potential impairments, on either an annual or interim basis, by comparing the estimated fair value of a reporting unit to its carrying value. If the estimated fair value is less than the carrying value and, it is more likely than not that an impairment exists, then the amount of the impairment will be assessed in the updated guidance in Step 2. Evaluating an impairment in Step 2 requires the evaluation of qualitative factors including the factors presented in existing guidance that trigger an interim impairment test of goodwill such as an adverse change in the business climate, unanticipated competition, or the expectation that a reporting unit will be sold or disposed. This update is effective for annual reporting periods beginning after December 15, 2010. The implementation of this update did not have a material effect on the Company's consolidated financial statements.
In May 2011, the FASB issued an accounting standard update which addresses changes to concepts regarding performing fair value measurements including: (i) the application of the highest and best use and valuation premise; (ii) the valuation of an instrument classified in the reporting entity's shareholder equity; (iii) the valuation of financial instruments that are managed within a portfolio; and (iv) the application of premiums and discounts. This update also enhances disclosure requirements about fair value measurements, including providing information regarding Level 3 measurements such as quantitative information about unobservable inputs, further discussion of the valuation processes used and assumption sensitivity analysis. The update is effective for interim and annual periods beginning after December 15, 2011. The implementation of this update did not have a material effect on the Company's consolidated financial statements.
In June 2011, the FASB issued an accounting standard update which amends the comprehensive income topic of the current codification. The update eliminates the option to present the components of other comprehensive income as part of the statement of changes in equity, and instead requires consecutive presentation of the statement of net income and other comprehensive income either in a continuous statement of comprehensive income or in two separate but consecutive statements. The update is effective for interim and annual periods beginning after December 15, 2011. The implementation of this update did not have a material effect on the Company's consolidated financial statements.
In September 2011, the FASB issued an accounting standard update on testing goodwill for impairment. This guidance provides an entity the option to first perform a qualitative assessment to determine whether it is more likely than not that the fair value of a reporting unit is less than its carrying amount. If an entity determines that this is the case, it is required to perform the currently prescribed two-step goodwill impairment test to identify potential goodwill impairment and measure the amount of goodwill impairment loss to be recognized for that reporting unit (if any). If an entity determines that the fair value of a reporting unit is more than its carrying amount, the two-step goodwill impairment test is not required. The amendments are effective for annual and interim goodwill impairment tests performed for fiscal years beginning after December 15, 2011 (early adoption is permitted). The Company has early adopted the update and the implementation of this update did not have a material effect on the Company's consolidated financial statements.
69
ITEM 7A. QUANTITATIVE AND QUALITATIVE DISCLOSURES ABOUT MARKET RISK
See “Management's Discussion and Analysis of Financial Condition and Results of Operations—Quantitative and Qualitative Disclosures About Market Risk.”
ITEM 8. FINANCIAL STATEMENTS AND SUPPLEMENTARY DATA
Index to Consolidated Financial Statements
Heartland Payment Systems, Inc. and Subsidiaries: | Page | ||
70
REPORT OF INDEPENDENT REGISTERED PUBLIC ACCOUNTING FIRM
To the Board of Directors and Stockholders of
Heartland Payment Systems, Inc.
We have audited the accompanying consolidated balance sheets of Heartland Payment Systems, Inc. and subsidiaries (the "Company") as of December 31, 2011 and 2010, and the related consolidated statements of operations and comprehensive income (loss), stockholders' equity, and cash flows for each of the three years in the period ended December 31, 2011. These financial statements are the responsibility of the Company's management. Our responsibility is to express an opinion on the financial statements based on our audits.
We conducted our audits in accordance with the standards of the Public Company Accounting Oversight Board (United States). Those standards require that we plan and perform the audit to obtain reasonable assurance about whether the financial statements are free of material misstatement. An audit includes examining, on a test basis, evidence supporting the amounts and disclosures in the financial statements. An audit also includes assessing the accounting principles used and significant estimates made by management, as well as evaluating the overall financial statement presentation. We believe that our audits provide a reasonable basis for our opinion.
In our opinion, such consolidated financial statements present fairly, in all material respects, the financial position of Heartland Payment Systems, Inc. and subsidiaries as of December 31, 2011 and 2010, and the results of their operations and their cash flows for each of the three years in the period ended December 31, 2011, in conformity with accounting principles generally accepted in the United States of America.
We have also audited, in accordance with the standards of the Public Company Accounting Oversight Board (United States), the Company's internal control over financial reporting as of December 31, 2011, based on the criteria established in Internal Control-Integrated Framework issued by the Committee of Sponsoring Organizations of the Treadway Commission and our report dated February 28, 2012 expressed an unqualified opinion on the Company's internal control over financial reporting.
/s/ Deloitte & Touche LLP
Philadelphia, Pennsylvania
February 28, 2012
71
REPORT OF INDEPENDENT REGISTERED PUBLIC ACCOUNTING FIRM
To the Board of Directors and Stockholders of
Heartland Payment Systems, Inc.
We have audited the internal control over financial reporting of Heartland Payment Systems, Inc. and subsidiaries (the "Company") as of December 31, 2011, based on criteria established in Internal Control - Integrated Framework issued by the Committee of Sponsoring Organizations of the Treadway Commission. The Company's management is responsible for maintaining effective internal control over financial reporting and for its assessment of the effectiveness of internal control over financial reporting, included in the accompanying Management Annual Report on Internal Control over Financial Reporting. Our responsibility is to express an opinion on the Company's internal control over financial reporting based on our audit.
We conducted our audit in accordance with the standards of the Public Company Accounting Oversight Board (United States). Those standards require that we plan and perform the audit to obtain reasonable assurance about whether effective internal control over financial reporting was maintained in all material respects. Our audit included obtaining an understanding of internal control over financial reporting, assessing the risk that a material weakness exists, testing and evaluating the design and operating effectiveness of internal control based on the assessed risk, and performing such other procedures as we considered necessary in the circumstances. We believe that our audit provides a reasonable basis for our opinion.
A company's internal control over financial reporting is a process designed by, or under the supervision of, the company's principal executive and principal financial officers, or persons performing similar functions, and effected by the company's board of directors, management, and other personnel to provide reasonable assurance regarding the reliability of financial reporting and the preparation of financial statements for external purposes in accordance with generally accepted accounting principles. A company's internal control over financial reporting includes those policies and procedures that (1) pertain to the maintenance of records that, in reasonable detail, accurately and fairly reflect the transactions and dispositions of the assets of the company; (2) provide reasonable assurance that transactions are recorded as necessary to permit preparation of financial statements in accordance with generally accepted accounting principles, and that receipts and expenditures of the company are being made only in accordance with authorizations of management and directors of the company; and (3) provide reasonable assurance regarding prevention or timely detection of unauthorized acquisition, use, or disposition of the company's assets that could have a material effect on the financial statements.
Because of the inherent limitations of internal control over financial reporting, including the possibility of collusion or improper management override of controls, material misstatements due to error or fraud may not be prevented or detected on a timely basis. Also, projections of any evaluation of the effectiveness of the internal control over financial reporting to future periods are subject to the risk that the controls may become inadequate because of changes in conditions, or that the degree of compliance with the policies or procedures may deteriorate.
In our opinion, the Company maintained, in all material respects, effective internal control over financial reporting as of December 31, 2011, based on the criteria established in Internal Control - Integrated Framework issued by the Committee of Sponsoring Organizations of the Treadway Commission. We have also audited, in accordance with the standards of the Public Company Accounting Oversight Board (United States), the consolidated financial statements as of and for the year ended December 31, 2011 of the Company and our report dated February 28, 2012 expressed an unqualified opinion on those financial statements.
/s/ Deloitte & Touche LLP
Philadelphia, Pennsylvania
February 28, 2012
72
Heartland Payment Systems, Inc. and Subsidiaries
Consolidated Balance Sheets
(In thousands, except share data)
December 31, | |||||||
Assets | 2011 | 2010 | |||||
Current assets: | |||||||
Cash and cash equivalents | $ | 40,301 | $ | 41,729 | |||
Funds held for payroll customers | 42,511 | 36,523 | |||||
Receivables, net | 176,535 | 175,530 | |||||
Investments held to maturity | 2,505 | 1,516 | |||||
Inventory | 11,492 | 11,058 | |||||
Prepaid expenses | 9,660 | 7,721 | |||||
Current tax asset | — | 18,652 | |||||
Current deferred tax assets, net | 6,746 | 7,250 | |||||
Total current assets | 289,750 | 299,979 | |||||
Capitalized customer acquisition costs, net | 55,014 | 59,251 | |||||
Property and equipment, net | 115,579 | 102,248 | |||||
Goodwill | 103,399 | 68,319 | |||||
Intangible assets, net | 32,498 | 31,160 | |||||
Deposits and other assets, net | 681 | 507 | |||||
Total assets | $ | 596,921 | $ | 561,464 | |||
Liabilities and Equity | |||||||
Current liabilities: | |||||||
Due to sponsor banks | $ | 63,881 | $ | 72,573 | |||
Accounts payable | 47,373 | 42,126 | |||||
Deposits held for payroll customers | 42,511 | 36,523 | |||||
Current portion of borrowings | 15,003 | 38,286 | |||||
Current portion of accrued buyout liability | 8,104 | 5,560 | |||||
Processing liabilities and loss reserves | 30,689 | 28,740 | |||||
Accrued expenses and other liabilities | 50,884 | 28,789 | |||||
Current tax liability | 1,408 | — | |||||
Total current liabilities | 259,853 | 252,597 | |||||
Deferred tax liabilities, net | 21,643 | 21,714 | |||||
Reserve for unrecognized tax benefits | 1,819 | 1,309 | |||||
Long-term portion of borrowings | 70,000 | 85,000 | |||||
Long-term portion of accrued buyout liability | 23,554 | 23,250 | |||||
Total liabilities | 376,869 | 383,870 | |||||
Commitments and contingencies (Note 18) | — | — | |||||
Equity | |||||||
Common stock, $0.001 par value, 100,000,000 shares authorized, 38,847,957 and 38,415,199 shares issued and outstanding at December 31, 2011 and December 31, 2010 | 39 | 38 | |||||
Additional paid-in capital | 207,643 | 185,689 | |||||
Accumulated other comprehensive (loss) income | (680 | ) | 37 | ||||
Retained earnings (Accumulated deficit) | 29,236 | (8,471 | ) | ||||
Treasury stock, at cost (778,889 shares at December 31, 2011) | (16,828 | ) | — | ||||
Total stockholders’ equity | 219,410 | 177,293 | |||||
Noncontrolling interests | 642 | 301 | |||||
Total equity | 220,052 | 177,594 | |||||
Total liabilities and equity | $ | 596,921 | $ | 561,464 | |||
See accompanying notes to consolidated financial statements.
73
Heartland Payment Systems, Inc. and Subsidiaries
Consolidated Statements of Operations and Comprehensive Income (Loss)
(In thousands, except per share data)
Year Ended December 31, | |||||||||||
2011 | 2010 | 2009 | |||||||||
Total revenues | $ | 1,996,950 | $ | 1,864,337 | $ | 1,652,139 | |||||
Costs of services: | |||||||||||
Interchange | 1,359,448 | 1,299,631 | 1,142,112 | ||||||||
Dues, assessments and fees | 155,233 | 119,834 | 89,844 | ||||||||
Processing and servicing | 212,747 | 228,953 | 199,934 | ||||||||
Customer acquisition costs | 46,140 | 50,415 | 50,362 | ||||||||
Depreciation and amortization | 14,675 | 15,201 | 15,786 | ||||||||
Total costs of services | 1,788,243 | 1,714,034 | 1,498,038 | ||||||||
General and administrative | 130,724 | 104,088 | 104,154 | ||||||||
Total expenses | 1,918,967 | 1,818,122 | 1,602,192 | ||||||||
Income from operations | 77,983 | 46,215 | 49,947 | ||||||||
Other income (expense): | |||||||||||
Interest income | 177 | 148 | 117 | ||||||||
Interest expense | (4,125 | ) | (4,778 | ) | (2,698 | ) | |||||
(Provision for) recovery of processing system intrusion costs | (1,012 | ) | 14,138 | (128,943 | ) | ||||||
Gain (loss) on investments | — | 25 | (31 | ) | |||||||
Other, net | (1,550 | ) | 47 | (41 | ) | ||||||
Total other (expense) income | (6,510 | ) | 9,580 | (131,596 | ) | ||||||
Income (loss) before income taxes | 71,473 | 55,795 | (81,649 | ) | |||||||
Provision for (benefit from) income taxes | 27,126 | 21,135 | (29,919 | ) | |||||||
Net income (loss) | 44,347 | 34,660 | (51,730 | ) | |||||||
Less: Net income attributable to noncontrolling interests | 408 | 123 | 66 | ||||||||
Net income (loss) attributable to Heartland | $ | 43,939 | $ | 34,537 | $ | (51,796 | ) | ||||
Net income (loss) | $ | 44,347 | $ | 34,660 | $ | (51,730 | ) | ||||
Other comprehensive income (loss): | |||||||||||
Unrealized (losses) gains on investments, net of income tax of ($4), $30 and $54 | (5 | ) | 46 | 90 | |||||||
Unrealized losses on derivative financial instruments, net of income tax of ($341) | (556 | ) | — | — | |||||||
Foreign currency translation adjustment | (223 | ) | 501 | 1,509 | |||||||
Comprehensive income (loss) | 43,563 | 35,207 | (50,131 | ) | |||||||
Less: Comprehensive income attributable to noncontrolling interests | 341 | 87 | 66 | ||||||||
Comprehensive income (loss) attributable to Heartland | $ | 43,222 | $ | 35,120 | $ | (50,197 | ) | ||||
Earnings (loss) per common share: | |||||||||||
Basic | $ | 1.13 | $ | 0.91 | $ | (1.38 | ) | ||||
Diluted | $ | 1.09 | $ | 0.88 | $ | (1.38 | ) | ||||
Weighted average number of common shares outstanding: | |||||||||||
Basic | 38,931 | 37,994 | 37,483 | ||||||||
Diluted | 40,233 | 39,310 | 38,028 | ||||||||
See accompanying notes to consolidated financial statements.
74
Heartland Payment Systems, Inc. and Subsidiaries
Consolidated Statements of Equity
(In thousands)
Heartland Stockholders’ Equity | ||||||||||||||||||||||||||||||
Common Stock | Additional Paid-In Capital | Accumulated Other Comprehensive Income (Loss) | Retained Earnings(Accumulated Deficit) | Treasury Stock | Noncontrolling Minority Interests | Total Equity | ||||||||||||||||||||||||
Shares | Amount | |||||||||||||||||||||||||||||
Balance, January 1, 2009 | 37,676 | $ | 38 | $ | 167,337 | $ | (2,145 | ) | $ | 14,014 | — | $ | 119 | $ | 179,363 | |||||||||||||||
Issuance of common stock -options exercised | 198 | — | 1,045 | — | — | — | — | $ | 1,045 | |||||||||||||||||||||
Excess tax benefit on stock options exercised | — | — | 384 | — | — | — | — | $ | 384 | |||||||||||||||||||||
Repurchase of common stock | (350 | ) | — | — | — | — | (3,202 | ) | — | $ | (3,202 | ) | ||||||||||||||||||
Retirement of treasury stock | — | — | (1,556 | ) | — | (1,646 | ) | 3,202 | — | $ | — | |||||||||||||||||||
Stock-based compensation | — | — | 4,526 | — | — | — | — | $ | 4,526 | |||||||||||||||||||||
Accumulated other comprehensive income (loss): | ||||||||||||||||||||||||||||||
Unrealized gains on available for sale investments | — | — | — | 90 | — | — | — | $ | 90 | |||||||||||||||||||||
Foreign currency translation adjustment | — | — | — | 1,509 | — | — | 29 | $ | 1,538 | |||||||||||||||||||||
Dividends on common stock | — | — | — | — | (2,059 | ) | — | — | $ | (2,059 | ) | |||||||||||||||||||
Net income (loss) for the year | — | — | — | — | (51,796 | ) | — | 66 | $ | (51,730 | ) | |||||||||||||||||||
Balance, December 31, 2009 | 37,524 | $ | 38 | $ | 171,736 | $ | (546 | ) | $ | (41,487 | ) | $ | — | $ | 214 | $ | 129,955 | |||||||||||||
Issuance of common stock– options exercised | 835 | — | 6,303 | — | — | — | — | 6,303 | ||||||||||||||||||||||
Issuance of common stock – RSU's invested | 56 | — | (555 | ) | — | — | — | — | (555 | ) | ||||||||||||||||||||
Excess tax benefit on stock options exercised | — | — | 1,910 | — | — | — | — | 1,910 | ||||||||||||||||||||||
Stock-based compensation | — | — | 6,295 | — | — | — | — | 6,295 | ||||||||||||||||||||||
Accumulated other comprehensive income (loss): | ||||||||||||||||||||||||||||||
Unrealized gains on available for sale investments | — | — | — | 46 | — | — | — | 46 | ||||||||||||||||||||||
Foreign currency translation adjustment | — | — | — | 537 | — | — | (36 | ) | 501 | |||||||||||||||||||||
Dividends on common stock | — | — | — | — | (1,521 | ) | — | — | (1,521 | ) | ||||||||||||||||||||
Net income for the year | — | — | — | — | 34,537 | — | 123 | 34,660 | ||||||||||||||||||||||
Balance, December 31, 2010 | 38,415 | $ | 38 | $ | 185,689 | $ | 37 | $ | (8,471 | ) | $ | — | $ | 301 | $ | 177,594 | ||||||||||||||
Issuance of common stock – options exercised | 1,134 | 1 | 9,684 | — | — | — | — | 9,685 | ||||||||||||||||||||||
Issuance of common stock – RSU's vested | 78 | — | (732 | ) | — | — | — | — | (732 | ) | ||||||||||||||||||||
Excess tax benefit on stock options exercised | — | — | 3,454 | — | — | — | — | 3,454 | ||||||||||||||||||||||
Repurchase of common stock | (779 | ) | — | — | — | — | (16,828 | ) | — | (16,828 | ) | |||||||||||||||||||
Stock-based compensation | — | — | 9,548 | — | — | — | — | 9,548 | ||||||||||||||||||||||
Accumulated other comprehensive income (loss): | ||||||||||||||||||||||||||||||
Unrealized losses on available for sale investments | — | — | — | (5 | ) | — | — | — | (5 | ) | ||||||||||||||||||||
Unrealized losses on derivative financial instruments | — | — | — | (556 | ) | — | — | — | (556 | ) | ||||||||||||||||||||
Foreign currency translation adjustment | — | — | — | (156 | ) | — | — | (67 | ) | (223 | ) | |||||||||||||||||||
Dividends on common stock | — | — | — | — | (6,232 | ) | — | — | (6,232 | ) | ||||||||||||||||||||
Net income for the year | — | — | — | — | 43,939 | — | 408 | 44,347 | ||||||||||||||||||||||
Balance, December 31, 2011 | 38,848 | $ | 39 | $ | 207,643 | $ | (680 | ) | $ | 29,236 | $ | (16,828 | ) | $ | 642 | $ | 220,052 | |||||||||||||
See accompanying notes to consolidated financial statements.
75
Heartland Payment Systems, Inc. and Subsidiaries
Consolidated Statements of Cash Flow
(In thousands)
Year Ended December 31, | |||||||||||
2011 | 2010 | 2009 | |||||||||
Cash flows from operating activities | |||||||||||
Net income (loss) attributable to Heartland | $ | 43,939 | $ | 34,537 | $ | (51,796 | ) | ||||
Adjustments to reconcile net income to net cash provided by operating activities: | |||||||||||
Amortization of capitalized customer acquisition costs | 47,188 | 53,997 | 56,838 | ||||||||
Other depreciation and amortization | 27,837 | 26,020 | 21,870 | ||||||||
Addition to loss reserves | 6,011 | 9,985 | 6,272 | ||||||||
Provision for doubtful receivables | 2,423 | 1,329 | 690 | ||||||||
Deferred taxes | 778 | 35,730 | (21,537 | ) | |||||||
Stock-based compensation | 9,548 | 6,295 | 4,526 | ||||||||
Net income attributable to noncontrolling interests | 408 | 123 | 66 | ||||||||
(Gain) Loss on investment | — | (25 | ) | 31 | |||||||
Write downs on intangible assets, purchased software, fixed assets and system development | 129 | 1,014 | 241 | ||||||||
Other | 1,915 | 509 | 16 | ||||||||
Changes in operating assets and liabilities: | |||||||||||
Increase in receivables | (1,409 | ) | (27,084 | ) | (9,890 | ) | |||||
(Increase) decrease in inventory | (194 | ) | 1,331 | (3,979 | ) | ||||||
Payment of signing bonuses, net | (29,035 | ) | (26,495 | ) | (34,690 | ) | |||||
Increase in capitalized customer acquisition costs | (14,276 | ) | (14,715 | ) | (16,449 | ) | |||||
(Increase) decrease in prepaid expenses | (1,677 | ) | 1,162 | (2,192 | ) | ||||||
Decrease (increase) in current tax assets | 23,522 | (481 | ) | (13,463 | ) | ||||||
(Increase) decrease in deposits and other assets | (65 | ) | 1,118 | (1,177 | ) | ||||||
Excess tax benefits on options exercised | (3,454 | ) | (1,910 | ) | (384 | ) | |||||
Increase (decrease) in reserve for unrecognized tax benefits | 510 | (82 | ) | (341 | ) | ||||||
(Decrease) increase in due to sponsor banks | (8,692 | ) | (7,433 | ) | 11,795 | ||||||
Increase in accounts payable | 3,779 | 8,368 | 4,999 | ||||||||
(Decrease) increase in accrued expenses and other liabilities | (755 | ) | (4,808 | ) | 4,266 | ||||||
(Decrease) increase in processing liabilities and loss reserves | (4,104 | ) | (8,459 | ) | 4,069 | ||||||
(Decrease) increase in reserve for processing system intrusion | (8 | ) | (98,294 | ) | 99,911 | ||||||
Payouts of accrued buyout liability | (10,380 | ) | (25,209 | ) | (8,127 | ) | |||||
Increase in accrued buyout liability | 13,228 | 11,133 | 9,973 | ||||||||
Net cash provided by (used in) operating activities | 107,166 | (22,344 | ) | 61,538 | |||||||
Cash flows from investing activities | |||||||||||
Purchase of investments held to maturity | (3,781 | ) | (1,452 | ) | (1,224 | ) | |||||
Maturities of investments held to maturity | 2,934 | 1,397 | 1,207 | ||||||||
Proceeds from sale of available for sale investments | — | 161 | — | ||||||||
Increase in funds held for payroll customers | (6,163 | ) | (6,916 | ) | (7,549 | ) | |||||
Increase in deposits held for payroll customers | 5,988 | 6,856 | 7,665 | ||||||||
Acquisition of businesses, net of cash acquired | (23,165 | ) | (7,904 | ) | (3,237 | ) | |||||
Purchases of property and equipment | (36,543 | ) | (23,279 | ) | (41,622 | ) | |||||
Proceeds from disposal of property and equipment | — | — | 33 | ||||||||
Net cash used in investing activities | (60,730 | ) | (31,137 | ) | (44,727 | ) | |||||
Cash flows from financing activities | |||||||||||
Proceeds from borrowings | — | 176,200 | — | ||||||||
Principal payments on borrowings | (38,287 | ) | (119,880 | ) | (8,540 | ) | |||||
Proceeds from exercise of stock options | 9,685 | 6,303 | 1,045 | ||||||||
Excess tax benefits on options exercised | 3,454 | 1,910 | 384 | ||||||||
Repurchases of common stock | (16,414 | ) | — | (3,202 | ) | ||||||
Dividends paid on common stock | (6,232 | ) | (1,521 | ) | (2,059 | ) | |||||
Net cash (used in) provided by financing activities | (47,794 | ) | 63,012 | (12,372 | ) | ||||||
Net (decrease) increase in cash | (1,358 | ) | 9,531 | 4,439 | |||||||
Effect of exchange rates on cash | (70 | ) | 85 | 85 | |||||||
Cash at beginning of year | 41,729 | 32,113 | 27,589 | ||||||||
Cash at end of year | $ | 40,301 | $ | 41,729 | $ | 32,113 | |||||
Supplemental cash flow information: | |||||||||||
Cash paid (received) during the period for: | |||||||||||
Interest | $ | 3,783 | $ | 4,495 | $ | 2,669 | |||||
Income taxes | 2,349 | (14,042 | ) | 5,631 | |||||||
See accompanying notes to consolidated financial statements.
76
Heartland Payment Systems, Inc. and Subsidiaries
Notes To Consolidated Financial Statements
1. Organization and Operations
Basis of Financial Statement Presentation— The accompanying consolidated financial statements include those of Heartland Payment Systems, Inc. (the “Company,” “we,” “us,” or “our”) and its wholly-owned subsidiaries, Heartland Payroll Company (“HPC”), Debitek, Inc. (“Debitek”) and Heartland Acquisition LLC (“Network Services”), and its 70% owned subsidiary Collective POS Solutions Ltd. (“CPOS”). The consolidated financial statements have been prepared in accordance with accounting principles generally accepted in the United States of America. All intercompany balances and transactions with the Company's subsidiaries have been eliminated upon consolidation. Certain amounts relating to 2010 financial information have been reclassified to conform with the current year presentation.
Business Description—The Company’s principal business is to provide payment processing services related to bankcard transactions for merchants throughout the United States and Canada. In addition, the Company provides certain other merchant services, including check processing, the sale and rental of terminal equipment, gift and loyalty card processing, and the sale of terminal supplies. HPC provides payroll and related tax filing services throughout the United States. Debitek provides prepaid card and stored-value card solutions throughout the United States and Canada. The Company and Debitek also provide campus payment solutions throughout the United States and Canada. CPOS is a Canadian provider of payment processing services and secure point-of-sale solutions. The Company provides Heartland School Solutions in the United States through its acquired school solutions businesses previously operated by Lunchbox, Comalex, mySchoolBucks and School-Link Technologies.
Over 85% of the Company's revenue is derived from processing and settling Visa and MasterCard bankcard transactions for its merchant customers. Because the Company is not a ''member bank'' as defined by Visa and MasterCard, in order to process and settle these bankcard transactions for its merchants, the Company has entered into sponsorship agreements with member banks. Visa and MasterCard rules restrict the Company from performing funds settlement or accessing merchant settlement funds and require that these funds be in the possession of the member bank until the merchant is funded. A sponsorship agreement permits the Company to route Visa and MasterCard bankcard transactions under the member bank's control and identification numbers to clear credit bankcard transactions through Visa and MasterCard. A sponsorship agreement also enables the Company to settle funds between cardholders and merchants by delivering funding files to the member bank, which in turn transfers settlement funds to the merchants' bank accounts. These restrictions place the settlement assets and obligations under the control of the member bank.
The sponsorship agreements with the member banks require, among other things, that the Company abide by the by-laws and regulations of the Visa and MasterCard networks, and certain of the bank sponsors require a certificate of deposit or a cash balance in a deposit account. If the Company breaches a sponsorship agreement, the bank sponsor may terminate the agreement and, under the terms of the agreement, the Company would have 180 days to identify an alternative bank sponsor. The Company is dependent on its bank sponsors, Visa and MasterCard for notification of any compliance breaches. As of December 31, 2011, the Company has not been notified of any such issues by its bank sponsors, Visa or MasterCard.
At December 31, 2011, the Company is currently party to four bank sponsorship agreements. The Company entered into a sponsorship agreement with KeyBank, National Association on April 1, 1999 and on December 22, 2011, the Company entered into amendment agreement that extended the expiration date of that agreement to October 1, 2012. In 2007, the Company entered into a sponsor bank agreement with Heartland Bank, an unrelated third party. The agreement with Heartland Bank has been renewed through September 2013. In November 2009, the Company entered into a sponsorship agreement with The Bancorp Bank to sponsor the Company's large national and mid-tier merchants processed by Network Services. The agreement with The Bancorp Bank expires in November 2014. On March 24, 2011, the Company entered into a sponsor bank agreement with Barclays Bank Delaware to sponsor certain of the Company's large national merchants processed by Network Services. The agreement with Barclays Bank Delaware expires in March 2016 with an automatic one year renewal. On February 8, 2012, the Company entered into a sponsor bank agreement with Wells Fargo Bank, N.A.
Following is a breakout of the Company’s total Visa and MasterCard settled bankcard processing volume for the month ending December 31, 2011 by percentage processed under its individual bank sponsorship agreements:
77
Heartland Payment Systems, Inc. and Subsidiaries
Notes To Consolidated Financial Statements—(Continued)
Sponsor Bank | % of December 2011 Bankcard Processing Volume |
KeyBank, National Association | 65% |
The Bancorp Bank | 14% |
Barclays Bank Delaware | 12% |
Heartland Bank | 9% |
Processing System Intrusion—On January 20, 2009, the Company publicly announced the discovery of a criminal breach of its payment systems environment (the “Processing System Intrusion”). The Processing System Intrusion involved malicious software that appears to have been used to collect in-transit, unencrypted payment card data while it was being processed by the Company during the transaction authorization process. The Company believes the breach did not extend beyond 2008. See Note 3, Processing System Intrusion for further detail and related events.
Working Capital— The Company's working capital, defined as current assets less current liabilities, was positive by $29.9 million at December 31, 2011. Prior to refinancing of its credit facility in November 2010, the Company's net working capital position was negative reflecting (i) its previous revolving credit facility with $75.0 million in borrowings classified as a current liability, and (ii) its $28.0 million Bridge Loan, which was due on February 17, 2011. See Note 11, Credit Facilities for a discussion of the Company's refinancing.
2. Summary of Significant Accounting Policies
Use of Estimates—The preparation of financial statements in conformity with accounting principles generally accepted in the United States of America, requires management to make estimates and assumptions that affect the reported amounts of assets, liabilities, and disclosure of contingent assets and liabilities at the date of the consolidated financial statements, and the reported amounts of revenues and expenses during the reporting period. Estimates include, among other things, the accrued buyout liability, capitalized customer acquisition costs, goodwill, loss reserves, certain accounts payable and accrued expenses and certain tax assets and liabilities as well as the related valuation allowances, if any. Actual results could differ from those estimates.
Cash and Cash Equivalents—At December 31, 2011, cash included approximately $28.0 million of processing-related cash in transit and collateral, compared to approximately $25.6 million of processing-related cash in transit and collateral at December 31, 2010.
Receivables—Receivables are stated net of allowance for doubtful accounts. The Company estimates its allowance based on experience with its merchants, customers, and sales force and its judgment as to the likelihood of their ultimate payment. The Company also considers collection experience and makes estimates regarding collectability based on trends in aging. Historically, the Company has not experienced significant charge offs for its merchant receivables.
The Company's primary receivables are from its bankcard processing merchants. These receivables result from the Company's practice of advancing interchange fees to most of its small and mid-sized merchants (referred to as Small and Midsized Enterprises, or “SME”) during the month and collecting those fees at the beginning of the following month, as well as from transaction fees the Company charges its merchants for processing transactions. The Company does not advance interchange fees to its Network Services Merchants.
Generally, the Company uses cash available for investment to fund these advances to SME merchants; when available cash has been expended, the Company directs its sponsor banks to make these advances, thus generating a payable to the sponsor banks. We pay our sponsor banks the prime rate on these payables. At December 31, 2011, the Company used $40.0 million of its available cash to fund merchant advances and at December 31, 2010, the Company used $29.5 million of its cash to fund merchant advances. The amount due to sponsor banks for funding advances was $45.2 million at December 31, 2011 and $63.2 million at December 31, 2010. The payable to sponsor banks is repaid at the beginning of the following month out of the fees the Company collects from its merchants. Receivables from merchants also include receivables from the sale of point of sale terminal equipment. Unlike the SME merchants, Network Services Merchants are invoiced monthly, on payment terms of 30 days net from date of invoicing.
Receivables also include amounts resulting from the pre-funding of Discover and American Express transactions to our merchants and are due from the related bankcard networks. These amounts are recovered over the following two business
78
Heartland Payment Systems, Inc. and Subsidiaries
Notes To Consolidated Financial Statements—(Continued)
days from the date of processing the transaction.
Receivables also include amounts resulting from the sale, installation, training and repair of payment system hardware and software for prepaid card and stored-value card payment systems and campus payment solutions. These receivables are mostly invoiced on terms of 30 days net from date of invoicing and are typically funded from working capital.
Investments and Funds Held for Payroll Customers—Investments, including those carried on the Consolidated Balance Sheet as Funds Held for Payroll Customers, consist primarily of fixed income bond funds and certificates of deposit. Funds Held for Payroll Customers also include overnight bank deposits. The majority of investments carried in Funds Held for Payroll Customers are available-for-sale and recorded at fair value based on quoted market prices. Certificates of deposit are classified as held to maturity and recorded at cost. In the event of a sale, cost is determined on a specific identification basis. At December 31, 2011, Funds Held for Payroll Customers included cash and cash equivalents of $41.3 million and investments available for sale of $1.2 million.
Inventories—Inventories consist of point-of-sale terminal equipment held for sale to merchants, check processing terminal equipment for sale to merchants, prepaid card and cashless payment systems hardware for sale to end users, resellers and distributors, and campus payments solutions equipment for sale to end users. Inventories are valued at the lower of cost or market price. Cost is arrived at using the first-in, first-out method. Market price is estimated based on current sales of equipment.
Inventories also include purchased data encryption software licenses held for sale to merchants who acquire the Company's End-to-End Encryption Solution (“E3”) for processing bankcard transactions, or purchase the upgraded terminal and point-of-sale devices containing E3.
Capitalized Customer Acquisition Costs, net—Capitalized customer acquisition costs consist of (1) up-front signing bonus payments made to Relationship Managers and sales managers (the Company's sales force) for the establishment of new merchant relationships, and (2) a deferred acquisition cost representing the estimated cost of buying out the commissions of vested sales employees. Capitalized customer acquisition costs represent incremental, direct customer acquisition costs that are recoverable through gross margins associated with merchant contracts. The capitalized customer acquisition costs are amortized using a method which approximates a proportional revenue approach over the initial three-year term of the merchant contract.
The up-front signing bonus is based on the estimated gross margin for the first year of the SME merchant contract. The signing bonus, amount capitalized, and related amortization are adjusted after one year to reflect the actual gross margin generated by the merchant contract during that year. The deferred customer acquisition cost asset is accrued over the first year of merchant processing, consistent with the build-up in the accrued buyout liability, as described below.
Management evaluates the capitalized customer acquisition costs for impairment at each balance sheet date by comparing, on a pooled basis by vintage month of origination, the expected future net cash flows from underlying SME merchant relationships to the carrying amount of the capitalized customer acquisition costs. If the estimated future net cash flows are lower than the recorded carrying amount, indicating an impairment of the value of the capitalized customer acquisition costs, the impairment loss will be charged to operations.
At December 31, 2011, the Company recognized an impairment charge to net signing bonuses related to its decision to discontinue Express Funds, its remote deposit check capture product. The Company believed that no impairment of capitalized customer acquisition costs had occurred as of December 31, 2010.
Property and Equipment—Property and equipment are carried at cost, net of accumulated depreciation. Depreciation for the Company's owned service center building in Jeffersonville, Indiana is computed straight-line over thirty-nine years with depreciation on certain building improvements computed over fifteen years. Depreciation is computed straight-line over periods ranging from three to ten years for furniture and equipment. Leasehold improvements are amortized over the lesser of the economic useful life of the improvement or the term of the lease.
Equipment held under capitalized lease arrangements is included in property and equipment, and the associated liabilities are included in current and long-term borrowings as appropriate. Amortization of equipment under capitalized leases is included in depreciation and amortization expense.
79
Heartland Payment Systems, Inc. and Subsidiaries
Notes To Consolidated Financial Statements—(Continued)
Fully depreciated property and equipment are retained in property and equipment and accumulated depreciation accounts until their disposal or removal from service. When fully depreciated property and equipment is taken out of service, the original cost basis and matching accumulated depreciation amounts are written off.
Rent expense on operating leases is recorded on a straight-line basis over the term of the lease agreement.
The Company capitalizes the cost of computer software developed for internal use and amortizes such costs on a straight-line basis over an estimated useful life of three to five years. The Company capitalizes software development costs. Research and development costs incurred prior to establishing technological feasibility are charged to operations as such costs are incurred. Once technological feasibility is established, costs are capitalized until the software is placed in service.
Long-Lived Assets—The Company evaluates the potential for impairment when changes in circumstances indicate that undiscounted cash flows estimated to be generated by the related assets are less than the carrying amount. In 2011, the Company recognized an pre-tax impairment charge related to long lived assets to its decision to discontinue Express Funds, its remote deposit check capture product. Management believed that no such changes in circumstances or impairment have occurred as of December 31, 2010.
Goodwill— Goodwill represents the excess of acquisition costs over the fair values of net assets acquired in business combinations. The Company has recorded goodwill in connection with it acquisitions, including the recent 2010 and 2011 acquisitions of Lunchbox, Comalex, mySchoolBucks and School-Link. Goodwill is tested for impairment at least annually and between annual tests if an event occurs or changes in circumstances suggest a potential decline in the fair value of the reporting unit. A significant amount of judgment is involved in determining if an indicator or change in circumstances relating to impairment has occurred. Such changes may include, among others: a significant decline in expected future cash flows; a sustained decline in market capitalization; a significant adverse change in legal factors or in the business climate; unanticipated competition; and slower growth rates. The Company performs its annual goodwill impairment testing in the fourth quarter. The Company's evaluation indicated that no impairment exists as of December 31, 2011 or 2010. At December 31, 2011 and 2010, goodwill of $103.4 million and $68.3 million, respectively, was recorded on the Company's Consolidated Balance Sheet. The Company may be required to record goodwill impairment losses in future periods, whether in connection with the Company's next annual impairment testing in the fourth quarter of 2012 or prior to that, if any such indicators constitute a triggering event in other than the quarter in which the annual goodwill impairment test is performed. It is not possible at this time to determine if any such future impairment loss would result or, if it does, whether such charge would be material.
Processing Liabilities and Loss Reserves—The majority of the Company's processing liabilities include funds in transit associated with bankcard and check processing. In addition, the Company maintains merchant deposits to offset potential liabilities from merchant chargeback processing. Disputes between a cardholder and a merchant periodically arise due to the cardholder's dissatisfaction with merchandise quality or the merchant's service, and the disputes may not always be resolved in the merchant's favor. In some of these cases, the transaction is ''charged back'' to the merchant and the purchase price is refunded to the cardholder by the credit card-issuing institution. If the merchant is unable to fund the refund, the Company is liable for the full amount of the transaction. The Company's obligation to stand ready to perform is minimal. The Company maintains a deposit or the pledge of a letter of credit from certain merchants as an offset to potential contingent liabilities that are the responsibility of such merchants. The Company evaluates its ultimate risk and records an estimate of
potential loss for chargebacks related to merchant fraud based upon an assessment of actual historical fraud loss rates compared to recent bankcard processing volume levels. The Company believes that the liability recorded as loss reserves approximates fair value.
Accrued Buyout Liability—The Company's historic focus has been on SME merchants, and it has a sales compensation arrangement in this market that has been essentially unchanged since its inception. Under this approach, Relationship Managers and sales managers are paid residual commissions based on the gross margin generated by monthly SME merchant processing activity. The Company has the right, but is not obligated, to buy out some or all of these commissions, and intends to do so periodically. Such purchases of the commissions are at a fixed multiple of the last twelve months' commissions. Because of the Company's intent and ability to execute purchases of the residual commissions, and the mutual understanding between the Company and the Relationship Managers and sales managers, the Company has accounted for this deferred compensation arrangement pursuant to the substantive nature of the plan. The Company therefore records the amount that it would have to pay (the ''settlement cost'') to buy out non-servicing related commissions in their entirety from vested Relationship Managers and sales managers, and an accrual, based on their progress towards vesting, for those unvested Relationship Managers and sales managers who are expected to vest in the future. As noted above, as the liability increases
80
Heartland Payment Systems, Inc. and Subsidiaries
Notes To Consolidated Financial Statements—(Continued)
over the first year of a SME merchant contract, the Company also records a related deferred acquisition cost asset for currently vested Relationship Managers and sales managers. The accrued buyout liability associated with unvested Relationship Managers and sales managers are not included in the deferred acquisition cost asset since future services are required in order to vest. Subsequent changes in the settlement cost, due to account attrition, same-store sales growth and changes in gross margin are included in the same income statement caption as customer acquisition cost amortization expense.
The accrued buyout liability is based on the SME merchants under contract at the balance sheet date, the gross margin generated by those merchants over the prior twelve months, and the contractual buyout multiple. The liability related to a new SME merchant is therefore zero when the merchant is installed, and increases over the twelve months following the installation date. The same procedure is applied to unvested commissions over the expected vesting period, but is further adjusted to reflect the Company's estimate that 31% of unvested Relationship Managers and sales managers become vested.
The classification of the accrued buyout liability between current and non-current liabilities on the Consolidated Balance Sheet is based upon the Company's estimate of the amount of the accrued buyout liability that it reasonably expects to pay over the next twelve months. This estimate is developed by calculating the cumulative annual average percentage that total historical buyout payments represent of the accrued buyout liability. That percentage is applied to the period-end accrued buyout liability to determine the current portion.
Revenue—Revenues are mainly comprised of gross processing revenue, payroll processing revenue and equipment- related income. Gross processing revenue primarily consists of discount fees and per-transaction and periodic (primarily monthly) fees from the processing of Visa, MasterCard, American Express and Discover bankcard transactions for merchants. The Company passes through to its customers any changes in interchange or network fees. Gross processing revenue also includes fees for servicing American Express accounts, customer service fees, fees for processing chargebacks, termination fees on terminated contracts, check processing fees, gift and loyalty card fees, K to 12 fees, and other miscellaneous revenue.
Payroll processing revenue includes periodic and annual fees charged by HPC for payroll processing services, and interest earned from investing tax impound funds held for our customers. Revenue is recorded as bankcard and other processing transactions are processed or payroll services are performed.
Equipment-related income includes revenues from the sale, rental and deployment of bankcard and check processing terminals, from the sale of hardware, software and associated services for prepaid card and stored-value card payment systems, and campus payment solutions. Revenues are recorded at the time of shipment, or the provision of service.
Loss Contingencies and Legal Expenses—The Company records a liability for loss contingencies when the liability is probable and the amount is reasonably estimable. Legal fees associated with loss contingencies are recorded when the legal fees are incurred.
The Company records recoveries from its insurance providers when cash is received from the provider.
Other Income (Expense)—Other income (expense) consists of interest income on cash and investments, the interest cost on our borrowings, the gains or losses on the disposal of property and equipment and other non-operating income or expense items.
In 2011, other income (expense) includes:
Ÿ Pre-tax charges of $0.8 million reflecting the costs (primarily staff termination costs and fixed asset write downs) associated with closing of the Company's Johnson City, Tennessee service center.
Ÿ A pre-tax charge of $1.1 million reflecting costs associated with the decision to discontinue Express Funds, the Company's remote deposit capture product, including writedowns of receivables, inventory, customer acquisition costs and fixed assets.
Ÿ A pre-tax charge of $1.0 million for legal fees and costs incurred for defending various claims and actions associated with the Processing System Intrusion. See Note 3, Processing System Intrusion for more detail.
• | Pre-tax income of $0.3 million related to an earnout payment relating to the 2010 sale of SME merchant bankcard processing contracts |
In 2010, other income (expense) includes:
• | A net pre-tax recovery of $14.1 million, or $0.22 per share related to the Provision for Processing System Intrusion. During 2010, the Company recovered from its insurance providers approximately $27.2 million of the |
81
Heartland Payment Systems, Inc. and Subsidiaries
Notes To Consolidated Financial Statements—(Continued)
costs it incurred for the Processing System Intrusion and expensed approximately $13.1 million for accruals, legal fees and costs it incurred for defending various claims and actions. See Note 3, Processing System Intrusion for more detail.
• | A pre-tax gain of $3.1 million from the sale of merchant bankcard processing contracts. |
• | Net pre-tax charges of $1.7 million for legal settlements accrued or received during 2010. These legal settlements were unrelated to the Processing System Intrusion. |
• | A pre-tax charge of $0.8 million for the impairment of an acquisition intangible asset. |
• | Pre-tax charges of $0.5 million reflecting the estimated liability for costs (primarily accrued staff termination costs and fixed asset write downs) associated with the announced closing of our Johnson City, Tennessee service center. |
In 2009, other income (expense) includes the pretax charges of $128.9 million related to the Provision for Processing System Intrusion. See Note 3, Processing System Intrusion for more detail.
Income Taxes—The Company accounts for income taxes by recognizing deferred tax assets and liabilities for the expected future tax consequences of events that have been included in the financial statements or tax returns. Under this method, deferred tax assets and liabilities are determined based on the difference between the financial statements and the tax basis of assets and liabilities using enacted tax rates. The impact on deferred assets and liabilities of a change in tax rates is recognized in the period that the rate change is enacted.
The Company has recorded income tax expense (benefit) at U.S. tax rates on all taxable income (loss), except undistributed earnings of CPOS, its non-U.S. subsidiary. The Company intends to indefinitely reinvest undistributed earnings of CPOS and accordingly, has provided Canadian income tax on those earnings but not U.S. income tax. The amount of undistributed earnings of CPOS for which the Company has not recorded U.S. income tax was approximately $2.2 million. In the event of distribution of those earnings in the form of dividends or otherwise, the Company would be subject to U.S. income taxes subject to an adjustment, if any, for foreign tax credits. Determination of the amount of U.S. income tax liability that would be incurred is not practicable because of the complexities associated with this hypothetical calculation.
Stock–Based Compensation—The Company expenses employee share-based payments under the fair value method. Stock-based compensation cost is measured at the grant date, based on the fair value of the award, and is recognized as expense over the requisite service period.
Additionally, the excess tax benefits are reported as a financing cash inflow rather than a reduction of taxes paid, which is included within operating cash flows. Accordingly, cash provided by operating activities decreased and cash provided by financing activities increased by $3.5 million in 2011, $1.9 million in 2010 and $0.4 million in 2009 related to excess tax benefits from stock-based awards. The excess tax benefits result from employees exercising non-qualified stock options, making disqualifying dispositions of shares acquired through their exercise of incentive stock options and vesting of restricted share units.
Diluted earnings per share for the years ended December 31, 2011, 2010 and 2009 were computed based on the weighted average outstanding common shares plus equivalent shares assuming exercise of stock options and vesting of Restricted Share Units, where dilutive. Due to the net loss in 2009, calculating Diluted Earnings Per Share using diluted weighted average shares would be anti-dilutive for that year. Therefore, weighted average common stock outstanding was used to calculate Diluted Earnings Per Share for 2009.
Derivative Financial Instruments—The Company utilizes derivative instruments to manage interest rate risk on its borrowings under its Second Amended and Restated Credit Agreement. The Company recognizes the fair value of derivative financial instruments in the Consolidated Balance Sheets in investments, or accrued expenses and other liabilities. Changes in fair value of derivative instruments are recognized immediately in earnings unless the derivative is designated and qualifies as a hedge of future cash flows. For derivatives that qualify as hedges of future cash flows, the effective portion of changes in fair value is recorded in other comprehensive income and reclassified into interest expense in the same periods during which the hedged item affects earnings. Any ineffectiveness of cash flow hedges would be recognized in other income (expense) in the Consolidated Statements of Income during the period of change.
In January 2011, the Company entered into fixed-pay amortizing interest rate swaps having an initial notional amount of $50.0 million as a hedge of future cash flows on the variable rate debt outstanding under its Term Credit Facility. These
82
Heartland Payment Systems, Inc. and Subsidiaries
Notes To Consolidated Financial Statements—(Continued)
interest rate swaps convert the related notional amount of variable rate debt to fixed rate. At December 31, 2011, the remaining notional amount of these interest rate swaps was $42.5 million and the fair value of these interest rate swaps, $0.9 million, was recorded as a liability in accrued expenses and other liabilities. The related deferred tax benefit was $0.3 million.
Foreign Currency—The Canadian dollar is the functional currency of CPOS, which operates in Canada. CPOS' revenues and expenses are translated at the average exchange rates prevailing during the period. The foreign currency assets and liabilities of CPOS are translated at the period-end rate of exchange. The resulting translation adjustment is allocated between the Company and CPOS' noncontrolling interests and is recorded as a component of other comprehensive income or noncontrolling interests in total equity. At December 31, 2011 and 2010, the cumulative foreign currency translation reflected a loss of $0.2 million and $0.1 million, respectively. The Company intends to indefinitely reinvest undistributed earnings of CPOS and has not tax affected the cumulative foreign currency translation gain or loss. Determination of the amount of unrecognized deferred tax liability related to indefinitely reinvested profits is not material.
Noncontrolling Interests— Noncontrolling interests represent noncontrolling minority stockholders' share of the equity and after-tax net income or loss of consolidated subsidiaries. Noncontrolling minority stockholders' share of after-tax net income or loss of consolidated subsidiaries is included in “Net income attributable to noncontrolling interests” in the Consolidated Statement of Operations. The minority stockholders’ interests included in “noncontrolling interests” in the December 31, 2011 and December 31, 2010 Consolidated Balance Sheets were $642,000 and $301,000, respectively, and reflect the original investments by these minority shareholders in the consolidated subsidiaries, along with their proportionate share of the earnings or losses of the subsidiaries.
Subsequent Events—The Company evaluated subsequent events through the issuance date with respect to the Consolidated Financial Statements as of and for the year ended December 31, 2011.
New Accounting Pronouncements—In October 2009, the FASB issued an accounting standard update on multiple deliverable revenue arrangements to establish the accounting for certain revenue arrangements in which the vendor or service provider will perform multiple revenue generating activities (e.g., contracts that require an up-front fee along with fees that recur over the life of the arrangement). Specifically, the update addresses how to separate deliverables and how to measure and allocate arrangement consideration to one or more units of accounting. This update is effective for revenue arrangements entered into or materially altered after January 1, 2011. The implementation of this update did not have a material effect on the Company's consolidated financial statements.
In December 2010, the FASB issued an accounting standard update on when to perform Step 2 of the goodwill impairment test for reporting units with zero or negative carrying amounts. Step 1 requires reporting entities to identify any potential impairments, on either an annual or interim basis, by comparing the estimated fair value of a reporting unit to its carrying value. If the estimated fair value is less than the carrying value and, it is more likely than not that an impairment exists, then the amount of the impairment will be assessed in the updated guidance in Step 2. Evaluating an impairment in Step 2 requires the evaluation of qualitative factors including the factors presented in existing guidance that trigger an interim impairment test of goodwill such as an adverse change in the business climate, unanticipated competition, or the expectation that a reporting unit will be sold or disposed. This update is effective for annual reporting periods beginning after December 15, 2010. The implementation of this update did not have a material effect on the Company's consolidated financial statements.
In May 2011, the FASB issued an accounting standard update which addresses changes to concepts regarding performing fair value measurements including: (i) the application of the highest and best use and valuation premise; (ii) the valuation of an instrument classified in the reporting entity's shareholder equity; (iii) the valuation of financial instruments that are managed within a portfolio; and (iv) the application of premiums and discounts. This update also enhances disclosure requirements about fair value measurements, including providing information regarding Level 3 measurements such as quantitative information about unobservable inputs, further discussion of the valuation processes used and assumption sensitivity analysis. The update is effective for interim and annual periods beginning after December 15, 2011. The implementation of this update did not have a material effect on the Company's consolidated financial statements.
In June 2011, the FASB issued an accounting standard update which amends the comprehensive income topic of the current codification. The update eliminates the option to present the components of other comprehensive income as part of the statement of changes in equity, and instead requires consecutive presentation of the statement of net income and other comprehensive income either in a continuous statement of comprehensive income or in two separate but consecutive statements. The update is effective for interim and annual periods beginning after December 15, 2011. The implementation of
83
Heartland Payment Systems, Inc. and Subsidiaries
Notes To Consolidated Financial Statements—(Continued)
this update did not have a material effect on the Company's consolidated financial statements.
In September 2011, the FASB issued an accounting standard update on testing goodwill for impairment. This guidance provides an entity the option to first perform a qualitative assessment to determine whether it is more likely than not that the fair value of a reporting unit is less than its carrying amount. If an entity determines that this is the case, it is required to perform the currently prescribed two-step goodwill impairment test to identify potential goodwill impairment and measure the amount of goodwill impairment loss to be recognized for that reporting unit (if any). If an entity determines that the fair value of a reporting unit is more than its carrying amount, the two-step goodwill impairment test is not required. The amendments are effective for annual and interim goodwill impairment tests performed for fiscal years beginning after December 15, 2011 (early adoption is permitted). The Company has early adopted the update and the implementation of this update did not have a material effect on the Company's consolidated financial statements.
3. Processing System Intrusion
On January 20, 2009, the Company publicly announced the discovery of a criminal breach of its payment systems environment (the “Processing System Intrusion”). The Processing System Intrusion involved malicious software that appears to have been used to collect in-transit, unencrypted payment card data while it was being processed by the Company during the transaction authorization process. The Company believes the breach has been contained and did not extend beyond 2008.
Since its announcement of the Processing System Intrusion on January 20, 2009 and through December 31, 2011, the Company has expensed a total of $147.1 million, before reducing those charges by $31.2 million of total insurance recoveries. The majority of the total charges, or approximately $114.7 million, related to settlements of claims. Approximately $32.4 million of the total charges were for legal fees and costs we incurred for investigations, defending various claims and actions, remedial actions and crisis management services.
The following table summarizes the Provision for Processing System Intrusion, which the Company recorded for settlement accruals, legal fees and costs it incurred for defending various claims and actions associated with the Processing System Intrusion, and amounts it recovered from insurance providers for the years ended December 31, 2011, 2010 and 2009:
Year Ended December 31, | |||||||||||
2011 | 2010 | 2009 | |||||||||
(in millions, except per share data) | |||||||||||
(Charges) for settlement accruals, legal fees and costs | $ | (1.0 | ) | $ | (13.1 | ) | $ | (132.9 | ) | ||
Insurance recoveries | — | 27.2 | 4.0 | ||||||||
(Provision for) recovery of processing system intrusion costs | $ | (1.0 | ) | $ | 14.1 | $ | (128.9 | ) | |||
Per share | $ | (0.02 | ) | $ | 0.22 | $ | (2.16 | ) | |||
In 2009 and 2010, the Company had entered into settlements with the bankcard networks for various claims and disputes related to the Processing System Intrusion. During the year ended December 31, 2010, the Company settled the following claims and disputes related to the Processing System Intrusion:
• | On January 7, 2010, the Company entered into a settlement agreement with Heartland Bank, KeyBank National Association (“KeyBank,” and, together with Heartland Bank, the “Sponsor Banks”), and Visa U.S.A. Inc., Visa International Service Association and Visa Inc. (collectively, “Visa”) to resolve potential claims and other disputes among the Company, the Sponsor Banks and Visa with respect to the potential rights and claims of Visa and certain issuers of Visa-branded credit and debit cards related to the Processing System Intrusion (the “Visa Settlement Agreement”). After including a $780,000 credit for fines previously collected by Visa during 2009, the amount paid by the Company under the Visa Settlement Agreement was $59.3 million. The costs of this settlement were included in the Company's Provision for Processing System Intrusion on its Consolidated Statement of Operations for the year ended December 31, 2009 and in its Reserve for Processing System Intrusion on its Consolidated Balance Sheet as of December 31, 2009. Financial institutions representing more than 97 percent of eligible Visa-branded credit and debit cards have accepted the offers they received pursuant to the settlement entered into between and among the Company, Visa, and the Sponsor Banks. |
On February 18, 2010, the Company entered into a bridge loan agreement (the “Bridge Loan Agreement”) with KeyBank, as administrative agent, and KeyBank and Heartland Bank as bridge lenders. On that date, KeyBank made a bridge
84
Heartland Payment Systems, Inc. and Subsidiaries
Notes To Consolidated Financial Statements—(Continued)
loan to the Company in the amount of $20.0 million and Heartland Bank made a bridge loan in the amount of $8.0 million (collectively, the “Bridge Loan”). See Note 11, Credit Facilities for additional terms of the Bridge Loan.
On February 18, 2010, the Company also entered into a Commitment Increase Agreement pursuant to the Amended and Restated Credit Agreement dated as of May 30, 2008 (the “Commitment Increase Agreement”) whereby KeyBank, as one of the lenders under the Amended and Restated Credit Agreement, agreed to increase its revolving credit commitment to the company under the Amended and Restated Credit Agreement by $25.0 million (the “Increased Credit Commitment”). See Note 11, Credit Facilities for additional terms of the Commitment Increase Agreement.
The proceeds of the Bridge Loan and the Increased Credit Commitment, together with a portion of the Company's cash reserves, were used to fund the settlement with Visa. The Settlement Agreement was consummated on February 18, 2010, with a payment of $58.6 million.
• | On May 19, 2010, the Company entered into a settlement agreement with MasterCard Worldwide (“MasterCard”) to resolve potential claims and other disputes among the Company, the Sponsor Banks and MasterCard related to the Processing System Intrusion (the “MasterCard Settlement Agreement”). Under the MasterCard Settlement Agreement, alternative recovery offers totaling $41.4 million were made to eligible MasterCard issuers with respect to losses alleged to have been incurred by them as a result of the Processing System Intrusion. The $41.4 million included a $6.6 million credit for fines previously collected by MasterCard during 2009, so the maximum amount payable under the settlement was $34.8 million if all MasterCard issuers had accepted the settlement. On September 3, 2010 and September 14, 2010, the Company paid approximately $34.4 million because certain issuers did not accept settlement. Those issuers, who represent less than 1% of the accounts eligible for the settlement, have been preliminarily awarded $367,172 by MasterCard, and the Company is contesting that award. |
• | On August 31, 2010, the Company and DFS Services, LLC (”Discover”) entered into an agreement of settlement and release to resolve potential claims and other disputes among the Company and Discover (and its affiliates and certain of its issuers) with respect to the Processing System Intrusion (the “Discover Settlement Agreement”). On September 2, 2010, the Company paid Discover $5.0 million in full and final satisfaction of any and all claims of Discover, its affiliates and certain of its issuers arising from or relating to the Processing System Intrusion. The Discover Settlement Agreement contains mutual releases by and between the Company and Discover (on behalf of itself and its affiliates) relating to the Processing System Intrusion. |
During the year ended December 31, 2009, the Company settled the following claims and disputes related to the Processing System Intrusion:
• | On December 17, 2009, we entered into a settlement agreement and release with American Express to resolve potential claims and other disputes among us and American Express (and its issuers) with respect to the Processing System Intrusion, and subsequently we paid approximately $3.5 million in full and final satisfaction of any and all claims of American Express and its issuers arising from or relating to the Processing System Intrusion. Such settlement agreement and release contains mutual releases by and between us and American Express (on behalf of itself and its issuers) relating to the Processing System Intrusion. |
These settlement amounts were previously provided for in the Company's Provision for Processing System Intrusion and carried in its Reserve for Processing System Intrusion. The Company does not consider it a reasonable possibility that losses exceeding the amounts already recognized on the matters subject to the settlement agreements will be incurred. With regard to the unsettled claims related to the Processing System Intrusion, which the Company described in “Management's Discussion and Analysis - Legal and Regulatory Considerations,” the Company determined material losses in addition to those previously accrued are not considered reasonably possible on any such claim disclosed. The Company is prepared to vigorously defend itself against any unsettled claims relating to the Processing System Intrusion that have been asserted against it and its sponsor banks to date. The Company feels it has strong defenses to all the claims that have been asserted against it and its sponsor banks relating to the Processing System Intrusion.
Additional costs the Company expects to incur for legal fees and costs for defending the unsettled claims and actions associated with the Processing System Intrusion will be recognized as incurred. Such costs are not expected to be material to its results of operations, financial condition and cash flow.
85
Heartland Payment Systems, Inc. and Subsidiaries
Notes To Consolidated Financial Statements—(Continued)
4. Acquisitions
The Company initiated its K to 12 School Solutions product through its acquisitions of the school solutions businesses operated by Lunchbox, Comalex, mySchoolBucks, and School-Link Technologies. Lunchbox, Comalex, mySchoolBucks, and School-Link Technologies serve approximately 4,400, 3,700, 900 and 10,000 schools, respectively. The combined Heartland School Solutions will develop, manufacture, sell, service and maintain computer software designed to facilitate accounting and management functions of school food service operations. These acquisitions provide the Company with the ability to offer Internet payment capability to parents, which facilitates on-line deposits of funds into student accounts and enables schools to operate more efficiently. The Company plans to consolidate the individual platforms and products of Lunchbox, Comalex, mySchoolBucks, and School-Link Technologies to optimize synergies, cost efficiencies and product offerings to customers. Pro forma results of operations have not been presented because the effect of these acquisitions was not material. The entire amount of goodwill is expected to be deductible for income tax reporting. Details of the individual acquisition transactions follow:
Lunchbox
On December 30, 2010, the Company purchased for a $7.7 million cash payment the net assets of the K to 12 School Solutions business previously operated by Lunchbox. The acquisition was financed through a combination of cash on hand and our credit facilities. Pro forma results of operations have not been presented because the effect of the acquisition was not material. The transaction was accounted for under the purchase method of accounting. Beginning December 30, 2010, Lunchbox's results of operations are included in the Company's results of operations. The allocation of the total purchase price was as follows: $6.0 million to goodwill, $1.9 million to intangible assets and $0.2 million to net tangible liabilities.
Comalex, Inc.
On January 12, 2011, the Company purchased for a $6.1 million cash payment the net assets of Comalex, Inc. The acquisition was funded with cash on hand. Pro forma results of operations have not been presented because the effect of the acquisition was not material. The transaction was accounted for under the purchase method of accounting. Beginning January 12, 2011, Comalex's results of operations are included in the Company's results of operations. The allocation of the total purchase price was as follows: $4.9 million to goodwill, $1.8 million to intangible assets and $0.6 million to net tangible liabilities.
mySchoolBucks LLC
On February 4, 2011, the Company purchased for a $1.5 million cash payment the net assets of mySchoolBucks, LLC. The acquisition was funded with cash on hand. Pro forma results of operations have not been presented because the effect of the acquisition was not material. The transaction was accounted for under the purchase method of accounting. Beginning February 4, 2011, mySchoolBucks' results of operations are included in the Company's results of operations. The allocation of the total purchase price was as follows: $1.0 million to goodwill and $0.5 million to intangible assets.
School-Link Technologies, Inc.
On September 30, 2011, the Company purchased for a $15.6 million cash payment the net assets of School-Link Technologies, Inc. The acquisition was funded with cash on hand. The transaction was accounted for under the purchase method of accounting. Beginning October 1, 2011, School Link's results of operations are included in the Company's results of operations. The allocation of the total purchase price was as follows: $28.7 million to goodwill, $4.3 million to intangible assets and $17.4 million to net tangible liabilities. The fair values of the School-Link Technologies' assets acquired and liabilities assumed were estimated as of their acquisition date. The fair values are preliminary, based on estimates, and may be adjusted as more information becomes available and valuations are finalized.
86
Heartland Payment Systems, Inc. and Subsidiaries
Notes To Consolidated Financial Statements—(Continued)
5. Receivables
A summary of receivables by major class was as follows at December 31, 2011 and 2010:
December 31, | |||||||
2011 | 2010 | ||||||
(In thousands) | |||||||
Accounts receivable from merchants | $ | 151,228 | $ | 154,295 | |||
Accounts receivables from bankcard networks | 24,301 | 19,978 | |||||
Accounts receivable from others | 2,457 | 1,940 | |||||
177,986 | 176,213 | ||||||
Less allowance for doubtful accounts | (1,451 | ) | (683 | ) | |||
Total receivables, net | $ | 176,535 | $ | 175,530 | |||
Included in accounts receivable from others are amounts due from employees, which are $0.7 million at each of December 31, 2011 and 2010. Accounts receivable related to bankcard networks are primarily amounts which were pre-funded to merchants for processing Discover and American Express bankcard transactions as well as amounts due from Visa for PIN debit transactions.
A summary of the activity in the allowance for doubtful accounts for the three years ended December 31, 2011, 2010 and 2009 was as follows:
Year Ended December 31, | ||||||||||||
2011 | 2010 | 2009 | ||||||||||
(In thousands) | ||||||||||||
Beginning balance | $ | 683 | $ | 459 | $ | 499 | ||||||
Additions to allowance | 2,423 | 1,329 | 690 | |||||||||
Charges against allowance | (1,655 | ) | (1,105 | ) | (730 | ) | ||||||
Ending balance | $ | 1,451 | $ | 683 | $ | 459 | ||||||
6. Funds Held for Payroll Customers and Investments
A summary of Funds Held for Payroll Customers and Investments, including the cost, gross unrealized gains (losses) and estimated fair value for investments held to maturity and investments available-for-sale by major security type and class of security was as follows at December 31, 2011 and 2010:
Cost | Gross Unrealized Gains | Gross Unrealized Losses | Estimated Fair Value | ||||||||||||
(In thousands) | |||||||||||||||
December 31, 2011 | |||||||||||||||
Funds Held for Payroll Customers: | |||||||||||||||
Fixed income bond fund - available-for-sale | $ | 968 | $ | 190 | $ | — | $ | 1,158 | |||||||
Cash held for payroll customers | 41,353 | — | — | 41,353 | |||||||||||
Total Funds Held for Payroll Customers | $ | 42,321 | $ | 190 | $ | — | $ | 42,511 | |||||||
Investments: | |||||||||||||||
Investments held to maturity – Certificates of deposit (a) | $ | 2,505 | $ | — | $ | — | $ | 2,505 | |||||||
Total investments | $ | 2,505 | $ | — | $ | — | $ | 2,505 | |||||||
(a) Certificates of deposit have remaining terms ranging from 1 month to 11 months.
87
Heartland Payment Systems, Inc. and Subsidiaries
Notes To Consolidated Financial Statements—(Continued)
Cost | Gross Unrealized Gains | Gross Unrealized Losses | Estimated Fair Value | ||||||||||||
(In thousands) | |||||||||||||||
December 31, 2010 | |||||||||||||||
Funds Held for Payroll Customers: | |||||||||||||||
Fixed income bond fund | $ | 968 | $ | 195 | $ | — | $ | 1,163 | |||||||
Corporate bonds | 165 | 5 | — | 170 | |||||||||||
Total investments available-for-sale | 1,133 | 200 | — | 1,333 | |||||||||||
Cash held for payroll customers | 35,190 | — | — | 35,190 | |||||||||||
Total Funds Held for Payroll Customers | $ | 36,323 | $ | 200 | $ | — | $ | 36,523 | |||||||
Investments: | |||||||||||||||
Investments held to maturity – Certificates of deposit | $ | 1,516 | $ | — | $ | — | $ | 1,516 | |||||||
Total investments | $ | 1,516 | $ | — | $ | — | $ | 1,516 | |||||||
During the twelve months ended December 31, 2011 and 2010 , the Company did not experience any other-than-temporary losses on its investments.
As of December 31, 2011, all available-for-sale debt securities and held to maturity investments are due in one year or less and had an amortized cost of $3.5 million and estimated fair value of $3.7 million.
7. Capitalized Customer Acquisition Costs, Net
A summary of net capitalized customer acquisition costs as of December 31, 2011 and 2010 was as follows:
December 31, | |||||||
2011 | 2010 | ||||||
(In thousands) | |||||||
Capitalized signing bonuses | $ | 86,837 | $ | 101,246 | |||
Less accumulated amortization | (45,125 | ) | (56,481 | ) | |||
41,712 | 44,765 | ||||||
Capitalized customer deferred acquisition costs | 36,564 | 38,709 | |||||
Less accumulated amortization | (23,262 | ) | (24,223 | ) | |||
13,302 | 14,486 | ||||||
Capitalized customer acquisition costs, net | $ | 55,014 | $ | 59,251 | |||
A summary of the activity in capitalized customer acquisition costs, net for the three years ended December 31, 2011, 2010 and 2009 was as follows:
Year Ended December 31, | |||||||||||
2011 | 2010 | 2009 | |||||||||
(In thousands) | |||||||||||
Balance at beginning of period | $ | 59,251 | $ | 72,038 | $ | 77,737 | |||||
Plus additions to: | |||||||||||
Capitalized signing bonuses, net | 29,035 | 26,495 | 34,690 | ||||||||
Capitalized customer deferred acquisition costs | 14,276 | 14,715 | 16,449 | ||||||||
43,311 | 41,210 | 51,139 | |||||||||
Less amortization expense on: | |||||||||||
Capitalized signing bonuses, net (a) | (32,088 | ) | (37,990 | ) | (40,897 | ) | |||||
Capitalized customer deferred acquisition costs | (15,460 | ) | (16,007 | ) | (15,941 | ) | |||||
(47,548 | ) | (53,997 | ) | (56,838 | ) | ||||||
Balance at end of period | $ | 55,014 | $ | 59,251 | $ | 72,038 | |||||
(a) Includes for 2011 from Other, Net Expense, a net impairment charge related to the remote check deposit product, Express Funds.
88
Heartland Payment Systems, Inc. and Subsidiaries
Notes To Consolidated Financial Statements—(Continued)
Net signing bonus adjustments from estimated amounts to actual were $(1.5) million, $(2.1) million, and $(1.5) million, respectively, for the years ended December 31, 2011, 2010 and 2009. Net signing bonus adjustments are netted against additions in the table above. Negative signing bonus adjustments occur when the actual gross margin generated by the merchant contract during the first year is less than the estimated gross margin for that year, resulting in the overpayment of the up-front signing bonus and would be recovered from the relevant salesperson. Positive signing bonus adjustments result from the prior underpayment of signing bonuses and would be paid to the relevant salesperson.
Fully amortized signing bonuses of $42.3 million and $44.8 million and $32.9 million, respectively, were written off during the three years ended December 31, 2011, 2010, and 2009. In addition, fully amortized customer deferred acquisition costs of $16.4 million, $15.2 million and $14.2 million, respectively, were written off during the three years ended December 31, 2011, 2010 and 2009.
At December 31, 2011, the Company recognized an impairment charge to net signing bonuses of $360,000 related to the decision to discontinue Express Funds, its remote deposit check capture product. The Company believed that no impairment of capitalized customer acquisition costs had occurred as of December 31, 2010.
8. Property and Equipment, Net
A summary of property and equipment, net as of December 31, 2011 and 2010 is as follows:
December 31, | |||||||
2011 | 2010 | ||||||
(In thousands) | |||||||
Computer hardware and software | $ | 120,380 | $ | 91,417 | |||
Building | 54,286 | 49,166 | |||||
Leasehold improvements | 5,140 | 5,299 | |||||
Furniture, fixtures and equipment | 13,783 | 12,694 | |||||
Land | 5,873 | 5,796 | |||||
199,462 | 164,372 | ||||||
Less accumulated depreciation | (83,883 | ) | (62,124 | ) | |||
$ | 115,579 | $ | 102,248 | ||||
Depreciation expense for the three years ended December 31, 2011, 2010 and 2009 was $23.4 million, $20.9 million and $16.8 million, respectively.
Included in property and equipment at December 31, 2011 and 2010 was $14.2 million and $8.9 million, respectively, representing the cost of assets not yet placed in service. At December 31, 2010, this included $0.6 million for the cost of the Company's Jeffersonville, Indiana service center which has all been placed in service during 2011 with no remainder at December 31, 2011. During the year ended December 31, 2010, $5.9 million of capitalized costs were placed in service for the new service center. During the years ended December 31, 2011 and 2010, the amounts of capitalized costs for internally developed projects placed in service were $15.9 million and $15.7 million, respectively.
9. Intangible Assets and Goodwill
Intangible Assets — Intangible assets consisted of the following as of December 31, 2011 and 2010:
December 31, 2011 | Amortization Life and Method | ||||||||||||
Gross Assets | Accumulated Amortization | Net Asset | |||||||||||
(In thousands) | |||||||||||||
Finite Lived Assets: | |||||||||||||
Customer relationships | $ | 33,166 | $ | 5,406 | $ | 27,760 | 3 to 18 years—proportional cash flow | ||||||
Merchant Portfolio | 3,345 | 1,819 | 1,526 | 7 years—proportional cash flow | |||||||||
Software | 10,078 | 8,612 | 1,466 | 2 to 5 years—straight line | |||||||||
Non-compete agreements | 2,794 | 1,126 | 1,668 | 3 to 5 years—straight line | |||||||||
Other | 457 | 379 | 78 | 2 to 9 years—straight line | |||||||||
$ | 49,840 | $ | 17,342 | $ | 32,498 | ||||||||
89
Heartland Payment Systems, Inc. and Subsidiaries
Notes To Consolidated Financial Statements—(Continued)
December 31, 2010 | Amortization Life and Method | ||||||||||||
Gross Assets | Accumulated Amortization | Net Asset | |||||||||||
(In thousands) | |||||||||||||
Finite Lived Assets: | |||||||||||||
Customer relationships | $ | 28,665 | $ | 3,452 | $ | 25,213 | 3 to 18 years—proportional cash flow | ||||||
Merchant Portfolio | 3,345 | 1,180 | 2,165 | 7 years—proportional cash flow | |||||||||
Software | 9,705 | 7,149 | 2,556 | 3 to 5 years—straight line | |||||||||
Non-compete agreements | 1,840 | 768 | 1,072 | 3 to 5 years—straight line | |||||||||
Other | 616 | 462 | 154 | 2 to 9 years—straight line | |||||||||
$ | 44,171 | $ | 13,011 | $ | 31,160 | ||||||||
The weighted average amortization life for the 2011 acquired finite lived intangible assets related to acquisitions of Comalex, mySchoolBucks, and School-Link Technologies is as follows:
Weighted-average amortization life | |
(in years) | |
Customer relationships | 6.0 |
Software | 3.4 |
Non-compete agreements | 5.0 |
Other | 5.0 |
Total | 5.6 |
Amortization expense related to the intangible assets was $4.7 million, $5.2 million and $5.0 million for the years ended December 31, 2011, 2010 and 2009, respectively.
The estimated amortization expense related to intangible assets for the next five years is as follows:
For the Years Ended December 31, | |||
(In thousands) | |||
2012 | $ | 4,274 | |
2013 | 4,120 | ||
2014 | 3,520 | ||
2015 | 3,314 | ||
2016 | 2,572 | ||
Thereafter | 14,698 | ||
$ | 32,498 | ||
Goodwill — The changes in the carrying amount of goodwill for the years ended December 31, 2011 and 2010 were as follows:
December 31, | |||||||
2011 | 2010 | ||||||
(In thousands) | |||||||
Beginning balance | $ | 68,319 | $ | 60,962 | |||
Goodwill acquired during the period | 34,506 | 5,557 | |||||
Effects of foreign currency translation | (145 | ) | 401 | ||||
Other (a) | 719 | 1,399 | |||||
Ending balance | $ | 103,399 | $ | 68,319 | |||
(a) Reflects adjustments to allocations of purchase price.
90
Heartland Payment Systems, Inc. and Subsidiaries
Notes To Consolidated Financial Statements—(Continued)
10. Processing Liabilities and Loss Reserves
The majority of our processing liabilities include funds in transit associated with bankcard and check processing. In addition, we maintain merchant deposits to offset potential liabilities from merchant chargeback processing. A summary of processing liabilities and loss reserves was as follows at December 31, 2011 and 2010:
December 31, | |||||||
2011 | 2010 | ||||||
(In thousands) | |||||||
Merchant bankcard processing | $ | 10,295 | $ | 12,061 | |||
Check processing | 8,594 | 5,852 | |||||
Merchant deposits | 9,839 | 9,160 | |||||
Loss reserves | 1,961 | 1,667 | |||||
$ | 30,689 | $ | 28,740 | ||||
The Company's merchants have the liability for any charges properly reversed by the cardholder through a mechanism known as a chargeback. If the merchant is unable to pay this amount, the Company will be liable to the card brand networks for the reversed charges. The Company has determined that the fair value of its obligation to stand ready to perform is minimal. The Company requires personal guarantees and merchant deposits from certain merchants to minimize its obligation.
The card brand networks generally allow chargebacks up to four months after the later of the date the transaction is processed or the delivery of the product or service to the cardholder. As the majority of the Company's SME merchant transactions involve the delivery of the product or service at the time of the transaction, a reasonable basis for determining an estimate of the Company's exposure to chargebacks is the last four months' processing volume on the SME portfolio, which was $22.3 billion and $21.7 billion for the four months ended December 31, 2011 and 2010, respectively. However, for the four months ended December 31, 2011 and 2010, the Company was presented with $12.2 million and $10.1 million, respectively, in chargebacks by issuing banks. In the year ended December 31, 2011 and 2010, the Company incurred merchant credit losses of $5.1 million and $9.1 million, respectively, on total SME bankcard dollar volumes processed of $67.5 billion and $63.1 billion, respectively. These credit losses are included in processing and servicing costs in the Company's Consolidated Statement of Operations.
The loss recorded by the Company for chargebacks associated with any individual merchant is typically small, due both to the relatively small size and the processing profile of the Company's SME merchants. However, from time to time the Company will encounter instances of merchant fraud, and the resulting chargeback losses may be considerably more significant to the Company. The Company has established a contingent reserve for estimated currently existing credit and fraud losses on its Consolidated Balance Sheet, amounting to $2.0 million at December 31, 2011 compared to $1.7 million at December 31, 2010. This reserve is determined by performing an analysis of the Company's historical loss experience applied to current processing volume and exposures.
A summary of the activity in the loss reserve for the years ended December 31, 2011, 2010, and 2009 was as follows:
Year Ended December 31, | ||||||||||
2011 | 2010 | 2009 | ||||||||
(in thousands) | ||||||||||
Beginning balance | $ | 1,667 | $ | 1,336 | 1,097 | |||||
Additions to reserve | 6,011 | 9,985 | 6,272 | |||||||
Charges against reserve (a) | (5,717 | ) | (9,654 | ) | (6,033 | ) | ||||
Ending balance | $ | 1,961 | $ | 1,667 | 1,336 | |||||
(a)Included in these amounts are payroll segment losses for the years ended December 31, 2011, 2010, and 2009 of $223,000, $303,000 and $179,000
During 2010, the Company began settling Network Services Merchant accounts and processing chargebacks originating from these merchants on Passport. Prior to this, these chargebacks were processed and carried by Vantiv, Inc., which was our third-party outsourced processor for settling Network Services Merchant accounts. Chargeback losses originating from Network Services' bankcard processing on Passport during the year ended December 31, 2011 were $17,000.
91
Heartland Payment Systems, Inc. and Subsidiaries
Notes To Consolidated Financial Statements—(Continued)
11. Credit Facilities
On November 24, 2010, the Company entered into a Second Amended and Restated Credit Agreement (the “Credit Agreement”) with JPMorgan Chase Bank, N.A., as administrative agent, and certain lenders who are a party to the Credit Agreement. Credit extended under the Credit Agreement is guaranteed by the Company's subsidiaries and is secured by substantially all of its assets and the assets of its subsidiaries. The Credit Agreement amended and restated in its entirety the previous amended and restated credit agreement entered into on May 30, 2008, as amended (the “Previous Credit Agreement”), between the Company and certain of the parties to the Credit Agreement. On February 18, 2010, the Company entered into the Commitment Increase Agreement with KeyBank as one of the lenders under the Previous Credit Agreement to increase the total commitment under that facility's revolving credit facility by $25 million.
The Credit Agreement provides for a revolving credit facility in the aggregate amount of up to $50 million (the “Revolving Credit Facility”), of which up to $10 million may be used for the issuance of letters of credit and up to $5 million is available for swing line loans. Upon the prior approval of the administrative agent, the Company may increase the total revolving commitments by $50 million for a total commitment under the Revolving Credit Facility of $100 million. The Revolving Credit Facility is available to the Company on a revolving basis until November 24, 2015. All principal and interest not previously paid on the Revolving Credit Facility will mature and be due and payable on November 24, 2015.
The Credit Agreement also provides for a term credit facility in the aggregate amount of up to $100 million (the “Term Credit Facility”). The Term Credit Facility requires amortization payments in the amount of $3.75 million for each fiscal quarter during the fiscal years ended December 31, 2011 and 2012, $5.0 million for each fiscal quarter during the fiscal years ended December 31, 2013 and 2014, and $7.5 million for each fiscal quarter during the period commencing on January 1, 2015 through the maturity date on November 24, 2015. All principal and interest not previously paid on the Term Credit Facility will mature and be due and payable on November 24, 2015. Amounts borrowed and repaid under the Term Credit Facility may not be re-borrowed. Principal payments due under the Term Credit Facility as of December 31, 2011 were as follows:
For the Years Ended December 31, | (In thousands) | ||
2012 | $ | 15,000 | |
2013 | 20,000 | ||
2014 | 20,000 | ||
2015 | 30,000 | ||
$ | 85,000 | ||
The Credit Agreement contains covenants which include: the Company's maintenance of certain leverage and fixed charge coverage ratios; limitations on its indebtedness; liens on its properties and assets, its investments in, and loans to other business units; its ability to enter into business combinations and asset sales; and certain other financial and non-financial covenants. These covenants also apply to certain of the Company's subsidiaries. The Company was in compliance with these covenants as of December 31, 2011 and expects it will remain in compliance with these covenants for at least the next twelve months.
Under the terms of the Credit Agreement, the Company may borrow, at its option, at interest rates equal to one, two, three or six month adjusted LIBOR rates, or equal to the greater of the prime rate, the federal funds rate plus 0.50% and the adjusted LIBOR rate plus 1%, in each case plus a margin determined by its current leverage ratio. The weighted average interest rate at December 31, 2011 was 2.6%. Total fees and direct costs paid for the Credit Agreement through December 31, 2011 were $1.3 million. These costs are being amortized to interest expense over the life of the Credit Agreement.
A condition of the January 7, 2010 Settlement Agreement with Visa was for the Company to obtain a loan of at least $53.0 million from KeyBank and Heartland Bank, the proceeds of which were to be used by the Company to fund the settlement amount. See Note 3, Processing System Intrusion for more detail. On February 18, 2010, the Company entered into the Bridge Loan Agreement with KeyBank, as administrative agent, and KeyBank and Heartland Bank as bridge lenders. On that date, KeyBank made a bridge loan to the Company in the amount of $20.0 million and Heartland Bank made a bridge loan to the Company in the amount of $8.0 million. The maturity date of the Bridge Loan was scheduled for February 17, 2011. The proceeds of the Bridge Loan ($28.0 million) and the Increased Credit Commitment ($25.0 million), together with a portion of the Company's cash reserves, were used to fund the settlement with Visa, which was consummated on February 18, 2010 for
92
Heartland Payment Systems, Inc. and Subsidiaries
Notes To Consolidated Financial Statements—(Continued)
$58.6 million.
In conjunction with the November 24, 2010 closing of the Credit Agreement, the Company borrowed $15.2 million under the Revolving Credit Facility and $100.0 million under the Term Credit Facility and repaid amounts previously borrowed and outstanding under the Previous Credit Agreement, the Increased Credit Commitment, and the Bridge Loan. Additionally, the Company borrowed $8.0 million under the Revolving Credit Facility at December 31, 2010 to fund the acquisition of Lunchbox. The Company repaid that $8.0 million and the remaining $15.2 million in the year ended December 31, 2011. At December 31, 2011, the Company had no outstanding balance due under the Revolving Credit Facility.
At December 31, 2011, the Company had $85.0 million outstanding under the Term Credit Facility. At December 31, 2010, the Company had $23.2 million outstanding under the Revolving Credit Facility and $100.0 million outstanding under the Term Credit Facility.
12. Accrued Buyout Liability
A summary of the accrued buyout liability was as follows as of December 31, 2011 and 2010:
December 31, | |||||||
2011 | 2010 | ||||||
(In thousands) | |||||||
Vested Relationship Managers and sales managers | $ | 30,269 | $ | 27,521 | |||
Unvested Relationship Managers and sales managers | 1,389 | 1,289 | |||||
31,658 | 28,810 | ||||||
Less current portion | (8,104 | ) | (5,560 | ) | |||
Long-term portion of accrued buyout liability | $ | 23,554 | $ | 23,250 | |||
In calculating the accrued buyout liability for unvested Relationship Managers and sales managers, the Company has assumed that 31% of the unvested Relationship Managers and sales managers will vest in the future, which represents the Company’s historical vesting rate. A 5% increase to 36% in the expected vesting rate would have increased the accrued buyout liability for unvested Relationship Managers and sales managers by $0.1 million and $0.2 million respectively, at December 31, 2011 and 2010.
A summary of the activity in the accrued buyout liability for the three years ended December 31, 2011, 2010, and 2009 was as follows:
Year Ended December 31, | |||||||||||
2011 | 2010 | 2009 | |||||||||
(In thousands) | |||||||||||
Beginning balance | $ | 28,810 | $ | 42,886 | $ | 41,040 | |||||
Increase in settlement obligation, net | 13,228 | 11,133 | 9,973 | ||||||||
Buyouts | (10,380 | ) | (25,209 | ) | (8,127 | ) | |||||
Ending balance | $ | 31,658 | $ | 28,810 | $ | 42,886 | |||||
During the third quarter of 2010, the Company exercised its rights to buy out a substantial portion of residual commissions owned by Relationship Managers and sales managers (also referred to as “portfolio equity”). As a result of these buyouts, the Company reduced the settlement obligation by the approximately $17.7 million of cash payments made. The Company continues to buy out portfolio equity. During 2011, 2010 and 2009, we made buyout payments of approximately $10.4 million, $25.2 million and $8.1 million, respectively. Residual commission expense is recorded in Processing and Servicing costs on the Consolidated Statement of Operations. The amount of future annual reductions in residual commission expense will be impacted by any additional portfolio equity buyouts and merchant attrition. Partially offsetting the impact of these buyouts are increases in the settlement obligation due to new SME merchant account signings, as adjusted for changes in same-store sales growth, changes in gross margin for existing merchant relationships, and the impact of SME merchant attrition.
93
Heartland Payment Systems, Inc. and Subsidiaries
Notes To Consolidated Financial Statements—(Continued)
13. Stockholders' Equity
Common Stock Repurchases. On October 21, 2011, our Board of Directors authorized the repurchase of up to $50 million worth of our common stock. Repurchases under this program will be made through the open market, or in privately negotiated transactions, from time to time in accordance with applicable laws and regulations. We intend to fund any repurchases with cash flow from operations, existing cash on the balance sheet, and other sources including the proceeds of options exercises. The manner, timing and amount of repurchases, if any, will be determined by our management and will depend on a variety of factors, including price, corporate and regulatory requirements, market conditions and other corporate liquidity requirements. The repurchase program may be modified or discontinued at any time.
Under this authorization, in 2011 the Company repurchased an aggregate of 778,889 shares of its common stock at a cost of $16.8 million, or an average cost of $21.61 per share. At December 31, 2011, the Company has remaining authorization to repurchase up to an additional $33.2 million of our common stock. No common stock was repurchased during the year ended December 31, 2010. Under a prior authorization from its Board of Directors, the Company repurchased 350,400 shares of its common stock at an average per share cost of $9.14 during the year ended December 31, 2009.
Dividends on Common Stock. During the years ended December 31, 2011, 2010 and 2009, the Company's Board of Directors declared the following quarterly cash dividends on common stock:
Date Declared | Record Date | Date Paid | Amount Paid Per Common Share | |||
Twelve Months Ended December 31, 2011 | ||||||
February 16, 2011 | March 4, 2011 | March 15, 2011 | $0.04 | |||
May 13, 2011 | May 24, 2011 | June 15, 2011 | $0.04 | |||
August 2, 2011 | August 24, 2011 | September 15, 2011 | $0.04 | |||
October 21, 2011 | November 24, 2011 | December 15, 2011 | $0.04 | |||
Twelve Months Ended December 31, 2010 | ||||||
February 18, 2010 | March 5, 2010 | March 15, 2010 | $0.01 | |||
May 4, 2010 | May 25, 2010 | June 15, 2010 | $0.01 | |||
August 3, 2010 | August 25, 2010 | September 15, 2010 | $0.01 | |||
November 2, 2010 | November 23, 2010 | December 15, 2010 | $0.01 | |||
Twelve Months Ended December 31, 2009 | ||||||
February 20, 2009 | March 9, 2009 | March 16, 2009 | $0.025 | |||
May 7, 2009 | May 25, 2009 | June 15, 2009 | $0.01 | |||
August 3, 2009 | August 25, 2009 | September 15, 2009 | $0.01 | |||
November 3, 2009 | November 23, 2009 | December 15, 2009 | $0.01 | |||
On February 8, 2012, the Company's Board of Directors declared a quarterly cash dividend of $0.06 per share of common stock, payable on March 15, 2012 to stockholders of record as of March 2, 2012.
94
Heartland Payment Systems, Inc. and Subsidiaries
Notes To Consolidated Financial Statements—(Continued)
14. Income Taxes
The provision for (benefit from) income taxes for the three years ended December 31, 2011, 2010, and 2009 consists of the following:
Year Ended December 31, | |||||||||||
2011 | 2010 | 2009 | |||||||||
(In thousands) | |||||||||||
Current | |||||||||||
Federal | $ | 23,949 | $ | (15,587 | ) | $ | (8,508 | ) | |||
State | 740 | 555 | 522 | ||||||||
Foreign | 676 | 303 | 237 | ||||||||
Deferred | |||||||||||
Federal | (435 | ) | 34,311 | (19,024 | ) | ||||||
State | 2,297 | 1,695 | (3,040 | ) | |||||||
Foreign | (101 | ) | (142 | ) | (106 | ) | |||||
Total provision for (benefit from) income taxes | $ | 27,126 | $ | 21,135 | $ | (29,919 | ) | ||||
For financial reporting purposes, income (loss) before income taxes includes the following components:
Year Ended December 31, | |||||||||||
2011 | 2010 | 2009 | |||||||||
(In thousands) | |||||||||||
United States | $ | 69,540 | $ | 55,158 | $ | (81,996 | ) | ||||
Foreign | 1,933 | 637 | 347 | ||||||||
Total income (loss) before income taxes | $ | 71,473 | $ | 55,795 | $ | (81,649 | ) | ||||
The differences in federal income taxes provided (benefited) and the amounts determined by applying the federal statutory tax rate of 35% to income (loss) before income taxes for the three years ended December 31, 2011, 2010, and 2009 are:
Year Ended December 31, | ||||||||||||||||||||
2011 | 2010 | 2009 | ||||||||||||||||||
% | Amount | % | Amount | % | Amount | |||||||||||||||
(In thousands) | (In thousands) | (In thousands) | ||||||||||||||||||
U.S. federal income tax at statutory rate | 35.00 | % | $ | 25,015 | 35.00 | % | $ | 19,528 | 35.00 | % | $ | (28,577 | ) | |||||||
U.S. state and local income taxes, net | 2.80 | % | 2,001 | 2.67 | % | 1,492 | 1.94 | % | (1,588 | ) | ||||||||||
Foreign income taxes | (0.16 | )% | (116 | ) | (0.01 | )% | (7 | ) | (0.01 | )% | 4 | |||||||||
Nondeductible expenses | 0.36 | % | 261 | 0.44 | % | 246 | (0.18 | )% | 143 | |||||||||||
Valuation Allowance | (0.01 | )% | (5 | ) | — | % | (2 | ) | (0.20 | )% | 166 | |||||||||
Other | (0.04 | )% | (30 | ) | (0.22 | )% | (122 | ) | 0.09 | % | (67 | ) | ||||||||
Provision for (benefit from) income taxes | 37.95 | % | $ | 27,126 | 37.88 | % | $ | 21,135 | 36.64 | % | $ | (29,919 | ) | |||||||
The Company has recorded income tax expense (benefit) at U.S. tax rates on all taxable income (loss), except undistributed earnings of CPOS, its non-U.S. subsidiary. The Company intends to indefinitely reinvest undistributed earnings of CPOS and accordingly, has provided Canadian income tax on those earnings but not U.S. income tax. As of December 31, 2011, the total amount of undistributed earnings of CPOS for which the Company has not recorded U.S. income tax was approximately $2.2 million. In the event of distribution of those earnings in the form of dividends or otherwise, the Company would be subject to U.S. income taxes subject to an adjustment, if any, for foreign tax credits. Determination of the amount of U.S. income tax liability that would be incurred is not practicable because of the complexities associated with this hypothetical calculation.
The Company recognized a $0.8 million reserve for unrecognized tax benefits related to its uncertain tax positions as a liability, increased deferred tax assets by $0.3 million and recorded a cumulative effect adjustment to Retained Earnings of $0.5 million on January 1, 2007. The Company recorded a liability of approximately $1.8 million, $1.3 million and $1.4 million for total gross unrecognized tax benefits of which approximately $1.1 million, $0.9 million and $1.0 million as of December 31,
95
Heartland Payment Systems, Inc. and Subsidiaries
Notes To Consolidated Financial Statements—(Continued)
2011, 2010 and 2009 respectively, would impact the effective tax rate. The Company does not expect any significant changes
within the next twelve months in its unrecognized tax benefits. A reconciliation of the beginning and ending amount of unrecognized tax benefits for the years ended December 31, 2011, 2010, and 2009 is as follows:
Year Ended December 31, | |||||||||||
2011 | 2010 | 2009 | |||||||||
(In thousands) | |||||||||||
Balance at January 1, | $ | 1,309 | $ | 1,391 | $ | 1,732 | |||||
Additions based on tax positions related to the current year | 637 | 448 | — | ||||||||
Reductions based on tax positions related to the prior years | — | (260 | ) | (226 | ) | ||||||
Lapse of statute of limitations | (127 | ) | (270 | ) | (113 | ) | |||||
Settlements | — | — | (2 | ) | |||||||
Balance at December 31, | $ | 1,819 | $ | 1,309 | $ | 1,391 | |||||
The Company recognizes interest related to uncertain tax positions in interest expense and recognizes penalties in general and administrative expense. At December 31, 2011 and 2010, the Company had an accrued interest liability on uncertain tax positions of approximately $216,000 and $168,000, respectively. During 2011 and 2010, the Company recognized $48,000 and $7,000, respectively, of interest expense related to uncertain tax positions. The Company does not expect to be assessed any penalties on its uncertain tax positions.
During the third quarter of 2009, the U.S. Internal Revenue Service completed the Company's federal income tax audit for the tax years ended December 31, 2004 through December 31, 2006. As a result of the audit, the Company paid a total settlement amount which was immaterial. The tax years ended December 31, 2007 through December 31, 2010 remain subject to examination by the U.S. Internal Revenue Service and the tax years ended December 31, 2006 through December 31, 2010 remain subject to examination by the Company's state taxing jurisdictions. Currently, the Company is under examination by the IRS for the tax year 2010, and is under review by the Joint Committee on Taxation for 2009. In addition to the U.S. federal examination, there is also limited audit activity in the U.S. state jurisdictions. Currently the Company does not expect that its state liability will significantly increase or decrease during the next 12 months. The Company files income tax returns in all states where required.
During 2011 and 2010, the Company recorded current tax assets reflecting excess tax benefits of $3.5 million and $1.9 million, respectively, resulting from employees exercising non-qualified stock options, making disqualifying dispositions of shares acquired through their exercise of incentive stock options, and vesting of restricted share units. The Company classified the $3.5 million and $1.9 million of excess tax benefits for 2011 and 2010, respectively, as cash inflows from financing activities and cash outflows from operating activities in its Consolidated Statement of Cash Flows.
The Company's Current Tax Asset shifted from an $18.7 million asset at December 31, 2010 to a Current Tax Liability of $1.4 million at December 31, 2011, primarily due to $16.7 million of tax refunds received from the carry back of its 2010 federal tax operating loss to prior years. The 2010 federal tax operating loss resulted from the payment of settlements with card brands and other Processing System Intrusion related expenses, net of recoveries from insurance providers (see Note 3, Processing System Intrusion for more detail).
96
Heartland Payment Systems, Inc. and Subsidiaries
Notes To Consolidated Financial Statements—(Continued)
The net deferred tax asset was comprised of the following at December 31, 2011 and 2010:
December 31, | |||||||
2011 | 2010 | ||||||
(In thousands) | |||||||
Deferred tax assets: | |||||||
Merchant contract costs | $ | 7,229 | $ | 5,502 | |||
Loss reserve and accounts receivable allowance | 1,198 | 815 | |||||
Share-based compensation | 6,691 | 4,883 | |||||
FIN No. 48 deferred tax reserve-state tax | 722 | 523 | |||||
Intangibles | 2,803 | 1,789 | |||||
Unearned Rent | 12 | 66 | |||||
Other comprehensive income | 341 | — | |||||
Reserve for processing system intrusion | — | 909 | |||||
Reserve for Litigation | 746 | 1,536 | |||||
State net operating loss carry-forwards | 1,369 | 2,855 | |||||
Reserve for processor incentive | 390 | — | |||||
Deferred compensation | 2,852 | — | |||||
Deferred state tax assets | 364 | — | |||||
Other | 1,114 | 570 | |||||
Deferred tax assets | 25,831 | 19,448 | |||||
Less Valuation Allowance | (158 | ) | (164 | ) | |||
Net Deferred tax Assets | 25,673 | 19,284 | |||||
Deferred tax liabilities: | |||||||
Capitalized signing bonus | 16,023 | 16,716 | |||||
Software development | 14,392 | 9,227 | |||||
Property and equipment | 4,622 | 3,377 | |||||
Goodwill | 5,533 | 3,544 | |||||
Deferred compensation | — | 408 | |||||
Deferred state tax liability | — | 476 | |||||
Deferred tax liabilities | 40,570 | 33,748 | |||||
Net deferred tax liabilities | (14,897 | ) | (14,464 | ) | |||
Less current deferred tax asset, net | 6,746 | 7,250 | |||||
Net deferred tax liabilities - non-current portion | $ | (21,643 | ) | $ | (21,714 | ) | |
Valuation allowances are recorded to reduce deferred tax assets when it is more likely than not that a tax benefit will not be realized. A valuation allowance has been recorded to fully reduce the tax benefit of a capital loss carry-forward that is not expected to be realized before it expires in 2014. A valuation allowance has not been recorded to reduce the tax benefit of the state net operating loss carry-forwards of $3.1 million, for December 31, 2010 or other net deferred tax assets as management believes that the Company will attain sufficient future taxable income within the carry-forward periods to fully recover these taxes. If not used, the state net operating loss carry-forwards will begin to expire in 2014.
15. Stock Incentive Plan
As described below, the Company maintained two share-based plans for its employees under which it has granted stock options, performance-based stock options, Restricted Share Units and performance-based Restricted Share Units. Amounts the Company recognized in its consolidated financial statements for the years ended December 31, 2011, 2010, and 2009 with respect to these share-based plans were as follows:
97
Heartland Payment Systems, Inc. and Subsidiaries
Notes To Consolidated Financial Statements—(Continued)
Year Ended December 31, | ||||||||||||
2011 | 2010 | 2009 | ||||||||||
(In thousands) | ||||||||||||
Compensation expense recognized on share-based plans before income tax benefit | $ | 9,548 | $ | 6,295 | $ | 4,526 | ||||||
Related income tax benefit recognized in the income statement | 3,635 | 2,379 | 1,723 | |||||||||
Cash received from stock option exercises | 9,685 | 6,303 | 1,045 | |||||||||
Excess tax benefit recorded for tax deductions resulting from the exercise of stock options | 3,454 | 1,910 | 384 | |||||||||
Tax benefit realized as reductions of estimated tax payments during the period | 2,954 | — | 250 | |||||||||
The Company estimates the grant date fair value of the stock options it issues using a Black-Scholes valuation model for “plain-vanilla” stock options and performance-based stock options, and it uses a lattice valuation model to measure grant date fair value for stock options containing market vesting conditions. The Company's assumption for expected volatility is based on its historical volatility data related to market trading of its own Common Stock. The Company bases its assumptions for the expected life of new stock option grants on its analysis of the historical exercise patterns of its stock options. Previously, it estimated the expected life of a stock option based on the simplified method for “plain-vanilla” stock options as provided by the staff of the SEC. The Company's dividend yield assumption is based on actual dividends expected to be paid over the expected life of the stock option. The risk-free interest rate assumption for stock options granted is determined by using U.S. treasury rates of the same period as the expected option term of each stock option. The weighted-average fair value of options granted during the years ended December 31, 2011, 2010, and 2009 were $7.95, $6.12 and $3.12, respectively. The fair value of options granted during the years ended December 31, 2011, 2010, and 2009 was estimated at the grant date using the following weighted average assumptions:
Year Ended December 31, | ||||||||
2011 | 2010 | 2009 | ||||||
Expected volatility | 55 | % | 54 | % | 48 | % | ||
Expected life | 3.65 years | 3.75 years | 3.75 to 4.0 years | |||||
Expected dividends | 0.80 | % | 0.40 | % | 0.47 | % | ||
Risk-free interest rate | 0.55 | % | 1.21 | % | 1.76 | % | ||
In the second quarter of 2009, the Company's Board of Directors approved grants of 930,000 stock options subject to multiple vesting conditions. Under these stock options, the employee must provide continuous service over four years and a market price condition must be satisfied within those four years. These stock options have a five-year term and could vest in equal amounts in 2010, 2011, 2012 and 2013 only if during the four-year service period, the price of the Company's common stock as reported by the New York Stock Exchange exceeds two or three times the exercise price for 30 consecutive trading days. The grant date fair values of these multiple vesting condition options are recognized as compensation expense over their four-year service periods. As of December 31, 2011, 232,500 of the 930,000 stock options have vested.
In the fourth quarter of 2010, the Company's Board of Directors approved grants of 508,800 performance-based Restricted Share Units. These Restricted Share Units are nonvested share awards which would vest 50% in 2013, 25% in 2014, and 25% in 2015 only if over the term of these Restricted Share Units, the following diluted earnings per share targets for the years ended December 31, 2012, 2013 and 2014 are achieved:
2012 | 2013 | 2014 | |
Diluted Earnings Per Share (a) | $1.48 | $1.74 | $2.04 |
(a) | Calculated on a Pro Forma basis to exclude non-operating gains and losses, if any, and excluding the after-tax impact of Stock Compensation Expense. |
As of December 31, 2011, management believed that achieving these performance targets was “more likely than not” to occur and began recording share-based compensation expense for these Restricted Share Units. The closing price of the Company's common stock on the grant date equals the grant date fair value of these nonvested Restricted Share Units awards and will be recognized as compensation expense over their vesting periods.
In the fourth quarter of 2011, the Company's Board of Directors approved grants of 164,808 performance-based Restricted Share Units. These Restricted Share Units are nonvested share awards which would vest 50% in 2014 and 50% in
98
Heartland Payment Systems, Inc. and Subsidiaries
Notes To Consolidated Financial Statements—(Continued)
2015 only if the Company achieves a diluted earnings per share compound annual growth rate ("CAGR") of seventeen percent (17%) for the two-year period ending December 31, 2013. Diluted earnings per share will be calculated on a Pro Forma basis to exclude non-operating gains and losses, if any, and exclude the after-tax impact of Stock Compensation Expense. For each 1% that the CAGR actually achieved by the Company for the two year period ending on December 31, 2013 is above the 17% target, the number of shares underlying the Restricted Share Units awarded would be increased by 3.09%; provided, however, that the maximum increase in the number of shares that may be awarded is 100%. Likewise, for each 1% that the CAGR actually achieved by the Company for the two-year period ending on December 31, 2013 is below the 17% target, the number of shares underlying the Restricted Share Units awarded would be decreased by 1.13%. If the target CAGR is missed by 80% or more, then the number of shares awarded is zero.
As of December 31, 2011, management believed that achieving the 17% two-year CAGR target was “more likely than not” to occur and began recording share-based compensation expense for these Restricted Share Units. The closing price of the Company's common stock on the grant date equals the grant date fair value of these nonvested Restricted Share Units awards and will be recognized as compensation expense over their vesting periods.
At December 31, 2011, there was a total of $17.3 million of unrecognized compensation expense related to unvested stock options and Restricted Share Units, which the Company expects to recognize over a weighted average period of 2.5 years.
Amended and Restated 2008 Equity Incentive Plan. In May 2010, the Company approved the Amended and Restated 2008 Equity Incentive Plan. The maximum number of share awards which may be granted under the Amended and Restated 2008 Equity Incentive Plan is 7,700,000, of which 1,269,568 stock options, 309,964 Restricted Share Units and 673,608 performance-based Restricted Share Units were granted during 2011 and 2010. The stock options and Restricted Share Units granted in 2011 and 2010 generally vest over four years, while the performance-based Restricted Share Units will vest only if, over the term of these Restricted Share Units, performance targets established for the years ended December 31, 2012, 2013 and 2014 are achieved. At December 31, 2011, 4,897,339 shares of the 7,700,000 authorized shares of common stock reserved for issuance under the Amended and Restated 2008 Equity Incentive Plan remain available for future grant.
Under the 2008 Equity Incentive Plan, 2,656,175 stock options and 362,360 Restricted Share Units were granted during 2009. Included in the stock options granted in 2009 were 930,000 stock options which would vest in accordance with multiple vesting provisions including four-year continuous service and market price conditions, while 1,696,175 stock options vest over four years and 30,000 stock options vested immediately. The 362,360 Restricted Share Units granted during 2009 vest over four years.
The stock options and Restricted Share Units were granted with terms of 5 years and an exercise price equal to the closing market price on the date of grant. The total intrinsic value of stock options exercised under the Amended and Restated 2008 Equity Incentive Plan during 2011 and 2010 was $6.7 million and $1.1 million, respectively. The total intrinsic value of Restricted Share Units vested under the Amended and Restated 2008 Equity Incentive Plan during 2011 and 2010 was $2.4 million and $1.5 million, respectively.
Amended and Restated 2000 Equity Incentive Plan. The Amended and Restated 2000 Equity Incentive Plan (the “2000 Equity Incentive Plan”) was replaced by in May 2008 by the 2008 Equity Incentive Plan. No awards were granted under the 2000 Equity Incentive Plan in 2011, 2010 or 2009. At December 31, 2011, 4,750 options were unvested and are expected to vest within 1 year. At December 31, 2011, there were 593,501 options outstanding under the 2000 Equity Incentive Plan.
The total intrinsic value of stock options exercised under the 2000 Equity Incentive Plan during 2011, 2010 and 2009 was $6.4 million, $6.1 million and $1.8 million, respectively.
Share-Based Plan Activity. During 2011 and 2010, employees exercised 1,133,974 and 927,473 stock options, respectively, to acquire the Company's common stock, generating $9.7 million and $6.3 million of stockholders' equity from the exercises and $3.5 million and $1.9 million of stockholders' equity related to tax deductions, which accrued to the Company as employees exercised non-qualified stock options and made disqualifying dispositions of shares acquired through the exercise of incentive stock options. Stock option and restricted share activity in the Company's share-based plans during 2009, 2010 and 2011 was as follows:
99
Heartland Payment Systems, Inc. and Subsidiaries
Notes To Consolidated Financial Statements—(Continued)
Stock Options | Restricted Share Units | Combined | |||||||||||||||||
Shares | Weighted-Average Exercise Price | Shares | Weighted-Average Grant Price | Shares | Weighted-Average Exercise/Grant Price | ||||||||||||||
Options Outstanding at January 1, 2009 | 5,308,173 | $ | 17.38 | — | $ | — | 5,308,173 | $ | 17.38 | ||||||||||
Issued | 2,656,175 | $ | 9.20 | 362,360 | $ | 9.12 | 3,018,535 | $ | 9.19 | ||||||||||
Exercised/vested | (226,852 | ) | $ | 6.66 | — | $ | — | (226,852 | ) | $ | 6.66 | ||||||||
Forfeited/cancelled | (227,432 | ) | $ | 17.88 | — | $ | — | (227,432 | ) | $ | 17.88 | ||||||||
Outstanding at December 31, 2009 | 7,510,064 | $ | 14.79 | 362,360 | $ | 9.12 | 7,872,424 | $ | 14.53 | ||||||||||
Options exercisable at December 31, 2009 | 2,242,560 | $ | 12.60 | — | $ | — | 2,242,560 | $ | 12.60 | ||||||||||
Issued | 1,238,000 | $ | 15.22 | 611,040 | $ | 16.50 | 1,849,040 | $ | 15.64 | ||||||||||
Exercised/vested | (927,473 | ) | $ | 8.38 | (89,690 | ) | $ | 9.09 | (1,017,163 | ) | $ | 8.44 | |||||||
Forfeited/cancelled | (366,425 | ) | $ | 22.49 | (3,600 | ) | $ | 12.16 | (370,025 | ) | $ | 22.39 | |||||||
Outstanding at December 31, 2010 | 7,454,166 | $ | 15.28 | 880,110 | $ | 14.23 | 8,334,276 | $ | 15.17 | ||||||||||
Options exercisable at December 31, 2010 | 1,782,475 | $ | 12.54 | — | $ | — | 1,782,475 | $ | 12.54 | ||||||||||
Issued | 31,568 | $ | 20.59 | 372,532 | $ | 22.02 | 404,100 | $ | 21.91 | ||||||||||
Exercised/vested | (1,133,974 | ) | $ | 8.54 | (112,480 | ) | $ | 10.59 | (1,246,454 | ) | $ | 8.72 | |||||||
Forfeited/cancelled | (385,695 | ) | $ | 20.39 | (37,060 | ) | $ | 16.35 | (422,755 | ) | $ | 20.04 | |||||||
Outstanding at December 31, 2011 | 5,966,065 | $ | 16.26 | 1,103,102 | $ | 17.11 | 7,069,167 | $ | 16.39 | ||||||||||
Options exercisable at December 31, 2011 | 2,264,769 | $ | 16.67 | — | $ | — | 2,264,769 | $ | 16.67 | ||||||||||
Stock options and Restricted Share Units which were outstanding at December 31, 2011 totaled 7,069,167 and had a weighted-average remaining contractual life of 2.3 years, a weighted average exercise/grant price of $16.39, and total intrinsic value of $76.2 million. Stock options which were exercisable at December 31, 2011 totaled 2,264,769 and had a weighted-average remaining contractual life of 1.9 years, a weighted average exercise price of $16.67, and total intrinsic value of $18.4 million. We have historically issued new shares to satisfy the exercise of options. Stock options and Restricted Share Units outstanding and exercisable at December 31, 2011 are summarized by exercise price below:
Outstanding | Exercisable | |||||||||||||||
Exercise price per share | Stock Options | Restricted Share Units | Total | Stock Options | Restricted Share Units | Total | ||||||||||
$5.00 to $8.88 | 1,832,081 | 168,000 | 2,000,081 | 688,556 | — | 688,556 | ||||||||||
$9.28 to $16.40 | 1,384,411 | 564,050 | 1,948,461 | 399,348 | — | 399,348 | ||||||||||
$18.00 to $27.40 | 2,621,373 | 371,052 | 2,992,425 | 1,048,665 | — | 1,048,665 | ||||||||||
$28.25 to $31.66 | 128,200 | — | 128,200 | 128,200 | — | 128,200 | ||||||||||
5,966,065 | 1,103,102 | 7,069,167 | 2,264,769 | — | 2,264,769 | |||||||||||
The table below summarizes stock options and Restricted Share Units outstanding at December 31, 2011 by their weighted average remaining contractual term:
Stock Options | Restricted Share Units | ||||||||
Exercise price per share | Outstanding | Average Remaining Contractual Term | Outstanding | Average Remaining Contractual Term | |||||
$5.00 to $8.88 | 1,832,081 | 2.2 years | 168,000 | 1.4 years | |||||
$9.28 to $16.40 | 1,384,411 | 3.4 years | 564,050 | 3.1 years | |||||
$18.00 to $27.40 | 2,621,373 | 1.6 years | 371,052 | 3.3 years | |||||
$28.25 to $31.66 | 128,200 | 0.5 years | — | — | |||||
5,966,065 | 2.2 years | 1,103,102 | 2.9 years | ||||||
100
Heartland Payment Systems, Inc. and Subsidiaries
Notes To Consolidated Financial Statements—(Continued)
16. Fair Value of Financial Instruments
The Company applies a fair value framework in order to measure and disclose its financial assets and liabilities which include fixed income equity securities, interest swap derivatives and certain other financial instruments. The Company determines fair value based on quoted prices when available or through the use of alternative approaches when market quotes are not readily accessible or available. The Company carries its liabilities at fair value, including its derivative liabilities.
The Company’s framework for measuring fair value provides a three-level hierarchy, which prioritizes the factors (inputs) used to calculate the fair value of assets and liabilities as follows:
• | Level 1 inputs are unadjusted quoted prices, such as a New York Stock Exchange closing price, in active markets for identical assets. Level 1 is the highest priority in the hierarchy. |
• | Level 2 inputs may include quoted prices for similar assets and liabilities in active markets, as well as other significant inputs that are observable at commonly quoted intervals, such as interest rates, foreign exchange rates, and yield curves. |
• | Level 3 inputs are unobservable and are based on company assumptions due to little, if any, observable market information. Level 3 is the lowest priority in the hierarchy. |
The following tables provide the assets and liabilities carried at fair value measured on a recurring basis as of December 31, 2011 and 2010:
December 31, 2011 | Total | Quoted Prices in Active Markets for Identical Assets (Level 1) | Significant Other Observable Inputs (Level 2) | ||||||||
Assets: | (in thousands) | ||||||||||
Investments available for sale: | |||||||||||
Fixed income bond fund (a) | $ | 1,158 | $ | 1,158 | $ | — | |||||
Investments held to maturity: | |||||||||||
Certificates of deposit | 2,505 | — | 2,505 | ||||||||
Total Assets | $ | 3,663 | $ | 1,158 | $ | 2,505 | |||||
Liabilities: | |||||||||||
Interest rate swaps | $ | 897 | — | $ | 897 | ||||||
Total Liabilities | $ | 897 | — | $ | 897 | ||||||
December 31, 2010 | Total | Quoted Prices in Active Markets for Identical Assets (Level 1) | Significant Other Observable Inputs (Level 2) | ||||||||
Assets: | (in thousands) | ||||||||||
Investments available for sale: | |||||||||||
Fixed income bond fund (a) | $ | 1,163 | $ | 1,163 | $ | — | |||||
Corporate bonds (a) | 170 | 170 | — | ||||||||
Investments held to maturity: | |||||||||||
Certificates of deposit | 1,516 | — | 1,516 | ||||||||
Total Assets | $ | 2,849 | $ | 1,333 | $ | 1,516 | |||||
(a) amounts included in Funds held for payroll customers on the Consolidated Balance Sheet
At December 31, 2011 and 2010, all investments in available-for-sale securities held by the Company were measured using Level 1 inputs and all held to maturity investments held by the Company were measured using Level 2 inputs.
The Company’s liabilities include interest rate swaps that are measured at fair value using observable market inputs
101
Heartland Payment Systems, Inc. and Subsidiaries
Notes To Consolidated Financial Statements—(Continued)
including the Company’s credit risk and its counterparties’ credit risks. Based on these inputs, the interest rate swaps are classified within Level 2 of the valuation hierarchy. Based on the Company’s continued ability to enter into these swaps, the Company considers the markets for its fair value instruments to be active.
The Company’s financial instruments also include cash and cash equivalents, cash held for payroll customers, accounts receivable, accounts payable and accrued liabilities. The carrying amount of these instruments approximates fair value because of their short-term nature.
17. Employee Benefit Plan
The Company offers a defined contribution plan to all employees. Company contributions are generally based upon fixed amounts of eligible compensation and the Company contributed approximately $1.6 million, $1.5 million and $1.5 million to the Plan for the years ended December 31, 2011, 2010 and 2009, respectively.
18. Commitments and Contingencies
Litigation—The Company is involved in ordinary course legal proceedings, which include all claims, lawsuits, investigations and proceedings, including unasserted claims, which are probable of being asserted, arising in the ordinary course of business and otherwise not described below. The Company has considered all such ordinary course legal proceedings in formulating its disclosures and assessments. In the opinion of the Company, based on consultations with outside counsel, material losses in addition to amounts previously accrued are not considered reasonably possible in connection with these ordinary course legal proceedings.
The Company has also been subject to lawsuits, claims, and investigations which resulted from the Processing System Intrusion. See Contingencies below and Note 3 for a description of the Processing System Intrusion.
Contingencies—The Company collects and stores sensitive data about its merchant customers and bankcard holders. If the Company’s network security is breached or sensitive merchant or cardholder data is misappropriated, the Company could be exposed to assessments, fines or litigation costs.
On January 20, 2009, the Company publicly announced the Processing System Intrusion. The Processing System Intrusion involved malicious software that appears to have been used to collect in-transit, unencrypted payment card data while it was being processed by the Company during the transaction authorization process. See Note 3, Processing System Intrusion for further detail.
Leases—The Company leases various office spaces and certain equipment under operating leases with remaining terms ranging up to ten years. The majority of the office space lease agreements contain renewal options and generally require the Company to pay certain operating expenses.
Future minimum lease payments for all non-cancelable leases as of December 31, 2011 were as follows:
For the Years Ended December 31, | Operating Leases (a) | ||||
(In thousands) | |||||
2012 | $ | 7,886 | |||
2013 | 5,827 | ||||
2014 | 4,287 | ||||
2015 | 2,189 | ||||
2016 | 1,866 | ||||
Thereafter | 4,556 | ||||
Total future minimum lease payments | $ | 26,611 | |||
(a) There were no material capital leases at December 31, 2011. | |||||
Rent expense for leased facilities and equipment was $9.1 million, $6.9 million and $5.0 million, respectively, for the years ended December 31, 2011, 2010, and 2009.
Commitments—Certain officers of the Company have entered into employee confidential information and non-
102
Heartland Payment Systems, Inc. and Subsidiaries
Notes To Consolidated Financial Statements—(Continued)
competition agreements under which they are entitled to severance pay equal to their base salary and medical benefits for twelve months and a pro-rated bonus in the event they are terminated by the Company other than for cause. There were no material payouts under these agreements in the year ended December 31, 2011.
The following table reflects the Company’s other significant contractual obligations, including leases from above, as of December 31, 2011:
Payments Due by Period | ||||||||||||||||||||
Contractual Obligations | Total | Less than 1 year | 1 to 3 Years | 3 to 5 years | More than 5 years | |||||||||||||||
(In thousands) | ||||||||||||||||||||
Processing providers (a) | $ | 25,623 | $ | 8,951 | $ | 11,629 | $ | 5,043 | $ | — | ||||||||||
Telecommunications providers | 4,078 | 3,766 | 312 | — | — | |||||||||||||||
Office and equipment leases | 26,611 | 7,886 | 10,114 | 4,055 | 4,556 | |||||||||||||||
Term Credit Facility (b) | 85,000 | 15,000 | 40,000 | 30,000 | — | |||||||||||||||
$ | 141,312 | $ | 35,603 | $ | 62,055 | $ | 39,098 | $ | 4,556 | |||||||||||
(a) | The Company has agreements with several third-party processors to provide to us on a non-exclusive basis payment processing and transmittal, transaction authorization and data capture services, and access to various reporting tools. Our agreements with third-party processors require the Company to submit a minimum monthly number of transactions or volume for processing. If the Company submits a number of transactions or volume that is lower than the minimum, it is required to pay the third-party processors the fees that they would have received if the Company had submitted the required minimum number or volume of transactions. |
(b) | Interest rates on the Term Credit Facility are variable in nature; however, in January 2011 we entered into fixed-pay amortizing interest rate swaps having a remaining notional amount at December 31, 2011 of $42.5 million. If interest rates were to remain at the December 31, 2011 level, we would make interest payments of $2.6 million in the next year, $3.4 million in the next 1 to 3 years and $0.5 million in the next 3 to 5 years or a total of $6.4 million including net settlements on the fixed-pay amortizing interest rate swaps. |
19. Segments
The determination of the Company's business segments is based on how the Company monitors and manages the performance of its operations. The Company's operating segments are strategic business units that offer different products and services. They are managed separately because each business requires different marketing strategies, personnel skill sets and technology.
The Company has two reportable segments, as follows: (1) Card, which provides payment processing and related services for bankcard transactions and (2) Other. The Card segment includes CPOS, our Canadian payments processing subsidiary, since March 2008, and Network Services since May 2008. Goodwill and intangible assets resulting from the acquisitions of CPOS and Network Services are reported in the Card segment. At December 31, 2011, goodwill related to CPOS and Network Services was $52.8 million. The Other segment includes Payroll, which provides payroll and related tax filing services, PrepaidCard, which provides prepaid card, stored-value card and loyalty and gift card solutions, and Heartland School Solutions, which provides point-of-sale platforms designed to facilitate food service operations. None of these Other segments meet the defined thresholds for determining individually reportable segments. Goodwill and intangible assets resulting from the acquisitions of Debitek, General Meters, Chockstone, Lunchbox, Comalex, mySchoolBucks and School-Link are reported in the Other segment. At December 31, 2011, total goodwill in the Other segment was $50.6 million.
The Company allocates revenues, expenses, assets and liabilities to segments only where directly attributable. The unallocated corporate administration amounts are costs attributed to finance, corporate administration, human resources and corporate services. At December 31, 2011 and 2010, 33% and 47% respectively, of the Other segment's total assets were funds that the Company holds as a fiduciary in its Payroll services activities for payment to taxing authorities. Reconciling items include eliminations of intercompany investments and receivables.
103
Heartland Payment Systems, Inc. and Subsidiaries
Notes To Consolidated Financial Statements—(Continued)
A summary of the Company’s segments for the three years ended December 31, 2011, 2010, and 2009 was as follows:
Card Segment | Other Segment | Unallocated Corporate Administration Amounts | Reconciling Items | Total Amount | |||||||||||||||
(In thousands) | |||||||||||||||||||
Year Ended December 31, 2011 | |||||||||||||||||||
Total revenues | $ | 1,940,512 | $ | 56,650 | $ | — | $ | (212 | ) | $ | 1,996,950 | ||||||||
Depreciation and amortization | 23,775 | 3,591 | 471 | — | 27,837 | ||||||||||||||
Interest income | 177 | — | — | — | 177 | ||||||||||||||
Interest expense | 4,332 | 5 | — | (212 | ) | 4,125 | |||||||||||||
Net income (loss) attributable to Heartland | 69,852 | 3,545 | (29,458 | ) | — | 43,939 | |||||||||||||
Total assets | 624,772 | 130,071 | — | (157,922 | ) | 596,921 | |||||||||||||
Year Ended December 31, 2010 | |||||||||||||||||||
Total revenues | $ | 1,824,340 | $ | 40,205 | $ | — | $ | (208 | ) | $ | 1,864,337 | ||||||||
Depreciation and amortization | 22,537 | 2,927 | 556 | — | 26,020 | ||||||||||||||
Interest income | 148 | — | — | — | 148 | ||||||||||||||
Interest expense | 4,963 | 19 | — | (204 | ) | 4,778 | |||||||||||||
Net income (loss) attributable to Heartland | 56,611 | (291 | ) | (21,783 | ) | — | 34,537 | ||||||||||||
Total assets | 640,722 | 77,557 | — | (156,815 | ) | 561,464 | |||||||||||||
Year Ended December 31, 2009 | |||||||||||||||||||
Total revenues | $ | 1,620,559 | $ | 31,776 | $ | — | $ | (196 | ) | $ | 1,652,139 | ||||||||
Depreciation and amortization | 19,045 | 2,077 | 748 | — | 21,870 | ||||||||||||||
Interest income | 117 | — | — | — | 117 | ||||||||||||||
Interest expense | 2,839 | 40 | — | (181 | ) | 2,698 | |||||||||||||
Net income (loss) attributable to Heartland | (24,762 | ) | (138 | ) | (26,896 | ) | — | (51,796 | ) | ||||||||||
Total assets | 658,292 | 56,860 | — | (152,946 | ) | 562,206 | |||||||||||||
20. Earnings Per Share
The Company presents earnings per share data following the established standards for the computation and presentation of basic and diluted earnings per share data. Under these standards, the dilutive effect of stock options is excluded from the calculation of basic earnings per share but included in diluted earnings per share. The following is a reconciliation of the amounts used to calculate basic and diluted earnings per share:
Year Ended December 31, | |||||||||||
2011 | 2010 | 2009 | |||||||||
(in thousands, except per share) | |||||||||||
Basic: | |||||||||||
Net income (loss) attributable to Heartland | $ | 43,939 | $ | 34,537 | $ | (51,796 | ) | ||||
Weighted average common stock outstanding | 38,931 | 37,994 | 37,483 | ||||||||
Earnings (loss) per share | $ | 1.13 | $ | 0.91 | $ | (1.38 | ) | ||||
Diluted: | |||||||||||
Net income (loss) attributable to Heartland | $ | 43,939 | $ | 34,537 | $ | (51,796 | ) | ||||
Basic weighted average common stock outstanding | 38,931 | 37,994 | 37,483 | ||||||||
Effect of dilutive instruments: | |||||||||||
Stock options and restricted share units | 1,302 | 1,316 | 545 | ||||||||
Diluted weighted average shares outstanding | 40,233 | 39,310 | 38,028 | ||||||||
Earnings (loss) per share | $ | 1.09 | $ | 0.88 | $ | (1.38 | ) | ||||
(a) Due to the net loss in the 2009 period, calculating Diluted Earnings Per Share using diluted weighted average shares
would be anti-dilutive. Therefore, weighted average common stock outstanding was used to calculate Diluted Earnings
Per Share for the 2009 period.
104
Heartland Payment Systems, Inc. and Subsidiaries
Notes To Consolidated Financial Statements—(Continued)
21. Quarterly Consolidated Results of Operations (Unaudited)
The Company's unaudited quarterly results of operations for the years ended December 31, 2011 and 2010 were as follows:
For the Quarter Ended | ||||||||||||||||
March 31, 2011 | June 30, 2011 | September 30, 2011 | December 31, 2011 | |||||||||||||
(In thousands, except per share data) | ||||||||||||||||
Total revenues | $ | 467,646 | $ | 525,977 | $ | 531,904 | $ | 471,423 | ||||||||
Costs of services | 423,038 | 474,948 | 478,038 | 412,219 | ||||||||||||
General and administrative expenses | 30,046 | 29,377 | 32,244 | 39,057 | ||||||||||||
Total expenses | 453,084 | 504,325 | 510,282 | 451,276 | ||||||||||||
Income from operations | 14,562 | 21,652 | 21,622 | 20,147 | ||||||||||||
Net income attributable to Heartland | 7,815 | 12,258 | 12,646 | 11,220 | ||||||||||||
Earnings per share | 0.20 | 0.31 | 0.31 | 0.28 | ||||||||||||
For the Quarter Ended | ||||||||||||||||
March 31, 2010 | June 30, 2010 | September 30, 2010 | December 31, 2010 | |||||||||||||
(In thousands, except per share data) | ||||||||||||||||
Total revenues | $ | 411,156 | $ | 475,881 | $ | 499,074 | $ | 478,226 | ||||||||
Costs of services | 381,457 | 436,637 | 459,397 | 436,543 | ||||||||||||
General and administrative expenses | 27,100 | 24,094 | 25,479 | 27,415 | ||||||||||||
Total expenses | 408,557 | 460,731 | 484,876 | 463,958 | ||||||||||||
Income from operations | 2,599 | 15,150 | 14,198 | 14,268 | ||||||||||||
Net income attributable to Heartland | 14,228 | 6,143 | 7,533 | 6,633 | ||||||||||||
Earnings per share | 0.36 | 0.16 | 0.19 | 0.17 | ||||||||||||
ITEM 9. CHANGES IN AND DISAGREEMENTS WITH ACCOUNTANTS ON ACCOUNTING AND FINANCIAL DISCLOSURE
None.
ITEM 9A. | CONTROLS AND PROCEDURES |
Evaluation of Disclosure Controls and Procedures
Under the supervision and with the participation of our management, including our Chief Executive Officer (“CEO”) and Chief Financial Officer (“CFO”) we evaluated the effectiveness of our disclosure controls and procedures, as such term is defined in Rule 13a-15(e) and Rule 15d-15(e) under the Exchange Act, as of December 31, 2011. Based upon that evaluation, our CEO and CFO concluded that, as of the end of the period covered by this report, our disclosure controls and procedures were effective.
Management Annual Report on Internal Control over Financial Reporting
Our management team is responsible for establishing and maintaining adequate internal control over financial reporting as defined in Rules 13a-15(f) and 15d-15(f) under the Exchange Act.
Our internal control over financial reporting includes those policies and procedures that:
• | Pertain to the maintenance of records that, in reasonable detail, accurately and fairly reflect the transactions and dispositions of the assets of the Company; |
• | Provide reasonable assurance that transactions are recorded as necessary to permit preparation of financial statements |
105
in accordance with generally accepted accounting principles, and that our receipts and expenditures are being made only in accordance with authorizations of the Company's management and directors; and
• | Provide reasonable assurance regarding prevention or timely detection of unauthorized acquisition, use or disposition of our assets that could have a material effect on the financial statements. |
Any system of internal control over financial reporting, however well designed and operated, may not prevent or detect all misstatements. Internal control over financial reporting is a process that involves human diligence and compliance and is subject to lapses in judgment and breakdowns resulting from human failures. In addition, the design of any control system is based, in part, upon certain assumptions about the likelihood of future events. Because of these and other inherent limitations of internal control systems, there is only reasonable assurance that the Company's system of internal control over financial reporting will succeed in achieving its goals under all potential future conditions.
Our management assessed the effectiveness of the Company's internal control over financial reporting as of December 31, 2011. In making this assessment, our management used the criteria set forth by the Committee of Sponsoring Organizations of the Treadway Commission (COSO) in Internal Control-Integrated Framework. As of December 31, 2011, management believes that the Company's internal control over financial reporting is effective based on this assessment and those criteria.
The effectiveness of the Company's internal control over financial reporting as of December 31, 2011 has been audited by Deloitte & Touche LLP, an independent registered public accounting firm, as stated in their report which is presented in the Annual Report on Form 10-K.
Changes in Internal Control Over Financial Reporting
There has been no change in the Company's internal controls over financial reporting as defined in Rule 13a-15(f) under the Exchange Act identified in connection with the evaluation required by Rule 13a-15(d) of the Exchange Act that occurred during our last fiscal quarter in the period covered by this Annual Report on Form 10-K that has materially affected, or is reasonably likely to materially affect, the Company's internal controls over financial reporting.
ITEM 9B. OTHER INFORMATION
None.
PART III
ITEM 10. DIRECTORS, EXECUTIVE OFFICERS AND CORPORATE GOVERNANCE
The information required to be included in Item 10 of Part III of this Form 10-K is incorporated herein by reference to certain information contained in our definitive proxy statement for our 2012 Annual Meeting of Stockholders to be filed with the SEC not later than 120 days after the end of the fiscal year covered by this report.
ITEM 11. EXECUTIVE COMPENSATION
The information required to be included in Item 11 of Part III of this Form 10-K is incorporated herein by reference to certain information contained in our definitive proxy statement for our 2012 Annual Meeting of Stockholders to be filed with the SEC not later than 120 days after the end of the fiscal year covered by this report.
ITEM 12. SECURITY OWNERSHIP OF CERTAIN BENEFICIAL OWNERS AND MANAGEMENT AND RELATED STOCKHOLDER MATTERS
The information required to be included in Item 12 of Part III of this Form 10-K is incorporated herein by reference to certain information contained in our definitive proxy statement for our 2012 Annual Meeting of Stockholders to be filed with the SEC not later than 120 days after the end of the fiscal year covered by this report.
ITEM 13. CERTAIN RELATIONSHIPS AND RELATED TRANSACTIONS, AND DIRECTOR INDEPENDENCE
The information required to be included in Item 13 of Part III of this Form 10-K is incorporated herein by reference to certain information contained in our definitive proxy statement for our 2012 Annual Meeting of Stockholders to be filed with
106
the SEC not later than 120 days after the end of the fiscal year covered by this report.
ITEM 14. PRINCIPAL ACCOUNTING FEES AND SERVICES
The information required to be included in Item 14 of Part III of this Form 10-K is incorporated herein by reference to certain information contained in our definitive proxy statement for our 2012 Annual Meeting of Stockholders to be filed with the SEC not later than 120 days after the end of the fiscal year covered by this report.
PART IV
ITEM 15. EXHIBITS AND FINANCIAL STATEMENT SCHEDULES
1. Consolidated Financial Statements
Our consolidated financial statements listed below are set forth in “Item 8-Financial Statements and Supplementary Data” of this report:
Page | |||
2. Financial Statement Schedules
All schedules to our consolidated financial statements have been omitted because they are not required under the related instruction or are inapplicable, or because we have included the required information in our consolidated financial statements or related notes.
3. Exhibits
The following exhibits either (i) are filed with this report or (ii) have previously been filed with the SEC and are incorporated in this Item 15 by reference to those prior filings.
107
Exhibit Number | Description |
2.2 | Agreement and Plan of Merger dated September 29, 2000 by and among Heartland Payment Systems, Inc., Uhle and Associates, LLC, Martin J. Uhle, Mark K. Strippy and Steven B. Gamary. (Incorporated by reference to Exhibit 2.2 to the Registrant's Annual Report on Form 10 filed on August 9, 2005). |
2.3 | Agreement and Plan of Merger dated September 29, 2000 by and between Heartland Payment Systems, Inc. and Triad LLC. (Incorporated by reference to Exhibit 2.2 to the Registrant's Annual Report on Form 10 filed on August 9, 2005). |
2.4 | Agreement and Plan of Merger dated as of December 28, 2000 by and between Heartland Payment Systems, Inc. and Heartland Payment Systems L.L.C. (Incorporated by reference to Exhibit 2.2 to the Registrant's Annual Report on Form 10 filed on August 9, 2005). |
2.5 | Agreement of Merger dated as of June 14, 2004 by and between Heartland Payment Systems, Inc. and Credit Card Software Systems, Inc. (Incorporated by reference to Exhibit 2.2 to the Registrant's Annual Report on Form 10 filed on August 9, 2005). |
3.1 | Amended and Restated Certificate of Incorporation of Heartland Payment Systems, Inc. (Incorporated by reference to Exhibit 3.3 in the Registrant's Registration Statement on Form S-1, as amended (333-118073)). |
3.2 | Amended and Restated By-Laws of Heartland Payment Systems, Inc. (Incorporated by reference to Exhibit 3.2 to the Registrant's Annual Report on Form 10-K filed on March 10, 2008 (File No. 001-32594)). |
4.2 | Registration Rights Agreement dated August 2, 2005 (Incorporated by reference to Exhibit 4.2 in the Registrant's Form 8-A filed on August 4, 2005). |
10.1 | Revolver Advance and Purpose and Ability Line of Credit Loan Agreement dated August 28, 2002 between Heartland Payment Systems, Inc. and KeyBank National Association (Incorporated by reference to Exhibit 10.1 in the Registrant's Registration Statement on Form S-1, as amended (333-118073)). |
10.2 | First Amendment to the Revolver Advance and Purpose and Ability Line of Credit Loan Agreement dated November 6, 2003 between Heartland Payment Systems, Inc. and KeyBank National Association (Incorporated by reference to Exhibit 10.2 in the Registrant's Registration Statement on Form S-1, as amended (333-118073)). |
10.3 | Second Amendment to the Revolver Advance and Purpose and Ability Line of Credit Loan Agreement dated June 23, 2004 between Heartland Payment Systems, Inc. and KeyBank National Association (Incorporated by reference to Exhibit 10.3 in the Registrant's Registration Statement on Form S-1, as amended (333-118073)). |
10.4 | Revolver Advance Note dated August 28, 2002 payable by Heartland Payment Systems, Inc. to KeyBank National Association in a principal amount of $3,500,000.00 (Incorporated by reference to Exhibit 10.4 in the Registrant's Registration Statement on Form S-1, as amended (333-118073)). |
10.5 | Purpose and Ability Line of Credit Note dated August 28, 2002 payable by Heartland Payment Systems, Inc. to KeyBank National Association in a principal amount of $3,000,000 (Incorporated by reference to Exhibit 10.5 in the Registrant's Registration Statement on Form S-1, as amended (333-118073)). |
10.6 | Processing Services Agreement dated April 1, 2002 between Vital Processing Services L.L.C. and Heartland Payment Systems, Inc., as amended (Incorporated by reference to Exhibit 10.6 in the Registrant's Registration Statement on Form S-1, as amended (333-118073)). |
10.7 | Merchant Processing Agreement dated April 1, 2002 between KeyBank National Association and Heartland Payment Systems, Inc., as amended (Incorporated by reference to Exhibit 10.7 in the Registrant's Registration Statement on Form S-1, as amended (333-118073)). |
10.8 | Withdrawal and Redemption Agreement dated May 8, 2000, among Heartland Payment Systems, LLC, Triad LLC, Heartland Bank and Heartland Card Company (Incorporated by reference to Exhibit 10.8 in the Registrant's Registration Statement on Form S-1, as amended (333-118073)). |
10.9 | Office Lease Agreement, dated September 6, 2002, between Heartland Payment Systems, Inc. and PSN Partners, L.P. for 47 Hulfish Street, Suite 400, Princeton, New Jersey 08540 (Incorporated by reference to Exhibit 10.9 in the Registrant's Registration Statement on Form S-1, as amended (333-118073)). |
10.10 | Lease Agreement, dated August 16, 2003 between Heartland Payment Systems, Inc. and Youngstown Partners, LLC for 1431 Youngstown Shopping Center, Jeffersonville, Indiana 47130 (Incorporated by reference to Exhibit 10.10 in the Registrant's Registration Statement on Form S-1, as amended (333-118073)). |
108
Exhibit Number | Description |
10.11 | Lease Agreement, dated April 30, 2002 between Heartland Payment Systems, Inc. and Youngstown Partners, L.P. for 1431 1/2 and 1433 Youngstown Shopping Center, Jeffersonville, Indiana 47130 (Incorporated by reference to Exhibit 10.11 in the Registrant's Registration Statement on Form S-1, as amended (333-118073)). |
10.12 | Lease Agreement, dated April 30, 2002 between Heartland Payment Systems, Inc. and Youngstown Partners L.P. for 1437 and 1443 Youngstown Shopping Center, Jeffersonville, Indiana 47130 (Incorporated by reference to Exhibit 10.12 in the Registrant's Registration Statement on Form S-1, as amended (333-118073)). |
10.13 | Lease Agreement, dated March 6, 2003, between Heartland Payment Systems, Inc. and Youngstown Partners, L.P. for 1441 Youngstown Shopping Center, Jeffersonville, Indiana 47130 (Incorporated by reference to Exhibit 10.13 in the Registrant's Registration Statement on Form S-1, as amended (333-118073)). |
10.14 | Lease Agreement, dated February 14, 2002 between Heartland Payment Systems, Inc. and Youngstown Partners, L.P. for 1443 Youngstown Shopping Center, Jeffersonville, Indiana 47130 (Incorporated by reference to Exhibit 10.14 in the Registrant's Registration Statement on Form S-1, as amended (333-118073)). |
10.15 | Office Building Lease, dated May 1998, between Heartland Card Services, L.L.C. and Hall Stonebriar Center I Associates, Ltd. for 2595 Dallas Parkway, Frisco, Texas 75034 (Incorporated by reference to Exhibit 10.15 in the Registrant's Registration Statement on Form S-1, as amended (333-118073)). |
10.16 | First Amendment to Office Building Lease, dated September 30, 1998, between Heartland Card Services, L.L.C. and Hall Stonebriar Center I Associates, Ltd. (Incorporated by reference to Exhibit 10.16 in the Registrant's Registration Statement on Form S-1, as amended (333-118073)). |
10.17 | Second Amendment to Office Lease Agreement, dated July 25, 2000, between Heartland Card Services, L.L.C. and Hall Stonebriar Center I Associates, Ltd. (Incorporated by reference to Exhibit 10.17 in the Registrant's Registration Statement on Form S-1, as amended (333-118073)). |
10.18 | Third Amendment to Office Building Lease, dated October 4, 2002, between Heartland Card Services, L.L.C. and Hall Stonebriar Center I Associates, Ltd. (Incorporated by reference to Exhibit 10.18 in the Registrant's Registration Statement on Form S-1, as amended (333-118073)). |
10.19 | Lease Agreement dated September 2004, between Heartland Payment Systems, Inc. and Bank of America, N.A. for 90 Nassau Street, Princeton, New Jersey 08542 (Incorporated by reference to Exhibit 10.19 in the Registrant's Registration Statement on Form S-1, as amended (333-118073)). |
10.20 | First Amendment to Lease Agreement, dated March 17, 2005, between Heartland Payment Systems, Inc. and First State Investors 5200, LLC for 90 Nassau Street, Princeton, New Jersey 08542 (Incorporated by reference to Exhibit 10.20 in the Registrant's Registration Statement on Form S-1, as amended (333-118073)). |
10.21** | Heartland Payment Systems, Inc. Amended and Restated 2000 Equity Incentive Plan (Incorporated by reference to Exhibit 10.21 in the Registrant's Registration Statement on Form S-1, as amended (333-118073)). |
10.22** | Form of Employee Incentive Stock Option Agreement Under 2000 Equity Incentive Plan (Incorporated by reference to Exhibit 10.22 in the Registrant's Registration Statement on Form S-1, as amended (333-118073)). |
10.23** | Heartland Payment Systems, Inc. 2002 PEPShares Plan (Incorporated by reference to Exhibit 10.23 in the Registrant's Registration Statement on Form S-1, as amended (333-118073)). |
10.24** | Amendment to Heartland Payment Systems, Inc. 2002 PEPShares Plan (Incorporated by reference to Exhibit 10.24 in the Registrant's Registration Statement on Form S-1, as amended (333-118073)). |
10.25** | Form of Stock Option Agreement Under 2002 PEPShares Plan (Incorporated by reference to Exhibit 10.25 in the Registrant's Registration Statement on Form S-1, as amended (333-118073)). |
10.26 | Form of Indemnification Agreement (Incorporated by reference to Exhibit 10.26 in the Registrant's Registration Statement on Form S-1, as amended (333-118073)). |
10.27 | Third Amendment to the Revolver Advance and Purpose and Ability Line of Credit Loan Agreement dated May 26, 2005 between Heartland Payment Systems, Inc. and KeyBank National Association (incorporated by reference to Exhibit 10.28 of the Registrant's Amendment No. 1 to Form 10-12G/A, File No. 000-51265, filed on June 22, 2005) (Incorporated by reference to Exhibit 10.27 in the Registrant's Registration Statement on Form S-1, as amended (333-118073)). |
10.28** | Heartland Payment Systems, Inc. Second Amended and Restated 2000 Equity Incentive Plan (Incorporated by reference to Exhibit 10.28 in the Registrant's Registration Statement on Form S-1, as amended (333-118073)). |
10.29 | Merchant Portfolio Purchase Agreement dated September 22, 2005 between Heartland Payment Systems, Inc. and Certegy Payment Systems, Inc. (Incorporated by reference to Exhibit 10.29 to the Registrant's Quarterly Report on Form 10-Q filed on November 14, 2005 (File No. 001-32594)). |
109
Exhibit Number | Description |
10.30** | Letter Agreement dated February 22, 2006 between Robert O. Carr and Thomas Sheridan. (Incorporated by reference to Exhibit 10.30 to the Registrant's Current Report on Form 8-K filed on February 22, 2006). |
10.31** | Option Agreement dated July 31, 2003 between Robert O. Carr and Greenhill Capital Partners, L.P. and its affiliated investment funds, and LLR Equity Partners, L.P. and its affiliated investment fund. (Incorporated by reference to Exhibit 10.31 to the Registrant's Annual Report on Form 10-K filed on March 14, 2006 (File No. 001-32594)). |
10.32** | Form of Nonqualified Stock Option Agreement. (Incorporated by reference to Exhibit 10.32 to the Registrant's Quarterly Report on Form 10-Q filed on August 11, 2006 (File No. 001-32594)). |
10.33** | Letter Agreement dated May 8, 2006 between Heartland Payment Systems, Inc. and Michael C. Hammer concerning terms of employment. (Incorporated by reference to Exhibit 10.33 to the Registrant's Quarterly Report on Form 10-Q filed on August 11, 2006 (File No. 001-32594)). |
10.34** | Form of Employee Confidential Information and Noncompetition Agreement entered into by each of Robert O. Carr, Robert H.B. Baldwin, Jr., Brooks L. Terrell and Sanford C. Brown with Heartland Payment Systems, Inc. (Incorporated by reference to Exhibit 10.34 to the Registrant's Quarterly Report on Form 10-Q filed on August 11, 2006 (File No. 001-32594)). |
10.35** | Supplement No. I to Employee Confidential Information and Noncompetition Agreement by and between Robert H.B. Baldwin, Jr. and Heartland Payment Systems, Inc. (Incorporated by reference to Exhibit 10.35 to the Registrant's Quarterly Report on Form 10-Q filed on August 11, 2006 (File No. 001-32594)). |
10.36** | Employee Confidential Information and Noncompetition Agreement entered into December 1, 2004 by and between Thomas M. Sheridan and Heartland Payment Systems, Inc. (Incorporated by reference to Exhibit 10.36 to the Registrant's Quarterly Report on Form 10-Q filed on August 11, 2006 (File No. 001-32594)). |
10.37** | Amended and Restated Employee Confidential Information and Noncompetition Agreement dated May 4, 2007 entered into by Robert O. Carr with Heartland Payment Systems, Inc. (Incorporated by reference to Exhibit 10.37 to the Registrant's Current Report on Form 8-K filed on May 4, 2007). |
10.38** | Amended and Restated Employee Confidential Information and Noncompetition Agreement dated May 4, 2007 entered into by Sanford C. Brown with Heartland Payment Systems, Inc. (Incorporated by reference to Exhibit 10.38 to the Registrant's Current Report on Form 8-K filed on May 4, 2007). |
10.39** | Amended and Restated Employee Confidential Information and Noncompetition Agreement dated May 4, 2007 entered into by Brooks L. Terrell with Heartland Payment Systems, Inc. (Incorporated by reference to Exhibit 10.39 to the Registrant's Current Report on Form 8-K filed on May 4, 2007). |
10.40 | Credit Agreement dated as of September 5, 2007, among Heartland Payment Systems, Inc., a Delaware corporation, the Lenders party thereto from time to time, and JPMorgan Chase Bank, N.A., as Administrative Agent. (Incorporated by reference to Exhibit 10.1 to the Registrant's Current Report on Form 8-K filed on September 5, 2007). |
10.41 | American Express Establishment Sales and Servicing Program Agreement dated as of December 20, 2007 between Heartland Payment Systems, Inc. and American Express Travel Related Services Company. (Incorporated by reference to Exhibit 10.41 to the Registrant's Annual Report on Form 10-K filed on March 10, 2008 (File No. 001-32594)). |
10.42** | Heartland Payment Systems, Inc. 2008 Equity Incentive Plan. (Incorporated by reference to Exhibit 10.1 to the Registrant's Quarterly Report on Form 10-Q filed on August 8, 2008 (File No. 001-32594)). |
10.43 | Amended and Restated Credit Agreement dated as of May 30, 2008, among Heartland Payment Systems, Inc., a Delaware corporation, the Lenders party thereto from time to time, and JPMorgan Chase Bank, N.A., as Administrative Agent. (Incorporated by reference to Exhibit 10.43 to the Registrant's Annual Report Amendment No. 3 on Form 10-K/A filed on July 10, 2009). |
10.44 | Membership Interest and Asset Purchase Agreement dated as of May 2, 2008, by and among Alliance Data Network Services LLC, a Delaware limited liability company, ADS Alliance Data Systems, Inc., a Delaware corporation, Alliance Data Systems Corporation, a Delaware corporation, Heartland Acquisition, LLC, a Delaware limited liability company, and Heartland Payment Systems, Inc., a Delaware corporation. (Incorporated by reference to Exhibit 10.1 to the Registrant's Current Report on Form 8-K filed on May 8, 2008). |
10.45** | Form of Employee Incentive Stock Option Agreement Under 2008 Equity Incentive Plan. (Incorporated by reference to Exhibit 4.5 to the Registrant's Registration Statement on Form S-8 filed on November 19, 2008 (File No. 333-155450)). |
10.46** | Form of Employee Restricted Stock Unit Agreement. (Incorporated by reference to Exhibit 10.46 to the Registrant's Quarterly Report on Form 10-Q filed on August 7, 2009 (File No. 001-32594)). |
10.47** | Amendment No. I to Amended and Restated Employee Confidential Information and Noncompetition Agreement dated May 11, 2009 entered into by Robert O. Carr with Heartland Payment Systems, Inc. (Incorporated by reference to Exhibit 10.47 to the Registrant's Quarterly Report on Form 10-Q filed on August 7, 2009). |
110
Exhibit Number | Description |
10.48** | Performance-Based Stock Option Agreement under the 2008 Equity Incentive Plan dated May 11, 2009 between Heartland Payment Systems, Inc. and Robert O. Carr. (Incorporated by reference to Exhibit 10.48 to the Registrant's Quarterly Report on Form 10-Q filed on August 7, 2009). |
10.49** | Performance-Based Stock Option Agreement under the 2008 Equity Incentive Plan dated May 11, 2009 between Heartland Payment Systems, Inc. and Robert O. Carr. (Incorporated by reference to Exhibit 10.49 to the Registrant's Quarterly Report on Form 10-Q filed on August 7, 2009). |
10.50 | Amendment No. I and Limited Waiver dated August 3, 2009 to the Amended and Restated Credit Agreement dated May 30, 2008, among Heartland Payment Systems, Inc., a Delaware corporation, the Lenders party thereto from time to time, and JPMorgan Chase Bank, N.A., as Administrative Agent, Swingline Lender, and Issuing Bank. (Incorporated by reference to Exhibit 10.50 to the Registrant's Quarterly Report on Form 10-Q filed on August 7, 2009). |
10.51 | Pledge and Security Agreement dated as of August 3, 2009, by and among Heartland Payment Systems, Inc., a Delaware corporation, The Heartland Payroll Company, L.L.C., an Ohio limited liability company, Debitek, Inc., a Delaware corporation, Heartland Acquisition, LLC, a Delaware limited liability company, and JPMorgan Chase Bank, N.A., as administrative agent for the lenders from time to time party to the Credit Agreement. (Incorporated by reference to Exhibit 10.51 to the Registrant's Quarterly Report on Form 10-Q filed on August 7, 2009). |
10.52 | Amended and Restated Credit Agreement dated as of May 30, 2008, among Heartland Payment Systems, Inc., a Delaware corporation, the Lenders party thereto from time to time, and JPMorgan Chase Bank, N.A., as Administrative Agent. (Incorporated by reference to Exhibit 10.1 to the Registrant's Current Report on Form 8-K filed on June 4, 2008). |
10.53 | Settlement Agreement dated as of January 7, 2010, is by and among Visa U.S.A. Inc., a Delaware corporation, Visa International Service Association, a Delaware corporation, and Visa Inc., a Delaware corporation, Heartland Payment Systems, Inc., a Delaware corporation, Keybank National Association, a national bank organized and existing under the laws of the United States, and Heartland Bank, a Missouri banking corporation. (Incorporated by reference to Exhibit 10.1 to the Registrant's Current Report on Form 8-K filed on January 8, 2010). |
10.54 | Amendment No. 1 dated February 3, 2010 to the Settlement Agreement dated as of January 7, 2010, by and among Visa U.S.A. Inc., a Delaware corporation, Visa International Service Association, a Delaware corporation, and Visa Inc., a Delaware corporation, Heartland Payment Systems, Inc., a Delaware corporation, Keybank National Association, a national bank organized and existing under the laws of the United States, and Heartland Bank, a Missouri banking corporation. (Incorporated by reference to Exhibit 10.1 to the Registrant's Current Report on Form 8-K filed on February 4, 2010). |
10.55 | Agreement of Settlement and Release, dated December 17, 2009, by and between Heartland Payment Systems, Inc., a Delaware corporation, and American Express Travel Related Services Company, Inc., a New York Corporation (Incorporated by reference to Exhibit 10.55 to the Registrant's Annual Report on Form 10-K filed on March 10, 2010). |
10.56 | Bridge Loan Agreement dated as of February 18, 2010 among Heartland Payment Systems, Inc., KeyBank National Association, as administrative agent, and KeyBank National Association and Heartland Bank as bridge lenders. (Incorporated by reference to Exhibit 10.1 to the Registrant's Current Report on Form 8-K filed on February 24, 2010). |
10.57 | Amendment No. 2 and Amended and Restated Credit Agreement and Partial Release of Collateral dated as of February 18, 2010, among Heartland Payment Systems, Inc., the lenders party thereto and JPMorgan Chase Bank, N.A., as administrative agent, swingline lender and issuing bank. (Incorporated by reference to Exhibit 10.2 to the Registrant's Current Report on Form 8-K filed on February 24, 2010). |
10.58 | Commitment Increase Agreement between Heartland Payment Systems, Inc, and KeyBank National Association, and accepted by JPMorgan Chase Bank, N.A. as administrative agent. (Incorporated by reference to Exhibit 10.3 to the Registrant's Current Report on Form 8-K filed on February 24, 2010). |
10.59** | Amendment and Restatement of Heartland Payment Systems, Inc.'s 2008 Equity Incentive Plan (Incorporated by reference to Exhibit 10.1 to the Company's Current Report on Form 8-K filed on May 18, 2010). |
10.60 | Settlement Agreement between Heartland Payment Systems, Inc. and MasterCard International Incorporated dated May 19, 2010 (Incorporated by reference to Exhibit 10.1 to the Company's Current Report on Form 8-K filed on May 19, 2010). |
10.61 | Amendment No.1 dated as of July 2, 2010 to the Settlement Agreement dated as of May 19, 2010 by and between MasterCard International Incorporated, a Delaware corporation and Heartland Payment Systems, Inc., a Delaware corporation. (Incorporated by reference to Exhibit 10.1 to the Registrant's Form 10-Q filed on November 8, 2010). |
10.62 | Amendment No.2 dated as of July 13, 2010 to the Settlement Agreement dated as of May 19, 2010, as amended by amendment dated July 2, 2010, by and between MasterCard International Incorporated, a Delaware corporation and Heartland Payment Systems, Inc., a Delaware corporation. (Incorporated by reference to Exhibit 10.2 to the Registrant's Form 10-Q filed on November 8, 2010). |
111
Exhibit Number | Description |
10.63 | Amendment No.3 dated as of August 6, 2010 to the Settlement Agreement dated as of May 19, 2010, as amended by amendments dated July 2, 2010 and July 13, 2010, by and between MasterCard International Incorporated, a Delaware corporation and Heartland Payment Systems, Inc., a Delaware corporation. (Incorporated by reference to Exhibit 10.3 to the Registrant's Form 10-Q filed on November 8, 2010). |
10.64 | Waiver Agreement dated as of August 27, 2010, by and among MasterCard International Incorporated, a Delaware corporation and Heartland Payment Systems, Inc., a Delaware corporation. (Incorporated by reference to Exhibit 10.4 to the Registrant's Form 10-Q filed on November 8, 2010). |
10.65 | Agreement of Settlement and Release, effective as of August 31, 2010, is entered into by and between Heartland Payment Systems, Inc., a Delaware corporation, and DFS Services LLC, a Delaware corporation. (Incorporated by reference to Exhibit 10.5 to the Registrant's Form 10-Q filed on November 8, 2010). |
10.66 | Second Amended and Restated Credit Agreement dated as of November 24, 2010, among Heartland Payment Systems, Inc., a Delaware corporation, the Lenders party thereto, JPMorgan Chase Bank, N.A., as Administrative Agent, J.P. Morgan Securities LLC and KeyBank National Association, as Co-Lead Arrangers and Joint Bookrunners, Bank of America, N.A., as Syndication Agent, and Wells Fargo Bank, N.A., as Documentation Agent. (Incorporated by reference to Exhibit 10.1 to the Registrant's Current Report on Form 8-K filed on November 24, 2010). |
10.67 | International Swaps and Derivatives Association, Inc. 2002 Master Agreement dated as of December 30, 2010 between Heartland Payment Systems, Inc., a Delaware corporation, and Bank of America, N.A., a Delaware corporation. (Incorporated by reference to Exhibit 10.67 to the Registrant's Current Report on Form 10-K filed on March 10, 2011). |
10.68 | Mortgage and Security Agreement dated as of January 20, 2011, by Heartland Payment Systems, Inc., a Delaware corporation, for the benefit of JPMorgan Chase Bank , N.A., in its capacity as administrative agent and mortgagee for the Lenders and the other Secured Parties defined in the Amended and Restated Credit Agreement dated as of May 30, 2008, among Heartland Payment Systems, Inc., a Delaware corporation, the Lenders party thereto from time to time, and JPMorgan Chase Bank, N.A., as Administrative Agent. (Incorporated by reference to Exhibit 10.68 to the Registrant's Current Report on Form 10-K filed on March 10, 2011). |
10.69** | Offer Letter between Maria Rueda and Heartland Payment Systems, Inc. dated April 11, 2011. (Incorporated by reference to Exhibit 10.1 to the Registrant's Current Report on Form 8-K filed on April 15, 2011). |
10.70** | Employee Confidential Information and Noncompetition Agreement between Maria Rueda and Heartland Payment Systems, Inc. dated April 11, 2011. (Incorporated by reference to Exhibit 10.2 to the Registrant's Current Report on Form 8-K filed on April 15, 2011). |
10.71** | Form of Performance-Based Employee Restricted Stock Unit Agreement (Incorporated by reference to Exhibit 10.1 to the Registrant's Form 10-Q filed on May 6, 2011) |
10.72** | Separation Agreement dated September 27, 2011 between Heartland Payment Systems, Inc. (the “Company”) and Steven M. Elefant, former Chief Information Officer of the Company. (Incorporated by reference to Exhibit 10.1 to the Registrant's Form 10-Q filed on November 4, 2011) |
10.73 | Amendment Number Three to the Merchant Processing Agreement dated April 1, 2002, as amended, between Heartland Payment Systems, Inc. and KeyBank National Association. (Incorporated by reference to Exhibit 10.1 to the Registrant's Current Report on Form 8-K filed on December 22, 2011). |
*10.74** | Form of Time Vesting Restricted Stock Unit Agreement. |
*10.75** | Form of Performance-Based Restricted Stock Unit Agreement. |
*21.1 | List of Subsidiaries of Registrant. |
*23.1 | Consent of Deloitte & Touche LLP. |
*31.1 | Certification of the Chief Executive Officer, pursuant to Rule 13a-14(a)/15d-14(a), as adopted pursuant to Section 302 of the Sarbanes-Oxley Act of 2002 |
*31.2 | Certification of the Chief Financial Officer, pursuant to Rule 13a-14(a)/15d-14(a), as adopted pursuant to Section 302 of the Sarbanes-Oxley Act of 2002 |
*32.1 | Certification of the Chief Executive Officer, pursuant to 18 U.S.C. Section 1350, as adopted pursuant to Section 906 of the Sarbanes-Oxley Act of 2002 |
*32.2 | Certification of the Chief Financial Officer, pursuant to 18 U.S.C. Section 1350, as adopted pursuant to Section 906 of the Sarbanes-Oxley Act of 2002 |
112
Exhibit Number | Description |
101*** | Interactive Data File |
* Filed herewith.
** Management contract or compensatory plan or arrangement.
*** XBRL Interactive Data File will be filed by amendment to this Annual Report on Form 10-K within 30 days of the filing date of this Annual Report on Form 10-K, as permitted by Rule 405(a)(2) of Regulation S-T.
SIGNATURES
Pursuant to the requirements of Section 13 or 15(d) of the Securities Exchange Act of 1934, the registrant has duly caused this report to be signed on its behalf by the undersigned thereunto duly authorized.
Date: February 28, 2012
HEARTLAND PAYMENT SYSTEMS, INC.
(Registrant)
By: /s/ Robert O. Carr
Robert O. Carr
Chief Executive Officer
(Principal Executive Officer)
By: /s/ Maria Rueda
Maria Rueda
Chief Financial Officer
(Chief Financial Officer)
113
Pursuant to the requirements of the Securities Exchange Act of 1934, this report has been signed below by the following persons on behalf of the registrant and in the capacities indicated on February 28, 2012.
SIGNATURE | TITLE | |
/s/ ROBERT O. CARR | Chairman of the Board and Chief Executive Officer | |
Robert O. Carr | (Principal Executive Officer) | |
/s/ MARIA RUEDA | Chief Financial Officer | |
Maria Rueda | (Chief Financial Officer) | |
/s/ MITCHELL L. HOLLIN | Director | |
Mitchell L. Hollin | ||
/s/ ROBERT H. NIEHAUS | Director | |
Robert H. Niehaus | ||
/s/ MARC J. OSTRO | Director | |
Marc J. Ostro | ||
/s/ JONATHAN PALMER | Director | |
Jonathan Palmer | ||
/s/ GEORGE F. RAYMOND | Director | |
George F. Raymond | ||
/s/ RICHARD W. VAGUE | Director | |
Richard W. Vague | ||
Exhibit Index
Exhibit Number | Description |
2.2 | Agreement and Plan of Merger dated September 29, 2000 by and among Heartland Payment Systems, Inc., Uhle and Associates, LLC, Martin J. Uhle, Mark K. Strippy and Steven B. Gamary. (Incorporated by reference to Exhibit 2.2 to the Registrant's Annual Report on Form 10 filed on August 9, 2005). |
2.3 | Agreement and Plan of Merger dated September 29, 2000 by and between Heartland Payment Systems, Inc. and Triad LLC. (Incorporated by reference to Exhibit 2.2 to the Registrant's Annual Report on Form 10 filed on August 9, 2005). |
2.4 | Agreement and Plan of Merger dated as of December 28, 2000 by and between Heartland Payment Systems, Inc. and Heartland Payment Systems L.L.C. (Incorporated by reference to Exhibit 2.2 to the Registrant's Annual Report on Form 10 filed on August 9, 2005). |
2.5 | Agreement of Merger dated as of June 14, 2004 by and between Heartland Payment Systems, Inc. and Credit Card Software Systems, Inc. (Incorporated by reference to Exhibit 2.2 to the Registrant's Annual Report on Form 10 filed on August 9, 2005). |
3.1 | Amended and Restated Certificate of Incorporation of Heartland Payment Systems, Inc. (Incorporated by reference to Exhibit 3.3 in the Registrant's Registration Statement on Form S-1, as amended (333-118073)). |
3.2 | Amended and Restated By-Laws of Heartland Payment Systems, Inc. (Incorporated by reference to Exhibit 3.2 to the Registrant's Annual Report on Form 10-K filed on March 10, 2008 (File No. 001-32594)). |
114
4.2 | Registration Rights Agreement dated August 2, 2005 (Incorporated by reference to Exhibit 4.2 in the Registrant's Form 8-A filed on August 4, 2005). |
10.1 | Revolver Advance and Purpose and Ability Line of Credit Loan Agreement dated August 28, 2002 between Heartland Payment Systems, Inc. and KeyBank National Association (Incorporated by reference to Exhibit 10.1 in the Registrant's Registration Statement on Form S-1, as amended (333-118073)). |
10.2 | First Amendment to the Revolver Advance and Purpose and Ability Line of Credit Loan Agreement dated November 6, 2003 between Heartland Payment Systems, Inc. and KeyBank National Association (Incorporated by reference to Exhibit 10.2 in the Registrant's Registration Statement on Form S-1, as amended (333-118073)). |
10.3 | Second Amendment to the Revolver Advance and Purpose and Ability Line of Credit Loan Agreement dated June 23, 2004 between Heartland Payment Systems, Inc. and KeyBank National Association (Incorporated by reference to Exhibit 10.3 in the Registrant's Registration Statement on Form S-1, as amended (333-118073)). |
10.4 | Revolver Advance Note dated August 28, 2002 payable by Heartland Payment Systems, Inc. to KeyBank National Association in a principal amount of $3,500,000.00 (Incorporated by reference to Exhibit 10.4 in the Registrant's Registration Statement on Form S-1, as amended (333-118073)). |
10.5 | Purpose and Ability Line of Credit Note dated August 28, 2002 payable by Heartland Payment Systems, Inc. to KeyBank National Association in a principal amount of $3,000,000 (Incorporated by reference to Exhibit 10.5 in the Registrant's Registration Statement on Form S-1, as amended (333-118073)). |
10.6 | Processing Services Agreement dated April 1, 2002 between Vital Processing Services L.L.C. and Heartland Payment Systems, Inc., as amended (Incorporated by reference to Exhibit 10.6 in the Registrant's Registration Statement on Form S-1, as amended (333-118073)). |
10.7 | Merchant Processing Agreement dated April 1, 2002 between KeyBank National Association and Heartland Payment Systems, Inc., as amended (Incorporated by reference to Exhibit 10.7 in the Registrant's Registration Statement on Form S-1, as amended (333-118073)). |
10.8 | Withdrawal and Redemption Agreement dated May 8, 2000, among Heartland Payment Systems, LLC, Triad LLC, Heartland Bank and Heartland Card Company (Incorporated by reference to Exhibit 10.8 in the Registrant's Registration Statement on Form S-1, as amended (333-118073)). |
10.9 | Office Lease Agreement, dated September 6, 2002, between Heartland Payment Systems, Inc. and PSN Partners, L.P. for 47 Hulfish Street, Suite 400, Princeton, New Jersey 08540 (Incorporated by reference to Exhibit 10.9 in the Registrant's Registration Statement on Form S-1, as amended (333-118073)). |
10.10 | Lease Agreement, dated August 16, 2003 between Heartland Payment Systems, Inc. and Youngstown Partners, LLC for 1431 Youngstown Shopping Center, Jeffersonville, Indiana 47130 (Incorporated by reference to Exhibit 10.10 in the Registrant's Registration Statement on Form S-1, as amended (333-118073)). |
10.11 | Lease Agreement, dated April 30, 2002 between Heartland Payment Systems, Inc. and Youngstown Partners, L.P. for 1431 1/2 and 1433 Youngstown Shopping Center, Jeffersonville, Indiana 47130 (Incorporated by reference to Exhibit 10.11 in the Registrant's Registration Statement on Form S-1, as amended (333-118073)). |
10.12 | Lease Agreement, dated April 30, 2002 between Heartland Payment Systems, Inc. and Youngstown Partners L.P. for 1437 and 1443 Youngstown Shopping Center, Jeffersonville, Indiana 47130 (Incorporated by reference to Exhibit 10.12 in the Registrant's Registration Statement on Form S-1, as amended (333-118073)). |
10.13 | Lease Agreement, dated March 6, 2003, between Heartland Payment Systems, Inc. and Youngstown Partners, L.P. for 1441 Youngstown Shopping Center, Jeffersonville, Indiana 47130 (Incorporated by reference to Exhibit 10.13 in the Registrant's Registration Statement on Form S-1, as amended (333-118073)). |
10.14 | Lease Agreement, dated February 14, 2002 between Heartland Payment Systems, Inc. and Youngstown Partners, L.P. for 1443 Youngstown Shopping Center, Jeffersonville, Indiana 47130 (Incorporated by reference to Exhibit 10.14 in the Registrant's Registration Statement on Form S-1, as amended (333-118073)). |
10.15 | Office Building Lease, dated May 1998, between Heartland Card Services, L.L.C. and Hall Stonebriar Center I Associates, Ltd. for 2595 Dallas Parkway, Frisco, Texas 75034 (Incorporated by reference to Exhibit 10.15 in the Registrant's Registration Statement on Form S-1, as amended (333-118073)). |
10.16 | First Amendment to Office Building Lease, dated September 30, 1998, between Heartland Card Services, L.L.C. and Hall Stonebriar Center I Associates, Ltd. (Incorporated by reference to Exhibit 10.16 in the Registrant's Registration Statement on Form S-1, as amended (333-118073)). |
10.17 | Second Amendment to Office Lease Agreement, dated July 25, 2000, between Heartland Card Services, L.L.C. and Hall Stonebriar Center I Associates, Ltd. (Incorporated by reference to Exhibit 10.17 in the Registrant's Registration Statement on Form S-1, as amended (333-118073)). |
115
10.18 | Third Amendment to Office Building Lease, dated October 4, 2002, between Heartland Card Services, L.L.C. and Hall Stonebriar Center I Associates, Ltd. (Incorporated by reference to Exhibit 10.18 in the Registrant's Registration Statement on Form S-1, as amended (333-118073)). |
10.19 | Lease Agreement dated September 2004, between Heartland Payment Systems, Inc. and Bank of America, N.A. for 90 Nassau Street, Princeton, New Jersey 08542 (Incorporated by reference to Exhibit 10.19 in the Registrant's Registration Statement on Form S-1, as amended (333-118073)). |
10.20 | First Amendment to Lease Agreement, dated March 17, 2005, between Heartland Payment Systems, Inc. and First State Investors 5200, LLC for 90 Nassau Street, Princeton, New Jersey 08542 (Incorporated by reference to Exhibit 10.20 in the Registrant's Registration Statement on Form S-1, as amended (333-118073)). |
10.21** | Heartland Payment Systems, Inc. Amended and Restated 2000 Equity Incentive Plan (Incorporated by reference to Exhibit 10.21 in the Registrant's Registration Statement on Form S-1, as amended (333-118073)). |
10.22** | Form of Employee Incentive Stock Option Agreement Under 2000 Equity Incentive Plan (Incorporated by reference to Exhibit 10.22 in the Registrant's Registration Statement on Form S-1, as amended (333-118073)). |
10.23** | Heartland Payment Systems, Inc. 2002 PEPShares Plan (Incorporated by reference to Exhibit 10.23 in the Registrant's Registration Statement on Form S-1, as amended (333-118073)). |
10.24** | Amendment to Heartland Payment Systems, Inc. 2002 PEPShares Plan (Incorporated by reference to Exhibit 10.24 in the Registrant's Registration Statement on Form S-1, as amended (333-118073)). |
10.25** | Form of Stock Option Agreement Under 2002 PEPShares Plan (Incorporated by reference to Exhibit 10.25 in the Registrant's Registration Statement on Form S-1, as amended (333-118073)). |
10.26 | Form of Indemnification Agreement (Incorporated by reference to Exhibit 10.26 in the Registrant's Registration Statement on Form S-1, as amended (333-118073)). |
10.27 | Third Amendment to the Revolver Advance and Purpose and Ability Line of Credit Loan Agreement dated May 26, 2005 between Heartland Payment Systems, Inc. and KeyBank National Association (incorporated by reference to Exhibit 10.28 of the Registrant's Amendment No. 1 to Form 10-12G/A, File No. 000-51265, filed on June 22, 2005) (Incorporated by reference to Exhibit 10.27 in the Registrant's Registration Statement on Form S-1, as amended (333-118073)). |
10.28** | Heartland Payment Systems, Inc. Second Amended and Restated 2000 Equity Incentive Plan (Incorporated by reference to Exhibit 10.28 in the Registrant's Registration Statement on Form S-1, as amended (333-118073)). |
10.29 | Merchant Portfolio Purchase Agreement dated September 22, 2005 between Heartland Payment Systems, Inc. and Certegy Payment Systems, Inc. (Incorporated by reference to Exhibit 10.29 to the Registrant's Quarterly Report on Form 10-Q filed on November 14, 2005 (File No. 001-32594)). |
10.30** | Letter Agreement dated February 22, 2006 between Robert O. Carr and Thomas Sheridan. (Incorporated by reference to Exhibit 10.30 to the Registrant's Current Report on Form 8-K filed on February 22, 2006). |
10.31** | Option Agreement dated July 31, 2003 between Robert O. Carr and Greenhill Capital Partners, L.P. and its affiliated investment funds, and LLR Equity Partners, L.P. and its affiliated investment fund. (Incorporated by reference to Exhibit 10.31 to the Registrant's Annual Report on Form 10-K filed on March 14, 2006 (File No. 001-32594)). |
10.32** | Form of Nonqualified Stock Option Agreement. (Incorporated by reference to Exhibit 10.32 to the Registrant's Quarterly Report on Form 10-Q filed on August 11, 2006 (File No. 001-32594)). |
10.33** | Letter Agreement dated May 8, 2006 between Heartland Payment Systems, Inc. and Michael C. Hammer concerning terms of employment. (Incorporated by reference to Exhibit 10.33 to the Registrant's Quarterly Report on Form 10-Q filed on August 11, 2006 (File No. 001-32594)). |
10.34** | Form of Employee Confidential Information and Noncompetition Agreement entered into by each of Robert O. Carr, Robert H.B. Baldwin, Jr., Brooks L. Terrell and Sanford C. Brown with Heartland Payment Systems, Inc. (Incorporated by reference to Exhibit 10.34 to the Registrant's Quarterly Report on Form 10-Q filed on August 11, 2006 (File No. 001-32594)). |
10.35** | Supplement No. I to Employee Confidential Information and Noncompetition Agreement by and between Robert H.B. Baldwin, Jr. and Heartland Payment Systems, Inc. (Incorporated by reference to Exhibit 10.35 to the Registrant's Quarterly Report on Form 10-Q filed on August 11, 2006 (File No. 001-32594)). |
10.36** | Employee Confidential Information and Noncompetition Agreement entered into December 1, 2004 by and between Thomas M. Sheridan and Heartland Payment Systems, Inc. (Incorporated by reference to Exhibit 10.36 to the Registrant's Quarterly Report on Form 10-Q filed on August 11, 2006 (File No. 001-32594)). |
10.37** | Amended and Restated Employee Confidential Information and Noncompetition Agreement dated May 4, 2007 entered into by Robert O. Carr with Heartland Payment Systems, Inc. (Incorporated by reference to Exhibit 10.37 to the Registrant's Current Report on Form 8-K filed on May 4, 2007). |
10.38** | Amended and Restated Employee Confidential Information and Noncompetition Agreement dated May 4, 2007 entered into by Sanford C. Brown with Heartland Payment Systems, Inc. (Incorporated by reference to Exhibit 10.38 to the Registrant's Current Report on Form 8-K filed on May 4, 2007). |
116
10.39** | Amended and Restated Employee Confidential Information and Noncompetition Agreement dated May 4, 2007 entered into by Brooks L. Terrell with Heartland Payment Systems, Inc. (Incorporated by reference to Exhibit 10.39 to the Registrant's Current Report on Form 8-K filed on May 4, 2007). |
10.40 | Credit Agreement dated as of September 5, 2007, among Heartland Payment Systems, Inc., a Delaware corporation, the Lenders party thereto from time to time, and JPMorgan Chase Bank, N.A., as Administrative Agent. (Incorporated by reference to Exhibit 10.1 to the Registrant's Current Report on Form 8-K filed on September 5, 2007). |
10.41 | American Express Establishment Sales and Servicing Program Agreement dated as of December 20, 2007 between Heartland Payment Systems, Inc. and American Express Travel Related Services Company. (Incorporated by reference to Exhibit 10.41 to the Registrant's Annual Report on Form 10-K filed on March 10, 2008 (File No. 001-32594)) |
10.42** | Heartland Payment Systems, Inc. 2008 Equity Incentive Plan. (Incorporated by reference to Exhibit 10.1 to the Registrant's Quarterly Report on Form 10-Q filed on August 8, 2008 (File No. 001-32594)) |
10.43 | Amended and Restated Credit Agreement dated as of May 30, 2008, among Heartland Payment Systems, Inc., a Delaware corporation, the Lenders party thereto from time to time, and JPMorgan Chase Bank, N.A., as Administrative Agent. (Incorporated by reference to Exhibit 10.43 to the Registrant's Annual Report Amendment No. 3 on Form 10-K/A filed on July 10, 2009). |
10.44 | Membership Interest and Asset Purchase Agreement dated as of May 2, 2008, by and among Alliance Data Network Services LLC, a Delaware limited liability company, ADS Alliance Data Systems, Inc., a Delaware corporation, Alliance Data Systems Corporation, a Delaware corporation, Heartland Acquisition, LLC, a Delaware limited liability company, and Heartland Payment Systems, Inc., a Delaware corporation. (Incorporated by reference to Exhibit 10.1 to the Registrant's Current Report on Form 8-K filed on May 8, 2008). |
10.45** | Form of Employee Incentive Stock Option Agreement Under 2008 Equity Incentive Plan. (Incorporated by reference to Exhibit 4.5 to the Registrant's Registration Statement on Form S-8 filed on November 19, 2008 (File No. 333-155450)). |
10.46** | Form of Employee Restricted Stock Unit Agreement. (Incorporated by reference to Exhibit 10.46 to the Registrant's Quarterly Report on Form 10-Q filed on August 7, 2009 (File No. 001-32594)). |
10.47** | Amendment No. I to Amended and Restated Employee Confidential Information and Noncompetition Agreement dated May 11, 2009 entered into by Robert O. Carr with Heartland Payment Systems, Inc. (Incorporated by reference to Exhibit 10.47 to the Registrant's Quarterly Report on Form 10-Q filed on August 7, 2009). |
10.48** | Performance-Based Stock Option Agreement under the 2008 Equity Incentive Plan dated May 11, 2009 between Heartland Payment Systems, Inc. and Robert O. Carr. (Incorporated by reference to Exhibit 10.48 to the Registrant's Quarterly Report on Form 10-Q filed on August 7, 2009). |
10.49** | Performance-Based Stock Option Agreement under the 2008 Equity Incentive Plan dated May 11, 2009 between Heartland Payment Systems, Inc. and Robert O. Carr. (Incorporated by reference to Exhibit 10.49 to the Registrant's Quarterly Report on Form 10-Q filed on August 7, 2009). |
10.50 | Amendment No. I and Limited Waiver dated August 3, 2009 to the Amended and Restated Credit Agreement dated May 30, 2008, among Heartland Payment Systems, Inc., a Delaware corporation, the Lenders party thereto from time to time, and JPMorgan Chase Bank, N.A., as Administrative Agent, Swingline Lender, and Issuing Bank. (Incorporated by reference to Exhibit 10.50 to the Registrant's Quarterly Report on Form 10-Q filed on August 7, 2009). |
10.51 | Pledge and Security Agreement dated as of August 3, 2009, by and among Heartland Payment Systems, Inc., a Delaware corporation, The Heartland Payroll Company, L.L.C., an Ohio limited liability company, Debitek, Inc., a Delaware corporation, Heartland Acquisition, LLC, a Delaware limited liability company, and JPMorgan Chase Bank, N.A., as administrative agent for the lenders from time to time party to the Credit Agreement. (Incorporated by reference to Exhibit 10.51 to the Registrant's Quarterly Report on Form 10-Q filed on August 7, 2009). |
10.52 | Amended and Restated Credit Agreement dated as of May 30, 2008, among Heartland Payment Systems, Inc., a Delaware corporation, the Lenders party thereto from time to time, and JPMorgan Chase Bank, N.A., as Administrative Agent. (Incorporated by reference to Exhibit 10.1 to the Registrant's Current Report on Form 8-K filed on June 4, 2008). |
10.53 | Settlement Agreement dated as of January 7, 2010, is by and among Visa U.S.A. Inc., a Delaware corporation, Visa International Service Association, a Delaware corporation, and Visa Inc., a Delaware corporation, Heartland Payment Systems, Inc., a Delaware corporation, Keybank National Association, a national bank organized and existing under the laws of the United States, and Heartland Bank, a Missouri banking corporation. (Incorporated by reference to Exhibit 10.1 to the Registrant's Current Report on Form 8-K filed on January 8, 2010). |
117
10.54 | Amendment No. 1 dated February 3, 2010 to the Settlement Agreement dated as of January 7, 2010, by and among Visa U.S.A. Inc., a Delaware corporation, Visa International Service Association, a Delaware corporation, and Visa Inc., a Delaware corporation, Heartland Payment Systems, Inc., a Delaware corporation, Keybank National Association, a national bank organized and existing under the laws of the United States, and Heartland Bank, a Missouri banking corporation. (Incorporated by reference to Exhibit 10.1 to the Registrant's Current Report on Form 8-K filed on February 4, 2010). |
10.55 | Agreement of Settlement and Release, dated December 17, 2009, by and between Heartland Payment Systems, Inc., a Delaware corporation, and American Express Travel Related Services Company, Inc., a New York Corporation (Incorporated by reference to Exhibit 10.55 to the Registrant's Annual Report on Form 10-K filed on March 10, 2010). |
10.56 | Bridge Loan Agreement dated as of February 18, 2010 among Heartland Payment Systems, Inc., KeyBank National Association, as administrative agent, and KeyBank National Association and Heartland Bank as bridge lenders. (Incorporated by reference to Exhibit 10.1 to the Registrant's Current Report on Form 8-K filed on February 24, 2010). |
10.57 | Amendment No. 2 and Amended and Restated Credit Agreement and Partial Release of Collateral dated as of February 18, 2010, among Heartland Payment Systems, Inc., the lenders party thereto and JPMorgan Chase Bank, N.A., as administrative agent, swingline lender and issuing bank. (Incorporated by reference to Exhibit 10.2 to the Registrant's Current Report on Form 8-K filed on February 24, 2010). |
10.58 | Commitment Increase Agreement between Heartland Payment Systems, Inc, and KeyBank National Association, and accepted by JPMorgan Chase Bank, N.A. as administrative agent. (Incorporated by reference to Exhibit 10.3 to the Registrant's Current Report on Form 8-K filed on February 24, 2010). |
10.59** | Amendment and Restatement of Heartland Payment Systems, Inc.'s 2008 Equity Incentive Plan (Incorporated by reference to Exhibit 10.1 to the Company's Current Report on Form 8-K filed on May 18, 2010). |
10.60 | Settlement Agreement between Heartland Payment Systems, Inc. and MasterCard International Incorporated dated May 19, 2010 (Incorporated by reference to Exhibit 10.1 to the Company's Current Report on Form 8-K filed on May 19, 2010). |
10.61 | Amendment No.1 dated as of July 2, 2010 to the Settlement Agreement dated as of May 19, 2010 by and between MasterCard International Incorporated, a Delaware corporation and Heartland Payment Systems, Inc., a Delaware corporation. (Incorporated by reference to Exhibit 10.1 to the Registrant's Form 10-Q filed on November 8, 2010). |
10.62 | Amendment No.2 dated as of July 13, 2010 to the Settlement Agreement dated as of May 19, 2010, as amended by amendment dated July 2, 2010, by and between MasterCard International Incorporated, a Delaware corporation and Heartland Payment Systems, Inc., a Delaware corporation. (Incorporated by reference to Exhibit 10.2 to the Registrant's Form 10-Q filed on November 8, 2010). |
10.63 | Amendment No.3 dated as of August 6, 2010 to the Settlement Agreement dated as of May 19, 2010, as amended by amendments dated July 2, 2010 and July 13, 2010, by and between MasterCard International Incorporated, a Delaware corporation and Heartland Payment Systems, Inc., a Delaware corporation. (Incorporated by reference to Exhibit 10.3 to the Registrant's Form 10-Q filed on November 8, 2010). |
10.64 | Waiver Agreement dated as of August 27, 2010, by and among MasterCard International Incorporated, a Delaware corporation and Heartland Payment Systems, Inc., a Delaware corporation. (Incorporated by reference to Exhibit 10.4 to the Registrant's Form 10-Q filed on November 8, 2010). |
10.65 | Agreement of Settlement and Release, effective as of August 31, 2010, is entered into by and between Heartland Payment Systems, Inc., a Delaware corporation, and DFS Services LLC, a Delaware corporation. (Incorporated by reference to Exhibit 10.5 to the Registrant's Form 10-Q filed on November 8, 2010). |
10.66 | Second Amended and Restated Credit Agreement dated as of November 24, 2010, among Heartland Payment Systems, Inc., a Delaware corporation, the Lenders party thereto, JPMorgan Chase Bank, N.A., as Administrative Agent, J.P. Morgan Securities LLC and KeyBank National Association, as Co-Lead Arrangers and Joint Bookrunners, Bank of America, N.A., as Syndication Agent, and Wells Fargo Bank, N.A., as Documentation Agent. (Incorporated by reference to Exhibit 10.1 to the Registrant's Current Report on Form 8-K filed on November 24, 2010). |
10.67 | International Swaps and Derivatives Association, Inc. 2002 Master Agreement dated as of December 30, 2010 between Heartland Payment Systems, Inc., a Delaware corporation, and Bank of America, N.A., a Delaware corporation. (Incorporated by reference to Exhibit 10.67 to the Registrant's Current Report on Form 10-K filed on March 10, 2011). |
10.68 | Mortgage and Security Agreement dated as of January 20, 2011, by Heartland Payment Systems, Inc., a Delaware corporation, for the benefit of JPMorgan Chase Bank , N.A., in its capacity as administrative agent and mortgagee for the Lenders and the other Secured Parties defined in the Amended and Restated Credit Agreement dated as of May 30, 2008, among Heartland Payment Systems, Inc., a Delaware corporation, the Lenders party thereto from time to time, and JPMorgan Chase Bank, N.A., as Administrative Agent. (Incorporated by reference to Exhibit 10.68 to the Registrant's Current Report on Form 10-K filed on March 10, 2011). |
118
10.69** | Offer Letter between Maria Rueda and Heartland Payment Systems, Inc. dated April 11, 2011. (Incorporated by reference to Exhibit 10.1 to the Registrant's Current Report on Form 8-K filed on April 15, 2011). |
10.70** | Employee Confidential Information and Noncompetition Agreement between Maria Rueda and Heartland Payment Systems, Inc. dated April 11, 2011. (Incorporated by reference to Exhibit 10.2 to the Registrant's Current Report on Form 8-K filed on April 15, 2011). |
10.71** | Form of Performance-Based Employee Restricted Stock Unit Agreement (Incorporated by reference to Exhibit 10.1 to the Registrant's Form 10-Q filed on May 6, 2011) |
10.72** | Separation Agreement dated September 27, 2011 between Heartland Payment Systems, Inc. (the “Company”) and Steven M. Elefant, former Chief Information Officer of the Company. (Incorporated by reference to Exhibit 10.1 to the Registrant's Form 10-Q filed on November 4, 2011) |
10.73 | Amendment Number Three to the Merchant Processing Agreement dated April 1, 2002, as amended, between Heartland Payment Systems, Inc. and KeyBank National Association. (Incorporated by reference to Exhibit 10.1 to the Registrant's Current Report on Form 8-K filed on December 22, 2011). |
*10.74** | Form of Time Vesting Restricted Stock Unit Agreement. |
*10.75** | Form of Performance-Based Restricted Stock Unit Agreement. |
*21.1 | List of Subsidiaries of Registrant. |
*23.1 | Consent of Deloitte & Touche LLP. |
*31.1 | Certification of the Chief Executive Officer, pursuant to Rule 13a-14(a)/15d-14(a), as adopted pursuant to Section 302 of the Sarbanes-Oxley Act of 2002 |
*31.2 | Certification of the Chief Financial Officer, pursuant to Rule 13a-14(a)/15d-14(a), as adopted pursuant to Section 302 of the Sarbanes-Oxley Act of 2002 |
*32.1 | Certification of the Chief Executive Officer, pursuant to 18 U.S.C. Section 1350, as adopted pursuant to Section 906 of the Sarbanes-Oxley Act of 2002 |
*32.2 | Certification of the Chief Financial Officer, pursuant to 18 U.S.C. Section 1350, as adopted pursuant to Section 906 of the Sarbanes-Oxley Act of 2002 |
101*** | Interactive Data File. |
* Filed herewith.
** Management contract or compensatory plan or arrangement.
*** XBRL Interactive Data File will be filed by amendment to this Annual Report on Form 10-K within 30 days of the filing date of this Annual Report on Form 10-K, as permitted by Rule 405(a)(2) of Regulation S-T.
119