Attached files
| file | filename |
|---|---|
| 8-K - FORM 8-K - FIRST BANCORP /PR/ | d307807d8k.htm |
 Investor
Presentation Investor Presentation
February 2012
February 2012 |
 Disclaimer
2
This presentation contains “forward-looking statements” concerning First
BanCorp’s (the “Corporation”) future economic performance. The words or phrases “would be,” “will
allow,” “intends to,” “will likely result,” “are expected
to,” “anticipate,” “look forward,” “should,” “believes” and similar expressions are meant to identify “forward-looking
statements” within the meaning of Section 27A of the Private Securities Litigation Reform
Act of 1995, and are subject to the safe harbor created by such section. The
Corporation wishes to caution readers not to place undue reliance on any such
“forward-looking statements,” which speak only as of the date made, and to advise readers that
various factors, including, but not limited to, the following: uncertainty about whether the
Corporation will be able to fully comply with the written agreement dated June 3, 2010
that the Corporation entered into with the Federal Reserve Bank of New York (the “FED”) and the order dated June 2, 2010 (the “Order”) that FirstBank Puerto Rico
(“FirstBank” or “the Bank”) entered into with the FDIC and the Office of
the Commissioner of Financial Institutions of Puerto Rico that, among other things, require the Bank to
maintain certain capital levels and reduce its special mention, classified, delinquent and
non-performing assets; uncertainty as to the availability of certain funding sources, such
as retail brokered CDs; the Corporation’s reliance on brokered CDs and its ability to
obtain, on a periodic basis, approval from the FDIC to issue brokered CDs to fund operations
and provide liquidity in accordance with the terms of the Order; the risk of not being able to
fulfill the Corporation’s cash obligations or resume paying dividends to its
stockholders in the future due to its inability to receive approval from the FED to receive
dividends from the Bank; the risk of being subject to possible additional regulatory
actions; the strength or weakness of the real estate markets and of the consumer and
commercial credit sectors and their impact on the credit quality of the Corporation’s loans
and other assets, including the Corporation’s construction and commercial real estate
loan portfolios, which have contributed and may continue to contribute to, among other
things, the high levels of non-performing assets, charge-offs and the provision
expense and may subject the Corporation to further risk from loan defaults and foreclosures;
adverse changes in general economic conditions in the United States and in Puerto Rico,
including the interest rate scenario, market liquidity, housing absorption rates, real
estate prices and disruptions in the U.S. capital markets, which may reduce interest margins,
impact funding sources and affect demand for all of the Corporation’s products and
services and the value of the Corporation’s assets; an adverse change in the
Corporation’s ability to attract new clients and retain existing ones; a decrease in demand for the
Corporation’s products and services and lower revenues and earnings because of the
continued recession in Puerto Rico and the current fiscal problems and budget deficit of
the Puerto Rico government; uncertainty about regulatory and legislative changes for financial
services companies in Puerto Rico, the United States and the U.S. and British Virgin
Islands, which could affect the Corporation’s financial performance and could cause the Corporation’s actual results for future periods to differ materially from prior
results and anticipated or projected results; uncertainty about the effectiveness of the
various actions undertaken to stimulate the United States economy and stabilize the
United States’ financial markets, and the impact such actions may have on the
Corporation’s business, financial condition and results of operations; changes in the fiscal and
monetary policies and regulations of the federal government, including those determined by the
Federal Reserve System, the FDIC, government sponsored housing agencies and local
regulators in Puerto Rico and the U.S. and British Virgin Islands; the risk of possible failure or circumvention of controls and procedures and the risk that the Corporation’s
risk management policies may not be adequate; the risk that the FDIC may further increase the
deposit insurance premium and/or require special assessments to replenish its insurance
fund, causing an additional increase in the Corporation’s non-interest expense; risks of not being able to recover the assets pledged to Lehman Brothers Special
Financing, Inc.; the impact to the Corporation’s results of operations and financial
condition associated with acquisitions and dispositions; a need to recognize additional
impairments on financial instruments or goodwill relating to acquisitions; risks that further
downgrades in the credit ratings of the Corporation’s long-term senior debt will
adversely affect the Corporation’s ability to make future borrowings; the impact of the
Dodd-Frank Wall Street Reform and Consumer Protection Act on the Corporation’s
businesses, business practices and cost of operations; and general competitive factors and
industry consolidation. The Corporation does not undertake, and specifically
disclaims any obligation, to update any “forward-looking statements” to reflect
occurrences or unanticipated events or circumstances after the date of such statements except
as required by the federal securities laws. Investors should refer to the Corporation’s
Annual Report on Form 10-K for the year ended December 31, 2010 for a discussion of such
factors and certain risks and uncertainties to which the Corporation is subject.
|
 Franchise
Overview Founded in 1948 (63 years)
Headquartered in San Juan, Puerto Rico with
operations in PR, Eastern Caribbean (Virgin
Islands) and Florida
A well diversified operation with over 650,000
retail & commercial customers
2nd largest financial holding company in Puerto
Rico with attractive business mix and
substantial loan market share
A leading bank in the Virgin Islands with over
40% market share
Small presence in Florida serving south Florida
region
154 ATM machines and largest ATM network in
the ECR
More than 2,500 FTE employees
As of December 31, 2011
Eastern Caribbean Region or ECR includes United States and British Virgin Islands
FTE = Full Time Equivalent
Well diversified with significant competitive strengths
3
Total
Assets
-
$13.1
billion
Total
Deposits
-
$9.9
billion
Puerto Rico: 84% of Assets
Total
Loans
-
$10.6
billion |
 Franchise
Overview Strong and uniquely positioned market
franchise in densely populated operating
footprints
Strong market share in loan portfolios
facilitates customer relationship expansion
and cross sell
Unique challenger to Puerto Rico’s largest
player
1 Puerto Rico only; 2 Credit Cards provided through alliance with Bank of America; 3 Provided
through alliance with UBS; 4 Established primarily for municipal financing Source: PR
Market Share Report prepared with data provided by the Commissioner of Financial Institutions of Puerto Rico as of 12/31/2011
Unique challenger to Puerto Rico’s largest player
4
Puerto Rico Total Assets¹
Puerto Rico Total Loans¹
Portfolio
Balance
Market
Share
1
Banco Popular
$25,678
36.3%
2
FirstBank
$10,840
15.3%
6
Scotiabank
$8,122
11.5%
3
Oriental Bank
$6,642
9.4%
4
Banco Santander
$6,587
9.3%
5
Doral Bank
$5,728
8.1%
7
BBVA
$5,016
7.1%
8
Citibank
$1,699
2.4%
9
Banco Cooperativo
$473
0.7%
10
BBU
$3
0.0%
Total
$70,789
100%
Institutions
Portfolio
Balance
Market
Share
1
Banco Popular
$19,150
36.4%
2
FirstBank
$8,743
16.6%
3
Scotiabank
$5,778
11.0%
4
Banco Santander
$5,348
10.2%
5
Doral Bank
$4,272
8.1%
6
BBVA
$3,700
7.0%
7
Oriental Bank
$1,731
3.3%
8
Citibank
$678
1.3%
9
Bank of America
$501
1.0%
10
Banco Cooperativo
$176
0.3%
11
Other
$2,522
4.8%
Total
$52,599
100%
Institutions
Puerto Rico
ECR
Florida
Banking Branches
48
14
11
Wholesale Banking
Retail Banking
Consumer
Lending
2
Mortgage
Banking
Insurance
Retail
Brokerage
3
Wholesale
Brokerage
4 |
 1 As of
December 31, 2011 2 Between December 31, 2009 and December 31, 2011
5
Successful Execution of Strategic Plan
Significant accomplishments over past 24 months
Executing
Capital Plan
Strengthened capital structure
Converted TARP preferred shares into common
Completed exchange of 89% preferred stocks into common
Completed $528 million capital raise and rights offering
Successfully achieved imposed regulatory capital ratios of 12%, 10% and 8%
De-risking
Balance Sheet
Made significant progress on improving risk profile reducing NPAs by $453mm since 3/31/10
peak¹ Disposed of $636 million NPLs and classified loans
via note sales, including a $517 million bulk sale Deleveraged balance sheet reducing
assets by 16%² Enhancing Franchise
Value
Successfully protected our Brand, market position and franchise value
Increased core deposits by $1.1 billion²
and reduced reliance on brokered deposits by 51%²
Introduced new products and achieved efficiency improvements (new Service Center, tech
infrastructure, internet banking)
Strengthening
Governance &
Risk Management
Strengthened management team and governance structure; culture change
Complied with Regulatory Agreements
Reconstituted Board of Directors
During the recent
cycle
(consolidations,
capital
raise,
economic
challenges),
Management
focused
on strengthening the franchise and succeeded in solidifying its strong #2 position in PR
|
 Strengthened
Capital Position Completed $528 million capital raise and rights offering
Issued
150
million
shares
of
common
stock
at
a
purchase
price
of
$3.50
per
share
to
institutional
investors
Simultaneous with the completion of the capital raise, issued 32,941,797 shares of common
stock to the US Treasury upon conversion of all of the Corporation’s outstanding
Preferred Stock, Series G Achieved
strong
capital
ratios,
well
in
excess
of
regulatory
targets
and
“well-capitalized”
levels
Improved Tangible Common Equity ratio to 10.25% and Tier 1 common equity to risk weighted
assets to 12.96%¹
1 Non-GAAP financial measure. See reconciliation on page 19
Additional capital in place to support growth
6
Regulatory Capital Ratios for First BanCorp
12.0%
12.0%
12.4%
12.4%
17.1%
10.7%
10.7%
11.1%
11.1%
15.8%
7.6%
7.8%
8.0%
8.4%
11.9%
0.0%
6.0%
12.0%
18.0%
2010
1Q 11
2Q 11
3Q 11
4Q 11
Total Capital
Tier 1 Capital
Leverage |
 Executed Targeted
Deleverage Balance Sheet deleverage as a capital preservation
strategy, focused mostly on investment securities,
higher risk assets and non-core relationships
Loan categories decreased as a result of loan sales, pay-
downs and charge-offs
Selective well diversified loan originations to replace
interest income from non-performing loan
Continued to reduce risks in the Balance Sheet
7
($ in millions)
Loan Portfolio
Asset Composition
$690
$592
$526
$563
$899
$595
$599
$577
$2,175
$3,154
$1,707
$1,486
$476
$433
$175
$88
$4,240
$4,774
$3,008
$2,714
$-
$5,000
2008
2009
2010
2011
Residential
Consumer
Commercial & CRE
Construction
Loan Originations
$12,807
$13,421
$11,403
$10,081
$5,709
$4,867
$3,369
$2,244
$975
$1,340
$821
$802
$19,491
$19,628
$15,593
$13,127
$0
$20,000
2008
2009
2010
2011
Total loans, net of ALLL
Investments & Money Markets
Cash & Other
$3,481
$3,596
$3,417
$2,874
$2,108
$1,898
$1,716
$1,562
$5,962
$6,942
$5,822
$5,696
$1,527
$1,493
$701
$428
$10
$20
$301
$16
$13,088
$13,949
$11,956
$10,575
$-
$18,000
2008
2009
2010
2011
Residential
Consumer
Commercial & CRE
Construction
Loans Held for Sale |
 Improved Risk
Profile Reduced NPLs by 31% since 3/31/2010¹
Decreasing charge-off trend
Significantly reduced construction portfolio exposure by 72% to
$428 million since 2008 peak¹, a major driver of loan
losses Focused on loan sales, organic workouts, note sales and
liquidating OREO through Special Assets Group
Increased preventive measures for early detection
Opportunistic sales of non-performing assets will continue
1 As of December 31, 2011
2 Net Carrying Amount = % of carrying value net of reserves and accumulated
charge-offs Credit quality continues to improve at a steady pace
8
($ in millions)
Allowance coverage ratio of 4.7%
Net Charge-offs
Non-performing Assets
Book Value
Accumulated
Charge-offs
Reserves
Net Carrying
Amount²
C & I
270
$
98
$
60
$
57%
Construction
250
137
43
54%
CRE
240
23
41
76%
Total
761
$
258
$
144
$
60%
Commercial Non-performing Loans¹
|
 1 Net of
Brokered CDs 2 As of December 31, 2011
$1,625
$1,505
$2,090
$2,126
$564
$448
$470
$481
$723
$774
$763
$916
$1,716
$2,381
$2,477
$2,654
$4,628
$5,108
$5,800
$6,176
$-
$6,500
2008
2009
2010
2011
CDs & IRAs
Government
Commercial
Retail
Successful execution of core deposit growth strategy; $1.1 billion
or 21% increase since December 2009
Cost of interest bearing deposits, net of brokered CD’s,
decreased during 2011 to 1.51% from 2.20% in 2009
Overall deposit mix improvement with reduced reliance on
brokered CDs
38% of deposits are brokered CDs², down from 60% in 2009
Focus in electronic services strategy to support deposits’
growth
resulted in a 30% increase in Cash Management fees and an 87%
increase in POS terminals during 2011
Building Franchise Value
Successful core deposits growth over recent years
9
($ in millions)
Deposits, Net of Brokered
2.92%
2.20%
1.79%
1.51%
2.45%
1.87%
1.56%
1.34%
0.00%
1.00%
2.00%
3.00%
2008
2009
2010
2011
Interest Bearing Deposits, Net of Brokered
Total Deposits, Net of Brokered
Total Deposit Composition
Cost of Deposits¹
Interest Bearing
55%
Non-
interest
Bearing
7%
Brokered CDs
38% |
 Focus on
Rebuilding Earnings 2011 Highlights
Net loss for the year decreased $442 million to $82 million
Net
interest
margin
increased
21
basis
points
to
2.82%
for
2011,
reaching
2.99%
in
4Q
2011
Provision for loan and lease losses decreased $398 million to $236 million
Non-interest expenses decreased $28 million to $338 million
1 Non-GAAP financial measure
2 Fair value adjustments on derivatives and financial liabilities measured at fair value
3 See reconciliation on page 20
4 See reconciliation on page 21. All share and per share data have been adjusted to
retroactively reflect the 1-for-15 reverse stock split effected January 7, 2011
Stable PTPP earnings with realizable opportunities for improvement
10
($ in millions, except per share results)
Income Statement
4Q 2011
3Q 2011
2Q 2011
1Q 2011
4Q 2010
3Q 2010
2Q 2010
1Q 2010
Net interest income, excluding valuations
1
100
$
97
$
96
$
106.5
$
112
$
115
$
116
$
119
$
Valuations
2
(2)
(3)
(1)
(0.2)
0.1
(1.3)
3
(2)
GAAP Net Interest Income
98
$
94
$
94
$
106.3
$
112
$
113.7
$
119
$
117
$
Provision for loan and lease losses
42
46
59
89
93
120
147
171
Non-interest income
15
14
39
40
14
19
40
45
Non-interest expense
86
83
86
83
88
89
99
91
Pre-tax net loss
(15)
(21)
(12)
(25)
(55)
(76)
(87)
(100)
Provision related to loans transferred to held for sale
-
103
-
-
-
Income tax (expense) benefit
(0)
(3)
(3)
(3)
(93)
1
(4)
(7)
Net loss
(15)
$
(24)
$
(15)
$
(28)
$
(251)
$
(75)
$
(91)
$
(107)
$
Adjusted Pre-tax pre-provision earnings
1, 3
28
$
29
$
30
$
42
$
39
$
45
$
36
$
40
$
Net Interest Margin, excluding valuations (%)
2.99%
2.82%
2.64%
2.83%
2.77%
2.67%
2.51%
2.52%
Net income (loss) per common share-
basic
4
1.36
$
(1.46)
$
(1.04)
$
(1.66)
$
(12.67)
$
31.30
$
(15.70)
$
(18.34)
$ |
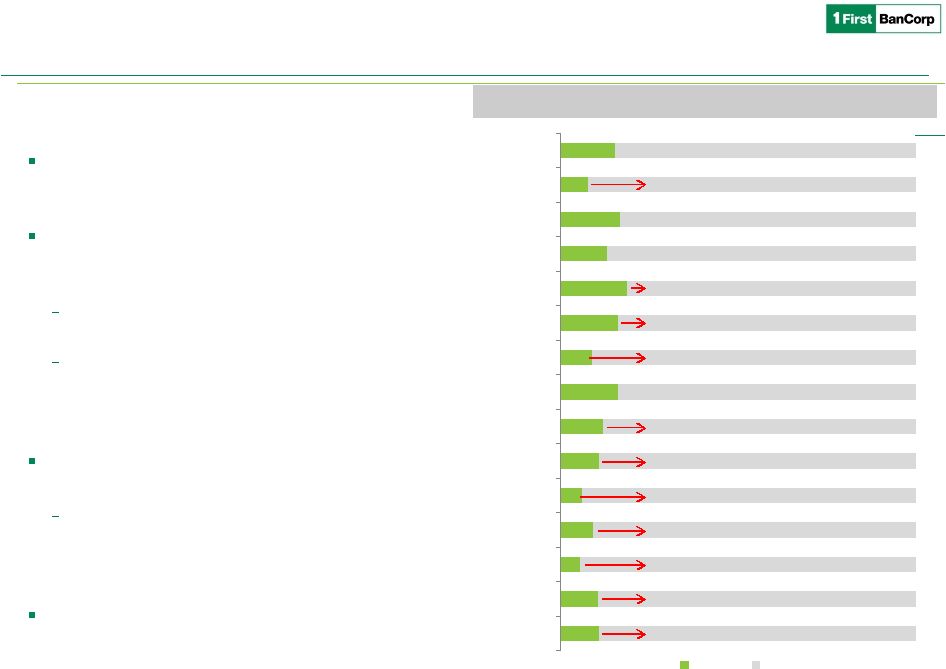  Path to
Profitability Targeted strategies for growth
11
2
2
4
4
2
2
3
4
3
4
3
4
3
4
5
Rank
Market Share in Main Market¹
1 Puerto Rico only
Source: Office of the Commissioner of Financial Institutions of Puerto Rico as of 12/31/2011
and internal reports; commercial loans include loans collateralized by real estate; Insurance share is for income
information included in regulatory reports filed by banks for the year 2009; credit cards
include portfolio managed by FIA Card Services Puerto Rico
Strong market share in loan portfolios
provides solid base for customer relationships
expansion and cross sell
Opportunities for ongoing market share gains
on selected products based on fair share of
assets
Largest opportunity on deposits and electronic
banking & transaction services
Selected loan products growth for balanced
risk/return to avoid risk concentration and
diversify income
Florida
Expansion prospects in Florida given long term
demographic trends
Continue focus in core deposit growth,
commercial and transaction banking and
conforming residential mortgages
Virgin Islands
Solidify leadership position by further
increasing customer share of wallet
15%
8%
17%
13%
19%
16%
9%
16%
12%
11%
6%
9%
6%
11%
11%
85%
92%
83%
87%
81%
84%
91%
84%
88%
89%
94%
91%
94%
90%
89%
Assets
Personal Loans
Commercial Loans
Construction
Auto/Leasing
Small Personal Loans
Mortgage Originations
Credit Cards
Insurance
ACH Transactions
POS Terminals
ATM Terminals
Debit Cards
Deposits
Branches
FirstBank
Other Banks |
 12
Path to Profitability
De-risking
Balance Sheet
Achieve additional reduction of NPAs and classified assets
Increase OREO disposition efficiency
Ongoing key credit metrics improvement
Enhancing Franchise
Value
Re-energize loan production in key focus areas
Continue to execute core deposit strategic plan focused on increasing non-
interest bearing deposits, cash management and electronic services
Rebuild pre-tax pre-provision income
Execute process improvement projects
DTA valuation allowance of $368.9 million available to offset income tax effect on
future earnings
Strengthening
Governance &
Risk Management
Manage emerging regulatory changes
Positioned for Profitability & Growth Post Capital Raise
-
Enhance loan pricing and optimize NIM through further reductions
in funding costs
-
Launch new products
-
Expand cross sell |
 Summary of
Investment Opportunity Strong and uniquely positioned franchise with strengthened
capital base Stable pre-tax, pre-provision earnings with realizable
opportunities for improvement
Executing on our strategic plan
Continued improvements in asset quality
Core-deposit plan
Ongoing expense management
Committed management team with proven execution skills
Attractive valuation on a pro-forma tangible book value basis
13 |
 Exhibits
Investor Presentation
Investor Presentation
February 2012
February 2012 |
 15
Stock Profile
Trading Symbol:
•
FBP
Exchange:
•
NYSE
Share
Price
•
$3.95
Shares Outstanding:
•
205,299,171
Market Capitalization
•
$811 million
1 Yr. Average Daily Volume:
•
146,837
Price
to Tangible
Book
•
0.60x
Beneficial Owner
Amount
Percent of
Class
Entities affiliated with Thomas H. Lee
Partners, L.P.
50,684,485
24.69%
Entities affiliated with Oaktree Capital
Management, L.P.
50,684,485
24.69%
Wellington Management Company, LLP.
20,220,300
9.85%
United States Department of the
Treasury
34,227,696
16.57%
5% or more Beneficial Ownership
(2/24/2012):
(2/24/2012)
(12/31/11):
(2/24/12):
|
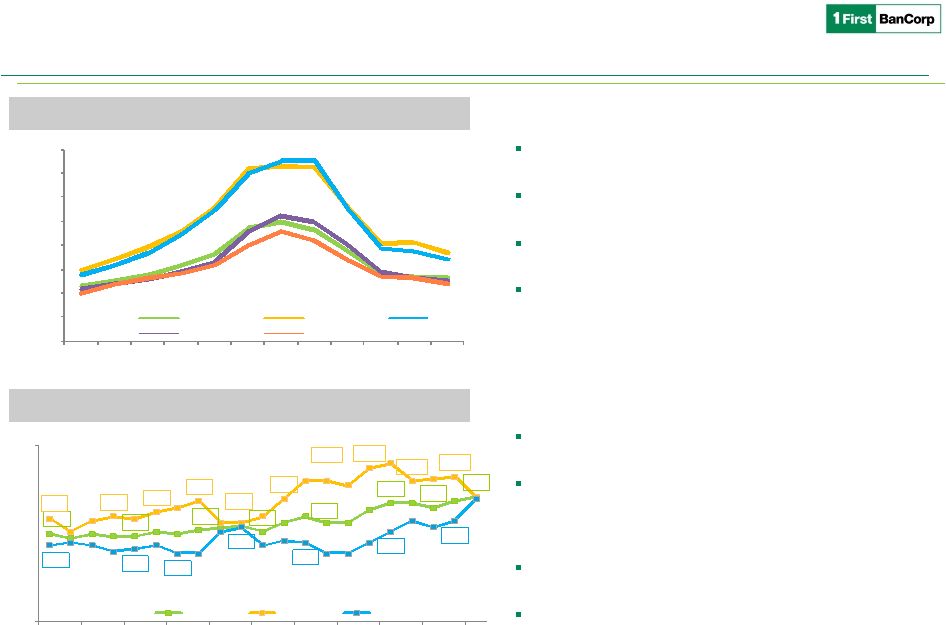
 Economic
Environment Continues to Stabilize Puerto Rico
Economic Activity Index continues to reflect stabilization with
certain improving trends
Government efforts to control fiscal imbalances have been
showing results
The deficit as of January 2009 was $3.3 billion; it was reduced to
$2.1 billion in 2010, to $1 billion in 2011 and is projected at $610
million for fiscal year 2012,
Public/private partnerships (PPPs) are in process to improve
physical/functional infrastructure and build strategic/regional
projects to jump-start the economy
PPP for Toll Roads PR-22 and PR-5 / $1.4 billion investment
PPP for Modernization and New construction of Schools /
$756 millions investment
Others are currently in process –
PPP for Energy (Via Verde),
Puerto Rico Aqueduct and
Sewer Authority and Luis Muñoz
Marín International Airport
16
In July 2011, Commonwealth issued bonds of $300 million for
infrastructure projects to continue stimulating the economy
Despite the recent Moody’s downgrade of PR’s General
Obligation Bond and other associated credits, investors continued
to show their confidence by purchasing more than $2B in bonds
for the Schools of the 21st Century Projects and COFINA
Housing incentives enacted in Puerto Rico were extended up to
December 2012
Retail Sales show a stable trend over the last two years
New car sales have shown a positive year over year trend since
December 2009
Stabilization of the banking system was reflected in financial
results and a leveling of assets in the overall system
GDB -
Economic Activity Index
Puerto Rico GNP & Yearly
% Growth
2000 –
2010
2
3.0%
1.5%
0.3%
2.1%
2.7%
1.9%
0.5%
1.2%
2.9%
4.0%
3.8%
1.0%
5%
4%
3%
2%
1%
0%
1%
2%
3%
4%
5,600.0
5,800.0
6,000.0
6,200.0
6,400.0
6,600.0
6,800.0
7,000.0
7,200.0
2000
2001
2002
2003
2004
2005
2006
2007
2008
2009
2010
Est.
2011
Est.
Real GNP
GNP Growth
1 GDB Puerto Rico (www.bgfpr.com). Index and its indicators are subject to monthly
revisions. Data used for GDB-EAI is adjusted for seasonality and variability.
2 PR Planning Board (www.jp.gobierno.pr). GNP in millions and at constant prices of
1954. Estimate as of 3/24/2011. Years are from July 1 to June 30 of next year (fiscal year)
|
 Economic
Environment Continues to Stabilize Virgin Islands
During September 2011, unemployment rate increased
0.2 points to 9.7% from 9.5 in August
691,844 visitors arrived in the 1Q11, representing a
growth of 11.3% over same period, last year. Cruise
visitors increased a 16.9% over last year’s first quarter,
but air visitors declined by 5.4%.
During 1Q11, hotel occupancy rate decreased to 49.5%
from 53% same quarter, last year
Total building permit values were flat in 1Q11 with a slight
decrease of 0.69% compared to 1Q10
17
Florida
Number of homes sold increased 8% in 2011 compared to
last year but average sales price dropped 3% to $131,700
December unemployment rate²
was 9.9%. It reflects a 0.1
point decrease compared to November
Total number of tourist visitors for the 3Q11 decreased by
3.77%, when compared to 2Q11, reaching 20.4 million
Number of total residential building permits issued
increased 11% in 2011 versus 2010
US Virgin Island’s Unemployment Rate³
Florida single family
median home price¹
$-
$50,000
$100,000
$150,000
$200,000
$250,000
$300,000
$350,000
$400,000
2000
2001
2002
2003
2004
2005
2006
2007
2008
2009
2010
2011
Statewide
Fort Lauderdale
Miami
Orlando
Tampa
8.0%
7.9%
8.3%
8.1%
8.5%
9.4%
9.2%
9.7%
8.7%
8.8%
9.0%
9.5%
8.5%
9.6%
10.4%
11.0%
10.4%
10.6%
7.5%
7.3%
7.1%
8.3%
7.6%
8.1%
8.6%
4.0%
12.0%
Jan-10
Mar-10
May-10
Jul-10
Sep-10
Nov-10
Jan-11
Mar-11
May-11
Jul-11
Sep-11
Territory
St. Croix
St. Thomas/ St. John
1 Florida Association of Realtors, Moody’s Economy.com 2 Seasonally
adjusted, preliminary data provided by the U.S. Bureau of Labor Statistics 3
VI Bureau of Economic Research, Bureau of Labor Statistics, US Census
|
 18
Non-performing Assets
($ in millions)
1 Collateral pledged with Lehman Brothers Special Financing, Inc.
12/31/2011
3/31/2010
% change
Non-performing loans held for investment
Residential mortgage
338
$
447
$
-24%
Commercial mortgage
240
230
4%
Commercial & Industrial
270
228
18%
Construction
250
685
-64%
Consumer Loans & Finance Leases
40
49
-19%
Total non-performing loans held for investment
1,138
1,639 -31%
REO
114
73
56%
Other repossessed property
15
12
23%
Other
assets¹
65
65
0%
Total non-performing assets, excluding loans held for sale
1,333
1,790 -26%
Non-performing loans held for sale
5
-
-
Total non-performing assets, including loans
held for sale $ 1,337
$ 1,790
-25% |
 1 Tier 1
capital excludes net unrealized gains (losses) on available-for-sale debt securities and net unrealized gains on available-for-sale equity securities with readily determinable fair values, inaccordance with
regulatory risk-based capital guidelines. In arriving at Tier 1 capital, institutions are
required to deduct net unrealized losses on available-for-sale equity securities with readily determinable fair values, net of tax.
2 Approximately $13 million of the Corporation's deferred tax assets at December 31, 2011 was
included without limitation in regulatory capital pursuant to the risk-based capital guidelines. According to regulatory
capital guidelines, the deferred tax assets that are dependent upon future taxable income are
limited for inclusion in Tier 1 capital to the lesser of: (i) the amount of such deferred tax asset that the entity expects to
realize within one year of the calendar quarter end-date, based on its projected future
taxable income for that year, or (ii) 10% of the amount of the entity's Tier 1 capital. Approximately $8 million of the Corporation's
other net deferred tax liability at December 31, 2011 represented primarily the deferred tax
effects of unrealized gains and losses on available-for-sale debt securities, which are permitted to be excluded prior to
deriving the amount of net deferred tax assets subject to limitation under the
guidelines. 19
Tangible Common Equity Ratio Reconciliation
($ in millions)
12/31/2011
12/31/2011
Total equity -
GAAP
$ 1,444
Total equity -
GAAP
$ 1,444
Preferred equity
(63)
Qualifying preferred stock
(63)
Goodwill
(28)
Unrealized gain on available-for-sale securities
1
(19)
Core deposit intangible
(12)
Disallowed deferred tax asset
2
-
Tangible common equity
$ 1,341
Goodwill
(28)
Core deposit intangible
(12)
Total assets -
GAAP
$ 13,127
Cummulative change gain in fair value of liabilities
accounted for under a fair value option
(2)
Goodwill
(28)
Other disallowed assets
(1)
Core deposit intangible
(12)
Tier 1 common equity
$ 1,319
$ 13,087
Total risk-weighted assets
$ 10,182
205,134
Tier 1 common equity to risk-weighted assets ratio
12.96%
10.25%
$
6.54 Tangible book value per common
Tangible equity:
Tangible assets:
Tangible assets
Common shares outstanding
Tangible common equity ratio |
 20
Adjusted Pre-tax, Pre-provision Income Reconciliation
($ in thousands)
12/31/2011
9/30/2011
6/30/2011
3/31/2011
12/31/2010
9/30/2010
6/30/2010
3/31/2010
Loss before income taxes
(14,600)
$
(21,158)
$
(12,318)
$
(24,834)
$
(158,016)
$
(76,196)
$
(86,817)
$
(100,138)
$
Add: Provision for loan and lease losses
41,987
46,446
59,184
88,732
196,347
120,482
146,793
170,965
Less: Net (gain) loss on sale and OTTI of investment
securities
1,014
(12,156)
(21,342)
(19,341)
620
(48,281)
(24,237)
(30,764)
Less: Gain on sale of FirstBank Insurance VI
-
-
-
(2,845)
-
-
-
-
Add: Unrealized loss (gain) on derivatives instruments
and liabilities measured at fair value
1,746
2,555
1,162
253
(90)
1,464
(3,409)
1,733
Add: Loss on early extinguishment of repurchase
agreement
-
9,012
1,823
-
-
47,405
-
-
Add: Equity in losses (gains) of unconsolidated entities
(1,666)
4,357
1,536
-
Adjusted Pre-tax, pre-provision income
28,481
$
29,056
$
30,045
$
41,965
$
38,861
$
44,874
$
32,330
$
41,796
$
Quarter Ended |
 21
Reconciliation of the (Loss) Earnings per Common Share
($ in thousands, except per share information)
1 Includes a non-cash adjustments of $0.2 million for the quarter ended June 30, 2011 and
of $11.3 million for the quarter ended December 31, 2010 as an acceleration of the Series G preferred stock
discount accretion pursuant to amendments to the exchange agreement with the U.S. Treasury,
the sole holder of the Series G Preferred Stock. 2 Excess of carrying amount of the Series G Preferred Stock exchanged over the fair value of
new common shares issued in the fourth quarter of 2011. 3 Excess of carrying amount of Series A through E preferred stock exchanged over the fair
value of new common shares issued in the third quarter of 2010.
4 Excess of carrying amount of Series F preferred stock exchanged and original warrant over
the fair value of Series G preferred stock issued in the third quarter of 2010 and amended warrant.
5 All share and per share data have been adjusted to retroactively reflect the
1-for-15 reverse stock split effected January 7, 2011. 6 For the quarter ended December 31, 2011, the diluted (loss) per share, excluding the
one-time favorable impact of $278.0 million from issuing common stock in exchange for the Series G Preferred
Stock, held by the U.S. Treasury, was $(0.08).
7 For the quarter ended December 31, 2010, the diluted (loss) per share, excluding the $102.9
million charge associated with loans transferred to held for sale was $(7.84).
4Q 2011
3Q 2011
2Q 2011
1Q 2011
4Q 2010
3Q 2010
2Q 2010
1Q 2010
Net loss
(14,842)
$
(24,046)
$
(14,924)
$
(28,420)
$
(251,436)
$
(75,233)
$
(90,640)
$
(106,999)
$
Cumulative non-convertible preferred stock dividends (Series F)
-
-
-
-
-
(1,618)
(5,000)
(5,000)
Cumulative convertible preferred stock dividend (Series G)
(997)
(5,302)
(5,302)
(5,302)
(5,302)
(4,183)
-
-
Preferred
stock
discount
accretion
(Series
G
and
F)
1
(145)
(1,795)
(1,979)
(1,716)
(13,133)
(1,688)
(1,170)
(1,152)
Favorable impact from issuing common stock in exchange for
Series
G
preferred
stock,
net
of
issuance
costs
2
277,995
-
-
-
-
-
-
-
Favorable impact from issuing common stock in exchange for
Series
A
through
E
preferred
stock
net
of
issuance
costs
3
-
-
-
-
-
385,387
-
-
Favorable impact from issuing Series G mandatorily convertible
preferred
stock
in
exchange
for
Series
F
preferred
stock
4
-
-
-
-
-
55,122
-
-
Net
(loss)
income
attributable
to
common
stockholders
-
basic
262,011
$
(31,143)
$
(22,205)
$
(35,438)
$
(269,871)
$
357,787
$
(96,810)
$
(113,151)
$
Convertible preferred stock dividends and accretion
1,142
-
-
-
-
5,626
-
-
Net
(loss)
income
attributable
to
common
stockholders
-
diluted
263,153
$
(31,143)
$
(22,205)
$
(35,438)
$
(269,871)
$
363,413
$
(96,810)
$
(113,151)
$
Average
common
shares
outstanding
5
192,546
21,303
21,303
21,303
21,303
11,432
6,168
6,168
Average
potential
common
shares
5
2,195
-
-
-
-
75,119
-
-
Average
common shares
outstanding
-
assuming
dilution
5
194,741
21,303
21,303
21,303
21,303
86,551
6,168
6,168
Basic
(loss)
earnings
per
common
share
5
1.36
$
(1.46)
$
(1.04)
$
(1.66)
$
(12.67)
$
31.30
$
(15.70)
$
(18.34)
$
Diluted
(loss)
earnings
per
common
share
5
1.35
$
6
(1.46)
$
(1.04)
$
(1.66)
$
(12.67)
$
7
4.20
$
(15.70)
$
(18.34)
$ |