Attached files
| file | filename |
|---|---|
| EX-23.1 - CONSENT - FARO TECHNOLOGIES INC | d262526dex231.htm |
| EX-31.A - CERTIFICATION - FARO TECHNOLOGIES INC | d262526dex31a.htm |
| EX-99.1 - PROPERTIES - FARO TECHNOLOGIES INC | d262526dex991.htm |
| EX-32.B - CERTIFICATION - FARO TECHNOLOGIES INC | d262526dex32b.htm |
| EX-32.A - CERTIFICATION - FARO TECHNOLOGIES INC | d262526dex32a.htm |
| EX-21.1 - SUBSIDIARIES - FARO TECHNOLOGIES INC | d262526dex211.htm |
| EX-31.B - CERTIFICATION - FARO TECHNOLOGIES INC | d262526dex31b.htm |
| EX-10.8 - SUMMARY OF DIRECTOR COMPENSATION PROGRAM - FARO TECHNOLOGIES INC | d262526dex108.htm |
Table of Contents
UNITED STATES
SECURITIES AND EXCHANGE COMMISSION
WASHINGTON, D.C. 20549
FORM 10-K
| x | ANNUAL REPORT PURSUANT TO SECTION 13 OR 15(d) OF THE SECURITIES EXCHANGE ACT OF 1934 |
For the fiscal year ended December 31, 2011
or
| ¨ | TRANSITION REPORT PURSUANT TO SECTION 13 OR 15(d) OF THE SECURITIES EXCHANGE ACT OF 1934 |
For the transition period from to
Commission File Number 0-23081
FARO TECHNOLOGIES, INC.
(Exact name of Registrant as Specified in Its Charter)
| Florida | 59-3157093 | |
| (State or Other Jurisdiction of Incorporation or Organization) |
(I.R.S. Employer Identification Number) |
| 250 Technology Park, Lake Mary, FL | 32746 | |
| (Address of Principal Executive Offices) | (Zip Code) |
(Registrant’s telephone number, including area code): (407) 333-9911
Securities registered pursuant to Section 12(b) of the Act:
| Title of each class |
Name of each exchange on which registered | |
| Common Stock, par value $.001 | NASDAQ Global Select Market |
Securities registered pursuant to Section 12(g) of the Act: None
Indicate by check mark if the registrant is a well-known seasoned issuer, as defined in Rule 405 of the Securities Act. Yes x No ¨
Indicate by check mark if the registrant is not required to file reports pursuant to Section 13 or Section 15(d) of the Exchange Act. Yes ¨ No x
Indicate by check mark whether the registrant: (1) has filed all reports required to be filed by Section 13 or 15(d) of the Securities Exchange Act of 1934 during the preceding 12 months (or for such shorter period that the registrant was required to file such reports), and (2) has been subject to such filing requirements for the past 90 days. Yes x No ¨
Indicate by check mark whether the registrant has submitted electronically and posted on its corporate Web site, if any, every Interactive Data File required to be submitted and posted pursuant to Rule 405 of Regulation S-T (§ 229.405 of this chapter) during the preceding 12 months (or for such shorter period that the registrant was required to submit and post such files). Yes x No ¨
Indicate by check mark if disclosure of delinquent filers pursuant to Item 405 of Regulation S-K is not contained herein, and will not be contained, to the best of registrant’s knowledge, in definite proxy or information statements incorporated by reference in Part III of this Form 10-K or any amendment to this Form 10-K. x
Indicate by check mark whether the registrant is a large accelerated filer, an accelerated filer, a non-accelerated filer or a smaller reporting company. See definitions of “large accelerated filer,” “accelerated filer” and “smaller reporting company” in Rule 12b-2 of the Exchange Act. (Check one):
| Large accelerated filer | x | Accelerated filer | ¨ | |||
| Non-accelerated filer | ¨ (Do not check if a smaller reporting company) | Smaller Reporting Company | ¨ | |||
Indicate by check mark whether the Registrant is a shell company (as defined in Rule 12b-2 of the Act). Yes ¨ No x
The aggregate market value of the Registrant’s common stock held by non-affiliates of the Registrant on July 1, 2011, the last business day of the registrant’s most recently completed second fiscal quarter, was approximately $708 million (based on the last sale on such date on the NASDAQ Global Select Market).
As of February 9, 2012, there were outstanding 16,772,131 shares of the Registrant’s common stock.
DOCUMENTS INCORPORATED BY REFERENCE
Portions of the Registrant’s proxy statement for the 2012 Annual Meeting of Shareholders are incorporated by reference in Part III of this Annual Report on Form 10-K.
Table of Contents
Page
Table of Contents
CAUTIONARY STATEMENTS FOR FORWARD-LOOKING INFORMATION
Some of the statements made in this Annual Report on Form 10-K are “forward-looking statements” within the meaning of Section 27A of the Securities Act of 1933 and Section 21E of the Securities Exchange Act of 1934. Statements that are not historical facts or that describe our plans, beliefs, goals, intentions, objectives, projections, expectations, assumptions, strategies, or future events are forward-looking statements. In addition, words such as “may,” “will,” “believe,” “plan,” “should,” “could,” “seek,” “expect,” “anticipate,” “intend,” “estimate,” “goal,” “objective,” “project,” “forecast,” “target” and similar words identify forward-looking statements.
Forward-looking statements are not guarantees of future performance and are subject to a number of known and unknown risks, uncertainties, and other factors that could cause actual results to differ materially from those expressed or implied by such forward-looking statements. Consequently, undue reliance should not be placed on these forward-looking statements. The Company does not intend to update any forward-looking statements, whether as a result of new information, future events, or otherwise, unless otherwise required by law. Important factors that could cause actual results to differ materially from those contemplated in such forward-looking statements include, among others, the following:
| • | economic downturn in the manufacturing industry or the domestic and international economies in the regions of the world where the Company operates; |
| • | the Company’s inability to further penetrate its customer base and target markets; |
| • | development by others of new or improved products, processes or technologies that make the Company’s products obsolete or less competitive; |
| • | the Company’s inability to maintain its technological advantage by developing new products and enhancing its existing products; |
| • | the Company’s inability to successfully identify and acquire target companies or achieve expected benefits from acquisitions that are consummated; |
| • | the cyclical nature of the industries of the Company’s customers and material adverse changes in its customers access to liquidity and capital; |
| • | the market potential for the computer-aided measurement (“CAM2”) market and the potential adoption rate for the Company’s products are difficult to quantify and predict; |
| • | the inability to protect the Company’s patents and other proprietary rights in the United States and foreign countries; |
| • | fluctuations in the Company’s annual and quarterly operating results and the inability to achieve its financial operating targets as a result of a number of factors including, without limitation (i) litigation and regulatory action brought against the Company, (ii) quality issues with its products, (iii) excess or obsolete inventory, (iv) raw material price fluctuations, (v) expansion of the Company’s manufacturing capability and other inflationary pressures, (vi) the size and timing of customer orders, (vii) the amount of time that it takes to fulfill orders and ship the Company’s products, (viii) the length of the Company’s sales cycle to new customers and the time and expense incurred in further penetrating its existing customer base, (ix) increases in operating expenses required for product development and new product marketing, (x) costs associated with new product introductions, such as product development, marketing, assembly line start-up costs and low introductory period production volumes, (xi) the timing and market acceptance of new products and product enhancements, (xii) customer order deferrals in anticipation of new products and product enhancements, (xiii) the Company’s success in expanding its sales and marketing programs, (xiv) start-up costs associated with opening new sales offices outside of the United States, (xv) fluctuations in revenue without proportionate adjustments in fixed costs, (xvi) the efficiencies achieved in managing inventories and fixed assets, (xvii) investments in potential acquisitions or strategic sales, product or other initiatives, (xviii) shrinkage or other inventory losses due to product obsolescence, scrap or material price changes, (xix) adverse changes in the manufacturing industry and general economic conditions, (xx) compliance with government regulations including health, safety, and environmental matters, (xxi) the ultimate costs of the Company’s monitoring obligations in respect of the Foreign Corrupt Practices Act (“FCPA”) matter; and (xxii) other factors noted herein; |
1
Table of Contents
| • | changes in gross margins due to changing mix of products sold and the different gross margins on different products; |
| • | the Company’s inability to successfully maintain the requirements of Restriction of use of Hazardous Substances (“RoHS”) and Waste Electrical and Electronic Equipment (“WEEE”) compliance into its products; |
| • | the inability of the Company’s products to displace traditional measurement devices and attain broad market acceptance; |
| • | the impact of competitive products and pricing in the CAM2 market and the broader market for measurement and inspection devices; |
| • | the effects of increased competition as a result of recent consolidation in the CAM2 market |
| • | risks associated with expanding international operations, such as fluctuations in currency exchange rates, difficulties in staffing and managing foreign operations, political and economic instability, compliance with import and export regulations, and the burdens and potential exposure of complying with a wide variety of U.S. and foreign laws and labor practices; |
| • | the loss of the Company’s Chief Executive Officer or other key personnel; |
| • | difficulties in recruiting research and development engineers and application engineers; |
| • | the failure to effectively manage the effects of the Company’s growth; |
| • | variations in the effective income tax rate and the difficulty in predicting the tax rate on a quarterly and annual basis; and |
| • | the loss of key suppliers and the inability to find sufficient alternative suppliers in a reasonable period or on commercially reasonable terms; |
as well as other risks and uncertainties discussed in Part I, Item 1A in this Annual Report on Form 10-K. Moreover, new risks and uncertainties emerge from time to time, and we undertake no obligation to update publicly or review the risks and uncertainties included in this Annual Report on Form 10-K.
| ITEM 1. | BUSINESS. |
The Company designs, develops, manufactures, markets and supports portable, software driven, 3-D measurement and imaging systems used in a broad range of manufacturing, industrial, building construction and forensic applications. The Company’s FaroArm®, FARO Laser ScanArm® and FARO Gage articulated measuring devices, the FARO Laser Tracker ION™, the FARO Focus3D, the FARO 3D Imager AMP, and their companion CAM2® software, provide for Computer-Aided Design, or CAD, based inspection and/or factory-level statistical process control and high-density surveying. Together, these products integrate the measurement, quality inspection, and reverse engineering functions with CAD software to improve productivity, enhance product quality and decrease rework and scrap in the manufacturing process. The Company uses the acronym “CAM2” for this process, which stands for computer-aided measurement. As of December 2011, the Company’s products have been purchased by approximately13,000 customers worldwide, ranging from small machine shops to such large manufacturing and industrial companies as Audi, Boeing, Bombadier, Ford, General Electric, General Motors, Honda, Johnson Controls, Komatsu America International, Lockheed Martin, NASA, Northrup Grumman, Siemens and Volkswagen, among many others.
2
Table of Contents
The Company was founded in 1982 and re-incorporated in Florida in 1992. The Company’s worldwide headquarters are located at 250 Technology Park, Lake Mary, Florida 32746, and its telephone number is (407) 333-9911.
Industry Background
The Company believes four principal forces drive the need for its products and services: 1) the widespread use by manufacturers of CAD in product development, which shortens product cycles; 2) the adoption by manufacturers of quality standards such as Six Sigma and ISO-9001 (and its offshoot QS-9000), which stress the measurement of every step in a manufacturing process to reduce or eliminate defects, 3) the inability of traditional measurement devices to address many manufacturing problems such as throughput, efficiency, and accuracy, especially with respect to large components for products such as automobiles, aircraft, heavy duty construction equipment and factory retrofits, and 4) the growing demand to capture large volumes of three-dimensional data for modeling and analysis.
CAD improves the manufacturing process. The creation of physical products involves the processes of design, engineering, production and measurement and quality inspection. These basic processes have been profoundly affected by the computer hardware and software revolution that began in the 1980s. CAD software was developed to automate the design process, providing manufacturers with computerized 3-D design capability and shortening the time between design changes. Today, most manufacturers use some form of CAD software to create designs and engineering specifications for new products and to quantify and modify designs and specifications for existing products. While manufacturers previously designed their products to remain in production for longer periods of time, current manufacturing practices must accommodate more frequent product introductions and modifications, while satisfying more stringent quality and safety standards. Assembly fixtures and measurement tools must be linked to the CAD design to enable production to keep up with the rate of design change.
Quality standards dictate measurement to reduce defects. QS-9000 is the name given to the Quality System Requirements of the automotive industry developed by Chrysler, Ford, General Motors and major truck manufacturers. Companies registered under QS-9000 are considered to have higher standards and better quality products. Six Sigma is a set of quality standards that embodies the principles of total quality management focused on measuring results and reducing product or service failure rates to 3.4 per million. All aspects of a Six Sigma company’s infrastructure must be analyzed, and if necessary, restructured to increase revenues and raise customer satisfaction levels. The all-encompassing nature of these and other quality standards has resulted in manufacturers measuring every aspect of their process, including stages of product assembly that may never have been measured before, in part because of the lack of suitable measurement equipment.
Traditional products do not measure up. A significant aspect of the manufacturing process entails measurement and quality inspection. Historically, manufacturers have measured and inspected products using hand-measurement tools such as scales, calipers, micrometers and plumb lines for simple measuring tasks, test (or check) fixtures for certain large manufactured products, and traditional (or fixed) coordinate measurement machines, or CMM, for objects that require higher precision measurement. However, the broader utility of each of these measurement methods is limited.
3
Table of Contents
Although hand-measurement tools are often appropriate for simple geometric measurements, including hole diameters or length and width of a rectangular component, their use for complex part measurements, such as the fender of a car, is limited. Also, these devices do not allow for the measurements to be directly compared electronically to the CAD model of the part. Test fixtures (customized fixed tools used to make comparative measurements of complex production parts to “master parts”) are relatively expensive and must be reworked or discarded each time a dimensional change is made in the part being measured. In addition, these manual measuring devices do not permit the manufacturer to electronically compare the dimensions of an object with its CAD model.
Conventional CMMs are generally large, fixed-base machines that provide very high levels of precision and provide a link to the CAD model of the object being measured. However, fixed-base CMMs require that the object being measured be brought to the CMM and fit within the CMMs measurement grid. As manufactured subassemblies increase in size and become integrated into even larger assemblies, they become less transportable, thus diminishing the utility of a conventional CMM. Consequently, manufacturers must continue to use hand-measuring tools, or expensive customized test fixtures, to measure large or unconventionally shaped objects. In addition, some parts or assemblies are not easily accessible and cannot be measured using traditional devices.
The market demands three-dimensional data. Conventional surveying equipment is limited to single-point measurements and does not have the capacity to capture and analyze large volumes of three-dimensional data. As data requirements for construction, civil engineering and forensic inspection projects become more complex, single-point measurement devices will become increasingly more difficult to utilize in those applications.
Escalating global competition has created a demand for higher quality products with shorter life cycles. Customers require more rapid design, greater control of the manufacturing process, tools to compare components to their CAD specifications, the ability to precisely measure components that cannot be measured or inspected by conventional devices, and the ability to capture and analyze large volumes of three-dimensional data. Moreover, they increasingly require measurement capabilities to be integrated into manufacturing processes and to be available on the factory floor. These changing demands have driven the demand for FARO’s products and services.
FARO Products
The FaroArm. The FaroArm is a combination of a portable, six or seven-axis, instrumented articulated measurement arm, a computer, and CAM2 software programs, which are described below under “CAM2 Software”.
| ¨ | Articulated Arm – The articulated arm is comprised of three major joints, each of which may consist of one, two or three axes of motion. The articulated arm is available in a variety of sizes, configurations and precision levels suitable for a broad range of applications. To take a measurement, the operator simply touches the object to be measured with a probe at the end of the arm and presses a button. Data can be captured at either individual points or a series of points. Digital rotational transducers located at each of the joints of the arm measure the angles at those joints, and this rotational measurement data is transmitted to an on-board controller that converts the arm angles to precise locations in 3-D space using “xyz” position coordinates and “ijk” orientation coordinates. |
4
Table of Contents
| ¨ | Computer—The Company pre-installs its CAM2 software on either a notebook or desktop style computer, depending on the customer’s need, and the measurement arm, computer and installed software are sold as a system. The Company purchases the computers sold with its products from various suppliers. |
The FARO Laser ScanArm. The FARO Laser ScanArm is a FaroArm equipped with a combination of a hard probe (like that in the FaroArm) and a non-contact line laser probe. This product provides the Company’s customers the ability to measure products without touching them and offers a seven-axis contact/non-contact measurement device with a fully integrated laser scanner. The ScanArm is used for non-contact measurement applications, including inspection, cloud-to-CAD comparison, rapid prototyping, reverse engineering and 3-D modeling.
The FARO Gage. Sold as a combination of an articulated arm device with a computer and software, the FARO Gage is a smaller, higher-accuracy version of the FaroArm. The FARO Gage is also distinguished from the FaroArm by the special mounting features and software unique to the FARO Gage. The FARO Gage is targeted at machine tools and bench tops around machine tools, where basic measurements of smaller machined parts must be measured. As such, the CAM2 FARO Gage software developed for this device, described below, features basic 2-D and 3-D measurements common to these applications.
The FARO Laser Tracker ION. The FARO Laser Tracker ION combines a portable, large-volume laser measurement tool, a computer, and CAM2 software programs.
| ¨ | Laser Tracker – The FARO Laser Tracker ION utilizes an ultra-precise laser beam to measure objects of up to 230 feet. It enables manufacturing, engineering, and quality control professionals to measure and inspect large parts, machine tools and other large objects on-site and in-process. With its greater angular resolution, repeatability, and accuracy, the FARO Laser Tracker ION advances already-proven tracker technology. Among its many enhanced features is AgileADM™, which improves upon existing Absolute Distance Measurement technology by providing the time-saving ability to reacquire the laser beam without the need to return to a known reference point or the need to hold the target stationary. |
| ¨ | Computer – The FARO Laser Tracker ION includes a notebook or desktop style computer, depending on the customer’s requirements, that includes the pre-installed CAM2 Software. |
The FARO Focus3D. The FARO Focus3D utilizes laser technology to measure and collect a cloud of data points, allowing for the detailed and precise three-dimensional rendering of an object or an area as large as a factory. This technology is currently used for factory planning, facility life-cycle management, quality control, forensic analysis and capturing large volumes of three-dimensional data. The FARO Focus3D simplifies modeling, reduces project time and maintains or increases the accuracy of the image. The resulting data is used with major CAD systems or FARO’s own proprietary CAM2 software.
The FARO 3D Imager AMP. The FARO 3D Imager AMP is a high-performance non-contact 3-D Imager, capable of collecting millions of points to generate infinitely-focused fringe patterns. The FARO 3D Imager AMP creates a highly-accurate point cloud of objects in the AMP’s field of view. This technology is used in quality control to improve product quality and reduce scrap, as well as for reverse engineering and rapid manufacturing.
CAM2 Software. CAM2 is the Company’s family of proprietary CAD-based measurement and statistical process control software used with the Company’s measurement devices. The CAM2 product line includes the following software programs, many of which are translated into multiple languages:
5
Table of Contents
| ¨ | CAM2 Q allows the FARO Laser ScanArm to automatically recognize geometric features for non-contact inspection. In addition, customers can measure with multiple FaroArms and FARO Laser Tracker IONs simultaneously to achieve geometry calculations accurate to one half-micron. CAM2 Q also contains a fully customizable user interface, allowing users to create and organize a work environment that best meets the user’s needs. |
| ¨ | CAM2 Measure X allows customers to compare measurements of manufactured components or assemblies with the corresponding CAD data for the components or assemblies. CAM2 Measure X is offered with the FaroArm and the FARO Laser Tracker ION. |
| ¨ | Soft Check Tool is a custom software program designed to lead an operator through a measurement process on the FaroArm or FARO Laser Tracker ION with minimal training. These programs are created by the Company from specifications provided by the customer. |
| ¨ | FARO Gage Software, used with the FARO Gage, includes a dedicated graphical interface designed for the ease of use of the operator. Capable of producing graphical and tabular reports, the software runs a library of gauging and Soft Check tools. |
| ¨ | FARO Focus3D Software. The Company has a number of programs available for use with its Focus3D product, as follows: |
| • | FARO Scout is a software tool for displaying 3-D measurements and navigation in huge pointclouds. |
| • | FARO Scene displays, analyzes, administers and edits 3-D measurements in pointclouds, including registration of multiple pointclouds. |
| • | FARO Cloud for AutoCAD supports the visualization and analysis of millions of 3-D points in the well known AutoCAD software environment and makes possible as-built documentation of industrial structures, historic buildings and many more applications. |
| • | FARO Works is a web-based tool for the administration of complex projects and navigation from floor plan to scan with links to measurements. |
To support its product lines, the Company also offers extended warranties and comprehensive support, training and technology consulting services to its customers.
Customers
As of December 2011, the Company’s products have been purchased by approximately 13,000 customers worldwide, ranging from small machine shops to such large manufacturing and industrial companies as Audi, Bell Helicopter, Boeing, British Aerospace, Caterpillar, Daimler AG, General Electric, General Motors, Honda, Johnson Controls, Komatsu America International, Lockheed Martin, Nissan, Siemens and Volkswagen, among many others, as well as universities and law enforcement agencies. The Company’s ten largest customers by revenue represented an aggregate of approximately 5.1% of the Company’s total revenues in 2011. No customer represented more than 1.0% of the Company’s sales in 2011.
6
Table of Contents
Sales and Marketing
The Company conducts its sales and marketing efforts on a decentralized basis in three main regions around the world: Americas, Europe/Africa and Asia/Pacific. The regional headquarters for the Americas is located in the Company’s headquarters in Lake Mary, Florida; the Europe/Africa regional headquarters is located in Stuttgart, Germany; and the regional headquarters for the Asia/Pacific region is located in Singapore. At December 31, 2011, the Company employed 90, 113, and 124 sales and marketing specialists in the Americas, Europe/Africa, and Asia/Pacific regions, respectively. The Company sells most of its products through direct sales representation in the United States, Canada, Mexico, Brazil, Germany, the United Kingdom, France, Spain, Italy, Poland, Turkey, the Netherlands, India, China, Singapore, Malaysia, Vietnam, Thailand, and Japan. The Company also sells its products through distributors, although this has historically represented a small percentage of total sales. Note 17 to the Company’s “Notes to Consolidated Financial Statements” included in Part II, Item 8 of this Annual Report on Form 10-K includes financial information about the Company’s foreign and domestic operations and export sales.
The Company’s sales and marketing efforts use a process of integrated lead qualification and sales demonstration. Once a customer opportunity is identified, the Company employs a team-based sales approach involving inside and outside sales personnel who are supported by application engineers. Each team has the ability to sell multiple product lines. The Company employs a variety of marketing techniques to promote brand awareness and customer identification.
Research and Development
The Company believes that its future success depends on its ability to maintain technological leadership, which will require ongoing enhancements of its products and the development of new applications and products that provide 3-D measurement solutions. The field of 3-D measurement continues to expand and new technologies and applications will be essential to competing in this market. Accordingly, the Company intends to continue to make substantial investments in the development of new technologies, the commercialization of new products that build on the Company’s existing technological base and the enhancement and development of additional applications for its products.
The Company’s research and development efforts are directed primarily at enhancing the functional adaptability of its current products and developing new and innovative products that respond to specific requirements of the emerging market for 3-D measurement systems. The Company’s research and development efforts have been devoted primarily to mechanical hardware, electronics and software. The Company’s engineering development efforts will continue to focus on enhancing its existing products and developing new products for the CAM2 market. Research and development activities, especially with respect to new products and technologies, are subject to significant risks, and there can be no assurance that any of the Company’s research and development activities will be completed successfully or on schedule, or, if completed, will be commercially accepted.
At December 31, 2011, the Company employed 104 scientists and technicians in its research and development efforts. Research and development expenses were approximately $15.2 million in 2011, compared to $12.7 million in 2010 and $12.6 million in 2009.
Intellectual Property
The Company holds or has pending 158 patents in the United States and related patents worldwide, which generally expire on a rolling basis between 2012 and 2029. The Company also has 22 registered or pending trademarks in the United States and worldwide, which generally expire on a rolling basis between 2013 and 2031.
7
Table of Contents
The Company relies on a combination of contractual provisions and trade secret laws to protect its proprietary information. However, there can be no assurance that the steps taken by the Company to protect its trade secrets and proprietary information will be sufficient to prevent misappropriation of its proprietary information or preclude third-party development of similar intellectual property.
Despite the Company’s efforts to protect its proprietary rights, unauthorized parties may attempt to copy aspects of the Company’s products or to obtain and use information that the Company regards as proprietary. The Company intends to vigorously defend its proprietary rights against infringement by third parties. However, policing unauthorized use of the Company’s products is difficult, particularly overseas, and the Company is unable to determine the extent to which piracy of its software products exists. In addition, the laws of some foreign countries do not protect the Company’s proprietary rights to the same extent as the laws of the United States. The Company’s success and its ability to maintain its competitive position depends, in large part, on its ability to protect its intellectual property.
The Company does not believe that any of its products infringe on the proprietary rights of third parties. There can be no assurance, however, that third parties will not claim infringement by the Company with respect to current or future products. Any such claims, with or without merit, could be time consuming, result in costly litigation, cause product shipment delays or require the Company to enter into royalty or licensing agreements, which could have a material adverse effect upon the Company’s business, operating results and financial condition. In addition, such royalty or licensing agreements, if required, may not be available on terms acceptable to the Company, if at all.
Manufacturing and Assembly
The Company manufactures its FaroArm, FARO Gage, FARO 3D Imager AMP and FARO Laser Tracker ION products in the Company’s manufacturing facilities located in Florida and Pennsylvania for customer orders from the Americas, in its manufacturing facility located in Switzerland for customer orders from the Europe/Africa region, and in its manufacturing facility located in Singapore for customer orders from the Asia/Pacific region. The Company manufactures its FARO Focus3D product in its facility located in Stuttgart, Germany. The Company expects all its existing plants to have the production capacity necessary to support its volume requirements through 2012.
Manufacturing consists primarily of assembling and integrating components and subassemblies purchased from suppliers into finished products. The primary components, which include machined parts and electronic circuit boards, are produced by subcontractors according to the Company’s specifications. All products are assembled, calibrated and tested for accuracy and functionality before shipment. The Company performs limited in-house circuit board assembly and component part machining. Typically, the Company enters into purchase commitments for manufacturing components to cover production requirements for 60 to 90 days.
The Company’s manufacturing, engineering, and design headquarters have been registered to the ISO-9001 standard since July 1998. Semi-annual surveillance audits have documented continuous improvement to this multinational standard. Currently, the Company’s manufacturing sites in Lake Mary, Florida; Kennett Square, Pennsylvania; Stuttgart, Germany; Schaffhausen, Switzerland; and Singapore are jointly registered to ISO-9001 and ISO17025. In addition, the Company’s service sites in the United States, Germany, India, Japan, China, Singapore and Brazil have joint certification and accreditation to these key standards. The Company continues to examine its scope of registration as its business evolves and has chosen English as the standard business language for its operations.
8
Table of Contents
The Company’s efforts to register its manufacturing, engineering and design headquarters to the ISO-9001 standard in concert with the ISO9001:2008 Quality Management System Certification is expected to increase the quality of the Company’s processes, products and services worldwide. Additionally, the Company takes a global approach to ISO17025:2005 regarding the recognition of the Competence of Calibration and Testing Laboratories, seeking to have all locations registered with similar scopes of accreditation and capabilities for the products generated and serviced.
Competition
The Company’s portable measurement systems compete in the broad and highly competitive market for measurement devices for manufacturing and industrial applications, which, in addition to portable articulated arms, laser tracker, 3-D imaging and laser scanner products, consist of fixed-base CMMs, templates and go/no-go gages, check fixtures, handheld measurement tools, and various categories of surveying equipment. In the FARO Gage product line, the Company competes with a number of manufacturers of handheld measurement tools and fixed-base CMMs, including some large, well-established companies. In the FaroArm, FARO Laser ScanArm, FARO Laser Tracker ION, FARO Focus3D and FARO 3D Imager AMP product lines, the Company competes primarily with Hexagon Metrology, a division of Hexagon, and with Steinbichler Optotechink GmbH and GOM Gmbh in the 3D Imager product lines. The Company also competes in these product lines with a number of other smaller competitors. The Company competes on the basis of technical innovation, product performance, quality and price with respect to all of its products.
The Company will be required to make continued investments in technology and product development to maintain and extend the technological advantage that it believes it currently has over its competition. Some of the Company’s competitors, including some manufacturers of fixed-base CMMs and Hexagon, possess substantially greater financial, technical, and marketing resources than the Company possesses. Moreover, the Company cannot be certain that its technology or its product development efforts will allow the Company to successfully compete as the industry evolves. As the market for the Company’s portable measurement systems expands, additional competition may emerge and the Company’s existing and future competitors may commit more resources to the markets in which the Company participates.
Government Regulation
The Company’s operations are subject to numerous governmental laws and regulations, including those governing antitrust and competition, the environment, import and export of products, currency conversions and repatriation, taxation of foreign earnings and earnings of expatriate personnel and use of local employees and suppliers. The Company’s foreign operations are subject to the U.S. Foreign Corrupt Practices Act, or FCPA, and similar foreign anti-corruption laws, which makes illegal any payments to government officials or government employees that are intended to induce their influence to assist the Company or to gain any improper advantage for the Company. The Company operates in certain regions that are more highly prone to risk under these anti-corruption laws.
Manufacturers of electrical goods are subject to the European Union’s RoHS and WEEE directives, which took effect during 2006. RoHS prohibits the use of lead, mercury and certain other specified substances in electronics products, and WEEE makes producers of electrical goods financially responsible for specified collection, recycling, treatment, and disposal of covered electronic products and components. Parallel initiatives are being proposed in other jurisdictions, including several states in the United States and China.
9
Table of Contents
The Company currently holds WEEE registration and is in compliance with the directives of the European Union. The Company’s products are currently exempt from the RoHS directive, although the Company expects to have all products in compliance in 2012. However, if the Company is unable to do so, and the RoHS exemption is removed, it would be unable to sell its products in European Union countries and China, as well as several possible states in the United States, which would have a material adverse effect on its sales and results of operations.
Backlog
At December 31, 2011, the Company had orders representing approximately $20.2 million in sales outstanding. The majority of these specific orders were shipped by February 9, 2012, and, as of February 9, 2012, the Company had orders representing approximately $20.4 million in sales outstanding. The Company believes that substantially all of the outstanding sales orders as of February 12, 2012 will be shipped during 2012. At December 31, 2010 and 2009, the Company had orders representing approximately $23.0 million and $17.6 million in sales outstanding, respectively.
Employees
At December 31, 2011, the Company had 885 full-time employees, consisting of 327 sales and marketing professionals, 157 production staff, 104 research and development staff, 113 administrative staff, and 184 customer service/application engineering specialists. The Company is not a party to any collective bargaining agreements and believes its employee relations are satisfactory. Management believes that its future growth and success will depend in part on its ability to retain and continue to attract highly skilled personnel. The Company anticipates that it will be able to obtain the additional personnel required to satisfy its staffing requirements over the foreseeable future.
Geographic Information
The Company has three reportable segments based upon geographic regions: Americas, Europe/Africa and Asia Pacific. The Company develops, manufactures, markets, supports and sells CAD-based quality assurance products integrated with CAD-based inspection and statistical process control software in each of these regions. These activities represent approximately 99% of consolidated sales. The Company evaluates performance and allocates resources based upon profitable growth and assets deployed. Information regarding the Company’s net sales, operating income, and long-lived assets by geographic region is set forth in Note 17 to the Consolidated Financial Statements under Part II, Item 8 to this Annual Report on Form 10-K.
Available Information
The Company makes available, free of charge on its Internet website at http://www.faro.com, its Annual Report on Form 10-K, quarterly reports on Form 10-Q, current reports on Form 8-K, and any amendments to those reports filed or furnished pursuant to Section 13(a) or 15(d) of the Securities Exchange Act of 1934, as amended, or the Exchange Act, as soon as reasonably practicable after they are electronically filed with, or furnished to, the Securities and Exchange Commission, or the SEC. You can find these reports on the Company’s website at www.faro.com under the heading “Investor”. The information on the Company’s website is not a part of this Annual Report on Form 10-K.
These reports may also be obtained at the SEC’s Public Reference Room at 100 F Street NE, Washington, DC 20549. Information on the operation of the Public Reference Room is available by calling the SEC at (800) SEC-0330. You may also access this information at the SEC’s website at http://www.sec.gov. This site contains reports, proxy and information statements and other information regarding issuers that file electronically with the SEC.
10
Table of Contents
| ITEM 1A. | RISK FACTORS. |
The statements under this heading describe the most significant risks to the Company’s business identified by management and should be considered carefully in conjunction with the discussion under the heading “Management’s Discussion and Analysis of Financial Condition and Results of Operations” and the Company’s “Notes to Consolidated Financial Statements” included in Part II, Item 8 of this Annual Report on Form 10-K.
Any of the following risks and uncertainties could materially and adversely affect our business, results of operations, liquidity, and financial condition. However, predicting or identifying all such risks and uncertainties is not possible. As a result, the following factors should not be considered to be a complete discussion of the Company’s risks and uncertainties.
Competitors may develop products that make the Company’s products obsolete or less competitive.
The CAM2 market is characterized by rapid technological change. Competitors may develop new or improved products, processes or technologies that may make the Company’s products obsolete or less competitive.
As a result, the Company’s success depends, in part, on its ability to maintain its technological advantage by developing new products and applications and enhancing its existing products, which can be complex and time-consuming and require substantial investment by the Company. Significant delays in new product releases or difficulties in developing new products could adversely affect the Company’s business, revenues and results of operations. The Company can provide no assurance that it will be able to adapt to evolving markets and technologies or maintain its technological advantage.
The Company’s financial performance is dependent on the conditions of the automotive, aerospace, and heavy equipment industries, which have recently experienced and may again experience significant disruptions in the current economic environment.
A significant portion of the Company’s sales are to manufacturers in the automotive, aerospace, and heavy equipment industries. The Company is dependent upon the continued viability and financial stability of its customers in these industries, which are highly cyclical and dependent upon the general health of the economy and consumer spending.
Customers’ buying process for the Company’s products is highly decentralized and typically requires significant time and expense for the Company to further penetrate the potential market of a specific customer, which may delay its ability to generate additional revenue.
The Company’s success depends, in part, on its ability to further penetrate its customer base. During 2011, approximately 58% of the Company’s revenue was attributable to sales to its existing customers. If the Company is not able to continue to further penetrate its existing customer base, its sales growth may decline. However, most of the Company’s customers have a decentralized buying process for measurement devices, and the Company must spend significant time and resources to increase revenues from a specific customer. For example, the Company may provide products to only one of its customer’s manufacturing facilities or for a specific product line within a manufacturing facility. The Company cannot offer any assurance that it will be able to maintain or increase the amount of sales to its existing customers, which could adversely affect its financial condition and target financial results.
The Company’s ability to protect its patents and proprietary rights in the United States and foreign countries could adversely affect its revenues.
11
Table of Contents
The Company’s success depends, in large part, on its ability to obtain and maintain patents and other proprietary right protection for its processes and products in the United States and other countries. The Company also relies upon trade secrets, technical know-how and continuing inventions to maintain its competitive position. The Company seeks to protect its technology and trade secrets, in part, by confidentiality agreements with its employees and contractors. However, the Company’s employees may breach these agreements or the Company’s trade secrets may otherwise become known or be independently discovered by inventors. If the Company is unable to obtain or maintain protection of its patents, trade secrets and other proprietary rights, it may not be able to prevent third parties from using its proprietary rights, which could have a material adverse effect on the Company’s results of operations.
The Company’s patent protection involves complex legal and technical questions. Its patents may be challenged, narrowed, invalidated or circumvented. Further, the Company may be able to protect its proprietary rights from infringement by third parties only to the extent that its proprietary processes and products are covered by valid and enforceable patents or are effectively maintained as trade secrets. Furthermore, others may independently develop similar or alternative technologies or design around the Company’s patented technologies. Litigation or other proceedings to defend or enforce its intellectual property rights could require the Company to spend significant time and money, which could have an adverse impact on the Company’s financial condition.
Claims from others that the Company infringes their intellectual property rights may adversely affect its business and financial condition.
From time to time, the Company receives notices from others claiming it infringes their intellectual property rights. Responding to these claims may require the Company to enter into royalty or licensing agreements on unfavorable terms, require it to stop selling or to redesign affected products, or require it to pay damages. In addition, from time to time, the Company is involved in intellectual property lawsuits. On July 11, 2008, Nikon Metrology, Inc. (formerly Metris USA, Inc.) filed a complaint for patent infringement against the Company concerning two U.S. patents. The Company believes that it does not infringe the asserted patents and that the patents are invalid. Although it is not possible to predict with certainty the outcome of every claim and lawsuit, the Company believes that the complaint by Nikon will not have a material impact on the Company’s results. However, the Company could in the future incur judgments or enter into settlements of lawsuits and claims that could have a material adverse effect on the Company’s financial condition. Any litigation or interference proceedings, regardless of their outcome, may be costly and may require significant time and attention of the Company’s management and technical personnel.
Product failures or product availability and performance issues could result in increased warranty costs, delays in new product introductions and enhancements and adversely affect the Company’s business.
The Company regularly introduces new products and enhances existing products. Product failures in new or existing products of the Company could result in increased warranty costs and delays in new product introductions, which could lead to a loss of sales and customers and have an adverse effect on the Company’s business and financial condition.
The Company may not be able to achieve financial results within its target goals, and its operating results may fluctuate due to a number of factors, many of which are beyond its control.
The Company’s ability to achieve financial results that are within its goals is subject to a number of factors beyond its control. Moreover, the Company’s annual and quarterly operating results have varied significantly in the past and likely will vary significantly in the future. Factors that cause the Company’s financial results to fluctuate include, but are not limited to, the following:
12
Table of Contents
| • | adverse changes in the manufacturing industry and general economic conditions, |
| • | the effectiveness of sales promotions and sales of demonstration equipment; |
| • | geographic expansion in the Asia/Pacific region and other regions; |
| • | training and ramp-up time for new sales people; |
| • | investments in potential acquisitions or strategic sales, product or other initiatives; |
| • | investments in technologies and new products and product enhancements, including costs associated with new product introductions and the timing and market acceptance of new products and product enhancements; |
| • | quality issues with the Company’s products; |
| • | shrinkage or other inventory losses due to product obsolescence, scrap or material price changes; |
| • | expansion of the Company’s manufacturing capability and other inflationary pressures; |
| • | the size and timing of customer orders, many of which are received towards the end of the quarter; |
| • | the amount of time that it takes to fulfill orders and ship the Company’s products; |
| • | the length of the Company’s sales cycle to new customers; |
| • | customer order deferrals in anticipation of new products and product enhancements; |
| • | start-up costs and ramp-up time associated with opening new sales offices outside of the United States; |
| • | variations in the effective income tax rate and the difficulty in predicting the tax rate on a quarterly and annual basis; and |
| • | litigation and regulatory action brought against the Company. |
Any one or a combination of these factors could adversely affect the Company’s annual and quarterly operating results in the future and could cause it to fail to achieve its target financial results.
The Company’s growth depends on the ability of the Company’s products to attain broad market acceptance.
The market for traditional fixed-base CMMs, check fixtures, handheld measurement tools, and surveying equipment is mature. Part of the Company’s strategy is to continue to displace these traditional measurement devices. Displacing traditional measurement devices and achieving broad market acceptance of the Company’s products requires significant effort to convince manufacturers to reevaluate their historical measurement procedures and methodologies.
13
Table of Contents
The CAM2 market is emerging and the potential size and growth rate of this market is uncertain and difficult to quantify. If the CAM2 market does not continue to expand or does not expand as quickly as the Company anticipates, it may not be able to grow its sales, which may affect its financial results.
The Company markets six closely interdependent products (FaroArm, FARO Laser ScanArm, FARO Focus3D, FARO Laser Tracker ION, FARO Gage and FARO 3D Imager AMP) and related software for use in measurement, inspection, and high density surveying applications. Substantially all of the Company’s revenues are currently derived from sales of these products and software, and it plans to continue its business strategy of focusing on the portable software-driven, 3-D measurement and inspection market. Consequently, the Company’s financial performance will depend in large part on portable, computer-based measurement, inspection, and high density surveying products achieving broad market acceptance. If its products cannot attain broad market acceptance, the Company will not grow as anticipated and may be required to make increased expenditures on research and development for new applications or new products.
The Company competes with manufacturers of portable measurement systems and traditional measurement devices, many of which have more resources than the Company and may develop new products and technologies.
The broad market for measurement devices is highly competitive. In the FARO Gage product line, the Company competes with manufacturers of handheld measurement tools and fixed-base CMMs, including some large, well-established companies. In the FaroArm, FARO Laser ScanArm, FARO Laser Tracker ION, FARO Focus3D and FARO 3D Imager AMP product lines, the Company competes primarily with Hexagon Metrology, a division of Hexagon, and with Steinbichler Optotechink GmbH and GOM mbh in the 3D Imager product lines. The Company also competes in these product lines with a number of other smaller competitors. The Company competes on the basis of technical innovation, product performance, quality, and price with respect to all of its products.
The Company will be required to make continued investments in technology and product development to maintain the technological advantage that it believes it currently has over its competition. Some of its competitors, including some manufacturers of fixed based CMMs and Hexagon, possess substantially greater financial, technical, and marketing resources than it possesses. Moreover, the Company cannot be certain that its technology or its product development efforts will allow it to successfully compete as the industry evolves. As the market for its portable measurement systems expands, additional competition may emerge and the Company’s existing and future competitors may commit more resources to the markets in which the Company participates. The Company’s results of operations could be adversely affected by pricing strategies pursued by competitors or technological or product developments by competitors.
The Company derives a substantial part of its revenues from its international operations, which are subject to greater volatility and often require more management time and expense to achieve profitability than its domestic operations.
The Company derives more than half of its revenues from international operations. The Company’s international operations are subject to various risks, including:
| • | difficulties in staffing and managing foreign operations; |
| • | political and economic instability; |
| • | unexpected changes in regulatory requirements and laws; |
14
Table of Contents
| • | longer customer payment cycles and difficulty collecting accounts receivable; |
| • | compliance with export and import regulations and trade restrictions; |
| • | governmental restrictions on the transfer of funds to the Company from its operations outside the United States; and |
| • | burdens of complying with a wide variety of foreign laws and labor practices. |
Several of the countries where the Company operates have emerging or developing economies, which may be subject to greater currency volatility, negative growth, high inflation, limited availability of foreign exchange and other risks. These factors may harm the Company’s results of operations and any measures that it may implement to reduce the effect of volatile currencies and other risks of its international operations may not be effective.
Because a significant portion of the Company’s revenues and expenses are denominated in foreign currencies, the Company faces significant exposure to foreign exchange rate risk.
Approximately 62% of the Company’s sales are denominated in currencies other than the U.S. dollar. As a result, the Company’s results of operations are affected by fluctuations in exchange rates, which can cause significant fluctuations in the Company’s quarterly and annual results of operations. Fluctuations in exchange rates between the U.S. dollar and such foreign currencies may have a material adverse effect on the business, results of operations and financial condition, and could specifically result in foreign exchange gains and losses. To the extent that the percentage of its non-U.S. dollar revenues derived from international sales increases in the future, the Company’s exposure to risks associated with fluctuations in foreign exchange rates will increase.
Any failure to comply with the Company’s settlement of the Foreign Corrupt Practices Act Matter or anti-corruption laws could subject the Company to fines and penalties.
The Company has entered into settlement agreements and documents with the SEC and the Department of Justice, or DOJ, concerning certain payments made by the Company’s China subsidiary that may have violated the Foreign Corrupt Practices Act, or the FCPA, and other applicable laws, which we refer to as the FCPA Matter, pursuant to which the Company has, among other things, continuing obligations with the SEC and the DOJ with respect to compliance with the FCPA and other laws, full cooperation with the government, and the adoption of a compliance code containing specific provisions intended to prevent violations of the FCPA. Any failure to comply with any such continuing obligations could result in the SEC and the DOJ seeking to impose penalties against the Company in the future. In addition, many countries in which the Company operates have increased regulation regarding anti-corruption practices generally. Compliance with such regulations could be costly and could adversely impact the Company’s results of operations or delay entry into new markets.
The Company may not be able to identify, consummate or achieve expected benefits from acquisitions, which could harm its growth.
The Company’s growth strategy partly depends on its ability to obtain additional technologies, complementary product lines and sales channels through selective acquisitions and strategic investments. The Company may not be able to identify and successfully negotiate suitable acquisitions, obtain financing for future acquisitions, if necessary, on satisfactory terms or otherwise complete acquisitions in the future. In the past, the Company has used its stock as consideration for acquisitions. The Company’s common stock may not remain at a price at which it can be used as consideration for acquisitions without diluting the Company’s existing shareholders, and potential acquisition candidates may not view the Company’s stock attractively.
15
Table of Contents
In addition, realization of the benefits of acquisitions often requires integration of some or all of the sales and marketing, distribution, manufacturing, engineering, finance and administrative organizations of the acquired companies. The integration of acquisitions demands substantial attention from senior management and the management of the acquired companies. Any acquisition may be subject to a variety of risks and uncertainties including:
| • | the inability to assimilate effectively the operations, products, technologies and personnel of the acquired companies (some of which may be located in diverse geographic regions); |
| • | the inability to maintain uniform standards, controls, procedures and policies; |
| • | the need or obligation to divest portions of the acquired companies; and |
| • | the potential impairment of relationships with customers. |
The Company cannot offer any assurance that it will be able to identify or complete suitable acquisitions, integrate successfully any acquisitions, that any acquired companies will operate profitably, or that it will realize the expected benefits from any acquisition.
The Company may face difficulties managing the effects of its growth.
If its business grows rapidly in the future, the Company expects it to result in:
| • | increased complexity; |
| • | increased responsibility for existing and new management personnel; and |
| • | incremental strain on its operations and financial and management systems. |
| • | If the Company is not able to manage the effects of its future growth, its business, financial condition and operating results may be harmed. |
The Company’s dependence on suppliers for materials could impair its ability to manufacture its products.
Outside vendors provide key components used by the Company in the manufacture of its products. Any supply interruption in a limited source component would harm its ability to manufacture its products until a new source of supply is identified. In addition, an uncorrected defect or supplier’s variation in a component, either known or unknown to the Company, or incompatibility with its manufacturing processes could harm its ability to manufacture its products. The Company may not be able to find a sufficient alternative supplier in a reasonable period, or on commercially reasonable terms, if at all. If the Company fails to obtain a supplier for the manufacture of components of its potential products, it may experience delays or interruptions in its operations, which would adversely affect its business, results of operations and financial condition.
16
Table of Contents
The Company’s failure to attract and retain qualified personnel could lead to a loss of sales or decreased profitability or growth.
The Company may not be able to attract and retain sufficient qualified personnel to support its growth. In addition, the loss of the Company’s Chief Executive Officer, or other key personnel, could adversely affect its sales, profitability, or growth. Moreover, the Company continues to rely in part on equity awards to attract and retain qualified personnel, which may result in an increase in compensation expense.
The Company is subject to risks of natural disasters.
The occurrence of one or more natural disasters, such as tornadoes, hurricanes, earthquakes, floods and other forms of severe weather in any region where the Company has a facility could result in physical damage to, and complete or partial closure of, one or more of the Company’s manufacturing facilities, which could adversely affect the Company’s business, operations and financial performance. Interruptions in the Company’s manufacturing operations or damage to its manufacturing facilities could reduce the Company’s revenues and increase its costs, and the extent of losses from natural disasters and severe weather will be a function of both the severity of the event and the total amount of insured exposure. Although the Company maintains insurance coverage, it can offer no assurance that its insurance coverage will be adequate to cover any losses or that it will be able to maintain insurance at a reasonable cost in the future. If losses from business interruption or property damage exceed the amounts for which the Company is insured, the Company’s business, results of operations and financial condition could be adversely affected.
The Company may experience volatility in its stock price.
The price of the Company’s common stock has been, and may continue to be, highly volatile in response to various factors, many of which are beyond its control, including:
| • | fluctuations in demand for, and sales of, the Company’s products or prolonged downturns in the industries that the Company serves; |
| • | actual or anticipated variations in quarterly or annual operating results; |
| • | general economic uncertainties; |
| • | speculation in the press or investment community; and |
| • | announcements of technological innovations or new products by the Company or its competitors. |
The market price of the Company’s common stock may also be affected by its inability to meet analyst and investor expectations and failure to achieve projected financial results. Any failure to meet such expectations or projected financial results, even if minor, could cause the market price of the Company’s common stock to decline significantly. Volatility in its stock price may result in the inability of the Company’s shareholders to sell their shares at or above the price at which they purchased them.
In addition, stock markets have generally experienced a high level of price and volume volatility, and the market prices of equity securities of many companies have experienced wide price fluctuations not necessarily related to the operating performance of such companies. These broad market fluctuations may adversely affect the market price of the Company’s common stock. In the past, securities class action lawsuits frequently have been instituted against such companies following periods of volatility in the market price of such companies’ securities. If any such litigation is instigated against the Company, it could result in substantial costs and a diversion of management’s attention and resources, which could have a material adverse effect on its results of operations and financial condition.
17
Table of Contents
Anti-takeover provisions in the Company’s articles of incorporation, its bylaws and provisions of Florida law could delay or prevent a change of control that you may favor.
The Company’s articles of incorporation, its bylaws and provisions of Florida law could make it more difficult for a third party to acquire the Company. Although the Company believes such provisions are appropriate to protect long-term value for its shareholders, these provisions could discourage potential takeover attempts and could adversely affect the market price of the Company’s shares. Because of these provisions, you might not be able to receive a premium on your investment. These provisions include:
| • | a limitation on shareholders’ ability to call a special meeting of the Company’s shareholders; |
| • | advance notice requirements to nominate directors for election to the Company’s board of directors or to propose matters that can be acted on by shareholders at shareholder meetings; |
| • | the Company’s classified board of directors, which means that approximately one-third of its directors are elected each year; and |
| • | the authority of the board of directors to issue, without shareholder approval, preferred stock with such terms as the board of directors may determine. |
The provisions described above could delay or make more difficult transactions involving a change in control of the Company or its management.
| ITEM 1B. | UNRESOLVED STAFF COMMENTS. |
None.
| ITEM 2. | PROPERTIES. |
The Americas
The Company’s headquarters are located in a leased building in Lake Mary, Florida containing approximately 46,000 square feet. This facility houses the Company’s sales, marketing, customer service/application operations and administrative staff. The Company’s U.S. production, research and development and manufacturing are located in a leased building in Lake Mary, Florida consisting of approximately 35,000 square feet. The Company also has a leased facility consisting of two buildings totaling approximately 37,000 square feet located in Kennett Square, Pennsylvania containing research and development, manufacturing and service operations of the laser tracker product lines.
Europe/Africa
The Company’s European headquarters are located in a leased building in Stuttgart, Germany containing approximately 62,000 square feet. This facility houses the manufacturing, administration, sales, marketing and service management personnel for the Company’s European operations. Additionally, the Company has a leased facility consisting of approximately 16,000 square feet located in Schaffhausen, Switzerland containing manufacturing operations for the Company’s products shipped to customers in Europe and Africa.
18
Table of Contents
Asia/Pacific
The Company’s Asian headquarters are located in a leased building in Singapore containing approximately 22,000 square feet. This facility houses the administration, sales, marketing, production, service management personnel and manufacturing for the Company’s Asian operations. The Company’s Japan headquarters are located in a leased building in Nagoya, Japan containing approximately 17,000 square feet. This facility houses the Company’s Japan sales, marketing and service operations. The Company’s China headquarters are located in a leased building in Shanghai, China containing approximately 11,000 square feet for sales, marketing and service operations.
The Company believes that its current facilities will be adequate for its foreseeable needs and that it will be able to locate suitable space for additional regional offices or enhanced production needs as necessary.
The information required by the remainder of this Item is incorporated herein by reference to Exhibit 99.1 to this Annual Report on Form 10-K.
| ITEM 3. | LEGAL PROCEEDINGS. |
Patent Matters — On July 11, 2008, Metris USA, Inc. and its affiliates, Metris N.V., Metris IPR N.V. and 3-D Scanners Ltd., filed a complaint against the Company for patent infringement in the U.S. District Court for the District of Massachusetts (the “Massachusetts Court”) concerning U.S. Patent Nos. 6,611,617 and 7,313,264 (hereinafter, the “patents-in-suit”). Following an acquisition by Nikon Corporation in late 2009, Metris USA, Inc. subsequently changed its name to Nikon Metrology, Inc., Metris N.V. changed its name to Nikon Metrology NV, and Metris IPR N.V. was dissolved and merged into Nikon Metrology NV. We refer to each of Nikon Metrology, Inc., Nikon Metrology NV, and 3-D Scanners Ltd. as “Plaintiffs” or “Nikon”.
The Company responded to the complaint with counterclaims alleging that the patents-in-suit, which are generally directed to laser scanning devices, are invalid, non-infringed, and unenforceable due to fraud during prosecution of the patents in the U.S. Patent and Trademark Office. On August 31, 2009, the Massachusetts Court granted the Company’s motion to add counterclaims and defenses for violation of federal and state antitrust and unfair competition laws based on the alleged knowing assertion of invalid and fraudulent patents. The Company also filed an amended counterclaim to add the Plaintiff’s parent company, Nikon Corporation, as a counterclaim defendant.
On January 29, 2010, the Company filed a motion for summary judgment that the patents-in-suit are unenforceable due to inequitable conduct during patent prosecution. Evidentiary hearings on the issue of inequitable conduct commenced on July 19, 2010 and concluded on October 22, 2010. Post-trial briefing concluded on December 10, 2010. On July 14, 2010, the Company filed a motion for summary judgment of non-infringement of both patents-in-suit. In addition, during the first quarter of 2010, Nikon served a supplemental interrogatory answer revising its alleged date of conception of the patents-in-suit to an earlier date. The Company filed a motion to strike the supplemental interrogatory answer. On August 31, 2010, Nikon filed a motion for summary judgment against the Company’s counterclaims for antitrust violations and unfair trade practices. The Company filed its opposition on October 12, 2010.
A mediation hearing held on February 18, 2011 to settle the matter was unsuccessful. On February 22, 2011, the Massachusetts Court denied Nikon’s motion for summary judgment on the Company’s counterclaims for antitrust violations and unfair trade practices without prejudice. On February 24, 2011, the Massachusetts Court denied the Company’s motion for summary judgment of non-infringement without prejudice. On May 4, 2011, the Massachusetts Court found that, with respect to U.S. Patent No. 6,611,617, Nikon’s patent is unenforceable due to inequitable conduct.
19
Table of Contents
On May 26, 2011, the Company renewed its motion for summary judgment of non-infringement. On June 28, 2011, the Massachusetts Court heard oral arguments on the Company’s motion, as well as on Nikon’s renewed motion for summary judgment on the Company’s counterclaims for anti-trust violations and unfair trade practices. The Massachusetts Court also heard oral arguments regarding an intervening change in the law of inequitable conduct and whether it changes the Massachusetts Court’s May 4, 2011 finding that Nikon’s U.S. Patent No. 6,611,617 is unenforceable due to inequitable conduct.
On September 19, 2011, as a result of these changes in the law of inequitable conduct, the Massachusetts Court vacated its May 4, 2011 decision that U.S. Patent No. 6,611,617 is unenforceable. However, in the same order, the Massachusetts Court ruled that the Company did not infringe U.S. Patent No. 6,611,617. The Massachusetts Court also granted Nikon’s motion for summary judgment on the Company’s counterclaims for anti-trust violations and unfair trade practices. The Massachusetts Court denied the Company’s motion for summary judgment of non-infringement of U.S. Patent No. 7,313,264. The effect of the ruling is to reduce or eliminate the Company’s exposure with respect to claims associated with US. Patent No. 6,611,617, while the patent dispute with respect to U.S. Patent No. 7,313,264 remains ongoing. The Company believes it does not infringe U.S. Patent No. 7,313,264 and that the patent is invalid and unenforceable, and the Company will continue to vigorously defend itself against these claims.
The Company does not anticipate this lawsuit will have a material impact on the Company; however, the outcome is difficult to predict, and an adverse determination could have a material impact on the Company’s business, financial condition or results of operations.
Other than the litigation mentioned above, the Company is not involved in any other legal proceedings other than routine litigation arising in the normal course of business, none of which the Company believes will have a material adverse effect on the Company’s business, financial condition or results of operations.
| ITEM 4. | MINE SAFETY DISCLOSURES. |
Not applicable.
| ITEM 5. | MARKET FOR REGISTRANT’S COMMON EQUITY, RELATED STOCKHOLDER MATTERS AND ISSUER PURCHASES OF EQUITY SECURITIES. |
Market Information and Holders
The Company’s common stock is listed and traded on the NASDAQ Global Select Market under the symbol “FARO”.
The following table sets forth, for the periods indicated, the high and low sales prices of the Company’s common stock as reported by the NASDAQ Stock Market:
| 2011 | 2010 | |||||||||||||||
| High | Low | High | Low | |||||||||||||
| First Quarter |
40.99 | 28.62 | 27.02 | 16.80 | ||||||||||||
| Second Quarter |
45.42 | 36.66 | 29.40 | 17.60 | ||||||||||||
| Third Quarter |
48.93 | 30.47 | 22.62 | 17.82 | ||||||||||||
| Fourth Quarter |
49.45 | 29.45 | 33.52 | 21.63 | ||||||||||||
20
Table of Contents
As of February 10, 2012, the Company had 57 holders of record of common stock.
Dividends
The Company has not paid any cash dividends on its common stock to date. The Company expects to retain future earnings for use in operating and expanding its business and does not anticipate paying any cash dividends in the reasonably foreseeable future.
Recent Sales of Unregistered Securities
During the year ended December 31, 2011, the Company did not sell any equity securities that were not registered under the Securities Act of 1933, as amended, or the Securities Act.
Purchases of Equity Securities
On November 24, 2008, the Company’s Board of Directors approved a $30 million share repurchase program. Acquisitions for the share repurchase program will be made from time to time at prevailing prices, as permitted by securities laws and other legal requirements and subject to market conditions and other factors. The share repurchase program may be discontinued at any time. There is no restriction date or other restriction governing the period over which the Company can repurchase shares under the program. The Company did not purchase any shares in the year ended December 31, 2011 under the repurchase program.
Performance Graph
The following performance graph and related information shall not be deemed “soliciting material” or to be “filed” with the SEC, nor shall such information be incorporated by reference into any future filing under the Securities Act of 1933 or the Exchange Act, except to the extent that the Company specifically incorporates it by reference into such filing.
The following line graph compares the cumulative five-year returns on the Company’s common stock with (1) the cumulative returns of the NASDAQ Composite-Total Return and (2) the Morningstar Scientific & Technical Instruments Index.
For purposes of preparing the graph, we assumed that an investment of $100 was made at market close on December 30, 2006, the last trading day before the beginning of the Company’s fifth preceding fiscal year, with reinvestment of any dividends at the time they were paid. The Company did not pay any dividends during the period indicated.
The comparison in the graph below is based on historical data and is not necessarily indicative of future performance of the Company’s common stock.
21
Table of Contents
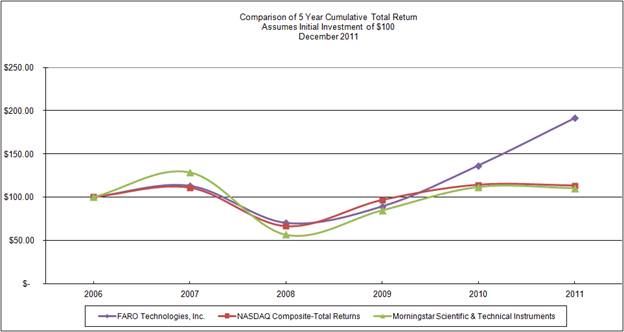
| Company/Market/Peer Group |
2006 | 2007 | 2008 | 2009 | 2010 | 2011 | ||||||||||||||||||
| FARO Technologies, Inc. |
$ | 100.00 | $ | 113.05 | $ | 70.13 | $ | 89.18 | $ | 136.58 | $ | 191.34 | ||||||||||||
| NASDAQ Composite-Total Returns |
$ | 100.00 | $ | 110.65 | $ | 66.42 | $ | 96.54 | $ | 114.06 | $ | 113.16 | ||||||||||||
| Morningstar Scientific & Technical Instruments |
$ | 100.00 | $ | 128.44 | $ | 56.56 | $ | 84.79 | $ | 111.67 | $ | 110.35 | ||||||||||||
22
Table of Contents
ITEM 6. SELECTED FINANCIAL DATA.
| Historical - Year ended December 31, | ||||||||||||||||||||
| in thousands, except share and per-share data |
2011 | 2010 | 2009 | 2008 | 2007 | |||||||||||||||
| Consolidated Statement of Operations Data: |
||||||||||||||||||||
| Sales |
$ | 254,164 | $ | 191,775 | $ | 147,703 | $ | 209,249 | $ | 191.617 | ||||||||||
| Gross profit |
143,689 | 113,398 | 80,708 | 125,226 | 115,043 | |||||||||||||||
| Income (loss) from operations |
32,858 | 16,927 | (10,989 | ) | 18,937 | 19,111 | ||||||||||||||
| Income (toss) before income tax expense |
31,705 | 14,215 | (10,158 | ) | 18,360 | 23,036 | ||||||||||||||
| Net income (loss) |
23,377 | 11,068 | (10,582 | ) | 13,952 | 18,093 | ||||||||||||||
| Net income (loss) per common share: |
||||||||||||||||||||
| Basic |
$ | 1.42 | $ | 0.69 | $ | (0.66 | ) | $ | 0.84 | $ | 1.17 | |||||||||
| Diluted |
$ | 1.39 | $ | 0.68 | $ | (0.66 | ) | $ | 0.83 | $ | 1.15 | |||||||||
| Weighted average shares outstanding: |
||||||||||||||||||||
| Basic |
16,503,773 | 16,153,831 | 16,125,449 | 16,632,608 | 15,443,259 | |||||||||||||||
| Diluted |
16,868,471 | 16,365,826 | 16,125,449 | 16,734,403 | 15,722,215 | |||||||||||||||
| Historical - as at December 3l, | ||||||||||||||||||||
| 2011 | 2010 | 2009 | 2008 | 2007 | ||||||||||||||||
| Consolidated Balance Sheet Data: |
||||||||||||||||||||
| Working capital |
$ | 197,539 | $ | 162,814 | $ | 148,213 | $ | 163,230 | $ | 154,946 | ||||||||||
| Total assets |
312,791 | 266,019 | 235,710 | 259,314 | 243,539 | |||||||||||||||
| Total debt-capital leases |
341 | 216 | 273 | 368 | 240 | |||||||||||||||
| Total shareholders’ equity |
247,898 | 212,477 | 196,598 | 212,308 | 194,499 | |||||||||||||||
ITEM 7. MANAGEMENT’S DISCUSSION AND ANALYSIS OF FINANCIAL CONDITION AND RESULTS OF OPERATIONS.
The following information should be read in conjunction with the Consolidated Financial Statements of the Company, including the notes thereto, included in Part II, Item 8 of this Annual Report on Form 10-K.
23
Table of Contents
Overview
The Company designs, develops, manufactures, markets and supports portable, software driven, 3-D measurement and imaging systems used in a broad range of manufacturing, industrial, building construction and forensic applications. The Company’s FaroArm, FARO Laser ScanArm and FARO Gage articulated measuring devices, the FARO Laser Tracker ION, the FARO Focus3D, the FARO 3D Imager AMP and their companion CAM2 software systems provide for CAD-based inspection, high-density surveying and other applications. Together, these products integrate the measurement, quality inspection, and reverse engineering functions with CAD software to improve productivity, enhance product quality and decrease rework and scrap in the manufacturing process.
The Company derives revenues primarily from the sale of its measurement equipment and their related multi-faceted CAM2 software programs. Revenue related to these products is generally recognized upon shipment. In addition, the Company sells one and three-year extended warranties and training and technology consulting services relating to its products. The Company recognizes the revenue from extended warranties on a straight-line basis. The Company also receives royalties from licensing agreements for its historical medical technology and recognizes the revenue from these royalties as licensees use the technology.
The Company operates in international markets throughout the world and maintains sales offices in France, Germany, Great Britain, Japan, Spain, Italy, Turkey, China, India, Poland, the Netherlands, Malaysia, Thailand, Singapore and Vietnam. The Company manages and reports its global sales in three regions: the Americas, Europe/Africa and Asia/Pacific.
The Company manufactures its FaroArm, FARO Gage, FARO 3D Imager AMP, and FARO Laser Tracker ION products in its manufacturing facility located in Switzerland for customer orders from the Europe/Africa region, in its manufacturing facility located in Singapore for customer orders from the Asia/Pacific region, and in its manufacturing facilities located in Florida and Pennsylvania for customer orders from the Americas. The Company manufactures its FARO FOCUS3D product in its facility located in Stuttgart, Germany. The Company expects all its existing plants to have the production capacity necessary to support its volume requirements through 2012.
The Company accounts for wholly owned foreign subsidiaries in the currency of the respective foreign jurisdiction. Therefore, fluctuations in exchange rates may have an impact on inter-company accounts reflected in the Company’s consolidated financial statements. The Company is aware of the availability of off-balance sheet financial instruments to hedge exposure to foreign currency exchange rates, including cross-currency swaps, forward contracts and foreign currency options. However, it does not regularly use such instruments, and none were utilized in 2011, 2010 or 2009.
The Company was profitable in each quarter in the years ended December 31, 2011 and December 31, 2010. The Company incurred a net loss in the year ended December 31, 2009, primarily as a result of a decrease in product sales. The Company attributes the decrease in product sales principally to the decline of the global economy. Prior to 2009, the Company had a history of sales and earnings growth and 26 consecutive profitable quarters through December 31, 2008. Its historical sales and earnings growth were the result of a number of factors, including: continuing market demand for and acceptance of the Company’s products; increased sales activity in part through additional sales staff worldwide, new products and product enhancements such as the FARO Edge Arm and FARO Focus3D, and the effect of acquisitions. However, the Company’s historical financial performance is not indicative of its future financial performance.
On December 22, 2009, the Company filed a Registration Statement on Form S-3 with the SEC registering shares of common stock, preferred stock, and warrants to purchase common and preferred stock, either individually or in units, with a proposed maximum aggregate offering price of $145 million. The proceeds from any offerings with respect to this registration statement, if any, would be used for either repayment or refinancing of debt, acquisition of additional businesses or technologies or for working capital and general corporate purposes.
24
Table of Contents
FCPA Update
As previously reported by the Company, the Company conducted an internal investigation in 2006 into certain payments made by its China subsidiary that may have violated the Foreign Corrupt Practices Act, or the FCPA, and other applicable laws, which we refer to as the “FCPA Matter”, and entered into settlement agreements and related documents with the SEC and the U.S. Department of Justice, or the DOJ, in 2008 related to the FCPA Matter. Under the terms of the agreements with the SEC and the DOJ, the Company assumed a two-year monitoring obligation and other continuing obligations with respect to compliance with the FCPA and other laws, including full cooperation with the U.S. government and the adoption of a compliance code containing specific provisions intended to prevent violations of the FCPA. During the second quarter of 2010, the Company, in conjunction with the SEC and the DOJ, completed the selection of the FCPA monitor. As a result of delays in the SEC/DOJ approval of the monitor, the Company is currently still in the monitoring period, which otherwise would have already expired. The Company is cooperating with the monitor as the monitor completes a work plan to assess the Company’s compliance with the requirements of the settlement agreements. Failure to comply with any continuing obligations with respect to the FCPA Matter could result in the SEC and the DOJ seeking to impose penalties against the Company in the future.
Results of Operations
The following table sets forth, for the periods presented, the percentage of sales represented by certain items in the Company’s consolidated statements of operations:
| Years ended December 31, | ||||||||||||
| 2011 | 2010 | 2009 | ||||||||||
| Statement of Operations Data: |
||||||||||||
| Sales |
100.0 | % | 100.0 | % | 100.0 | % | ||||||
| Cost of sales |
43.5 | % | 40.9 | % | 45.4 | % | ||||||
|
|
|
|
|
|
|
|||||||
| Gross margin |
56.5 | % | 59.1 | % | 54.6 | % | ||||||
| Operating expenses: |
||||||||||||
| Selling |
24.4 | % | 26.4 | % | 32.9 | % | ||||||
| General and administrative |
10.5 | % | 14.0 | % | 16.9 | % | ||||||
| Depreciation and amortization |
2.6 | % | 3.3 | % | 3.7 | % | ||||||
| Research and development |
6.0 | % | 6.6 | % | 8.5 | % | ||||||
|
|
|
|
|
|
|
|||||||
| Total operating expenses |
43.5 | % | 50.3 | % | 62.0 | % | ||||||
| Income (loss) from operations |
13.0 | % | 8.8 | % | (7.4 | %) | ||||||
| Interest income |
0.0 | % | (0.1 | %) | (0.2 | %) | ||||||
| Other expense (income), net |
0.5 | % | 1.5 | % | (0.4 | %) | ||||||
| Interest expense |
0.0 | % | 0.0 | % | 0.1 | % | ||||||
|
|
|
|
|
|
|
|||||||
| Income (loss) before income tax expense |
12.5 | % | 7.4 | % | (6.9 | %) | ||||||
| Income tax expense |
3.3 | % | 1.6 | % | 0.3 | % | ||||||
|
|
|
|
|
|
|
|||||||
| Net Income (toss) |
9.2 | % | 5.8 | % | (7.2 | %) | ||||||
|
|
|
|
|
|
|
|||||||
25
Table of Contents
2011 Compared to 2010
Sales. Total sales increased $62.4 million, or 32.6%, to $254.2 million in the year ended December 31, 2011 from $191.8 million for the year ended December 31, 2010. This increase resulted primarily from an increase in worldwide demand for products and some recovery in the global economy. Product sales increased by $55.3 million, or 35.2%, to $212.6 million for the year ended December 31, 2011 from $157.3 million in the year ended December 31, 2010. Service revenue increased by $7.1 million, or 20.6%, to $41.6 million for the year ended December 31, 2011 from $34.5 million in the year ended December 31, 2010.
Sales in the Americas region increased $25.1 million, or 34.7%, to $97.5 million for the year ended December 31, 2011 from $72.4 million in the prior year period. Product sales in the Americas region increased by $23.1 million, or 40.7%, to $80.0 million for the year ended December 31, 2011 from $56.9 million in the prior year. Service revenue in the Americas region increased by $2.0 million, or 12.6%, to $17.5 million for the year ended December 31, 2011 from $15.5 million for the prior year, primarily due to an increase in customer service revenue.
Sales in the Europe/Africa region increased $24.9 million, or 33.2%, to $99.6 million for the year ended December 31, 2011 from $74.7 million in the year ended December 31, 2010. Product sales in the Europe/Africa region increased by $21.4 million, or 34.5%, to $83.3 million for the year ended December 31, 2011 from $61.9 million in the prior year. Service revenue in the Europe/Africa region increased by $3.5 million, or 27.2%, to $16.3 million for the year ended December 31, 2011 from $12.8 million in the prior year, primarily due to an increase in customer service revenue.
Sales in the Asia/Pacific region increased $12.4 million, or 27.9%, to $57.1 million for the year ended December 31, 2011 from $44.7 million in the year ended December 31, 2010. Product sales in the Asia/Pacific region increased by $10.8 million, or 28.0%, to $49.3 million for the year ended December 31, 2011 from $38.5 million in the prior year. Service revenue in the Asia/Pacific region increased by $1.6 million, or 26.8%, to $7.8 million for the year ended December 31, 2011 from $6.2 million in the same period during the prior year, primarily due to an increase in warranty revenue.
Gross profit increased by $30.3 million, or 26.7%, to $143.7 million for the year ended December 31, 2011 from $113.4 million for the year ended December 31, 2010. Gross margin decreased to 56.5% for the year ended December 31, 2011 from 59.1% for the year ended December 31, 2010. The decrease in gross margin is primarily due to a decrease in gross margin from product sales to 61.2% in the year ended December 31, 2011 from 65.3% for the prior year, primarily as a result of a change in the historical product sales mix caused by the increase in sales of the new Laser Scanner product which currently has a lower gross margin. Gross margin from service revenues increased to 32.4% in the year ended December 31, 2011 compared to 30.9% for the prior year.
Selling Expenses. Selling expenses increased by $11.4 million, or 22.6%, to $62.1 million for the year ended December 31, 2011 from $50.7 million for the year ended December 31, 2010. This increase was primarily due to an increase in commissions and compensation expense of $8.8 million, an increase in marketing and advertising expenses of $1.7 million, and an increase in travel expenses of $1.5 million.
Worldwide sales and marketing headcount increased by 27, or 9.0%, to 327 at December 31, 2011 from 300 at December 31, 2010. Regionally, the Company’s sales and marketing headcount increased by 9, or 11.1%, to 90 at December 31, 2011 from 81 at December 31, 2010 for the Americas; increased by 2, or 1.8%, to 113 at December 31, 2011 from 111 at December 31, 2010 in Europe/Africa; and increased by 16, or 14.8%, in Asia/Pacific to 124 at December 31, 2011 from 108 at December 31, 2010.
26
Table of Contents
As a percentage of sales, selling expenses decreased to 24.4% of sales in the year ended December 31, 2011 from 26.4% of sales in the year ended December 31, 2010. Regionally, selling expenses were 20.5% of sales in the Americas for the year ended December 31, 2011 compared to 21.9% of sales in the year ended December 31, 2010; 28.1% of sales for Europe/Africa for the year ended December 31, 2011 compared to 30.1% of sales in the prior year; and 24.9% of sales for Asia/Pacific for the year ended December 31, 2011 compared to 27.5% of sales in the prior year.
General and administrative expenses. General and administrative expenses remained flat at $26.8 million for the years ended December 31, 2011 and December 31, 2010. Increases in compensation costs of $1.7 million and increases in recruiting and relocation costs of $0.3 million were offset by decreases of $1.0 million in bad debt expenses, decreases of $0.4 million related to the FCPA monitor, and a decrease in legal and professional fees related to patent litigation of $0.6 million. General and administrative expenses as a percentage of sales decreased to 10.5% for the year ended December 31, 2011 from 14.0% for the year ended December 31, 2010.
Depreciation and amortization expenses. Depreciation and amortization expenses increased by $0.4 million to $6.7 million for the year ended December 31, 2011 from $6.3 million for the year ended December 31, 2010 as a result of an increase in property, equipment and intangible assets.
Research and development expenses. Research and development expenses increased $2.5 million, or 19.7%, to $15.2 million for year ended December 31, 2011 from $12.7 million for the year ended December 31, 2010, primarily due to an increase in compensation of $1.9 million, subcontractor expenses of $0.6 million and expenses of $0.4 million related to the closing and relocation of the R&D facility in Andover, MA to our existing facility in Kennett Square, PA. Research and development expenses as a percentage of sales decreased to 6.0% for the year ended December 31, 2011 from 6.6% for the year ended December 31, 2010.
Other (income) expense, net. Other (income) expense, net decreased by $1.6 million to $1.2 million of expense for the year ended December 31, 2011, from expense of $2.8 million for the year ended December 31, 2010, primarily as a result of a decrease in foreign exchange transaction losses due to the effects of changes in foreign exchange rates on the value of intercompany account balances of the Company’s subsidiaries denominated in different currencies.
Income tax expense. Income tax expense increased by $5.2 million to $8.3 million for the year ended December 31, 2011 from $3.1 million for the year ended December 31, 2010, primarily due to an increase in pretax income. The Company’s effective tax rate increased to 26.3% for the year ended December 31, 2011 compared to 22.1% for the year ended December 31, 2010, primarily due to the release of a valuation allowance of approximately $1.2 million in the year ended December 31, 2010 related to net operating losses of a subsidiary in Germany as a result of being included in a group consolidated tax filing with net taxable earnings. The Company’s tax rate continues to be lower than the statutory tax rate in the United States primarily as a result of favorable tax rates in foreign jurisdictions. However, the Company’s tax rate could be impacted positively or negatively by geographic changes in the manufacturing or sales of its products and the resulting effect on taxable income in each jurisdiction. Total deferred tax assets for the Company’s foreign subsidiaries relating to net operating loss carryforwards were $14.9 million and $14.1 million at December 31, 2011 and 2010, respectively. The related valuation allowance was $11.8 million and $11.1 million at December 31, 2011 and 2010, respectively.
Net income. Net income increased by $12.3 million to $23.4 million for the year ended December 31, 2011 from $11.1 million for the year ended December 31, 2010 as a result of the factors described above.
27
Table of Contents
2010 Compared to 2009
Sales. Total sales increased $44.1 million, or 29.9%, to $191.8 million in the year ended December 31, 2010 from $147.7 million for the year ended December 31, 2009. This increase resulted primarily from an increase in worldwide demand for products related, in part, to the recovery in the global economy. Product sales increased by $39.6 million, or 33.6%, to $157.3 million for the year ended December 31, 2010 from $117.7 million in the year ended December 31, 2009. Service revenue increased by $4.5 million, or 15%, to $34.5 million for the year ended December 31, 2010 from $30.0 million in the year ended December 31, 2009.
Sales in the Americas region increased $17.4 million, or 31.4%, to $72.4 million for the year ended December 31, 2010 from $55.0 million in the prior year period. Product sales in the Americas region increased by $14.7 million, or 34.5%, to $56.9 million for the year ended December 31, 2010 from $42.2 million in the prior year. Service revenue in the Americas region increased by $2.7 million, or 21.1%, to $15.5 million for the year ended December 31, 2010 from $12.8 million for the prior year, primarily due to an increase in customer service revenue.
Sales in the Europe/Africa region increased $11.7 million, or 18.7%, to $74.7 million for the year ended December 31, 2010 from $63.0 million in the year ended December 31, 2009. Product sales in the Europe/Africa region increased by $11.0 million, or 21.9%, to $61.9 million for the year ended December 31, 2010 from $50.9 million in the prior year. Service revenue in the Europe/Africa region increased by $0.7 million, or 5.6%, to $12.8 million for the year ended December 31, 2010 from $12.1 million in the prior year, primarily due to a increase in customer service revenue.
Sales in the Asia/Pacific region increased $15.0 million, or 50.5%, to $44.7 million for the year ended December 31, 2010 from $29.7 million in the year ended December 31, 2009. Product sales in the Asia/Pacific region increased by $13.9 million, or 56.5%, to $38.5 million for the year ended December 31, 2010 from $24.6 million in the prior year. Service revenue in the Asia/Pacific region increased by $1.1 million, or 20.8%, to $6.2 million for the year ended December 31, 2010 from $5.1 million in the same period during the prior year, primarily due to an increase in warranty revenue.
Gross profit increased by $32.7 million, or 40.5%, to $113.4 million for the year ended December 31, 2010 from $80.7 million for the year ended December 31, 2009. Gross margin increased to 59.1% for the year ended December 31, 2010 from 54.6% for the year ended December 31, 2009, primarily due to a change in the sales mix between higher-margin product sales and lower-margin service revenue resulting from an increase in product sales. Gross margin from product sales increased to 65.3% in the year ended December 31, 2010 from 60.7% for the prior year, primarily due to an increase in the product sales mix of higher margin product lines. Gross margin from service revenues remained relatively flat at 30.9% in the year ended December 31, 2010 compared to 31.0% for the prior year.
Selling Expenses. Selling expenses increased by $2.1 million, or 4.3%, to $50.7 million for the year ended December 31, 2010 from $48.6 million for the year ended December 31, 2009. This increase was primarily due to an increase in commissions expense of $4.7 million, an increase in product demonstration costs of $1.3 million, and an increase in performance-based bonuses of $0.4 million, offset by a decrease in compensation costs of $3.6 million due to reduced headcount and a decrease in travel expenses of $0.7 million.
Worldwide sales and marketing headcount decreased by 6, or 2.0%, to 300 at December 31, 2010 from 306 at December 31, 2009. Regionally, the Company’s sales and marketing headcount decreased by 9, or 10.0%, to 81 at December 31, 2010 from 90 at December 31, 2009 for the Americas; decreased by 1, or 1.0%, to 111 at December 31, 2010 from 112 at December 31, 2009 in Europe/Africa; and increased by 4, or 4.0%, in Asia/Pacific to 108 at December 31, 2010 from 104 at December 31, 2009.
28
Table of Contents
As a percentage of sales, selling expenses decreased to 26.4% of sales in the year ended December 31, 2010 from 32.9% in the year ended December 31, 2009. Regionally, selling expenses were 21.9% of sales in the Americas for the year ended December 31, 2010 compared to 30.7% of sales in the year ended December 31, 2009; 30.1% of sales for Europe/Africa for the year ended December 31, 2010 compared to 34.2% of sales in the prior year; and 27.5% of sales for Asia/Pacific for the year ended December 31, 2010 compared to 34.3% of sales in the prior year.
General and administrative expenses. General and administrative expenses increased by $1.9 million, or 7.3%, to $26.8 million for the year ended December 31, 2010 from $24.9 million for the year ended December 31, 2009. General and administrative expenses increased primarily due to the $1.1 million cost of the FCPA monitor, an increase in legal and professional fees related to patent litigation of $0.8 million, and an increase in performance based bonuses of $1.1 million, offset by a decrease in compensation costs of $0.9 million due to reduced headcount. General and administrative expenses as a percentage of sales decreased to 14.0% for the year ended December 31, 2010 from 16.9% for the year ended December 31, 2009.
Depreciation and amortization expenses. Depreciation and amortization expenses increased by $0.8 million to $6.3 million for the year ended December 31, 2010 from $5.5 million for the year ended December 31, 2009 as a result of an increase in property, equipment and intangible assets.
Research and development expenses. Research and development expenses increased $0.1 million, or 0.6%, to $12.7 million for year ended December 31, 2010 from $12.6 million for the year ended December 31, 2009, primarily due to an increase in performance-based bonuses of $0.8 million, offset by decreases in materials of $0.1 million and subcontractor expenses of $0.6 million. Research and development expenses as a percentage of sales decreased to 6.6% for the year ended December 31, 2010 from 8.5% for the year ended December 31, 2009.
Interest income / expense. Interest income, net, decreased by $0.1 million to $0.1 million for the year ended December 31, 2010 from $0.2 million for the year ended December 31, 2009, due to a decrease in interest rates related to cash and short term investments.
Other (income) expense, net. Other (income) expense, net increased by $3.4 million to $2.8 million of expense for the year ended December 31, 2010, from income of $0.6 million for the year ended December 31, 2009, primarily as a result of an increase in foreign currency losses related to the effects of the decline in the Euro on the value of intercompany account balances denominated in different currencies with the Company’s European subsidiaries.
Income tax expense. Income tax expense increased by $2.7 million to $3.1 million for the year ended December 31, 2010 from $0.4 million for the year ended December 31, 2009, primarily due to an increase in pretax income. Income tax expense in the year ended December 31, 2009 included $2.6 million related to a settlement with the Internal Revenue Service in the fourth quarter of 2009 of an audit of the Company’s federal corporate income tax returns for the period 2005 to 2007 related to the valuation of certain intangible assets contributed to a foreign subsidiary of the Company under a R&D Cost Sharing Arrangement entered into in 2001. Excluding the effects of the $2.6 million tax settlement, the Company’s effective tax benefit rate would have been 21.7% for 2009. The Company believes that calculating its effective tax rate without the impact of the IRS settlement is useful to management and investors to provide greater clarity and to facilitate internal and external comparisons to the Company’s historical tax rate. The Company’s effective tax rate was 22.1% for the year ended December 31, 2010 compared to a tax benefit rate of 21.7%, excluding the effects of the $2.6 million tax settlement for the year ended December 31, 2009. Total deferred tax assets for the Company’s foreign subsidiaries relating to net operating loss carryforwards were $14.1 million and $12.2 million at December 31, 2010 and 2009, respectively. The related valuation allowance was $11.1 million and $10.6 million at December 31, 2010 and 2009, respectively. The Company released a valuation allowance of approximately $1.2 million related to net operating losses of a subsidiary in Germany as a result of being included in a group consolidated tax filing with net taxable earnings. The Company’s tax rate continues to be lower than the statutory tax rate in the United States primarily as a result of favorable tax rates in foreign jurisdictions. However, the Company’s tax rate could be impacted positively or negatively by geographic changes in the manufacturing or sales of its products and the resulting effect on taxable income in each jurisdiction.
29
Table of Contents
Net income. Net income increased by $21.7 million to $11.1 million for the year ended December 31, 2010 from a net loss of $10.6 million for the year ended December 31, 2009 as a result of the factors described above.
Liquidity and Capital Resources
Cash and cash equivalents increased by $13.8 million to $64.5 million at December 31, 2011 from $50.7 million at December 31, 2010. The increase was primarily attributable to an increase in net income and non-cash expenses of $34.3 million and proceeds from and tax benefits of stock option exercises of $10.7 million, offset by an increase in working capital of $25.6 million primarily related to the increase in raw material inventories to meet the higher level of sales of the Laser Scanner product, and $5.4 million in purchases of equipment and intangible assets.
On July 11, 2006, the Company entered into a loan agreement providing for a line of credit of $30.0 million, which was most recently amended on June 18, 2009. Loans under the Amended and Restated Loan Agreement, as amended, bear interest at the rate of LIBOR plus a fixed percentage between 2.25% and 2.50%, and require the Company to maintain a minimum cash balance and tangible net worth measured at the end of each of the Company’s fiscal quarters. As of December 31, 2011, the Company was in compliance with all of the covenants under the Amended and Restated Loan Agreement, as amended. The term of the Amended and Restated Loan Agreement, as amended, extends to March 31, 2012. The Company has not drawn on this line of credit. The Company believes it will be able to renew its line of credit upon the expiration of the current Amended Loan Agreement, although the terms and conditions may change.
The Company believes that its working capital, anticipated cash flow from operations, cash and credit facility will be sufficient to fund its long-term liquidity requirements for the foreseeable future.
Off Balance Sheet Items
None.
Contractual Obligations and Commercial Commitments
The Company is party to capital leases on equipment with an initial term of 36 to 60 months and other non-cancelable operating leases. These obligations are presented below as of December 31, 2011 ($ in thousands):
30
Table of Contents
FARO CONSOLIDATED
Contractual Obligations
For the year ended December 31, 2011
| Payments Due by Period | ||||||||||||||||||||
| Contractual Obligations |
Total | <1 Year | 1-3 Years | 3-5 Years | > 5 Years | |||||||||||||||
|
|
|
|
|
|
|
|
|
|
|
|||||||||||
| Capital lease obligations |
$ | 156 | $ | 84 | $ | 61 | $ | 11 | $ | — | ||||||||||
| Operating lease obligations |
18,307 | 6,254 | 6,483 | 3,225 | 2,345 | |||||||||||||||
| Purchase obligations |
50,262 | 50,262 | — | — | — | |||||||||||||||
|
|
|
|
|
|
|
|
|
|
|
|||||||||||
| Total |
$ | 68,725 | $ | 56,600 | $ | 6,544 | $ | 3,236 | $ | 2,345 | ||||||||||
|
|
|
|
|
|
|
|
|
|
|
|||||||||||
The Company enters into purchase commitments for products and services in the ordinary course of business. These purchases generally cover production requirements for 60 to 90 days. The Company has a $0.3 million liability for unrecognized tax benefits that is excluded from the contractual obligations table due to the uncertainty of the period of settlement, if any, with the respective taxing authorities.
Inflation
Inflation did not have a material impact on the Company’s results of operations in recent years, and the Company does not expect inflation to have a material impact on its operations in 2012.
Critical Accounting Policies
The preparation of the Company’s consolidated financial statements requires the Company’s management to make estimates and assumptions that affect the reported amounts of assets, liabilities, revenues, and expenses, as well as disclosure of contingent assets and liabilities. The Company bases its estimates on historical experience, along with various other factors believed to be reasonable under the circumstances, the results of which form the basis for making judgments about the carrying value of assets and liabilities that are not readily apparent from other sources. Some of these judgments can be subjective and complex and, consequently, actual results may differ from these estimates under different assumptions or conditions. While for any given estimate or assumption made by the Company’s management there may be other estimates or assumptions that are reasonable, the Company believes that, given the current facts and circumstances, it is unlikely that applying any such other reasonable estimate or assumption would materially impact the financial statements.
In response to the SEC’s financial reporting release, FR-60, “Cautionary Advice Regarding Disclosure About Critical Accounting Policies,” the Company has selected its critical accounting policies for purposes of explaining the methodology used in the calculation in addition to any inherent uncertainties pertaining to the possible effects on its financial condition. The critical policies discussed below are the Company’s processes of recognizing revenue, the reserve for excess and obsolete inventory, income taxes, the reserve for warranties, and goodwill impairment. These policies affect current assets and operating results and are therefore critical in assessing the Company’s financial and operating condition. These policies involve certain assumptions that, if incorrect, could have an adverse impact on the Company’s operations and financial position.
31
Table of Contents
Revenue Recognition
Revenue related to the Company’s measurement equipment and related software is generally recognized upon shipment, as the Company considers the earnings process substantially complete as of the shipping date. Revenue from sales of software only is recognized when no further significant production, modification or customization of the software is required and where persuasive evidence of a sales agreement exists, delivery has occurred, and the sales price is fixed or determinable and deemed collectible. Revenues resulting from sales of comprehensive support, training and technology consulting services are recognized as such services are performed. Extended maintenance plan revenues are recognized on a straight-line basis over the life of the plan. The Company warrants its products against defects in design, materials and workmanship for one year. A provision for estimated future costs relating to warranty expense is recorded when products are shipped. Costs relating to extended maintenance plans are recognized as incurred. Revenue from the licensing agreements for the use of the Company’s historical technology for medical applications is recognized when the technology is used by the licensees.
Reserve for Excess and Obsolete Inventory
Since the value of inventory that will ultimately be realized cannot be known with exact certainty, the Company relies upon both past sales history and future sales forecasts to provide a basis for the determination of the reserve. Inventory is considered obsolete if the Company has withdrawn those products from the market or had no sales of the product for the past 12 months and has no sales forecasted for the next 12 months. Inventory is considered excess if the quantity on hand exceeds 12 months of remaining usage. The resulting obsolete and excess parts are then reviewed to determine if a substitute usage or a future need exists. Items without an identified current or future usage are reserved in an amount equal to 100% of the FIFO cost of such inventory. The Company’s products are subject to changes in technologies that may make certain of its products or their components obsolete or less competitive, which may increase its historical provisions to the reserve.
Income Taxes
The Company reviews its deferred tax assets on a regular basis to evaluate their recoverability based upon expected future reversals of deferred tax liabilities, projections of future taxable income over a two-year period, and tax planning strategies that it might employ to utilize such assets, including net operating loss carryforwards. Based on the positive and negative evidence of recoverability, the Company establishes a valuation allowance against the net deferred tax assets of a taxing jurisdiction in which it operates, unless it is “more likely than not” that it will recover such assets through the above means. In the future, the Company’s evaluation of the need for the valuation allowance will be significantly influenced by its ability to achieve profitability and its ability to predict and achieve future projections of taxable income.
Significant judgment is required in determining the Company’s worldwide provision for income taxes. In the ordinary course of global business, there are many transactions for which the ultimate tax outcome is uncertain. The Company establishes provisions for income taxes when, despite the belief that tax positions are fully supportable, there remain certain positions that do not meet the minimum probability threshold as described by ASC 740, which is a tax position that is more likely than not to be sustained upon examination by the applicable taxing authority. In the ordinary course of business, the Company and its subsidiaries are examined by various federal, state, and foreign tax authorities. The Company regularly assesses the potential outcomes of these examinations and any future examinations for the current or prior years in determining the adequacy of its provision for income taxes. The Company assesses the likelihood and amount of potential adjustments and adjusts the income tax provision, the current tax liability and deferred taxes in the period in which the facts that gave rise to a revision become known.
32
Table of Contents
Reserve for Warranties
The Company establishes at the time of sale a liability for the one-year warranty included with the initial purchase price of equipment, based upon an estimate of the repair expenses likely to be incurred for the warranty period. The warranty period is measured in installation-months for each major product group. The warranty reserve is reflected in accrued liabilities in the accompanying consolidated balance sheets. The warranty expense is estimated by applying the actual total repair expenses for each product group in the prior period and determining a rate of repair expense per installation month. This repair rate is multiplied by the number of installation-months of warranty for each product group to determine the provision for warranty expenses for the period. The Company evaluates its exposure to warranty costs at the end of each period using the estimated expense per installation-month for each major product group, the number of units remaining under warranty and the remaining number of months each unit will be under warranty. The Company has a history of new product introductions and enhancements to existing products, which may result in unforeseen issues that increase its warranty costs. While such expenses have historically been within expectations, the Company cannot guarantee this will continue in the future.
Goodwill Impairment
Goodwill represents the excess cost of a business acquisition over the fair value of the net assets acquired. Indefinite-life identifiable intangible assets and goodwill are not amortized but are tested for impairment. The Company performs an annual review in the fourth quarter of each year, or more frequently if indicators of potential impairment exist, to determine if the carrying value of the recorded goodwill is impaired. If an asset is impaired, the difference between the value of the asset reflected on the financial statements and its current fair value is recognized as an expense in the period in which the impairment occurs.
The Company first performs a qualitative assessment to determine whether it is necessary to perform the two-step goodwill impairment test. If the Company believes, as a result of its qualitative assessment, that it is not more likely than not that the fair value of a reporting unit is less than its carrying amount, then the first and second steps of the goodwill impairment test are unnecessary. The Company elected to early adopt this accounting guidance at the beginning of its fourth quarter of 2011 on a prospective basis for goodwill impairment tests.
If necessary, the goodwill impairment test is applied using a two-step approach. In performing the first step, the Company calculates the fair values of the reporting units using discounted cash flows (“DCF”) of each reporting unit. If the carrying amount of the reporting unit exceeds the fair market value, the second step is performed to measure the amount of the impairment loss, if any. In the second step, the implied fair value of the goodwill is estimated as the fair value of the reporting unit as calculated in the first step, less the fair values of the net tangible and intangible assets of the reporting unit other than goodwill. If the carrying amount of goodwill exceeds its implied fair market value, an impairment loss is recognized in an amount equal to that excess, not to exceed the carrying amount of the goodwill. Management has concluded there was no goodwill impairment in the years ended December 31, 2011, 2010 and 2009.
Impact of Recently Issued Accounting Standards
In January 2010, the Financial Accounting Standards Board (“FASB”) issued ASU 2010-6, Improving Disclosures About Fair Value Measurements (“ASU 2010-6”), which requires reporting entities to make new disclosures about recurring or nonrecurring fair-value measurements, including significant transfers into and out of Level 1 and Level 2 fair-value measurements and information on purchases, sales, issuances, and settlements on a gross basis in the reconciliation of Level 3 fair-value measurements. ASU 2010-6 is effective for annual reporting periods beginning after December 15, 2009, except for Level 3 reconciliation disclosures, which are effective for annual periods beginning after December 15, 2010. The adoption of ASU 2010-6 did not have a material impact on the Company’s consolidated financial statements or disclosures nor is it expected to have a material impact in future periods.
33
Table of Contents
In July 2010, the FASB issued guidance to enhance disclosures about the credit quality of a creditor’s financing receivables and the adequacy of its allowance for credit losses. The amended guidance is effective for period-end balances beginning with the first interim or annual reporting period ending on or after December 15, 2010. The amended guidance is effective for activity during a reporting period beginning with the first interim or annual reporting period beginning on or after December 15, 2010. The adoption of the amended guidance had no impact on the Company’s disclosure or on its consolidated financial statements.
In May 2011, the Financial Accounting Standards Board (FASB) issued Accounting Standards Update No. 2011-04: Fair Value Measurement (Topic 820): Amendments to Achieve Common Fair Value Measurement and Disclosure Requirements in U.S. GAAP and IFRSs (ASU 2011-04) . ASU 2011-04 clarifies application of fair value measurement and disclosure requirements and is effective for annual periods beginning after December 15, 2011. We are currently evaluating the provisions of ASU 2011-04 and assessing the impact, if any, it may have on our financial position and results of operations.
In December 2010, the FASB issued accounting standard ASU 2010-28, Intangibles-Goodwill and Other (Topic 350): When to Perform Step 2 of the Goodwill Impairment Test for Reporting Units with Zero or Negative Carrying Amounts (a consensus of the FASB Emerging Issues Task Force) (“ASU 2010-28”). ASU 2010-28 provides amendments to Topic 350 that modifies Step 1 of the goodwill impairment test for reporting units with zero or negative carrying amounts. As a result, goodwill impairments may be reported sooner than under current practice. For public entities, ASU 2010-28 is effective for fiscal years and interim periods within those years beginning after December 15, 2010, with early adoption not permitted. The adoption of ASU 2010-28 did not have a material impact on the Company’s consolidated results of operations or financial condition.
In June 2011, the FASB issued ASU 2011-05, Comprehensive Income (Topic 220): Presentation of Comprehensive Income (“ASU 2011-05”). ASU 2011-05 will require companies to present the components of net income and other comprehensive income either as one continuous statement or as two consecutive statements. It eliminates the option to present components of other comprehensive income as part of the changes in stockholders’ equity. The standard does not change the items which must be reported in other comprehensive income, how such items are measured or when they must be reclassified to net income. ASU 2011-05 is effective for interim and annual periods beginning after December 15, 2011, with early adoption permitted. The adoption of ASU 2011-05 will only impact presentation and will not have any effect on the Company’s condensed consolidated financial statements or on its financial condition.
In December 2011, the FASB issued Accounting Standards Update No. 2011-12: Comprehensive Income (Topic 220): Deferral of the Effective Date for Amendments to the Presentation of Reclassifications of Items Out of Accumulated Other Comprehensive Income in Accounting Standards Update No. 2011-05 (ASU 2011-12) . The Update defers the specific requirement to present items that are reclassified from accumulated other comprehensive income to net income separately with their respective components of net income and other comprehensive income. As part of this update, the FASB did not defer the requirement to report comprehensive income either in a single continuous statement or in two separate but consecutive financial statements. ASU 2011-12 is effective for annual periods beginning after December 15, 2011.
34
Table of Contents
In September 2011, the FASB issued ASU 2011-08, Intangibles-Goodwill and Other (Topic 350) (“ASU 2011-08”). ASU 2011-08 allows entities to first assess qualitatively whether it is necessary to perform the two-step goodwill impairment test. If an entity believes, as a result of its qualitative assessment, that it is not more likely than not that the fair value of a reporting unit is less than its carrying amount, then the first and second steps of the goodwill impairment test are unnecessary. The Company elected to early adopt this accounting guidance at the beginning of its fourth quarter of 2011 on a prospective basis for goodwill impairment tests. The adoption of this standard did not have a material impact on its consolidated financial statements and footnote disclosures.
In October 2009, the FASB issued ASU No. 2009-13, “Revenue Recognition — Multiple-Deliverable Revenue Arrangements.” The new standard changes the requirements for establishing separate units of accounting in a multiple element arrangement and requires the allocation of arrangement consideration to each deliverable based on the relative selling price. The selling price for each deliverable is based on vendor-specific objective evidence (“VSOE”) if available, third-party evidence if VSOE is not available, or estimated selling price if neither VSOE or third-party evidence is available. ASU 2009-13 is effective for revenue arrangements entered into in fiscal years beginning on or after June 15, 2010. The Company adopted ASU 2009-13 effective January 1, 2011. The adoption of ASU 2009-13 did not have an impact on our consolidated financial statements.
| ITEM 7A. | QUANTITATIVE AND QUALITATIVE DISCLOSURES ABOUT MARKET RISK. |
Foreign Exchange Exposure
The Company conducts a significant portion of its business outside the United States. At present, 61.6% of its revenues are invoiced, and a significant portion of its operating expenses paid, in foreign currencies. Fluctuations in exchange rates between the U.S. dollar and such foreign currencies may have a material adverse effect on the Company’s results of operations and financial condition and could specifically result in foreign exchange gains and losses. The impact of future exchange rate fluctuations on the results of the Company’s operations cannot be accurately predicted. To the extent that the percentage of its non-U.S. dollar revenues derived from international sales increases in the future, the Company’s exposure to risks associated with fluctuations in foreign exchange rates may increase. The Company is aware of the availability of off-balance sheet financial instruments to hedge exposure to foreign currency exchange rates, including cross-currency swaps, forward contracts and foreign currency options. However, it does not regularly use such instruments, and none were utilized in 2011, 2010 or 2009.
35
Table of Contents
| ITEM 8. | FINANCIAL STATEMENTS AND SUPPLEMENTARY DATA. |
REPORT OF INDEPENDENT REGISTERED PUBLIC ACCOUNTING FIRM
Board of Directors and Shareholders
FARO Technologies, Inc. and Subsidiaries
We have audited the accompanying consolidated balance sheets of FARO Technologies, Inc. (a Florida corporation) and subsidiaries as of December 31, 2011 and 2010, and the related statements of operations, shareholders' equity and comprehensive income (loss), and cash flows for each of the three years in the period ended December 31, 2011. These financial statements are the responsibility of the Company’s management. Our responsibility is to express an opinion on these financial statements based on our audits.
We conducted our audits in accordance with the standards of the Public Company Accounting Oversight Board (United States). Those standards require that we plan and perform the audit to obtain reasonable assurance about whether the financial statements are free of material misstatement. An audit includes examining, on a test basis, evidence supporting the amounts and disclosures in the financial statements. An audit also includes assessing the accounting principles used and significant estimates made by management, as well as evaluating the overall financial statement presentation. We believe that our audits provide a reasonable basis for our opinion.
In our opinion, the consolidated financial statements referred to above present fairly, in all material respects, the financial position of FARO Technologies, Inc. and subsidiaries as of December 31, 2011 and 2010, and the results of their operations and their cash flows for each of the three years in the period ended December 31, 2011 in conformity with accounting principles generally accepted in the United States of America.
We also have audited, in accordance with the standards of the Public Company Accounting Oversight Board (United States), FARO Technologies, Inc. and subsidiaries’ internal control over financial reporting as of December 31, 2011, based on criteria established in Internal Control—Integrated Framework issued by the Committee of Sponsoring Organizations of the Treadway Commission (COSO) and our report dated February 28, 2012 expressed an unqualified opinion.
| /s/ GRANT THORNTON LLP |
| Orlando, Florida |
| February 28, 2012 |
36
Table of Contents
FARO TECHNOLOGIES, INC. AND SUBSIDIARIES
CONSOLIDATED BALANCE SHEETS
| (in thousands, except share data) |
December 31, 2011 |
December 31, 2010 |
||||||
| ASSETS |
||||||||
| Current Assets: |
||||||||
| Cash and cash equivalents |
$ | 64,540 | $ | 50,722 | ||||
| Short-term investments |
64,997 | 64,986 | ||||||
| Accounts receivable, net |
57,512 | 51,862 | ||||||
| Inventories, net |
49,934 | 28,242 | ||||||
| Deferred income taxes, net |
5,297 | 4,455 | ||||||
| Prepaid expenses and other current assets |
9,207 | 8,045 | ||||||
|
|
|
|
|
|||||
| Total current assets |
251,487 | 208,312 | ||||||
|
|
|
|
|
|||||
| Property and Equipment: |
||||||||
| Machinery and equipment |
29,171 | 24,840 | ||||||
| Furniture and fixtures |
5,963 | 5,700 | ||||||
| Leasehold improvements |
10,233 | 9,682 | ||||||
|
|
|
|
|
|||||
| Property and equipment at cost |
45,367 | 40,222 | ||||||
| Less: accumulated depreciation and amortization |
(29,134 | ) | (24,982 | ) | ||||
|
|
|
|
|
|||||
| Property and equipment, net |
16,233 | 15,240 | ||||||
|
|
|
|
|
|||||
| Goodwill |
18,610 | 19,015 | ||||||
| Intangible assets, net |
6,849 | 7,204 | ||||||
| Service inventory |
17,316 | 13,726 | ||||||
| Deferred income taxes, net |
2,296 | 2,522 | ||||||
|
|
|
|
|
|||||
| Total Assets |
$ | 312,791 | $ | 266,019 | ||||
|
|
|
|
|
|||||
| LIABILITIES AND SHAREHOLDERS’ EQUITY |
||||||||
| Current Liabilities: |
||||||||
| Accounts payable |
$ | 13,396 | $ | 12,025 | ||||
| Accrued liabilities |
18,076 | 15,208 | ||||||
| Income taxes payable |
2,682 | 1,138 | ||||||
| Current portion of unearned service revenues |
15,638 | 13,357 | ||||||
| Customer deposits |
4,072 | 3,679 | ||||||
| Current portion of obligations under capital leases |
84 | 91 | ||||||
|
|
|
|
|
|||||
| Total current liabilities |
53,948 | 45,498 | ||||||
| Unearned service revenues - less current portion |
9,540 | 6,758 | ||||||
| Deferred tax liability, net |
1,148 | 1,161 | ||||||
| Obligations under capital leases - less current portion |
257 | 125 | ||||||
|
|
|
|
|
|||||
| Total Liabilities |
64,893 | 53,542 | ||||||
|
|
|
|
|
|||||
| Commitments and contingencies - See Note 13 |
||||||||
| Shareholders’ Equity: |
||||||||
| Common stock - par value $.001, 50,000,000 shares authorized; 17,381,110 and 16,894,374 issued; 16,700,875 and 16,214,139 outstanding, respectively |
17 | 17 | ||||||
| Additional paid-in capital |
169,780 | 156,310 | ||||||
| Retained earnings |
81,360 | 57,983 | ||||||
| Accumulated other comprehensive income |
5,816 | 7,242 | ||||||
| Common stock in treasury, at cost - 680,235 shares |
(9,075 | ) | (9,075 | ) | ||||
|
|
|
|
|
|||||
| Total Shareholders’ Equity |
247,898 | 212,477 | ||||||
|
|
|
|
|
|||||
| Total Liabilities and Shareholders’ Equity |
$ | 312,791 | $ | 266,019 | ||||
|
|
|
|
|
|||||
The accompanying notes are an integral part of these consolidated financial statements.
37
Table of Contents
FARO TECHNOLOGIES, INC. AND SUBSIDIARIES
CONSOLIDATED STATEMENTS OF OPERATIONS
| Years ended December 31, | ||||||||||||
| (in thousands, except share and per share data) |
2011 | 2010 | 2009 | |||||||||
| SALES |
||||||||||||
| Product |
$ | 212,635 | $ | 157,331 | $ | 117,714 | ||||||
| Service |
41,529 | 34,444 | 29,989 | |||||||||
|
|
|
|
|
|
|
|||||||
| Total Sales |
254,164 | 191,775 | 147,703 | |||||||||
|
|
|
|
|
|
|
|||||||
| COST OF SALES |
||||||||||||
| Product |
82,408 | 54,571 | 46,293 | |||||||||
| Service |
28,067 | 23,806 | 20,702 | |||||||||
|
|
|
|
|
|
|
|||||||
| Total Cost of Sales (exclusive of depreciation and amortization, shown separately below) |
110,475 | 78,377 | 66,995 | |||||||||
|
|
|
|
|
|
|
|||||||
| GROSS PROFIT |
143,689 | 113,398 | 80,708 | |||||||||
| OPERATING EXPENSES: |
||||||||||||
| Selling |
62,117 | 50,679 | 48,598 | |||||||||
| General and administrative |
26,806 | 26,776 | 24,956 | |||||||||
| Depreciation and amortization |
6,712 | 6,326 | 5,530 | |||||||||
| Research and development |
15,196 | 12,690 | 12,613 | |||||||||
|
|
|
|
|
|
|
|||||||
| Total operating expenses |
110,831 | 96,471 | 91,697 | |||||||||
|
|
|
|
|
|
|
|||||||
| INCOME (LOSS) FROM OPERATIONS |
32,858 | 16,927 | (10,989 | ) | ||||||||
|
|
|
|
|
|
|
|||||||
| OTHER (INCOME) EXPENSE |
||||||||||||
| Interest income |
(101 | ) | (105 | ) | (253 | ) | ||||||
| Other expense (income) , net |
1,217 | 2,783 | (592 | ) | ||||||||
| Interest expense |
37 | 34 | 14 | |||||||||
|
|
|
|
|
|
|
|||||||
| INCOME (LOSS) BEFORE INCOME TAX EXPENSE |
31,705 | 14,215 | (10,158 | ) | ||||||||
| INCOME TAX EXPENSE |
8,328 | 3,147 | 424 | |||||||||
|
|
|
|
|
|
|
|||||||
| NET INCOME (LOSS) |
$ | 23,377 | $ | 11,068 | $ | (10,582 | ) | |||||
|
|
|
|
|
|
|
|||||||
| NET INCOME (LOSS) PER SHARE - BASIC |
$ | 1.42 | $ | 0.69 | $ | (0.66 | ) | |||||
|
|
|
|
|
|
|
|||||||
| NET INCOME (LOSS) PER SHARE - DILUTED |
$ | 1.39 | $ | 0.68 | $ | (0.66 | ) | |||||
|
|
|
|
|
|
|
|||||||
| Weighted average shares - Basic |
16,503,773 | 16,153,831 | 16,125,449 | |||||||||
|
|
|
|
|
|
|
|||||||
| Weighted average shares - Diluted |
16,868,471 | 16,365,826 | 16,125,449 | |||||||||
|
|
|
|
|
|
|
|||||||
The accompanying notes are an integral part of these consolidated financial statements.
38
Table of Contents
FARO TECHNOLOGIES, INC. AND SUBSIDIARIES
CONSOLIDATED STATEMENTS OF SHAREHOLDERS’ EQUITY AND COMPREHENSIVE INCOME (LOSS)
FOR THE YEARS ENDED DECEMBER 31, 2011, 2010, AND 2009
| Common Stock | Additional Paid-in Capital |
Retained Earnings |
Accumulated Other Comprehensive Income |
Common Stock in Treasury |
Total | |||||||||||||||||||||||
| (in thousands except share data) |
Shares | Amounts | ||||||||||||||||||||||||||
| BALANCE DECEMBER 31, 2008 |
16,698,552 | $ | 17 | $ | 149,298 | $ | 57,497 | $ | 5,742 | $ | (246 | ) | $ | 212,308 | ||||||||||||||
|
|
|
|
|
|
|
|
|
|
|
|
|
|
|
|||||||||||||||
| Net loss |
(10,582 | ) | (10,582 | ) | ||||||||||||||||||||||||
| Currency translation adjustment |
619 | 619 | ||||||||||||||||||||||||||
|
|
|
|||||||||||||||||||||||||||
| Comprehensive loss |
(9,963 | ) | ||||||||||||||||||||||||||
|
|
|
|||||||||||||||||||||||||||
| Stock compensation expense |
2,449 | 2,449 | ||||||||||||||||||||||||||
| Issuance of restricted stock |
42,487 | |||||||||||||||||||||||||||
| Stock issued for iQvolution milestone earn-outs |
30,692 | 546 | 546 | |||||||||||||||||||||||||
| Stock options exercised |
7,750 | 83 | 83 | |||||||||||||||||||||||||
| Tax benefit from employee stock option exercises |
4 | 4 | ||||||||||||||||||||||||||
| Stock Buy Back |
(624,427 | ) | (8,829 | ) | (8,829 | ) | ||||||||||||||||||||||
|
|
|
|
|
|
|
|
|
|
|
|
|
|
|
|||||||||||||||
| BALANCE DECEMBER 31, 2009 |
16,155,054 | 17 | 152,380 | 46,915 | 6,361 | (9,075 | ) | 196,598 | ||||||||||||||||||||
|
|
|
|
|
|
|
|
|
|
|
|
|
|
|
|||||||||||||||
| Net income |
11,068 | 11,068 | ||||||||||||||||||||||||||
| Currency translation adjustment |
881 | 881 | ||||||||||||||||||||||||||
|
|
|
|||||||||||||||||||||||||||
| Comprehensive income |
11,949 | |||||||||||||||||||||||||||
|
|
|
|||||||||||||||||||||||||||
| Stock compensation expense |
149 | 2,416 | 2,416 | |||||||||||||||||||||||||
| Issuance of restricted stock |
23,181 | (24 | ) | (24 | ) | |||||||||||||||||||||||
| Stock options exercised |
75,755 | 1,405 | 1,405 | |||||||||||||||||||||||||
| Tax benefit from employee stock option exercises |
133 | 133 | ||||||||||||||||||||||||||
|
|
|
|
|
|
|
|
|
|
|
|
|
|
|
|||||||||||||||
| BALANCE DECEMBER 31, 2010 |
16,254,139 | 17 | 156,310 | 57,983 | 7,242 | (9,075 | ) | 212,477 | ||||||||||||||||||||
|
|
|
|
|
|
|
|
|
|
|
|
|
|
|
|||||||||||||||
| Net income |
23,377 | 23,377 | ||||||||||||||||||||||||||
| Currency translation adjustment |
(1,426 | ) | (1,426 | ) | ||||||||||||||||||||||||
|
|
|
|||||||||||||||||||||||||||
| Comprehensive income |
21,951 | |||||||||||||||||||||||||||
|
|
|
|||||||||||||||||||||||||||
| Stock compensation expense |
2,767 | 2,767 | ||||||||||||||||||||||||||
| Issuance of restricted stock |
15,039 | (40 | ) | (40 | ) | |||||||||||||||||||||||
| Stock options exercised |
471,697 | 9,150 | 9,150 | |||||||||||||||||||||||||
| Tax benefit from employee stock option exercises |
1,593 | 1,593 | ||||||||||||||||||||||||||
|
|
|
|
|
|
|
|
|
|
|
|
|
|
|
|||||||||||||||
| BALANCE DECEMBER 31, 2011 |
16,740,875 | $ | 17 | $ | 169,780 | $ | 81,360 | $ | 5,816 | $ | (9,075 | ) | $ | 247,898 | ||||||||||||||
|
|
|
|
|
|
|
|
|
|
|
|
|
|
|
|||||||||||||||
The accompanying notes are an integral part of these consolidated financial statements.
39
Table of Contents
FARO TECHNOLOGIES, INC. AND SUBSIDIARIES
CONSOLIDATED STATEMENTS OF CASH FLOWS
| Years Ended December 31, | ||||||||||||
| (in thousands) |
2011 | 2010 | 2009 | |||||||||
| CASH FLOWS FROM: |
||||||||||||
| OPERATING ACTIVITIES: |
||||||||||||
| Net income (loss) |
$ | 23,377 | $ | 11,068 | $ | (10,582 | ) | |||||
| Adjustments to reconcile net income (loss) to net cash provided by operating activities: |
||||||||||||
| Depreciation and amortization |
6,712 | 6,326 | 5,530 | |||||||||
| Compensation for stock options and restricted stock units |
2,727 | 2,392 | 2,449 | |||||||||
| Provision for bad debts |
2,169 | 2,408 | 1,852 | |||||||||
| Deferred income tax expense (benefit) |
(672 | ) | (693 | ) | 1,986 | |||||||
| Change in operating assets and liabilities: |
||||||||||||
| Decrease (increase) in: |
||||||||||||
| Accounts receivable |
(8,979 | ) | (13,018 | ) | 5,769 | |||||||
| Inventories, net |
(27,329 | ) | (6,273 | ) | 8,301 | |||||||
| Prepaid expenses and other current assets |
(1,417 | ) | (2,172 | ) | 1,964 | |||||||
| Income tax benefit from exercise of stock options |
(1,593 | ) | (133 | ) | (4 | ) | ||||||
| Increase (decrease) in: |
||||||||||||
| Accounts payable and accrued liabilities |
4,644 | 10,435 | (7,891 | ) | ||||||||
| Income taxes payable |
2,998 | 829 | (1,749 | ) | ||||||||
| Customer deposits |
668 | 1,474 | 1,736 | |||||||||
| Unearned service revenues |
5,384 | 2,338 | (396 | ) | ||||||||
|
|
|
|
|
|
|
|||||||
| Net cash provided by operating activities |
8,689 | 14,981 | 8,965 | |||||||||
|
|
|
|
|
|
|
|||||||
| INVESTING ACTIVITIES: |
||||||||||||
| Purchases of property and equipment |
(4,474 | ) | (4,047 | ) | (3,387 | ) | ||||||
| Payments for intangible assets |
(890 | ) | (979 | ) | (670 | ) | ||||||
| Purchases of short-term investments |
— | — | (64,986 | ) | ||||||||
| Proceeds from sales of short-term investments |
— | — | 81,965 | |||||||||
|
|
|
|
|
|
|
|||||||
| Net cash (used in) provided by investing activities |
(5,364 | ) | (5,026 | ) | 12,922 | |||||||
|
|
|
|
|
|
|
|||||||
| FINANCING ACTIVITIES: |
||||||||||||
| Proceeds from notes payable |
— | 2,490 | — | |||||||||
| Payments on notes payable |
— | (2,490 | ) | — | ||||||||
| Payments on capital leases |
(163 | ) | (84 | ) | (88 | ) | ||||||
| Income tax benefit from exercise of stock options |
1,593 | 133 | 4 | |||||||||
| Purchases of treasury stock |
— | — | (8,829 | ) | ||||||||
| Proceeds from issuance of stock, net |
9,150 | 1,405 | 83 | |||||||||
|
|
|
|
|
|
|
|||||||
| Net cash provided by (used in) financing activities |
10,580 | 1,454 | (8,830 | ) | ||||||||
|
|
|
|
|
|
|
|||||||
| EFFECT OF EXCHANGE RATE CHANGES ON CASH AND CASH EQUIVALENTS |
(87 | ) | 4,235 | (1,473 | ) | |||||||
|
|
|
|
|
|
|
|||||||
| INCREASE IN CASH AND CASH EQUIVALENTS |
13,818 | 15,644 | 11,584 | |||||||||
| CASH AND CASH EQUIVALENTS, BEGINNING OF PERIOD |
50,722 | 35,078 | 23,494 | |||||||||
|
|
|
|
|
|
|
|||||||
| CASH AND CASH EQUIVALENTS, END OF PERIOD |
$ | 64,540 | $ | 50,722 | $ | 35,078 | ||||||
|
|
|
|
|
|
|
|||||||
The accompanying notes are an integral part of these consolidated financial statements
40
Table of Contents
FARO TECHNOLOGIES, INC. AND SUBSIDIARIES
NOTES TO CONSOLIDATED FINANCIAL STATEMENTS
YEARS ENDED DECEMBER 31, 2011, 2010 and 2009
(in thousands, except share and per share data or as otherwise noted)
| 1. | SUMMARY OF SIGNIFICANT ACCOUNTING POLICIES |
Description of Business—FARO Technologies, Inc. and its subsidiaries (collectively the “Company” or “FARO”) design, develop, manufacture, market and support software-based three-dimensional measurement and imaging systems for manufacturing, industrial, building construction and forensic applications. The Company’s principal products include the FaroArm, FARO Laser ScanArm and FARO Gage, all articulated electromechanical measuring devices, and the FARO Laser Tracker ION, FARO Focus3D and FARO 3D Imager AMP, all laser-based measuring devices. Markets for the Company’s products include automobile, aerospace, heavy equipment, and law enforcement agencies. The Company sells the vast majority of its products through a direct sales force located in many of the world’s largest industrialized countries.
Principles of Consolidation—The consolidated financial statements of the Company include the accounts of FARO Technologies, Inc. and all of its subsidiaries. All intercompany transactions and balances have been eliminated. The financial statements of the Company’s foreign subsidiaries are translated into U.S. dollars using exchange rates in effect at period-end for assets and liabilities and average exchange rates during each reporting period for results of operations. Adjustments resulting from financial statement translations are reflected as a separate component of accumulated other comprehensive income.
Revenue Recognition, Product Warranty and Extended Maintenance Contracts—Revenue related to the Company’s measurement systems (integrated combinations of a measurement device, a computer and software loaded on the computer and the measurement device) is generally recognized upon shipment, as the Company considers the earnings process substantially complete as of the shipping date. The Company warrants its products against defects in design, materials and workmanship for one year. A provision for estimated future costs relating to warranty expense is recorded when products are shipped. The Company separately sells one and three year extended warranties. Extended warranty revenues are recognized on a straight-line basis over the term of the warranty. Costs relating to extended maintenance plans are recognized as incurred. Revenue from sales of software only is recognized when no further significant production, modification or customization of the software is required and when the following criteria are met: persuasive evidence of a sales agreement exists, delivery has occurred, and the sales price is fixed or determinable and deemed collectible. Revenues resulting from sales of comprehensive support, training and technology consulting services are recognized as such services are performed and are deferred when billed in advance of the performance of services. Revenue from the licensing agreements for the use of the Company’s technology for medical applications is generally recognized as licensees use the technology. Amounts representing royalties for the current year and not received as of year-end are estimated as due based on historical data and recognized in the current year.
Cash and Cash Equivalents—The Company considers cash on hand and amounts on deposit with financial institutions with maturities of three months or less when purchased to be cash and cash equivalents. The Company had deposits with foreign banks totaling $37,531 and $34,763 as of December 31, 2011 and 2010, respectively. The Company does not intend to repatriate those funds.
41
Table of Contents
Accounts Receivable and Related Allowance for Doubtful Accounts—Credit is extended to customers based on an evaluation of a customer’s financial condition and, generally, collateral is not required. Accounts receivable are generally due within 30 to 90 days and are stated at amounts due from customers net of an allowance for doubtful accounts. Accounts outstanding longer than the contractual payment terms are considered past due. The Company makes judgments as to the collectability of accounts receivable based on historical trends and future expectations. Management estimates an allowance for doubtful accounts, which adjusts gross trade accounts receivable to its net realizable value. The allowance for doubtful accounts is based on an analysis of all receivables for possible impairment issues and historical write-off percentages. The Company writes off accounts receivable when they become uncollectible, and payments subsequently received on such receivables are credited to the allowance for doubtful accounts. The Company does not generally charge interest on past due receivables.
Inventories—Inventories are stated at the lower of cost or net realizable value using the first-in first-out method. Shipping and handling costs are classified as a component of cost of sales in the consolidated statements of operations. Sales demonstration inventory is comprised of measuring devices utilized by sales representatives to present the Company’s products to customers. These products remain in sales demonstration inventory for approximately 6 to 12 months and are subsequently sold at prices that produce slightly reduced gross margins. Service inventory is comprised of inventory that is not expected to be sold within twelve months, such as training and loaned equipment.
Property and Equipment—Property and equipment purchases exceeding a thousand dollars are capitalized and recorded at cost. Depreciation is computed using the straight-line method over the estimated useful lives of the various classes of assets as follows:
| Machinery and equipment | 2 to 5 years | |||
| Furniture and fixtures | 3 to 10 years |
Leasehold improvements are amortized on a straight-line basis over the lesser of the life of the asset or the remaining term of the lease, not to exceed 7 years.
Depreciation expense was $5,394, $4,842 and $4,143 in 2011, 2010 and 2009, respectively. Accelerated methods of depreciation are used for income tax purposes in contrast to book purposes, and as a result, appropriate provisions are made for the related deferred income taxes.
Goodwill and Intangibles—Goodwill represents the excess cost of a business acquisition over the fair value of the net assets acquired. Indefinite-life identifiable intangible assets and goodwill are not amortized but are tested for impairment. The Company performs an annual review in the fourth quarter of each year, or more frequently if indicators of potential impairment exist, to determine if the carrying value of the recorded goodwill or indefinite lived intangible assets is impaired. If an asset is impaired, the difference between the value of the asset reflected on the financial statements and its current fair value is recognized as an expense in the period in which the impairment occurs.
The Company first performs a qualitative assessment to determine whether it is necessary to perform the two-step goodwill impairment test. If the Company believes, as a result of its qualitative assessment, that it is not more likely than not that the fair value of a reporting unit is less than its carrying amount, then the first and second steps of the goodwill impairment test are unnecessary. The Company elected to early adopt this accounting guidance at the beginning of its fourth quarter of 2011 on a prospective basis for goodwill impairment tests.
42
Table of Contents
If necessary, the goodwill impairment test is applied using a two-step approach. In performing the first step, the Company calculates the fair values of the reporting units using discounted cash flows (“DCF”) of each reporting unit. If the carrying amount of the reporting unit exceeds the fair market value, the second step is performed to measure the amount of the impairment loss, if any. In the second step, the implied fair value of the goodwill is estimated as the fair value of the reporting unit as calculated in the first step, less the fair values of the net tangible and intangible assets of the reporting unit other than goodwill. If the carrying amount of goodwill exceeds its implied fair market value, an impairment loss is recognized in an amount equal to that excess, not to exceed the carrying amount of the goodwill. Management has concluded there was no goodwill impairment in the years ended December 31, 2011, 2010 and 2009.
Other intangible assets principally include patents, existing product technology and customer relationships that arose in connection with the Company’s acquisition of iQvolution AG and Dimensional Photonics International. Other intangible assets are recorded at fair value at the date of acquisition and are amortized over their estimated useful lives of 3 to 20 years.
Product technology and patents are recorded at cost. Amortization is computed using the straight-line method over the lives of the patents.
Long-Lived Assets—Long-lived assets, other than goodwill and indefinite lived intangible assets, are evaluated for impairment when events or changes in business circumstances indicate that the carrying amount of the assets may not be fully recoverable. Management has concluded that there was no impairment of these assets for the years ended December 31, 2011, 2010 and 2009.
Research and Development—Research and development costs incurred in the discovery of new knowledge and the resulting translation of this new knowledge into plans and designs for new products, prior to the attainment of the related products’ technological feasibility, are recorded as expenses in the period incurred.
Reserve for Warranties—The Company establishes a liability for the twelve-month warranties included with its products by the creation of a warranty reserve, which is an estimate of the repair expenses likely to be incurred for the remaining period of the warranty measured in installation-months in each major product group. Warranty reserve is reflected in accrued liabilities in the accompanying consolidated balance sheets. The warranty expense is estimated by determining the total repair expenses for each product group in the period and determining a rate of repair expense per installation month and included in Cost of Sales-Service in the accompanying consolidated statements of operations. This repair rate is multiplied by the number of installation-months of warranty for each product group sold during the period to determine the provision for warranty expenses for the period. The Company evaluates its exposure to warranty costs at the end of each period using the estimated expense per installation month for each major product group, the number of units remaining under warranty, and the remaining number of months each unit will be under warranty. While such expenses have historically been within its expectations, the Company cannot guarantee this will continue in the future.
Income Taxes—The Company reviews its deferred tax assets on a regular basis to evaluate their recoverability based upon expected future reversals of deferred tax liabilities, projections of future taxable income, and tax planning strategies that the Company might employ to utilize such assets, including net operating loss carryforwards. Based on the positive and negative evidence for recoverability, the Company establishes a valuation allowance against the net deferred tax assets of a taxing jurisdiction in which the Company operates unless it is “more likely than not” that the Company will recover such assets through the above means. In the future, the Company’s evaluation of the need for the valuation allowance will be significantly influenced by the Company’s ability to achieve profitability and the Company’s ability to predict and achieve future projections of taxable income over a two-year period.
43
Table of Contents
The Company recognizes tax benefits related to uncertain tax positions only if it is more likely than not the tax position will be sustained upon examination by taxing authorities. For those positions where there is less than a 50% likelihood that a tax benefit will be sustained, no tax benefit has been recognized in the financial statements. In the ordinary course of business, the Company and its subsidiaries are examined by various federal, state, and foreign tax authorities. The Company regularly assesses the potential outcomes of these examinations and any future examinations for the current or prior years in determining the adequacy of its provision for income taxes.
Fair Value of Financial Instruments—The Company’s financial instruments include cash and cash equivalents, short-term investments, accounts receivable and accounts payable and accruals. Due to their short-term nature, the carrying amounts of such financial instruments approximate their fair value.
Earnings Per Share—Basic earnings per share (“EPS”) is computed by dividing earnings available to common shareholders by the weighted-average number of common shares outstanding for the period. Diluted EPS includes the effect of all dilutive stock options and equity instruments. A reconciliation of the number of common shares used in calculation of basic and diluted EPS is presented in Note 15 - Earnings Per Share.
Concentration of Credit Risk—Financial instruments that expose the Company to concentrations of credit risk consist principally of short-term investments and operating demand deposit accounts. The Company’s policy is to place its operating demand deposit accounts with high credit quality financial institutions.
Estimates—The preparation of financial statements in conformity with accounting principles generally accepted in the United States of America (“U.S. GAAP”) requires management to make estimates and assumptions that affect the reported amounts of assets and liabilities and disclosure of contingent assets and liabilities at the date of the financial statements and the reported amounts of revenues and expenses during the reporting period. Actual results could differ from those estimates.
Impact of Recently Issued Accounting Standards
In January 2010, the Financial Accounting Standards Board (“FASB”) issued ASU 2010-6, Improving Disclosures About Fair Value Measurements (“ASU 2010-6”), which requires reporting entities to make new disclosures about recurring or nonrecurring fair-value measurements, including significant transfers into and out of Level 1 and Level 2 fair-value measurements and information on purchases, sales, issuances, and settlements on a gross basis in the reconciliation of Level 3 fair-value measurements. ASU 2010-6 is effective for annual reporting periods beginning after December 15, 2009, except for Level 3 reconciliation disclosures, which are effective for annual periods beginning after December 15, 2010. The adoption of ASU 2010-6 did not have a material impact on the Company’s consolidated financial statements or disclosures nor is it expected to have a material impact in future periods.
In July 2010, the FASB issued guidance to enhance disclosures about the credit quality of a creditor’s financing receivables and the adequacy of its allowance for credit losses. The amended guidance is effective for period-end balances beginning with the first interim or annual reporting period ending on or after December 15, 2010. The amended guidance is effective for activity during a reporting period beginning with the first interim or annual reporting period beginning on or after December 15, 2010. The adoption of the amended guidance had no impact on the Company’s disclosure or on its consolidated financial statements.
44
Table of Contents
In May 2011, the Financial Accounting Standards Board (FASB) issued Accounting Standards Update No. 2011-04: Fair Value Measurement (Topic 820): Amendments to Achieve Common Fair Value Measurement and Disclosure Requirements in U.S. GAAP and IFRSs (ASU 2011-04) . ASU 2011-04 clarifies application of fair value measurement and disclosure requirements and is effective for annual periods beginning after December 15, 2011. We are currently evaluating the provisions of ASU 2011-04 and assessing the impact, if any, it may have on our financial position and results of operations.
In December 2010, the FASB issued accounting standard ASU 2010-28, Intangibles-Goodwill and Other (Topic 350): When to Perform Step 2 of the Goodwill Impairment Test for Reporting Units with Zero or Negative Carrying Amounts (a consensus of the FASB Emerging Issues Task Force) (“ASU 2010-28”). ASU 2010-28 provides amendments to Topic 350 that modifies Step 1 of the goodwill impairment test for reporting units with zero or negative carrying amounts. As a result, goodwill impairments may be reported sooner than under current practice. For public entities, ASU 2010-28 is effective for fiscal years and interim periods within those years beginning after December 15, 2010, with early adoption not permitted. The adoption of ASU 2010-28 did not have a material impact on the Company’s consolidated results of operations or financial condition.
In June 2011, the FASB issued ASU 2011-05, Comprehensive Income (Topic 220): Presentation of Comprehensive Income (“ASU 2011-05”). ASU 2011-05 will require companies to present the components of net income and other comprehensive income either as one continuous statement or as two consecutive statements. It eliminates the option to present components of other comprehensive income as part of the changes in shareholders’ equity. The standard does not change the items which must be reported in other comprehensive income, how such items are measured or when they must be reclassified to net income. ASU 2011-05 is effective for interim and annual periods beginning after December 15, 2011, with early adoption permitted. The adoption of ASU 2011-05 will only impact presentation and will not have any effect on the Company’s condensed consolidated financial statements or on its financial condition.
In December 2011, the FASB issued Accounting Standards Update No. 2011-12: Comprehensive Income (Topic 220): Deferral of the Effective Date for Amendments to the Presentation of Reclassifications of Items Out of Accumulated Other Comprehensive Income in Accounting Standards Update No. 2011-05 (ASU 2011-12). The Update defers the specific requirement to present items that are reclassified from accumulated other comprehensive income to net income separately with their respective components of net income and other comprehensive income. As part of this update, the FASB did not defer the requirement to report comprehensive income either in a single continuous statement or in two separate but consecutive financial statements. ASU 2011-12 is effective for annual periods beginning after December 15, 2011.
In September 2011, the FASB issued ASU 2011-08, Intangibles-Goodwill and Other (Topic 350) (“ASU 2011-08”). ASU 2011-08 allows entities to first assess qualitatively whether it is necessary to perform the two-step goodwill impairment test. If an entity believes, as a result of its qualitative assessment, that it is not more likely than not that the fair value of a reporting unit is less than its carrying amount, then the first and second steps of the goodwill impairment test are unnecessary. The Company elected to early adopt this accounting guidance at the beginning of its fourth quarter of 2011 on a prospective basis for goodwill impairment tests. The adoption of this standard did not have a material impact on its consolidated financial statements and footnote disclosures.
45
Table of Contents
In October 2009, the FASB issued ASU No. 2009-13, “Revenue Recognition — Multiple-Deliverable Revenue Arrangements.” The new standard changes the requirements for establishing separate units of accounting in a multiple element arrangement and requires the allocation of arrangement consideration to each deliverable based on the relative selling price. The selling price for each deliverable is based on vendor-specific objective evidence (“VSOE”) if available, third-party evidence if VSOE is not available, or estimated selling price if neither VSOE or third-party evidence is available. ASU 2009-13 is effective for revenue arrangements entered into in fiscal years beginning on or after June 15, 2010. The Company adopted ASU 2009-13 effective January 1, 2011. The adoption of ASU 2009-13 did not have an impact on our consolidated financial statements.
| 2. | SUPPLEMENTAL CASH FLOW INFORMATION |
Selected cash payments and non-cash activities were as follows:
| Years ended December 31, | ||||||||||||
| 2011 | 2010 | 2009 | ||||||||||
| Cash paid for interest |
$ | 34 | $ | 32 | $ | 7 | ||||||
| Cash paid for income taxes |
5,422 | 2,870 | 2,431 | |||||||||
| Non-Cash Activity: |
||||||||||||
| Value of Shares issued for acquisition of iQvolution |
— | — | 546 | |||||||||
| 3. | ALLOWANCE FOR DOUBTFUL ACCOUNTS |
| Years ended December 31, | ||||||||||||
| 2011 | 2010 | 2009 | ||||||||||
| Balance, beginning of year |
$ | 4,700 | $ | 3,159 | $ | 1,727 | ||||||
| Provision |
2,169 | 2,408 | 1,852 | |||||||||
| Amounts written off, net of recoveries |
(2,284 | ) | (867 | ) | (420 | ) | ||||||
|
|
|
|
|
|
|
|||||||
| Balance, end of year |
$ | 4,585 | $ | 4,700 | $ | 3,159 | ||||||
|
|
|
|
|
|
|
|||||||
46
Table of Contents
| 4. | SHORT-TERM INVESTMENTS |
Short-term investments of $65.0 million at December 31, 2011 and 2010 are comprised of U.S. Treasury Bills that mature through June 15, 2012. The interest rate on the U.S. Treasury Bills is less than one percent. The investments are classified as held-to-maturity and recorded at cost. The fair value of the U.S. Treasury Bills at December 31, 2011 and 2010 approximated cost.
| 5. | INVENTORIES |
Inventories consist of the following:
| As of December 31, 2011 |
As of December 31, 2010 |
|||||||
| Raw materials |
$ | 28,675 | $ | 12,743 | ||||
| Finished goods |
7,251 | 3,441 | ||||||
| Sales demonstration inventory |
16,794 | 14,662 | ||||||
| Reserve for excess and obsolete |
(2,786 | ) | (2,604 | ) | ||||
|
|
|
|
|
|||||
| Inventory |
$ | 49,934 | $ | 28,242 | ||||
|
|
|
|
|
|||||
| Service inventory |
$ | 17,316 | $ | 13,726 | ||||
|
|
|
|
|
|||||
| 6. | GOODWILL |
The Company’s goodwill at December 31, 2011 and 2010 is related to its acquisition of three previous businesses. The Company evaluates each reporting unit’s fair value as compared to its carrying value on December 31 of each year or more frequently if events or changes in circumstances indicate that the carrying value may exceed the fair value. The Company first performs a qualitative assessment to determine whether it is necessary to perform the two-step goodwill impairment test. Recoverability of goodwill is measured using a discounted cash flow model incorporating discount rates commensurate with the risks involved for each reporting unit. The key assumptions used in the discounted cash flow model include discount rates, growth rates, cash flow projections and terminal value rates. These rates are susceptible to change and require significant management judgment. Impairments to goodwill are charged against earnings in the period the impairment is identified. The Company has three reporting units for which goodwill was tested on December 31, 2011: the Americas Region, the Europe/Africa Region, and the Asia Pacific Region, as shown in the table below. As of December 31, 2011 and 2010, the Company did not have any goodwill that was identified as impaired. The changes in goodwill of $0.4 million in 2011 and $0.9 million in 2010 are to adjustments for changes in foreign exchange rates related to an acquisition made in 2005.
47
Table of Contents
| December 31, 2011 |
Beginning Balance |
Additions | Foreign Currency Translation |
Ending Balance |
||||||||||||
| Americas Region |
$ | 6,994 | $ | — | $ | — | $ | 6,994 | ||||||||
| Europe/Africa region |
12,021 | — | (405 | ) | 11,616 | |||||||||||
| Asia Pacific Region |
— | — | — | — | ||||||||||||
|
|
|
|
|
|
|
|
|
|||||||||
| Total |
$ | 19,015 | $ | — | $ | (405 | ) | $ | 18,610 | |||||||
|
|
|
|
|
|
|
|
|
|||||||||
| December 31, 2010 |
Beginning Balance |
Additions | Foreign Currency Translation |
Ending Balance |
||||||||||||
| Americas Region |
$ | 6,994 | $ | — | $ | — | $ | 6,994 | ||||||||
| Europe/Africa region |
12,940 | — | (919 | ) | 12,021 | |||||||||||
| Asia Pacific Region |
— | — | — | — | ||||||||||||
|
|
|
|
|
|
|
|
|
|||||||||
| Total |
$ | 19,934 | $ | — | $ | (919 | ) | $ | 19,015 | |||||||
|
|
|
|
|
|
|
|
|
|||||||||
| 7. | INTANGIBLE ASSETS |
Intangible assets consist of the following:
| December 31, | ||||||||
| 2011 | 2010 | |||||||
| Amortizable intangible assets: |
||||||||
| Product technology |
$ | 10,009 | $ | 10,501 | ||||
| Patents |
7,287 | 6,523 | ||||||
| Other |
7,535 | 7,539 | ||||||
|
|
|
|
|
|||||
| Total |
24,831 | 24,563 | ||||||
| Accumulated amortization |
(17,982 | ) | (17,359 | ) | ||||
|
|
|
|
|
|||||
| Intangible assets - net |
$ | 6,849 | $ | 7,204 | ||||
|
|
|
|
|
|||||
48
Table of Contents
Amortization expense was $1,318, $1,484 and $1,387 in 2011, 2010 and 2009, respectively. The estimated amortization expense for each of the years 2012 through 2016 and thereafter is as follows:
| Years ending December 31, |
Amount | |||||
| 2012 |
$ | 1,091 | ||||
| 2013 |
916 | |||||
| 2014 |
825 | |||||
| 2015 |
825 | |||||
| 2016 |
755 | |||||
| Thereafter |
2187 | |||||
|
|
|
|||||
| $ | 6,599 | |||||
|
|
|
|||||
| 8. | ACCRUED LIABILITIES |
Accrued liabilities consist of the following:
| As of December 31, | ||||||||
| 2011 | 2010 | |||||||
| Accrued compensation and benefits |
$ | 10,665 | $ | 8,303 | ||||
| Accrued warranties |
2,365 | 1,857 | ||||||
| Professional and legal fees |
966 | 1,000 | ||||||
| Other accrued liabilities |
4,080 | 4,048 | ||||||
|
|
|
|
|
|||||
| $ | 18,076 | $ | 15,208 | |||||
|
|
|
|
|
|||||
Activity related to accrued warranties was as follows:
| Years ended December 31, | ||||||||||||
| 2011 | 2010 | 2009 | ||||||||||
| Beginning Balance |
$ | 1,857 | $ | 1,253 | $ | 2,381 | ||||||
| Provision for warranty expense |
2,953 | 2,589 | 1,731 | |||||||||
| Warranty expired |
(2,445 | ) | (1,985 | ) | (2,859 | ) | ||||||
|
|
|
|
|
|
|
|||||||
| Ending Balance |
$ | 2,365 | $ | 1,857 | $ | 1,253 | ||||||
|
|
|
|
|
|
|
|||||||
49
Table of Contents
| 9. | LINE OF CREDIT |
On July 11, 2006, the Company entered into a loan agreement providing for an available line of credit of $30.0 million, which was most recently amended on June 18, 2009. Loans under the Amended and Restated Loan Agreement, as amended, bear interest at the rate of LIBOR plus a fixed percentage between 2.25% and 2.50% and require the Company to maintain a minimum cash balance and tangible net worth measured at the end of each of the Company’s fiscal quarters. As of December 31, 2011, the Company was in compliance with all of the covenants under the Amended and Restated Loan Agreement, as amended. The term of the Amended and Restated Loan Agreement, as amended, extends to March 31, 2012. The Company has not drawn on this line of credit. The Company believes it will be able to renew its line of credit upon the expiration of the current Amended Loan Agreement, although the terms and conditions may change.
| 10. | CAPITAL LEASES |
Assets under capital leases were $401 and $381 at December 31, 2011 and 2010, respectively. Accumulated depreciation on assets under capital leases was $294 and $202 at December 31, 2011 and 2010, respectively.
| 11. | OTHER (INCOME) EXPENSE, NET |
Other (income) expense, net consists of the following:
| Years ended December 31, | ||||||||||||
| 2011 | 2010 | 2009 | ||||||||||
| Foreign exchange transaction losses (gains) |
$ | 1,049 | $ | 2,814 | $ | (571 | ) | |||||
| Other |
168 | (31 | ) | (21 | ) | |||||||
|
|
|
|
|
|
|
|||||||
| Total other expense (income), net |
$ | 1,217 | $ | 2,783 | $ | (592 | ) | |||||
|
|
|
|
|
|
|
|||||||
50
Table of Contents
| 12. | INCOME TAXES |
As of December 31, 2011 and 2010, the Company’s gross unrecognized tax benefits totaled $0.3 million, which includes approximately $0.03 million of interest and penalties. The Company estimates that the unrecognized tax benefits will not change significantly within the next year.
A reconciliation of the beginning and ending amount of unrecognized tax benefits is as follows:
| 2011 | 2010 | 2009 | ||||||||||
| Balance at January 1, |
$ | 265 | $ | 645 | $ | 349 | ||||||
| Additions based on tax positions related to the current year |
— | — | 31 | |||||||||
| Additions for tax positions of prior years |
— | 265 | ||||||||||
| Reductions for tax positions of prior years |
— | (380 | ) | — | ||||||||
| Settlements |
— | — | — | |||||||||
|
|
|
|
|
|
|
|||||||
| Balance at December 31, |
$ | 265 | $ | 265 | $ | 645 | ||||||
|
|
|
|
|
|
|
|||||||
The Company and its subsidiaries file income tax returns in the U.S. federal jurisdiction and various state and foreign jurisdictions. The table below summarizes the open tax years and ongoing tax examinations in major jurisdictions as of December 31, 2011:
| Jurisdiction | Open Years | Examination in Process |
||||
| United States - Federal Income Tax |
2005, 2008 - 2011 | 2009 | ||||
| United States - various states |
2006 - 2011 | N/A | ||||
| Germany |
2004 - 2011 | 2004 - 2007 | ||||
| Switzerland |
2011 | N/A | ||||
| Singapore |
2006 - 2011 | N/A | ||||
The Company recognizes accrued interest and penalties related to unrecognized tax benefits in tax expense. The total amount of unrecognized tax benefits that, if recognized, would affect the effective tax rate is $0.3 million. FARO does not currently anticipate that the total amount of unrecognized tax benefits will result in material changes to its financial position. The Company is subject to income taxes at the federal, state and foreign country level. The Company’s tax returns are subject to examination at the U.S. federal level from 2005 forward and at the state level subject to a three to five year statute of limitations.
51
Table of Contents
The United States Internal Revenue Service (“IRS”) commenced an examination of the Company’s 2009 income tax returns in June 2011 that is currently in process. The IRS completed an examination of the Company’s 2005 to 2007 income tax returns in late 2009. This examination resulted in an assessment of approximately $2.6 million related to the valuation of certain intangible assets contributed to a foreign subsidiary of the Company under a R&D Cost Sharing Arrangement entered into in 2001. This assessment was paid in January 2010 and included in income tax expense for the year ended December 31, 2009. The Company does not expect this assessment will have a prospective impact on its global effective tax rate. The Company believes that it has provided appropriately for any uncertain tax positions that may arise.
The effective income tax rate for 2011, 2010, and 2009 includes a reduction in the statutory corporate tax rates for the Company’s operations in Switzerland. The favorable tax rate ruling requires the Company to maintain a certain level of manufacturing operations in Switzerland. The aggregate dollar effect of this favorable tax rate was approximately $0.9 million, or $0.05 per share, in the year ended December 31, 2011, $0.2 million, or $0.01 per share, in the year ended December 31, 2010, and $1.2 million, or $0.07 per share, in the year ended December 31, 2009.
In 2005, the Company opened a regional headquarters and began to manufacture its products in Singapore. In the third quarter of 2006, the Company received confirmation of a tax holiday for its operations from the Singapore Economic Development Board for a period of four years commencing January 1, 2006 and an additional six-year extension at a favorable tax rate subject to certain terms and conditions including employment, spending, and capital investment. The aggregate dollar effect of this favorable tax rate was approximately $0.3 million, or $0.02 per share, during the year ended December 31, 2011, $0.7 million, or $0.04 per share, in the year ended December 31, 2010 and $1.1 million, or $0.07 per share, during the year ended December 31, 2009.
At December 31, 2011 and 2010, the Company’s domestic entities had deferred income tax assets in the amount of $4,957 and $4,564, respectively.
At December 31, 2011 and 2010, the Company’s foreign subsidiaries had deferred income tax assets relating to net operating loss carry forwards, some of which expire in 5 to 15 years and others which can be carried forward indefinitely, of $14,939 and $14,084, respectively. For financial reporting purposes, a valuation allowance of $11,760 and $11,148, respectively, has been recognized to offset the deferred tax assets relating to net operating losses. The Company maintains a valuation allowance on net operating losses in jurisdictions for which it does not have a history of earnings over the last three years and where the Company believes that the deferred tax assets are not more-likely-than-not to be realized based upon two-year projections of taxable income. The Company released a valuation allowance of approximately $1.2 million in the year ended December 31, 2010 related to net operating losses of a subsidiary in Germany as a result of being included in a group consolidated tax filing with net taxable earnings.
The Company has not recognized any U.S. tax expense on undistributed international earnings, as it intends to reinvest the earnings outside the U.S. for the foreseeable future. The Company’s net undistributed international earnings were approximately $50.8 million and $38.4 million at December 31, 2011 and 2010, respectively.
Significant judgment is required in determining the Company’s worldwide provision for income taxes. In the ordinary course of a global business, there are many transactions for which the ultimate tax outcome is uncertain. The Company reviews its tax contingencies on a regular basis and makes appropriate accruals as necessary.
52
Table of Contents
Income (loss) before income taxes consists of the following:
| Years ended December 31, | ||||||||||||
| 2011 | 2010 | 2009 | ||||||||||
| Domestic |
$ | 14,268 | $ | 4,921 | $ | (7,239 | ) | |||||
| Foreign |
17,437 | 9,294 | (2,919 | ) | ||||||||
|
|
|
|
|
|
|
|||||||
| Income (loss) before income taxes |
$ | 31,705 | $ | 14,215 | $ | (10,158 | ) | |||||
|
|
|
|
|
|
|
|||||||
The components of the income tax expense are as follows:
| Years ended December 31, | ||||||||||||
| 2011 | 2010 | 2009 | ||||||||||
| Current: |
||||||||||||
| Federal |
$ | 4,356 | $ | 1,008 | $ | (1,369 | ) | |||||
| State |
423 | 98 | (133 | ) | ||||||||
| Foreign |
4,195 | 2,633 | (60 | ) | ||||||||
|
|
|
|
|
|
|
|||||||
| 8,974 | 3,739 | (1,562 | ) | |||||||||
|
|
|
|
|
|
|
|||||||
| Deferred: |
||||||||||||
| Federal |
(400 | ) | 150 | 1,199 | ||||||||
| State |
(40 | ) | 15 | 116 | ||||||||
| Foreign |
(206 | ) | (757 | ) | 671 | |||||||
|
|
|
|
|
|
|
|||||||
| (646 | ) | (592 | ) | 1,986 | ||||||||
|
|
|
|
|
|
|
|||||||
| $ | 8,328 | $ | 3,147 | $ | 424 | |||||||
|
|
|
|
|
|
|
|||||||
53
Table of Contents
Income tax expense for the years ended December 31, 2011, 2010, and 2009 differs from the amount computed by applying the federal statutory corporate rate to income before income taxes. The differences are reconciled as follows:
| Years ended December 31, | ||||||||||||
| 2011 | 2010 | 2009 | ||||||||||
| Tax expense (benefit) at statutory rate of 35% |
$ | 11,097 | $ | 4,975 | $ | (3,555 | ) | |||||
| State income taxes, net of federal benefit |
471 | 162 | (239 | ) | ||||||||
| Foreign tax rate difference |
(2,910 | ) | (1,866 | ) | (1,977 | ) | ||||||
| Research and development credit |
(418 | ) | (518 | ) | (123 | ) | ||||||
| Change in valuation allowance |
612 | 545 | 2,486 | |||||||||
| IRS settlement |
— | — | 2,628 | |||||||||
| Equity based compensation |
(91 | ) | 479 | 828 | ||||||||
| Tax expense related to uncertain tax positions |
— | (380 | ) | 265 | ||||||||
| Tax exempt interest income |
— | — | (39 | ) | ||||||||
| Manufacturing credit |
(474 | ) | (167 | ) | — | |||||||
| Other |
41 | (83 | ) | 150 | ||||||||
|
|
|
|
|
|
|
|||||||
| Total income tax expense |
$ | 8,328 | $ | 3,147 | $ | 424 | ||||||
|
|
|
|
|
|
|
|||||||
The components of the Company’s net deferred income tax asset are as follows:
| December 31, | ||||||||
| 2011 | 2010 | |||||||
| Net deferred income tax asset - Current |
||||||||
| Intercompany profit in inventory |
$ | 1,482 | $ | 1,504 | ||||
| Warranty costs |
291 | 248 | ||||||
| Bad debt reserve |
120 | 112 | ||||||
| Inventory reserve |
727 | 655 | ||||||
| Unearned service revenue |
1,997 | 1,787 | ||||||
| Other |
679 | 149 | ||||||
|
|
|
|
|
|||||
| Net deferred income tax asset - Current |
$ | 5,297 | $ | 4,455 | ||||
|
|
|
|
|
|||||
| Net deferred income tax asset - Non-current |
||||||||
| Depreciation |
$ | (779 | ) | $ | (186 | ) | ||
| Goodwill amortization |
(1,508 | ) | (1,342 | ) | ||||
| Product design costs |
(87 | ) | (61 | ) | ||||
| Employee stock options |
426 | 202 | ||||||
| Unearned service revenue |
1,065 | 973 | ||||||
| Loss carryforwards |
14,939 | 14,084 | ||||||
|
|
|
|
|
|||||
| Deferred income tax asset - Non-current |
14,056 | 13,670 | ||||||
|
|
|
|
|
|||||
| Valuation Allowance |
(11,760 | ) | (11,148 | ) | ||||
|
|
|
|
|
|||||
| Net deferred income tax asset - Non-current |
$ | 2,296 | $ | 2,522 | ||||
|
|
|
|
|
|||||
| Net deferred income tax liability - Non-current |
||||||||
| Intangible assets |
$ | (1,148 | ) | $ | (1,161 | ) | ||
|
|
|
|
|
|||||
54
Table of Contents
| 13. | COMMITMENTS AND CONTINGENCIES |
Leases – The Company leases buildings and equipment under operating leases through 2019. The following is a schedule of future minimum lease payments required under non-cancelable operating leases with initial terms in excess of one year, in effect at December 31, 2011:
| Years ending December 31, | Amount | |||||
| 2012 |
$ | 6,254 | ||||
| 2013 |
3,857 | |||||
| 2014 |
2,626 | |||||
| 2015 |
1,673 | |||||
| 2016 |
1,552 | |||||
| Thereafter |
2,345 | |||||
|
|
|
|||||
| Total future minimum lease payments |
$ | 18,307 | ||||
|
|
|
|||||
Rent expense for 2011, 2010 and 2009 was approximately $5,176, $4,044 and $4,680, respectively.
Patent Matters — On July 11, 2008, Metris USA, Inc. and its affiliates, Metris N.V., Metris IPR N.V. and 3-D Scanners Ltd., filed a complaint against the Company for patent infringement in the U.S. District Court for the District of Massachusetts (the “Massachusetts Court”) concerning U.S. Patent Nos. 6,611,617 and 7,313,264 (hereinafter, the “patents-in-suit”). Following an acquisition by Nikon Corporation in late 2009, Metris USA, Inc. subsequently changed its name to Nikon Metrology, Inc., Metris N.V. changed its name to Nikon Metrology NV, and Metris IPR N.V. was dissolved and merged into Nikon Metrology NV. We refer to each of Nikon Metrology, Inc., Nikon Metrology NV, and 3-D Scanners Ltd. as “Plaintiffs” or “Nikon”.
The Company responded to the complaint with counterclaims alleging that the patents-in-suit, which are generally directed to laser scanning devices, are invalid, non-infringed, and unenforceable due to fraud during prosecution of the patents in the U.S. Patent and Trademark Office. On August 31, 2009, the Massachusetts Court granted the Company’s motion to add counterclaims and defenses for violation of federal and state antitrust and unfair competition laws based on the alleged knowing assertion of invalid and fraudulent patents. The Company also filed an amended counterclaim to add the Plaintiff’s parent company, Nikon Corporation, as a counterclaim defendant.
On January 29, 2010, the Company filed a motion for summary judgment that the patents-in-suit are unenforceable due to inequitable conduct during patent prosecution. Evidentiary hearings on the issue of inequitable conduct commenced on July 19, 2010 and concluded on October 22, 2010. Post-trial briefing concluded on December 10, 2010. On July 14, 2010, the Company filed a motion for summary judgment of non-infringement of both patents-in-suit. In addition, during the first quarter of 2010, Nikon served a supplemental interrogatory answer revising its alleged date of conception of the patents-in-suit to an earlier date. The Company filed a motion to strike the supplemental interrogatory answer. On August 31, 2010, Nikon filed a motion for summary judgment against the Company’s counterclaims for antitrust violations and unfair trade practices. The Company filed its opposition on October 12, 2010.
A mediation hearing held on February 18, 2011 to settle the matter was unsuccessful. On February 22, 2011, the Massachusetts Court denied Nikon’s motion for summary judgment on the Company’s counterclaims for antitrust violations and unfair trade practices without prejudice. On February 24, 2011, the Massachusetts Court denied the Company’s motion for summary judgment of non-infringement without prejudice. On May 4, 2011, the Massachusetts Court found that, with respect to U.S. Patent No. 6,611,617, Nikon’s patent is unenforceable due to inequitable conduct.
55
Table of Contents
On May 26, 2011, the Company renewed its motion for summary judgment of non-infringement. On June 28, 2011, the Massachusetts Court heard oral arguments on the Company’s motion, as well as on Nikon’s renewed motion for summary judgment on the Company’s counterclaims for anti-trust violations and unfair trade practices. The Massachusetts Court also heard oral arguments regarding an intervening change in the law of inequitable conduct and whether it changes the Massachusetts Court’s May 4, 2011 finding that Nikon’s U.S. Patent No. 6,611,617 is unenforceable due to inequitable conduct.
On September 19, 2011, as a result of these changes in the law of inequitable conduct, the Massachusetts Court vacated its May 4, 2011 decision that U.S. Patent No. 6,611,617 is unenforceable. However, in the same order, the Massachusetts Court ruled that the Company did not infringe U.S. Patent No. 6,611,617. The Massachusetts Court also granted Nikon’s motion for summary judgment on the Company’s counterclaims for anti-trust violations and unfair trade practices. The Massachusetts Court denied the Company’s motion for summary judgment of non-infringement of U.S. Patent No. 7,313,264. The effect of the ruling is to reduce or eliminate the Company’s exposure with respect to claims associated with US. Patent No. 6,611,617, while the patent dispute with respect to U.S. Patent No. 7,313,264 remains ongoing. The Company believes it does not infringe U.S. Patent No. 7,313,264 and that the patent is invalid and unenforceable, and the Company will continue to vigorously defend itself against these claims.
The Company does not anticipate this lawsuit will have a material impact on the Company; however, the outcome is difficult to predict, and an adverse determination could have a material impact on the Company’s business, financial condition or results of operations.
Other than the litigation mentioned above, the Company is not involved in any other legal proceedings other than routine litigation arising in the normal course of business, none of which the Company believes will have a material adverse effect on the Company’s business, financial condition or results of operations.
| 14. | STOCK COMPENSATION PLANS |
The Company has four stock option plans that provide for the granting of stock options to key employees and non-employee members of the Board of Directors. The 1997 Employee Stock Option Plan (“1997 Plan”) provides for granting incentive stock options and nonqualified stock options to officers and key employees of the Company. The 1997 Non-employee Director Stock Option Plan provides for granting nonqualified stock options and formula options to non-employee directors. The 2004 Equity Incentive Plan (“2004 Plan”) and the 2009 Equity Incentive Plan (“2009 Plan”) provide for granting options, restricted stock, restricted stock units or stock appreciation rights to employees and non-employee directors.
56
Table of Contents
The Company was authorized to grant awards for up to 1,400,000 shares of common stock under the 1997 Plan, of which 28,583 options are currently outstanding at exercise prices between $1.68 and $27.40. These options have a 10-year term and vest over a 3-year period. The Company was also authorized to grant awards for up to 250,000 shares of common stock under the 1997 Non-employee Stock Option Director Plan, of which 3,000 options are currently outstanding at an exercise price of $21.56. The Company was also authorized to grant awards for up to 1,750,000 shares of common stock under the 2004 Plan, of which 397,170 options are currently outstanding at exercise prices between $12.50 and $31.06, and 5,251 restricted stock units are outstanding at a stock price of $13.04 to $24.30. These options and restricted stock units have a 10-year term (7 years on grants beginning in 2010) and vest over a 3-year period. The Company will not make any further grants under the 1997 Plan, the 1997 Non-employee Stock Option Director Plan or the 2004 Plan. The Company is authorized to grant awards for up to 1,781,546 shares of common stock under the 2009 Plan, as well as any shares underlying awards outstanding under the 2004 Plan as of the effective date of the 2009 Plan that thereafter terminate or expire unexercised or are canceled, forfeited or lapse for any reason. There are 436,692 options currently outstanding under the 2009 Plan at exercise prices between $17.04 and $39.33. Prior to 2009, upon election to the Board, each non-employee director was granted 3,400 restricted shares of common stock that vested ratably over three years. On the day following the Annual Meeting of Shareholders, each non-employee director, other than a non-employee director who received the initial equity grant in that same year, was granted 2,200 restricted shares of common stock that vested ratably over three years.
Beginning in 2009, upon election to the Board, each non-employee director receives an initial equity grant of shares of restricted common stock with a value equal to $100,000, calculated as of the closing share price on the date of the non-employee director’s election to the Board. The initial restricted stock grant vests on the third anniversary of the grant date, subject to the non-employee director’s continued membership on the board. Annually on the first business day following the annual meeting of stockholders, each non-employee director is granted restricted shares of common stock with a value equal to $70,000, calculated as of the closing share price on that day. The shares of restricted stock vest on the day prior to the following year’s annual meeting date, subject to a director’s continued membership on the Board. The Company records compensation cost associated with its restricted stock unit grants on a straight-line basis over the vesting term.
Compensation costs charged to operations associated with the Company’s stock incentive plans were $2,756, $2,416, and $2,449 in 2011, 2010, and 2009, respectively. The changes in stock option associated compensation cost were due to the vesting of options and the accrual of expenses relating to the issuance of restricted stock.
The Company used the Black-Scholes option-pricing model to determine the fair value of grants made using the following assumptions:
| For the Years Ended December 31 | ||||||||||||
| 2011 | 2010 | 2009 | ||||||||||
| Risk-free interest rate |
0.66% and 1.83 | % | 1.85% and 2.14 | % | 1.38% and 1.44 | % | ||||||
| Expected dividend yield |
0 | % | 0 | % | 0 | % | ||||||
| Expected option life |
4 years | 4 years | 4 years | |||||||||
| Expected volatility |
47.9% - 48.7 | % | 43.5% and 46.5 | % | 48.3 | % | ||||||
| Weighted-average expected volatility |
48.7 | % | 46.5 | % | 48.3 | % | ||||||
Historical information was the primary basis for the selection of the expected dividend yield, expected volatility and the expected lives of the options. The risk-free interest rate was based on yields of U.S. zero coupon issues and U.S. Treasury issues, with a term equal to the expected life of the option being valued.
57
Table of Contents
A summary of stock option activity and weighted average exercise prices follows:
| Options | Weighted- Average Exercise Price |
Weighted-Average Remaining Contractual Term |
Aggregate Intrinsic Value as of December 31, 2011 |
|||||||||||||
| Outstanding at January 1, 2011 |
1,098,859 | $ | 21.37 | |||||||||||||
| Granted |
272,412 | 35.89 | ||||||||||||||
| Forfeited |
(34,129 | ) | 27.93 | |||||||||||||
| Exercised |
(471,697 | ) | 19.41 | |||||||||||||
|
|
|
|
|
|
|
|
|
|||||||||
| Outstanding at December 31, 2011 |
865,445 | $ | 26.72 | 4.7 | $ | 16,684 | ||||||||||
|
|
|
|
|
|
|
|
|
|||||||||
| Options exercisable at December 31, 2011 |
419,474 | $ | 23.66 | 3.7 | $ | 9,372 | ||||||||||
|
|
|
|
|
|
|
|
|
|||||||||
The weighted-average grant-date fair value of the stock options granted during the years ended December 31, 2011, 2010 and 2009 was $14.15, $9.30 and $5.08, respectively. The aggregate intrinsic value of stock options exercised during the years ended December 31, 2011, 2010 and 2009 was $10.4 million, $0.7 million and $0.05 million, respectively. The total fair value of stock options using the Black-Scholes option pricing model vested during the years ended December 31, 2011, 2010 and 2009 was $1.6 million, $1.7 million and $1.7 million, respectively.
The following table summarizes the restricted stock activity and weighted average grant-date fair values for the year ended December 31, 2011:
| Shares | Weighted-Average Grant Date Fair Value |
|||||||
| Non-vested at beginning of period |
40,313 | $ | 23.53 | |||||
| Granted |
32,045 | 42.04 | ||||||
| Forfeited |
(624 | ) | 18.96 | |||||
| Vested |
(28,207 | ) | 26.10 | |||||
|
|
|
|
|
|||||
| Non-vested at December 31, 2011 |
43,527 | $ | 32.31 | |||||
|
|
|
|
|
|||||
As of December 31, 2011, there was $4.4 million in total unrecognized stock-based compensation expense related to non-vested stock-based compensation arrangements. The expense is expected to be recognized over a weighted average period of 2.0 years.
58
Table of Contents
| 15. | EARNINGS PER SHARE |
A reconciliation of the number of common shares used in the calculation of basic and diluted earnings per share (EPS) is presented below:
| Years Ended | ||||||||||||||||||||||||
| December 31, 2011 | December 31, 2010 | December 31, 2009 | ||||||||||||||||||||||
| Shares | Per-Share Amount |
Shares | Per-Share Amount |
Shares | Per-Share Amount |
|||||||||||||||||||
| Basic EPS |
16,503,773 | $ | 1.42 | 16,153,831 | $ | 0.69 | 16,125,449 | $ | (0.66 | ) | ||||||||||||||
| Effect of dilutive securities |
364,698 | (0.03 | ) | 211,995 | (0.01 | ) | — | — | ||||||||||||||||
|
|
|
|
|
|
|
|
|
|
|
|
|
|||||||||||||
| Diluted EPS |
16,868,471 | $ | 1.39 | 16,365,826 | $ | 0.68 | 16,125,449 | $ | (0.66 | ) | ||||||||||||||
|
|
|
|
|
|
|
|
|
|
|
|
|
|||||||||||||
The effect of 0, 605,506, and 1,030,578 potentially dilutive securities were not included for 2011, 2010 and 2009 respectively, as they were antidilutive.
| 16. | EMPLOYEE RETIREMENT BENEFIT PLAN |
The Company maintains a 401(k) defined contribution retirement plan for its eligible U.S. employees. The Company terminated matching contributions on April 18, 2009 and reinstated them on March 1, 2011. Costs charged to operations in connection with the 401(k) plan during 2011 and 2010 aggregated $640 and $0, respectively.
| 17. | SEGMENT REPORTING |
The Company has three reportable segments based upon geographic regions: Americas, Europe/Africa and Asia Pacific. The Company includes costs related to Corporate in its Americas region. The Company does not incur R&D expenses in its Asia region.
The Company develops, manufactures, markets, supports and sells CAD-based quality assurance products integrated with CAD-based inspection and statistical process control software in each of these regions. These activities represent approximately 99% of consolidated sales. The Company evaluates performance and allocates resources based upon profitable growth and assets deployed.
59
Table of Contents
The following table presents information about the Company’s reportable segments:
| 2011 | 2010 | 2009 | ||||||||||
| Americas Region |
||||||||||||
| Net sales to external customers |
$ | 97,484 | $ | 72,383 | $ | 55,062 | ||||||
| Operating income (loss) |
8,864 | 185 | (13,353 | ) | ||||||||
| Long-lived assets |
23,024 | 22,182 | 21,579 | |||||||||
| Capital expenditures |
3,371 | 1,864 | 2,898 | |||||||||
| Total assets |
167,579 | 140,667 | 131,477 | |||||||||
| Europe/Africa Region |
||||||||||||
| Net sales to external customers |
$ | 99,568 | $ | 74,724 | $ | 62,968 | ||||||
| Operating income (loss) |
6,909 | 6,362 | (371 | ) | ||||||||
| Long-lived assets |
16,592 | 17,212 | 18,245 | |||||||||
| Capital expenditures |
1,748 | 2,236 | 515 | |||||||||
| Total assets |
92,231 | 83,691 | 74,126 | |||||||||
| Asia Pacific Region |
||||||||||||
| Net sales to external customers |
$ | 57,112 | $ | 44,668 | $ | 29,673 | ||||||
| Operating income |
17,085 | 10,380 | 2,735 | |||||||||
| Long-lived assets |
2,076 | 2,065 | 1,833 | |||||||||
| Capital expenditures |
869 | 653 | 536 | |||||||||
| Total assets |
52,981 | 41,661 | 30,107 | |||||||||
| Totals |
||||||||||||
| Net sales to external customers |
$ | 254,164 | $ | 191,775 | $ | 147,703 | ||||||
| Operating income (loss) |
32,858 | 16,927 | (10,989 | ) | ||||||||
| Long-lived assets |
41,692 | 41,459 | 41,657 | |||||||||
| Capital expenditures |
5,988 | 4,753 | 3,949 | |||||||||
| Total assets |
312,791 | 266,019 | 235,710 | |||||||||
The geographical sales information presented above represents sales to customers located in each respective region, whereas the long-lived assets information represents assets held in the respective regions. There were no customers that individually accounted for 10% or more of total revenue.
60
Table of Contents
| 18. | QUARTERLY RESULTS OF OPERATIONS (UNAUDITED) |
| Quarter ended |
April 2, 2011 |
July 2, 2011 |
October 1, 2011 |
December 31, 2011 |
||||||||||||
| Sales |
$ | 52,566 | $ | 59,711 | $ | 64,807 | $ | 77,080 | ||||||||
| Gross profit |
30,272 | 33,516 | 36,389 | 43,512 | ||||||||||||
| Net income |
3,243 | 4,233 | 6,429 | 9,472 | ||||||||||||
| Net income per share: |
||||||||||||||||
| Basic |
$ | 0.20 | $ | 0.26 | $ | 0.39 | $ | 0.57 | ||||||||
| Diluted |
$ | 0.20 | $ | 0.25 | $ | 0.38 | $ | 0.56 | ||||||||
| Quarter ended |
April 3, 2010 |
July 3, 2010 |
October 2, 2010 |
December 31, 2010 |
||||||||||||
| Sales |
$ | 42,269 | $ | 45,705 | $ | 45,286 | $ | 58,515 | ||||||||
| Gross profit |
25,391 | 27,088 | 26,383 | 34,536 | ||||||||||||
| Net income |
2,064 | 1,837 | 2,328 | 4,839 | ||||||||||||
| Net income per share: |
||||||||||||||||
| Basic |
$ | 0.13 | $ | 0.11 | $ | 0.14 | $ | 0.30 | ||||||||
| Diluted |
$ | 0.13 | $ | 0.11 | $ | 0.14 | $ | 0.29 | ||||||||
61
Table of Contents
| ITEM 9. | CHANGES IN AND DISAGREEMENTS WITH ACCOUNTANTS ON ACCOUNTING AND FINANCIAL DISCLOSURE. |
None.
| ITEM 9A. | CONTROLS AND PROCEDURES. |
Evaluation of Disclosure Controls and Procedures
The Company maintains disclosure controls and procedures that are designed to ensure that information required to be disclosed by the Company in the reports it files or submits under the Exchange Act is recorded, processed, summarized and reported within the time periods specified in the SEC’s rules and forms, and that such information is accumulated and communicated to the Company’s management, including its Chief Executive Officer and Chief Financial Officer, as appropriate to allow timely decisions regarding required disclosure.
As of the end of the period covered by this report, the Company’s management carried out an evaluation, under the supervision and with the participation of its Chief Executive Officer and its Chief Financial Officer, of the effectiveness of the Company’s disclosure controls and procedures. Based upon that evaluation, the Company’s Chief Executive Officer and Chief Financial Officer concluded that the Company’s disclosure controls and procedures, as defined by Rule 13a-15(e) under the Exchange Act, were effective as of December 31, 2011.
Changes in Internal Control Over Financial Reporting
There were no changes in the Company’s internal control over financial reporting during the fourth quarter ended December 31, 2011 that have materially affected, or are reasonably likely to materially affect, the Company’s internal control over financial reporting.
Management’s Report on Internal Control Over Financial Reporting
Management of the Company is responsible for establishing and maintaining adequate internal control over financial reporting. Internal control over financial reporting is the process designed under the Chief Executive Officer’s and the Chief Financial Officer’s supervision, and effected by the Company’s Board of Directors, management and other personnel, to provide reasonable assurance regarding the reliability of financial reporting and the preparation of financial statements for external purposes in accordance with generally accepted accounting principles in the United States.
Under the supervision and with the participation of the Company’s management, including its Chief Executive Officer and Chief Financial Officer, the Company conducted an evaluation of the effectiveness of the Company’s internal control over financial reporting as of December 31, 2011, as required by Exchange Act Rule 13a-1(c). In making this assessment, the Company used the criteria set forth in the framework in Internal Control – Integrated Framework issued by the Committee of Sponsoring Organizations of the Treadway Commission. Based on the Company’s evaluation under the framework in Internal Control – Integrated Framework, management concluded that the Company’s internal control over financial reporting was effective as of December 31, 2011.
There are inherent limitations in the effectiveness of internal control over financial reporting, including the possibility that misstatements may not be prevented or detected. Accordingly, an effective control system, no matter how well designed and operated, can provide only reasonable assurance of achieving the designed control objectives, and management is required to apply its judgment in evaluating the cost-benefit relationship of possible controls and procedures. Because of the inherent limitations in all control systems, no evaluation of controls can provide absolute assurance that all control issues and instances of fraud, if any, within the company have been detected. The design of any system of controls also is based in part upon certain assumptions about the likelihood of future events, and there can be no assurance that any design will succeed in achieving its stated goals under all potential future conditions.
Grant Thornton LLP, the independent registered public accounting firm that audited the Company’s consolidated financial statements, has issued an attestation report on the Company’s internal control over financial reporting as of December 31, 2011, which appears below.
FARO Technologies, Inc.
Lake Mary, Florida
February 28, 2012
62
Table of Contents
REPORT OF INDEPENDENT REGISTERED PUBLIC ACCOUNTING FIRM
Board of Directors and Shareholders
FARO Technologies, Inc. and Subsidiaries
We have audited FARO Technologies, Inc. (a Florida Corporation) and subsidiaries’ internal control over financial reporting as of December 31, 2011, based on criteria established in Internal Control-Integrated Framework issued by the Committee of Sponsoring Organizations of the Treadway Commission (COSO). FARO Technologies, Inc. and subsidiaries’ management is responsible for maintaining effective internal control over financial reporting and for its assessment of the effectiveness of internal control over financial reporting, included in the accompanying Management’s Report on Internal Control over Financial Reporting. Our responsibility is to express an opinion on FARO Technologies, Inc. and subsidiaries’ internal control over financial reporting based on our audit.
We conducted our audit in accordance with the standards of the Public Company Accounting Oversight Board (United States). Those standards require that we plan and perform the audit to obtain reasonable assurance about whether effective internal control over financial reporting was maintained in all material respects. Our audit included obtaining an understanding of internal control over financial reporting, assessing the risk that a material weakness exists, testing and evaluating the design and operating effectiveness of internal control based on the assessed risk, and performing such other procedures as we considered necessary in the circumstances. We believe that our audit provides a reasonable basis for our opinion.
A company’s internal control over financial reporting is a process designed to provide reasonable assurance regarding the reliability of financial reporting and the preparation of financial statements for external purposes in accordance with generally accepted accounting principles. A company’s internal control over financial reporting includes those policies and procedures that (1) pertain to the maintenance of records that, in reasonable detail, accurately and fairly reflect the transactions and dispositions of the assets of the company; (2) provide reasonable assurance that transactions are recorded as necessary to permit preparation of financial statements in accordance with generally accepted accounting principles, and that receipts and expenditures of the company are being made only in accordance with authorizations of management and directors of the company; and (3) provide reasonable assurance regarding prevention or timely detection of unauthorized acquisition, use, or disposition of the company’s assets that could have a material effect on the financial statements. Because of its inherent limitations, internal control over financial reporting may not prevent or detect misstatements. Also, projections of any evaluation of effectiveness to future periods are subject to the risk that controls may become inadequate because of changes in conditions, or that the degree of compliance with the policies or procedures may deteriorate.
In our opinion, FARO Technologies, Inc. and subsidiaries maintained, in all material respects, effective internal control over financial reporting as of December 31, 2011, based on criteria established in Internal Control-Integrated Framework issued by COSO.
We also have audited, in accordance with the standards of the Public Company Accounting Oversight Board (United States), the consolidated balance sheets of FARO Technologies, Inc. and subsidiaries as of December 31, 2011 and 2010, and the related consolidated statements of operations, shareholders’ equity and other comprehensive income and cash flows for each of the three years in the period ended December 31, 2011 and our report dated February 28, 2012 expressed an unqualified opinion.
| /s/ GRANT THORNTON LLP |
| Orlando, Florida |
| February 28, 2012 |
| ITEM 9B. | OTHER INFORMATION |
NONE
63
Table of Contents
| ITEM 10. | DIRECTORS, EXECUTIVE OFFICERS, AND CORPORATE GOVERNANCE. |
The information required by this Item with respect to directors and executive officers is incorporated herein by reference from the information under the captions “Election of Directors” and “Executive Officers” contained in the Company’s definitive proxy statement for its 2012 Annual Meeting of Shareholders, which the Company refers to as the Proxy Statement.
The information required by this Item regarding compliance with Section 16(a) of the Exchange Act appears under the heading “Other Matters-Section 16(a) Beneficial Ownership Reporting Compliance” in the Proxy Statement and is incorporated herein by reference.
The information required by this Item with respect to corporate governance and the Company’s Code of Conduct is incorporated herein by reference from the information contained in the Proxy Statement under the heading “Corporate Governance and Board Matters”.
| ITEM 11. | EXECUTIVE COMPENSATION. |
The information required by this Item regarding executive compensation is incorporated herein by reference from the information contained in the Proxy Statement under the captions “Executive Compensation” and “Director Compensation”.
| ITEM 12. | SECURITY OWNERSHIP OF CERTAIN BENEFICIAL OWNERS AND MANAGEMENT AND RELATED STOCKHOLDER MATTERS. |
The information required by this Item regarding security ownership of certain beneficial owners and management and related stockholder matters is incorporated herein by reference from the information contained in the Proxy Statement under the captions “Security Ownership of Beneficial Owners and Management” and “Equity Compensation Plan Information”.
| ITEM 13. | CERTAIN RELATIONSHIPS AND RELATED TRANSACTIONS AND DIRECTOR INDEPENDENCE. |
The information required by this Item about certain relationships and related transactions appears under the heading “Certain Relationships and Related Transactions” in the Proxy Statement and is incorporated herein by reference.
The information required by this Item regarding director independence is incorporated herein by reference from the information contained in the Proxy Statement under the heading “Corporate Governance and Board Matters”.
| ITEM 14. | PRINCIPAL ACCOUNTANT FEES AND SERVICES. |
The information required by this Item about principal accountant fees and services as well as related pre-approval policies appears under the heading “Independent Public Accountants” in the Proxy Statement and is incorporated herein by reference.
| ITEM 15. | EXHIBITS AND FINANCIAL STATEMENT SCHEDULES. |
(a) Documents Filed as Part of this Report. The following documents are filed as part of this Annual Report on Form 10-K:
(1) Consolidated Financial Statements. Included in Part II, Item 8 are the consolidated financial statements, the notes thereto and the report of the Independent Registered Public Accounting Firm.
(2) Exhibits. The exhibits listed in the accompanying Exhibit Index are filed or incorporated by reference as part of this Annual Report on Form 10-K.
64
Table of Contents
SIGNATURES
Pursuant to the requirements of Section 13 or 15(d) of the Securities Exchange Act of 1934, the registrant has duly caused this report to be signed on its behalf by the undersigned, thereunto duly authorized.
| FARO TECHNOLOGIES, INC. | ||||||
| Date: February 28, 2012 |
By: | /s/ Keith S. Bair | ||||
| Keith S. Bair, Senior Vice President | ||||||
| (Duly Authorized Officer and Principal | ||||||
Pursuant to the requirements of the Securities Exchange Act of 1934, this report has been signed below by the following persons on behalf of the registrant and in the capacities and on the dates indicated. Each person whose signature appears below constitutes and appoints JAY W. FREELAND his true and lawful attorney-in-fact and agent, with full power of substitution and revocation, for him and in his name, place and stead, in any and all capacities, to sign any and all amendments to this report and to file the same, with all exhibits thereto, and other documents in connection therewith, with the Securities and Exchange Commission, granting unto said attorneys-in-fact and agents, and each of them, full power and authority to do and perform each and every act and thing requisite and necessary to be done in connection therewith, as fully to all intents and purposes as he might or could do in person, hereby ratifying and confirming all that said attorneys-in-fact and agents, or either of them, may lawfully do or cause to be done by virtue hereof.
| Signature | Title | Date | ||
| /s/ Simon Raab |
Chairman of the Board and Director | February 28, 2012 | ||
| Simon Raab | ||||
| /s/ Jay W. Freeland |
President and Chief Executive | February 28, 2012 | ||
| Jay W. Freeland | Officer (Principal Executive Officer) and Director |
|||
| /s/ Keith S. Bair |
Senior Vice President and Chief | February 28, 2012 | ||
| Keith S. Bair | Financial Officer (Principal Financial Officer and Principal Accounting Officer) | |||
| /s/ John Caldwell |
Director | February 28, 2012 | ||
| John Caldwell | ||||
| /s/ Lynn Brubaker |
Director | February 28, 2012 | ||
| Lynn Brubaker | ||||
| /s/ Stephen R. Cole |
Director | February 28, 2012 | ||
| Stephen R. Cole | ||||
| /s/ Marvin Sambur |
Director | February 28, 2012 | ||
| Marvin Sambur | ||||
| /s/ John Donofrio |
Director | February 28, 2012 | ||
| John Donofrio | ||||
65
Table of Contents
EXHIBIT INDEX
| Exhibit No. | Description | |
| 3.1 | Articles of Incorporation, as amended (Filed as Exhibit 3.1 to Registrant’s Registration Statement on Form S-1, No. 333-32983, and incorporated herein by reference) | |
| 3.2 | Amended and Restated Bylaws (Filed as Exhibit 3.1 to Registrant’s Current Report on Form 8-K, dated February 3, 2010, and incorporated herein by reference) | |
| 4.1 | Specimen Stock Certificate (Filed as Exhibit 4.1 to Registrant’s Registration Statement on Form S-1, No. 333-32983, and incorporated herein by reference) | |
| 10.1 | 1993 Stock Option Plan, as amended (Filed as Exhibit 10.1 to Registrant’s Registration Statement on Form S-1, No. 333-32983, and incorporated herein by reference)* | |
| 10.2 | 1997 Amended and Restated Employee Stock Option Plan (Filed as Exhibit 4.2 to Registrant’s Registration Statement on Form S-8, No. 333-125021, and incorporated herein by reference)* | |
| 10.3 | Amended and Restated 2004 Equity Incentive Plan (Filed as Exhibit 10.1 to Registrant’s Form 8-K dated November 20, 2008, and incorporated herein by reference)* | |
| 10.4 | Amendment to Amended and Restated 2004 Equity Incentive Plan (Filed as Exhibit 10.3 to Registrant’s Form 8-K, dated April 8, 2009, and incorporated herein by reference)* | |
| 10.5 | 1997 Non-Employee Director Stock Option Plan (Filed as Exhibit 10.3 to Registrant’s Registration Statement on Form S-1, No. 333-32983, and incorporated herein by reference)* | |
| 10.6 | 2009 Equity Incentive Plan (Filed as Appendix A to Registrant’s Definitive Proxy Statement on Schedule 14A dated April 13, 2009, and incorporated herein by reference)* | |
| 10.7 | First Amendment to the 2009 Equity Incentive Plan (Filed as Exhibit 10.1 to Registrant’s Current Report on Form 8-K, dated April 13, 2011, and incorporated herein by reference)* | |
| 10.8 | Summary of Director Compensation Program* | |
| 10.9 | Form of Patent and Confidentiality Agreement between the Company and each of its employees (Filed as Exhibit 10.10 to Registrant’s Registration Statement on Form S-1, No. 333-32983, and incorporated herein by reference) | |
| 10.10 | Form of Restricted Stock Grant Agreement under the 2004 Equity Incentive Plan (Filed as Exhibit 10.7 to Registrant’s Annual Report on Form 10-K for the year ended December 31, 2006 and incorporated herein by reference)* | |
| 10.11 | Form of Restricted Stock Unit Grant Agreement under the 2004 Equity Incentive Plan (Filed as Exhibit 10.8 to Registrant’s Annual Report on Form 10-K for the year ended December 31, 2006 and incorporated herein by reference)* | |
| 10.12 | Form of Stock Option Grant Agreement under the 2004 Equity Incentive Plan (Filed as Exhibit 10.1 to Registrant’s Quarterly Report on Form 10-Q for the quarter ended March 29, 2008 and incorporated herein by reference)* | |
Table of Contents
| 10.13 | Amended and Restated Loan Agreement, dated as of July 11, 2006, between the Company and SunTrust Bank (Filed as Exhibit 10.1 to Registrant’s Current Report on Form 8-K dated July 11, 2006 and incorporated herein by reference) | |
| 10.14 | First Amendment to Amended and Restated Loan Agreement, dated November 21, 2008, between FARO Technologies, Inc. and SunTrust Bank (Filed as Exhibit 10.1 to Registrant’s Current Report on Form 8-K, dated November 21, 2008, and incorporated herein by reference) | |
| 10.15 | Second Amendment to Amended and Restated Loan Agreement, dated April 22, 2009, between FARO Technologies, Inc. and SunTrust Bank (Filed as Exhibit 10.1 to Registrant’s Current Report on Form 8-K, dated April 24, 2009, and incorporated herein by reference) | |
| 10.16 | Third Amendment to Amended and Restated Loan Agreement, dated June 18, 2009, between FARO Technologies, Inc. and SunTrust Bank (Filed as Exhibit 10.1 to Registrant’s Current Report on Form 8-K, dated June 22, 2009, and incorporated herein by reference) | |
| 10.17 | Amended and Restated Employment Agreement, dated December 14, 2010, by and between the Company an d Jay Freeland (Filed as Exhibit 10.17 to the Registrant’s Annual Report on Form 10-K, for the year ended December 31, 2010 and incorporated herein by reference)* | |
| 10.18 | Amended and Restated Employment Agreement, dated December 14, 2010 by and between the Company and Keith Bair (Filed as Exhibit 10.18 to the Registrant’s Annual Report on Form 10-K, for the year ended December 31, 2010 and incorporated herein by reference)* | |
| 10.19 | FARO Technologies, Inc. Change in Control Severance Policy (Filed as Exhibit 10.3 to Registrant’s Current Report on Form 8-K, dated November 7, 2008, and incorporated herein by reference) * | |
| 10.20 | Amendment to FARO Technologies, Inc. Change in Control Severance Policy, dated April 9, 2010 (Filed as Exhibit 10.1 to Registrant’s Current Report on Form 8-K, dated April 15, 2010, and incorporated herein by reference)* | |
| 10.21 | Amendment to FARO Technologies, Inc. Change in Control Severance Policy, dated December 14, 2010 (Filed as Exhibit 10.21 to the Registrant’s Annual Report on Form 10-K, for the year ended December 31, 2010 and incorporated herein by reference)* | |
| 10.22 | Lease Agreement dated July 8, 2008, by and between the Company and James W. Hickman Revocable Trust (Filed as Exhibit 10.16 to Registrant’s Quarterly Report on Form 10-Q for the quarter ended September 27, 2008 and incorporated herein by reference) | |
| 10.23 | Lease Agreement dated September 15, 2008, by and between the Company and NB MS NEBC LLC (Filed as Exhibit 10.17 to Registrant’s Quarterly Report on Form 10-Q for the quarter ended September 27, 2008 and incorporated herein by reference) | |
| 10.24 | Sublease Agreement dated September 30, 2007 between the Company and Priority HealthCare Corporation (Filed as Exhibit 10.14 to Registrant’s Annual Report on Form 10-K for the year ended December 31, 2007 and incorporated herein by reference) | |
| 10.25 | Lease Agreement dated September 26, 2007, by and between the Company and Sun Life Assurance Company of Canada (Filed as Exhibit 10.15 to Registrant’s Annual Report on Form 10-K for the year ended December 31, 2007 and incorporated herein by reference) | |
| 10.26 | Amended and Restated Lease Agreement, dated October 1, 2009, by and between the Company and Emma Investments, LLC (Filed as Exhibit 10.26 to Registrant’s Annual Report on Form 10-K for the year ended December 31, 2009 and incorporated herein by reference) | |
Table of Contents
| 10.27 | First Amendment to Lease Agreement, dated October 1, 2009, by and between the Company and Sun Life Assurance Company of Canada (Filed as Exhibit 10.27 to Registrant’s Annual Report on Form 10-K for the year ended December 31, 2009 and incorporated herein by reference). | |
| 10.28 | Joint Marketing and Sales Agreement, dated September 14, 2010, by and between the Company and Carl Zeiss IMT Corporation (Filed as Exhibit 99.2 to Registrant’s Current Report on Form 8-K, dated September 15, 2010, and incorporated herein by reference) | |
| 21.1 | List of Subsidiaries | |
| 23.1 | Consent of Grant Thornton LLP | |
| 24.1 | Power of Attorney relating to subsequent amendments (included on the signature page(s) of this report). | |
| 31-A | Certification of the Chief Executive Officer Pursuant to Section 302 of the Sarbanes-Oxley Act of 2002 | |
| 31-B | Certification of the Principal Financial Officer Pursuant to Section 302 of the Sarbanes-Oxley Act of 2002 | |
| 32-A | Certification of the Chief Executive Officer Pursuant to Section 906 of the Sarbanes-Oxley Act of 2002 | |
| 32-B | Certification of the Principal Financial Officer Pursuant to Section 906 of the Sarbanes-Oxley Act of 2002 | |
| 99.1 | Properties | |
| * | Indicates management contracts and compensatory plans and arrangements | |