Attached files
| file | filename |
|---|---|
| 8-K - FORM 8-K - PROSPERITY BANCSHARES INC | d307356d8k.htm |
| EX-2.1 - AGREEMENT AND PLAN OF REORGANIZATION - PROSPERITY BANCSHARES INC | d307356dex21.htm |
| EX-99.2 - PRESS RELEASE - PROSPERITY BANCSHARES INC | d307356dex992.htm |
 Exhibit 99.1
Merger with American State Financial Corp
February 27,
2012 |
 2
“Safe Harbor”
Statement
“Safe Harbor”
Statement
under the Private Securities Litigation Reform Act of 1995
Statements contained in this presentation which are not
historical facts and which pertain to future operating results
of
Prosperity
Bancshares
®
and
its
subsidiaries
constitute
“forward-looking
statements”
within
the
meaning
of
the
Private Securities Litigation reform Act of 1995. These
forward-looking statements involve significant risks and
uncertainties. Actual results may differ materially from the
results discussed in these forward-looking statements. Factors
that might cause such a difference include, but are not limited
to, those discussed in the company’s periodic filings with the
SEC.
Copies
of
the
SEC
filings
for
Prosperity
Bancshares
®
may be downloaded from the Internet at no charge from
www.prosperitybanktx.com. |
 3
Strategic Rationale
Strategic Rationale
•
American State merger marks Prosperity’s entry into West Texas in a
significant way:
–
Expands Prosperity west of I-35 and creates a presence in 18 new
counties, for a total of 78 counties of operation upon
completion –
American State is ranked in the top three by deposit market share in
each of the following attractive markets: Lubbock, Abilene and
Odessa –
Creates ample opportunities for in-market consolidation in new
markets across Texas •
Creates the second largest bank focused solely on Texas with
approximately $14 billion in assets:
–
Improves Texas deposit market share ranking to the seventh position
from number nine –
Significantly increases the C&I loan portfolio, increasing from
approximately $440 million to over $740 million
–
Complementary balance sheets as American State brings high quality,
low cost deposits and pristine asset quality
•
Following
the
merger,
Prosperity
will
be
the
51st
largest
U.S.
headquartered
banking
institution |
 4
Assumptions & Impact
Assumptions & Impact
•
Expected to be approximately 8% accretive to earnings per share
•
The tangible common equity ratio is restored in approximately one
year •
Preliminary loan mark is approximately equal to American State’s
current loan loss reserve
•
Non-deposit fee revenue is enhanced through the merger
•
Through the merger Prosperity will acquire a trust department with $850
million in assets under management |
 5
Pro Forma Branch Franchise
Pro Forma Branch Franchise
(1) PB pro forma for pending and recently completed
acquisitions: Texas Bankers, East Texas Financial Services and Bank Arlington
(2) ASFC excludes one drive thru branch in Odessa and eight
mobile deposit services for nursing homes that do not retain deposits
PB
(1)
(178)
ASFC
(2)
(37)
Texas Deposit Market Share
Source: SNL Financial and Microsoft MapPoint; Deposit data as of June 30, 2011 |
 6
Merger Summary
Merger Summary
Merger Partner:
American State Financial Corporation
(“American State”
or “ASFC”)
Aggregate Value:
$529.2 million
(1)
Termination Fee:
$20.0 million (3.8% of transaction value)
Due Diligence:
Completed
(1) Based on PB closing price of $41.14 on
2/24/2012 Consideration:
66.3% stock / 33.7% cash
Each share of American State common stock will be
converted into the right to receive the pro-rata share
of $178.5 million in cash and 8,525,000 shares of PB
common stock |
 7
Transaction Highlights
Transaction Highlights
(1)
Based on PB closing price of $41.14 on 2/24/2012
(2)
ASFC balance sheet and income statement data as of 12/31/2012; earnings
estimates per PB management (3)
Calculated as the premium paid to tangible book value as a percentage
of total deposits Source: SNL Financial
Anticipated Closing:
Third Quarter 2012
Pre-tax Cost Savings:
20.0%
Transaction Multiples:
Merger Price to:
(1),(2)
Book Value:
1.89x
Tang. Book Value:
2.06x
LTM Earnings:
12.6x
2012 Earnings Estimate:
13.6x
Deposit Premium:
(3)
11.1%
|
 8
Management Retention
Management Retention
The following members of American State’s management will join
Prosperity’s executive team:
Management
Current Role
Prosperity Position
W. R. Collier
Chairman & CEO
-
Holding Company Board Member
-
Senior Chairman –
West Texas Area
Michael F. Epps
Vice Chairman & President
-
Chairman –
West Texas Area
-
Prosperity Management Committee
Tony Whitehead
President –
Lubbock
Division
-
President –
West Texas Area
-
Prosperity Management Committee
Additionally, four Prosperity Bank
board seats will be offered to the
following American State Bank
Directors:
Directors
Industry
Scott Collier
Construction
Mark Kirkpatrick
Ranching / Oil & Gas
Van May
Agribusiness
Don Pickering
Manufacturing |
 9
American State
Financial Highlights
American State
Financial Highlights
•
Founded in 1948 in
Lubbock, TX
•
Consistent growth and
profitability through
recession
•
Operates 37 locations
across 18 counties
•
Established presence in
core markets of operation
Source: SNL Financial
($mm)
At or for the year ended December 31,
'08 -
'11
2008
2009
2010
2011
CAGR
Balance Sheet
Total Assets
$2,203.4
$2,406.7
$2,690.8
$3,081.7
11.8%
Total Net Loans
979.7
1,036.5
1,073.7
1,174.3
6.2%
Securities
1,000.9
1,149.5
1,225.1
1,587.8
16.6%
Deposits
1,766.1
1,931.8
2,157.1
2,459.5
11.7%
Total Equity
229.5
231.8
250.9
279.7
6.8%
Balance Sheet Ratios
Loans / Deposits (%)
56.5
54.9
51.0
49.3
TCE / TA (%)
9.45
8.75
8.53
8.38
Leverage Ratio (%)
9.49
8.79
8.82
8.15
Tier 1 Ratio (%)
15.71
15.30
16.37
15.03
Total Capital Ratio (%)
16.79
16.45
17.62
16.29
Profitability Ratios
ROAA (%)
1.28
1.27
1.44
1.48
ROAE (%)
11.54
12.75
14.70
15.85
Net Interest Margin (%)
3.58
3.89
3.85
3.62
Efficiency Ratio (%)
57.5
55.0
55.1
53.3
Fee Inc / Operating Rev (%)
32.6
29.5
29.1
29.4
Asset Quality
NPAs / Loans + OREO (%)
1.62
2.38
0.98
0.76
NCOs / Avg Loans (%)
0.55
1.12
0.32
0.01
Reserves / Loans (%)
1.40
1.46
1.68
2.02
Texas Ratio (%)
7.37
13.37
4.42
3.61 |
 10
Established Presence in
Core Markets of Operation
Established Presence in
Core Markets of Operation
American State has significant deposit market share in its markets,
including top three rankings in the attractive Lubbock, Abilene
and Odessa markets Note:
ASFC excludes one drive thru branch in Odessa, eight mobile deposit
services for nursing homes that do not retain deposits (seven in Lubbock and one in Abilene) and six branches not defined
by an MSA representing $199 million in deposits
Represents a top 5 market share
Source: SNL Financial and Microsoft MapPoint; Deposit data as of June
30, 2011 American State Deposit Market
Share by Texas MSA MSA
Market
Rank
Branch
Count
Deposits
in Market
($mm)
Market
Share
(%)
Population
2010
(Actual)
Proj. HH
Income
2010-15
(%)
Lubbock
3
9
737.5
12.2
276,354
15.2
Abilene
2
6
316.5
13.9
161,179
15.6
Odessa
2
4
282.2
12.6
134,891
14.5
Midland
8
2
228.3
4.9
133,025
10.9
Plainview
2
1
125.0
23.5
35,071
12.9
Levelland
3
1
87.4
17.4
22,344
14.9
Snyder
4
1
86.5
22.1
16,060
14.2
Big Spring
5
1
40.2
8.0
33,702
14.8
Brownwood
5
2
29.0
5.5
38,784
14.3
Granbury
8
2
26.3
2.9
61,010
8.4
San Angelo
13
1
19.5
1.1
109,521
14.5
Dallas-Fort Worth
157
1
18.3
0.0
6,540,927
11.5
MSA Totals
31
1,996.7
7,562,868 |
 11
West Texas Markets
Economies at a Glance
West Texas Markets
Economies at a Glance
Lubbock MSA
Abilene MSA
Midland-Odessa “Petroplex”
(1) Midland-Odessa combined unemployment rate
calculated as a weighted average of Midland and Odessa MSA unemployment rates
Source: 2010 Census Bureau, Unemployment rates per Bureau of Labor
Statistics as of December 2011 •
Population: approximately 275,000; unemployment rate: 5.3%
•
Serves as the economic, education and health care hub of the South
Plains region •
Home to Texas Tech University (30,000+ students) and Lubbock Christian
University (1,500+)
•
Largest contiguous cotton-growing region in the world
•
Population: approximately 160,000; unemployment rate: 6.0%
•
Home to Dyess Air Force Base, a 6,000 acre military facility home to
13,000 military and civilian people with an annual economic
impact of $310 million •
Diverse economy, including wind, medical, oil and high tech
industries, has stabilized the region and weathered the
recession’s regional impact •
Combined
population:
approximately
274,000;
unemployment
rate:
4.5%
(1)
•
Located on the Permian Basin, a petroleum rich area of West Texas, and
home to the New York Mercantile Exchange’s benchmark West
Texas Intermediate Crude •
Combined economies grew 13.5% in 2011 as high crude prices have driven
record consumer spending and a strong housing market
|
 12
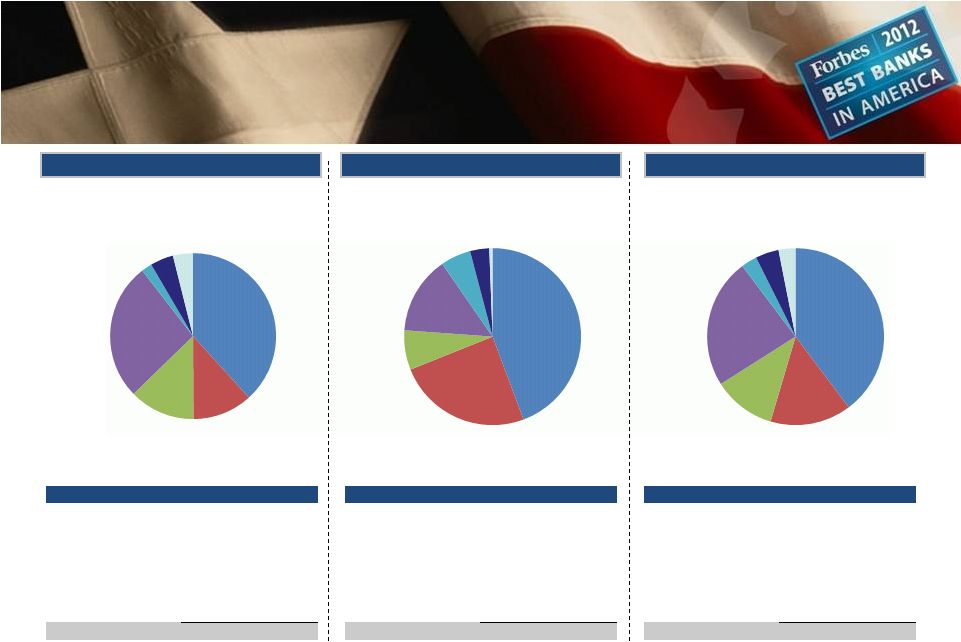
Pro Forma Loan Composition
Pro Forma Loan Composition
Prosperity Bancshares, Inc.
American State Financial Corporation
Pro Forma
Loan Portfolio ($000)
% of Total
Commercial R.E.
1,441,226
$
38.3%
Commercial
439,854
11.7%
Construction
482,140
12.8%
1-4 Family Residential
1,007,266
26.7%
Consumer
78,187
2.1%
Agriculture
170,234
4.5%
Home Equity
146,999
3.9%
Gross Loans
3,765,906
$
100.0%
Yield on Loans
5.70%
Loan Portfolio ($000)
% of Total
Commercial R.E.
537,051
$
44.3%
Commercial
298,219
24.6%
Construction
87,575
7.2%
1-4 Family Residential
172,364
14.2%
Consumer
66,944
5.5%
Agriculture
42,466
3.5%
Home Equity
7,271
0.6%
Gross Loans
1,211,890
$
100.0%
Yield on Loans
5.24%
Loan Portfolio ($000)
% of Total
Commercial R.E.
1,978,277
$
39.7%
Commercial
738,073
14.8%
Construction
569,715
11.4%
1-4 Family Residential
1,179,630
23.7%
Consumer
145,131
2.9%
Agriculture
212,700
4.3%
Home Equity
154,270
3.1%
Gross Loans
4,977,796
$
100.0%
Yield on Loans
5.59%
Source: PB’s 4 Quarter 2012 Earnings
Release and company documents for American State; Data as of December 31, 2011; Yield on loans as of quarter ended December 31, 2011
Commercial
R.E.
38.3%
Commercial
11.7%
Construction
12.8%
1-4 Family
Residential
26.7%
Consumer
2.1%
Agriculture
4.5%
Home
Equity
3.9%
Commercial
R.E.
44.3%
Commercial
24.6%
Construction
7.2%
1-4 Family
Residential
14.2%
Consumer
5.5%
Agriculture
3.5%
Home
Equity
0.6%
Commercial
R.E.
39.7%
Commercial
14.8%
Construction
11.4%
1-4 Family
Residential
23.7%
Consumer
2.9%
Agriculture
4.3%
Home
Equity
3.1%
th |
 13
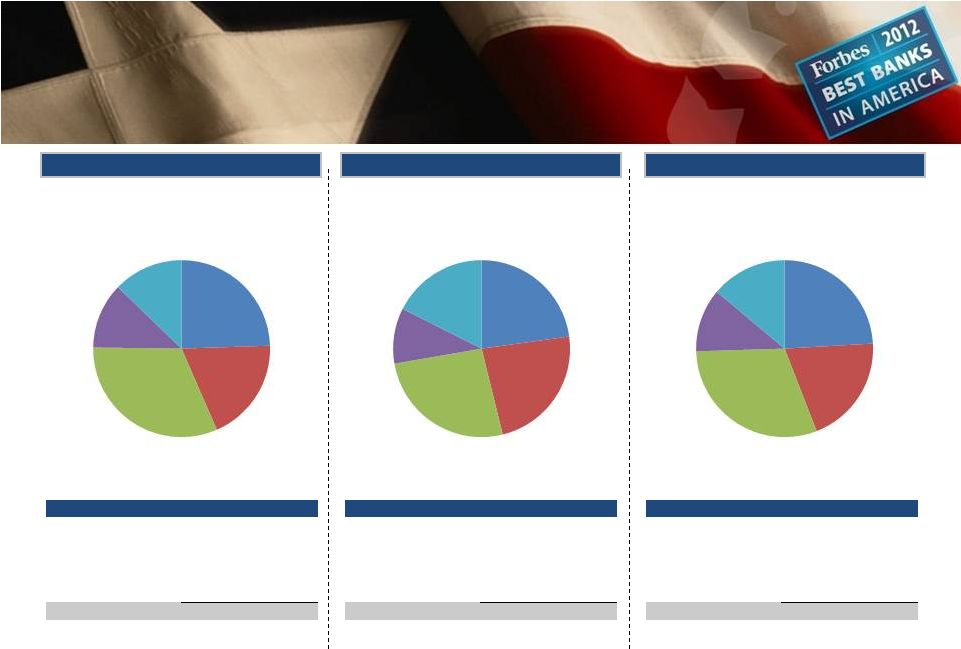
Pro Forma Deposit Composition
Pro Forma Deposit Composition
Prosperity Bancshares, Inc.
American State Financial Corporation
Pro Forma
Deposit Portfolio ($000)
% of Total
Non-interest Bearing DDA
1,972,226
$
24.5%
Interest Bearing DDA
1,532,701
19.0%
MMA & Savings
2,557,023
31.7%
CD's & IRA's<100m
968,806
12.0%
CD's & IRA's>100m
1,029,498
12.8%
Total Deposits
8,060,254
$
100.0%
Cost of Total Deposits
0.44%
Deposit Portfolio ($000)
% of Total
Non-interest Bearing DDA
561,065
$
22.8%
Interest Bearing DDA
574,094
23.3%
MMA & Savings
642,744
26.1%
CD's & IRA's<100m
249,553
10.1%
CD's & IRA's>100m
432,073
17.6%
Total Deposits
2,459,529
$
100.0%
Cost of Total Deposits
0.42%
Deposit Portfolio ($000)
% of Total
Non-interest Bearing DDA
2,533,291
$
24.1%
Interest Bearing DDA
2,106,795
20.0%
MMA & Savings
3,199,767
30.4%
CD's & IRA's<100m
1,218,359
11.6%
CD's & IRA's>100m
1,461,571
13.9%
Total Deposits
10,519,783
$
100.0%
Cost of Total Deposits
0.44%
Non-interest
Bearing
DDA
24.5%
Interest
Bearing
DDA
19.0%
MMA &
Savings
31.7%
CD's &
IRA's<100m
12.0%
CD's &
IRA's>100m
12.8%
Non-interest
Bearing
DDA
22.8%
Interest
Bearing
DDA
23.3%
MMA &
Savings
26.1%
CD's &
IRA's<100m
10.1%
CD's &
IRA's>100m
17.6%
Non-interest
Bearing
DDA
24.1%
Interest
Bearing
DDA
20.0%
MMA &
Savings
30.4%
CD's &
IRA's<100m
11.6%
CD's &
IRA's>100m
13.9%
Source: PB’s 4 Quarter 2012 Earnings
Release and company documents for American State; Data as of December 31, 2011; Cost of deposits as of quarter ended December 31, 2011
th |
 14
Capital Ratio Analysis
Capital Ratio Analysis
(1)
(2)
($mm)
PB
ASFC
Pro Forma
12/31/11
12/31/11
9/30/12
Balance Sheet
Total Assets
9,823
$
3,082
$
13,969
$
Tangible Assets
8,877
3,058
12,743
Risk Weighted Assets
4,357
1,628
6,285
8,784
3,003
12,293
Deposits
8,060
2,460
11,055
Capital
Tangible Common Equity
622
256
808
Tier 1 Capital
693
245
880
Total Capital
745
265
933
Capital Ratios
TCE / TA
7.0%
8.4%
6.3%
Leverage
7.9%
8.1%
7.2%
Tier 1 Capital
15.9%
15.0%
14.0%
Total Capital
17.1%
16.3%
14.9%
Average Assets for Leverage Ratio
(1)
Estimated close is pro forma for pending and recently completed
acquisitions: Texas Bankers, East Texas Financial Services, Bank Arlington, and American State Financial Corporation
(2)
Calculated as average assets less non-allowable intangibles; per
regulatory guidance |
 15
Contact Information
Contact Information
Corporate Headquarters
Investor Contacts
Prosperity Bank Plaza
David Zalman
4295 San Felipe
Chairman & Chief Executive Officer
Houston, Texas 77027
979.543.2200
david.zalman@prosperitybanktx.com
281.269.7199 Telephone
Dan Rollins
281.269-7222 Fax
President & Chief Operating Officer
www.prosperitybanktx.com
281.269.7199
dan.rollins@prosperitybanktx.com
David Hollaway
Chief Financial Officer
281.269.7199
david.hollaway@prosperitybanktx.com |
 ASFC Merger
Presentation -
2/27/12 |