Attached files
| file | filename |
|---|---|
| EXCEL - IDEA: XBRL DOCUMENT - ISTA PHARMACEUTICALS INC | Financial_Report.xls |
| EX-32.2 - SECTION 906 CFO CERTIFICATION - ISTA PHARMACEUTICALS INC | d275317dex322.htm |
| EX-31.1 - SECTION 302 CEO CERTIFICATION - ISTA PHARMACEUTICALS INC | d275317dex311.htm |
| EX-32.1 - SECTION 906 CEO CERTIFICATION - ISTA PHARMACEUTICALS INC | d275317dex321.htm |
| EX-31.2 - SECTION 302 CFO CERTIFICATION - ISTA PHARMACEUTICALS INC | d275317dex312.htm |
| EX-10.12 - EXECUTIVE EMPLOYMENT AGREEMENT DATED NOVEMBER 30, 2011 - ISTA PHARMACEUTICALS INC | d275317dex1012.htm |
| EX-10.13 - FORM OF EXECUTIVE EMPLOYMENT AGREEMENT DATED DECEMBER 2, 2011 - ISTA PHARMACEUTICALS INC | d275317dex1013.htm |
| EX-10.13.1 - SCHEDULE OF PARTIES TO EXECUTIVE EMPLOYMENT AGREEMENT - ISTA PHARMACEUTICALS INC | d275317dex10131.htm |
| EX-23.1 - CONSENT OF INDEPENDENT REGISTERED PUBLIC ACCOUNTING FIRM. - ISTA PHARMACEUTICALS INC | d275317dex231.htm |
Table of Contents
UNITED STATES
SECURITIES AND EXCHANGE COMMISSION
Washington, D.C. 20549
Form 10-K
| x | ANNUAL REPORT PURSUANT TO SECTION 13 OR 15(d) OF THE SECURITIES EXCHANGE ACT OF 1934 |
For Fiscal Year Ended December 31, 2011 December 31, 2011
or
| ¨ | TRANSITION REPORT PURSUANT TO SECTION 13 OR 15(d) OF THE SECURITIES EXCHANGE ACT OF 1934 |
From the transition period from to
Commission File Number 001-35396
ISTA PHARMACEUTICALS, INC.
(Exact name of registrant as specified in its charter)
| Delaware | 33-0511729 | |
| (State or other jurisdiction of incorporation or organization) |
(I.R.S. Employer Identification No.) |
50 Technology Drive, Irvine, California 92618
(Address of principal executive offices)
(949) 788-6000
(Registrant’s telephone number)
Securities registered pursuant to Section 12(b) of the Act:
| Title of Each Class |
Name of Each Exchange on Which Registered | |
| Common Stock, $0.001 par value | The NASDAQ Stock Market LLC |
Securities registered pursuant to Section 12(g) of the Act:
None
Indicate by check mark if the registrant is a well-known seasoned issuer, as defined in Rule 405 of the Securities Act. Yes ¨ No x
Indicate by check mark if the registrant is not required to file reports pursuant to Section 13 or Section 15(d) of the Act. Yes ¨ No x
Indicate by check mark whether the registrant (1) has filed all reports required to be filed by Section 13 or 15(d) of the Securities Exchange Act of 1934 during the preceding 12 months (or for such shorter period that the registrant was required to file such reports), and (2) has been subject to such filing requirements for the past 90 days. Yes x No ¨
Indicate by check mark whether the registrant has submitted electronically and posted on its corporate Web site, if any, every Interactive Data File required to be submitted and posted pursuant to Rule 405 of Regulation S-T (§232.405 of this chapter) during the preceding 12 months (or for such shorter period that the registrant was required to submit and post such files). Yes x No ¨
Indicate by check mark if disclosure of delinquent filers pursuant to Item 405 of Regulation S-K (§229.405 of this chapter) is not contained herein, and will not be contained, to the best of registrant’s knowledge, in definitive proxy or information statements incorporated by reference in Part III of this Form 10-K or any amendment to this Form 10-K x
Indicate by check mark whether the registrant is a large accelerated filer, an accelerated filer, a non-accelerated filer, or a smaller reporting company. See the definitions of “large accelerated filer,” “accelerated filer,” and “smaller reporting company” in Rule 12b-2 of the Exchange Act.
| Large accelerated filer | ¨ | Accelerated filer | ¨ | |||
| Non-accelerated filer | ¨ (Do not check if a smaller reporting company) | Smaller reporting company | x | |||
Indicate by check mark whether the registrant is a shell company (as defined by Rule 12b-2 of the Act). Yes ¨ No x
As of June 30, 2011, the aggregate market value of the Registrant’s voting stock held by non-affiliates was approximately $218,696,417.
As of January 31, 2012 there were 41,772,441 shares of Common Stock outstanding.
DOCUMENTS INCORPORATED BY REFERENCE
None.
Table of Contents
PART I
| Page | ||||||
| Item 1: | 1 | |||||
| Item 1A: | 13 | |||||
| Item 1B: | 28 | |||||
| Item 2: | 28 | |||||
| Item 3: | 28 | |||||
| Item 4: | 30 | |||||
| PART II | ||||||
| Item 5: | 30 | |||||
| Item 6: | 33 | |||||
| Item 7: | Management’s Discussion and Analysis of Financial Condition and Results of Operations |
34 | ||||
| Item 7A: | 44 | |||||
| Item 8: | 44 | |||||
| Item 9: | Changes in and Disagreements with Accountants on Accounting and Financial Disclosure |
44 | ||||
| Item 9A: | 45 | |||||
| Item 9B: | ||||||
| PART III | ||||||
| Item 10: | 47 | |||||
| Item 11: | 47 | |||||
| Item 12: | Security Ownership of Certain Beneficial Owners and Management and Related Stockholder Matters |
47 | ||||
| Item 13: | Certain Relationships and Related Transactions, and Director Independence |
47 | ||||
| Item 14. | 47 | |||||
| PART IV | ||||||
| Item 15: | 48 | |||||
Table of Contents
ISTA PHARMACEUTICALS, INC.
PART I
References in this Annual Report on Form 10-K to “ISTA”, “we”, “our”, “us”, or the “Company” refer to ISTA Pharmaceuticals, Inc. This Annual Report on Form 10-K contains forward-looking statements based on expectations, estimates and projections as of the date of this filing. Actual results may differ materially from those expressed in forward-looking statements. See Item 7 of Part II – “Management’s Discussion and Analysis of Financial Condition and Results of Operations.” ISTA Pharmaceuticals, Inc. was incorporated as Advanced Corneal Systems, Inc. in California in February 1992 to discover, develop and market new remedies for diseases and conditions of the eye. In March 2000, we changed our name to ISTA Pharmaceuticals, Inc., and we reincorporated in Delaware in August 2000. BROMDAY™, BEPREVE®, ISTALOL®, VITRASE®, XIBROM (bromfenac ophthalmic solution)®, XIBROM™, T-PRED™, PROLENSA™, BEPOSONE™, BEPOMAX™, ISTA®, ISTA Pharmaceuticals, Inc.® and the ISTA logo are our trademarks, either owned or under license.
We obtained the market data and industry information contained in this Annual Report on Form 10-K from internal surveys, estimates, reports and studies, as appropriate, as well as from market research, publicly available information and industry publications. Although we believe our internal surveys, estimates, reports, studies and market research, as well as industry publications are reliable, we have not independently verified such information, and as such, we do not make any representation as to its accuracy.
| Item 1: | Business. |
Overview
We are a rapidly growing commercial-stage, multi-specialty pharmaceutical company developing, marketing and selling our own products in the United States, or the U.S., and Puerto Rico. We are the third largest branded prescription eye care business in the U.S. and have a growing allergy drug franchise. We have had success in obtaining product approvals for five prescription drugs in six years. We manufacture our finished good products through third-party contracts, and we in-license or acquire new products and technologies to add to our internal development efforts from time to time. Our products and product candidates seek to treat allergy and serious diseases of the eye and include therapies for ocular inflammation and pain, glaucoma, dry eye and ocular and nasal allergies. The U.S. prescription markets for 2011, which our therapies seek to address, include key segments of the $7.5 billion ophthalmic pharmaceutical market and the $2.5 billion nasal allergy market.
We currently have four products available for sale in the U.S. and Puerto Rico: once-daily BROMDAY (bromfenac ophthalmic solution) 0.09%, for the treatment of postoperative inflammation and reduction of ocular pain in patients who have undergone cataract extractions, BEPREVE (bepotastine besilate ophthalmic solution) 1.5%, for the treatment of ocular itching associated with allergic conjunctivitis, ISTALOL (timolol maleate ophthalmic solution) 0.05%, for the treatment of glaucoma, and VITRASE (hyaluronidase injection) ovine, 200 USP units/ml, for use as a spreading agent. At the beginning of 2011, we had one additional product available for sale, twice-daily XIBROM (bromfenac ophthalmic solution) 0.09%, a topical non-steroidal anti-inflammatory formulation of bromfenac for the treatment of ocular inflammation and pain following cataract surgery, or XIBROM. Due to the rapid adoption of BROMDAY, we stopped shipping XIBROM in February 2011. At that time, we anticipated wholesalers would continue to sell XIBROM to pharmacies until their inventories were depleted. As of December 31, 2011, the wholesalers’ inventories were depleted. We believe that the conversion of XIBROM to BROMDAY has been well accepted by the markets. In addition, we have several eye and allergy product candidates in various stages of development, including treatments for dry eye, ocular inflammation and pain and nasal allergies.
We have incurred losses since inception and have a stockholders’ deficit of approximately $49.1 million at December 31, 2011.
Recent Business Developments
On December 16, 2011, we announced that our Board of Directors, or our Board, had rejected an unsolicited proposal by Valeant Pharmaceuticals International, Inc., or Valeant, to acquire our company for $6.50 per share in cash, a decision that we reiterated on January 4, 2012, after careful consideration and with the assistance of our financial and legal advisors. On December 16, 2011, we also announced that our Board would commence a review of all strategic options available to us in the context of the Board’s fiduciary responsibilities and our strategic plans. On January 11, 2012, we received a revised non-binding proposal from Valeant to acquire our company for $7.50 per share in cash with a target price of $8.50 per share in cash, subject to due diligence, which increased proposal Valeant confirmed in a letter to us on January 16, 2012. Valeant withdrew its proposal on January 30, 2012. Our process for review of strategic options is advancing as planned and in an expeditious manner, consistent with our Board’s fiduciary responsibilities and our commitment to maximizing shareholder value. Through December 31, 2011, we have incurred $1.1 million in legal and banking fees to evaluate and respond to Valeant’s proposal.
1
Table of Contents
Our Products and Pipeline
The following is a summary of our key products and product candidates:
| Product |
Indication |
Development Status | ||
| Currently marketed products |
||||
| BROMDAY | Postoperative inflammation and reduction of ocular pain after cataract extractions | Marketed | ||
| BEPREVE | Ocular itching associated with allergic conjunctivitis | Marketed | ||
| ISTALOL | Glaucoma | Marketed | ||
| VITRASE | Spreading agent | Marketed | ||
| Products under development |
||||
| OTC tear products | Dry eyes | Expect to launch first over-the-counter, or OTC artificial tear product in the second half of 2012. | ||
| PROLENSA | Postoperative inflammation and reduction of ocular pain after cataract extractions | Expect to file an NDA with the FDA in the first half of 2012 with approval anticipated in 2013 | ||
| T-PRED | Steroid-responsive inflammation where a risk of bacterial infection exists | Expect to initiate Phase 3 clinical trials in the second half of 2012 | ||
| BEPOMAX | Allergic rhinitis | Completed Phase 2 clinical study with positive results reported in April 2011 | ||
| BEPOSONE | Allergic rhinitis | Initiated Phase 2 clinical study and completed enrollment, both in early 2012. Expect to announce results in the first half of 2012. | ||
| Bromfenac Adjunct for AMD | Age-related macular degeneration, or AMD | Proof of concept completed; discussing clinical path forward with FDA | ||
Commercial Products
BROMDAY
BROMDAY™ (bromfenac ophthalmic solution) 0.09%, or BROMDAY, is a once-daily topical non-steroidal anti-inflammatory formulation of bromfenac for the treatment of postoperative inflammation and reduction of ocular pain in patients who have undergone cataract extractions. In October 2010, we received approval from the U.S. Food and Drug Administration, or FDA, and were granted three years of marketing exclusivity for BROMDAY under the Drug Price Competition and Patent Term Restoration Act, commonly known as the Hatch-Waxman Act. We promote BROMDAY through our own sales force to ophthalmologists.
Senju Pharmaceuticals, Co. Ltd., or Senju, first developed bromfenac in Japan in 2000. We acquired U.S. ophthalmic rights to bromfenac in May 2002 under a license from Senju. In December 2009, we expanded the territory to include not only the U.S. and its possessions, but also Canada and Mexico. From 2005 to February 2011, we marketed twice-daily XIBROM in the U.S. for the treatment of postoperative inflammation and the reduction of ocular pain in patients who have undergone cataract surgery.
In 2010, we launched BROMDAY in the U.S., when we focused our sales and marketing efforts on encouraging physicians to transition from prescribing XIBROM to prescribing BROMDAY.
2
Table of Contents
In February 2011, we stopped shipping XIBROM. At that time, we anticipated wholesalers would continue to sell XIBROM to pharmacies until their inventories were depleted. As of December 31, 2011, the wholesalers’ inventories of XIBROM were depleted. We believe that the conversion of XIBROM to BROMDAY has been well accepted by the markets. During the third quarter of 2011, we launched a twin-pack size of BROMDAY. This new packaging configuration will allow us to offer BROMDAY to our customers in an alternative pack configuration for cataract surgeries for both eyes.
Based on 2011 data from IMS Health, BROMDAY achieved the number one position in total prescription dollars in September 2011. Also, based upon 2011 data from IMS Health, we estimate that 2011 sales in the U.S. topical ophthalmic non-steroidal anti-inflammatory market were approximately $370 million, with total prescriptions over three million. From 2010 to 2011, the U.S. topical ophthalmic non-steroidal anti-inflammatory market grew approximately 6% in total dollars. Other non-steroid treatments currently available must be dosed two, three or four times a day as compared to BROMDAY’s once-daily dosing. BROMDAY, including the twin-pack configuration, has achieved in excess of $85 million in net product revenues in the first full year after launch.
For the year ended December 31, 2011, BROMDAY accounted for approximately 54% of our total net revenues. On a combined basis, BROMDAY and XIBROM accounted for approximately 55% of our total net revenues.
BEPREVE
BEPREVE (bepotastine besilate ophthalmic solution) 1.5%, or BEPREVE, is a twice-daily prescription treatment for ocular itching associated with allergic conjunctivitis in patients two years of age and older. In September 2009, we received approval from the FDA for, and launched, BEPREVE in the U.S. We promote BEPREVE through our own sales force to ophthalmologists, optometrists and allergists.
BEPREVE was first approved in Japan for use as a systemic drug in the treatment of allergic rhinitis and urticaria and pruritus in July 2000 and January 2002, respectively, and is marketed by Mitsubishi Tanabe Pharma Corporation (formerly Tanabe Seiyaku Co., Ltd.), or Mitsubishi Tanabe, under the brand name TALION®. TALION was co-developed by Tanabe Seiyaku and Ube Industries, Ltd., or Tanabe Seiyaku. In 2001, Tanabe Seiyaku granted Senju exclusive worldwide rights, with the exception of certain Asian countries, to develop, manufacture and market bepotastine for ophthalmic use. In 2006, we licensed the exclusive North American ophthalmic rights to bepotastine from Senju. In 2007, we licensed exclusive North American rights to nasal dosage forms of bepotastine from Tanabe Seiyaku and obtained a future right to negotiate for a North American license to oral dosage forms of bepotastine.
Based upon 2011 data from IMS Health, we estimate that 2011 sales in the U.S. prescription ocular allergy market were approximately $786 million, with total prescriptions over seven million. From 2010 to 2011, the U.S. ocular allergy market grew approximately 18% in total prescription dollars and 3% in total prescriptions. For the year ended December 31, 2011, BEPREVE accounted for approximately 18% of our total net revenues.
ISTALOL
ISTALOL (timolol maleate ophthalmic solution) 0.05%, or ISTALOL, is a once-daily eye drop solution of timolol, a beta-blocking agent for the treatment of glaucoma. ISTALOL was developed by Senju in Japan. In May 2002, we acquired rights to ISTALOL in the U.S. under a license agreement with Senju. ISTALOL has patent protection through 2018. We received FDA approval to market ISTALOL in the U.S. in 2004. We promote ISTALOL through our own sales force to ophthalmologists.
According to the Glaucoma Research Foundation, four million people in the U.S. suffer from the disease, with 120,000 new cases documented annually. Based on 2011 data from IMS Health, we estimate that the U.S. pharmaceutical market for the treatment of glaucoma exceeds $2.3 billion per year. Of this amount, the ophthalmic beta-blocker market was approximately $184 million in 2011 primarily at generic prices, with over four million prescriptions written in 2011. For the year ended December 31, 2011, ISTALOL accounted for 18% of our total net revenues.
VITRASE
We launched VITRASE (hyaluronidase injection) ovine, 200 USP units/ml, or VITRASE, our proprietary formulation of ovine hyaluronidase, for use as a spreading agent in 2004. Hyaluronidase is a naturally occurring enzyme that digests certain forms of carbohydrate molecules called proteoglycans. VITRASE, when used as a spreading agent, is injected into connective tissue, where it modifies the permeability of such tissues and promotes diffusion of injected drugs, thus accelerating their absorption.
3
Table of Contents
In October 2004, the FDA informed us that VITRASE for use as a spreading agent was entitled to five-year new chemical market exclusivity under the Federal Food, Drug and Cosmetic Act. In December 2004, the FDA approved our supplemental New Drug Application, or sNDA, for VITRASE for use as a spreading agent at a concentration of 200 USP units/mL in sterile solution. We promote our 200 USP units/mL vial of VITRASE through our own sales force to ophthalmologists.
Since late 2010, VITRASE revenues have grown, primarily due to manufacturing issues faced by competitors’ products. One of the competitors’ product reentered the market in late 2011. The other competitor’s product is not expected to be back on the market until late 2012 or beyond. For the year ended December 31, 2011, VITRASE accounted for 9% of our total net revenues.
Products under development
Over-The-Counter (OTC) Artificial Tear Products
We are developing new OTC products to treat dry eye and other ocular conditions. The formulas in these products are similar to the placebo in the Phase 3 dry eye syndrome clinical trials during 2011. The placebo in these trials proved to be effective in treating dry eye syndrome. As a result, we expect to launch our first OTC tear product in the second half of 2012.
Based on 52 rolling week data from March 2010 made available to us by Information Resources, Inc., a third party information provider, we estimate the U.S. OTC tear products market to be approximately $239 million in sales.
PROLENSA
We have developed a lower concentration new formulation of bromfenac, or PROLENSA, for post-operative inflammation and reduction of ocular pain in patients who have undergone cataract extractions. We completed and reported statistically significant results from our Phase 3 clinical program for PROLENSA in October of 2011.
The new, optimized formulation used for PROLENSA enhances the penetration of the drug into ocular tissues, allowing us to lower the concentration of the active ingredient, bromfenac, while maintaining the convenience of once-daily use of BROMDAY. In both Phase 3 studies, PROLENSA was statistically significantly better than placebo and met the primary efficacy endpoint of absence of ocular inflammation 14 days following surgery and the secondary efficacy endpoint of elimination of ocular pain one day post-surgery. There were no serious drug-related ocular or systemic adverse events, and PROLENSA’s safety profile was found to be consistent with BROMDAY. The two clinical studies had the lowest number of adverse events (greater than 2%) than any of our bromfenac clinical trials for cataract surgery to date, and, to the best of our knowledge, PROLENSA contains the lowest concentration of bromfenac currently under investigation in any clinical trials for inflammation and pain associated with cataract surgery.
The claims in a patent covering the formulation of PROLENSA were allowed by the U.S. Patent and Trademark Office in late 2011. We anticipate this allowed patent will be issued by the U.S. Patent and Trademark Office during the first half of 2012.
We plan to file a New Drug Application, or NDA, with the FDA for PROLENSA in the first half of 2012. Assuming approval by the FDA, our experience in the successful conversion of XIBROM to BROMDAY should help us prepare for a similar conversion of BROMDAY to PROLENSA, when we initiate a commercial launch planned for early 2013.
Based upon 2011 data from IMS Health, we estimate that 2011 sales in the U.S. topical ophthalmic non-steroidal anti-inflammatory market were approximately $370 million.
T-PRED
T-PRED is a proprietary formulation of a combination product of tobramycin 0.3% and prednisolone acetate 1.0%. T-PRED is being developed for the treatment of steroid responsive inflammation where the risk of bacterial infection exists. We plan to initiate Phase 3 studies in the second half of 2012.
We have discussed the study results with the FDA and have established a path forward for T-PRED. The FDA advised us to conduct several studies: two uveitis Phase 3 studies to show that prednisolone acetate in combination is as effective as the reference product; two Phase 3 allergic conjunctivitis studies demonstrating superiority to placebo; and an in-vitro antibiotic kill rate study to show the combination formulation does not affect the tobramycin kill rate as compared to the reference product, when tested against a panel of micro-organisms. We expect to initiate these studies in the second half of 2012 and, assuming timely approval by the FDA, launch the product in 2014.
4
Table of Contents
Based upon 2011 data from IMS Health, the combination antibiotic and steroid segment of the ophthalmic anti-inflammatory market had approximately a 29% share of the prescriptions, or $334 million in prescription dollars.
BEPOMAX
We are developing a proprietary single agent nasal antihistamine formulation of bepotastine for the treatment of seasonal allergic rhinitis, or BEPOMAX. In September 2007, we obtained exclusive North American rights to nasal dosage forms of bepotastine, an investigational product for the treatment of allergy symptoms, from Mitsubishi Tanabe. The active ingredient in this product candidate is patented through 2017, with additional pending patents through 2031.
In October 2010, we announced positive preliminary results from a Phase 1/2 clinical study of bepotastine besilate nasal spray conducted in Canada for the treatment of symptoms associated with seasonal allergic rhinitis, the inflammation of the nasal passages caused by allergies. The findings demonstrated two of the three bepotastine besilate concentrations tested were effective in relieving patients’ nasal symptoms after exposure to seasonal allergens. The safety data showed the drug to be well-tolerated, with adverse events consistent with those observed with other antihistamine nasal sprays and generally rated as mild. As a result of these positive outcomes, in December 2010, we initiated a Phase 2 clinical study of bepotastine besilate nasal spray for the treatment of symptoms associated with seasonal allergic rhinitis, which was completed in 2011. The randomized, placebo-controlled, parallel-group environmental study evaluated the safety and efficacy of bepotastine besilate, dosed twice daily, in patients presenting with allergic rhinitis caused by one of the most potent seasonal allergy triggers, Mountain Cedar pollen. We enrolled approximately 600 patients who were treated with either bepotastine besilate nasal spray or placebo for two weeks. Patients graded both individual nasal and ocular symptoms on a daily basis. In April 2011, we announced positive, topline results from our Phase 2 dose-ranging, environmental clinical trial.
According to the trial findings, each of three concentrations of bepotastine besilate nasal spray showed statistically significant improvements compared to placebo in patients’ nasal symptoms following exposure to Mountain Cedar pollen during the peak season for this allergen. These improvements were seen on day one of therapy and were sustained through the two-week treatment period. Further, safety data demonstrated bepotastine besilate was well-tolerated as a nasal spray, with an adverse event profile similar to placebo and consistent with those observed with bepotastine besilate dosed as a nasal spray in prior clinical trials and with other antihistamine nasal sprays. We expect to conduct additional Phase 2 and Phase 3 trials before we can file an NDA for BEPOMAX.
Upon approval by the FDA, we expect to launch both BEPOMAX and BEPOSONE. We are considering commercial partnerships for the launches of both BEPOMAX and BEPOSONE to accelerate growth and provide access to the primary care physician market.
Based upon 2011 data from IMS Health, we estimate the U.S. nasal antihistamine market to be approximately $344 million in sales, comprising about 14% of all allergic rhinitis prescription dollars.
BEPOSONE
In addition to BEPOMAX, we are developing a combination antihistamine / steroid nasal spray, with bepotastine as the antihistamine component, for the treatment of seasonal allergic rhinitis, or BEPOSONE. We filed an Investigational New Drug application, or IND, with the FDA for BEPOSONE in October 2011.
In early 2012, we initiated a four-armed Phase 2 study with BEPOSONE to treat allergic rhinitis resulting from the exposure to Mountain Cedar pollen. We have completed the enrollment for the study and expect to report preliminary results in the first half of 2012. We expect to conduct additional Phase 2 and Phase 3 trials before we can file an NDA for BEPOSONE.
Upon approval by the FDA, we expect to launch both BEPOMAX and BEPOSONE. We are considering commercial partnerships for the launches of both BEPOMAX and BEPOSONE, to accelerate growth and gain access to the primary care physician market.
Based on 2011 data from IMS Health, we estimate the U. S. seasonal allergic rhinitis to be approximately $2.5 billion in sales, with the nasal steroid component comprising about 86% of all prescription dollars.
Bromfenac Adjunct for AMD
We intend to initiate a development program for bromfenac as an adjunct therapy to be used with Lucentis® or Avastin® (trademarks of Genentech Inc., a member of the Roche Group), for the treatment of AMD. A proof of concept study was completed by a physician investigator, who published results in the second half of 2011. We are determining a path forward with the FDA for the use of a new patent allowed formulation of bromfenac for AMD.
5
Table of Contents
According to the results published in the issue of RETINA, The Journal of Retinal and Vitreous Diseases, the pilot study suggested that the topical non-steroidal anti-inflammatory drug, or NSAID, eye drop of XIBROM administered twice-daily may have an additive effect when used with intravitreal LUCENTIS® (ranibizumab injection) in reducing retinal thickness in neovascular age-related macular degeneration, or NV AMD. AMD robs the patient of all but the outermost, peripheral vision, leaving only dim images or black holes at the center of vision, and is the leading cause of vision loss and blindness among Americans who are aged 65 and older. Retinal specialists believe reducing the macular thickness (the width of the central retina) may help preserve or improve patients’ vision over the long term. Thirty eyes were tested consecutively and were randomized in a 2:1 ratio of combination therapy (intravitreal LUCENTIS and topical XIBROM) and LUCENTIS alone. All patients received LUCENTIS therapy monthly for four months, then as needed on a monthly basis in accordance with standard of care. Patients receiving XIBROM self-administered one drop twice a day for 12 months. Three-quarters of subjects enrolled had pre-existing minimally classic or occult NV AMD and a history of LUCENTIS use. Endpoints included adverse events, mean change in visual acuity, change in macular thickness, number of subjects with a 50um (micrometer) or more reduction in macular thickness and mean number of LUCENTIS injections over the 12-month period. This is the second independent study suggesting that use of XIBROM may be safe and effective as an adjunct therapy for AMD, and it is the longest performed to date with XIBROM dosing (12 months).
Based upon 2011 data from IMS Health, we estimate that 2011 sales in the U.S. topical ophthalmic non-steroidal anti-inflammatory and AMD markets were approximately $2 billion.
Other Product Candidates and Development Activities
In addition to the products presently in human clinical trials, we have a number of products that may be ready for late stage clinical study initiation in the future. These include iganidipine, to enhance ocular nerve blood flow; new formulation of latanoprost, a prostaglandin, for the treatment of glaucoma; and ecabet sodium for the treatment of dry eye.
We continually evaluate opportunities for late-stage or currently-marketed complementary products and for expansion of our existing ophthalmology, optometry, and allergy product franchises. We plan to continue to pursue such opportunities through further licensing arrangements, collaborations and product acquisitions, along with related development activities. Our ability to execute on such opportunities in some circumstances may be dependent upon our ability to raise additional capital on commercially reasonable terms.
Product Licensing Agreements
BROMDAY, BEPREVE, ISTALOL, XIBROM, Ecabet Sodium, Prostaglandins and Iganidipine Agreements with Senju
In May 2002, we acquired certain of the assets of AcSentient, Inc., or AcSentient, which included exclusive U.S. development, manufacturing and marketing rights for ISTALOL and XIBROM. The marketing rights for ISTALOL and XIBROM were originally licensed by AcSentient from Senju.
In November 2004, we entered into another license agreement with Senju under which Senju granted to us exclusive U.S. ophthalmic rights to ecabet sodium.
In 2006, we entered into three additional license agreements with Senju under which Senju has granted us exclusive North American ophthalmic rights for BEPREVE, various prostaglandin products and iganidipine.
In December 2009, we renegotiated with Senju our bromfenac rights to include, among other things, the expansion of our territory to include Canada and Mexico.
Generally, under the terms of our agreements with Senju, we are responsible for all costs associated with developing products covered by the licensed rights in ophthalmology for the U.S. and, with respect to bromfenac, bepotastine, prostaglandins and iganidipine, North America, including clinical trials, regulatory filings, manufacturing, and, if the product is approved, marketing and sales activities.
We have paid to Senju non-refundable milestone payments of $4 million, in the aggregate, relating to the development process and regulatory approval of both ISTALOL and XIBROM and are required to pay royalties on the sales of products that are covered by Senju’s patent rights.
We have paid to Senju non-refundable milestone payments of $4 million, in the aggregate, relating to the development process and regulatory approval of BEPREVE and are required to pay royalties on the sales for the products that are covered by Senju’s patent rights.
6
Table of Contents
We will be required to pay to Senju non-refundable milestone payments of up to $2 million, in the aggregate, if all such milestones relating to the development process and regulatory approval of ecabet sodium are accomplished, and royalties on future product sales covered by Senju’s patent rights.
We will be required to pay Senju non-refundable milestone payments of approximately $8 million, in the aggregate, if all such milestones relating to the development process and regulatory approval of iganidipine are accomplished, and royalties on future sales of products covered by Senju’s patent rights.
We will be required to pay Senju non-refundable milestone payments of approximately $8 million, in the aggregate, if all such milestones relating to the development process and regulatory approval of a prostaglandin product are accomplished, and royalties on future sales of products covered by Senju’s patent rights.
In April 2010, we commenced withholding royalty payments and initiated legal action against Senju seeking a declaratory judgment with regard to our royalty obligations to Senju in connection with bromfenac products and a recovery of overpaid XIBROM royalties and other damages. The only U.S. patent applicable to XIBROM and, now to BROMDAY, expired in January 2009 and, according to U.S. case law and the terms of our license agreement with Senju, we believe no bromfenac product royalties are due after patent expiration. In August 2010, the U.S. District Court for the Central District of California stayed our action against Senju, and, in September 2010, Senju initiated an arbitration proceeding regarding the same dispute with the International Chamber of Commerce, or the ICC. The order staying our action against Senju will not become appealable until after the arbitration is concluded and a judgment is entered in the court case. The arbitration proceeding, the outcome of which may also affect our BROMDAY royalty obligations, is ongoing.
In February 2012, the arbitration tribunal adjudicating the dispute with Senju issued a decision on three preliminary matters. The arbitration tribunal upheld its own jurisdiction and rejected a request by Senju for interim and conservatory financial and other measures. The decision also addressed aspects of the law applicable to the parties’ dispute, concluding that Japanese law governs the obligation to pay royalties except insofar as Japanese law requires the application of U.S. mandatory law to the performance of certain obligations in the contract. In particular, the decision stated that U.S. mandatory laws govern our obligation to pay royalties under the license, provided the facts of this case fall within the scope of U.S. mandatory law. We believe that U.S. mandatory law includes case law supporting our assertion that no bromfenac product royalties were due after the expiration of the bromfenac patent. In addition, the arbitration tribunal dismissed Senju’s request for an interim order permitting Senju to terminate the license or suspend our contractual rights as exclusive licensee, pending the resolution of the parties’ dispute. Following further submissions and evidence from the parties, the arbitration tribunal is expected to issue a final award. The timing of the issuance of a final award is unknown at this time.
In June 2010, we commenced withholding royalty payments and initiated a legal action by filing a Complaint against AcSentient, Inc. and AcSentient II, LLC, which we collectively refer to as AcSentient, seeking a declaratory judgment with regard to our bromfenac royalty obligations under the Asset Purchase Agreement dated May 3, 2002 between AcSentient and us. The only U.S. patent applicable to XIBROM and, now, to BROMDAY expired in January 2009 and, according to U.S. case law and the terms of our agreement with AcSentient, we believe no XIBROM and BROMDAY royalties are due after patent expiration. A declaratory judgment that we are seeking from the court in regard to royalty obligations to AcSentient may apply not only to XIBROM, but also to BROMDAY, which was approved by the FDA in October 2010. In November 2010, the Superior Court of the State of California, County of Orange stayed our case against AcSentient and ruled that the dispute had to be arbitrated. We will have an opportunity to appeal that court’s ruling after the final judgment is entered by the court. In January 2011, AcSentient filed a request for arbitration with the ICC. This arbitration is in its early stages.
There can be no assurance about when or how these two disputes will be resolved, and we cannot predict the final outcome or financial impact of either. The parties could elect to settle the dispute, allow the dispute to be resolved in arbitration or the U.S. courts or seek to exercise interim contractual rights including a purported termination by Senju prior to any determination in arbitration or the U.S. courts that would be challenged by ISTA. The range of outcomes could include continuation of the license with or without royalties, termination of the license with or without any assessment of costs or awards for withheld royalties or the negotiation of an amended license arrangement. Until these two disputes are resolved, for accounting purposes, we have been and intend to continue to reserve for BROMDAY and XIBROM royalties, which would have been payable to Senju and AcSentient if the relevant contractual royalty obligations were existing and enforceable. As of December 31, 2011, we had approximately $38.2 million reserved for such contingent XIBROM and BROMDAY royalties.
The relevant license provisions with Senju for bromfenac, iganidipine and prostaglandins provide that the relevant royalty obligations will terminate upon the later of (i) the last-to-expire licensed patent and (ii) ten years after the first commercial sale of the applicable licensed product. The license agreement with Senju for ISTALOL will terminate upon the last-to-expire licensed patent. The license agreements with Senju for ecabet sodium and BEPREVE will terminate ten years after the later of (i) the last-to-expire licensed patent and (ii) ten years after the first commercial sale of the applicable licensed product.
Bepotastine Nasal Agreement with Mitsubishi Tanabe
In September 2007, we entered into a license agreement with Mitsubishi Tanabe under which we were granted exclusive North American rights to nasal dosage forms of bepotastine, an investigational product for the treatment of allergic rhinitis. We also obtained the right to develop other nasal bepotastine products, including a fixed combination with a steroid and a future right to negotiate for a North American license to oral dosage forms of bepotastine for allergy treatment.
7
Table of Contents
Generally, under the terms of our agreement with Mitsubishi Tanabe, we are responsible for all costs associated with developing the licensed products in ophthalmology for the U.S. and, with respect to bepotastine nasal, North America, including clinical trials, regulatory filings, manufacturing, and, if the product is approved, marketing and sales activities.
Under the terms of our bepotastine nasal agreement with Mitsubishi Tanabe, we are required to pay Mitsubishi Tanabe non-refundable milestone payments of approximately $12 million, if all such milestones relating to the development process and regulatory approval of bepotastine nasal are accomplished, and royalties on future product sales.
The license agreement with Mitsubishi Tanabe for bepotastine nasal will terminate upon the later of (i) the last-to-expire licensed patent and (ii) ten years after the first commercial sale of the applicable licensed product.
Japan- Otsuka
In December 2001, we entered into certain agreements with Otsuka Pharmaceutical Co., Ltd., or Otsuka, with respect to the commercialization of VITRASE in Japan for ophthalmic uses in the posterior region of the eye. Under the terms of our agreements with Otsuka, Otsuka is responsible for preclinical studies, clinical trials, applying for and obtaining regulatory approvals and other development activities for VITRASE for ophthalmic uses in the posterior region of the eye in Japan.
In September 2009, we modified our existing license and supply agreements with Otsuka. Among other changes, the supply agreement terminated, resulting in us having no future obligation to supply Otsuka with hyaluronidase for injection. As a result, in 2009, we recognized $3.1 million of previously deferred income primarily related to the termination of such supply agreement.
Marketing and Sales
We have a commercial infrastructure in connection with the marketing, sale and distribution of our approved products in the U.S. As of December 31, 2011, we had 166 sales territories to support our growing commercial activities. We target our commercialization efforts towards ophthalmologists, optometrists and allergists, depending on the product.
InVentiv Pharma Services LLC provides us with administrative and other services, including training, analytics, and operational support.
Customers and Distribution
We sell our approved products primarily to drug wholesalers, retailers and distributors, including large chain drug stores, hospitals, clinics, government agencies and managed healthcare providers such as health maintenance organizations and other institutions. These customers comprise a significant part of the distribution network for pharmaceutical products in the U.S. This distribution network is continuing to undergo significant consolidation marked by mergers and acquisitions among wholesale distributors and the growth of large retail drug store chains. As a result, a small number of large, wholesale distributors control a significant share of the market, and the number of independent drug stores and small drug store chains has decreased. We expect that consolidation of drug wholesalers and retailers will, on an increasing basis, impact the net sales and gross margins of drug manufacturers and will create other competitive pressures.
Sales to Cardinal Health, Inc., McKesson HBOC and AmeriSource Bergen Corp. accounted for 39%, 37% and 18%, respectively, of our net revenues for the year ended December 31, 2011. The loss of any of these customers could materially and adversely affect our business, results of operations, financial condition and cash flows. Due to the relatively short lead-time required to fill orders for our products, backlog of orders is not material to our business.
We have engaged Cardinal Health PTS, LLC, or Cardinal Health, through its Specialty Pharmaceutical Services group, to act as our exclusive distributor for commercial shipment and distribution of our products to our customers in the U.S. In addition to distribution services, Cardinal Health provides us with other related services, including product storage, returns, customer support, and administrative support.
Seasonality
We experience seasonality with respect to sales of our ocular allergy product, BEPREVE. We expect larger sales in the spring through late summer and fewer sales in the late fall and winter.
In addition, although our ophthalmic pharmaceutical business is not materially affected by seasonal factors, we have noticed a historical trend with respect to sales. Specifically, our sales have tended to be lowest during the first calendar quarter and the highest in the fourth calendar quarter.
8
Table of Contents
Competition
The markets for therapies that treat diseases and conditions of the eye are subject to intense competition and technological change. Many companies, including major pharmaceutical companies, specialty pharmaceutical companies and specialized biotechnology companies, are engaged in activities similar to ours. Such companies include Allergan, Inc., Alcon Laboratories, Inc./ Novartis AG, Bausch & Lomb, Inc., Johnson & Johnson Merck & Co., Inc. and Pfizer, Inc. Many of these companies have substantially greater financial and other resources, larger research and development staffs and more extensive marketing and manufacturing organizations than ours.
Numerous companies are working on alternate therapies for ocular inflammation and pain, glaucoma, allergy, dry eye syndrome, ocular infection, macular degeneration and other disease states of the eye.
In addition, competition from generic drug manufacturers is a major challenge in the U.S. to branded drug companies, like us, and may have a material adverse effect on the net revenues of our products.
In January 2009, the patent on XIBROM expired, exposing us to potential future generic competition. In May 2011, the FDA approved a generic version of twice-daily bromfenac ophthalmic solution 0.09%, which is substitutable for XIBROM. While we believe that there is only one Abbreviated New Drug Application, or ANDA, approved, there could be additional ANDAs approved or approvable for XIBROM and that could expose us to additional future generic competition. Also, while BROMDAY has exclusivity under the Hatch-Waxman Act until October 2013, ANDAs could be filed as a substitutable generic product for our BROMDAY, obtain tentative approval; however, such product would not be able to be launched prior to expiration of the exclusivity period.
In May 2011, we filed a Complaint in the United States District Court for the District of Columbia alleging that the FDA’s approval of a generic version of XIBROM was arbitrary, capricious, and contrary to law. We also filed papers seeking injunctive relief with respect to the FDA’s approval of a generic version of XIBROM and relief from denial of our Citizens Petition, or 2011 CP, requesting that the FDA refrain from granting tentative or final approval of any abbreviated new drug application for XIBROM that utilizes the labeling for discontinued XIBROM or omits any portion of the BROMDAY label relating to the once-per-day dosing. Although our request for a temporary injunction was denied by the court in May 2011, our subsequent motion for summary judgment seeking revocation of the approval of the generic bromfenac product, as well as the FDA’s counter-motion for summary judgment, have been fully briefed before the court.
Manufacturing
We have a supply agreement with Senju for bepotastine besilate, which is the active pharmaceutical ingredient in BEPREVE. Currently, Senju is our sole source for bepotastine besilate for BEPREVE. We have a supply agreement with Regis Technologies, Inc., or Regis, for bromfenac, which is the active pharmaceutical ingredient in BROMDAY and was also used for XIBROM. Currently, Regis is our sole source for bromfenac. We also have supply agreements with Bausch & Lomb, Inc., or Bausch & Lomb, to manufacture commercial quantities of BROMDAY, BEPREVE and ISTALOL. Currently, Bausch & Lomb is our sole source for BROMDAY, BEPREVE and ISTALOL.
Ovine hyaluronidase, the active pharmaceutical ingredient used in VITRASE, is processed in several stages to produce a highly purified raw material for formulation. In 2010, we received approval from the FDA to manufacture hyaluronidase at our Irvine, California manufacturing facility and began production of highly purified ovine hyaluronidase. We have a supply agreement with Alliance Medical Products to manufacture commercial quantities of VITRASE. Currently, Alliance Medical Products is our sole source for VITRASE.
Research and Development
Since our inception, we have made substantial investments in research and development. During the years ended December 31, 2011, 2010 and 2009, we spent $31.6 million, $25.9 million and $24.9 million, respectively, on research and development activities.
We plan to focus our near-term research and development efforts on the later-stage products in our product candidate pipeline. Building on these development efforts, our goal is to continue our growth as a commercial stage, multi-specialty pharmaceutical company by developing or acquiring complementary products, either already marketed or in late-stage development. Some licensed or acquired products may require additional research and development activities prior to regulatory approval and commercialization.
Patents and Proprietary Rights
Our success depends in part on our ability to obtain patent protection for our inventions, to preserve our trade secrets and to operate without infringing the proprietary rights of third parties. Our strategy is to actively pursue patent protection in the U.S. and foreign jurisdictions for technology that we believe to be proprietary and that offers a potential competitive advantage. As of December 31, 2011, we owned eight issued U.S. patents, seven pending U.S. patent applications, 22 issued foreign patents, and four pending foreign patent applications. In addition, as of December 31, 2011, we licensed six issued U.S. patents, four pending U.S. patent applications, one issued foreign patent, and one pending foreign patent application.
9
Table of Contents
The table below sets forth, for each of our material products or product candidates covered by a patent, the technology or technologies dependent on each such patent, the jurisdiction where such patent protection has been obtained, the expiration date of such patent, and whether we own or license such patent.
| Product or Product Candidate Subject to Patent Protection |
Technology |
Jurisdiction |
Expiration |
Owned or Licensed Patent | ||||
| BEPREVE |
Bepotastine active ingredient | U.S. | 2017 (1) | Licensed | ||||
| BEPREVE |
Formulation | U.S. | patent application | Licensed | ||||
| ISTALOL |
Method of use | U.S. | 2018 | Licensed | ||||
| PROLENSA |
Formulation and method of use | U.S. | patent applications (2) | Owned and licensed | ||||
| BEPOMAX |
Formulation and method of use | U.S. | patent applications | Owned and licensed | ||||
| BEPOSONE |
Formulation and method of use | U.S. | patent applications | Owned and licensed | ||||
| T-PRED |
Formulation and method of use | U.S. and Canada | patent application | Owned and licensed | ||||
| (1) | With a patent term extension expected until 2019. |
| (2) | One patent application was allowed in 2011, with patent issuance anticipated in the first half of 2012. |
In addition to patents, we rely on trade secrets and proprietary know-how. We seek protection of these trade secrets and proprietary know-how, in part, through confidentiality and proprietary information agreements. We make efforts to require our employees, directors, consultants and advisors, outside scientific collaborators and sponsored researchers, other advisors and other individuals and entities to execute confidentiality agreements upon the start of employment, consulting or other contractual relationships with us. These agreements provide that all confidential information developed or made known to the individual or entity during the course of the relationship is to be kept confidential and not be disclosed to third parties, except in specific circumstances. In the case of employees and some other parties, the agreements provide that all inventions conceived by the individual will be our exclusive property. These agreements may not provide meaningful protection for, or adequate remedies to protect, our technology in the event of unauthorized use or disclosure of information. Furthermore, our trade secrets may otherwise become known to, or be independently developed by, our competitors.
We have not conducted an extensive search of patents issued to other parties and no assurance can be given that such patents do not exist, have not been filed, or could not be issued which contain claims relating to our technology and products. If such patents do exist, the owners may bring claims against us for infringement, which may have an adverse effect on our business.
We also file trademark applications to protect the names of our products. These applications may not mature to registration and may be challenged by third parties. In addition, some of our trademarks, are owned by, or assignable to, our licensors, such as Senju, and upon expiration or termination of the license agreements, we may no longer be able to use these trademarks.
Government Regulation
Our pharmaceutical products are subject to extensive government regulation in the U.S. If we ever decide to distribute our products abroad, our products would also be subject to extensive foreign government regulation. In the U.S., the FDA regulates pharmaceutical products. FDA regulations govern the testing, manufacturing, advertising, promotion, labeling, sale and distribution of our products.
In general, the FDA approval process for drugs includes, without limitation:
| • | preclinical studies; |
| • | submission of an IND application for clinical trials; |
| • | adequate and well-controlled human clinical trials to establish the safety and efficacy of the product; |
| • | submission of an NDA to obtain marketing approval; |
| • | review of the NDA; and |
| • | inspection of the facilities used in the manufacturing of the drug to assess compliance with the FDA’s current Good Manufacturing Practice, or cGMP, regulations. |
10
Table of Contents
Preclinical studies include laboratory evaluation of the product, as well as animal studies to assess the potential safety and efficacy of the product. These studies must be performed according to good laboratory practices. The results of the preclinical studies, together with manufacturing information and analytical data, are submitted to the FDA as part of the IND application. Clinical trials may begin 30 days after the IND application is received, unless the FDA raises concerns or questions about the conduct of the clinical trials. If concerns or questions are raised, the IND application sponsor and the FDA must resolve any outstanding concerns before clinical trials can proceed.
We cannot assure that submission of an IND application for any of our product candidates will result in authorization to commence clinical trials. Clinical trials involve the administration of the product that is the subject of the trial to volunteers or patients under the supervision of a qualified principal investigator. Each clinical trial must be reviewed and approved by an independent institutional review board at each institution at which the study will be conducted. The institutional review board will consider, among other things, ethical factors, safety of human subjects and the possible liability of the institution. Also, clinical trials must be performed according to good clinical practices. Good clinical practices are enumerated in FDA regulations and guidance documents.
Clinical trials typically are conducted in three sequential phases: Phases 1, 2 and 3, with Phase 4 studies sometimes required to be conducted after approval. Drugs for which Phase 4 studies are required include those approved under accelerated approval regulations. The four phases may overlap. In Phase 1 clinical trials, the drug is usually tested on a small number of healthy volunteers to determine:
| • | safety; |
| • | any adverse effects; |
| • | proper dosage; |
| • | absorption; |
| • | metabolism; |
| • | distribution; |
| • | excretion; and |
| • | other drug effects. |
In Phase 2 clinical trials, the drug is usually tested on a limited number of subjects (generally up to several hundred subjects) to preliminarily evaluate the efficacy of the drug for specific, targeted indications, determine dosage tolerance and optimal dosage, and identify possible adverse effects and safety risks.
In Phase 3 clinical trials, the drug is usually tested on a larger number of subjects (up to several thousand), in an expanded patient population and at multiple clinical sites. The FDA may require that we suspend clinical trials at any time on various grounds, including if the FDA makes a finding that the subjects are being exposed to an unacceptable health risk.
Following successful conclusion of Phase 3 clinical trials, an NDA is submitted to the FDA. The NDA must include comprehensive and complete descriptions of the preclinical testing, clinical trials, and the chemical manufacturing and control requirements of a drug that enable the FDA to determine the drug’s safety and efficacy. An NDA must be approved by the FDA before any drugs can be marketed commercially in the U.S.
The FDA testing and approval process requires substantial time, effort and money. We cannot assure you that any NDA we submit for our product candidate will be timely approved, if ever.
In Phase 4 clinical trials or other post-approval commitments, additional studies and patient follow-up are conducted to gain experience from the treatment of patients in the intended therapeutic indication. Additional studies and follow-up are also conducted to document a clinical benefit where drugs are approved under accelerated approval regulations and based on surrogate endpoints. In clinical trials, surrogate endpoints are alternative measurements of the symptoms of a disease or condition that are substituted for measurements of observable clinical symptoms. Failure to promptly conduct Phase 4 clinical trials and follow-up could result in expedited withdrawal of products approved under accelerated approval regulations.
The facilities, procedures, and operations of our contract manufacturers must be determined to be adequate by the FDA before product approval. Manufacturing facilities are subject to inspections by the FDA for compliance with cGMP, licensing specifications, and other FDA regulations before and after an NDA has been approved. Foreign manufacturing facilities are also subject to periodic FDA inspections or inspections by foreign regulatory authorities. Among other things, the FDA may withhold approval of NDAs or other product applications of a facility if deficiencies are found at the facility. Vendors that supply us finished products or components used to manufacture, package and label products are subject to similar regulation and periodic inspections.
11
Table of Contents
Following such inspections, the FDA may issue notices on Form 483 and Warning Letters that could cause us to modify certain activities identified during the inspection. A Form 483 notice is generally issued at the conclusion of an FDA inspection and lists conditions the FDA investigators believe may violate cGMP or other FDA regulations. FDA guidelines specify that a Warning Letter be issued only for violations of “regulatory significance” for which the failure to adequately and promptly achieve correction may be expected to result in an enforcement action.
In addition, the FDA imposes a number of complex regulatory requirements on entities that advertise and promote pharmaceuticals, including, but not limited to, standards and regulations for direct-to-consumer advertising, off-label promotion, industry-sponsored scientific and educational activities, and promotional activities involving the Internet.
Failure to comply with FDA and governmental regulations can result in fines, unanticipated compliance expenditures, recall or seizure of products, total or partial suspension of production and/or distribution, suspension of the FDA’s review of NDAs, injunctions, disqualification from participation in government reimbursement programs and criminal prosecution. Any of these actions could have a material adverse effect on us. For clinical trials conducted outside the U.S., the clinical stages are generally comparable to the phases of clinical development established by the FDA.
In the U.S., physicians, hospitals and other healthcare providers that purchase pharmaceutical products generally rely on third-party payors, principally private health insurance plans, Medicare and, to a lesser extent, Medicaid, to reimburse all or part of the cost of the product and procedure for which the product is being used. Even if a product is approved for marketing by the FDA, there is no assurance that third-party payors will cover the cost of the product and related medical procedures. Although they are not required to do so, private health insurers often follow the Medicare program’s lead when determining whether or not to reimburse for a drug. To support our applications for reimbursement coverage with Medicare and other major third-party payors, we intend to use data from clinical trials. The lack of satisfactory reimbursement for our drug products would limit their widespread use and lower potential net revenues from our products.
Our interactions with physicians and other healthcare professional are subject to both federal and state law and regulation designed to prohibit companies from wrongfully inducing physicians and others from prescribing and using our products. We have adopted a comprehensive compliance program to regulate our personnel’s interactions with physicians and others, to attempt to comply with these regulations.
Federal, state and local laws of general applicability, such as laws regulating working conditions, also govern us. In addition, we are subject to various federal, state and local environmental protection laws and regulations, including those governing the discharge of material into the environment. We do not expect the costs of complying with such environmental provisions to have a material effect on our earnings, cash requirements or competitive position in the foreseeable future.
Human Resources
As of January 31, 2012, we had 330 full-time employees. Of our employees, 54 are engaged in research and development, 10 in manufacturing, 19 in quality assurance and quality control, 212 in sales and marketing, and 35 in administration and finance. Our employees do not have a collective bargaining agreement. We consider our relations with our employees to be good.
General Information
We incorporated in California in February 1992 as Advanced Corneal Systems, Inc. In March 2000, we changed our name to ISTA Pharmaceuticals, Inc., and we reincorporated in Delaware in August 2000. Our corporate headquarters and principal research laboratories are located at 50 Technology Drive, Irvine, CA 92618, and our telephone number is (949) 788-6000.
We make the following reports available on our website, at www.istavision.com, free of charge as soon as practicable after filing with the U.S. Securities and Exchange Commission, or SEC:
| • | our annual reports on Form 10-K, quarterly reports on Form 10-Q, current reports on Form 8-K and amendments to these reports; |
| • | our policies related to corporate governance, including our Code of Ethics and Conduct which apply to our directors, officers and employees (including our principal executive officer and principal financial officer) that we have adopted to meet the requirements set forth in the rules and regulations of the SEC and its corporate governance principles; and |
| • | the charters of the Audit, Compensation and Nominating & Corporate Governance Committees of our Board of Directors. |
12
Table of Contents
All such reports are also available free of charge via EDGAR through the SEC website at www.sec.gov. In addition, the public may read and copy materials filed by us with the SEC at the SEC’s public reference room located at 100 F St., NE, Washington, D.C., 20549. Information regarding operation of the SEC’s public reference room can be obtained by calling the SEC at 1-800-SEC-0330.
| Item 1A | Risk Factors |
The pharmaceutical industry is a fast-paced, highly competitive environment with many factors that influence the ability of a company to successfully commercialize a product. Many of these factors are beyond our control and are, therefore, difficult to predict. In addition to other information included in this Annual Report on Form 10-K, the following factors, among others, could cause actual results to differ materially from those contained in forward-looking statements contained in this Annual Report on Form 10-K, and thus should be considered carefully in evaluating our business and future prospects. The following risk factors are not an exhaustive list of the risks associated with our business. New factors may emerge or changes to these risks could occur that could materially affect our business. These risks, along with others, may have the potential to materially and adversely affect our business, financial position, results of operations and prospects.
Risks Related to Our Business
If we do not timely receive and maintain regulatory approvals for our products or product candidates, we will not be able to commercialize our products, which would substantially impair our ability to generate revenues and materially harm our business, results of operations and financial condition.
Approval from the FDA is necessary to manufacture and market pharmaceutical products in the U.S. All of our currently marketed products; BROMDAY, BEPREVE, ISTALOL and VITRASE have received regulatory approval from the FDA.
The regulatory approval process is extensive, time-consuming and costly, and the FDA may not approve additional product candidates, or the timing of any such approval may not be appropriate for our product launch schedule and other business priorities, which are subject to change.
FDA approval of our products and product candidates can be delayed, limited or not granted for many reasons, including, among others:
| • | the FDA may not find a product candidate safe or effective to merit an approval; |
| • | the FDA may not find that the data from preclinical testing and clinical trials justifies approval, or they may require additional studies that would make it commercially unattractive to continue pursuit of approval; |
| • | the FDA may not approve the processes or facilities of our contract manufacturers or raw material suppliers or our manufacturing processes or facilities; |
| • | the FDA may change its approval policies or adopt new regulations; and |
| • | the FDA may approve a product candidate for indications with labeling claims that are narrow or that place our product at a competitive disadvantage, which may limit our sales and marketing activities or otherwise adversely impact the commercial potential of a product. |
If the FDA does not approve our product candidates in a timely fashion with suitable labeling claims, or we terminate development of any of our product candidates due to difficulties or delays encountered in clinical testing and the regulatory approval process, it may have a material adverse impact on our business, results of operations and financial condition.
We may not be able to develop product candidates into successful commercial products, which would impair our ability to grow and could materially harm our business, results of operations and financial condition.
The process of developing product candidates involves a high degree of risk and takes several years. Product candidates may fail to reach the market for several reasons, including but not limited to the following:
| • | clinical trials may show our product candidates to be ineffective or not as effective as anticipated, or to have harmful side effects or an unforeseen result; |
| • | our inability to enroll patients in clinical trials within the expected timeframes; |
| • | our inability to obtain authorization from the FDA or other regulatory authority to initiate clinical trials within the expected timeframes; |
| • | product candidates may fail to receive regulatory approvals required to bring the products to the market; |
13
Table of Contents
| • | manufacturing costs and delays and manufacturing problems in general, the inability to scale up to produce supplies for clinical trials or commercial supplies, or other factors may make our product candidates uneconomical; and |
| • | the proprietary rights of others and their competing products and technologies may prevent our product candidates from being effectively commercialized or to obtain exclusivity. |
Success in the preclinical and early clinical trials does not ensure that large-scale clinical trials will be successful. Clinical results are frequently susceptible to varying interpretations that may delay, limit or prevent regulatory approvals. The length of time necessary to complete clinical trials and to submit an application for marketing approval for a final decision by a regulatory authority varies significantly and may be difficult to predict. Currently, there is substantial congressional and administration review of the regulatory approval process for drug candidates in the U.S. Any changes to the U.S. regulatory approval process could significantly increase the timing or cost of regulatory approval for our product candidates making further development uneconomical or impossible.
In addition, developing product candidates is very expensive and will have a significant impact on our ability to generate profits. Factors affecting our product development expenses include:
| • | changes to the regulatory approval process for product candidates in those jurisdictions, including the U.S., in which we may be seeking approval for our product candidates; |
| • | the cost and timing of manufacturing clinical or commercial supplies of product candidates, including the cost and timing of the implementation of any necessary corrective actions; |
| • | regulatory approval of trade names for our product candidates and the timing thereof; |
| • | our ability to raise any additional funds that we need to complete our trials; |
| • | the number and outcome of clinical trials conducted by us and/or our collaborators; |
| • | the number of products we may have in clinical development; |
| • | in-licensing or other partnership activities, including the timing and amount of related development funding, license fees or milestone payments; and |
| • | future levels of our revenue. |
Our product development efforts also could result in large and immediate write-offs, significant milestone payments, incurrence of debt and contingent liabilities or amortization of expenses related to intangible assets, any of which could negatively impact our financial results. Additionally, if we are unable to develop our product candidates into viable commercial products, we will be reliant solely on sales of our currently approved products for our revenues, potentially limiting our growth opportunities.
If generic manufacturers obtain approval for generic versions of our products, our business, results of operations and financial condition may suffer.
All products that are approved under the provisions of the U.S. Food, Drug and Cosmetic Act render them susceptible to potential competition from generic manufacturers through the ANDA procedure. All of our marketed products have patent protection or Hatch-Waxman Act protection. Generic manufacturers pursuing ANDA approval are not required to conduct costly and time-consuming clinical trials to establish the safety and efficacy of their products; rather, they are permitted to rely on the innovator’s data regarding safety and efficacy. Thus, generic manufacturers can sell their products at prices much lower than those charged by the innovative pharmaceutical companies who have incurred substantial expenses associated with the research and development of the drug product.
In January 2009, the patent on XIBROM expired, and we lost regulatory exclusivity for XIBROM. In May 2011, the FDA approved a generic version of twice-daily bromfenac ophthalmic solution 0.09%, which is substitutable for XIBROM. While we believe that there is only one ANDA approved, there could be additional ANDAs approved or approvable for twice-daily XIBROM and that could expose us to additional future generic competition.
In October 2010, the FDA approved BROMDAY for the treatment of postoperative inflammation and reduction of ocular pain in patients who have undergone cataract extractions. We were granted three years of marketing exclusivity under the Hatch-Waxman Act. We launched BROMDAY in November 2010, and we focused our sales and marketing efforts on encouraging physicians to transition from prescribing twice-daily XIBROM to prescribing once-daily BROMDAY. In February 2011, we discontinued shipping XIBROM.
Also, while BROMDAY has exclusivity under the Hatch-Waxman Act until October 2013, ANDAs could be filed as a substitutable generic product for BROMDAY and obtain tentative approval; however, such product would not be able to be launched prior to expiration of the exclusivity period. The introduction of generic version(s) of BROMDAY and / or XIBROM could have an adverse impact on our business, results of operations and financial condition.
14
Table of Contents
If our products do not gain market acceptance, our business will suffer.
A number of factors may affect the market acceptance of our products or any other products we develop or acquire, including, among others:
| • | the price of our products relative to other therapies for the same or similar treatments; |
| • | the perception by patients, physicians and other members of the health care community of the safety and efficacy of our products for their prescribed treatments; |
| • | the availability of satisfactory levels, or at all, of third party reimbursement for our products and related treatments; |
| • | the restrictiveness of FDA approved labeling of our products; |
| • | our ability to fund our sales and marketing efforts; and |
| • | the effectiveness of our sales and marketing efforts. |
In addition, we have historically focused our sales and marketing efforts on specialty physicians. However, in the future, in order to achieve broader market acceptance of our products, we may choose to modify our focus to include primary care physicians and pediatricians, which will require us to implement changes to our commercialization strategy.
If our products do not gain market acceptance, we may not be able to fund future operations, including the development or acquisition of new product candidates and/or our sales and marketing efforts for our approved products, which would cause our business to suffer.
If we fail to properly manage our anticipated growth, our business could suffer.
Rapid growth of our business is likely to place a significant strain on our managerial, operational and financial resources and systems. To manage our anticipated growth successfully, we must attract and retain qualified personnel and manage and train them effectively. We are dependent on our personnel and third parties to effectively manufacture, market, sell and distribute our products. We will also continue to depend on our personnel and third parties to successfully develop and acquire new products. Further, our anticipated growth will place additional strain on our suppliers and manufacturers, resulting in an increased need for us to carefully manage these relationships and monitor for quality assurance. If we do not grow as we expect, if we fail to manage our growth effectively or if we do not develop and expand a successful commercial infrastructure, our business, results of operations, and financial condition could be materially harmed.
We may need to raise additional capital in the future.
We believe our current cash and cash equivalents on hand, together with borrowings available under our revolving credit facility with Silicon Valley Bank, or Revolving Credit Facility, and other borrowing arrangements, will be sufficient to finance anticipated capital, financing and operating requirements for at least the next twelve months. Our Revolving Credit Facility with Silicon Valley Bank expires in March 2012. If we are unable to generate sufficient product net revenues, or if we are unable to renew our Revolving Credit Facility, we may be required to raise additional capital in the future through collaborative agreements or public or private equity or debt financings. In May 2011, we filed a universal shelf registration statement on Form S-3 with the SEC. The registration statement has been declared effective by the SEC, and we will be able to offer and sell up to $150 million of any form of securities including, but not limited to, equity, debt and other securities as described in the registration statement. Our intent with respect to the registration statement is to provide us with flexibility for financing future growth through acquisitions and strategic transactions, and does not reflect a change in our financing strategy. At present, we have no specific plans to issue any form of securities under the registration statement.
If we are required to raise additional capital in the future, such additional financing may not be available on favorable terms, or available at all, or may be dilutive to our existing stockholders. In addition, we have a facility agreement, or the Facility Agreement, with certain institutional accredited investors, which we refer to as the Lenders. The Facility Agreement and our Revolving Credit Facility contain restrictions on our ability to incur certain indebtedness without the prior consent of our lenders. If we fail to obtain additional capital as and when required, such failure could have a material impact on our business, results of operations and financial condition.
15
Table of Contents
Adverse economic conditions may have material adverse consequences on our business, results of operations and financial condition.
Unpredictable and unstable changes in economic conditions, including recession, inflation, increased government intervention, or other changes, may adversely affect our general business strategy. If the current equity and credit markets deteriorate, or do not continue to improve, it may make any necessary debt or equity financing more difficult, more costly, and more dilutive. While we believe we have adequate capital resources to meet current working capital and capital expenditure requirements, a radical economic downturn, or an increase in our expenses could require additional financing on less than attractive rates or on terms that are excessively dilutive to existing stockholders. Failure to secure any necessary financing in a timely manner and on favorable terms could have a material adverse effect on our growth strategy, financial performance and stock price and could require us to delay or abandon clinical development plans or plans to acquire additional products.
These economic conditions not only limit our access to capital, but also make it difficult for our customers and us to accurately forecast and plan future business activities, and they could cause businesses to slow spending on our products and services, which would delay and lengthen sales cycles. Furthermore, during challenging economic times, our customers may face issues gaining timely access to sufficient credit, which could result in an impairment of their ability to make timely payments to us. In addition, the recent economic crisis could also adversely impact our suppliers’ ability to provide us with materials and components, either of which may negatively impact our business, financial condition and results of operations.
If we are required to immediately repay our outstanding borrowings, our financial position could be negatively impacted.
Outstanding amounts under our Revolving Credit Facility bear interest at variable rates, which may expose us to interest rate risk. If interest rates increase, our debt service obligations on the variable rate indebtedness would increase and our income and cash flows would decrease. The loan and security agreement related to the Revolving Credit Facility also contains certain covenants based on our financial performance. If we violate any of these financial performance covenants, or are otherwise in default, our lender has the option to declare all outstanding borrowings immediately due and payable, which could also cause a default under our Facility Agreement, thereby allowing the Lenders under our Facility Agreement to accelerate the payment of the amounts outstanding thereunder. In that event, we may not have sufficient resources to pay the outstanding amounts and would need to obtain additional financing, which may not be available on reasonable terms or at all. One of the covenants contained in the Revolving Credit Facility relates to the ratio of adjusted current assets to current liabilities During the fourth quarter of 2011, we failed to meet this covenant, but we obtained a waiver of the covenant from Silicon Valley Bank.
If we fail to fulfill any of the covenants in the future, we may not be able to cure the default or obtain a similar waiver and which could have a material impact on our business, results of operations and financial condition.
Our partners may terminate, or fail to perform their duties under our agreements, in which case our ability to commercialize our products may be significantly impaired.
We have entered into licensing agreements with Senju relating to BROMDAY and XIBROM, BEPREVE, ecabet sodium, iganidipine, and certain prostaglandin compounds, including latanoprost. With respect to BROMDAY and XIBROM, BEPREVE, ecabet sodium and iganidipine, certain patent and other intellectual property rights we have received from Senju have been licensed to Senju from third parties. As a result, Senju’s license of such rights to us is subject to Senju maintaining and performing its obligations under these third party license agreements.
As described in Item 3: Legal Proceedings, we are currently in arbitration with Senju regarding our royalty obligations under our license agreement with respect to BROMDAY and XIBROM. There can be no assurance about when or how these two disputes will be resolved, and we cannot predict the final outcome or financial impact of either. The parties could elect to settle the dispute, allow the dispute to be resolved in arbitration or the U.S. courts or seek to exercise interim contractual rights including a purported termination by Senju prior to any determination in arbitration or the U.S. courts that would be challenged by ISTA. The range of outcomes could include continuation of the license with or without royalties, termination of the license with or without any assessment of costs or awards for withheld royalties or the negotiation of an amended license arrangement. In the event that Senju successfully terminates that license agreement, our ability to continue our development and/or commercialization of bromfenac products for which Senju has licensed us rights would be significantly impaired. We have also entered into an exclusive licensing agreement with Mitsubishi Tanabe, from whom we obtained the North American rights to nasal (including intranasal) dosage forms of bepotastine. Certain intellectual property rights we received from Mitsubishi Tanabe have been licensed to Mitsubishi Tanabe from a third party, and thus Mitsubishi Tanabe’s license of such rights to us is subject to Mitsubishi Tanabe maintaining and performing its obligations under such third party license agreement.
Any failure by Senju or Mitsubishi Tanabe to perform their respective obligations under their license agreements with third parties, or any adverse modification or termination of these third party license agreements, could significantly impair our ability to continue or stop our development and/or commercialization of any product candidates or products for which Senju or Mitsubishi Tanabe has licensed us rights subject to these third party agreements. Our agreements with Senju and Mitsubishi Tanabe generally contain reciprocal terms providing that neither we nor they may develop products that directly compete in the same form with the products involved in the agreement. Nonetheless, our partners may develop competing products in different forms or products that compete indirectly with our products.
16
Table of Contents
Our supply of drug products will be dependent upon our limited manufacturing capacities and the production capabilities of third party manufacturers, contract manufacturing organizations, or CMOs, and other suppliers, and if such parties are not able to meet our demands, we may be limited in our ability to meet demand for our products, ensure regulatory compliance or maximize profit on the sale of our products.
We have limited manufacturing capacity for the raw material of one of our drug products and no internal manufacturing capacity for our drug products, and, therefore, we have entered into agreements with third-party manufacturers, CMOs and other suppliers for the manufacture and supply of our products and for their active and other ingredients. Reliance on these manufacturing capabilities and those of such third-party manufacturers, CMOs and other suppliers entails risks to which we would not be subject if we manufactured products ourselves. For the raw material that we manufacture, we are subject to compliance with the regulations promulgated by the FDA and other agencies, including but not limited to the FDA’s cGMP requirements. If we do not or cannot maintain control over compliance with these regulations, it could have a negative impact on our business. The disqualification of these manufacturers, CMOs and other suppliers through their failure to comply with regulatory requirements could negatively impact our business because the delays and costs in obtaining and qualifying alternate suppliers (if such alternative suppliers are available, which they may not be) could delay clinical trials or otherwise inhibit our ability to bring our approved products to market, which could have an adverse effect on our business, results of operations and financial condition.
In addition, we have little or no control over the production processes of third-party manufacturers, CMOs or other suppliers. Accordingly, while we do not currently anticipate any shortages of supply, circumstances could arise in which we would not have adequate supplies to timely meet our requirements or market demand for a particular drug product could outstrip the ability of our supply source to timely manufacture and deliver the product, thereby causing us to lose sales. In addition, our ability to make a profit on the sale of our products depends on our ability to obtain price arrangements that ensure a supply of product at favorable prices.
If we are unable to obtain materials from our sole source suppliers in a timely manner or our sole source suppliers do not meet their commitments, our product development and commercialization efforts for our product candidates could be delayed or stopped.
Some materials used in our products are currently obtained from a single source. We have a supply agreement with Senju for bepotastine besilate, which is the active pharmaceutical ingredient in BEPREVE. Currently, Senju is our sole source for bepotastine besilate. The active ingredient for BROMDAY is also supplied to us under an exclusive agreement from a sole source. We also have supply agreements with Bausch & Lomb to manufacture commercial quantities of BROMDAY, BEPREVE and ISTALOL. Currently, Bausch & Lomb is our sole source for such products. We have a supply agreement with Alliance Medical Products, Inc. to manufacture commercial quantities of VITRASE. Currently, Alliance Medical Products, Inc. is our sole source for VITRASE.
We have not established and may not be able to establish arrangements with additional suppliers for certain of these ingredients or products. Difficulties in our relationships with our suppliers, or delays or interruptions in such suppliers’ supply of our requirements could limit or stop our ability to provide sufficient quantities of our product candidates on a timely basis for clinical trials and, for our approved products, could limit or stop commercial sales, which would have a material adverse effect on our business, results of operations and financial condition. In addition, our ability to make a profit on the sale of our products depends on our ability to obtain price arrangements that ensure a supply of product at favorable prices.
If actual future payments or credits for allowances, discounts, product returns, rebates, chargebacks and other discounts, such as wholesaler fees, materially exceed the estimates we made at the time of the sale of our products, our financial position, results of operations and cash flows may be materially and negatively impacted.
We recognize revenues from product sales when there is persuasive evidence that an arrangement exists, when title has passed, the price is fixed or determinable, and we are reasonably assured of collecting the resulting receivable. We recognize product revenues net of estimated allowances for discounts, product returns, rebates, chargebacks and other discounts, such as wholesaler fees. If actual future payments for allowances for discounts, product returns, wholesaler fees, rebates and chargebacks materially exceed the estimates we made at the time of sale, our business, results of operations and financial condition would be negatively impacted.
In general, we are obligated to accept from our customers the return of pharmaceutical products that have reached their expiration date. We authorize returns for damaged products, expiring and expired products in accordance with our return goods policy and procedures, and have established reserves for such amounts at the time of sale. We typically refund the agreed portion of the sales price by the issuance of a credit, rather than cash refund or exchanges for inventory, and the returned product is destroyed. With the launch of each of our products, we record a sales return allowance, which was larger for stocking orders than subsequent re-orders. To date, actual product returns have not exceeded our estimated allowances for returns. Although we believe that our estimates and assumptions are reasonable as of the date when made, actual results may differ significantly from these estimates. Our business, results of operations and financial condition may be materially and negatively impacted if actual returns materially exceed our estimated allowances for returns.
17
Table of Contents
Customers typically process their claim for allowances such as early pay discounts promptly, usually within the established payment terms. We monitor actual credit memos issued to our customers and compare such actual amounts to the estimated provisions, in the aggregate, for each allowance category to assess the reasonableness of the various reserves at each balance sheet date. Differences between our estimated allowances and actual credits issued have not been significant, and are accounted for in the current period as a change in estimate in accordance with generally accepted accounting principles. Our business, results of operations and financial condition may be materially and negatively impacted if actual credits issued exceed our estimated allowances for such credits.
We also periodically offer promotional discounts to our existing customer base. These discounts are usually calculated as a percentage of the current published list price. Accordingly, the discounts are recorded as a reduction of revenue in the period that the program is offered. In addition to promotional discounts, at the time we implement a price increase, we generally offer our existing customers an opportunity to purchase a limited quantity of products at the previous list price. Shipments resulting from these programs generally are not in excess of ordinary levels and therefore, we recognize the related revenue upon receipt by the customer and include the sale in estimating our various product-related allowances. In the event we determine that these sales represent purchases of inventory in excess of ordinary levels for a given wholesaler, the potential impact on product returns exposure would be specifically evaluated and reflected as a reduction to revenue at the time of such sale.
Our dependence upon key personnel to operate our business puts us at risk of a loss of expertise if key personnel were to leave us.
We depend upon the experience and expertise of our executive management team. The competition for executives, as well as for skilled product development, marketing and sales, and technical personnel, in the pharmaceutical industry is intense and we may not be able to retain or recruit the personnel we need. If we are not able to attract and retain existing and additional highly qualified management, sales, clinical and technical personnel, we may not be able to successfully execute our business strategy.
Our quarterly results may fluctuate significantly and could fall below the expectations of securities analysts and investors, resulting in a decline in our stock price.
Our quarterly operating results may fluctuate significantly because of several factors, including:
| • | the level and timing of our net revenues, gross margin and expenses; |
| • | the volatility of our stock price and its impact on the valuation of our warrants and other financial instruments; |
| • | the timing of our regulatory submissions or approvals, or the failure to receive regulatory approvals; |
| • | the initiation and progress of our clinical trials and other product development activities; |
| • | the introduction of competitive products, including potential generic products, and announcements from competitors regarding actual or potential products under development or new commercial products, and the impact of competitive products and pricing; |
| • | the level of orders within a given quarter and preceding quarters; |
| • | the service fees charged and the levels of inventory for our products maintained by our customers, including wholesalers; |
| • | the timing of our product shipments and our customer’s receipt of such shipments within a given quarter; |
| • | the timing of introducing new products; |
| • | the changes in our pricing policies or in the pricing policies of our competitors or suppliers; and |
| • | our product mix and dependence on a small number of products for most of our net revenues. |
We experience seasonality with respect to sales of our ocular allergy product, BEPREVE. We expect larger sales in the spring through late summer and fewer sales in the late fall and winter. In addition, although our ophthalmic pharmaceutical business is not materially affected by seasonal factors, we have noticed a historical trend with respect to sales. Specifically, our sales have tended to be lowest during the first calendar quarter and the highest during the fourth calendar quarter. Due to these and other factors, we believe that quarter-to-quarter comparisons of results from operations, or any other similar period-to-period comparisons, should not be construed as reliable indicators of our future performance. In any quarterly period, our results may be below the expectations of market analysts and investors, which would likely cause the trading price of our common stock to decrease.
18
Table of Contents
Product acquisitions and licensing activities are subject to uncertainty and any completed acquisitions or licenses may not result in commercially successful products.
We regularly evaluate and, as appropriate, may make selective acquisitions of technologies, products, and compounds that we believe are complementary and/or additive to our business. Such acquisitions may be carried out through the purchase of assets, joint ventures and licenses or by acquiring other companies. However, we cannot assure you that we will be able to complete acquisitions or in-licensing arrangements that meet our target criteria on satisfactory terms, if at all. Successfully integrating a product acquisition or in-licensing arrangement can be a lengthy and complex process. Issues that could delay or prevent integration of the acquired technologies, products, and compounds into our own include:
| • | conforming standards, controls, procedures and policies, business cultures and compensation structures; |
| • | conforming information technology and accounting systems; |
| • | consolidating corporate and administrative infrastructures; |
| • | consolidating sales and marketing operations; |
| • | retaining existing customers and attracting new customers; |
| • | retaining key employees; |
| • | identifying and eliminating redundant and underperforming operations and assets; |
| • | minimizing the diversion of management’s attention from ongoing business concerns; |
| • | coordinating geographically dispersed organizations; |
| • | managing tax costs or inefficiencies associated with integrating operations; and |
| • | making any necessary modifications to operating control standards to comply with the Sarbanes-Oxley Act of 2002 and the rules and regulations promulgated thereunder. |
If we are unable to successfully integrate our acquisitions with our existing business, we may not obtain the advantages that the acquisitions were intended to create, which may materially adversely affect our business, results of operations and financial condition. Actual costs and sales synergies, if achieved at all, may be lower than we expect and may take longer to achieve than we anticipate. Furthermore, the products of companies we acquire may overlap with our products or those of our customers, creating conflicts with existing relationships or with other commitments that are detrimental to the integrated businesses.
Other companies, including those with substantially greater resources than ours, may compete with us for the acquisition of product or in-licensing candidates and approved products, resulting in the possibility that we devote resources to potential acquisitions or arrangements that are never completed. In addition, our product acquisition and licensing activities may require us to obtain additional debt or equity financing, resulting in increased debt obligations or dilution of ownership to our existing stockholders, as applicable. Therefore, we may not be able to finance acquisitions on terms satisfactory to us, if at all.
Our future collaborative arrangements may give rise to disputes over commercial terms, contract interpretation and ownership of our intellectual property and may adversely affect the commercial success of our products.
We may in the future enter into collaborative arrangements, some of which could be based on less definitive agreements, such as memoranda of understanding, material transfer agreements, options or feasibility agreements. We may not execute definitive agreements formalizing these arrangements. Collaborative relationships are generally complex and may give rise to disputes regarding the relative rights, obligations and revenues of the parties, including the ownership of intellectual property and associated rights and obligations, especially when the applicable collaborative provisions have not been fully negotiated and documented. Such disputes can delay collaborative research, development or commercialization of potential products, and can lead to lengthy, expensive litigation or arbitration. The terms of collaborative arrangements may also limit or preclude us from developing products or technologies developed pursuant to such collaborations. Additionally, the collaborators under these arrangements might breach the terms of their respective agreements or fail to prevent infringement of the licensed patents by third parties. Moreover, negotiating collaborative arrangements often takes considerably longer to conclude than the parties initially anticipate, which could cause us to enter into less favorable agreement terms that delay or defer recovery of our development costs and reduce the funding available to support key programs.
We may be unable to enter into future collaborative arrangements on acceptable terms, which would harm our ability to develop and commercialize our current and potential future products. Other factors relating to collaborations that may adversely affect the commercial success of our products include:
| • | any parallel development by a collaborative partner of competitive technologies or products; |
| • | arrangements with collaborative partners that limit or preclude us from developing products or technologies; |
| • | premature termination of a collaboration agreement; or |
19
Table of Contents
| • | failure by a collaborative partner to devote sufficient resources to the development and commercial sales of products using our technology. |
Our collaborative arrangements might not restrict our collaborative partners from competing with us or restrict their ability to market or sell competitive products. Any future collaborative partners may pursue existing or other development-stage products or alternative technologies in preference to those being developed in collaboration with us. Our collaborative partners may also terminate their collaborative relationships with us or otherwise decide not to proceed with development and commercialization of our products.
Litigation Risk
The Company is involved in various other legal proceedings currently, and from time to time, that arise in the ordinary course of business. The Company accrues for estimated legal fees as services are performed and settlements relating to pending lawsuits when they are probable and reasonably estimable. The Company does not believe that the outcome of any such pending or threatened litigation in the ordinary course of business will have a material adverse effect on the Company’s financial position or results of operations. However, there cannot be any assurance that such actions will not materially and adversely affect the Company’s business, financial condition, results of operations or cash flows.
Risks Related to Our Industry
Compliance with extensive government regulations or other third parties to which we are subject is expensive and time consuming, and may result in the delay, cessation or cancellation of product sales, introductions or modifications.
Extensive industry regulation has had, and will continue to have, a significant impact on our business. All pharmaceutical companies, including us, are subject to extensive, complex, costly and evolving regulation by the federal government, principally the FDA, and foreign and state government agencies. The Food, Drug and Cosmetic Act, the Controlled Substances Act and other domestic and foreign statutes and regulations govern or influence the testing, manufacturing, packing, labeling, storing, record keeping, safety, approval, advertising, promotion, sale and distribution of our products. Under certain of these regulations, we and our contract suppliers and manufacturers are subject to periodic inspection of our or their respective facilities, procedures and operations and/or the testing of our products by the FDA and other authorities, which conduct periodic inspections to confirm that we and our contract suppliers and manufacturers are in compliance with all applicable regulations. The FDA also conducts pre-approval and post-approval reviews and plant inspections to determine whether our systems, or our contract suppliers’ and manufacturers’ processes, are in compliance with cGMP regulations and other FDA regulations.
We are dependent on maintaining FDA and other governmental approvals in order to manufacture, market, sell and ship our products. Consequently, there is always a risk that the FDA or other applicable governmental authorities will take post-approval action limiting, modifying or revoking our ability to manufacture or sell our products, or that the cost of maintaining such approvals will adversely affect our results of operations. Certain of the FDA’s policies and procedures are under review by new leadership and it is uncertain whether any changes arising from such review could adversely affect our products and business.
We currently have certain raw materials manufactured in foreign countries and the manufacturers of those materials are subject to regulation and inspection by both the FDA and local governmental authorities. We may also elect in the future to market certain of our products in foreign countries which would require further approvals by local governmental authorities.
If our past or present operations are found to be in violation of any of the laws described above or other similar governmental regulations to which we are subject, we may be subject to the applicable penalty associated with the violation which could adversely affect our ability to operate our business, results of operations and financial condition.
Pharmaceutical marketing is subject to substantial regulation in the United States.
All marketing activities associated with BROMDAY, BEPREVE, ISTALOL and VITRASE, and XIBROM, which we stopped shipping in February 2011, as well as marketing activities related to any other products for which we obtain regulatory approval, will be subject to numerous federal and state laws governing the marketing and promotion of pharmaceutical products. The FDA regulates post-approval promotional labeling and advertising to ensure that they conform to statutory and regulatory requirements. In addition to FDA restrictions, the marketing of prescription drugs is subject to laws and regulations prohibiting fraud and abuse under governmental healthcare programs. For example, the federal healthcare program anti-kickback statute prohibits giving things of value to induce the prescribing or purchase of products that are reimbursed by federal healthcare programs, such as Medicare and Medicaid. In addition, federal false claims laws prohibit any person from knowingly presenting, or causing to be presented, a false claim for payment to the federal government. Under this law, the federal government in recent years has brought claims against drug manufacturers alleging that certain marketing activities caused false claims for prescription drugs to be submitted to federal programs. Many states have similar statutes or regulations, which apply to items and services reimbursed under Medicaid and other state programs, or, in some states, regardless of the payor. If we, or our collaborative partners, fail to comply with applicable FDA regulations or other laws or regulations relating to the marketing of our products, we could be subject to criminal prosecution, civil penalties, seizure of products, injunction and exclusion of our products from reimbursement under governmental programs, as well as other regulatory actions against our product candidates, our collaborative partners or us.
20
Table of Contents
In April 2008, we received subpoenas from the office of the U.S. Attorney for the Western District of New York requesting information regarding the marketing activities related to XIBROM. We are cooperating with the government’s investigation. From April 2008 through December 31, 2011, we have incurred approximately $5.2 million, including $1.3 million incurred in 2011, in legal fees associated with this criminal investigation and expect to incur significant expenses in the future. In October 2011, we, and certain of our officers and current and former employees received correspondence from the government identifying them as targets. Tolling agreements have been executed to allow cooperation and discussions regarding resolution. If the government chooses to engage in civil litigation or initiate a criminal prosecution against us, our officers or our current or former employees, as a result of its review of the requested documents and other evidence, we may have to incur significant amounts to defend such actions or pay or incur substantial fines or penalties, on behalf of ourselves, our officers or our current or former employees, any of which could significantly deplete our cash resources. The case is ongoing and the likelihood of an unfavorable outcome and/or the amount/range of loss or additional expenses, cannot be reasonably estimated.
We have adopted a comprehensive compliance program to regulate our personnel’s interactions with physicians and others, to attempt to comply with these regulations. However, because of the breadth of these laws and regulations and subjective nature of their fundamental bases, it is possible that some of our business activities could be subject to challenge under one or more of such laws.
If our past or present operations are found to be in violation of any of the laws described above or other similar governmental regulations to which we are subject, we may be subject to the applicable penalty associated with the violation which could adversely affect our ability to operate our business, results of operations and financial condition.
If we are unable to adequately protect our technology or enforce our patent rights, our business could suffer.
Our success with the products that we develop will depend, in part, on our ability and the ability of our licensors to obtain and maintain patent protection for these products. We currently have a number of U.S. and foreign patents issued and pending, however, we primarily rely on patent rights licensed from others. Our license agreements generally give us the right and/or the obligation to maintain and enforce the subject patents. We may not receive patents for any of our pending patent applications or any patent applications we may file in the future. If our pending and future patent applications are not allowed or, if allowed and issued into patents, if such patents and the patents we have licensed are not upheld in a court of law, our ability to competitively exploit our drug products would be substantially harmed. Also, such patents may or may not provide competitive advantages for their respective products or they may be challenged or circumvented by our competitors, in which case our ability to commercially exploit these products may be diminished.
As of December 31, 2011, we owned eight issued U.S. patents, seven pending U.S. patent applications, 22 issued foreign patents, and four pending foreign patent applications. In addition, as of December 31, 2011, we licensed six issued U.S. patents, four pending U.S. patent applications, one issued foreign patent, and one pending foreign patent application. Our existing patents, or any patents issued to us as a result of such applications, may not provide us a basis for commercially viable products, may not provide us with any competitive advantages, or may face third-party challenges or be the subject of further proceedings limiting their scope or enforceability. We may become involved in interference proceedings in the U.S. Patent and Trademark Office to determine the priority of our inventions. In addition, costly litigation could be necessary to protect our patent position. We license patent rights from Senju related to BROMDAY, BEPREVE, ecabet sodium, iganidipine and certain prostaglandin compounds, including latanoprost. We also license patent rights from Mitsubishi Tanabe for bepotastine in nasal dosage form. Some of these license agreements do not permit us to control the prosecution, maintenance, protection and/or defense of such patents. If the licensor chooses not to protect and enforce its own patent rights, we may not be able to take actions to secure our related product marketing rights. In addition, if such patent licenses are terminated before the expiration of the licensed patents, we may no longer be able to continue to manufacture and sell these products covered by the patents. In this regard, certain patent rights licensed from Senju and Mitsubishi Tanabe were licensed by them from third parties. As a result, any failure by Senju or Mitsubishi Tanabe to perform their respective obligations under their license agreements with third parties, or any adverse modification or termination of these third party license agreements, could significantly impair our ability to continue or stop our development and/or commercialization of any product candidates or products for which Senju and Mitsubishi Tanabe have licensed us rights subject to these third party license agreements.
The patent positions of pharmaceutical and biotechnology companies can be highly uncertain and involve complex legal and factual questions. No consistent policy regarding the breadth of claims allowed in pharmaceutical and biotechnology patents has emerged to date in the U.S. The laws of many countries may not protect intellectual property rights to the same extent as U.S. laws, and those countries may lack adequate rules and procedures for defending our intellectual property rights. Filing, prosecuting and defending patents on all our products or product candidates throughout the world would be prohibitively expensive. Competitors may use our technologies in jurisdictions outside of those in which we have patent or intellectual property protection and we may not be covered by any of our patent claims or other intellectual property rights.
21
Table of Contents
Changes in either patent laws or in interpretations of patent laws in the U.S. and other countries may diminish the value of our intellectual property. We do not know whether any of our patent applications will result in the issuance of any patents, and we cannot predict the breadth of claims that may be allowed in our patent applications or in the patent applications we license from others.
The degree of future protection for our proprietary rights is uncertain because legal means afford only limited protection and may not adequately protect our rights or permit us to gain or keep our competitive advantage. For example:
| • | in certain jurisdictions, we or our licensors might not have been the first to make the inventions covered by each of our or our licensors’ pending patent applications and issued patents, and we may have to participate in expensive and protracted interference proceedings to determine priority of invention; |
| • | we or our licensors might not have been the first to file patent applications for these inventions; |
| • | others may independently develop similar or alternative product candidates or duplicate any of our or our licensors’ product candidates; |
| • | our or our licensors’ pending patent applications may not result in issued patents; |
| • | our or our licensors’ issued patents may not provide a basis for commercially viable products or may not provide us with any competitive advantages or may be challenged by third parties; |
| • | others may design around our or our licensors’ patent claims to produce competitive products that fall outside the scope of our or our licensors’ patents; |
| • | we may not develop or in-license additional patentable proprietary technologies related to our product candidates; or |
| • | the patents of others may prevent us from marketing one or more of our product candidates for one or more indications that may be valuable to our business strategy the timing of our product shipments and/or our customer’s receipt of such shipments within a given quarter. |
Moreover, an issued patent does not guarantee us the right to practice the patented technology or commercialize the patented product. Third parties may have blocking patents that could be used to prevent us from commercializing our patented products and practicing our patented technology. Our issued patents and those that may be issued in the future may be challenged, invalidated or circumvented, which could limit our ability to prevent competitors from marketing related product candidates or could limit the length of the term of patent protection of our product candidates. In addition, our competitors may independently develop similar technologies. Moreover, because of the extensive time required for development, testing and regulatory review of a potential product, it is possible that, before any of our product candidates can be commercialized, any related patent may expire or remain in force for only a short period following commercialization, thereby reducing any advantage of the patent.
We also rely on trade secrets, unpatented proprietary know-how and continuing technological innovation that we seek to protect with confidentiality agreements with employees, consultants and others with whom we discuss our business. Trade secrets are difficult to protect. While we enter into confidentiality agreements, these agreements may not successfully protect our trade secrets or other confidential and proprietary information. It is possible that these agreements will be breached, or that they will not be enforceable in every instance, and that we will not have adequate remedies for any such breach. It is possible that trade secrets or other confidential and proprietary information may still be leaked or disclosed to a third party. It is also possible that our trade secrets will become known or independently developed by our competitors. Disputes may arise concerning the ownership of intellectual property or the applicability or enforceability of these agreements, and we might not be able to resolve these disputes in our favor.
We also rely on trademarks to protect the names of our products. These trademarks may be challenged by others. If we enforce our trademarks against third parties, such enforcement proceedings may be expensive. Some of our trademarks are owned by, or assignable to, our licensors, and upon expiration or termination of the applicable license agreements, we may no longer be able to use these trademarks.
If we are unable to adequately protect our technology, trade secrets or proprietary know-how, or enforce our patents, our business, financial condition and results of operations and prospects could suffer.
22
Table of Contents
Intellectual property rights are complex and uncertain and therefore may subject us to infringement claims.
The patent positions related to our products are inherently uncertain and involve complex legal and factual issues. We believe that there is significant litigation in the pharmaceutical and biotechnology industry regarding patent and other intellectual property rights. A patent does not provide the patent holder with freedom to operate in a way that infringes the patent rights of others. We may be accused of patent infringement at any time. The coverage of patents is subject to interpretation by the courts, and the interpretation is not always uniform. If we are sued for patent infringement, we would need to demonstrate that our products or methods do not infringe the patent claims of the relevant patent and/or that the patent claims are invalid or unenforceable, and we may not be able to do this. Proving invalidity, in particular, is difficult since it requires a showing of clear and convincing evidence to overcome the presumption of validity enjoyed by issued patents in the U.S.
Although we are not aware of any infringement by any of our products on the rights of any third party, there may be third party patents or other intellectual property rights, including trademarks and copyrights, relevant to our products of which we are not aware. Third parties may assert patent or other intellectual property infringement claims against us, or our licensors and collaborators, with products. Any claims that might be brought against us relating to infringement of patents may cause us to incur significant expenses and, if successfully asserted against us, may cause us to pay substantial damages and result in the loss of our use of the intellectual property that is critical to our business strategy.
In the event that we or our partners are found to infringe any valid claim of a patent held by a third party, we may, among other things, be required to:
| • | pay damages, including up to treble damages and the other party’s attorneys’ fees, which may be substantial; |
| • | cease the development, manufacture, use and sale of our products that infringe the patent rights of others through a court-imposed sanction such as an injunction; |
| • | expend significant resources to redesign our products so they do not infringe others’ patent rights, which may not be possible; |
| • | discontinue manufacturing or other processes incorporating infringing technology; or |
| • | obtain licenses to the infringed intellectual property, which may not be available to us on acceptable terms, or at all. |
Intellectual property litigation is increasingly common and increasingly expensive and may result in restrictions on our business and substantial costs, even if we prevail.
Patent and other intellectual property litigation is becoming more common in the pharmaceutical industry. The pharmaceutical field is characterized by a large number of patent filings involving complex legal and factual questions, and, therefore, we cannot predict with certainty whether our licensed patents will be enforceable. Competitors may have filed applications for or have been issued patents and may obtain additional patents and proprietary rights related to products or processes that compete with or are similar to ours. We may not be aware of all of the patents potentially adverse to our interests that may have been issued to others. Litigation is sometimes necessary to defend against or assert claims of infringement, to enforce our patent rights, including those we have licensed from others, to protect trade secrets or to determine the scope and validity of proprietary rights of third parties. We have not conducted an extensive search of patents issued to other parties and such patents which contain claims relating to our technology and products may exist, may have been filed, or could be issued. If such patents do exist, we may be infringing upon a third party’s patent rights or other intellectual property, and litigation asserting such claims might be initiated in which we would not prevail, or we would not be able to obtain the necessary licenses on reasonable terms, if at all. All such litigation, whether meritorious or not, as well as litigation initiated by us against third parties, is time-consuming and very expensive to defend or prosecute and to resolve and we cannot be certain that we will have the required resources to pursue litigation or otherwise to protect our proprietary rights. In addition, if we infringe the intellectual property rights of others, we could lose our right to develop, manufacture or sell our products or could be required to pay monetary damages or royalties to license proprietary rights from third parties. An adverse determination in a judicial or administrative proceeding or a failure to obtain necessary licenses could prevent us from manufacturing or selling our products, which could harm our business, financial condition and prospects.
If our competitors prepare and file patent applications in the U.S. or in foreign countries that claim technology we also claim, we may have to participate in interference proceedings required by the United States Patent and Trademark Office to determine priority of invention or opposition proceedings in foreign countries, both of which could result in substantial costs, even if we ultimately prevail. Results of interference and opposition proceedings are highly unpredictable and may result in us having to try to obtain licenses which may not be available on commercially reasonable terms, or at all, in order to continue to develop or market certain of our products. If we need but cannot obtain a license, we may be prevented from marketing the affected product.
23
Table of Contents
If third-party reimbursement is not available at satisfactory levels or at all, our products may not be accepted in the market.
Market acceptance of our products depends in part on the extent to which reimbursement for our products, and for our competitors’ products, and related treatments will be available from government health administration authorities, private health insurers, managed care organizations and other healthcare providers. Both governmental and private third-party payors are increasingly attempting to limit both the coverage and the level of reimbursement of new products to contain costs.
Any of our products that have been, or in the future are, approved by the FDA may be purchased or reimbursed by state and federal government authorities, private health insurers and other organizations, such as health maintenance organizations and managed care organizations. Such third party payors increasingly challenge pharmaceutical product pricing. The trend toward managed healthcare in the U.S., the growth of such organizations, and various legislative proposals and enactments to reform healthcare and government insurance programs, including the Medicare Prescription Drug Modernization Act of 2003, could significantly influence the manner in which pharmaceutical products are prescribed and purchased, resulting in lower prices and/or a reduction in demand. Such cost-containment measures and healthcare reforms could adversely affect our ability to sell our products. Furthermore, individual states have become increasingly aggressive in passing legislation and implementing regulations designed to control pharmaceutical product pricing, including price or patient reimbursement constraints, discounts, restrictions on certain product access, importation from other countries and bulk purchasing. Legally mandated price controls on payment amounts by third party payors or other restrictions could negatively and materially impact our net revenues and financial condition. Similar regulatory and legislative issues are present in most other countries outside of the U.S.
The U.S. Department of Defense’s, or DoD’s, TRICARE Retail Pharmacy program pursuant to Section 703 of the National Defense Authorization Act of 2008, enacted on January 28, 2009, requires that pharmaceutical products purchased through the Department of Defense, or DoD, TRICARE Retail Pharmacy program be subject to the Federal Ceiling Price discount under the Veterans Health Care Act of 1992. DoD issued a rule pursuant to Section 703 that requires manufacturers to provide DoD with a quarterly refund on pharmaceutical products utilized through the TRICARE Retail Pharmacy program, and to pay rebates to DoD on TRICARE Retail Pharmacy purchases retroactive to January 28, 2008. We have requested a waiver of the retroactive rebate for TRICARE Retail Pharmacy utilization for the period from January 28, 2008 to May 26, 2009 (the effective date of the DoD rule). In addition, the regulation was the subject of litigation by others, and it was our position that the retroactive application of the regulation was contrary to established case law. In October 2011, the United States District Court for the District of Columbia issued its decision in Coalition for Common Sense in Government Procurement v. United States, No. 08-996 (D.D.C. Oct. 25, 2011) upholding the DoD’s regulation. That case has been appealed to the United States Circuit Court for the District of Columbia. It is uncertain whether such appeal will be successful. In addition, the foregoing court decision does not impact our currently pending request for a waiver of the retroactive rebate. As of December 31, 2011, we determined that our payment of the retroactive rebate (from January 28, 2008 to May 26, 2009) created by the regulation is neither reasonably estimable nor probable.
It is uncertain how any other policies and new healthcare legislation supported by the current presidential administration may impact the government and other third party payors’ reimbursement policies. Consequently, significant uncertainty exists as to the reimbursement status of healthcare products. Third-party payors may not establish adequate levels of reimbursement for any of our approved products or products we develop or acquire in the future, which could limit their market acceptance and result in a material adverse effect on our business, results of operations and financial condition.
Continuing consolidation of our distribution network and the concentration of our customer base could adversely affect our results of operations.
Our principal customers are wholesale drug distributors and major retail drug store chains. These customers comprise a significant part of the distribution network for pharmaceutical products in the U.S. This distribution network is continuing to undergo significant consolidation marked by mergers and acquisitions among wholesale distributors and the growth of large retail drug store chains. As a result, a small number of large wholesale distributors control a significant share of the market, and the number of independent drug stores and small drug store chains has decreased. We expect that consolidation of drug wholesalers and retailers could continue, likely resulting in increased service fees charged to drug companies and other competitive pressures. For the year ended December 31, 2011, our three largest customers, Cardinal Health, Inc., McKesson HBOC and AmeriSource Bergen Corp. accounted for 39%, 37% and 18%, respectively, of our net revenues. In addition, we are not party to any long-term supply agreements with our customers which would enable them to change suppliers freely should they wish to do so. The loss of any of our customers could materially adversely affect our business, results of operations and financial condition.
24
Table of Contents
We face intense competition and rapid technological change that could result in the development of products by others that are superior to the products we are developing.
We have numerous competitors in the U.S. and abroad, including major pharmaceutical and specialized biotechnology firms, universities and other research institutions that may be developing competing products. Our competitors include, among others, Allergan, Inc., Alcon Laboratories, Inc. / Novartis AG, Bausch & Lomb, Inc., Johnson & Johnson and Pfizer, Inc. These competitors may develop technologies and products that are more effective or less costly than our current or future products or product candidates or that could render our technologies, products and product candidates obsolete or noncompetitive. Many of these competitors have substantially more resources and product development, manufacturing and marketing experience and capabilities than we do. Many of our competitors also have more resources committed to, and expertise in, effectively commercializing, marketing, and promoting products approved by the FDA, including communicating the efficacy, safety and value of the products to actual and prospective customers and medical professionals. In addition, many of our competitors have significantly greater experience than we do in undertaking preclinical testing and clinical trials of pharmaceutical product candidates and obtaining FDA and other regulatory approvals of products and therapies for use in healthcare.
We are exposed to product liability claims, and insurance against these claims may not be available to us on reasonable terms, or at all.
The design, development, manufacture and sale of our products involve an inherent risk of product liability claims by consumers and other third parties. As a commercial company, we may be subject to various product liability claims. In addition, we may in the future recall or issue field corrections related to our products due to manufacturing deficiencies, labeling errors or other safety or regulatory reasons. We may experience material losses due to product liability claims, product recalls or corrections. These events, among others, could result in additional regulatory controls, such as the performance of costly post-approval clinical studies or revisions to our approved labeling that could limit the indications or patient population for our products or could even lead to the withdrawal of a product from the market. Furthermore, any adverse publicity associated with such an event could cause consumers to seek alternatives to our products, which may cause our sales to decline, even if our products are ultimately determined not to have been the primary cause of the event.
We currently maintain sold products and clinical trial liability insurance with per occurrence and aggregate coverage limits of $15 million. The coverage limits of our insurance policies may be inadequate to protect us from any liabilities we might incur in connection with clinical trials or the sale of our products. Product liability insurance is expensive and in the future may not be available on commercially acceptable terms, or at all. A successful claim or claims brought against us in excess of our insurance coverage could materially harm our business, results of operations and financial condition.
Legislative or regulatory reform of the healthcare system and pharmaceutical industry related to pricing or reimbursement may hurt our ability to sell our products profitably or at all.
In both the U.S. and certain foreign jurisdictions, there have been, and may continue to be, a number of legislative and regulatory proposals related to pricing and reimbursement that could impact our ability to sell our products profitably. In March 2010, the President of the United States signed the Patient Protection and Affordable Care Act, as amended by the Health Care and Education Affordability Reconciliation Act, or the Healthcare Reform Act. This law substantially changes the way health care is financed by both government and private insurers, and significantly impacts the pharmaceutical industry. The Healthcare Reform Act contains a number of provisions that are expected to impact our business and operations, in some cases in ways we cannot currently predict. Changes that may affect our business include those governing enrollment in federal healthcare programs, reimbursement changes, fraud and abuse and enforcement. These changes will impact existing government healthcare programs and will result in the development of new programs, including Medicare payment for performance initiatives and improvements to the physician quality reporting system and feedback program. Additional provisions of the Healthcare Reform Act, some of which became effective in 2011, may negatively affect our operating expenses and results of operations in the future. For example, the Healthcare Reform Act imposes a non-deductible excise tax on pharmaceutical manufacturers or importers that sell branded prescription drugs to U.S. government programs that we believe will impact our operating expenses and results of operations. In addition, as part of the Healthcare Reform Act’s provisions closing a funding gap that currently exists in the Medicare Part D prescription drug program (commonly known as the “donut-hole”), we are required to provide a 50% discount on branded prescription drugs dispensed to beneficiaries within this donut-hole. We expect that the Healthcare Reform Act and other healthcare reform measures that may be adopted in the future could have a material adverse effect on our industry generally and on our ability to maintain or increase our product sales or successfully commercialize our product candidates, or could limit or eliminate our future spending on development projects.
25
Table of Contents
In addition to the Healthcare Reform Act, there will continue to be proposals by legislators at both the federal and state levels, regulators and third-party payors to keep healthcare costs down while expanding individual healthcare benefits. Certain of these changes could impose limitations on the prices we will be able to charge for our products and any approved product candidates or the amounts of reimbursement available for these products from governmental agencies or third-party payors, or may increase the tax obligations on pharmaceutical companies such as ours. The enactment and implementation of any future healthcare reform legislation or policies could have a material adverse effect on our business, results of operations and financial condition.
It is possible that proposals will be adopted, or existing regulations that affect the coverage or pricing of pharmaceutical and other medical products may change, before any of our products are approved for marketing. Cost control initiatives could decrease the price that we receive for any of our products that we are developing. In addition, third-party payors are increasingly challenging the price and cost-effectiveness of medical products and services. Significant uncertainty exists as to the reimbursement status of newly-approved pharmaceutical products.
Risks Related to Our Stock
Our stock price is subject to significant volatility.
Since 2004, the daily closing price per share of our common stock has ranged from a high of $15.05 per share to a low of $0.36 per share. Our stock price has been and may continue to be subject to significant volatility. Among others, the following factors may cause the market price of our common stock to fall:
| • | the scope, outcome and timeliness of any governmental, court or other regulatory action that may involve us, including, without limitation, the scope, outcome or timeliness of any product approval, inspection or other action of the FDA; |
| • | market acceptance and demand for our approved products; |
| • | the availability to us, on commercially reasonable terms or at all, of third-party sourced products and materials; |
| • | timely and successful implementation of our strategic initiatives, including the expansion of our commercial infrastructure to support the marketing, sale, and distribution of our approved products; |
| • | developments concerning proprietary rights, including the ability of third parties to assert patents or other intellectual property rights against us which, among other things, could cause a delay or disruption in the development, manufacture, marketing or sale of our products; |
| • | the initiation and progress of our clinical trials and other product development activities; |
| • | competitors’ publicity regarding actual or potential products under development or new commercial products, and the impact of competitive products, including potential generic products, and pricing; |
| • | period-to-period fluctuations in our financial results; |
| • | future sales of debt or equity securities by us; |
| • | sales of our securities by our directors, officers or significant stockholders; |
| • | availability of capital from hedge funds, mutual funds and others; |
| • | comments made by securities analysts; and |
| • | economic and other external factors, including disasters and other crises. |
In addition, Valeant’s initiation and subsequent abandonment of its unsolicited takeover proposal to acquire all of the shares of our common stock has resulted in volatility in the price of our common stock. Any other takeover proposal by any third party to acquire the outstanding shares of our common stock may result in further volatility in the price of our common stock. If a takeover does not occur following announcement of a takeover proposal, for any reason, the market price of our common stock may decline.
We participate in a highly dynamic industry, which often results in significant volatility in the market price of our common stock irrespective of company performance. Fluctuations in the price of our common stock may be exacerbated by conditions in the healthcare and technology industry segments or conditions in the financial markets in general.
26
Table of Contents
Trading in our stock over the last twelve months has been limited, so investors may not be able to sell as much stock as they want at prevailing prices.
Based on data obtained from NASDAQ, the average daily trading volume in our common stock for the year ended December 31, 2011 was approximately 402,883 shares and the average daily number of transactions was approximately 2,015 for the same period. If limited trading in our stock continues, it may be difficult for investors to sell their shares in the public market at any given time at prevailing prices. Moreover, the market price for shares of our common stock may be made more volatile because of the relatively low volume of trading in our common stock. When trading volume is low, significant price movement can be caused by the trading in a relatively small number of shares. Volatility in our common stock could cause stockholders to incur substantial losses. Moreover, the market price for shares of our common stock may be made more volatile because of the relatively low volume of trading in our common stock. When trading volume is low, significant price movement can be caused by the trading in a relatively small number of shares. Volatility in our common stock could cause stockholders to incur substantial losses.
Substantial future sales of our common stock in the public market may depress our stock price and make it difficult for investors to recover the full value of their investment in our shares.
We have approximately 41.6 million shares of common stock outstanding, most of which are freely tradable. In addition, as of December 31, 2011, an aggregate of 10.3 million shares of common stock were issuable upon exercise of outstanding options, 6.9 million shares of common stock are issuable upon the exercise of certain warrants issued under the Facility Agreement and 2.0 million shares remain available for issuance under our equity incentive plans. The market price of our common stock could decrease due to sales of a large number of shares or the perception that such sales could occur. These factors also could make it more difficult to raise funds through future offerings of common stock.
Our directors, officers and principal stockholders have significant voting power and may take actions that may not be in the best interests of our other stockholders.
As of December 31, 2011, our officers, directors and principal stockholders, including certain stockholders who own 5% or more of our common stock and common stock equivalents and who are our Lenders, beneficially own approximately 45% of our common stock and common stock equivalents in the aggregate. As a result of the holdings, we may be able to control the management and affairs of our company and most matters requiring stockholder approval, including the election of directors and approval of significant corporate transactions. This concentration of ownership may have the effect of delaying or preventing a change in control and might adversely affect the market price of our common stock.
Our stockholder rights plan provisions, in our charter documents, and Delaware law may inhibit a takeover of us, which could limit the price investors might be willing to pay in the future for our common stock, and could entrench management.
We have a stockholder rights plan that has the effect of discouraging unsolicited takeover proposals, thereby entrenching current management and possibly depressing the market price of our common stock. The rights issued under the stockholder rights plan would cause substantial dilution to a person or group that attempts to acquire us on terms not approved in advance by our Board, In addition, our charter and bylaws contain provisions that may discourage unsolicited takeover proposals that stockholders may consider to be in their best interests. These provisions include:
| • | a classified board of directors; |
| • | the ability of the board of directors to designate the terms of and issue new series of preferred stock; |
| • | advance notice requirements for nominations for election to the board of directors; and |
| • | special voting requirements for the amendment of our charter and bylaws. |
In December 2001, we adopted a stockholder rights agreement pursuant to which we distributed rights to purchase units of our Series A Participating Preferred Stock, or Series A Preferred Stock. In January 2012, our Board approved a replacement stockholder rights agreement, effective January 12, 2012, that replaced the stockholder rights agreement which was originally was adopted in 2001 and expired on January 12, 2012. The replacement rights agreement will expire at the earlier of the close of business on (i) January 12, 2015 or (ii) on December 21, 2012 if the approval of a majority of the shares of our common stock voting on the matter at the 2012 annual meeting or a special meeting has not been received prior to such time, unless the rights are previously redeemed, exchanged or terminated. A stockholder rights agreement is designed to deter coercive, unfair, or inadequate takeovers and other abusive tactics that might be used in an attempt to gain control of the Company without paying all stockholders a fair price for their shares. A stockholder rights agreement will not prevent takeovers at a full and fair price, but rather is designed to deter coercive takeover tactics and to encourage anyone attempting to acquire the Company to first negotiate with the Board. These rights could delay or discourage someone from acquiring our business, even if doing so would benefit our stockholders.
27
Table of Contents
We are also subject to anti-takeover provisions under Delaware law, each of which could delay or prevent a change of control. Together these provisions and the stockholder rights plan may make the removal of management more difficult and may discourage transactions that otherwise could involve payment of a premium over prevailing market prices for our common stock.
Unsolicited takeover proposals may be disruptive to our business.
On December 16, 2011, we announced that our Board had rejected an unsolicited proposal by Valeant to acquire all of our outstanding shares of common stock. While Valeant has withdrawn its proposal, there can be no assurance that Valeant or another third party will not make an unsolicited takeover proposal in the future. The review and consideration of any takeover proposal may be a significant distraction for our management and employees and could require the expenditure of significant time and resources by us. Moreover, any unsolicited takeover proposal may create uncertainty for our employees and this uncertainty may adversely affect our ability to retain key employees and to hire new talent. Any such takeover proposal may also create uncertainty for our customers, suppliers and other business partners, which may cause them to terminate, or not to renew or enter into, arrangements with us. The uncertainty arising from unsolicited takeover proposals and any related costly litigation may disrupt our business, which could result in an adverse effect on our operating results. Management and employee distraction related to any such takeover proposal also may adversely impact our ability to optimally conduct our business and pursue our strategic objectives.
We do not anticipate declaring any cash dividends on our common stock.
We have never declared or paid cash dividends on our common stock and do not plan to pay any cash dividends in the near future. Our current policy is to retain all funds and any earnings for use in the operation and expansion of our business. The payment of cash dividends by us is restricted by our Facility Agreement, which contains restrictions prohibiting us from paying any cash dividends without the lender’s prior approval. If we do not pay cash dividends, our stock may be less valuable to investors because a return on their investment will only occur if our stock price appreciates.
| Item 1B: | Unresolved Staff Comments. |
None
| Item 2: | Properties. |
We do not own real property. We currently lease two facilities, one of which is approximately 60,547 square feet of laboratory and office space, located at 50 Technology Drive, Irvine, CA 92618. The other leased facility consists of two suites at 15273 Alton Parkway in Irvine, CA 92618, which approximates 9,862 square feet of manufacturing and other space. The term of the lease for the facility located at 50 Technology Drive expires on December 31, 2017 and the term of the lease located at 15273 Alton Parkway expires on March 31, 2016, and both leases may be renewed by us for additional five year terms. We believe that these facilities are adequate, suitable and of sufficient capacity to support our immediate needs. Additional space may be required, however, as we expand our research and clinical development, manufacturing and selling and marketing activities.
| Item 3: | Legal Proceedings. |
In April 2010, we commenced withholding royalty payments and initiated legal action against Senju seeking a declaratory judgment with regard to our royalty obligations to Senju in connection with bromfenac products and a recovery of overpaid XIBROM royalties and other damages. The only U.S. patent applicable to XIBROM and, now to BROMDAY, expired in January 2009 and, according to U.S. case law and the terms of our license agreement with Senju, we believe no bromfenac product royalties are due after patent expiration. In August 2010, the U.S. District Court for the Central District of California stayed our action against Senju, and, in September 2010, Senju initiated an arbitration proceeding regarding the same dispute with the International Chamber of Commerce, or the ICC. The order staying our action against Senju will not become appealable until after the arbitration is concluded and a judgment is entered in the court case. The arbitration proceeding, the outcome of which may also affect our BROMDAY royalty obligations, is ongoing.
In February 2012, the arbitration tribunal adjudicating the dispute with Senju issued a decision on three preliminary matters. The arbitration tribunal upheld its own jurisdiction and rejected a request by Senju for interim and conservatory financial and other measures. The decision also addressed aspects of the law applicable to the parties’ dispute, concluding that Japanese law governs the obligation to pay royalties except insofar as Japanese law requires the application of U.S. mandatory law to the performance of certain obligations in the contract. In particular, the decision stated that U.S. mandatory laws govern our obligation to pay royalties under the license, provided the facts of this case fall within the scope of U.S. mandatory law. We believe that U.S. mandatory law includes case law supporting our assertion that no bromfenac product royalties were due after the expiration of the bromfenac patent. In addition, the arbitration tribunal dismissed Senju’s request for an interim order permitting Senju to terminate the license or suspend our contractual rights as exclusive licensee, pending the resolution of the parties’ dispute. Following further submissions and evidence from the parties, the arbitration tribunal is expected to issue a final award. The timing of the issuance of a final award is unknown at this time.
28
Table of Contents
In June 2010, we commenced withholding royalty payments and initiated a legal action by filing a Complaint against AcSentient, seeking a declaratory judgment with regard to our bromfenac royalty obligations under the Asset Purchase Agreement dated May 3, 2002 between the AcSentient and us. The only U.S. patent applicable to XIBROM and, now, to BROMDAY expired in January 2009 and, according to U.S. case law and the terms of our agreement with AcSentient, we believe no XIBROM and BROMDAY royalties are due after patent expiration. A declaratory judgment that we are seeking from the court in regard to royalty obligations to AcSentient may apply not only to XIBROM, but also to BROMDAY, which was approved by the FDA in October 2010. In November 2010, the Superior Court of the State of California, County of Orange stayed our case against AcSentient and ruled that the dispute had to be arbitrated. We will have an opportunity to appeal that court’s ruling after the final judgment is entered by the court. In January 2011, AcSentient filed a request for arbitration with the ICC. This arbitration is in its early stages.
There can be no assurance about when or how these two disputes will be resolved, and we cannot predict the final outcome or financial impact of either. The parties could elect to settle the dispute, allow the dispute to be resolved in arbitration or the U.S. courts or seek to exercise interim contractual rights including a purported termination by Senju prior to any determination in arbitration or the U.S. courts that would be challenged by ISTA. The range of outcomes could include continuation of the license with or without royalties, termination of the license with or without any assessment of costs or awards for withheld royalties or the negotiation of an amended license arrangement. Until these two disputes are resolved, for accounting purposes, we have been and intend to continue to reserve for BROMDAY and XIBROM royalties, which would have been payable to Senju and AcSentient if the relevant contractual royalty obligations were existing and enforceable. As of December 31, 2011, we had approximately $38.2 million reserved for such contingent XIBROM and BROMDAY royalties.
Subpoenas From the U.S. Attorney, Western District of New York. In April 2008, we received subpoenas from the office of the U.S. Attorney for the Western District of New York requesting information regarding the marketing activities related to XIBROM. We are cooperating with the government’s investigation. From April 2008 through December 31, 2011, we have incurred approximately $5.2 million, including $1.3 million incurred in 2011, in legal fees associated with this criminal investigation and expect to incur significant expenses in the future. In October 2011, we, and certain of our officers and current and former employees received correspondence from the government identifying them as targets. Tolling agreements have been executed to allow cooperation and discussions regarding resolution. If the government chooses to engage in civil litigation or initiate a criminal prosecution against us, our officers or our current or former employees, as a result of its review of the requested documents and other evidence, we may have to incur significant amounts to defend such actions or pay or incur substantial fines or penalties, on behalf of ourselves, our officers or our current or former employees, any of which could significantly deplete our cash resources. The case is ongoing and the likelihood of an unfavorable outcome and/or the amount/range of loss or additional expenses, cannot be reasonably estimated.
TRICARE Retail Pharmacy Program. Section 703 of the National Defense Authorization Act of 2008, enacted on January 28, 2009, requires that pharmaceutical products purchased through the Department of Defense, or DoD, TRICARE Retail Pharmacy program be subject to the Federal Ceiling Price discount under the Veterans Health Care Act of 1992. DoD issued a rule pursuant to Section 703 that requires manufacturers to provide DoD with a quarterly refund on pharmaceutical products utilized through the TRICARE Retail Pharmacy program, and to pay rebates to DoD on TRICARE Retail Pharmacy purchases retroactive to January 28, 2008. We have requested a waiver of the retroactive rebate for TRICARE Retail Pharmacy utilization for the period from January 28, 2008 to May 26, 2009 (the effective date of the DoD rule). In addition, the regulation was the subject of litigation by others, and it was our position that the retroactive application of the regulation was contrary to established case law. In late October 2011, the United States District Court for the District of Columbia issued its decision in Coalition for Common Sense in Government Procurement v. United States, No. 08-996 (D.D.C. Oct. 25, 2011) upholding the DoD’s regulation. That case has been appealed to the United States Circuit Court for the District of Columbia. It is uncertain whether such appeal will be successful. In addition, the foregoing court decision does not impact our currently pending request for a waiver of the retroactive rebate. As of December 31, 2011, we determined that our payment of the retroactive rebate (from January 28, 2008 to May 26, 2009) created by the regulation is neither reasonably estimable nor probable.
FDA Complaint. In March 2011, we filed a CP with the FDA. The CP requested the FDA to refrain from granting tentative or final approval of any ANDA for bromfenac sodium ophthalmic solution 0.09% that utilizes the labeling for XIBROM, or omits any portion of the BROMDAY label relating to the once-per-day dosing. In May 2011, the FDA partially denied our CP and approved a generic version of XIBROM. In May 2011, we filed a Complaint in the United States District Court for the District of Columbia alleging that the FDA’s approval of a generic version of XIBROM was arbitrary, capricious, and contrary to law. We also filed papers seeking injunctive relief with respect to the FDA’s approval of a generic version of twice-daily XIBROM and relief from denial of our 2011 CP requesting that the FDA refrain from granting tentative or final approval of any ANDA that utilizes the labeling for XIBROM or omits any portion of the BROMDAY label relating to the once-per-day dosing. Although our request for a temporary injunction was denied by the Court in May 2011, our subsequent motion for summary judgment seeking revocation of the approval of the generic bromfenac product, as well as the FDA’s counter-motion for summary judgment, have been fully briefed before the Court.
In October 2010, we submitted a sNDA to add a 2.4 mL size to the already existing NDA approval for 1.7 mL size of BROMDAY. In February 2011, FDAs Center for Drug Evaluation and Research, or CDER, issued a Complete Response letter, stating that the sNDA could not be approved because a single bottle should not be used to treat more than one eye in a post-operative setting. In May 2011, we requested a hearing on the proposal to deny approval of the sNDA. In August 2011, CDER issue a Notice of Opportunity for a Hearing, proposing to deny approval of the 2.4 mL size.
29
Table of Contents
The FDA was required to hold the hearing or grant itself summary judgment by December 3, 2011. In November 2011, we contacted CDER, saying it had violated its own rules by not commencing the hearing in time to meet the December 3 deadline. FDA responded by saying that any ruling on the matter should be deferred until a meeting of FDAs Dermatologic and Ophthalmic Drugs Advisory Committee could be held on the issue of whether a single bottle should be used to treat more than one eye in a post-operative session. We then requested the FDA to grant summary judgment because of CDERs persistent refusal to act on this matter or that CDER be ordered to commence a hearing forthwith.
We are involved in other claims and legal proceedings incidental to our business from time to time. We do not believe that pending actions or proceedings, either individually or in the aggregate, will have a material adverse effect on our financial condition, results of operations or cash flows, and adequate provision has been made for the resolution of such actions and proceedings.
| Item 4: | Mine Safety Disclosures |
Not applicable
PART II
| Item 5: | Market for Registrant’s Common Equity, Related Stockholder Matters and Issuer Purchases of Equity Securities. |
Price Range of Common Stock
Our common stock is listed on The NASDAQ Global Market under the symbol “ISTA.” The following table shows the high and low sale prices for our common stock as reported by The NASDAQ Global Market during the calendar quarters indicated:
| High | Low | |||||||
| Year Ending December 31, 2010 |
||||||||
| First Quarter |
$ | 4.83 | $ | 3.40 | ||||
| Second Quarter |
4.14 | 2.08 | ||||||
| Third Quarter |
4.24 | 2.01 | ||||||
| Fourth Quarter |
5.25 | 3.91 | ||||||
| Year Ending December 31, 2011 |
||||||||
| First Quarter |
$ | 10.22 | $ | 5.11 | ||||
| Second Quarter |
11.39 | 6.72 | ||||||
| Third Quarter |
8.24 | 3.43 | ||||||
| Fourth Quarter |
7.14 | 2.88 | ||||||
| First Quarter 2012 (through February 9, 2012) |
||||||||
| First Quarter |
$ | 8.42 | $ | 6.82 | ||||
Holders of Common Stock
As of January 31, 2011, there were approximately 121 stockholders of record of our common stock based upon the records of our transfer agent, which do not include beneficial owners of common stock whose shares are held in the names of various securities brokers, dealers and registered clearing agencies.
Dividends
We have never declared or paid any cash dividends on our common stock and do not intend to pay any cash dividends on our common stock in the foreseeable future. The payment of cash dividends by us is restricted by our Facility Agreement and our Revolving Credit Facility which contain restrictions prohibiting us from paying any cash dividends without the lenders’ prior consent.
30
Table of Contents
Securities Authorized for Issuance Under Equity Compensation Plans
| Plan category |
(a) Number of securities to be issued upon exercise of outstanding options, warrants and rights |
(b) Weighted- average exercise price of outstanding options, warrants and rights |
(c) Number of securities remaining available for future issuance under equity compensation plans (excluding securities reflected in column (a) |
|||||||||
| Equity compensation plans approved by security holders (1) (2) |
10,274,782 | $ | 4.92 | 1,982,811 | ||||||||
| Equity compensation plans not approved by security holders (3) (4) |
6,956,921 | $ | 1.45 | — | ||||||||
|
|
|
|
|
|
|
|||||||
| Total |
17,231,703 | $ | 3.52 | 1,982,811 | ||||||||
|
|
|
|
|
|
|
|||||||
| (1) | On December 7, 2009, the stockholders approved the 2009 Employee Stock Purchase Plan, or 2009 ESPP, with 3,000,000 shares initially reserved and an increase each January 1, beginning January 1, 2011, in the number of shares reserved by the lesser of (i) of 1% of our outstanding common stock or (ii) an amount determined by the Compensation Committee; however, in no event will the number of shares reserved exceed the lesser of 10% of our outstanding common stock or 5,000,000 shares. The initial offering period commenced on January 1, 2010 and ended on June 30, 2010, with subsequent offering periods commencing on six-month intervals thereafter beginning on July 1, 2010. |
| (2) | On December 7, 2009, the stockholders approved the Fourth Amendment and Restatement of the 2004 Stock Plan, which increased the number of shares available by 6,000,000 shares to an aggregate of 12,153,107 shares, of which up to 1,450,000 shares may be issued in connection with restricted stock awards or performance share awards. |
| (3) | In June 2002, our Board granted our Vice President, Sales & Marketing, as an inducement to his employment, a stand-alone option agreement to purchase 30,000 shares of our common stock of for a purchase price of $8.50 per share. In August 2002, our Board granted our Vice President, Operations, as an inducement to his employment, a stand-alone option agreement to purchase 15,000 shares of our common stock for a purchase price of $6.90 per share. |
| (4) | In 2008, in conjunction with our Facility Agreement, we issued warrants to purchase an aggregate of 15 million shares of our common stock at an exercise price of $1.41 per share. Some of the warrant holders and their assignees exercised approximately 8.1 million warrants during 2011 and 6.9 million warrants remain outstanding as of December 31, 2011. The warrants expire on September 26, 2014. |
31
Table of Contents
Performance Graph
The following graph compares our total cumulative stockholder return as compared to The NASDAQ Global Market and U.S. index, or NASDAQ U.S. Index, and the NASDAQ Pharmaceutical Index for the period beginning on December 31, 2006 and ending on December 31, 2011. Total stockholder return assumes $100.00 invested at the beginning of the period in our common stock, the stocks represented by the NASDAQ U.S. Index and the NASDAQ Pharmaceutical Index, respectively. Total return assumes reinvestment of dividends as we have paid no dividends on our common stock.
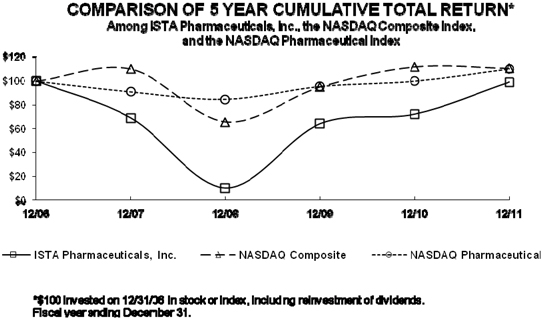
The material in the above performance graph does not constitute soliciting material and should not be deemed filed or incorporated by reference into any other Company filing, whether under the Securities Act of 1933, as amended, or the Securities Exchange Act of 1934, as amended, whether made on, before or after the date of this report and irrespective of any general incorporation language in such filing, except to the extent we specifically incorporate this performance graph by reference therein.
32
Table of Contents
| Item 6: | Selected Financial Data. |
The table below presents our selected consolidated financial data as of and for the years ended December 31, 2011, 2010, 2009, 2008 and 2007. The following selected consolidated financial data has been derived from our audited consolidated financial statements and should be read in conjunction with our consolidated financial statements contained herein, and related notes thereto, as well as our “Management’s Discussion and Analysis of Financial Condition and Results of Operations” included elsewhere in this Annual Report on Form 10-K.
| Years Ended December 31, | ||||||||||||||||||||
| (in thousands, except per share data) | ||||||||||||||||||||
| 2011 | 2010 | 2009 | 2008 | 2007 | ||||||||||||||||
| Consolidated Statement of Operations Data: |
||||||||||||||||||||
| Revenues: |
||||||||||||||||||||
| Product sales, net |
$ | 160,333 | $ | 156,525 | $ | 107,593 | $ | 82,798 | $ | 58,589 | ||||||||||
| License revenue |
— | — | 3,055 | 278 | 278 | |||||||||||||||
|
|
|
|
|
|
|
|
|
|
|
|||||||||||
| Total revenues |
160,333 | 156,525 | 110,648 | 83,076 | 58,867 | |||||||||||||||
| Cost of products sold |
39,109 | 37,608 | 27,278 | 21,947 | 15,864 | |||||||||||||||
|
|
|
|
|
|
|
|
|
|
|
|||||||||||
| Gross profit |
121,224 | 118,917 | 83,370 | 61,129 | 43,003 | |||||||||||||||
| Costs and expenses: |
||||||||||||||||||||
| Research and development |
31,628 | 25,929 | 24,904 | 32,400 | 32,492 | |||||||||||||||
| Selling, general and administrative |
89,577 | 82,631 | 56,377 | 53,539 | 46,603 | |||||||||||||||
|
|
|
|
|
|
|
|
|
|
|
|||||||||||
| Total costs and expenses |
121,205 | 108,560 | 81,281 | 85,939 | 79,095 | |||||||||||||||
|
|
|
|
|
|
|
|
|
|
|
|||||||||||
| Income (loss) from operations |
19 | 10,357 | 2,089 | (24,810 | ) | (36,092 | ) | |||||||||||||
| Other (expense) income: |
||||||||||||||||||||
| Interest income |
— | — | — | 714 | 2,141 | |||||||||||||||
| Interest expense |
(7,271 | ) | (8,307 | ) | (8,591 | ) | (8,100 | ) | (7,669 | ) | ||||||||||
| Loss on extinguishment of debt |
— | — | — | (2,497 | ) | — | ||||||||||||||
| (Loss) gain on derivative valuation |
(2,223 | ) | 130 | 1,177 | 26 | (197 | ) | |||||||||||||
| Loss on warrant valuation |
(47,139 | ) | (7,522 | ) | (52,066 | ) | — | — | ||||||||||||
| Other, net |
8 | 42 | (363 | ) | — | — | ||||||||||||||
|
|
|
|
|
|
|
|
|
|
|
|||||||||||
| Net loss |
$ | (56,606 | ) | $ | (5,300 | ) | $ | (57,754 | ) | $ | (34,667 | ) | $ | (41,817 | ) | |||||
|
|
|
|
|
|
|
|
|
|
|
|||||||||||
| Net loss per common share, basic and diluted |
$ | (1.47 | ) | $ | (0.16 | ) | $ | (1.74 | ) | $ | (1.05 | ) | $ | (1.41 | ) | |||||
|
|
|
|
|
|
|
|
|
|
|
|||||||||||
| Shares used in computing net loss per common share, basic and diluted |
38,610 | 33,440 | 33,228 | 33,028 | 29,621 | |||||||||||||||
|
|
|
|
|
|
|
|
|
|
|
|||||||||||
| As of December 31, | ||||||||||||||||||||
| (in thousands) | ||||||||||||||||||||
| 2011 | 2010 | 2009 | 2008 | 2007 | ||||||||||||||||
| Consolidated Balance Sheet Data: |
||||||||||||||||||||
| Cash, cash equivalents and short-term investments |
$ | 71,593 | $ | 78,777 | $ | 53,702 | $ | 53,016 | $ | 46,140 | ||||||||||
| Working capital |
2,265 | 15,822 | 29,113 | 31,500 | 32,686 | |||||||||||||||
| Total assets |
153,091 | 134,240 | 89,144 | 82,660 | 71,716 | |||||||||||||||
| Deferred income |
— | — | — | 3,055 | 3,333 | |||||||||||||||
| Convertible notes |
— | — | — | — | 40,253 | |||||||||||||||
| Facility agreement, net of current portion and unamortized discounts and derivatives |
21,975 | 38,706 | 57,438 | 55,157 | — | |||||||||||||||
| Warrant liability |
40,130 | 66,185 | 58,663 | — | — | |||||||||||||||
| Other long-term obligations |
2,205 | 2,410 | 325 | 450 | 407 | |||||||||||||||
| Accumulated deficit |
(459,178 | ) | (402,572 | ) | (397,272 | ) | (343,243 | ) | (308,576 | ) | ||||||||||
| Total stockholders’ equity (deficit) |
(49,073 | ) | (79,097 | ) | (78,028 | ) | (17,199 | ) | 3,881 | |||||||||||
33
Table of Contents
| Item 7: | Management’s Discussion and Analysis of Financial Condition and Results of Operations. |
This Annual Report on Form 10-K contains forward-looking statements that have been made pursuant to the provisions of the Private Securities Litigation Reform Act of 1995 and concern matters that involve risks and uncertainties that could cause actual results to differ materially from those projected in the forward-looking statements. Discussions containing forward-looking statements may be found in the material set forth under “Business,” “Management’s Discussion and Analysis of Financial Condition and Results of Operations” and in other sections of this Form 10-K. Words such as “may,” “will,” “should,” “could,” “expect,” “plan,” “anticipate,” “believe,” “estimate,” “predict,” “potential,” “continue” or similar words are intended to identify forward-looking statements, although not all forward-looking statements contain these words. Although we believe that our opinions and expectations reflected in the forward-looking statements are reasonable as of the date of this Annual Report on Form 10-K, we cannot guarantee future results, levels of activity, performance or achievements, and our actual results may differ substantially from the views and expectations set forth in this Annual Report on Form 10-K. We expressly disclaim any intent or obligation to update any forward-looking statements after the date hereof to conform such statements to actual results or to changes in our opinions or expectations. Readers are urged to carefully review and consider the various disclosures made by us, which attempt to advise interested parties of the risks, uncertainties, and other factors that affect our business, set forth in detail in Item 1A of Part I, under the heading “Risk Factors.”
The following discussion and analysis should be read in conjunction with our financial statements and the related notes to those statements contained elsewhere in this Annual Report on Form 10-K.
Overview
We are a rapidly growing commercial-stage, multi-specialty pharmaceutical company developing, marketing and selling our own products in the U.S. and Puerto Rico. We are the third largest branded prescription eye care business in the U.S. and have a growing allergy drug franchise. We have had success in obtaining product approvals for five prescription drugs in six years. We manufacture our finished good products through third-party contracts, and we in-license or acquire new products and technologies to add to our internal development efforts from time to time. Our products and product candidates seek to treat allergy and serious diseases of the eye and include therapies for ocular inflammation and pain, glaucoma, dry eye and ocular and nasal allergies. The U.S. prescription markets for 2011, which our therapies seek to address, include key segments of the $7.5 billion ophthalmic pharmaceutical market and the $2.5 billion nasal allergy market.
We currently have four products available for sale in the U.S. and Puerto Rico: BROMDAY, BEPREVE, ISTALOL and VITRASE. At the beginning of 2011, we had one additional product available for sale, twice-daily XIBROM.
We have incurred losses since inception and have a stockholders’ deficit of approximately $49.1 million through December 31, 2011.
Results of Operations
Years Ended December 31, 2011, 2010 and 2009
Revenues. Net revenues were approximately $160.3 million for 2011 as compared to $156.5 million in 2010 and $110.6 million in 2009. The increase in revenues in 2011 as compared to those recorded in 2010 is the result of higher revenues of BEPREVE, ISTALOL and VITRASE, partially offset by lower revenues from the BROMDAY/XIBROM franchise and due to the impact of higher managed care and government rebates, including $1.6 million for managed care rebates commonly known as donut-hole, which were not included in 2010. The increase in net revenues in 2011 for BEPREVE, ISTALOL and VITRASE is due to increases in units sold as well as increases in average selling price. Part of the increase is related to an increase in wholesaler inventory, however, we believe wholesaler inventory levels are within our range of expected ordinary levels. The decrease in the BROMDAY/XIBROM franchise is primarily due to a lower average selling price for BROMDAY as compared to XIBROM, the product it replaced, which had a higher average selling price due to two bottle sizes; partially offset by selling more units in 2011 as compared to in 2010. During the second half of 2011, we launched BROMDAY in a twin-pack configuration containing two bottles of BROMDAY priced at approximately double the single bottle price. We anticipate that the BROMDAY twin pack will increase the average price for BROMDAY over time. We recorded $5.4 million in net revenues for BROMDAY twin-pack configuration during the second half of 2011.
The increase in revenues in 2010 as compared to 2009 was the result of increased growth in prescription levels and market share for our core products, particularly for XIBROM, increased revenues from a full year of BEPREVE, increased revenues due to VITRASE gaining 100% market share and the launch of BROMDAY in the fourth quarter of 2010, offset by the elimination of license revenue that we earned in 2009.
34
Table of Contents
The following table sets forth our net revenues for each of our products for the years ended December 31, 2011, 2010, and 2009, respectively (dollars in millions):
| Years Ended December 31, | ||||||||||||
| 2011 | 2010 | 2009 | ||||||||||
| BROMDAY and XIBROM |
$ | 87.9 | $ | 105.8 | $ | 81.1 | ||||||
| BEPREVE |
28.6 | 15.7 | 1.7 | |||||||||
| ISTALOL |
28.3 | 22.0 | 18.8 | |||||||||
| VITRASE |
15.5 | 13.0 | 5.9 | |||||||||
|
|
|
|
|
|
|
|||||||
| Product sales, net |
160.3 | 156.5 | 107.5 | |||||||||
| License revenue |
— | — | 3.1 | |||||||||
|
|
|
|
|
|
|
|||||||
| Total revenues |
$ | 160.3 | $ | 156.5 | $ | 110.6 | ||||||
|
|
|
|
|
|
|
|||||||
Gross margin and cost of products sold. Gross margin for 2011 was 75% of net product revenues, or $121.2 million, as compared to 76% of net product revenues, or $118.9 million for 2010 and 75% of net product revenues, or $83.4 million, for 2009. The decrease in gross margin in 2011 as compared to 2010 is primarily impacted by lower revenues from the BROMDAY/XIBROM franchise and higher managed care and government rebates, partially offset by the result of continued increased growth in prescription levels and market share, particularly for BEPREVE, our higher gross margin product, and ISTALOL.
Cost of products sold was $39.1 million for 2011, $37.6 million in 2010 and $27.3 million in 2009. Cost of products sold for the three years consisted primarily of standard costs for each of our commercial products, distribution costs, royalties, inventory reserves and other costs of products sold. The increase in cost of products sold is primarily the result of increased net revenues.
Research and development expenses. Research and development expenses were $31.6 million in 2011, $25.9 million in 2010, and $24.9 million in 2009. The increase was primarily the result of an increase in clinical development costs, which include clinical investigator fees, study monitoring costs, data management costs, and manufacturing costs. During 2011, the increase in costs resulted from the completion of the Phase 3 clinical studies for PROLENSA, the completion of the Phase 3 efficacy and short-term safety dry eye trials for our dry eye program, the completion of the Phase 2 BEPOMAX clinical trials and the initiation of the Phase 2 clinical study for BEPOSONE. During 2010, the increase in costs as compared to 2009 resulted from the initiation of the Phase 3 efficacy and safety dry eye trials for our dry eye program and the initiation of BEPOMAX Phase 1/2 studies. Research and development expenses in 2009 included total milestone payments of $3.0 million to Senju for the FDA’s acceptance and approval of our BEPREVE NDA. Excluding these payments, recurring research and development expenses increased approximately $4.0 million in 2010, as compared to 2009. Research and development expenses in 2009 included costs associated with our BROMDAY and T-PRED trials and costs incurred to support our BEPREVE NDA. We expect clinical development costs to increase in 2012 as we plan to complete the BEPOSONE Mountain Cedar pollen trials, file the NDA for PROLENSA and initiate Phase 3 studies for T-PRED.
Our research and development expenses to date have consisted primarily of costs associated with the clinical trials of our product candidates, compensation and other expenses for research and development personnel, costs for consultants and contract research organizations and costs related to the development of commercial scale manufacturing capabilities for BROMDAY, BEPREVE, ISTALOL, VITRASE and XIBROM.
Generally, our research and development resources are not dedicated to a single project but are applied to multiple product candidates in our portfolio. As a result, we manage and evaluate our research and development expenditures generally by the type of costs incurred. We generally classify and separate research and development expenditures into amounts related to clinical development costs, regulatory costs, pharmaceutical development costs, manufacturing development costs and medical affairs costs. In addition, we also record as research and development expenses any up-front and milestone payments that have been accrued to third parties prior to regulatory approval of a product candidate under our licensing agreements unless there is an alternative future use. In 2011, 53% of our research and development expenditures were for clinical development costs, 13% were for regulatory costs, 4% were for pharmaceutical development costs, 8% were for manufacturing development costs, 19% were for medical affairs costs, and 3% for stock-based compensation costs ($1.0 million).
Changes in our research and development expenses in 2011 as compared to 2010 were primarily due to the following:
| • | Clinical Development Costs — Overall clinical development costs, which include clinical investigator fees, study monitoring costs and data management, were $16.6 million for 2011 as compared to $10.5 million for 2010, or an increase of $6.1 million. The increase in costs resulted from the completion of the Phase 3 clinical study for PROLENSA, the completion of the Phase 3 efficacy and safety dry eye trials for our dry eye program, the completion of the Phase 2 BEPOMAX clinical trials and the initiation of the Phase 2 clinical study for BEPOSONE, and costs incurred to support our BEPOSONE IND. |
35
Table of Contents
| • | Regulatory Costs — Regulatory costs, which include compliance expenses for existing products and other activity for pipeline projects, were $4.2 million in 2011 as compared to $4.0 million in 2010. The increase of $0.2 million was primarily due higher personnel costs. |
| • | Pharmaceutical Development Costs — Pharmaceutical development costs, which include costs related to the testing and development of our pipeline products, were $1.2 million and $1.3 million in 2011 and 2010, respectively. |
| • | Manufacturing Development Costs — Manufacturing development costs, which include costs related to production scale-up and validation, raw material qualification, and stability studies, were $2.7 million in 2011 compared to $3.3 million for 2010, or a decrease of $0.6 million. The decrease is primarily due to lower costs associated with stability and animal studies. |
| • | Medical Affairs Costs — Medical affairs costs, which include activities that relate to medical information in support of our products, were $5.9 million in 2011 as compared to $5.8 million for 2010. |
In 2010, approximately 40% of our research and development expenditures were for clinical development costs, 15% were for regulatory costs, 5% were for pharmaceutical development costs, 13% were for manufacturing development costs, 23% were for medical affairs costs, and approximately 4% for stock-based compensation costs ($1.0 million).
Changes in our research and development expenses in 2010 as compared to 2009 were primarily due to the following:
| • | Clinical Development Costs — Overall clinical development costs were $10.5 million for 2010 as compared to $8.0 million for 2009, or an increase of $2.5 million. The increase in costs resulted from the initiation of the Phase 3 efficacy and safety dry eye trials for our dry eye program, the initiation of BEPOMAX Phase 1/2 studies and initiation of a Phase 2 BEPOMAX clinical trial. Research and development expenses in 2009 included costs associated with our BROMDAY and T-PRED trials and costs incurred to support our BEPREVE NDA. |
| • | Regulatory Costs — Regulatory costs were $4.0 million in 2010 as compared to $5.0 million for 2009. The decrease of $1.0 million was primarily due to the costs incurred in 2009 for the preparation of our sNDA filing for BROMDAY and our participation in an FDA advisory panel for BEPREVE. |
| • | Pharmaceutical Development Costs — Pharmaceutical development costs were $1.3 million in both 2010 and 2009. |
| • | Manufacturing Development Costs — Manufacturing development costs were $3.3 million for 2010 as compared to $3.1 million for 2009, or an increase of $0.2 million. |
| • | Medical Affairs Costs — Medical affairs costs were $5.8 million for 2010, as compared to $3.3 million for 2009. The increase of $2.5 million was primarily due higher personnel related costs due to higher headcount and physician education programs and publications, offset by a decrease in post marketing clinical studies related to our existing commercial products. |
Our research and development activities reflect our efforts to advance our product candidates through the various stages of product development. The expenditures that will be necessary to execute our development plans are subject to numerous uncertainties, which may affect our research and development expenditures and capital resources. For instance, the duration and the cost of clinical trials may vary significantly depending on a variety of factors including a trial’s protocol, the number of patients in the trial, the duration of patient follow-up, the number of clinical sites in the trial, and the length of time required to enroll suitable study subjects. Even if earlier results are positive, we may obtain different results in later stages of development, including failure to show the desired safety or efficacy, which could impact our development expenditures for a particular product candidate. Although we spend a considerable amount of time planning our development activities, we may be required to deviate from our plan based on new circumstances or events or our assessment from time to time of a product candidate’s market potential, other product opportunities and our corporate priorities. Any deviation from our plan may require us to incur additional expenditures or accelerate or delay the timing of our development spending. Furthermore, as we obtain results from trials and review the path toward regulatory approval, we may elect to discontinue development of certain product candidates in certain indications, in order to focus our resources on more promising candidates or indications. As a result, the amount or ranges of estimable cost and timing to complete our product development programs and each future product development program is not estimable.
36
Table of Contents
Selling, general and administrative expenses. Selling, general and administrative expenses were $89.6 million in 2011, $82.6 in 2010 and $56.4 million in 2009. The $7.0 million increase in 2011 as compared to 2010 primarily reflect expenses of $8.5 million of higher legal costs, professional and other fees associated with the bromfenac royalty litigation, our complaint against the FDA regarding the approval of a generic version of XIBROM, pursuing a potential acquisition of a company and costs to review our strategic options; partially offset by $2.2 million of lower selling and marketing expenses, primarily due to costs incurred in 2010 to launch BROMDAY which were not incurred in 2011.
The $26.2 million increase in 2010 as compared to 2009 was primarily attributable to higher sales and marketing expenses associated with a full year of marketing BEPREVE and launching BROMDAY ($11.9 million), the addition of approximately 65 new sales representatives ($10.9 million) and an overall increase in administrative costs ($3.1 million).
Stock-based compensation costs. Total stock-based compensation costs for the years ended December 31, 2011, 2010, and 2009 were $4.3 million, $3.9 million and $3.8 million, respectively. For the year ended December 31, 2011, we granted options to employees to purchase 3.3 million shares of common stock at a weighted average exercise price of $4.57 per share, equal to the fair market value of our common stock at the time of grant. In addition to stock options, we also issued restricted stock awards. Stock-based compensation costs for the years ended December 31, 2011, 2010 and 2009 were $0.6 million, $0.5 million and $0.6 million, respectively, related to these restricted stock awards, and which are included in the total stock-based compensation costs described above. The following table sets forth our stock-based compensation costs for the years ended December 31, 2011, 2010 and 2009, respectively (dollars in millions):
| Years Ended December 31, | ||||||||||||
| 2011 | 2010 | 2009 | ||||||||||
| Selling, general and administrative |
$ | 3.3 | $ | 2.9 | $ | 2.6 | ||||||
| Manufacturing & research and development |
1.0 | 1.0 | 1.2 | |||||||||
|
|
|
|
|
|
|
|||||||
| Stock-based compensation costs |
$ | 4.3 | $ | 3.9 | $ | 3.8 | ||||||
|
|
|
|
|
|
|
|||||||
Interest expense. Interest expense was $7.3 million in 2011, $8.3 million in 2010 and $8.6 million in 2009. The components of interest expense are as follows (dollars in millions):
| Years Ended December 31, | ||||||||||||
| 2011 | 2010 | 2009 | ||||||||||
| Interest related to the Facility Agreement |
$ | 3.7 | $ | 4.2 | $ | 4.2 | ||||||
| Amortization of the discount on the Facility Agreement |
2.3 | 2.5 | 2.7 | |||||||||
| Amortization of deferred financing costs |
0.9 | 1.1 | 1.1 | |||||||||
| Amortization of derivative on the Facility Agreement |
0.2 | 0.3 | 0.4 | |||||||||
| Interest related to the Revolving Credit Facility |
0.2 | 0.2 | 0.2 | |||||||||
|
|
|
|
|
|
|
|||||||
| Interest expense |
$ | 7.3 | $ | 8.3 | $ | 8.6 | ||||||
|
|
|
|
|
|
|
|||||||
(Loss) gain on derivative valuation. We recorded a derivative loss for 2011 of $2.2 million and derivative valuation gains of $0.1 million in 2010 and $1.2 million in 2009. In 2011, the value of the derivative, which is related to certain change in control transactions under our Facility Agreement, increased as a result of our Board considering our strategic options. In 2010 and 2009, the gains were the result of decreases in the value of the derivative associated with the Facility Agreement.
Loss on warrant valuation. In 2011, we recorded a non-cash valuation loss of $47.1 million or $1.22 per diluted share as compared to a non-cash valuation loss of $7.5 million, or $0.22 per diluted share for 2010 and a non-cash valuation loss of $52.1 million, or $1.57 per diluted share in 2009. The change in the valuation of the warrants for the year ended December 31, 2011 was primarily driven by an increase in our stock price and an increase in related volatility, partially offset by the exercise of 8.1 million warrants by some of the Lenders and their assignees as we reclassified the relevant warrant liability to equity upon the issuance of the shares of common stock. The change in the valuation of the warrants for the years ended December 31, 2010 and 2009, respectively, were primarily driven by an increase in our stock price and an increase in related volatility.
Income taxes. We incurred net taxable losses for the years ended December 2011 and 2009, respectively. We generated net taxable income for the year ended December 31, 2010, primarily as a result of temporary differences related to accrued expenses and reserves. We utilized net operating loss carryforwards and research and development tax credits to offset our tax liabilities in 2010. At December 31, 2011, we had federal and California net operating loss carryforwards of approximately $123.0 million and $74.0 million, respectively. Our net operating loss carryforwards are limited due to previous ownership changes under Internal Revenue Code Section 382. We have established a valuation allowance against our federal and California net operating loss carryforwards due to the uncertainty of realization. Our federal tax loss carryforwards began to expire in 2011, and will continue to expire unless utilized. Our California tax loss carryforwards began to expire in 2012, and will continue to expire unless utilized. We also have federal and California research tax credit carryforwards of approximately $6.6 million and $6.4 million, respectively. The federal research tax credits began to expire in 2022, and will continue to expire unless utilized. Our California research tax credit carryforwards do not expire and will carryforward indefinitely until utilized.
37
Table of Contents
2012 Financial Outlook
We expect:
| • | our 2012 net revenues will be approximately $180 million to $195 million. As in previous years, our net revenues are seasonal, with first quarter net revenues typically being the lowest of the year and less than the prior quarter; |
| • | our 2012 gross margin will be in the range of 75% to 77% of net revenues; |
| • | our 2012 research and development expenses to be approximately 19% to 22% of net revenues, excluding legal and other costs to explore our strategic options depending upon the progress of our clinical programs; |
| • | our 2012 selling, general and administrative expenses to be approximately 45% to 49% of net revenues; |
| • | our 2012 adjusted cash net income will be $15 million to $19 million, or fully diluted earnings per share of $0.28 to $0.36. We define “adjusted cash net income” as our net income or loss adjusted for the non-cash mark-to-market adjustment relating to warrants and derivatives, plus non-cash interest expense, non-cash stock-based compensation and other non-recurring items. Once we are profitable, we expect our fully diluted common shares, including our outstanding shares of common stock, warrants and stock options on a treasury basis, will be approximately 53 million shares. |
| • | We expect our business to have at least $100 million in cash by the end of 2012, which includes repayment of debt of $21.5 million, and assumes no payments of past due royalties for XIBROM and BROMDAY and borrowings under our line of credit. |
Excluding the warrant valuation expense and other non-cash items, we expect 2012 to be our third year of profitability on an adjusted cash net income basis, but due to timing of revenues and expenses, we anticipate an adjusted cash net loss in the first quarter of 2012.
Liquidity and Capital Resources
As of December 31, 2011, we had $71.6 million in cash and working capital of $2.3 million. The second installment of our $65 million Facility Agreement is due in September 2012 and we anticipate making the $21.5 million principal repayment out of cash on hand. Historically, we have financed our operations primarily through sales of our debt and equity securities and cash receipts from product sales. Since March 2000, we have received gross proceeds of approximately $353 million from sales of our common stock, and the issuance of promissory notes and convertible debt.
Under our Revolving Credit Facility with Silicon Valley Bank, we may borrow up to the lesser of $25.0 million or 80% of eligible accounts receivable, plus the lesser of 25% of net cash or $10.0 million. As of December 31, 2011, we had $24.4 million available under the Revolving Credit Facility of which we borrowed $24 million. We also had letters of credit of $0.6 million outstanding. All outstanding amounts under the Revolving Credit Facility bear interest at a variable rate equal to the lender’s prime rate plus a margin of 0.25%. In no event shall the interest rate on outstanding borrowings be less than 4.25%, which is payable on a monthly basis. The Revolving Credit Facility also contains customary covenants regarding the operation of our business and financial covenants relating to ratios of current assets to current liabilities and is collateralized by all of our assets. An event of default under the Revolving Credit Facility will occur if, among other things, (i) we are delinquent in making payments of principal or interest on the Revolving Credit Facility; (ii) we fail to cure a breach of a covenant or term of the Revolving Credit Facility; (iii) we make a representation or warranty under the Revolving Credit Facility that is materially inaccurate; (iv) we are unable to pay our debts as they become due, certain bankruptcy proceedings are commenced or certain orders are granted against us, or we otherwise become insolvent; or (v) an acceleration event occurs under certain types of other indebtedness outstanding from time to time. If an event of default occurs, the indebtedness to Silicon Valley Bank could be accelerated, such that it becomes immediately due and payable. One of the covenants contained in the Revolving Credit Facility relates to the ratio of adjusted current assets to current liabilities. During the fourth quarter of 2011, we failed to meet this covenant, but we obtained a waiver of the covenant from Silicon Valley Bank. As of December 31, 2011, we are in compliance with all of the covenants under the Revolving Credit Facility. All amounts borrowed under the Revolving Credit Facility were repaid in January 2012. The Revolving Credit Facility expires on March 31, 2012. While we expect to renew the Revolving Credit Facility on terms substantially the same as the existing terms, there can be no assurance that we will be able to renew the Revolving Credit Facility or whether we would be able to renew the Revolving Credit Facility at substantially the same terms.
38
Table of Contents
We entered into a Facility Agreement, pursuant to which the Lenders loaned us $65 million. On December 31, 2011 we had total indebtedness under the Facility Agreement of $43.5 million, which excludes unamortized discounts of $2.5 million and the value of the derivative of $2.4 million.
Outstanding amounts under the Facility Agreement accrue interest at a rate of 6.5% per annum, payable quarterly in arrears. We are required to repay the Lenders 33% of the original principal amount (or $21.5 million) on September 26, 2012, and 34% of the original principal amount (or $22.0 million) on September 26, 2013.
Any amounts drawn under the Facility Agreement may become immediately due and payable upon (i) an “event of default,” as defined in the Facility Agreement, in which case the Lenders would have the right to require us to repay 100% of the principal amount of the loan, plus any accrued and unpaid interest thereon, or (ii) the consummation of certain change of control transactions, in which case the Lenders would have the right to require us to repay 110% of the outstanding principal amount of the loan, plus any accrued and unpaid interest thereon. An event of default under the Facility Agreement will occur if, among other things, (i) we fail to make payment when due; (ii) we fail to comply in any material respect with any covenant of the Facility Agreement, and such failure is not cured; (iii) any representation or warranty made by us in any transaction document was incorrect, false, or misleading in any material respect as of the date it was made; (iv) we are generally unable to pay our debts as they become due or a bankruptcy or similar proceeding is commenced by or against us; or (v) cash and cash equivalents on the last day of each calendar quarter are less than $10 million. The Facility Agreement also contains customary covenants regarding the operation of our business. As of December 31, 2011, we are in compliance with all the covenants under the Facility Agreement.
In connection with the Facility Agreement, we entered into a security agreement with the Lenders, pursuant to which, as security for our repayment obligations under the Facility Agreement, we granted to the Lenders a security interest in certain of our intellectual property, including intellectual property relating to BROMDAY, BEPREVE, ISTALOL, VITRASE, PROLENSA and XIBROM, and each other product marketed by or under license from us, and certain personal property relating thereto.
For the year ended December 31, 2011, we used $3.5 million in cash for operations, which was primarily the result of the increases in accounts receivables ($22.9 million), inventory ($0.6 million), other current assets ($2.0 million), other changes in operating assets and liabilities ($6.2 million); partially offset by increases in royalties payable ($15.5 million), accruals for rebates, chargebacks and returns ($9.9 million) and net income before non-cash charges. We incurred a net loss of $56.6 million, which included loss on warrant valuation ($47.1 million) and other non-cash charges ($12.2 million). Non-cash charges consisted primarily of stock-based compensation costs ($4.3 million), amortization of discounts on the Facility Agreement ($2.5 million), depreciation and amortization ($2.3 million), loss on derivative valuation ($2.2 million) and amortization of deferred financing costs ($0.9 million). For the year ended December 31, 2010, we generated $28.1 million of cash from operations, primarily the result of the increase in royalties payable of $18.2 million, an increase in accrued expenses of $11.0 million and other changes in operating assets and liabilities, offset by an increase in accounts receivable of $16.1 million. We incurred a net loss of $5.3 million, which included loss on warrant valuation ($7.5 million) and other non-cash charges of $9.1 million. Non-cash charges consisted primarily of stock-based compensation costs ($3.9 million), amortization of discounts on the Facility Agreement ($2.8 million), depreciation and amortization ($1.4 million) and amortization of deferred financing costs ($1.1 million), offset by a gain on derivative valuation ($0.1 million). During 2009, we generated $4.0 million of cash from operations. The cash generated from operations was primarily the result of non-cash charges ($59.8 million), change in operating assets and liabilities ($2.0 million), offset by a net loss ($57.8 million). Non-cash charges primarily include loss on warrant valuation ($52.1 million), stock-based compensation costs ($3.7 million), amortization of discounts on the Facility Agreement ($3.1 million), depreciation and amortization ($1.0 million), amortization of deferred financing costs ($1.1 million) and offset by the change in value of the derivative associated with the Facility Agreement ($1.2 million).
For the year ended December 31, 2011, we used cash of $2.3 million of cash from investing activities, primarily due to purchases of equipment ($1.9 million) and an increase in deposits ($0.4 million). For the year ended December 31, 2010, we used cash of $3.4 million of cash from investing activities, primarily due to our investments in leasehold improvements and purchases of equipment ($3.4 million). Net cash provided by investing activities totaled $3.4 million in 2009, primarily due to the maturities of our short-term investment securities ($4.7 million), offset by the purchase of equipment ($1.3 million).
For the year ended December 31, 2011, we used cash from financing activities of $1.4 million, primarily due to the repayment of the first installment against the Facility Agreement ($21.5 million), offset by net borrowings under our Revolving Credit Facility ( $11.0 million), exercises of warrants of $6.2 million, net exercises of stock options granted to our employees ($2.2 million) and issuance of stock to our employees under our Employee Stock Purchase Plan ($0.7 million). For the year ended December 31, 2010, we generated $0.4 million from financing activities, primarily from the issuance of common stock under our 2009 ESPP. Net cash used in financing activities totaled $2.0 million in 2009, primarily as a result of net repayments on our Revolving Credit Facility ($2.0 million).
39
Table of Contents
We believe that current cash and cash equivalents, together with amounts available for borrowing under our Revolving Credit Facility and cash generated from operations during 2012, will be sufficient to meet anticipated cash needs for operating and capital expenditures for at least the next twelve months.
However, our actual future capital requirements will depend on many factors, including the following:
| • | the success of the commercialization of our products; |
| • | our sales and marketing activities; |
| • | the expansion of our commercial infrastructure related to our approved products and product candidates; |
| • | the results of our clinical trials and requirements to conduct additional clinical trials; |
| • | the introduction of potential generic products; |
| • | the rate of progress of our research and development programs; |
| • | the time and expense necessary to obtain regulatory approvals; |
| • | activities and payments in connection with potential acquisitions of companies, products or technologies; |
| • | scheduled principal payments on our Facility Agreement and our Revolving Credit Facility; |
| • | the outcome of pending litigation; |
| • | competitive, technological, market and other developments; and |
| • | our ability to establish and maintain partnering relationships. |
Any or all of these factors may cause us to seek to raise additional funds through additional sales of our debt, or equity or other securities. There can be no assurance that funds from these sources will be available when needed or, if available, will be on terms favorable to us or to our stockholders. If additional funds are raised by issuing equity securities, the percentage ownership of our stockholders will be reduced, stockholders may experience additional dilution or such equity securities may provide for rights, preferences or privileges senior to those of the holders of our common stock. In May 2011, we filed a universal shelf registration statement on Form S-3 with the SEC. The registration statement has been declared effective by the SEC, and we will be able to offer and sell up to $150 million of any form of securities including, but not limited to, equity, debt and other securities as described in the registration statement. Our intent with respect to the registration statement is to provide us with flexibility for financing future growth through acquisitions and strategic transactions, and does not reflect a change in our financing strategy. At present, we have no specific plans to issue any form of securities under the registration statement.
We have incurred losses since inception and have never been profitable. While we currently anticipate becoming profitable in 2012 and beyond, we might not be able to achieve profitability or continue to remain profitable. We have incurred losses since inception and have a stockholders’ deficit of approximately $49.1 million at December 31, 2011.
Contractual Obligations
The following table summarizes our contractual obligations as of December 31, 2011 (in thousands):
| Total | Less than 1 year |
1-3 years |
3-5 years |
More than 5 years |
||||||||||||||||
| Operating lease obligations |
$ | 5,799 | $ | 1,066 | $ | 1,973 | $ | 1,895 | $ | 865 | ||||||||||
| Obligation under capital leases |
313 | 146 | 159 | 8 | — | |||||||||||||||
| Revolving credit facility |
24,012 | 24,012 | — | — | — | |||||||||||||||
| Facility agreement (1) |
47,080 | 23,918 | 23,162 | — | — | |||||||||||||||
|
|
|
|
|
|
|
|
|
|
|
|||||||||||
| Total: |
$ | 77,204 | $ | 49,142 | $ | 25,294 | $ | 1,903 | $ | 865 | ||||||||||
|
|
|
|
|
|
|
|
|
|
|
|||||||||||
| (1) | Includes $43.5 million in principal amount of our Facility Agreement, bearing 6.5% interest per annum payable quarterly in cash in arrears, but excludes unamortized discounts of $2.5 million and the value of the derivative of $2.4 million. The Facility Agreement expires September 2013. We are required to repay 33% of the original principal amount (or $21.5 million) on September 26, 2012, and 34% of the original amount outstanding (or $22 million) on September 26, 2013. |
40
Table of Contents
In addition to the above, we are committed to make potential future milestone payments to third-parties as part of our in-licensing and development programs. Milestone payments under these agreements generally become due and payable only upon achievement of certain development, regulatory and/or commercial milestones. Because the achievement of these milestones is neither probable nor reasonably estimable, such contingencies have not been recorded on our balance sheet. As of December 31, 2011, the maximum potential future milestone payments to third-parties was $32 million, including a milestone of $2 million upon achievement of $50 million cumulative net revenues of BEPREVE. Included in the $32 million are $12 million of future milestone payments related to products under development. We expect to pay a vendor the $2 million milestone in the first quarter of 2012.
Critical Accounting Policies and Estimates
Management’s discussion and analysis of financial condition and results of operations, as well as disclosures included elsewhere in this Annual Report on Form 10-K, are based upon our financial statements, which have been prepared in accordance with U.S. generally accepted accounting principles. Our significant accounting policies are described in the notes to the audited financial statements contained elsewhere in this Annual Report on Form 10-K. Included within these policies are our “critical accounting policies.” Critical accounting policies are those policies that are most important to the preparation of our financial statements and require management’s most subjective and complex judgment due to the need to make estimates about matters that are inherently uncertain. Although we believe that our estimates and assumptions are reasonable, actual results may differ significantly from these estimates. Changes in estimates and assumptions based upon actual results may have a material impact on our results of operations and/or financial condition.
We believe that the critical accounting policies that most impact the financial statements are as described below.
Revenue Recognition
Product Revenues. We recognize revenues from product sales when there is persuasive evidence that an arrangement exists, when title has passed, the price is fixed or determinable, and we are reasonably assured of collecting the resulting receivable. We recognize product revenues net of estimated allowances for rebates, chargebacks, product returns and other discounts, such as wholesaler fees. If actual future payments for allowances for discounts, product returns, wholesaler fees, rebates and chargebacks materially exceed the estimates we made at the time of sale, our financial position, results of operations and cash flows may be negatively impacted.
We establish allowances for estimated rebates, chargebacks and product returns based on numerous qualitative and quantitative factors, including:
| • | the number of agreements with customers and specific contractual terms; |
| • | the estimated level of units in the distribution channel; |
| • | historical rebates, chargebacks and returns of products; |
| • | direct communication with customers; |
| • | anticipated introduction of competitive products or generics; |
| • | anticipated pricing strategy changes by us and/or our competitors; |
| • | analysis of prescription data gathered by a third-party prescription data provider; |
| • | the impact of wholesaler distribution agreements; |
| • | the impact of changes in state and federal regulations; and |
| • | the estimated remaining shelf-life of products. |
In our analyses, we utilize on-hand unit data purchased from the major wholesalers, as well as prescription data purchased from a third-party data provider, to develop estimates of sales by wholesalers to pharmacies and others. We utilize an internal analysis to compare, on a historical basis, net product shipments versus both estimated prescriptions written and product returns. Based on such analysis, we develop an estimate of the quantity of product which may be subject to various discounts, product returns, rebates, chargebacks and wholesaler fees.
We record estimated allowances for rebates, chargebacks, product returns and other discounts, such as wholesaler fees, in the same period when revenue is recognized. The objective of recording the allowances for such deductions at the time of sale is to provide a reasonable estimate of the aggregate amount of credit to our direct customers or payments to our indirect customers. Customers typically process their claims for allowances such as early pay discounts promptly, usually within the established payment terms. We monitor actual credit memos issued to our customers and compare such actual amounts to the estimated provisions, in the aggregate, for each allowance category to assess the reasonableness of the various reserves at each balance sheet date. Differences between our estimated allowances and actual credits issued have not been significant, and are accounted for in the current period as a change in estimate.
41
Table of Contents
In general, we are obligated to accept from our customers the return of products that have reached their expiration date. We authorize returns for damaged products, expiring and expired products in accordance with our return goods policy and procedures, and have established reserves for such amounts at the time of sale. We typically refund the agreed proportion of the sales price by the issuance of a credit, rather than a cash refund or exchange for inventory, and the returned product is destroyed. With the launch of each of our products, we record a sales return allowance, which is larger for stocking orders than subsequent re-orders. To date, actual product returns have not exceeded our estimated allowances for returns. Although we believe that our estimates and assumptions are reasonable as of the date made, actual results may differ significantly from these estimates.
We identify product returns by their manufacturing lot number. Because we manufacture in bulk, lot sizes can be large and, as a result, sales of any individual lot may occur over several periods. As a result, we are unable to specify if actual returns or credits relate to a sale that occurred in the current period or a prior period, and therefore, we cannot specify how much of the allowance recorded relates to sales made in prior periods. Since there have been no material differences between estimates recorded and actual credits issued, we believe our systems and procedures are adequate for managing our business.
Allowances for product returns were $9.1 million and $8.6 million as of December 31, 2011and 2010, respectively. These allowances reflect an estimate of our liability for products that may be returned by the original purchaser in accordance with our stated return policy, which allows customers to return products within six months of their respective expiration dates and for a period up to twelve months after such products have reached their respective expiration dates. We estimate our liability for product returns at each reporting period based on the estimated units in the channel and the other factors discussed above. As a percentage of gross product revenues, the reserve for product returns was 2.6%, 2.6% and 3.7% for the years ended December 31, 2011, 2010 and 2009, respectively. The decrease in the percentage between 2010 and 2009 is due to lower product returns, improved product shelf life, continued acceptance and sale of our products.
We also periodically offer promotional discounts to our existing customer base. These discounts are usually calculated as a percentage of the current published list price. Accordingly, the discounts are recorded as a reduction of revenue in the period that the program is offered. In addition to promotional discounts, at the time we implement a price increase, we generally offer our existing customers an opportunity to purchase a limited quantity of products at the previous list price. Shipments resulting from these programs generally are not in excess of ordinary levels and therefore, we recognize the related revenue upon receipt by the customer and include the sale in estimating our various product-related allowances. In the event we determine that these sales represent purchases of inventory in excess of ordinary levels for a given wholesaler, the potential impact on product returns exposure would be specifically evaluated and reflected as a reduction to revenue at the time of such sale. Near the end of 2011, we had one such purchase for which we determined the purchase to be in excess of ordinary levels and deferred $1.9 million in product revenues. We believe the wholesalers did not have excess inventory on hand at December 31, 2011 and 2010, respectively.
Allowances for estimated rebates and chargebacks were $18.7 million and $9.3 million as of December 30, 2011 and 2010, respectively. Other discounts, such as wholesaler fees and prompt pay discounts, were $5.7 million and $5.0 million as of December 31, 2011 and 2010, respectively. These allowances reflect an estimate of our liability for items such as rebates due to various governmental organizations under the Medicare/Medicaid regulations, rebates due to managed care organizations under specific contracts, chargebacks due to various organizations purchasing certain of our products through federal contracts and/or group purchasing agreements and fees charged by certain wholesalers under distribution agreements. We estimate our liability for rebates, chargebacks and other discounts, such as wholesaler fees, at each reporting period based on the assumptions described above.
As a percentage of gross product revenues, the allowance for rebates, chargebacks and other discounts such as wholesaler fees was 22.2%, 17.6% and 14.7% for the years ended December 31, 2011, 2010 and 2009, respectively, which are included in other accrued expenses on the balance sheets. The increase is primarily due to growth in the number and utilization of managed care contracts, federal contracts, and wholesaler distribution agreements and the impact of higher Medicaid and Medicare rebates required under the recent healthcare legislation. For the year ended December 31, 2011, we recorded estimated new Medicare rebates required under the legislation, commonly known as donut-hole rebates, of $1.6 million.
License Revenue. Amounts received for product and technology license fees under multiple-element arrangements are deferred and recognized over the period of such services or performance if such arrangements require on-going services or performance. Amounts received for milestones are recognized upon achievement of the milestone, unless we have ongoing performance obligations. Any amounts received prior to satisfying our revenue recognition criteria will be recorded as deferred income in the accompanying condensed balance sheets.
Inventory
Inventories, net of allowances, are stated at the lower of cost or market. Cost is determined by the first-in, first-to-expire method.
42
Table of Contents
Inventory is reviewed periodically for slow-moving or obsolete status. We adjust our inventory to reflect situations in which the cost of inventory is not expected to be recovered. We would record a reserve to adjust inventory to its net realizable value if: (i) a launch of a new product is delayed, inventory may not be fully utilized and could be subject to impairment, (ii) when a product is close to expiration and not expected to be sold, (iii) when a product has reached its expiration date or (iv) when a product is not expected to be saleable. In determining the reserves for these products, we consider factors such as the amount of inventory on hand and its remaining shelf life, and current and expected market conditions, including management forecasts and levels of competition. We have evaluated the current level of inventory considering historical trends and other factors, and based on our evaluation, have recorded adjustments to reflect inventory at its net realizable value. These adjustments are estimates, which could vary significantly from actual results if future economic conditions, customer demand, competition or other relevant factors differ from expectations. These estimates require us to make assessments about the future demand for our products in order to categorize the status of such inventory items as slow-moving, obsolete or in excess-of-need. These future estimates are subject to the ongoing accuracy of our forecasts of market conditions, industry trends, competition and other factors. Differences between our estimated reserves and actual inventory adjustments have not been significant, and are accounted for in the current period as a change in estimate.
Costs incurred for the manufacture of validation batches for pre-approval products are recorded as research and development expenses in the period in which those costs are incurred.
Stock-based Compensation
We recognize compensation costs for all stock-based awards made to employees and directors. The fair value of stock-based awards is estimated at grant date using an option pricing model and the portion that is ultimately expected to vest is recognized as compensation cost over the requisite service period.
Since stock-based compensation is recognized only for those awards that are ultimately expected to vest, we have applied an estimated forfeiture rate to unvested awards for the purpose of calculating compensation cost. These estimates will be revised, if necessary, in future periods if actual forfeitures differ from estimates. Changes in forfeiture estimates impact compensation cost in the period in which the change in estimate occurs.
We use the Black-Scholes option-pricing model to estimate the fair value of stock-based awards. The determination of fair value using the Black-Scholes option-pricing model is affected by our stock price as well as assumptions regarding a number of complex and subjective variables, including expected stock price volatility, risk-free interest rate, expected dividends and projected employee stock option exercise behaviors. We estimate the expected term based on the contractual term of the awards and employees’ exercise and expected post-vesting termination behavior.
At December 31, 2011, there was $11.8 million of total unrecognized compensation cost related to non-vested stock options, which is expected to be recognized over a remaining weighted average vesting period of approximately 3.3 years.
Income Taxes
We record a full valuation allowance to reduce our deferred tax assets to the amount that is more likely than not to be realized. While we have considered future taxable income and ongoing prudent and feasible tax planning strategies in assessing the need for the valuation allowance, in the event we were to determine that we would be able to realize our deferred tax assets in the future in excess of its net recorded amount, an adjustment to the deferred tax asset would increase income in the period such determination was made.
Our practice is to recognize interest and/or penalties related to income tax matters in income tax expense. We had no accrual for interest or penalties on our balance sheets at December 31, 2011 and 2010, respectively and have not recognized interest and/or penalties in the statement of operations for the year ended December 31, 2011.
We are subject to taxation in the U.S. and various state jurisdictions. Our tax years for 2008 and forward are subject to examination by federal tax authorities, as are the years 2007 and forward by state tax authorities. Net operating loss carryforwards from the years 1996 forward are also subject to adjustment.
New Accounting Pronouncements
In June 2011, the Financial Accounting Standards Board, or the FASB issued Accounting Standards Update No. 2011-05 as amended by ASU 2011-12 which revised ASC 220 “Comprehensive Income.” The revisions increase the prominence of items reported in other comprehensive income, or OCI, by eliminating the option to present OCI as part of the statement of changes in shareholders’ equity. The amendments in this standard require that all non-owner changes in shareholders’ equity be presented either in a single continuous statement of comprehensive income or in two separate but consecutive statements. The ASUs do not change the current option for presenting components of OCI gross or net of the effect of income taxes, provided that such tax effects are presented in the statement in which OCI is presented or disclosed in the notes to the financial statements. Additionally, the standard does not affect the calculation or reporting of earnings per share. For public entities, the amendments are effective for fiscal years, and interim periods within those years, beginning after December 15, 2011 and are to be applied retrospectively, with early adoption permitted. The adoption of this guidance is not expected to have a material impact on our financial position or results of operations.
43
Table of Contents
In May 2011, the FASB updated the accounting guidance on alignment of disclosures for Generally Accepted Accounting Principles, or GAAP, and the International Financial Reporting Standards, or IFRS, by updating Topic 820 entitled “Amendments to Achieve Common Fair Value Measurement and Disclosure Requirements in U.S. GAAP and IFRS”, relating to presentation of fair value measurements reported in financial statements. The updated guidance requires companies to align fair value measurement and disclosure requirements between GAAP and IFRS. The updated guidance is effective beginning in our fiscal 2012 year and earlier adoption is not permitted. The adoption of this guidance is not expected to have a material impact on our financial position or results of operations.
| Item 7A: | Quantitative and Qualitative Disclosures About Market Risk. |
The primary objective of our investment policy is to preserve principal while at the same time maximizing the income we receive from our investments without significantly increasing risk. Some of the securities that we had invested in had market risk, where a change in prevailing interest rates could cause the principal amount of the investment to fluctuate. For example, if we hold a security that was issued with a fixed interest rate at the then-prevailing rate and the prevailing interest rate later increases, the principal amount of our investment will probably decline. Seeking to minimize this risk, we maintain our portfolio of cash equivalents and short-term investments in a variety of securities, including commercial paper, money market funds, government and non-government debt securities. When our cash is invested in short-term investments, the average duration is usually less than one year. At December 31, 2011, all our cash and cash equivalents were maintained in cash or invested into U.S. Treasury Funds. All of our cash is held in non-interest bearing accounts.
All outstanding amounts under our Revolving Credit Facility bear interest at a variable rate equal to the lender’s prime rate plus a margin of 0.25%. In no event shall the interest rate on outstanding borrowings be less than 4.25%. Interest is payable on a monthly basis and may expose us to market risk due to changes in interest rates. As of December 31, 2011, we had $24.0 million outstanding under our Revolving Credit Facility. The interest rate at December 31, 2011 was 4.25%. A 10% change in interest rates on our Revolving Credit Facility would not have had a material effect on our net loss for the year ended December 31, 2011.
We have operated primarily in the U.S. Accordingly, we have not had any significant exposure to foreign currency rate fluctuations.
| Item 8: | Financial Statements and Supplementary Data. |
The financial statements and supplementary data required by this item are set forth on the pages indicated in Item 15(a).
| Item 9: | Changes in and Disagreements with Accountants on Accounting and Financial Disclosure. |
None
44
Table of Contents
| Item 9A: | Controls and Procedures. |
Evaluation of Disclosure Controls and Procedures
Our management, with the participation and under the supervision of our Chief Executive Officer and Chief Financial Officer, has evaluated the effectiveness of our disclosure controls and procedures (as defined in Rules 13(a) – 15(e) and 15(d) – 15(e) under the Securities Exchange Act of 1934, as amended, or the Exchange Act) as of the end of the period covered by this Annual Report on Form 10-K. The Chief Executive Officer and Chief Financial Officer have concluded, based on their evaluation of these controls and procedures, that our disclosure controls and procedures were effective as of the end of the period covered by this Annual Report on Form 10-K to provide reasonable assurance that information required to be disclosed by us in our Exchange Act reports is recorded, processed, summarized and reported within the time periods specified in applicable SEC rules and forms. A controls system, no matter how well designed and operated, cannot provide absolute assurance that the objectives of the controls are met, and no evaluation of controls can provide absolute assurance that all controls and instances of fraud, if any, within a company have been detected.
Changes in Internal Control over Financial Reporting and Remediation Plans
We have not made any significant changes to our internal control over financial reporting (as defined in Rules 13a-15(f) and 15d-15(f) under the Exchange Act) during the year ended December 31, 2011 that have materially affected, or are reasonably likely to materially affect, our internal control over financial reporting.
Management’s Report on Internal Control over Financial Reporting
Our management is responsible for establishing and maintaining adequate internal control over financial reporting. Internal control over financial reporting is defined in Rule 13a-15(f) or 15d-15(f) promulgated under the Exchange Act as a process designed by, or under the supervision of, our principal executive and principal financial officers and effected by our Board, management and other personnel, to provide reasonable assurance regarding the reliability of financial reporting and the preparation of financial statements for external purposes in accordance with generally accepted accounting principles, and includes those policies and procedures that:
| • | pertain to the maintenance of records that in reasonable detail accurately and fairly reflect the transactions and dispositions of our assets; |
| • | provide reasonable assurance that transactions are recorded as necessary to permit preparation of financial statements in accordance with generally accepted accounting principles, and that our receipts and expenditures are being made only in accordance with authorizations of our management and directors; and |
| • | provide reasonable assurance regarding prevention or timely detection of unauthorized acquisition, use or disposition of our assets that could have a material effect on the financial statements. |
Because of its inherent limitations, internal control over financial reporting may not prevent or detect misstatements. Projections of any evaluation of effectiveness to future periods are subject to the risk that controls may become inadequate because of changes in conditions, or that the degree of compliance with the policies or procedures may deteriorate.
Our management assessed the effectiveness of our internal control over financial reporting as of December 31, 2011. In making this assessment, management used the criteria set forth by the Committee of Sponsoring Organizations of the Treadway Commission in Internal Control-Integrated Framework.
Based on our assessment, management believes that, as of December 31, 2011, our internal control over financial reporting is effective based on those criteria.
Our independent registered public accounting firm has issued a report on our assessment of our internal control over financial reporting. This report appears below.
There was no change in our internal control over financial reporting that occurred during our most recently completed fiscal quarter that materially affected, or is reasonably likely to materially affect, our internal control over financial reporting.
45
Table of Contents
Report of Independent Registered Public Accounting Firm
To the Board of Directors and Stockholders of ISTA Pharmaceuticals, Inc.
We have audited ISTA Pharmaceuticals, Inc.’s (the “Company”) internal control over financial reporting as of December 31, 2011, based on criteria established in Internal Control—Integrated Framework issued by the Committee of Sponsoring Organizations of the Treadway Commission (the “COSO criteria”). ISTA Pharmaceuticals, Inc.’s management is responsible for maintaining effective internal control over financial reporting and for its assessment of the effectiveness of internal control over financial reporting included in the accompanying Management’s Report on Internal Control over Financial Reporting. Our responsibility is to express an opinion on the effectiveness of the Company’s internal control over financial reporting based on our audit.
We conducted our audit in accordance with the standards of the Public Company Accounting Oversight Board (United States). Those standards require that we plan and perform the audit to obtain reasonable assurance about whether effective internal control over financial reporting was maintained in all material respects. Our audit included obtaining an understanding of internal control over financial reporting, assessing the risk that a material weakness exists, and testing and evaluating the design and operating effectiveness of internal control based on the assessed risk. Our audit also included performing such other procedures as we considered necessary in the circumstances. We believe that our audit provides a reasonable basis for our opinion.
A company’s internal control over financial reporting is a process designed to provide reasonable assurance regarding the reliability of financial reporting and the preparation of financial statements for external purposes in accordance with generally accepted accounting principles. A company’s internal control over financial reporting includes those policies and procedures that (1) pertain to the maintenance of records that, in reasonable detail, accurately and fairly reflect the transactions and dispositions of the assets of the Company; (2) provide reasonable assurance that transactions are recorded as necessary to permit preparation of financial statements in accordance with general accepted accounting principles, and that receipts and expenditures of the Company are being made only in accordance with authorizations of management and directors of the Company; and (3) provide reasonable assurance regarding prevention or timely detection of unauthorized acquisition, use, or disposition of the Company’s assets that could have a material effect on the financial statements. Because of its inherent limitations, internal control over financial reporting may not prevent or detect misstatements. Also, projections of any evaluation of effectiveness to future periods are subject to the risk that controls may become inadequate because of changes in conditions, or that the degree of compliance with the policies or procedures may deteriorate.
In our opinion, ISTA Pharmaceuticals, Inc. maintained, in all material respects, effective internal control over financial reporting as of December 31, 2011, based on the COSO criteria.
We also have audited, in accordance with the standards of the Public Company Accounting Oversight Board (United States), the consolidated balance sheet of ISTA Pharmaceuticals, Inc. as of December 31, 2011, and the related consolidated statements of operations, stockholders’ deficit, and cash flows for the year then ended and our report dated February 27, 2012 expressed an unqualified opinion thereon.
| /s/ BDO USA LLP | ||
Costa Mesa, California
February 27, 2012
46
Table of Contents
PART III
| Item 10. | Directors, Executive Officers and Corporate Governance |
In accordance with Instruction G (3) to Form 10-K, the information required by this Item will be provided in an amendment to this Annual Report on Form 10-K to be filed not later than 120 days after the end of the fiscal year covered by this Annual Report on Form 10-K.
| Item 11. | Executive Compensation |
In accordance with Instruction G (3) to Annual Report on Form 10-K, the information required by this Item will be provided in an amendment to this Annual Report on Form 10-K to be filed not later than 120 days after the end of the fiscal year covered by this Annual Report on Form 10-K.
| Item 12. | Security Ownership of Certain Beneficial Owners and Management and Related Stockholder Matters |
In accordance with Instruction G (3) to Annual Report on Form 10-K, the information required by this Item will be provided in an amendment to this Annual Report on Form 10-K to be filed not later than 120 days after the end of the fiscal year covered by this Annual Report on Form 10-K, with the exception of the information regarding securities authorized for issuance under our equity compensation plans, which is set forth in Item 5 of this Annual Report on Form 10-K under the heading “Equity Compensation Plans” and is incorporated herein by reference.
| Item 13. | Certain Relationships and Related Transactions, and Director Independence |
In accordance with Instruction G (3) to Annual Report on Form 10-K, the information required by this Item will be provided in an amendment to this Annual Report on Form 10-K to be filed not later than 120 days after the end of the fiscal year covered by this Annual Report on Form 10-K.
| Item 14. | Principal Accounting Fees and Services |
In accordance with Instruction G (3) to Annual Report on Form 10-K, the information required by this Item will be provided in an amendment to this Annual Report on Form 10-K to be filed not later than 120 days after the end of the fiscal year covered by this Annual Report on Form 10-K.
Consistent with Section 10A (i) (2) of the Exchange Act , as added by Section 202 of the Sarbanes-Oxley Act of 2002, we are responsible for listing the non-audit services approved by our Audit Committee to be performed by BDO USA LLP, our independent registered public accounting firm. Non-audit services are defined as services other than those provided in connection with an audit or a review of our financial statements. The Audit Committee has approved BDO USA LLP for non-audit services related to the preparation of federal and state income tax returns, and tax advice in preparing for and in connection with such filings.
47
Table of Contents
PART IV
| Item 15: | Exhibits and Financial Statement Schedules. |
(a) Financial Statements
(1) Index to Financial Statements
The financial statements required by this item are submitted in a separate section beginning on page F-1 of this report.
FINANCIAL STATEMENTS OF ISTA PHARMACEUTICALS, INC.
| Report of Independent Registered Public Accounting Firm |
F-2 | |||
| Balance Sheets as of December 31, 2011 and 2010 |
F-3 | |||
| Statements of Operations for the years ended December 31, 2011, 2010 and 2009 |
F-4 | |||
| Statements of Stockholders’ Deficit for the years ended December 31, 2011, 2010 and 2009 |
F-5 | |||
| Statements of Cash Flows for the years ended December 31, 2011, 2010 and 2009 |
F-6 | |||
| Notes to Financial Statements |
F-7 |
(2) Financial Statement Schedules
Schedule II — Valuation and Qualifying Accounts
This financial statement schedule should be read in conjunction with the financial statements. Financial statement schedules not included in this Annual Report on Form 10-K have been omitted because they are not applicable or the required information is shown in the financial statements or notes thereto.
(3) Exhibits
See Exhibit Index
48
Table of Contents
SIGNATURES
Pursuant to the requirements of Section 13 or 15(d) of the Securities Exchange Act of 1934, the registrant has duly caused this registration statement to be signed on its behalf by the undersigned, thereunto duly authorized, in the City of Irvine, State of California, on February 27, 2012.
| ISTA PHARMACEUTICALS, INC. | ||
| By: | /S/ VICENTE ANIDO, JR., PH.D. | |
| Vicente Anido, Jr., Ph.D. | ||
| President and Chief Executive Officer | ||
POWER OF ATTORNEY
Each person whose signature appears below constitutes and appoints each of Vicente Anido, Jr., Ph.D. and Lauren P. Silvernail as his or her attorney-in-fact, with full power of substitution, for him or her in any and all capacities, to sign any amendments to this Form 10-K, and to file the same, with all exhibits thereto and other documents in connection therewith, with the Securities and Exchange Commission, hereby ratifying and confirming all that each attorney-in-fact, or his substitute, may do or cause to be done by virtue hereof.
Pursuant to the requirements of the Securities Exchange Act of 1934, this Form 10-K has been signed by the following persons in the capacities and on the dates indicated.
| Signature |
Title |
Date | ||
| /S/ VICENTE ANIDO, JR., PH.D. Vicente Anido, Jr., Ph.D. |
President, Chief Executive Officer and Director | February 27, 2012 | ||
| /s/ LAUREN P. SILVERNAIL Lauren P. Silvernail |
Chief Financial Officer and Vice President, Corporate Development |
February 27, 2012 | ||
| /s/ RICHARD C. WILLIAMS Richard C. Williams |
Director (Chairman of the Board of Directors) | February 27, 2012 | ||
| /s/ PETER BARTON HUTT Peter Barton Hutt |
Director | February 27, 2012 | ||
| /s/ BENJAMIN F. MCGRAW III Benjamin F. McGraw III |
Director | February 27, 2012 | ||
| /s/ DEAN J. MITCHELL Dean J. Mitchell |
Director | February 27, 2012 | ||
| /s/ ANDREW J. PERLMAN Andrew J. Perlman |
Director | February 27, 2012 | ||
| /s/ WAYNE I. ROE Wayne I. Roe |
Director | February 27, 2012 | ||
49
Table of Contents
ISTA PHARMACEUTICALS, INC.
F-1
Table of Contents
REPORT OF INDEPENDENT REGISTERED PUBLIC ACCOUNTING FIRM
The Board of Directors and Stockholders of ISTA Pharmaceuticals, Inc.
We have audited the accompanying balance sheets of ISTA Pharmaceuticals, Inc. as of December 31, 2011 and 2010, and the related statements of operations, stockholders’ deficit, and cash flows for each of the years ended December 31, 2011, 2010 and 2009. Our audits also included the 2011, 2010 and 2009 information included in the schedule listed in the accompanying index. These financial statements and schedule are the responsibility of the Company’s management. Our responsibility is to express an opinion on these financial statements and schedule based on our audits.
We conducted our audits in accordance with the standards of the Public Company Accounting Oversight Board (United States). Those standards require that we plan and perform the audits to obtain reasonable assurance about whether the financial statements and schedule are free of material misstatement. An audit includes examining, on a test basis, evidence supporting the amounts and disclosures in the financial statements. An audit also includes assessing the accounting principles used and significant estimates made by management, as well as evaluating the overall presentation of the financial statements and schedule. We believe that our audits provide a reasonable basis for our opinion.
In our opinion, the financial statements referred to above present fairly, in all material respects, the financial position of ISTA Pharmaceuticals, Inc. at December 31, 2011 and 2010, and the results of its operations and its cash flows for each of the years ended December 31, 2011, 2010 and 2009, in conformity with accounting principles generally accepted in the United States of America. Also, in our opinion, the 2011, 2010 and 2009 information in the schedule presents fairly, in all material respects, the information set forth therein.
We also have audited, in accordance with the standards of the Public Company Accounting Oversight Board (United States), ISTA Pharmaceuticals, Inc.’s internal control over financial reporting as of December 31, 2011, based on criteria established in Internal Control – Integrated Framework issued by the Committee of Sponsoring Organizations of the Treadway Commission and our report dated February 27, 2012 expressed an unqualified opinion thereon.
| /s/ BDO USA LLP |
Costa Mesa, California
February 27, 2012
F-2
Table of Contents
BALANCE SHEETS
(in thousands, except per share data)
| December 31, | ||||||||
| 2011 | 2010 | |||||||
| ASSETS | ||||||||
| Current assets: |
||||||||
| Cash and cash equivalents |
$ | 71,593 | $ | 78,777 | ||||
| Accounts receivable, net of allowances of $1 at December 31, 2011 and 2010, respectively |
56,364 | 33,497 | ||||||
| Inventory, net of allowances of $1,076 and $1,275 at December 31, 2011 and 2010, respectively |
6,718 | 6,130 | ||||||
| Other current assets |
5,444 | 3,454 | ||||||
|
|
|
|
|
|||||
| Total current assets |
140,119 | 121,858 | ||||||
| Property and equipment, net |
10,137 | 10,352 | ||||||
| Deferred financing costs, net |
947 | 1,885 | ||||||
| Deposits and other assets |
1,888 | 145 | ||||||
|
|
|
|
|
|||||
| Total assets |
$ | 153,091 | $ | 134,240 | ||||
|
|
|
|
|
|||||
| LIABILITIES AND STOCKHOLDERS’ DEFICIT | ||||||||
| Current liabilities: |
||||||||
| Accounts payable |
$ | 4,564 | $ | 4,158 | ||||
| Accrued compensation and related expenses |
5,071 | 6,428 | ||||||
| Revolving Credit Facility |
24,000 | 13,000 | ||||||
| Current portion of Facility Agreement |
21,450 | 21,450 | ||||||
| Current portion of obligations under capital leases |
114 | 143 | ||||||
| Allowance for rebates and chargebacks |
18,690 | 9,273 | ||||||
| Allowance for product returns |
9,128 | 8,623 | ||||||
| Royalties payable |
41,074 | 25,567 | ||||||
| Other accrued expenses |
13,763 | 17,394 | ||||||
|
|
|
|
|
|||||
| Total current liabilities |
137,854 | 106,036 | ||||||
| Deferred rent and other long term liabilities |
2,055 | 2,287 | ||||||
| Obligations under capital leases |
150 | 123 | ||||||
| Facility Agreement, net of current portion and unamortized discounts and derivatives |
21,975 | 38,706 | ||||||
| Warrant liability |
40,130 | 66,185 | ||||||
|
|
|
|
|
|||||
| Total liabilities |
202,164 | 213,337 | ||||||
|
|
|
|
|
|||||
| Commitments and Contingencies |
||||||||
| Stockholders’ deficit: |
||||||||
| Preferred stock, $0.001 par value; 5,000 shares authorized of which 1,000 shares have been designated as Series A Participating Preferred Stock at December 31, 2011 and 2010; no shares issued and outstanding |
— | — | ||||||
| Common stock, $0.001 par value; 100,000 shares authorized at December 31, 2011 and 2010; 41,607 and 33,589 shares issued and outstanding at December 31, 2011 and 2010, respectively |
42 | 33 | ||||||
| Additional paid-in capital |
410,063 | 323,442 | ||||||
| Accumulated deficit |
(459,178 | ) | (402,572 | ) | ||||
|
|
|
|
|
|||||
| Total stockholders’ deficit |
(49,073 | ) | (79,097 | ) | ||||
|
|
|
|
|
|||||
| Total liabilities and stockholders’ deficit |
$ | 153,091 | $ | 134,240 | ||||
|
|
|
|
|
|||||
See accompanying notes.
F-3
Table of Contents
STATEMENTS OF OPERATIONS
(in thousands, except per share data)
| Years Ended December 31, | ||||||||||||
| 2011 | 2010 | 2009 | ||||||||||
| Revenues: |
||||||||||||
| Product sales, net |
$ | 160,333 | $ | 156,525 | $ | 107,593 | ||||||
| License revenue |
— | — | 3,055 | |||||||||
|
|
|
|
|
|
|
|||||||
| Total revenues |
160,333 | 156,525 | 110,648 | |||||||||
| Cost of products sold |
39,109 | 37,608 | 27,278 | |||||||||
|
|
|
|
|
|
|
|||||||
| Gross profit |
121,224 | 118,917 | 83,370 | |||||||||
|
|
|
|
|
|
|
|||||||
| Costs and expenses: |
||||||||||||
| Research and development |
31,628 | 25,929 | 24,904 | |||||||||
| Selling, general and administrative |
89,577 | 82,631 | 56,377 | |||||||||
|
|
|
|
|
|
|
|||||||
| Total costs and expenses |
121,205 | 108,560 | 81,281 | |||||||||
|
|
|
|
|
|
|
|||||||
| Income from operations |
19 | 10,357 | 2,089 | |||||||||
| Other (expense) income: |
||||||||||||
| Interest expense |
(7,271 | ) | (8,307 | ) | (8,591 | ) | ||||||
| (Loss) gain on derivative valuation |
(2,223 | ) | 130 | 1,177 | ||||||||
| Loss on warrant valuation |
(47,139 | ) | (7,522 | ) | (52,066 | ) | ||||||
| Other, net |
8 | 42 | (363 | ) | ||||||||
|
|
|
|
|
|
|
|||||||
| Total other expense |
(56,625 | ) | (15,657 | ) | (59,843 | ) | ||||||
|
|
|
|
|
|
|
|||||||
| Net loss |
$ | (56,606 | ) | $ | (5,300 | ) | $ | (57,754 | ) | |||
|
|
|
|
|
|
|
|||||||
| Net loss per common share, basic and diluted |
$ | (1.47 | ) | $ | (0.16 | ) | $ | (1.74 | ) | |||
|
|
|
|
|
|
|
|||||||
| Shares used in computing net loss per common share, basic and diluted |
38,610 | 33,440 | 33,228 | |||||||||
|
|
|
|
|
|
|
|||||||
See accompanying notes.
F-4
Table of Contents
STATEMENTS OF STOCKHOLDERS’ DEFICIT
(in thousands, except share data)
| Common Stock | Additional Paid-in Capital |
Accumulated Other Comprehensive Loss |
Accumulated Deficit |
Total Stockholders’ (Deficit) |
||||||||||||||||||||
| Shares | Amount | |||||||||||||||||||||||
| Balance at December 31, 2008 |
33,079,277 | $ | 33 | $ | 326,036 | $ | (25 | ) | $ | (343,243 | ) | $ | (17,199 | ) | ||||||||||
| Issuance of common stock from exercises of stock options |
52,425 | — | 166 | — | — | 166 | ||||||||||||||||||
| Restricted stock issuances |
139,213 | — | — | — | — | — | ||||||||||||||||||
| Common stock issued under ESPP |
20,208 | — | 12 | — | — | 12 | ||||||||||||||||||
| Warrant classification to liability |
— | — | (10,741 | ) | — | 3,725 | (7,016 | ) | ||||||||||||||||
| Stock-based compensation costs |
— | — | 3,738 | — | — | 3,738 | ||||||||||||||||||
| Net loss |
— | — | — | — | (57,754 | ) | (57,754 | ) | ||||||||||||||||
| Foreign currency translation adjustment |
25 | — | 25 | |||||||||||||||||||||
|
|
|
|
|
|
|
|||||||||||||||||||
| Comprehensive loss |
— | — | — | 25 | (57,754 | ) | (57,729 | ) | ||||||||||||||||
|
|
|
|
|
|
|
|
|
|
|
|
|
|||||||||||||
| Balance at December 31, 2009 |
33,291,123 | 33 | 319,211 | — | (397,272 | ) | (78,028 | ) | ||||||||||||||||
| Issuance of common stock from exercises of stock options |
37,142 | — | 81 | — | — | 81 | ||||||||||||||||||
| Restricted stock issuances |
113,688 | — | — | — | — | — | ||||||||||||||||||
| Common stock issued under ESPP |
147,382 | — | 288 | — | — | 288 | ||||||||||||||||||
| Stock-based compensation costs |
— | — | 3,862 | — | — | 3,862 | ||||||||||||||||||
| Net loss |
— | — | — | — | (5,300 | ) | (5,300 | ) | ||||||||||||||||
|
|
|
|
|
|
|
|||||||||||||||||||
| Comprehensive loss |
— | — | — | — | (5,300 | ) | (5,300 | ) | ||||||||||||||||
|
|
|
|
|
|
|
|
|
|
|
|
|
|||||||||||||
| Balance at December 31, 2010 |
33,589,335 | 33 | 323,442 | — | (402,572 | ) | (79,097 | ) | ||||||||||||||||
| Reduction of common stock due to unvested restricted stock awards |
(377,039 | ) | — | — | — | — | — | |||||||||||||||||
| Net issuance of common stock from exercises of stock options |
561,632 | 2 | 2,241 | — | — | 2,243 | ||||||||||||||||||
| Restricted stock issuances |
101,456 | — | — | — | — | — | ||||||||||||||||||
| Issuance of common stock from warrant exercise |
7,594,502 | 6 | 6,230 | — | — | 6,236 | ||||||||||||||||||
| Transfer of warrant liability to additional paid-in capital upon exercises of warrants |
— | — | 73,194 | — | — | 73,194 | ||||||||||||||||||
| Common stock issued under ESPP |
137,016 | 1 | 710 | — | — | 711 | ||||||||||||||||||
| Stock-based compensation costs |
— | — | 4,246 | — | — | 4,246 | ||||||||||||||||||
| Net loss |
— | — | — | — | (56,606 | ) | (56,606 | ) | ||||||||||||||||
|
|
|
|
|
|
|
|||||||||||||||||||
| Comprehensive loss |
— | — | — | — | (56,606 | ) | (56,606 | ) | ||||||||||||||||
|
|
|
|
|
|
|
|
|
|
|
|
|
|||||||||||||
| Balance at December 31, 2011 |
41,606,902 | $ | 42 | $ | 410,063 | $ | — | $ | (459,178 | ) | $ | (49,073 | ) | |||||||||||
|
|
|
|
|
|
|
|
|
|
|
|
|
|||||||||||||
See accompanying notes.
F-5
Table of Contents
STATEMENTS OF CASH FLOWS
(in thousands)
| Years Ended December 31, | ||||||||||||
| 2011 | 2010 | 2009 | ||||||||||
| OPERATING ACTIVITIES |
||||||||||||
| Net loss |
$ | (56,606 | ) | $ | (5,300 | ) | $ | (57,754 | ) | |||
| Adjustments to reconcile net loss to net cash (used in) provided by operating activities: |
||||||||||||
| Stock-based compensation costs |
4,277 | 3,862 | 3,738 | |||||||||
| Amortization of deferred financing costs |
938 | 1,072 | 1,115 | |||||||||
| Amortization of discounts on Facility Agreement |
2,495 | 2,848 | 3,038 | |||||||||
| Change in value of warrants related to Facility Agreement |
47,139 | 7,522 | 52,066 | |||||||||
| Change in value of derivatives related to Facility Agreement |
2,223 | (130 | ) | (1,177 | ) | |||||||
| Depreciation and amortization |
2,304 | 1,386 | 1,047 | |||||||||
| Loss (gain) on disposition of assets |
5 | (23 | ) | — | ||||||||
| Changes in operating assets and liabilities: |
||||||||||||
| Accounts receivable, net |
(22,867 | ) | (16,063 | ) | (2,192 | ) | ||||||
| Inventory, net |
(588 | ) | (582 | ) | (3,259 | ) | ||||||
| Other current assets |
(1,990 | ) | (279 | ) | (1,025 | ) | ||||||
| Accounts payable |
406 | (1,694 | ) | 466 | ||||||||
| Accrued compensation and related expenses |
(1,357 | ) | (1,303 | ) | 3,786 | |||||||
| Allowance for rebates and chargebacks |
9,417 | 4,494 | 2,705 | |||||||||
| Allowance for product returns |
505 | 3,114 | 2,268 | |||||||||
| Royalties payable |
15,507 | 18,219 | 1,481 | |||||||||
| Other accrued expenses |
(5,031 | ) | 10,990 | 1,082 | ||||||||
| Deferred rent and other long-term liabilities |
(263 | ) | (37 | ) | (343 | ) | ||||||
| Deferred income |
— | — | (3,055 | ) | ||||||||
|
|
|
|
|
|
|
|||||||
| Net cash (used in) provided by operating activities |
(3,486 | ) | 28,096 | 3,987 | ||||||||
|
|
|
|
|
|
|
|||||||
| INVESTING ACTIVITIES |
||||||||||||
| Maturities of marketable securities |
— | — | 4,700 | |||||||||
| Purchases of equipment |
(1,910 | ) | (3,440 | ) | (1,317 | ) | ||||||
| Deposits and other assets |
(343 | ) | 67 | (5 | ) | |||||||
|
|
|
|
|
|
|
|||||||
| Net cash (used in) provided by investing activities |
(2,253 | ) | (3,373 | ) | 3,378 | |||||||
|
|
|
|
|
|
|
|||||||
| FINANCING ACTIVITIES |
||||||||||||
| Proceeds from exercises of warrants |
6,236 | — | — | |||||||||
| Net proceeds from exercises of stock options |
2,243 | 81 | 166 | |||||||||
| Payments under capital leases |
(185 | ) | (17 | ) | (139 | ) | ||||||
| Repayments on Facility Agreement |
(21,450 | ) | — | — | ||||||||
| Proceeds from Revolving Credit Facility |
121,000 | 52,000 | 52,000 | |||||||||
| Repayments on Revolving Credit Facility |
(110,000 | ) | (52,000 | ) | (54,000 | ) | ||||||
| Proceeds from issuance of common stock for ESPP |
711 | 288 | 12 | |||||||||
| Financing costs on issuance of Facility Agreement |
— | — | (43 | ) | ||||||||
|
|
|
|
|
|
|
|||||||
| Net cash (used in) provided by financing activities |
(1,445 | ) | 352 | (2,004 | ) | |||||||
|
|
|
|
|
|
|
|||||||
| Effect of exchange rate changes on cash |
— | — | 25 | |||||||||
| (Decrease) increase in cash and cash equivalents |
(7,184 | ) | 25,075 | 5,386 | ||||||||
| Cash and cash equivalents at beginning of year |
78,777 | 53,702 | 48,316 | |||||||||
|
|
|
|
|
|
|
|||||||
| Cash and cash equivalents at end of year |
$ | 71,593 | $ | 78,777 | $ | 53,702 | ||||||
|
|
|
|
|
|
|
|||||||
| SUPPLEMENTAL DISCLOSURE OF CASH FLOW INFORMATION: |
||||||||||||
| Cash paid during the year for interest |
$ | 4,081 | $ | 4,393 | $ | 4,307 | ||||||
| Equipment additions under capital leases |
$ | 183 | $ | 151 | $ | 118 | ||||||
| Transfer of warrant liability to additional paid-in capital upon exercises of warrants |
$ | 73,194 | $ | — | $ | — | ||||||
|
|
|
|
|
|
|
|||||||
See accompanying notes.
F-6
Table of Contents
NOTES TO FINANCIAL STATEMENTS
1. Organization and Summary of Significant Accounting Policies
The Company
ISTA Pharmaceuticals, Inc. (“ISTA”, the “Company”, or “we”) was incorporated as Advanced Corneal Systems, Inc. in California in February 1992 to discover, develop and market new remedies for diseases and conditions of the eye. In March 2000, we changed our name to ISTA Pharmaceuticals, Inc., and we reincorporated in Delaware in August 2000. BROMDAY™, BEPREVE®, ISTALOL®, VITRASE®, XIBROM (bromfenac ophthalmic solution)®, XIBROM™, T-PRED™, PROLENSA™, BEPOSONE™, BEPOMAX™, ISTA®, ISTA Pharmaceuticals, Inc.® and the ISTA logo are our trademarks, either owned or under license.
We are a rapidly growing commercial-stage, multi-specialty pharmaceutical company developing, marketing and selling our own products in the United States, or the U.S., and Puerto Rico. We are the third largest branded prescription eye care business in the U.S. and have a growing allergy drug franchise. We have had success in obtaining product approvals for five prescription drugs in six years. We manufacture our finished good products through third-party contracts, and we in-license or acquire new products and technologies to add to our internal development efforts from time to time. Our products and product candidates seek to treat allergy and serious diseases of the eye and include therapies for ocular inflammation and pain, glaucoma, dry eye and ocular and nasal allergies.
We currently have four products available for sale in the U.S. and Puerto Rico: once-daily BROMDAY (bromfenac ophthalmic solution) 0.09%, for the treatment of postoperative inflammation and reduction of ocular pain in patients who have undergone cataract extractions, or BROMDAY, BEPREVE (bepotastine besilate ophthalmic solution) 1.5%, for the treatment of ocular itching associated with allergic conjunctivitis, ISTALOL (timolol maleate ophthalmic solution) 0.05%, for the treatment of glaucoma and VITRASE (hyaluronidase injection) ovine, 200 USP units/ml, for use as a spreading agent. At the beginning of 2011, we had one additional product available for sale, twice-daily XIBROM (bromfenac ophthalmic solution) 0.09%, a topical non-steroidal anti-inflammatory formulation of bromfenac for the treatment of ocular inflammation and pain following cataract surgery, or XIBROM. Due to the rapid adoption of BROMDAY, we stopped shipping XIBROM in February 2011. At that time, we anticipated wholesalers would continue to sell XIBROM to pharmacies until their inventories were depleted. As of December 31, 2011, the wholesalers’ inventories were depleted.
Basis of Presentation
We have incurred losses since inception and have a stockholders’ deficit of approximately $49.1 million at December 31, 2011.We believe that our existing capital resources as well as our anticipated future operations will enable us to fund operations for at least the next twelve months.
Use of Estimates
The preparation of financial statements in conformity with U.S. generally accepted accounting principles requires us to make estimates and assumptions that affect the amounts reported in the financial statements and accompanying notes. Actual results could differ significantly from those estimates. Our significant estimates include, among others, our estimates for product returns, rebates and chargebacks, the fair value of our financial instruments, stock-based compensation, royalty obligations and litigation related matters.
F-7
Table of Contents
Reclassifications
Certain comparative prior year amounts in the Financial Statements and accompanying notes may have been reclassified to conform to the current year presentation. These reclassifications had no effect on previously reported operating expenses or net loss.
Fair Value of Financial Instruments
Our financial instruments include cash and cash equivalents, accounts receivable, accounts payable, accrued liabilities, current and long-term debt, certain derivatives related to our debt obligations and common stock warrants issued to lenders. The carrying amount of cash and cash equivalents, accounts receivable, accounts payable, and accrued liabilities are considered to be representative of their respective fair values because of the short-term nature of those instruments. The carrying amount of our revolving credit facility with Silicon Valley Bank, or Revolving Credit Facility, approximates fair value since the interest rate approximates the market rate for debt securities with similar terms and risk characteristics. Although our facility agreement, or the Facility Agreement, with certain institutional accredited investors, collectively known as the Lenders, is considered a financial instrument, we are unable to reasonably determine fair value.
Cash and Cash Equivalents
Cash and cash equivalents consist of cash in banks and short-term investments with maturities of three months or less when purchased. Cash equivalents are carried at cost, which we believe approximates fair value because of the short-term maturity of these instruments. Cash and cash equivalents are maintained at financial institutions and, at times, balances may exceed federally insured limits. We have never experienced any losses related to these balances. All of our non-interest bearing cash balances were fully insured at December 31, 2011, due to a temporary federal program in effect from December 31, 2010 through December 31, 2012. Under the program, there is no limit to the amount of insurance for eligible accounts. Beginning 2013, insurance coverage will revert to $250,000 per depositor at each financial institution, and our non-interest bearing cash balances may exceed federally insured limits. At December 31, 2011 and 2010, we had invested $15 million and $60 million, respectively in short-term, low interest rate U.S. Treasury Funds.
Concentration of Credit Risk and Customers
Financial instruments that potentially subject us to a significant concentration of credit risk principally consist of cash and cash equivalents, and trade receivables. Wholesale distributors account for a substantial portion of trade receivables. Accounts receivables from Cardinal Health, Inc., McKesson HBOC and AmeriSource Bergen Corp. accounted for 40%, 41% and 15% respectively, of our 2011 total accounts receivables as compared to 43%, 37% and 14%, respectively, of our 2010 total accounts receivables. We maintain reserves for bad debt and such losses, in the aggregate, have not exceeded our estimates.
Sales to Cardinal Health, Inc., McKesson HBOC and AmeriSource Bergen Corp. accounted for 39%, 37% and 18% of our net revenues for the year ended December 31, 2011; 40%, 36% and 16% of our net revenues for the year ended December 31, 2010; and 35%, 40% and 17% of our net revenues for the year ended December 31, 2009.
Inventory
Inventories, net of allowances, are stated at the lower of cost or market. Cost is determined by the first-in, first-to- expire method.
Inventory is reviewed periodically for slow-moving or obsolete status. We adjust our inventory to reflect situations in which the cost of inventory is not expected to be recovered. We would record a reserve to adjust inventory to its net realizable value if: (i) a launch of a new product is delayed, inventory may not be fully utilized and could be subject to impairment, (ii) when a product is close to expiration and not expected to be sold, (iii) when a product has reached its expiration date or (iv) when a product is not expected to be saleable. In determining the reserves for these products, we consider factors such as the amount of inventory on hand and its remaining shelf life, and current and expected market conditions, including management forecasts and levels of competition. We have evaluated the current level of inventory considering historical trends and other factors, and based on our evaluation, have recorded adjustments to reflect inventory at its net realizable value. These adjustments are estimates, which could vary significantly from actual results if future economic conditions, customer demand, competition or other relevant factors differ from expectations. These estimates require us to make assessments about the future demand for our products in order to categorize the status of such inventory items as slow-moving, obsolete or in excess-of-need. These future estimates are subject to the ongoing accuracy of our forecasts of market conditions, industry trends, competition and other factors. Differences between our estimated reserves and actual inventory adjustments have not been significant, and are accounted for in the current period as a change in estimate.
F-8
Table of Contents
Costs incurred for the manufacture of validation batches for pre-approval products are recorded as research and development expenses in the period in which those costs are incurred.
Property and Equipment
Property and equipment are recorded at cost. Equipment and furniture are depreciated using the straight-line method over their estimated useful lives (generally three to seven years) and leasehold improvements are amortized using the straight-line method over the estimated useful life of the asset or the lease term, whichever is shorter. Equipment acquired under capital leases is amortized over the estimated useful life of the assets and included in depreciation expense. Leasehold improvements contributed by the lessor are capitalized and depreciated over the period of the lease and the contributions are recorded as deferred rent and amortized over the term of the lease as a reduction to rent expense.
Long-lived Assets
If indicators of impairment exist, we assess the recoverability of the affected long-lived assets by determining whether the carrying value of such assets can be recovered through undiscounted future operating cash flows. If impairment is indicated, we measure the amount of such impairment by comparing the fair value to the carrying value. We believe the future cash flows to be received from the long-lived assets will exceed the assets’ carrying value, and accordingly, we have not recognized any impairment losses through December 31, 2011.
Deferred Financing Costs
In connection with the issuance of our Facility Agreement, we paid financing costs, which consisted primarily of placement agent fees, accounting, legal and filing fees which are being amortized over the life of the debt. Amortization of the deferred financing costs using the effective interest method was $0.9 million, $1.1 million and $1.1 million for the years ended December 31, 2011, 2010 and 2009, respectively, and were included in interest expense. As of December 31, 2011 and 2010, deferred financing costs, net of accumulated amortization were approximately $1.0 million and $1.9 million, respectively.
Revolving Credit Facility
Under our Revolving Credit Facility, we may borrow up to the lesser of $25.0 million or 80% of eligible accounts receivable, plus the lesser of 25% of net cash or $10.0 million. As of December 31, 2011, we had $24.4 million available under the Revolving Credit Facility of which we borrowed $24 million. We also had letters of credit of $0.6 million outstanding. All outstanding amounts under the Revolving Credit Facility bear interest at a variable rate equal to the lender’s prime rate plus a margin of 0.25%. In no event shall the interest rate on outstanding borrowings be less than 4.25%, which is payable on a monthly basis. The Revolving Credit Facility also contains customary covenants regarding the operation of our business and financial covenants relating to ratios of current assets to current liabilities and is collateralized by all of our assets. An event of default under the Revolving Credit Facility will occur if, among other things, (i) we are delinquent in making payments of principal or interest on the Revolving Credit Facility; (ii) we fail to cure a breach of a covenant or term of the Revolving Credit Facility; (iii) we make a representation or warranty under the Revolving Credit Facility that is materially inaccurate; (iv) we are unable to pay our debts as they become due, certain bankruptcy proceedings are commenced or certain orders are granted against us, or we otherwise become insolvent; or (v) an acceleration event occurs under certain types of other indebtedness outstanding from time to time. If an event of default occurs, the indebtedness to Silicon Valley Bank could be accelerated, such that it becomes immediately due and payable. One of the covenants contained in the Revolving Credit Facility relates to the ratio of adjusted current assets to current liabilities. During the fourth quarter of 2011, we failed to meet this covenant, but we obtained a waiver of the covenant from Silicon Valley Bank. As of December 31, 2011, we are in compliance with all of the covenants under the Revolving Credit Facility. All amounts borrowed under the Revolving Credit Facility were repaid in January 2012. The Revolving Credit Facility expires on March 31, 2012. While we expect to renew the Revolving Credit Facility on terms substantially the same as the existing terms, there can be no assurance that we will be able to renew the Revolving Credit Facility or whether we would be able to renew the Revolving Credit Facility at substantially the same terms.
Facility Agreement
In 2008, we entered into a Facility Agreement, pursuant to which the Lenders loaned us $65 million. On December 31, 2011 we had total indebtedness under the Facility Agreement of $43.5 million, which excludes unamortized discounts of $2.5 million and the value of the derivative of $2.4 million.
Outstanding amounts under the Facility Agreement accrue interest at a rate of 6.5% per annum, payable quarterly in arrears. We are required to repay the Lenders 33% of the original principal amount (or $21.5 million) on September 26, 2012, and 34% of the original principal amount (or $22.0 million) on September 26, 2013.
F-9
Table of Contents
Any amounts drawn under the Facility Agreement may become immediately due and payable upon (i) an “event of default,” as defined in the Facility Agreement, in which case the Lenders would have the right to require us to repay 100% of the principal amount of the loan, plus any accrued and unpaid interest thereon, or (ii) the consummation of certain change of control transactions, in which case the Lenders would have the right to require us to repay 110% of the outstanding principal amount of the loan, plus any accrued and unpaid interest thereon. An event of default under the Facility Agreement will occur if, among other things, (i) we fail to make payment when due; (ii) we fail to comply in any material respect with any covenant of the Facility Agreement, and such failure is not cured; (iii) any representation or warranty made by us in any transaction document was incorrect, false, or misleading in any material respect as of the date it was made; (iv) we are generally unable to pay our debts as they become due or a bankruptcy or similar proceeding is commenced by or against us; or (v) cash and cash equivalents on the last day of each calendar quarter are less than $10 million. The Facility Agreement also contains customary covenants regarding operations of our business. As of December 31, 2011, we are in compliance with all the covenants under the Facility Agreement.
Because the consummation of certain change in control transactions results in a premium of the outstanding principal, the premium put feature is a derivative that is required to be bifurcated from the host debt instrument and recorded at fair value at each quarter end. The value of the derivative, which is related to certain change in control transactions under our Facility Agreement, increases or decreases as a result of the probability of the existence of a change in control. In 2011, the value of the derivative increased as a result of our Board of Directors, or our Board, considering our strategic options. The value of the derivative at December 31, 2011 was $2.4 million, is marked-to-market and adjusted quarterly through other expense.
In 2008, we issued to the Lenders warrants to purchase an aggregate of 15 million shares of our common stock at an exercise price of $1.41 per share. If we issue or sell shares of our common stock (other than certain “excluded shares,” as such term is defined in the Facility Agreement), we will issue concurrently therewith additional warrants to purchase such number of shares of common stock as will entitle the Lenders to maintain the same beneficial ownership in the Company after the issuance as they had prior to such issuance, as adjusted on a pro rata basis for repayments of the outstanding principal amount under the loan, with such warrants being issued at an exercise price equal to the greater of $1.41 per share and the closing price of the common stock on the date immediately prior to the issuance.
In 2009, as required by the Derivatives and Hedging Topic of the FASB Accounting Standards Codification, which provides requirements to determine whether the warrants are indexed to the Company’s stock, we classified our warrants as a liability, specifically because of the anti-dilutive provisions in the warrant agreement, where additional warrants might be issued should we issue additional equity, with such additional warrants being issued at a price equal to the fair value of the common stock being issued, but not less than $1.41. The cumulative effect was a $10.7 million reduction to additional paid-in capital for the original value of warrants, partially offset by a decrease in accumulated deficit of $3.7 million to reflect the change in the value of the warrants at December 31, 2008.
Additionally, the warrants are marked to market and adjusted quarterly. We recorded non-cash valuation losses of $47.1 million or $1.22 per diluted share, $7.5 million, or $0.22 per diluted share and $52.1 million, or $1.57 per diluted share for the years ended December 31, 2011, 2010 and 2009, respectively. The change in the valuation of the warrants was primarily driven by changes in our stock price, related volatility and the weighted average number of warrants outstanding. During the year ended December 31, 2011, some of the Lenders and their assignees exercised a total of 8.1 million warrants, of which a portion were exercised for cash and a portion were exercised on a cashless basis. The change in the valuation of the warrants for the years ended December 31, 2010 and 2009 was primarily driven by an increase in our stock price and an increase in related volatility.
Commitments and Contingencies
We are subject to routine claims and litigation incidental to our business. In the opinion of management, the resolution of such claims is not expected to have a material adverse effect on our operating results or financial position.
Income Taxes
We account for income taxes under the provision of Accounting Standards Codification 740, “Income Taxes”, or ASC 740. As of December 31, 2011 and 2010, there were no unrecognized tax benefits included in the balance sheet that would, if recognized, affect the effective tax rate. Our practice is to recognize interest and/or penalties related to income tax matters in income tax expense. We had no accrual for interest or penalties on our balance sheets at December 31, 2011 and 2010, respectively, and have not recognized interest and/or penalties in the statement of operations for the year ended December 31, 2011. We are subject to taxation in the U.S. and various state jurisdictions.
F-10
Table of Contents
Supply Concentration Risks
Some materials used in our products are currently obtained from a single source.
We have a supply agreement with Senju Pharmaceuticals Co. Ltd., or Senju, for bepotastine besilate, which is the active pharmaceutical ingredient in BEPREVE. Currently, Senju is our sole source for bepotastine besilate for BEPREVE. We have a supply agreement with Regis Technologies, Inc., or Regis, for bromfenac, which is the active pharmaceutical ingredient in BROMDAY and was also used for XIBROM. Currently, Regis is our sole source for bromfenac. We also have supply agreements with Bausch & Lomb, Inc., or Bausch & Lomb, to manufacture commercial quantities of BROMDAY, BEPREVE and ISTALOL. Currently, Bausch & Lomb is our sole source for BROMDAY, BEPREVE and ISTALOL.
Ovine hyaluronidase, the active pharmaceutical ingredient used in VITRASE, is processed in several stages to produce a highly purified raw material for formulation. In June 2010, we received approval from the FDA to manufacture hyaluronidase at our Irvine, California manufacturing facility and began production of highly purified ovine hyaluronidase in July 2010. We have a supply agreement with Alliance Medical Products to manufacture commercial quantities of VITRASE. Currently, Alliance Medical Products is our sole source for VITRASE.
Revenue Recognition
Product Revenues. We recognize revenues from product sales when there is persuasive evidence that an arrangement exists, when title has passed, the price is fixed or determinable, and we are reasonably assured of collecting the resulting receivable. We recognize product revenues net of estimated allowances for rebates, chargebacks, product returns and other discounts, such as wholesaler fees. If actual future payments for allowances for discounts, product returns, wholesaler fees, rebates and chargebacks materially exceed the estimates we made at the time of sale, our financial position, results of operations and cash flows may be negatively impacted.
We establish allowances for estimated rebates, chargebacks and product returns based on numerous qualitative and quantitative factors, including:
| • | the number of agreements with customers and specific contractual terms; |
| • | the estimated level of units in the distribution channel; |
| • | historical rebates, chargebacks and returns of products; |
| • | direct communication with customers; |
| • | anticipated introduction of competitive products or generics; |
| • | anticipated pricing strategy changes by us and/or our competitors; |
| • | analysis of prescription data gathered by a third-party prescription data provider; |
| • | the impact of wholesaler distribution agreements; |
| • | the impact of changes in state and federal regulations; and |
| • | the estimated remaining shelf-life of products. |
In our analyses, we utilize on-hand unit data purchased from the major wholesalers, as well as prescription data purchased from a third-party data provider, to develop estimates of sales by wholesalers to pharmacies and others. We utilize an internal analysis to compare, on a historical basis, net product shipments versus both estimated prescriptions written and product returns. Based on such analysis, we develop an estimate of the quantity of product which may be subject to various discounts, product returns, rebates, chargebacks and wholesaler fees.
We record estimated allowances for rebates, chargebacks, product returns and other discounts, such as wholesaler fees, in the same period when revenue is recognized. The objective of recording the allowances for such deductions at the time of sale is to provide a reasonable estimate of the aggregate amount of credit to our direct customers or payments to our indirect customers. Customers typically process their claims for allowances such as early pay discounts promptly, usually within the established payment terms. We monitor actual credit memos issued to our customers and compare such actual amounts to the estimated provisions, in the aggregate, for each allowance category to assess the reasonableness of the various reserves at each balance sheet date. Differences between our estimated allowances and actual credits issued have not been significant, and are accounted for in the current period as a change in estimate.
F-11
Table of Contents
In general, we are obligated to accept from our customers the return of products that have reached their expiration date. We authorize returns for damaged products, expiring and expired products in accordance with our return goods policy and procedures, and have established reserves for such amounts at the time of sale. We typically refund the agreed proportion of the sales price by the issuance of a credit, rather than a cash refund or exchange for inventory, and the returned product is destroyed. With the launch of each of our products, we record a sales return allowance, which is larger for stocking orders than subsequent re-orders. To date, actual product returns have not exceeded our estimated allowances for returns. Although we believe that our estimates and assumptions are reasonable as of the date made, actual results may differ significantly from these estimates. Our financial position, results of operations and cash flows may be materially and negatively impacted if actual returns materially exceed our estimated allowances for returns.
We identify product returns by their manufacturing lot number. Because we manufacture in bulk, lot sizes can be large and, as a result, sales of any individual lot may occur over several periods. As a result, we are unable to specify if actual returns or credits relate to a sale that occurred in the current period or a prior period, and therefore, we cannot specify how much of the allowance recorded relates to sales made in prior periods. Since there have been no material differences between estimates recorded and actual credits issued, we believe our systems and procedures are adequate for managing our business.
Allowances for product returns were $9.1 million and $8.6 million as of December 31, 2011 and 2010, respectively. These allowances reflect an estimate of our liability for products that may be returned by the original purchaser in accordance with our stated return policy, which allows customers to return products within six months of their respective expiration dates and for a period up to twelve months after such products have reached their respective expiration dates. We estimate our liability for product returns at each reporting period based on the estimated units in the channel and the other factors discussed above. As a percentage of gross product revenues, the reserve for product returns was 2.6%, 2.6% and 3.7% for the years ended December 31, 2011, 2010 and 2009, respectively. The decrease in the percentage between 2010 and 2009 is due to lower product returns, improved product shelf life, continued acceptance and sale of our products.
We also periodically offer promotional discounts to our existing customer base. These discounts are usually calculated as a percentage of the current published list price. Accordingly, the discounts are recorded as a reduction of revenue in the period that the program is offered. In addition to promotional discounts, at the time we implement a price increase, we generally offer our existing customers an opportunity to purchase a limited quantity of products at the previous list price. Shipments resulting from these programs generally are not in excess of ordinary levels and therefore, we recognize the related revenue upon receipt by the customer and include the sale in estimating our various product-related allowances. In the event we determine that these sales represent purchases of inventory in excess of ordinary levels for a given wholesaler, the potential impact on product returns exposure would be specifically evaluated and reflected as a reduction to revenue at the time of such sale. Near the end of 2011, we had one such purchase for which we determined the purchase to be in excess of ordinary levels and deferred $1.9 million in product revenues. We believe the wholesalers did not have excess inventory on hand at December 31, 2011 and 2010, respectively.
Allowances for estimated rebates and chargebacks were $18.7 million and $9.3 million as of December 30, 2011 and 2010, respectively. Other discounts, such as wholesaler fees and prompt pay discounts, were $5.7 million and $5.0 million as of December 31, 2011 and 2010, respectively, which are included in other accrued expenses on the balance sheets. These allowances reflect an estimate of our liability for items such as rebates due to various governmental organizations under the Medicare/Medicaid regulations, rebates due to managed care organizations under specific contracts, chargebacks due to various organizations purchasing certain of our products through federal contracts and/or group purchasing agreements and fees charged by certain wholesalers under distribution agreements. We estimate our liability for rebates, chargebacks and other discounts, such as wholesaler fees, at each reporting period based on the assumptions described above.
As a percentage of gross product revenues, the allowance for rebates, chargebacks and other discounts such as wholesaler fees was 22.2%, 17.6% and 14.7% for the years ended December 31, 2011, 2010 and 2009, respectively. The increase is primarily due to growth in the number and utilization of managed care contracts, federal contracts, and wholesaler distribution agreements and the impact of higher Medicaid and Medicare rebates required under the recent healthcare legislation. For the year ended December 31, 2011, we recorded estimated new Medicare rebates required under the legislation, commonly known as donut-hole rebates, of $1.6 million.
License Revenue. Amounts received for product and technology license fees under multiple-element arrangements are deferred and recognized over the period of such services or performance if such arrangements require on-going services or performance. Amounts received for milestones are recognized upon achievement of the milestone, unless we have ongoing performance obligations. Any amounts received prior to satisfying our revenue recognition criteria will be recorded as deferred income in the accompanying balance sheets. During the year ended December 31, 2009, we recognized $3.1 million of previously deferred income primarily related to the termination of our supply agreement with Otsuka. We did not receive any similar license revenues in 2011 or 2010.
F-12
Table of Contents
License Fees and Research and Development Costs
Expenditures relating to research and development are expensed in the period incurred. Research and development expenses to date have consisted primarily of costs associated with the clinical trials of our product candidates, compensation and other expenses for research and development personnel, costs for consultants and contract research, costs related to development of commercial scale manufacturing capabilities for our products BROMDAY, BEPREVE, ISTALOL, VITRASE and XIBROM and in-process research and development costs related to the acquisition of late-stage development compounds such as BEPOMAX, BEPOSONE and T-PRED.
We generally classify and separate research and development expenditures into amounts related to clinical development costs, regulatory costs, pharmaceutical development costs, manufacturing development costs and medical affairs costs.
We expense amounts paid to acquire or maintain licenses when the ultimate recoverability of the amounts paid is uncertain and the technology had no alternative future use when acquired. Payments made to acquire or maintain licenses are capitalized when we determine that the amounts paid have alternative future use. We have $1.4 million capitalized as of December 31, 2011, which is included in deposits and other assets, related to license rights that have a remaining estimated life of 5 years. This amount was recorded in the fourth quarter of 2011 as an out-of-period adjustment.
Stock-based Compensation
We recognize compensation costs for all stock-based awards made to employees and directors. The fair value of stock-based awards is estimated at grant date using an option pricing model and the portion that is ultimately expected to vest is recognized as compensation cost over the requisite service period. Since stock-based compensation is recognized only for those awards that are ultimately expected to vest, we have applied an estimated forfeiture rate to unvested awards for the purpose of calculating compensation cost. These estimates will be revised, if necessary, in future periods if actual forfeitures differ from estimates. Changes in forfeiture estimates impact compensation cost in the period in which the change in estimate occurs.
Our stock-based compensation plans are discussed further in Note 4.
Net Loss Per Share
Basic net loss per common share is computed by dividing the net loss for the period by the weighted average number of common shares outstanding during the period. Diluted net loss per share is computed by dividing the net loss for the period by the weighted-average number of common and common equivalent shares, such as stock options and warrants outstanding during the period. Diluted earnings for common stockholders per common share considers the impact of potentially dilutive securities except in periods in which there is a loss because the inclusion of the potential common shares would have an anti-dilutive effect. Diluted EPS excludes the impact of potential common shares related to our stock options and warrants, in periods in which the options exercise or conversion price is greater than the average market price of our common stock during the period.
Common shares issued for nominal consideration, if any, would be included in the per share calculations as if they were outstanding for all periods presented. We have further determined that the warrants issued in conjunction with our Facility Agreement represent participating securities. However, because we operate at a net loss, and losses are not allocated to the warrant holders, the two class method does not affect our calculation of earnings per share.
The following table sets forth the computation of net loss (numerator) and shares (denominator) for loss per share (in thousands):
| Years Ended December 31, | ||||||||||||
| 2011 | 2010 | 2009 | ||||||||||
| Numerator: |
||||||||||||
| Net loss |
$ | (56,606 | ) | $ | (5,300 | ) | $ | (57,754 | ) | |||
|
|
|
|
|
|
|
|||||||
| Denominator: |
||||||||||||
| Weighted average shares outstanding used for basic and diluted loss per share |
38,610 | 33,440 | 33,228 | |||||||||
|
|
|
|
|
|
|
|||||||
F-13
Table of Contents
Potentially dilutive securities, which are not included in our loss per share, are summarized below (in thousands):
| Years Ended December 31, | ||||||||||||
| 2011 | 2010 | 2009 | ||||||||||
| Common stock options |
10,319 | 7,957 | 7,051 | |||||||||
| Warrants |
6,911 | 15,000 | 15,000 | |||||||||
|
|
|
|
|
|
|
|||||||
| Total dilutive securities |
17,230 | 22,957 | 22,051 | |||||||||
|
|
|
|
|
|
|
|||||||
Executive Employment Agreements
We have agreements with each of our officers which provides that any unvested stock options and restricted shares then held by such officer will become fully vested and, with respect to stock options, immediately exercisable, in the event of a change in control of the Company and, in certain instances, if within twenty-four months following such change in control such officer’s employment is terminated by the Company without cause or such officer resigns for good reason within sixty days of the event forming the basis for such good reason termination.
In December 2011, we entered into a new employment agreement with our Chief Executive Officer, or CEO, which superseded the existing employment agreement with our CEO pursuant to which we granted to our CEO 172,775 cash-settled stock appreciation rights, or SARs, subject to vesting and other restrictions, and phantom stock equal to the product obtained by multiplying 27,225 shares of the Company’s common stock by the closing price of the Company’s common stock on the applicable measurement date, and also subject to vesting and other restrictions.
Segment Reporting
We currently operate in only one segment.
New Accounting Pronouncements
In June 2011, the Financial Accounting Standards Board, or the FASB issued Accounting Standards Update No. 2011-05 as amended by ASU 2011-12 which revised ASC 220 “Comprehensive Income.” The revisions increase the prominence of items reported in other comprehensive income, or OCI, by eliminating the option to present OCI as part of the statement of changes in shareholders’ equity. The amendments in this standard require that all non-owner changes in shareholders’ equity be presented either in a single continuous statement of comprehensive income or in two separate but consecutive statements. The ASUs do not change the current option for presenting components of OCI gross or net of the effect of income taxes, provided that such tax effects are presented in the statement in which OCI is presented or disclosed in the notes to the financial statements. Additionally, the standard does not affect the calculation or reporting of earnings per share. For public entities, the amendments are effective for fiscal years, and interim periods within those years, beginning after December 15, 2011 and are to be applied retrospectively, with early adoption permitted. The adoption of this guidance is not expected to have a material impact on our financial position or results of operations.
In May 2011, the FASB updated the accounting guidance on alignment of disclosures for Generally Accepted Accounting Principles, or GAAP, and the International Financial Reporting Standards, or IFRS, by updating Topic 820 entitled “Amendments to Achieve Common Fair Value Measurement and Disclosure Requirements in U.S. GAAP and IFRS”, relating to presentation of fair value measurements reported in financial statements. The updated guidance requires companies to align fair value measurement and disclosure requirements between GAAP and IFRS. The updated guidance is effective beginning in our fiscal 2012 year and earlier adoption is not permitted. The adoption of this guidance is not expected to have a material impact on our financial position or results of operations.
F-14
Table of Contents
2. Balance Sheet Details
Accounts Receivables
Accounts receivables are stated net of allowances for doubtful accounts. Accounts receivables at December 31, 2011 and 2010 consist of the following (in thousands):
| December 31, | ||||||||
| 2011 | 2010 | |||||||
| Gross accounts receivables (trade) |
$ | 56,322 | $ | 33,466 | ||||
| Other accounts receivables |
43 | 32 | ||||||
|
|
|
|
|
|||||
| Total gross receivables |
56,365 | 33,498 | ||||||
| Less reserve for doubtful accounts |
(1 | ) | (1 | ) | ||||
|
|
|
|
|
|||||
| Total receivables, net of allowances |
$ | 56,364 | $ | 33,497 | ||||
|
|
|
|
|
|||||
We have collected approximately $50.4 million of our outstanding December 31, 2011 accounts receivable balance as of February 17, 2012.
Inventory
Inventories are stated at the lower of cost (first-in, first-to-expire) or market. Inventories at December 31, 2011 and 2010 consist of the following (in thousands):
| December 31, | ||||||||
| 2011 | 2010 | |||||||
| Raw materials |
$ | 4,539 | $ | 3,468 | ||||
| Work in process |
123 | 100 | ||||||
| Finished goods |
3,132 | 3,837 | ||||||
|
|
|
|
|
|||||
| Total inventory |
7,794 | 7,405 | ||||||
| Less reserve for excess and obsolescence |
(1,076 | ) | (1,275 | ) | ||||
|
|
|
|
|
|||||
| Total inventory, net of allowances |
$ | 6,718 | $ | 6,130 | ||||
|
|
|
|
|
|||||
Property and Equipment
Equipment and leasehold improvements and related accumulated depreciation and amortization at December 31, 2011 and 2010 consist of the following (in thousands):
| December 31, | ||||||||
| 2011 | 2010 | |||||||
| Equipment |
$ | 5,687 | $ | 4,080 | ||||
| Furniture and fixtures |
1,221 | 990 | ||||||
| Equipment under capital leases |
694 | 511 | ||||||
| Leasehold improvements |
7,937 | 4,675 | ||||||
| Construction in progress |
443 | 4,456 | ||||||
|
|
|
|
|
|||||
| Total property, plant and equipment |
15,982 | 14,712 | ||||||
| Less accumulated depreciation and amortization |
(5,845 | ) | (4,360 | ) | ||||
|
|
|
|
|
|||||
| Total net property, plant and equipment |
$ | 10,137 | $ | 10,352 | ||||
|
|
|
|
|
|||||
As part of our facility lease that we entered into in 2010, the landlord contributed approximately $2.2 million toward the cost of tenant improvements. The tenant improvements were completed in the first quarter of 2011 and the landlord contribution was capitalized as leasehold improvements and non-cash deferred rent. Leasehold improvements will be depreciated over the term of the lease and the deferred rent is being amortized on a straight-line basis over the term of the lease as a reduction to rent expense.
F-15
Table of Contents
Total depreciation and amortization expense amounted to $2.3 million, $1.4 million, and $1.0 million for the years ended December 31, 2011, 2010 and 2009, respectively.
3. Fair Value Measurements
Fair Value Measurements
We account for fair value measurements under FASB Accounting Standard Codification 820 “Fair Value Measurements and Disclosures”, or ASC 820, which defines fair value as the exchange price that would be received for an asset or paid to transfer a liability (an exit price) in the principal or most advantageous market for the asset or liability in an orderly transaction between market participants at the measurement date. ASC 820 establishes a three-level fair value hierarchy that prioritizes the inputs used to measure fair value. This hierarchy requires entities to maximize the use of observable inputs and minimize the use of unobservable inputs. The three levels of inputs used to measure fair value are as follows:
| • | Level 1 — Quoted prices in active markets for identical assets or liabilities. |
| • | Level 2 — Observable inputs other than quoted prices included in Level 1, such as quoted prices for similar assets and liabilities in active markets; quoted prices for identical or similar assets and liabilities in markets that are not active; or other inputs that are observable or can be corroborated by observable market data. |
| • | Level 3 — Unobservable inputs that are supported by little or no market activity and that are significant to the fair value of the assets or liabilities. This includes certain pricing models, discounted cash flow methodologies and similar techniques that use significant unobservable inputs. |
We have segregated all assets and liabilities measured at fair value on a recurring basis (at least annually) into the most appropriate level within the fair value hierarchy based on the inputs used to determine the fair value at the measurement date in the table below. As of December 31, 2011 and 2010, all of our assets and liabilities are valued using Level 1 inputs except for a derivative and warrants related to our Facility Agreement.
Assets and liabilities measured at fair value on a recurring basis are summarized below (in thousands):
| Fair Value Measurements at December 31, using: | Total Carrying Value at |
|||||||||||||||
| Level 1 | Level 2 | Level 3 | December 31, | |||||||||||||
| 2011 |
||||||||||||||||
| Cash and cash equivalents, including U.S. Treasury Funds |
$ | 71,593 | $ | — | $ | — | $ | 71,593 | ||||||||
| Derivative (Facility Agreement) |
— | — | (2,392 | ) | (2,392 | ) | ||||||||||
| Warrants |
— | — | (40,130 | ) | (40,130 | ) | ||||||||||
| 2010 |
||||||||||||||||
| Cash and cash equivalents, including U.S. Treasury Funds |
$ | 78,777 | $ | — | $ | — | $ | 78,777 | ||||||||
| Derivative (Facility Agreement) |
— | — | (169 | ) | (169 | ) | ||||||||||
| Warrants |
— | — | (66,185 | ) | (66,185 | ) | ||||||||||
| Fair Value Measurements | ||||||||
| Using Significant | ||||||||
| Unobservable Inputs (Level 3) | ||||||||
| Derivative | Warrants | |||||||
| Balance at December 31, 2009 |
$ | (299 | ) | $ | (58,663 | ) | ||
| Total gains or losses (realized or unrealized) |
130 | (7,522 | ) | |||||
|
|
|
|
|
|||||
| Balance at December 31, 2010 |
(169 | ) | (66,185 | ) | ||||
| Total gains or losses (realized or unrealized) |
(2,223 | ) | (47,139 | ) | ||||
| Transfer of warrant liability to additional paid- in capital upon exercises of warrants |
— | 73,194 | ||||||
|
|
|
|
|
|||||
| Balance at December 31, 2011 |
$ | (2,392 | ) | $ | (40,130 | ) | ||
|
|
|
|
|
|||||
F-16
Table of Contents
4. Stockholders’ Equity
Common Stock Warrants
In 2008, we issued a total of 15 million warrants at an exercise price of $1.41 per share in conjunction with our borrowings under our Facility Agreement. If we issue or sell shares of our common stock (other than certain “excluded shares,” as such term is defined in the Facility Agreement), we will issue concurrently therewith additional warrants to purchase such number of shares of common stock as will entitle the Lenders to maintain the same beneficial ownership in the Company after the issuance as they had prior to such issuance, as adjusted on a pro rata basis for repayments of the outstanding principal amount under the loan, with such warrants being issued at an exercise price equal to the greater of $1.41 per share and the closing price of the common stock on the date immediately prior to the issuance.
The warrants expire on September 26, 2014 and contain certain limitations that prevent the holder from acquiring shares upon exercise of a warrant that would result in the number of shares beneficially owned by it to exceed 9.98% of the total number of shares of our common stock then issued and outstanding.
In addition, upon certain change of control transactions, or upon certain “events of default” (as defined in the warrants), the holder has the right to net exercise the warrants for an amount of shares of our common stock equal to the Black-Scholes value of the shares issuable under the warrants divided by 95% of the closing price of the common stock on the day immediately prior to the consummation of such change of control or event of default, as applicable, as defined in the Facility Agreement. In certain circumstances where a warrant or portion of a warrant is not net exercised in connection with a change of control or event of default, the holder will be paid an amount in cash equal to the Black-Scholes value of such portion of the warrant which is not treated as a net exercise.
During the year ended December 31, 2011, some of the Lenders and their assignees exercised a total of 8.1 million warrants, of which a portion were exercised for cash and a portion were exercised on a cashless basis.
A reconciliation of warrant activity for year ended December 31, 2011 is as follows (in thousands):
| Warrants | Common Stock | |||||||||||
| Balance at December 31, 2010 |
15,000 | |||||||||||
| Less: warrants exercised / common stock issued |
||||||||||||
| For cash |
(4,423 | ) | 4,423 | |||||||||
| On a cashless basis |
(3,666 | ) | 3,172 | |||||||||
|
|
|
|
|
|||||||||
| Total warrants exercised / common stock issued |
(8,089 | ) | 7,595 | |||||||||
|
|
|
|
|
|||||||||
| Balance at December 31, 2011 |
6,911 | |||||||||||
|
|
|
|||||||||||
Employee Stock Purchase Plan
On December 7, 2009, our stockholders approved the 2009 Employee Stock Purchase Plan, or 2009 ESPP. The 2009 ESPP replaced our 2000 ESPP, which expired in April 2010. The 2009 ESPP will terminate on October 18, 2019, unless earlier terminated in accordance with the terms and provisions of the 2009 ESPP.
An aggregate of 3,000,000 shares is reserved for issuance under the 2009 ESPP. In addition, on each January 1, beginning on January 1, 2011, the number of shares reserved will be increased by the lesser of (i) 1% of the Company’s outstanding common stock or (ii) an amount determined by the Compensation Committee, or any other administrator of the 2009 ESPP. However, in no event will the number of shares reserved exceed the lesser of 10% of our outstanding common stock or 5,000,000 shares.
Every employee of the Company who customarily works more than 20 hours per week for more than five months per calendar year is eligible to participate in offerings made under the 2009 ESPP, subject to certain limitations. Shares of common stock is generally offered for purchase through a series of six-month offering periods. The initial offering period commenced on January 1, 2010 and ended on June 30, 2010, with subsequent offering periods commencing on six-month intervals thereafter beginning on July 1, 2010. The purchase price for the common stock will be the lower of 85% of the fair market value of the common stock on the first day of an offering period or 85% of the fair market value of the common stock on the last day of the offering period.
During 2011, 2010 and 2009, 137,016 shares, 147,382 shares and 20,208 shares, respectively, had been issued to participants. The ESPP shares issued in 2010 include 9,557 shares that were issuable as of December 31, 2009, and which were issued under the 2000 ESPP.
F-17
Table of Contents
ESPP activity during 2011 was as follows:
| Number of shares |
Weighted-average purchase price |
|||||||
| Available at December 31, 2010 |
2,862,175 | |||||||
| Purchases |
(137,016 | ) | $ | 5.18 | ||||
|
|
|
|||||||
| Available at December 31, 2011 |
2,725,159 | |||||||
|
|
|
|||||||
Stock Options
We have outstanding options to purchase shares of our common stock under individual option agreements, our 1993 Stock Plan, our 2000 Stock Plan and under our 2004 Performance Incentive Plan, or the 2004 Stock Plan. All of the outstanding options granted under the individual option agreements, the 1993 Stock Plan, the 2000 Stock Plan and the 2004 Stock Plan will remain outstanding, and subject to the provisions of the applicable agreement and plan until they are either exercised or expire in accordance with their respective terms. No new options were issued under the 1993 Stock Plan or the 2000 Stock Plan after the adoption of the 2004 Stock Plan and have been included in the shares of common stock authorized for issuance under the 2004 Stock Plan.
The 2004 Stock Plan provides for the grant of stock options, restricted stock awards, and performance shares to qualified employees, officers, directors, consultants and other service providers. The 2004 Stock Plan originally authorized us to grant options and/or rights to purchase up to an aggregate of 2,053,107 shares of common stock. In October 2005, the options available for issuance under the 2004 Stock Plan were increased by 1,000,000 shares to 3,053,107, of which up to 300,000 shares may be issued in connection with restricted stock awards or performance share awards. In October 2006, the options available for issuance under the 2004 Stock Plan was increased by 3,100,000 shares to 6,153,107, of which up to 700,000 shares may be issued in connection with restricted stock awards or performance share awards. In December 2009, the options available for issuance under the 2004 Stock Plan was increased by 6,000,000 shares to an aggregate of 12,153,107 shares, of which up to 1,450,000 shares may be issued in connection with restricted stock awards or performance share awards.
As of December 31, 2011, a total of 1,982,811 shares of common stock remain reserved for issuance under the 2004 Stock Plan. A summary of our stock option activity and related information during 2011 follows:
| Number of Shares |
Weighted- Average Exercise Price |
Remaining Contractual Life |
Aggregate Intrinsic Value |
|||||||||||||
| Outstanding at December 31, 2010 |
7,957,312 | $ | 5.31 | |||||||||||||
| Granted |
3,338,383 | 4.57 | ||||||||||||||
| Exercised |
(595,632 | ) | 4.84 | |||||||||||||
| Canceled |
(380,281 | ) | 9.70 | |||||||||||||
|
|
|
|
|
|||||||||||||
| Outstanding at December 31, 2011 |
10,319,782 | $ | 4.94 | 6.31 | $ | 25,087,686 | ||||||||||
|
|
|
|
|
|
|
|
|
|||||||||
| Options vested and expected to vest at December 31, 2011 |
10,050,163 | $ | 4.94 | 6.22 | $ | 24,279,048 | ||||||||||
|
|
|
|
|
|
|
|
|
|||||||||
| Exercisable at December 31, 2011 |
6,141,000 | $ | 5.46 | 4.30 | $ | 12,696,085 | ||||||||||
|
|
|
|
|
|
|
|
|
|||||||||
The aggregate intrinsic value of options exercised during the years ended December 31, 2011, 2010 and 2009 was $5,536,231, $155,371and $272,976, respectively.
F-18
Table of Contents
At December 31, 2011, there was $11.8 million of total unrecognized compensation cost, related to non-vested stock options, which is expected to be recognized over a remaining weighted average vesting period of 3.3 years.
We use the Black-Scholes option-pricing model to estimate the fair value of stock-based awards. The determination of fair value using the Black-Scholes option-pricing model is affected by our stock price as well as assumptions regarding a number of complex and subjective variables, including expected stock price volatility, risk-free interest rate, expected dividends and projected employee stock option exercise behaviors. We estimate the expected term based on the contractual term of the awards and employees’ exercise and expected post-vesting termination behavior.
The total number of stock option awards expected to vest is adjusted by estimated forfeiture rates. The weighted average assumptions used for the years ended December 31, 2011, 2010 and 2009 and the resulting estimates of weighted-average fair value per share of options granted and for stock purchases under the ESPP during those periods are as follows:
| Years Ended December 31, | ||||||||||||
| 2011 | 2010 | 2009 | ||||||||||
| Interest rate |
1.2 | % | 2.60 | % | 2.00 | % | ||||||
| Volatility |
91.07 | % | 88.74 | % | 91.00 | % | ||||||
| Expected life |
7.5 years | 6 years | 7 years | |||||||||
| Expected dividend yield |
0 | % | 0 | % | 0 | % | ||||||
Restricted Stock Awards
During the years ended December 31, 2011, 2010 and 2009, we granted a total of 477,844, 159,152 and 159,434 shares of restricted common stock, respectively, to employees under the 2004 Stock Plan. Restrictions on these shares will expire and related charges are being amortized as earned over the vesting period of four years.
The amount of unearned compensation recorded is based on the market value of the shares on the date of issuance. Expenses related to the vesting of restricted stock were $0.6 million, $0.5 million and $0.6 million for the years ended December 31, 2011, 2010 and 2009, respectively. As of December 31, 2011, there was approximately $2.3 million of unamortized compensation cost related to restricted stock awards, which is expected to be recognized ratably over the vesting period of four years.
Restricted stock activity during 2011 was as follows:
| Number of Shares |
Weighted-Average Fair Value |
|||||||
| Outstanding at December 31, 2010 |
377,039 | $ | 3.24 | |||||
| Granted |
477,844 | 4.61 | ||||||
| Vested |
(140,474 | ) | 3.83 | |||||
| Forfeited |
(9,204 | ) | 3.38 | |||||
|
|
|
|||||||
| Outstanding at December 31, 2011 |
705,205 | $ | 4.05 | |||||
|
|
|
|
|
|||||
Aggregate Stock-based Compensation Information
The weighted average fair value of equity instruments granted during 2011, 2010 and 2009 was as follows:
| Weighted Average Fair Value | ||||||||||||
| 2011 | 2010 | 2009 | ||||||||||
| Stock options |
$ | 4.57 | $ | 3.82 | $ | 2.68 | ||||||
| ESPP Purchases |
5.18 | 1.83 | 2.14 | |||||||||
| Restricted Stock |
4.61 | 3.53 | 1.55 | |||||||||
Stock-based compensation costs are as follows (in millions):
| Years Ended December 31, | ||||||||||||
| 2010 | 2010 | 2009 | ||||||||||
| Selling, general and administrative |
$ | 3.3 | $ | 2.9 | $ | 2.6 | ||||||
| Manufacturing and research and development |
1.0 | 1.0 | 1.2 | |||||||||
|
|
|
|
|
|
|
|||||||
| Stock-based compensation costs |
$ | 4.3 | $ | 3.9 | $ | 3.8 | ||||||
|
|
|
|
|
|
|
|||||||
5. Stock Appreciation Rights and Phantom Stock
During the fourth quarter of 2011, we granted 172,775 SARs to our CEO which were subject to vesting and other restrictions, at a price equal the closing price of our common stock on the applicable measurement date. One-half of such SARs will vest at the 2-year and 4-year anniversaries, respectively.
F-19
Table of Contents
Upon exercise of each vested SAR, our CEO will receive cash equal in value to the difference between the exercise price and the fair market value at the vesting dates, less all applicable withholding taxes. Information about our cash-settled SARs is summarized in the following table.
| Cash-Settled Stock Appreciation Rights |
Weighted Average Exercise Price |
Remaining Contractual Term |
Aggregate Intrinsic Value |
|||||||||||||
| Outstanding at December 31, 2010 |
— | — | ||||||||||||||
| Granted |
172,775 | $ | 3.75 | |||||||||||||
|
|
|
|
|
|||||||||||||
| Outstanding at December 31, 2011 |
172,775 | $ | 3.75 | 9.9 years | $ | 570,158 | ||||||||||
|
|
|
|||||||||||||||
These SARs are accounted for as liability awards and are remeasured at fair value each reporting period until they become vested, assuming a prorated vesting over the period of the award, with compensation expense being recognized over the requisite service period in accordance with ASC 718-30 “Compensation—Stock Compensation, Awards Classified as Liabilities”, and the cumulative compensation cost recognized to date must be trued up each reporting period for changes in fair value prorated for the portion of the requisite service period rendered.
We use the Black-Scholes option-pricing model to estimate the fair value of the SARs. The determination of fair value using the Black-Scholes option-pricing model is affected by our stock price as well as assumptions regarding a number of complex and subjective variables, including expected stock price volatility, risk-free interest rate, expected dividends and projected employee stock option exercise behaviors. We estimate the expected term based on the contractual term of the SARs, employees’ exercise and expected post-vesting termination behavior.
The weighted average assumptions used for the years ended December 31, 2011 and the resulting weighted-average estimates of fair value per share of the SARs during the period are as follows:
| Year Ended December 31, 2011 |
||||
| Interest rate |
0.37 | % | ||
| Volatility |
90.14 | % | ||
| Weighted expected life |
3 years | |||
| Expected dividend yield |
0 | % | ||
| Estimated fair value |
$ | 3.48 | ||
Also during the fourth quarter of 2011, we granted cash-settled phantom stock awards, or phantom stock, to our CEO, the value of which is equal to the product obtained by multiplying 27,225 phantom stock shares by the closing price of our common stock on any applicable measurement date, subject to vesting and other restrictions. One-half of such phantom stock will vest at the 2-year and 4-year anniversaries respectively.
Upon exercise of each vested phantom stock, our CEO will receive cash equal in value to the difference between the par value of the phantom stock and the fair market value at the vesting dates, less all applicable withholding taxes. Information about our cash-settled phantom stock is summarized in the following table.
| Cash-Settled Phantom Stock |
Remaining Contractual Term |
|||||||
| Outstanding at December 31, 2010 |
— | |||||||
| Granted |
27,225 | |||||||
|
|
|
|||||||
| Outstanding at December 31, 2011 |
27,225 | 2.9 years | ||||||
|
|
|
|||||||
These phantom stock awards are accounted for as liability awards and are remeasured at fair value each reporting period until they become vested assuming a prorated vesting over the period of the award, with compensation expense being recognized over the requisite service period in accordance with ASC 718-30 “Compensation—Stock Compensation, Awards Classified as Liabilities”. The cumulative compensation cost recognized to date must be trued up each reporting period for changes in fair value prorated for the portion of the requisite service period rendered. We use the market price of our common stock at the end of each reporting period to estimate the fair value of the phantom stock.
F-20
Table of Contents
For the year ended December 31, 2011, we recognized approximately $31,000 of compensation expense associated with the SARs and phantom stock.
6. Commitments and Contingencies
In April 2010, we commenced withholding royalty payments and initiated legal action against Senju seeking a declaratory judgment with regard to our royalty obligations to Senju in connection with bromfenac products and a recovery of overpaid XIBROM royalties and other damages. The only U.S. patent applicable to XIBROM and, now to BROMDAY, expired in January 2009 and, according to U.S. case law and the terms of our license agreement with Senju, we believe no bromfenac product royalties are due after patent expiration. In August 2010, the U.S. District Court for the Central District of California stayed our action against Senju, and, in September 2010, Senju initiated an arbitration proceeding regarding the same dispute with the International Chamber of Commerce, or the ICC. The order staying our action against Senju will not become appealable until after the arbitration is concluded and a judgment is entered in the court case. The arbitration proceeding, the outcome of which may also affect our BROMDAY royalty obligations, is ongoing.
In February 2012, the arbitration tribunal adjudicating the dispute with Senju issued a decision on three preliminary matters. The arbitration tribunal upheld its own jurisdiction and rejected a request by Senju for interim and conservatory financial and other measures. The decision also addressed aspects of the law applicable to the parties’ dispute, concluding that Japanese law governs the obligation to pay royalties except insofar as Japanese law requires the application of U.S. mandatory law to the performance of certain obligations in the contract. In particular, the decision stated that U.S. mandatory laws govern ISTA’s obligation to pay royalties under the license, provided the facts of this case fall within the scope of U.S. mandatory law. We believe that U.S. mandatory law includes case law supporting our assertion that no bromfenac product royalties were due after the expiration of the bromfenac patent. In addition, the arbitration tribunal dismissed Senju’s request for an interim order permitting Senju to terminate the license or suspend our contractual rights as exclusive licensee, pending the resolution of the parties’ dispute. Following further submissions and evidence from the parties, the arbitration tribunal is expected to issue a final award. The timing of the issuance of a final award is unknown at this time.
In June 2010, we commenced withholding royalty payments and initiated a legal action by filing a Complaint against AcSentient, Inc. and AcSentient II, LLC, which we collectively refer to as AcSentient, seeking a declaratory judgment with regard to our bromfenac royalty obligations under the Asset Purchase Agreement dated May 3, 2002 between AcSentient and us. The only U.S. patent applicable to XIBROM and, now, to BROMDAY expired in January 2009 and, according to U.S. case law and the terms of our agreement with AcSentient, we believe no XIBROM and BROMDAY royalties are due after patent expiration. A declaratory judgment that we are seeking from the court in regard to royalty obligations to AcSentient may apply not only to XIBROM, but also to BROMDAY, which was approved by the FDA in October 2010. In November 2010, the Superior Court of the State of California, County of Orange stayed our case against AcSentient and ruled that the dispute had to be arbitrated. We will have an opportunity to appeal that court’s ruling after the final judgment is entered by the court. In January 2011, AcSentient filed a request for arbitration with the ICC. This arbitration is in its early stages.
There can be no assurance about when or how these two disputes will be resolved, and we cannot predict the final outcome or financial impact of either. The parties could elect to settle the dispute, allow the dispute to be resolved in arbitration or the U.S. courts or seek to exercise interim contractual rights including a purported termination by Senju prior to any determination in arbitration or the U.S. courts that would be challenged by ISTA. The range of outcomes could include continuation of the license with or without royalties, termination of the license with or without any assessment of costs or awards for withheld royalties or the negotiation of an amended license arrangement. Until these two disputes are resolved, for accounting purposes, we have been and intend to continue to reserve for BROMDAY and XIBROM royalties, which would have been payable to Senju and AcSentient if the relevant contractual royalty obligations were existing and enforceable. As of December 31, 2011, we had approximately $38.2 million reserved for such contingent XIBROM and BROMDAY royalties.
Subpoenas From the U.S. Attorney, Western District of New York. In April 2008, we received subpoenas from the office of the U.S. Attorney for the Western District of New York requesting information regarding the marketing activities related to XIBROM. We are cooperating with the government’s investigation. From April 2008 through December 31, 2011, we have incurred approximately $5.2 million, including $1.3 million incurred in 2011, in legal fees associated with this criminal investigation and expect to incur significant expenses in the future. In October 2011, we, and certain of our officers and current and former employees received correspondence from the government identifying them as targets. Tolling agreements have been executed to allow cooperation and discussions regarding resolution. If the government chooses to engage in civil litigation or initiate a criminal prosecution against us, our officers or our current or former employees, as a result of its review of the requested documents and other evidence, we may have to incur significant amounts to defend such actions or pay or incur substantial fines or penalties, on behalf of ourselves, our officers or our current or former employees, any of which could significantly deplete our cash resources. The case is ongoing and the likelihood of an unfavorable outcome and/or the amount/range of loss or additional expenses, cannot be reasonably estimated.
F-21
Table of Contents
TRICARE Retail Pharmacy Program. Section 703 of the National Defense Authorization Act of 2008, enacted on January 28, 2009, requires that pharmaceutical products purchased through the Department of Defense, or DoD, TRICARE Retail Pharmacy program be subject to the Federal Ceiling Price discount under the Veterans Health Care Act of 1992. DoD issued a rule pursuant to Section 703 that requires manufacturers to provide DoD with a quarterly refund on pharmaceutical products utilized through the TRICARE Retail Pharmacy program, and to pay rebates to DoD on TRICARE Retail Pharmacy purchases retroactive to January 28, 2008. We have requested a waiver of the retroactive rebate for TRICARE Retail Pharmacy utilization for the period from January 28, 2008 to May 26, 2009 (the effective date of the DoD rule). In addition, the regulation was the subject of litigation by others, and it was our position that the retroactive application of the regulation was contrary to established case law. In late October 2011, the United States District Court for the District of Columbia issued its decision in Coalition for Common Sense in Government Procurement v. United States, No. 08-996 (D.D.C. Oct. 25, 2011) upholding the DoD’s regulation. That case has been appealed to the United States Circuit Court for the District of Columbia. It is uncertain such appeal will be successful. In addition, the foregoing court decision does not impact our currently pending request for a waiver of the retroactive rebate. As of December 31, 2011, we determined that our payment of the retroactive rebate (from January 28, 2008 to May 26, 2009) created by the regulation is neither reasonably estimable nor probable.
FDA Complaint. In March 2011, we filed a Citizens Petition, or a CP, with the FDA. The CP requested the FDA to refrain from granting tentative or final approval of any abbreviated new drug application, or ANDA, for bromfenac sodium ophthalmic solution 0.09% that utilizes the labeling for XIBROM or omits any portion of the BROMDAY label relating to the once-per-day dosing. In May 2011, the FDA partially denied our CP and approved a generic version of XIBROM In May 2011, we filed a Complaint in the United States District Court for the District of Columbia alleging that the FDA’s approval of a generic version of XIBROM was arbitrary, capricious, and contrary to law. We also filed papers seeking injunctive relief with respect to the FDA’s approval of a generic version of twice-daily XIBROM and relief from denial of our 2011 CP requesting that the FDA refrain from granting tentative or final approval of any ANDA that utilizes the labeling for XIBROM or omits any portion of the BROMDAY label relating to the once-per-day dosing. Although our request for a temporary injunction was denied by the Court in May 2011, our subsequent motion for summary judgment seeking revocation of the approval of the generic bromfenac product, as well as the FDA’s counter-motion for summary judgment, have been fully briefed before the Court.
In October 2010, we submitted a Supplemental New Drug Application, or sNDA, to add a 2.4 mL size to the already existing NDA approval for 1.7 mL size of BROMDAY. In February 2011, FDAs Center for Drug Evaluation and Research, or CDER, issued a Complete Response letter, stating that the sNDA could not be approved because a single bottle should not be used to treat more than one eye in a post-operative setting. In May 2011, we requested a hearing on the proposal to deny approval of the sNDA. In August 2011, CDER issue a Notice of Opportunity for a Hearing, proposing to deny approval of the 2.4 mL size. The FDA was required to hold the hearing or grant itself summary judgment by December 3, 2011. In November 2011, we contacted CDER, saying it had violated its own rules by not commencing the hearing in time to meet the December 3 deadline. FDA responded by saying that any ruling on the matter should be deferred until a meeting of FDAs Dermatologic and Ophthalmic Drugs Advisory Committee could be held on the issue of whether a single bottle should be used to treat more than one eye in a post-operative session. We then requested the FDA to grant summary judgement because of CDERs persistent refusal to act on this matter or that CDER be ordered to commence a hearing forthwith.
We are involved in other claims and legal proceedings incidental to our business from time to time.We do not believe that pending actions or proceedings, either individually or in the aggregate, will have a material adverse effect on our financial condition, results of operations or cash flows, and adequate provision has been made for the resolution of such actions and proceedings.
Debt and Lease Commitments
We lease our corporate and laboratory facilities and certain equipment under various operating leases. Provisions of the facilities lease provide for abatement of rent during certain periods and escalating rent payments during the term. Rent expense is recognized on a straight-line basis over the term of the lease. Accordingly, rent expense recognized in excess of rent paid is reflected as deferred rent. Additionally, we are required to pay taxes, insurance and maintenance expenses related to the building. Rent expense on the facilities and equipment during 2011, 2010 and 2009 was $1.0 million, $1.2 million and $0.8 million, respectively.
Future annual minimum payments under our facility leases and operating leases are as follows (in thousands):
| Years Ending December 31: | ||||
| 2012 |
$ | 1,066 | ||
| 2013 |
980 | |||
| 2014 |
993 | |||
| 2015 |
1,006 | |||
| 2016 |
889 | |||
| Thereafter |
865 | |||
|
|
|
|||
| Total |
$ | 5,799 | ||
|
|
|
|||
F-22
Table of Contents
Scheduled maturities of capital leases, debt, amounts borrowed under the Revolving Credit Facility and Facility Agreement as of December 31, 2011, are as follows (in thousands):
| Years Ending December 31: | ||||
| 2012 |
$ | 45,606 | ||
| 2013 |
22,209 | |||
| 2014 |
51 | |||
| 2015 |
8 | |||
|
|
|
|||
| 67,874 | ||||
| Unamortized discounts on Facility Agreement |
(2,517 | ) | ||
| Embedded derivative on Facility Agreement |
2,392 | |||
|
|
|
|||
| Total |
$ | 67,749 | ||
|
|
|
|||
Milestones
We are committed to make potential future milestone payments to third parties as part of our in-licensing and development programs. Milestone payments under these agreements generally become due and payable only upon achievement of certain development, regulatory and/or commercial milestones. As of December 31, 2011, the maximum potential future milestone payments to third parties is $32 million. Because the achievement of these milestones is neither probable nor reasonably estimable, such contingencies have not been recorded on our balance sheet, except for a $2 million milestone related to our expected achievement of cumulative net revenues of BEPREVE, which we expect to pay to a vendor in the first quarter of 2012. Included in the $32 million are $12 million of future milestone payments related to products under development. Included in our December 31, 2011 balance sheet is a vendor payable, which is included in other accrued expenses, of $2 million related thereto.
7. Income Taxes
We account for income taxes under the Income Tax Topic of the FASB Accounting Standards Codification. As of December 31, 2011 and 2010, there are no unrecognized tax benefits included in the balance sheets that would, if recognized, affect the effective tax rate.
Our practice is to recognize interest and/or penalties related to income tax matters in income tax expense. We had no accrual for interest or penalties on our balance sheets at December 31, 2011 and 2010, respectively and have not recognized interest and/or penalties in the statement of operations for the year ended December 31, 2011.
We are subject to taxation in the U.S. and various state jurisdictions. Our tax years for 2008 and forward are subject to examination by federal tax authorities, as are the years 2007 and forward by state tax authorities. Net operating loss carryforwards from the years 1996 forward are also subject to adjustment.
At December 31, 2011, we had net deferred tax assets of $83.2 million. Due to uncertainties surrounding our ability to generate future taxable income to realize these assets, a full valuation has been established to offset the net deferred tax asset. Additionally, the future utilization of our net operating loss and research and development credit carryforwards to offset future taxable income are subject to an annual limitation, pursuant to Internal Revenue Code Sections 382 and 383, as a result of ownership changes that have occurred previously or that could occur in the future. We have completed a Section 382 analysis to determine the limitation of the net operating loss but have not completed an analysis of research and development credit carry forwards. Until this analysis has been performed, we have removed the deferred tax assets for federal research and development credits of $6.6 million and $6.4 million for state research and development credits generated through 2011 from the deferred tax asset schedule, and have recorded a corresponding decrease to the valuation allowance. When this analysis is finalized, we plan to update our unrecognized tax benefits. Due to the existence of the valuation allowance, future changes in our unrecognized tax benefits will not impact our effective tax rate.
We incurred net taxable losses for the years ended December 2011 and 2009, respectively. We generated net taxable income for the year ended December 31, 2010, primarily as a result of temporary differences related to accrued expenses and reserves. We utilized net operating loss carryforwards and research and development tax credits to offset our tax liabilities in 2010. At December 31, 2011, we had federal and California net operating loss carryforwards of approximately $123.0 million and $74.0 million, respectively. Our net operating loss carryforwards are limited due to previous ownership changes under Internal Revenue Code Section 382. We have established a valuation allowance against our federal and California net operating loss carryforwards due to the uncertainty of realization. Our federal tax loss carryforwards began to expire in 2011, and will continue to expire unless utilized. Our California tax loss carryforwards began to expire in 2012, and will continue to expire unless utilized. We also have federal and California research tax credit carryforwards of approximately $6.6 million and $6.4 million, respectively. The federal research tax credits began to expire in 2011, and will continue to expire unless utilized. Our California research tax credit carryforwards do not expire and will carryforward indefinitely until utilized.
F-23
Table of Contents
Significant components of our deferred tax assets as of December 31, 2011 and 2010 are listed below. A valuation allowance of $83.2 million and $42.9 million at December 31, 2011 and 2010, respectively, has been recognized to offset the net deferred tax assets as realization of such assets is uncertain. Our valuation allowance changed by $1.7 million, $3.4 million and $0.1 million for the years ended December 31, 2011, 2010 and 2009, respectively. A summary of the components of our deferred taxes follows (in thousands):
| December 31, | ||||||||
| 2011 | 2010 | |||||||
| Deferred tax asset: |
||||||||
| Capitalized research and development |
$ | 17,869 | $ | 25,407 | ||||
| Stock-based compensation |
4,123 | 3,894 | ||||||
| Net operating losses |
42,920 | — | ||||||
| Accruals and other, net |
18,344 | 13,610 | ||||||
|
|
|
|
|
|||||
| Total deferred tax asset |
83,256 | 42,911 | ||||||
| Valuation allowance for deferred tax assets |
(83,256 | ) | (42,911 | ) | ||||
|
|
|
|
|
|||||
| $ | — | $ | — | |||||
|
|
|
|
|
|||||
Our deferred tax asset increased by $38.6 million due to a gross up upon the completion of our study under Internal Revenue Code Section 382 during 2011.
A portion of the net operating loss carryforwards as of December 31, 2011 include amounts related to stock option deductions. Any excess tax benefits from stock-based compensation are only realized when income taxes payable is reduced, with the corresponding credit posted to additional paid-in capital.
A reconciliation between the U.S. statutory tax rate and our effective tax rate is as follows:
| Years Ended December 31, | ||||||||||||
| 2011 | 2010 | 2009 | ||||||||||
| Tax at U.S. statutory rate |
(34 | %) | (34 | %) | (34 | %) | ||||||
| State income tax and rate, net |
— | 2 | % | 3 | % | |||||||
| Warrant valuation |
28 | % | 49 | % | 31 | % | ||||||
| Derivatives |
1 | % | (1 | %) | (1 | %) | ||||||
| Stock options |
— | 15 | % | 1 | % | |||||||
| Other |
— | 4 | % | — | ||||||||
| Change in valuation allowances |
4 | % | (34 | %) | — | |||||||
|
|
|
|
|
|
|
|||||||
| Effective tax rate |
0 | % | 1 | % | 0 | % | ||||||
|
|
|
|
|
|
|
|||||||
8. Employee Benefit Plan
We have a 401(k) Savings Plan covering substantially all employees that have been employed for one month and meet certain age requirements. Employees may contribute up to 92% of their compensation per year (subject to a maximum limit by federal tax law). In 2011, we provided matching contributions equal to 25% of the first 6% of contributed salary. Employer contributions were $0.4 million, $0.3 million and $0.2 million for the years ended December 31, 2011, 2010 and 2009, respectively.
9. Licensing Agreements
Senju Agreements
In May 2002, we acquired certain of the assets of AcSentient, which included exclusive U.S. development, manufacturing and marketing rights for ISTALOL and XIBROM. ISTALOL and XIBROM were originally licensed by AcSentient from Senju.
In November 2004, we entered into another license agreement with Senju under which Senju granted to us exclusive U.S. ophthalmic rights to ecabet sodium.
In 2006, we entered into three additional license agreements with Senju under which Senju has granted us exclusive North American ophthalmic rights for BEPREVE, various prostaglandin products and iganidipine.
F-24
Table of Contents
In December 2009, we renegotiated with Senju our bromfenac rights to include, among other things, the expansion of our territory to include Canada and Mexico.
Generally, under the terms of our agreements with Senju, we are responsible for all costs associated with developing products covered by the licensed rights in ophthalmology for the U.S. and, with respect to XIBROM (and now BROMDAY), BEPREVE, prostaglandins and iganidipine, North America, including clinical trials, regulatory filings, manufacturing, and, if the product is approved, marketing and sales activities.
We have paid to Senju non-refundable milestone payments of $4 million, in the aggregate, relating to the development process and regulatory approval of both ISTALOL and XIBROM and are required to pay royalties on the sales of products that are covered by Senju’s patent rights.
We have paid to Senju non-refundable milestone payments of $4 million , in the aggregate, relating to the development process and regulatory approval of BEPREVE and are required to pay royalties and milestones on the sales for the products that are covered by Senju’s patent rights.
We will be required to pay to Senju non-refundable milestone payments of up to $2 million, in the aggregate, if all such milestones relating to the development process and regulatory approval of ecabet sodium are accomplished, and royalties on future product sales covered by Senju’s patent rights.
We will be required to pay Senju non-refundable milestone payments of approximately $8 million, in the aggregate, if all such milestones relating to the development process and regulatory approval of iganidipine are accomplished, and royalties on future sales of products covered by Senju’s patent rights.
We will be required to pay Senju non-refundable milestone payments of approximately $8 million, in the aggregate, if all such milestones relating to the development process and regulatory approval of a prostaglandin product are accomplished, and royalties on future sales of products covered by Senju’s patent rights. See Note 6 of the Notes to the Financial Statements.
Mitsubishi Tanabe Agreement
In September 2007, we licensed exclusive North American rights to nasal dosage forms of bepotastine, an investigational product for the treatment of allergy symptoms, from Mitsubishi Tanabe Pharma Corporation (formerly Tanabe Seiyaku Co., Ltd.), or Mitsubishi Tanabe. Under the terms of the license agreement with Mitsubishi Tanabe we paid an upfront payment to Mitsubishi Tanabe of $2.0 million, and will make additional payments based on achievement of development and approval milestones, and royalties on future product sales. We are responsible for all costs associated with developing nasal bepotastine in North America, including clinical trials, FDA filings, manufacturing, and, if the product is approved, marketing and sales activities. We also obtained the right to develop other nasal bepotastine products, including a fixed combination with a steroid, and a future right to negotiate for a North American license to oral dosage forms of bepotastine for allergy treatment. Under the terms of our bepotastine nasal agreement with Mitsubishi Tanabe, we are required to pay Mitsubishi Tanabe non-refundable milestone payments of approximately $12 million, if all such milestones relating to the development process and regulatory approval of bepotastine nasal are accomplished, and royalties on future product sales.
10. Stockholder’s Rights Agreement
In December 2001, we adopted a stockholder rights agreement pursuant to which we distributed rights to purchase units of our Series A Participating Preferred Stock, or Series A Preferred Stock. In January 2012, our Board approved a replacement stockholder rights agreement, effective January 12, 2012, that replaced the stockholder rights agreement which was originally was adopted in 2001 and expired on January 12, 2012. The new replacement rights agreement will expire at the earlier of the close of business on (i) January 12, 2015 or (ii) on December 21, 2012 if the approval of a majority of the shares of our common stock voting on the matter at the 2012 annual meeting or a special meeting has not been received prior to such time, unless the rights are previously redeemed, exchanged or terminated. A stockholder rights agreement is designed to deter coercive, unfair, or inadequate takeovers and other abusive tactics that might be used in an attempt to gain control of the Company without paying all stockholders a fair price for their shares. A stockholder rights agreement will not prevent takeovers at a full and fair price, but rather is designed to deter coercive takeover tactics and to encourage anyone attempting to acquire the Company to first negotiate with our Board.
F-25
Table of Contents
11. Quarterly Results of Operations (unaudited)
The following table sets forth a summary of our unaudited quarterly operating results for each of the last eight quarters in the period ended December 31, 2011. This data has been derived from our unaudited interim financial statements which, in our opinion, have been prepared on substantially the same basis as the audited financial statements contained elsewhere in this report and include all normal recurring adjustments necessary for a fair presentation of the financial information for the periods presented. These unaudited quarterly results should be read in conjunction with our financial statements and notes thereto included elsewhere in this report. The operating results in any quarter are not necessarily indicative of the results that may be expected for any future period (in thousands except earnings per share).
| Quarter Ended | ||||||||||||||||||||||||||||||||
| Dec. 31, 2011 |
Sept. 30, 2011 |
June 30, 2011 |
Mar. 31, 2011 |
Dec. 31, 2010 |
Sept. 30, 2010 |
June 30, 2010 |
Mar. 31, 2010 |
|||||||||||||||||||||||||
| (unaudited) | ||||||||||||||||||||||||||||||||
| Revenues: |
||||||||||||||||||||||||||||||||
| Product sales, net |
$ | 45,089 | $ | 41,386 | $ | 37,138 | $ | 36,720 | $ | 51,133 | $ | 42,020 | $ | 35,068 | $ | 28,304 | ||||||||||||||||
|
|
|
|
|
|
|
|
|
|
|
|
|
|
|
|
|
|||||||||||||||||
| Total revenues |
45,089 | 41,386 | 37,138 | 36,720 | 51,133 | 42,020 | 35,068 | 28,304 | ||||||||||||||||||||||||
| Cost of products sold |
10,670 | 10,140 | 9,083 | 9,216 | 12,437 | 9,678 | 8,209 | 7,284 | ||||||||||||||||||||||||
|
|
|
|
|
|
|
|
|
|
|
|
|
|
|
|
|
|||||||||||||||||
| Gross profit |
34,419 | 31,246 | 28,055 | 27,504 | 38,696 | 32,342 | 26,859 | 21,020 | ||||||||||||||||||||||||
| Costs and expenses: |
||||||||||||||||||||||||||||||||
| Research and development |
4,714 | 7,720 | 8,850 | 10,344 | 8,150 | 7,945 | 5,031 | 4,803 | ||||||||||||||||||||||||
| Selling, general and administrative |
19,649 | 19,644 | 23,353 | 26,931 | 22,249 | 19,614 | 19,900 | 20,868 | ||||||||||||||||||||||||
|
|
|
|
|
|
|
|
|
|
|
|
|
|
|
|
|
|||||||||||||||||
| Total costs and expenses |
24,363 | 27,364 | 32,203 | 37,275 | 30,399 | 27,559 | 24,931 | 25,671 | ||||||||||||||||||||||||
| Income (loss) from operations |
10,056 | 3,882 | (4,148 | ) | (9,771 | ) | 8,297 | 4,783 | 1,928 | (4,651 | ) | |||||||||||||||||||||
| Other expense, net |
(25,978 | ) | 26,732 | 16,923 | (74,302 | ) | (16,724 | ) | (28,299 | ) | 24,239 | 5,127 | ||||||||||||||||||||
|
|
|
|
|
|
|
|
|
|
|
|
|
|
|
|
|
|||||||||||||||||
| Net (loss) income |
$ | (15,922 | ) | $ | 30,614 | $ | 12,775 | $ | (84,073 | ) | $ | (8,427 | ) | $ | (23,516 | ) | $ | 26,167 | $ | 476 | ||||||||||||
|
|
|
|
|
|
|
|
|
|
|
|
|
|
|
|
|
|||||||||||||||||
| Net (loss) income per common share, basic |
$ | (0.38 | ) | $ | 0.74 | $ | 0.33 | $ | (2.49 | ) | $ | (0.25 | ) | $ | (0.70 | ) | $ | 0.78 | $ | 0.01 | ||||||||||||
|
|
|
|
|
|
|
|
|
|
|
|
|
|
|
|
|
|||||||||||||||||
| Net (loss) income per common share, diluted |
$ | (0.38 | ) | $ | 0.64 | $ | 0.25 | $ | (2.49 | ) | $ | (0.25 | ) | $ | (0.70 | ) | $ | 0.61 | $ | 0.01 | ||||||||||||
|
|
|
|
|
|
|
|
|
|
|
|
|
|
|
|
|
|||||||||||||||||
We recorded, in the fourth quarter of 2011, $2 million related to a milestone payment to a vendor and an out-of-period adjustment of $1.4 million related to the capitalization of license rights.
F-26
Table of Contents
SCHEDULE II — VALUATION AND QUALIFYING ACCOUNTS
| Description | Balance at beginning of year |
Additions | Deductions | Balance at end of year |
||||||||||||
| (in thousands) | ||||||||||||||||
| Allowance for Rebates and Chargebacks: |
||||||||||||||||
| Year ended December 31, 2011 |
$ | (9,273 | ) | $ | (31,786 | ) | $ | 22,369 | $ | (18,690 | ) | |||||
| Year ended December 31, 2010 |
(4,779 | ) | (21,209 | ) | 16,715 | (9,273 | ) | |||||||||
| Year ended December 31, 2009 |
(2,074 | ) | (13,298 | ) | 10,593 | (4,779 | ) | |||||||||
| Allowance for Product Returns |
||||||||||||||||
| Year ended December 31, 2011 |
$ | (8,623 | ) | $ | (5,441 | ) | $ | 4,936 | $ | (9,128 | ) | |||||
| Year ended December 31, 2010 |
(5,509 | ) | (5,150 | ) | 2,036 | (8,623 | ) | |||||||||
| Year ended December 31, 2009 |
(3,241 | ) | (4,927 | ) | 2,659 | (5,509 | ) | |||||||||
| Allowance for Doubtful Accounts |
||||||||||||||||
| Year ended December 31, 2011 |
$ | (1 | ) | $ | (3 | ) | $ | 3 | $ | (1 | ) | |||||
| Year ended December 31, 2010 |
(94 | ) | — | 93 | (1 | ) | ||||||||||
| Year ended December 31, 2009 |
(134 | ) | 13 | 27 | (94 | ) | ||||||||||
1
Table of Contents
EXHIBIT INDEX
| Exhibit |
Description | |
| 2.1 | Asset Purchase and Sale Agreement dated May 3, 2002, by and between the Registrant and AcSentient, Inc. (Incorporated by reference to Exhibit 2.1 of the Registrant’s Current Report on Form 8-K filed with the Commission on May 6, 2002). | |
| 3.1 | Restated Certificate of Incorporation of Registrant (Incorporated by reference to Exhibit 3.1 of the Registrant’s Annual Report on Form 10-K for the year ended December 31, 2002, filed with the Commission on March 7, 2003). | |
| 3.2 | Certificate of Correction to Restated Certificate of Incorporation of Registrant (Incorporated by reference to Exhibit 3.2 of the Registrant’s Annual Report on Form 10-K for the year ended December 31, 2002, filed with the Commission on March 7, 2003). | |
| 3.3 | Second Certificate of Correction to Restated Certificate of Incorporation of Registrant (Incorporated by reference to Exhibit 3.1 of the Registrant’s Current Report on Form 8-K filed with the Commission on August 31, 2005). | |
| 3.4 | Amended and Restated Bylaws of Registrant (Incorporated by reference to Exhibit 3.1 of the Registrant’s Current Report on Form 8-K filed with the Commission on October 31, 2006). | |
| 4.1 | Specimen common stock certificate (Incorporated by reference to Exhibit 4.1 of the Registrant’s Registration Statement on Form S-1/A (File No. 333-34120) filed with the Commission on August 7, 2000). | |
| 4.2 | Preferred Stock Rights Agreement dated as of December 31, 2001, by and between the Registrant and Mellon Investor Services LLC, as rights agent (Incorporated by reference to Exhibit 4.2 of the Registrant’s Registration Statement on Form 8-A (File No. 000-31255) filed with the Commission on January 22, 2002). | |
| 4.3 | First Amendment to the Preferred Stock Rights Agreement dated as of November 18, 2002, by and between the Registrant and Mellon Investor Services LLC, as rights agent (Incorporated by reference to Exhibit 4.2 of the Registrant’s Registration Statement on Form 8-A12G/A (File No. 000-31255) filed with the Commission on November 19, 2002). | |
| 4.4 | Second Amendment to the Preferred Stock Rights Agreement, dated June 23, 2006, by and between the Registrant and U.S. Stock Transfer Corporation (Incorporated by reference to Exhibit 4.1 to the Registrant’s Current Report on Form 8-K filed with the Commission on June 28, 2006). | |
| 4.5 | Third Amendment to the Preferred Stock Rights Agreement, dated January 12, 2012, by and between the Registrant and Computershare Trust Company, N.A., as Rights Agent. (Incorporated by reference to Exhibit 4.2 of the Registrant’s Current Report on Form 8-K filed with the Commission on January 17, 2012). | |
| 4.6 | Preferred Stock Rights Agreement, dated as of January 12, 2012, by and between the Registrant and Computershare Trust Company, N.A., as Rights Agent, which includes as Exhibit A thereto a Form of Rights Certificate and as Exhibit B thereto a Summary of Rights. (Incorporated by reference to Exhibit 4.1 of the Registrant’s Current Report on Form 8-K filed with the Commission on January 17, 2012). | |
| 10.1 | 1993 Stock Plan and forms of agreements thereunder (Incorporated by reference to Exhibit 10.2 of the Registrant’s Registration Statement on Form S-1 (File No. 333-34120) filed with the Commission on April 5, 2000). (2) | |
| 10.2 | 2000 Stock Plan (Amended and Restated) (Incorporated by reference to Exhibit 10.1 of the Registrant’s Quarterly Report on Form 10-Q for the period ended June 30, 2003, filed with the Commission on August 14, 2003). (2) | |
| 10.3 | Forms of agreements under 2000 Stock Plan (Incorporated by reference to Exhibit 10.3 of the Registrant’s Registration Statement on Form S-1 (File No. 333-34120) filed with the Commission on April 5, 2000). (2) | |
| 10.4 | 2009 Employee Stock Purchase Plan (Incorporated by reference to Exhibit 10.2 to the Registrant’s Current Report on Form 8-K filed with the Commission on December 11, 2009). (2) | |
| 10.5 | Fourth Amendment and Restatement to the 2004 Performance Incentive Plan (Incorporated by reference to Exhibit 10.1 of the Registrant’s Current Report on Form 8-K filed with the Commission on December 11, 2009). (2) | |
Table of Contents
| Exhibit |
Description | |
| 10.6 | Form of Stock Option Agreement under 2004 Performance Incentive Plan (Incorporated by reference to Exhibit 10.2 of the Registrant’s Current Report on Form 8-K filed with the Commission on August 31, 2005). (2) | |
| 10.7 | Form of Restricted Stock Purchase Agreement under 2004 Performance Incentive Plan (Incorporated by reference to Exhibit 10.3 of the Registrant’s Current Report on Form 8-K filed with the Commission on August 31, 2005). (2) | |
| 10.8 | Form of Indemnification Agreement by and between the Registrant and certain executive officers and directors of Registrant (Incorporated by reference to Exhibit 10.8 of the Registrant’s Annual Report on Form 10-K for the year ended December 31, 2005, filed with the Commission on March 6, 2006). (2) | |
| 10.8.1 | Schedule of Parties to Indemnification Agreement (Incorporated by reference to Exhibit 10.10.1 of the Registrant’s Annual Report on Form 10-K for the year ended December 31, 2007, filed with the Commission on March 7, 2008). | |
| 10.9 | Lease dated March 12, 2010 by and between the Registrant and The Irvine Company, LLC, for the lease of the office space located at 50 Technology Drive, Irvine, California (Incorporated by reference to Exhibit 10.1 of the Registrant’s Current Report on Form 8-K filed with the Commission on March 18, 2010). | |
| 10.10 | First Amendment to Lease dated October 21, 2010 by and between the Registrant and The Irvine Company, LLC, for the lease of the office space located at 50 Technology Drive, Irvine, California. (Incorporated by reference to Exhibit 10.10 of the Registrant’s Annual report on Form 10-K for the year ended December 31, 2010, filed with the Commission on February 25, 2010) | |
| 10.11 | License Agreement dated as of December 13, 2001, by and between Otsuka Pharmaceutical Co., Ltd., and the Registrant (Incorporated by reference to Exhibit 10.21 of the Registrant’s Current Report on Form 8-K filed with the Commission on January 2, 2002). (1) | |
| 10.12 | Executive Employment Agreement dated November 30, 2011, by and between Vince Anido and the Registrant. (2) (4) | |
| 10.13 | Form of Executive Employment Agreement by and between the Registrant and certain executive officers of the Registrant, each entered into on December 2, 2011. (2) (4) | |
| 10.13.1 | Schedule of Parties to Executive Employment Agreement. (2) (4) | |
| 10.14 | Stand-Alone Stock Option Agreement dated December 21, 2001, by and between Vicente Anido, Jr., Ph.D. and the Registrant (Incorporated by reference to Exhibit 10.28 of the Registrant’s Annual Report on Form 10-K for the year ended December 31, 2001, filed with the Commission on April 1, 2002). (2) | |
| 10.15 | Individual Non-Qualified Stock Option Agreement dated July 1, 2002, by and between Thomas A. Mitro and the Registrant (Incorporated by reference to Exhibit 99.1 of the Registrant’s Registration Statement on Form S-8 (File No. 333-103279) filed with the Commission on February 18, 2003). (2) | |
| 10.16 | Individual Non-Qualified Stock Option Agreement dated August 5, 2002, by and between Kirk McMullin and the Registrant (Incorporated by reference to Exhibit 99.2 of the Registrant’s Registration Statement on Form S-8 (File No. 333-103279) filed with the Commission on February 18, 2003). (2) | |
| 10.17 | Bausch & Lomb Pharmaceuticals, Inc. Contract Manufacturing Supply Agreement dated February 6, 2003, by and between Bausch & Lomb Pharmaceuticals, Inc. and the Registrant (Incorporated by reference to Exhibit 10.37 of the Registrant’s Annual Report on Form 10-K/A for the year ended December 31, 2002, filed with the Commission on June 4, 2003). (1) | |
| 10.18 | Bausch & Lomb Pharmaceuticals, Inc. Contract Manufacturing Supply Agreement dated November 25, 2002, by and between Bausch & Lomb Pharmaceuticals, Inc. and the Registrant (Incorporated by reference to Exhibit 10.38 of the Registrant’s Annual Report on Form 10-K/A for the year ended December 31, 2002, filed with the Commission on June 4, 2003). (1) | |
| 10.19 | Agreement dated April 17, 2002, by and between Senju Pharmaceutical Co., Ltd. and AcSentient, Inc. (Incorporated by reference to Exhibit 10.43 of the Registrant’s Annual Report on Form 10-K/A for the year ended December 31, 2002, filed with the Commission on June 4, 2003). (1) | |
Table of Contents
| Exhibit Number |
Description | |
| 10.20 | Amendment to Timolol Agreement dated August 13, 2002, by and between Senju Pharmaceutical Co., Ltd. and the Registrant (Incorporated by reference to Exhibit 10.46 of the Registrant’s Annual Report on Form 10-K/A for the year ended December 31, 2002, filed with the Commission on April 30, 2003). (1) | |
| 10.21 | License Agreement dated March 7, 2002, by and between Senju Pharmaceutical Co., Ltd and AcSentient, Inc. (Incorporated by reference to Exhibit 10.42 of the Registrant’s Annual Report on Form 10-K/A for the year ended December 31, 2002, filed with the Commission on June 4, 2003). (1) | |
| 10.22 | Amendment to Bromfenac License Agreement dated August 13, 2002, by and between Senju Pharmaceutical Co., Ltd and the Registrant (Incorporated by reference to Exhibit 10.45 of the Registrant’s Annual Report on Form 10-K/A for the year ended December 31, 2002, filed with the Commission on April 30, 2003). (1) | |
| 10.23 | Second Amendment to Bromfenac License Agreement dated May 31, 2006, by and between Senju Pharmaceutical Co., Ltd and the Registrant (Incorporated by reference to Exhibit 10.1 of the Registrant’s Current Report on Form 8-K filed with the Commission on June 2, 2006). | |
| 10.24 | Letter Agreement, dated December 11, 2009, by and between Senju Pharmaceutical Co., Ltd and the Registrant (Incorporated by reference to Exhibit 10.1 of the Registrant’s Current Report on Form 8-K filed with the Commission on December 17, 2009). | |
| 10.25 | Letter Agreement, dated December 11, 2009, by and between Senju Pharmaceutical Co., Ltd and the Registrant (Incorporated by reference to Exhibit 10.2 of the Registrant’s Current Report on Form 8-K filed with the Commission on December 17, 2009). (1) | |
| 10.26 | License Agreement dated November 17, 2004, by and between the Registrant and Senju Pharmaceuticals Co., Ltd. (Incorporated by reference to Exhibit 10.1 of the Registrant’s Current Report on Form 8-K/A filed with the Commission on December 28, 2004). (1) | |
| 10.27 | Supply Agreement dated August 30, 2004, by and between the Registrant and Alliance Medical Products, Inc. (Incorporated by reference to Exhibit 10.45 of the Registrant’s Annual Report on Form 10-K for the year ended December 31, 2004, filed with the Commission on March 15, 2005). (1) | |
| 10.28 | Exclusive License Agreement dated June 12, 2006, by and between the Registrant and Senju Pharmaceutical Co., Ltd. (Incorporated by reference to Exhibit 10.1 of the Registrant’s Current Report on Form 8-K filed with the Commission on June 16, 2006). (1) | |
| 10.29 | Exclusive License Agreement dated June 12, 2006, by and between the Registrant and Senju Pharmaceutical Co., Ltd. (Incorporated by reference to Exhibit 10.2 of the Registrant’s Current Report on Form 8-K filed with the Commission on June 16, 2006). (1) | |
| 10.30 | Exclusive License Agreement dated August 1, 2006, by and between the Registrant and Senju Pharmaceutical Co., Ltd. (Incorporated by reference to Exhibit 10.1 of the Registrant’s Current Report on Form 8-K filed with the Commission on August 3, 2006). (1) | |
| 10.31 | Form of Purchase Agreement (Incorporated by reference to Exhibit 10.1 of the Registrant’s Current Report on Form 8-K filed with the Commission on June 27, 2007). | |
| 10.32 | Exclusive License Agreement dated September 25, 2007, by and between Registrant and Mitsubishi Tanabe Pharma Corporation (formerly Tanabe Seiyaku Co., Ltd.) (Incorporated by reference to Exhibit 10.47 of the Registrant’s Quarterly Report on Form 10-Q for the period ended September 30, 2007, filed with the Commission on November 6, 2007). (1) | |
| 10.33 | Form of Warrant to purchase shares of common stock of Registrant (Incorporated by reference to Exhibit 4.1 of the Registrant’s Current Report on Form 8-K filed with the Commission on September 30, 2008). | |
| 10.34 | Facility Agreement dated September 26, 2008 by and between the Registrant and certain lenders named therein (Incorporated by reference to Exhibit 10.1 of the Registrant’s Current Report on Form 8-K filed with the Commission on September 30, 2008). | |
| 10.35 | Amendment dated September 26, 2008 by and between the Registrant and Highbridge International LLC (Incorporated by reference to Exhibit 10.2 of the Registrant’s Current Report on Form 8-K filed with the Commission on September 30, 2008). | |
Table of Contents
| Exhibit Number |
Description | |
| 10.36 | Registration Rights Agreement dated September 26, 2008 by and between the Registrant and certain investors named therein (Incorporated by reference to Exhibit 10.3 of the Registrant’s Current Report on Form 8-K filed with the Commission on September 30, 2008). | |
| 10.37 | Security Agreement dated September 26, 2008 by and between the Registrant and certain secured parties named therein (Incorporated by reference to Exhibit 10.4 of the Registrant’s Current Report on Form 8-K filed with the Commission on September 30, 2008). | |
| 10.38 | Amended and Restated Loan and Security Agreement dated February 23, 2011, by and between Silicon Valley Bank and the Registrant. (Incorporated by reference to Exhibit 10.40 of the Registrant’s Annual Report on Form 10-K filed with the Commission on February 25, 2011.) | |
| 23.1 | Consent of Independent Registered Public Accounting Firm. (4) | |
| 24.1 | Power of Attorney (included in the signature page). | |
| 31.1 | Certification of Chief Executive Officer Pursuant to Rule 13a-14(a)/15d-14(a) of the Securities Exchange Act of 1934. (4) | |
| 31.2 | Certification of Chief Financial Officer Pursuant to Rule 13a-14(a)/15d-14(a) of the Securities Exchange Act of 1934. (4) | |
| 32.1 | Certification of Chief Executive Officer Pursuant to Rule 13a-14(b)/15d-14(b) of the Securities Exchange Act of 1934 and 18 U.S.C. Section 1350. (3) | |
| 32.2 | Certification of Chief Financial Officer Pursuant to Rule 13a-14(b)/15d-14(b) of the Securities Exchange Act of 1934 and 18 U.S.C. Section 1350. (3) | |
| 101 | The following materials furnished from the ISTA Pharmaceuticals, Inc. Annual Report on Form 10-K for the year ended December 31, 2011 formatted in eXtensible Business Reporting Language (XBRL): (i) the Balance Sheets (ii) the Statements of Operations, (iii) the Statements of Stockholder’s deficit, (iii) the Statements of Cash Flows and (iv) the Notes to the Financial Statements, tagged as blocks of text. | |
| (1) | Portions of this exhibit are omitted and were filed separately with the Secretary of the Commission pursuant to ISTA’s application requesting confidential treatment under Rule 24b-2 of the Exchange Act of the Securities Exchange Act of 1934. |
| (2) | These exhibits are identified as management contracts or compensatory plans or arrangements of the Registrant pursuant to Item 15(a)(3) of Form 10-K. |
| (3) | Furnished herewith and not “filed” for purposes of Section 18 of the Securities Exchange Act of 1934, as amended. |
| (4) | Filed herewith. |