Attached files
| file | filename |
|---|---|
| 8-K - 8-K - WCA WASTE CORP | d303606d8k.htm |
 Change
2010 vs 2011E
2010
2011E
$
%
Volume
(0.7%)
Price
3.0%
Revenue
Collection
$123.1
$153.4
$30.3
24.6%
Disposal
98.8
102.9
4.1
4.1%
Transfer
35.0
40.9
5.9
16.9%
Other
12.5
19.7
7.2
57.6%
Eliminations
(39.9)
(43.1)
(3.2)
8.0%
Total revenue
$229.5
$273.8
$44.3
19.3%
Internalization
71.6%
68.1%
(3.5%)
EBITDA
53.1
57.7
4.6
8.7%
% margin
23.1%
21.1%
(2.0%)
Adj. EBITDA
$56.2
$62.7
$6.5
11.6%
% margin
24.5%
22.9%
(1.6%)
Capex
$31.3
$31.8
$0.5
1.6%
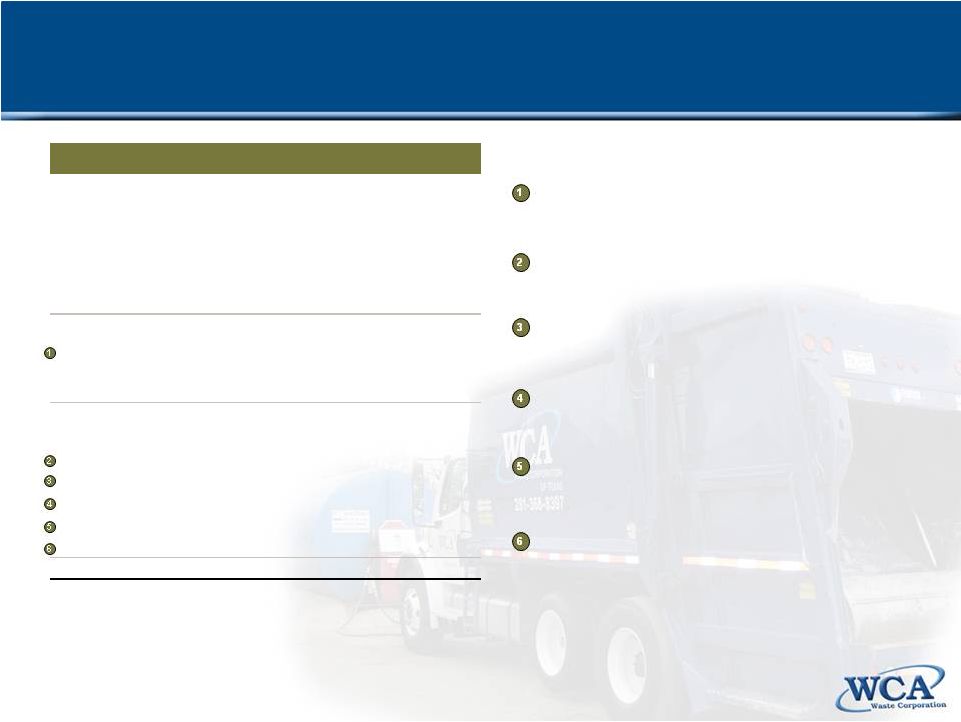
2011Estimated Results
2011 Estimated Results Commentary
Revenue was up 19.3% year-over-year, driven by
acquisitions and pricing growth
Completed 3 acquisitions in Q1 2011 that accounted for
$36 million of revenue increase
Largest was Emerald Waste acquisition (Central Florida)
Lower operating margins year-over-year can be partially
attributed to higher fuel and rail costs, a change in the mix
of revenue and M&A related costs
Cost of diesel as a percentage of revenue was 8.2% for
2011E, up from 6.3% in the prior year, resulting in lower
margins
Mix of revenue included more residential services
following the acquisition of Emerald Waste Services
$1.8 million of M&A costs during 2011E; majority related
to Macquarie acquisition
Comparative Results
($ in millions)
Note:
2011E represents unaudited actual results.
2011E not
pro forma for North Carolina and South Carolina asset sales.
–
–
–
–
–
Exhibit 99.1 |
 Reconcilliation of Adjusted EBITDA
($ in millions)
2011E
Net income (loss)
($2.4)
Add: Depreciation and amortization
33.5
Add: Interest expense
20.2
Add: Taxes
0.5
Add: Write-off of deferred financing costs
0.2
Add: Loss on early extinguishment of debt
5.8
EBITDA
$57.7
Add: One-time merger & acquisition related expenses
1.8
Add: Accretion expense for closure and post-closure obligations
1.0
Add: Non-cash stock-based compensation
2.2
Adj. EBITDA
$62.7
Pro forma adjustments:
Add: Public company costs
1.4
Add: Reduced senior management costs
1.7
Add: Stoughton and Emerald Waste run-rate adjustments
1.3
Less: EBITDA from North and South Carolina assets
(3.5)
Other
1.2
Total pro forma Adj. EBITDA
$64.7
Includes cost savings related to audit fees, legal fees, tax
preparation
fees,
investor
relations
and
directors’
fees
and
shares
Includes run-rate adjustments for the full year impact of the
acquisitions completed during 2011
Cost savings from realignment of management team and new
employment contracts
Removes the EBITDA impact for the assets that are being sold to
Waste Industries
Includes $0.3 million related to termination of a host Ohio landfill
fee
(terminated
effective
July
1,
2011)
and
$0.8
million
related
to
the City of Ada contract awarded in October 2011
Includes
fees
related
to
M&A
activity;
majority
of
costs
related
to
proposed acquisition by MIP II |
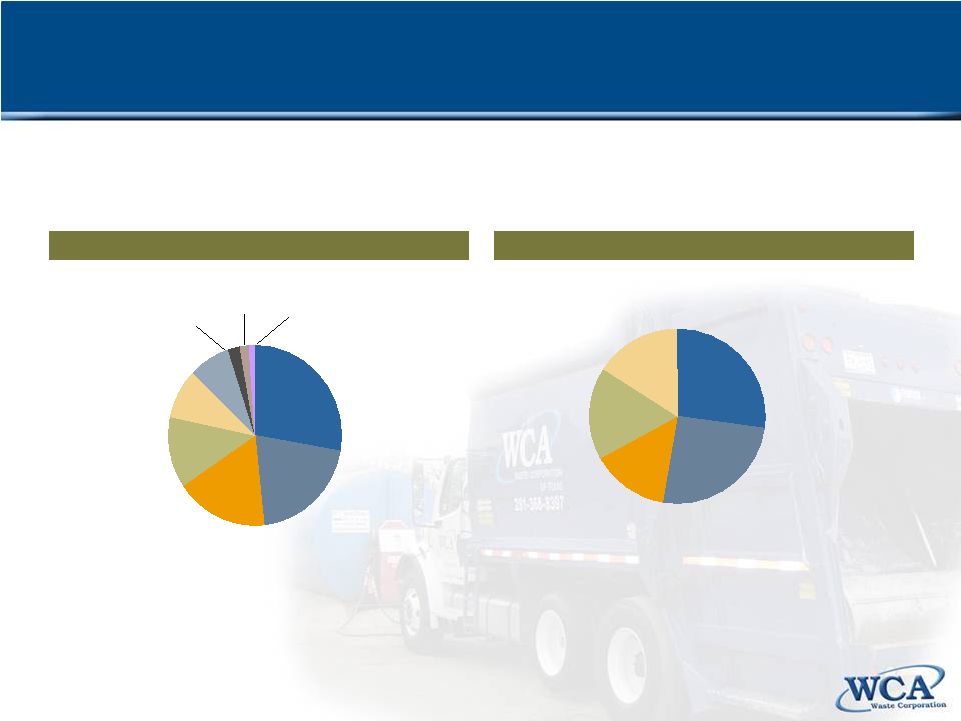 Residential
$66.0
Roll-off
$37.8
Commercial
$41.3
Disposal
$71.0
Transfer & other
$44.8
27.2%
17.2%
15.8%
25.3%
14.5%
2011 Estimated Revenue by Geography
2011 Estimated Revenue by Business Type
1.6%
27.8%
2.4%
8.9%
1.0%
17.1%
20.6%
Arkansas
$23.1
Texas
$72.6
Missouri / Kansas
$53.7
Tennesse
$2.7
Alabama
$6.3
Florida
$33.4
Colorado /
New Mexico $4.3
7.7%
12.8%
Ohio / Massachusetts
$44.7
Oklahoma
$20.0
($ in millions)
Note:
Pro forma for the North and South Carolina asset sale.
(1)
Defined
as
ratio
of
intercompany
disposal
expense
to
total
gross
disposal
expense.
Company Overview
($ in millions) |
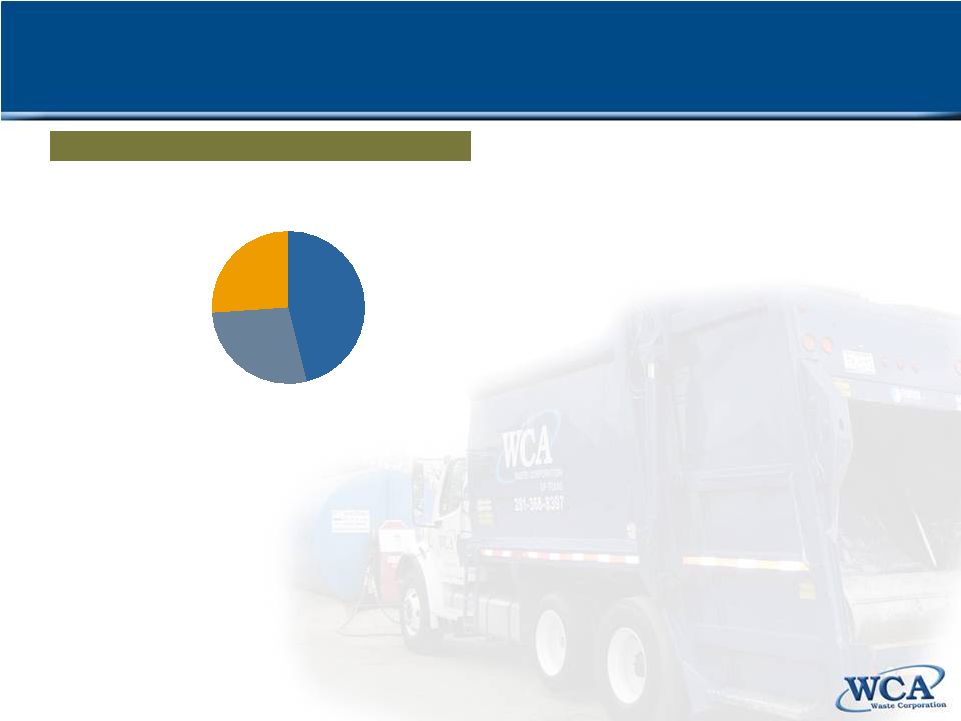 Company Overview (Continued)
Residential
46%
Commercial
28%
Roll-off
26%
2011 Estimated Collection Revenue by Service |
 Historical Change in Volume and Pricing
Volume change
Pricing change
(3.1%)
(2.0%)
(4.8%)
(3.0%)
(9.8%)
(6.9%)
(5.3%)
(10.3%)
(5.6%)
(0.5%)
(3.5%)
2.0%
(2.4%)
(2.8%)
3.0%
(0.4%)
Q1
Q2
Q3
Q4
Q1
Q2
Q3
Q4
Q1
Q2
Q3
Q4
Q1
Q2
Q3
Q4
2008
2009
2010
2011
Note:
Reflects year-on-year volume and pricing change.
5.4%
4.0%
4.0%
5.3%
5.7%
2.2%
(0.1%)
(1.8%)
(2.3%)
(2.1%)
1.1%
0.2%
3.8%
3.5%
1.7%
2.3%
Q1
Q2
Q3
Q4
Q1
Q2
Q3
Q4
Q1
Q2
Q3
Q4
Q1
Q2
Q3
Q4
2008
2009
2010
2011
C&D proportion
of revenue:
43%
36%
35%
25% |