Attached files
| file | filename |
|---|---|
| 8-K - FORM 8-K - TELEFLEX INC | d305908d8k.htm |
Exhibit 99.1

| 1 TELEFLEX INCORPORATED FOURTH QUARTER & FULL YEAR 2011 & 2012 OUTLOOK EARNINGS CONFERENCE CALL |
| 2 Conference Call Logistics The release, accompanying slides, and replay webcast available online at www.teleflex.com (click on "Investors") Telephone replay available by dialing 888-286-8010 or for international calls, 617- 801-6888, pass code number 36708812 |
| 3 Introductions Benson Smith Chairman, President and CEO Randy Meier Executive Vice President and CFO Jake Elguicze Treasurer and Vice President of Investor Relations |

| 4 4 4 4 4 4 4 Forward-Looking Statements/Additional Notes This presentation and our discussion contain forward-looking information and statements including, but not limited to, forecasted 2011 constant currency revenue growth and adjusted earnings per share; our expectations with respect to our gross and operating margins; and other matters which inherently involve risks and uncertainties which could cause actual results to differ from those projected or implied in the forward-looking statements. These risks and uncertainties are addressed in the Company's SEC filings, including its most recent Form 10-K. This presentation includes certain non-GAAP financial measures, which include revenue growth on a constant currency basis; adjusted gross and operating margins; adjusted earnings per share; adjusted gross profit; adjusted selling, general and administrative expenses; adjusted operating expenses; adjusted cash flow from operations; and adjusted free cash flow from operations. Adjusted earnings per share excludes the effect of charges associated with our restructuring programs and asset impairments, losses and other charges related to refinancing transactions, costs associated with severance payments and benefits to be provided to our former chief executive officer, intangible amortization expense, the amortization of debt discount on our convertible notes, charges associated with the early termination of our interest rate swap agreement and charges related to a stock keeping unit, or SKU, rationalization program. Consistent with past practice, adjusted earnings per share has not been adjusted to exclude the benefit resulting from the forfeiture of equity awards. Constant currency revenue growth excludes the impact of translating the results of international subsidiaries at different currency exchange rates from period to period and the comparable activity of companies acquired or divested within the most recent twelve-month period. Adjusted selling, general and administrative expenses, adjusted operating expenses and adjusted operating income exclude costs associated with severance payments and benefits to be provided to our former chief executive officer. Adjusted cash flow from operations excludes the impact of a tax refund and changes in certain accounting rules. Adjusted free cash flow reflects cash flow from operations minus capital expenditures and dividends and excludes the impact of the adoption of ASC topic 860 and a tax refund. Reconciliation of these non-GAAP measures to the most comparable GAAP measures is contained within this presentation. The following slides reflect continuing operations. |

| 5 FOURTH QUARTER 2011 HIGHLIGHTS |

| 6 Financial Highlights Revenue of $411.7 million, up 6.8% constant currency Adjusted gross margin of 47.1%, down 20 bps vs. prior year Adjusted operating margins of 16.8%, up 200 bps vs. prior year Adjusted EPS of $1.07, up 29% vs. prior year Adjusted earnings impacted ($0.17) due to acceleration of interest rate swap payment |

| 7 Strategic Development Highlights Marketplace continues to accept pricing initiatives Up 50 bps versus prior year Up 40 bps sequentially Adoption of VasoNova VPS in U.S. market continues 20 accounts won since limited market release in 2011 Approximately 30 trials per month scheduled through June 2012 Divested Aerospace assets for $280 million |

| 8 FULL YEAR 2011 HIGHLIGHTS |
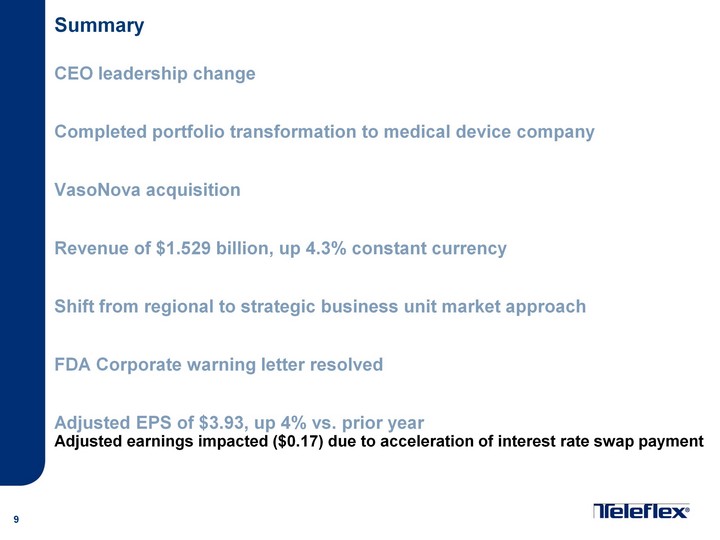
| 9 Summary CEO leadership change Completed portfolio transformation to medical device company VasoNova acquisition Revenue of $1.529 billion, up 4.3% constant currency Shift from regional to strategic business unit market approach FDA Corporate warning letter resolved Adjusted EPS of $3.93, up 4% vs. prior year Adjusted earnings impacted ($0.17) due to acceleration of interest rate swap payment |
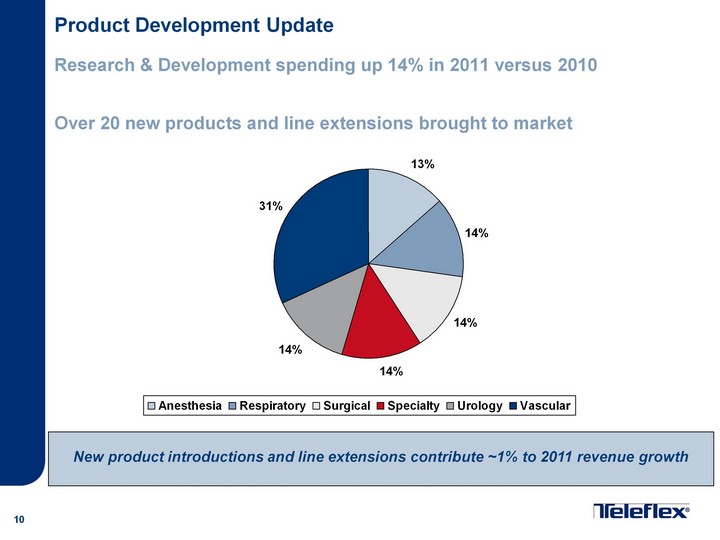
| 10 Product Development Update Research & Development spending up 14% in 2011 versus 2010 Over 20 new products and line extensions brought to market Anesthesia Respiratory Surgical Specialty Urology Vascular 0.136 0.136 0.136 0.136 0.136 0.32 New product introductions and line extensions contribute ~1% to 2011 revenue growth |

| 11 Group Purchasing Organization Update Significant progress made in 2011 Awarded 37 GPO Contracts 10 new awards won 27 award renewals Annualized 2011 revenue through GPOs up 6% versus prior year |

| 12 FOURTH QUARTER 2011 FINANCIAL REVIEW |

| 13 Fourth Quarter - Financial Results Revenue of $411.7 million Up 6.6% Up 6.8% constant currency Adjusted gross margin of 47.1% Down 20 bps vs. prior year Down 80 bps sequentially Research & development spending up 4% from prior year Adjusted operating margin of 16.8% Up 200 bps vs. prior year Down 20 bps sequentially Adjusted EPS of $1.07, up 29% vs. prior year |

| 14 FOURTH QUARTER 2011 PRODUCT & GEOGRAPHIC REVENUE REVIEW |
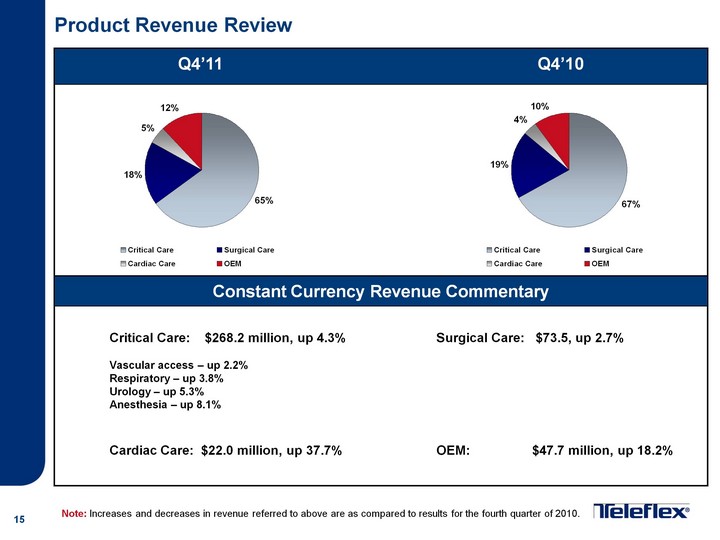
| 15 Product Revenue Review Critical Care Surgical Care Cardiac Care OEM 0.65 0.18 0.05 0.12 Q4'11 Q4'10 Constant Currency Revenue Commentary Critical Care Surgical Care Cardiac Care OEM 0.67 0.19 0.04 0.1 Critical Care: $268.2 million, up 4.3% Surgical Care: $73.5, up 2.7% Vascular access - up 2.2% Respiratory - up 3.8% Urology - up 5.3% Anesthesia - up 8.1% Cardiac Care: $22.0 million, up 37.7% OEM: $47.7 million, up 18.2% Note: Increases and decreases in revenue referred to above are as compared to results for the fourth quarter of 2010. |
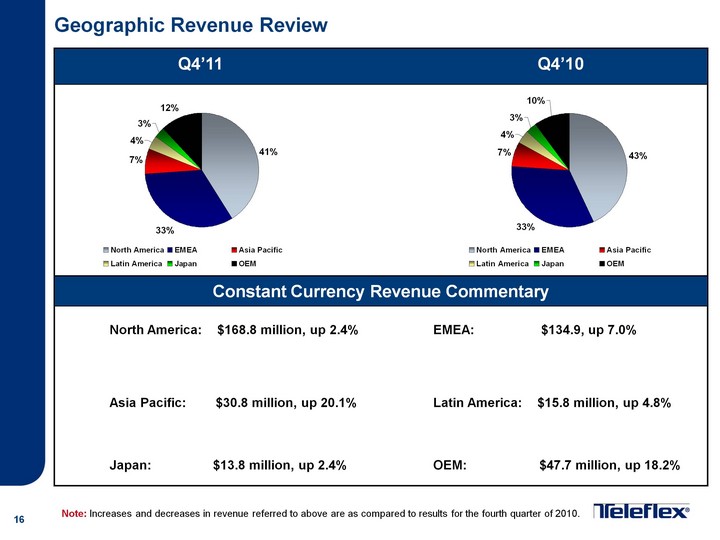
| 16 Geographic Revenue Review North America EMEA Asia Pacific Latin America Japan OEM 0.41 0.33 0.07 0.04 0.03 0.12 Q4'11 Q4'10 Constant Currency Revenue Commentary North America EMEA Asia Pacific Latin America Japan OEM 0.43 0.33 0.07 0.04 0.03 0.1 North America: $168.8 million, up 2.4% EMEA: $134.9, up 7.0% Asia Pacific: $30.8 million, up 20.1% Latin America: $15.8 million, up 4.8% Japan: $13.8 million, up 2.4% OEM: $47.7 million, up 18.2% Note: Increases and decreases in revenue referred to above are as compared to results for the fourth quarter of 2010. |

| 17 2012 OUTLOOK |
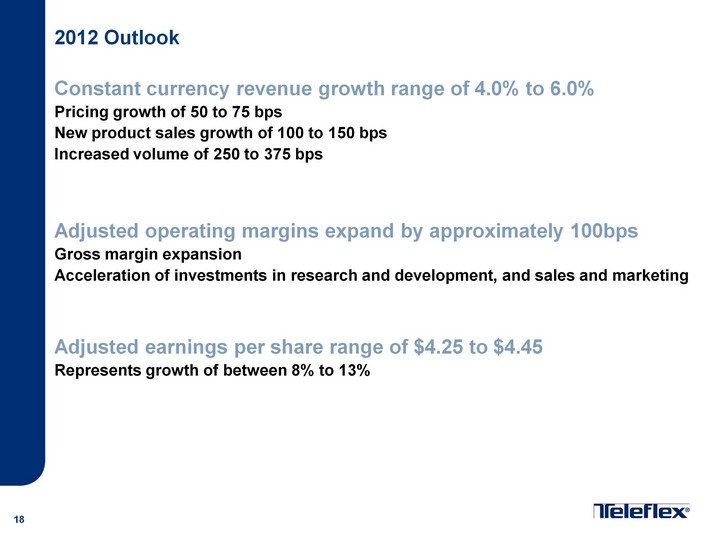
| 18 2012 Outlook Constant currency revenue growth range of 4.0% to 6.0% Pricing growth of 50 to 75 bps New product sales growth of 100 to 150 bps Increased volume of 250 to 375 bps Adjusted operating margins expand by approximately 100bps Gross margin expansion Acceleration of investments in research and development, and sales and marketing Adjusted earnings per share range of $4.25 to $4.45 Represents growth of between 8% to 13% |

| 19 QUESTION & ANSWER |

| 20 APPENDICES |
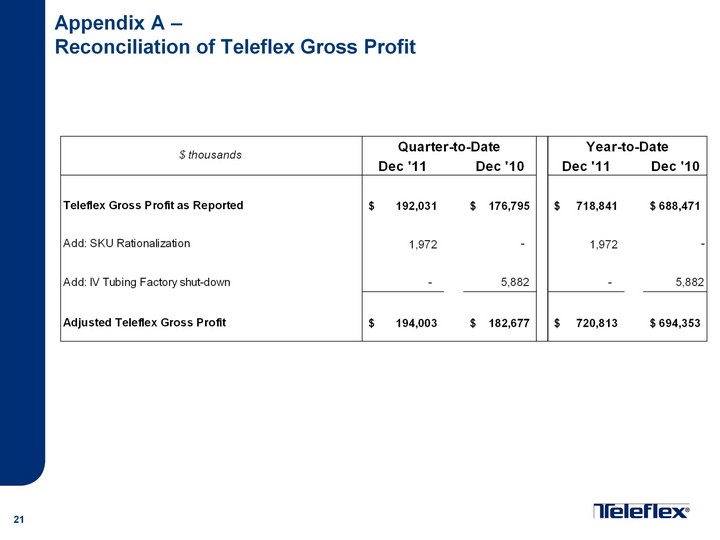
| 21 Appendix A - Reconciliation of Teleflex Gross Profit |
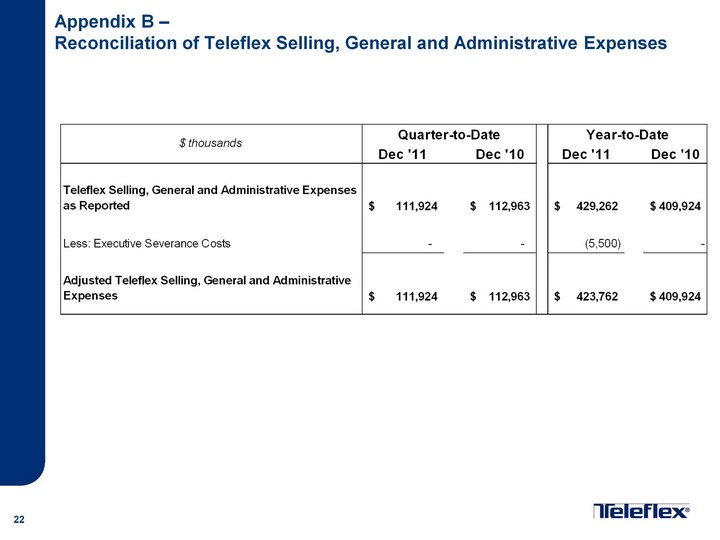
| 22 Appendix B - Reconciliation of Teleflex Selling, General and Administrative Expenses |
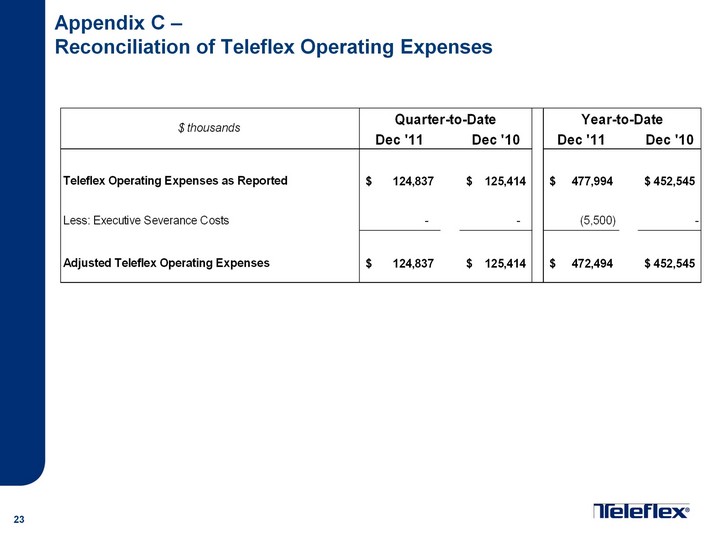
| 23 Appendix C - Reconciliation of Teleflex Operating Expenses |
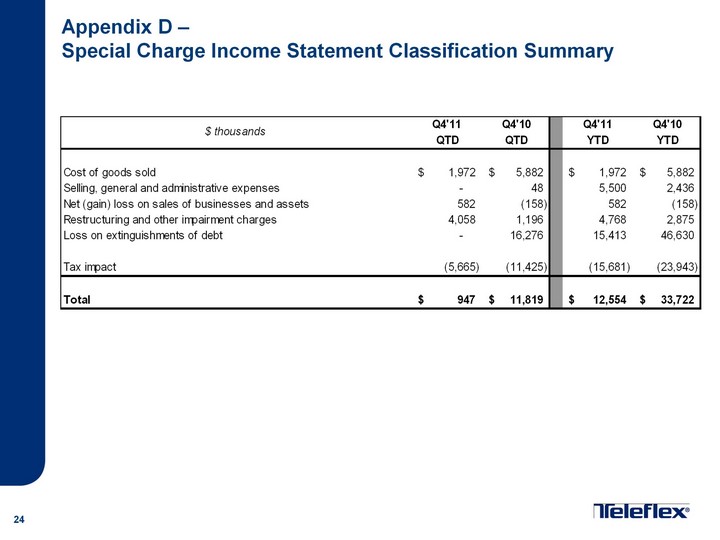
| 24 Appendix D - Special Charge Income Statement Classification Summary |

| 25 Appendix E - Quarter & Year-to-Date Reconciliation of Constant Currency Revenue Growth |
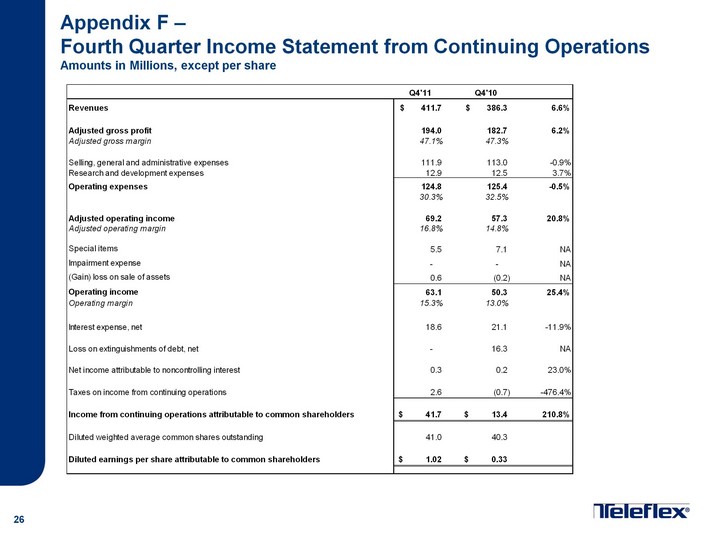
| 26 Appendix F - Fourth Quarter Income Statement from Continuing Operations Amounts in Millions, except per share |
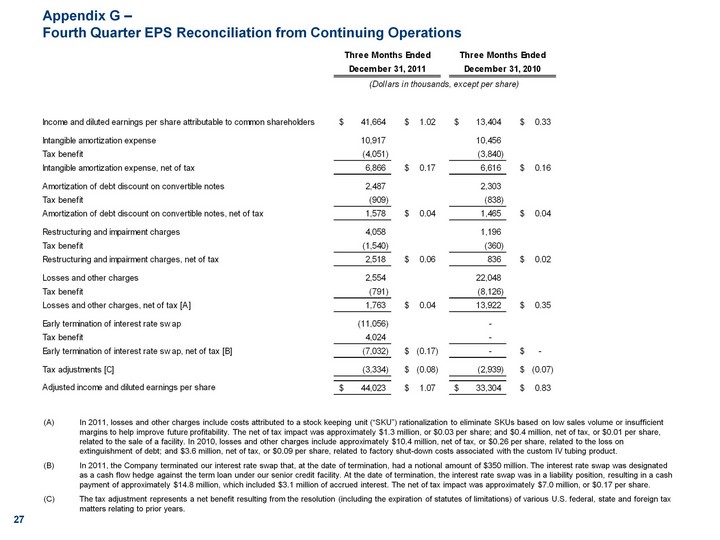
| 27 Appendix G - Fourth Quarter EPS Reconciliation from Continuing Operations In 2011, losses and other charges include costs attributed to a stock keeping unit ("SKU") rationalization to eliminate SKUs based on low sales volume or insufficient margins to help improve future profitability. The net of tax impact was approximately $1.3 million, or $0.03 per share; and $0.4 million, net of tax, or $0.01 per share, related to the sale of a facility. In 2010, losses and other charges include approximately $10.4 million, net of tax, or $0.26 per share, related to the loss on extinguishment of debt; and $3.6 million, net of tax, or $0.09 per share, related to factory shut-down costs associated with the custom IV tubing product. In 2011, the Company terminated our interest rate swap that, at the date of termination, had a notional amount of $350 million. The interest rate swap was designated as a cash flow hedge against the term loan under our senior credit facility. At the date of termination, the interest rate swap was in a liability position, resulting in a cash payment of approximately $14.8 million, which included $3.1 million of accrued interest. The net of tax impact was approximately $7.0 million, or $0.17 per share. The tax adjustment represents a net benefit resulting from the resolution (including the expiration of statutes of limitations) of various U.S. federal, state and foreign tax matters relating to prior years. |
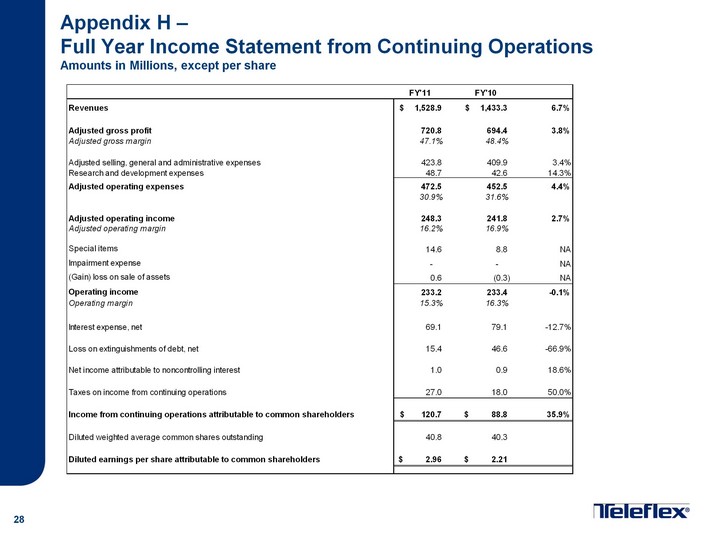
| 28 Appendix H - Full Year Income Statement from Continuing Operations Amounts in Millions, except per share |
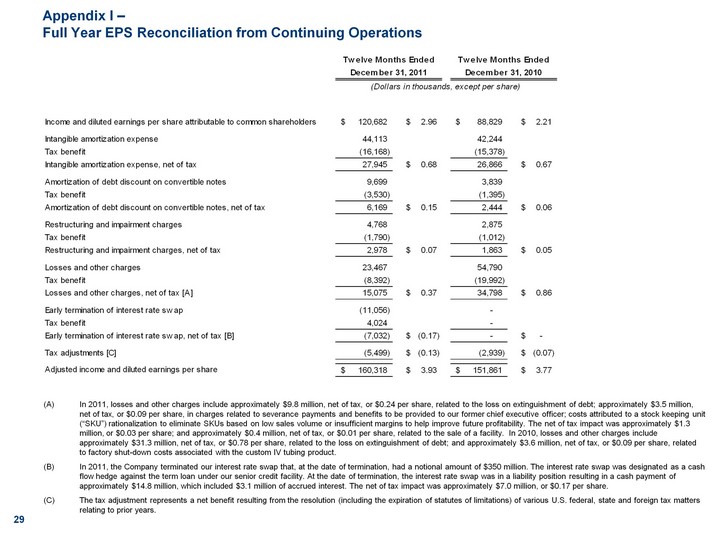
| 29 Appendix I - Full Year EPS Reconciliation from Continuing Operations In 2011, losses and other charges include approximately $9.8 million, net of tax, or $0.24 per share, related to the loss on extinguishment of debt; approximately $3.5 million, net of tax, or $0.09 per share, in charges related to severance payments and benefits to be provided to our former chief executive officer; costs attributed to a stock keeping unit ("SKU") rationalization to eliminate SKUs based on low sales volume or insufficient margins to help improve future profitability. The net of tax impact was approximately $1.3 million, or $0.03 per share; and approximately $0.4 million, net of tax, or $0.01 per share, related to the sale of a facility. In 2010, losses and other charges include approximately $31.3 million, net of tax, or $0.78 per share, related to the loss on extinguishment of debt; and approximately $3.6 million, net of tax, or $0.09 per share, related to factory shut-down costs associated with the custom IV tubing product. In 2011, the Company terminated our interest rate swap that, at the date of termination, had a notional amount of $350 million. The interest rate swap was designated as a cash flow hedge against the term loan under our senior credit facility. At the date of termination, the interest rate swap was in a liability position resulting in a cash payment of approximately $14.8 million, which included $3.1 million of accrued interest. The net of tax impact was approximately $7.0 million, or $0.17 per share. The tax adjustment represents a net benefit resulting from the resolution (including the expiration of statutes of limitations) of various U.S. federal, state and foreign tax matters relating to prior years. |
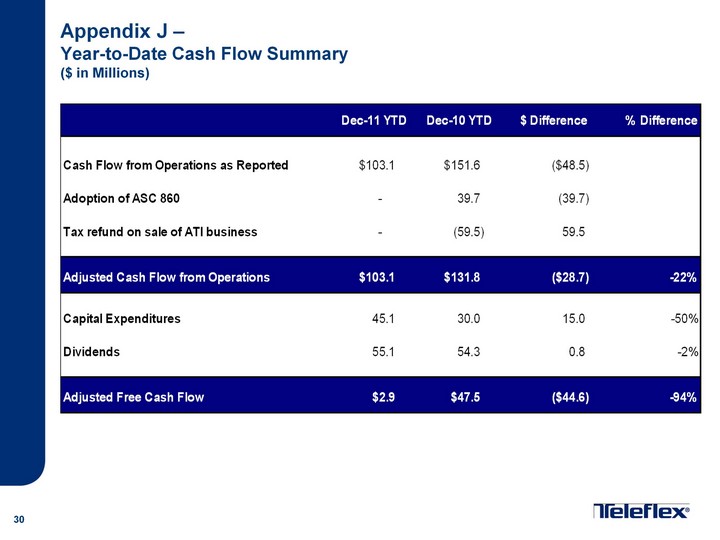
| 30 Appendix J - Year-to-Date Cash Flow Summary ($ in Millions) |

| 31 Appendix K - Quarter-to-Date Reconciliation of Critical Care Product Constant Currency Revenue Growth |
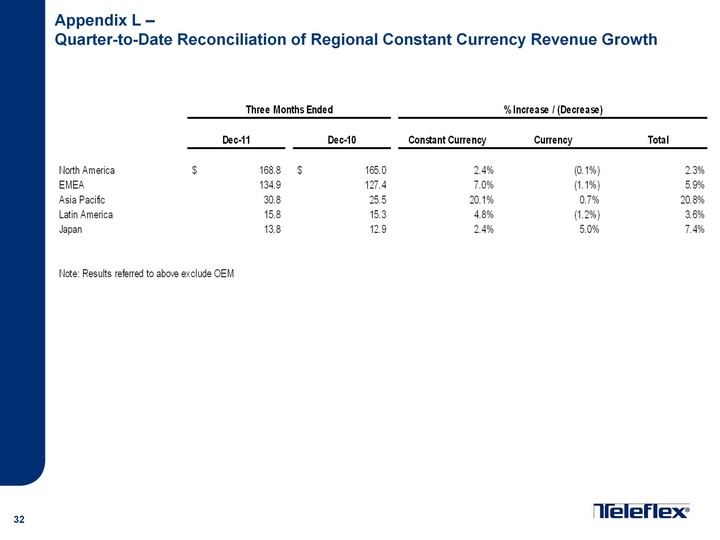
| 32 Appendix L - Quarter-to-Date Reconciliation of Regional Constant Currency Revenue Growth |
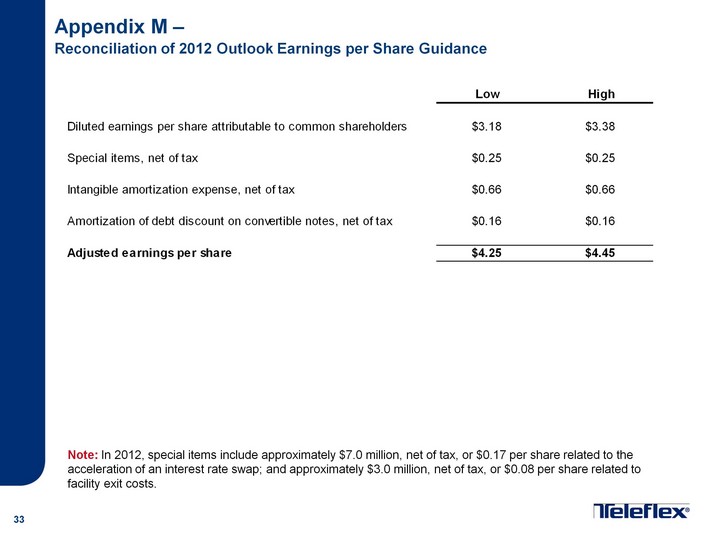
| 33 Appendix M - Reconciliation of 2012 Outlook Earnings per Share Guidance Note: In 2012, special items include approximately $7.0 million, net of tax, or $0.17 per share related to the acceleration of an interest rate swap; and approximately $3.0 million, net of tax, or $0.08 per share related to facility exit costs. |