Attached files
| file | filename |
|---|---|
| EX-21.1 - SUBSIDIARIES OF REGISTRANT - RANGE RESOURCES CORP | d260821dex211.htm |
| EX-99.2 - REPORT OF WRIGHT AND COMPANY - RANGE RESOURCES CORP | d260821dex992.htm |
| EX-32.1 - CERTIFICATION BY THE CHAIRMAN AND CEO - RANGE RESOURCES CORP | d260821dex321.htm |
| EX-23.3 - CONSENT OF WRIGHT AND COMPANY, INDEPENDENT CONSULTING ENGINEERS - RANGE RESOURCES CORP | d260821dex233.htm |
| EX-32.2 - CERTIFICATION BY THE CFO - RANGE RESOURCES CORP | d260821dex322.htm |
| EX-23.1 - CONSENT OF INDEPENDENT REGISTERED PUBLIC ACCOUNTING FIRM - RANGE RESOURCES CORP | d260821dex231.htm |
| EX-99.1 - REPORT OF DEGOYLER AND MACNAUGHTON - RANGE RESOURCES CORP | d260821dex991.htm |
| EX-31.1 - CERTIFICATION BY THE CHAIRMAN AND CEO - RANGE RESOURCES CORP | d260821dex311.htm |
| EX-31.2 - CERTIFICATION BY THE CFO - RANGE RESOURCES CORP | d260821dex312.htm |
| EX-23.2 - CONSENT OF DEGOYLER AND MACNAUGHTON, INDEPENDENT CONSULTING ENGINEERS - RANGE RESOURCES CORP | d260821dex232.htm |
Table of Contents
UNITED STATES
SECURITIES AND EXCHANGE COMMISSION
WASHINGTON, D.C. 20549
FORM 10-K
(Mark one)
| þ | ANNUAL REPORT PURSUANT TO SECTION 13 OR 15(d) OF THE SECURITIES EXCHANGE ACT OF 1934 |
For the fiscal year ended December 31, 2011
OR
| ¨ | TRANSITION REPORT PURSUANT TO SECTION 13 OR 15(d) OF THE SECURITIES EXCHANGE ACT OF 1934 |
For the transition period from to
Commission File Number: 001-12209
RANGE RESOURCES CORPORATION
(Exact Name of Registrant as Specified in Its Charter)
| Delaware | 34-1312571 | |
| (State or Other Jurisdiction of Incorporation or Organization) |
(IRS Employer Identification No.) | |
| 100 Throckmorton Street, Suite 1200, Fort Worth, Texas |
76102 | |
| (Address of Principal Executive Offices) | (Zip Code) | |
Registrant’s telephone number, including area code
(817) 870-2601
Securities registered pursuant to Section 12(b) of the Act:
| Title of Each Class |
Name of Exchange on Which Registered | |
| Common Stock, $.01 par value | New York Stock Exchange |
Securities registered pursuant to Section 12(g) of the Act:
None
Indicate by check mark if the registrant is a well-known seasoned issuer, as defined in Rule 405 of the Securities Act.
Yes þ No ¨
Indicate by check mark if the registrant is not required to file reports pursuant to Section 13 or Section 15(d) of the Act.
Yes ¨ No þ
Indicate by check mark whether the registrant (1) has filed all reports required to be filed by Section 13 or 15(d) of the Securities Exchange Act of 1934 during the preceding 12 months (or for such shorter period that the registrant was required to file such reports), and (2) has been subject to such filing requirements for the past 90 days. Yes þ No ¨
Indicate by check mark whether the registrant has submitted electronically and posted on its corporate website, if any, every Interactive Data File required to be submitted and posted pursuant to Rule 405 of Regulation S-T during the proceedings 12 months (or for such shorter period that the registrant was required to submit and post such files). Yes ¨ No þ
Indicate by check mark if disclosure of delinquent filers pursuant to Item 405 of Regulation S-K is not contained herein, and will not be contained, to the best of registrant’s knowledge, in definitive proxy or information statements incorporated by reference in Part III of this Form 10-K or any amendment to this Form 10-K. ¨
Indicate by check mark whether the registrant is a large accelerated filer, an accelerated filer, a non-accelerated filer, or a smaller reporting company. See the definitions of “large accelerated filer,” “accelerated filer” and “smaller reporting company” in Rule 12b-2 of the Exchange Act (check one):
| Large accelerated filer | þ | Accelerated filer | ¨ | |||
| Non-accelerated filer | ¨ (Do not check if a smaller reporting company) | Smaller reporting company | ¨ | |||
Indicate by check mark whether the registrant is a shell company (as defined in 12b-2 of the Act). Yes ¨ No þ
The aggregate market value of the voting and non-voting common equity held by non-affiliates as of June 30, 2011 was $8,686,292,000. This amount is based on the closing price of registrant’s common stock on the New York Stock Exchange on that date. Shares of common stock held by executive officers and directors of the registrant are not included in the computation. However, the registrant has made no determination that such individuals are “affiliates” within the meaning of Rule 405 of the Securities Act of 1933.
As of February 17, 2012, there were 161,748,938 shares of Range Resources Corporation Common Stock outstanding.
DOCUMENTS INCORPORATED BY REFERENCE
Portions of the registrant’s definitive proxy statement to be furnished to stockholders in connection with its 2012 Annual Meeting of Stockholders, which shall be filed with the Securities and Exchange Commission within 120 days after the end of the fiscal year to which this report relates, are incorporated by reference in Part III, Items 10-14 of this report.
Table of Contents
RANGE RESOURCES CORPORATION
Unless the context otherwise indicates, all references in this report to “Range,” “we,” “us” or “our” are to Range Resources Corporation and its wholly-owned subsidiaries and its ownership interests in equity method investments. Unless otherwise noted, all information in the report relating to natural gas, natural gas liquids and oil reserves and the estimated future net cash flows attributable to those reserves are based on estimates and are net to our interest. If you are not familiar with the oil and gas terms used in this report, please refer to the explanation of such terms under the caption “Glossary of Certain Defined Terms” at the end of Item 15 of this report.
i
Table of Contents
RANGE RESOURCES CORPORATION
Annual Report on Form 10-K
Year Ended December 31, 2011
Cautionary Statement Regarding Forward-Looking Statements
Certain statements and information included in this report, other materials filed or to be filed with the Securities and Exchange Commission (the “SEC”), as well as information included in oral statements or other written statements made or to be made by us, contain or incorporate by reference certain statements (other than statements of historical fact) that constitute forward-looking statements within the meaning of Section 27A of the Securities Act of 1933 and Section 21E of the Securities Exchange Act of 1934. When used herein, the words “budget,” “budgeted,” “assumes,” “should,” “goal,” “anticipates,” “expects,” “believes,” “seeks,” “plans,” “estimates,” “may,” “could,” “future,” “potential,” “intends,” “projects” or “targets” and similar expressions that convey the uncertainty of future events or outcomes are intended to identify forward-looking statements. Where any forward-looking statement includes a statement of the assumptions or bases underlying such forward-looking statement, we caution that while we believe these assumptions or bases to be reasonable and to be made in good faith, assumed facts or bases almost always vary from actual results and the difference between assumed facts or bases and the actual results could be material, depending on the circumstances. It is important to note that our actual results could differ materially from those projected by such forward-looking statements. Although we believe that the expectations reflected in such forward-looking statements are reasonable and such forward-looking statements are based on the best data available at the date this report is filed with the SEC, we cannot assure you that such expectations will prove correct. Known material factors that could cause our actual results to differ from the results discussed in such forward-looking statements are those described in Item 1A of this report under the heading “Risk Factors.” All such forward-looking statements in this document are expressly qualified in their entirety by the cautionary statements in this paragraph, and we undertake no obligation to publicly update or revise any forward-looking statements.
| ITEMS | 1 AND 2. BUSINESS AND PROPERTIES |
General
We are a Fort Worth, Texas-based independent natural gas, natural gas liquids and oil company, engaged in the exploration, development and acquisition of natural gas and oil properties, mostly in the Appalachian and Southwestern regions of the United States. We were incorporated in 1980 under the name Lomak Petroleum, Inc. In 1998, we changed our name to Range Resources Corporation. Our corporate offices are located at 100 Throckmorton Street, Suite 1200, Fort Worth, Texas 76102 (telephone (817) 870-2601). During the past five years, we have increased our proved reserves 187% (from 1.8 Tcfe in 2006 to 5.1 Tcfe in 2011), while production has increased 110% (from 89,988 Mmcfe in 2006 to 189,077 Mmcfe in 2011). At year-end 2011, we owned 2,400,000 gross (1,800,000 net) acres of leasehold, including 290,000 acres where we also own a royalty interest. We have built a multi-year drilling inventory we estimate to contain over 8,600 proven and unproven drilling locations.
At year-end 2011, our proved reserves had the following characteristics:
| • | 5.1 Tcfe of proved reserves; |
| • | 79% natural gas; |
| • | 48% proved developed; |
| • | 87% operated; |
| • | a reserve life of 22 years (based on fourth quarter 2011 production); |
| • | a pre-tax present value of $6.1 billion of future net cash flows attributable to our reserves, discounted at 10% per annum (“PV-10”); and |
| • | a standardized after-tax measure of discounted future net cash flows of $4.5 billion. |
PV-10 is considered a non-GAAP financial measure as defined by the SEC. We believe that the presentation of PV-10 is relevant and useful to our investors as supplemental disclosure to the standardized measure, or after-tax amount, because it presents the discounted future net cash flows attributable to our proved reserves before taking into account future corporate income taxes and our current tax structure. While the standardized measure is dependent on the unique tax situation of each company, PV-10 is based on prices and discount factors that are consistent for all companies. Because of this, PV-10 can be used within the industry and by creditors and securities analysts to evaluate estimated net cash flows from proved reserves on a more comparable basis. The difference between the standardized measure and the PV-10 amount is discounted estimated future income tax of $1.6 billion at December 31, 2011.
1
Table of Contents
Business Strategy
Our objective is to build stockholder value through consistent growth in reserves and production on a cost-efficient basis. Our strategy to achieve our objective is to increase reserves and production through internally generated drilling projects coupled with occasional complementary acquisitions. Our strategy requires us to make significant investments in technical staff, acreage, seismic data and technology to build drilling inventory. Our strategy has the following principal elements:
| • | Concentrate in Core Operating Areas. We currently operate in two regions: the Appalachian (which includes shale tight gas, coal bed methane and conventional natural gas, natural gas liquids, condensate and oil production in Pennsylvania, Virginia, and West Virginia) and Southwestern (which includes the Permian Basin of West Texas and the Delaware Basin of New Mexico, the Texas Panhandle, the Ardmore Basin in Southern Oklahoma, the Nemaha Uplift in Northern Oklahoma and the Anadarko Basin of Western Oklahoma). Concentrating our drilling and producing activities in these core areas allows us to develop the regional expertise needed to interpret specific geological and operating trends and develop economies of scale. Operating in multiple core areas allows us to blend the production characteristics of each area to balance our portfolio toward our goal of consistent production and reserve growth at attractive returns. |
| • | Maintain Multi-Year Drilling Inventory. We focus on areas with multiple prospective, productive horizons and development opportunities. We use our technical expertise to build and maintain a multi-year drilling inventory. A large, multi-year inventory of drilling projects increases our ability to consistently grow production and reserves. Currently, we have over 8,600 proven and unproven drilling locations in inventory. |
| • | Focus on cost efficiency. We concentrate in core areas which we believe to have sizeable hydrocarbon deposits in place that will allow us to consistently increase production while controlling costs. As there is little long-term competitive sales price advantage available to a commodity producer, the costs to find, develop, and produce a commodity are important to organizational sustainability and long-term shareholder value creation. We endeavor to control costs such that our cost to find, develop and produce natural gas and oil is in the best performing quartile of our peer group. |
| • | Commitment to environmental, health and safety. We implement the latest technologies and best practices to minimize potential impacts from the development of our nation’s natural resources as it relates to the environment, worker health and safety, and the health and safety of the communities where we operate. Working with peer companies, regulators, nongovernmental organizations, industries not related to the natural gas industry, and other engaged stakeholders, we consistently analyze and review performance while striving for continual improvement. In July 2010, we voluntarily elected to provide, on our website, the hydraulic fracturing components for all wells operated by us and completed to the Marcellus Shale formation. |
| • | Maintain Long-Life Reserve Base. Long-life natural gas and oil reserves provide a more stable growth platform than short-life reserves. Long-life reserves reduce reinvestment risk as they lessen the amount of reinvestment capital deployed each year to replace production. Long-life natural gas and oil reserves also assist us in minimizing costs as stable production makes it easier to build and maintain operating economies of scale. We use our acquisition, divestiture, and drilling activities to assist in executing this strategy. |
| • | Maintain Flexibility. Because of the risks involved in drilling, coupled with changing commodity prices, we remain flexible and adjust our capital budget throughout the year. If certain areas generate higher than anticipated returns, we may accelerate drilling and acquisitions in those areas and decrease capital expenditures and acquisitions elsewhere. We also believe in maintaining a strong balance sheet and using commodity derivatives, which allows us to be more opportunistic in lower price environments and provides more consistent financial results. |
| • | Equity Ownership and Incentive Compensation. We want our employees to think and act like stockholders. To achieve this, we reward and encourage them through equity ownership in Range. All full-time employees receive equity grants. As of December 31, 2011, our employees owned equity securities in our benefit plans (vested and unvested) that had an aggregate market value of approximately $314.0 million. |
2
Table of Contents
Significant Accomplishments in 2011
| • | Production growth – In 2011, our annual production averaged 518.0 Mmcfe per day, an increase of 36% from 2010. Including our Barnett Shale properties, which were sold in April 2011, our production in 2011 increased 12% from 2010. Targeted drilling in our Marcellus Shale play in Pennsylvania drove our production growth. |
| • | Reserve growth – Total proved reserves increased 14% in 2011 to 5.1 Tcfe, marking the tenth consecutive year our proved reserves have increased. Despite selling over 20% of our reserves with the sale of our Barnett Shale properties, we were able to fully replace the sold reserves and increase total reserves. This achievement is the result of continued drilling success, as all of our production and reserve growth in 2011 came from our drilling program. While consistent growth is challenging to sustain, we believe the quality of our technical teams and our substantial inventory of drilling locations provide the basis for future reserve, production and cash flow growth. |
| • | Successful drilling program – In 2011, we drilled 301 gross wells. Production was replaced by 738% through drilling in 2011 and our overall drilling success rate was 99.6%. As we continue to build our drilling inventory for the future, our ability to drill a large number of wells each year on a cost effective and efficient basis is critical. |
| • | Large resource potential from unconventional and conventional plays – Maintaining a large exposure to potential resources is important. We continued expansion of our unconventional resource shale plays in 2011. We have five large unconventional plays – the Marcellus, Utica and Upper Devonian shales in Pennsylvania, the Huron Shale in Virginia and West Virginia and the Cline Shale in West Texas. These plays cover expansive areas, provide multi-year drilling opportunities and have sustainable lower risk growth profiles. The economics of these plays have been enhanced by continued advancements in drilling and completion technologies. We have expanded into the conventional horizontal Mississippian play in Northern Oklahoma and Kansas. We have now leased 1.7 million net acres in these five shale plays. We also have 150,000 net acres in our coal bed methane plays in Virginia. |
| • | Maintenance of a strong balance sheet – Financial leverage, as measured by the debt-to-capitalization ratio, decreased from 47% in 2010 to 45% in 2011. In 2011, we issued $500.0 million of senior subordinated fixed rate 5.75% notes having a 10-year maturity. A portion of the proceeds we received from the issuance of the 5.75% senior subordinated notes was used to purchase or redeem our 6.375% senior subordinated notes due 2015 and our 7.5% senior subordinated notes due 2016. This helped to better align the maturity schedule of our debt with the long-term life of our assets and reduce interest rate volatility. |
| • | Successful land acquisitions completed – In 2011, we leased $221.0 million of acreage located in our core areas, primarily in the Marcellus Shale and the horizontal Mississippian conventional play in Oklahoma and Kansas. We continued to see outstanding results in the Marcellus Shale. Production in the Marcellus Shale increased 89% while we continue to prove up acreage, acquire additional acreage and gain access to additional pipeline and processing capacity. |
| • | Successful dispositions completed – In April and August 2011, we sold substantially all of our Barnett Shale properties in North Central Texas for gross proceeds of $889.3 million including certain derivative contracts assumed by the buyer. |
Industry Operating Environment
The oil and natural gas industry is affected by many factors that we cannot control. Government regulations, particularly in the areas of taxation, energy, climate change and the environment, can have a significant impact on operations and profitability. For several years preceding the 2008 worldwide economic decline, the oil and gas industry was characterized by volatile but upward trending oil, natural gas liquids (“NGLs”) and natural gas commodity prices. The combination of lower demand due to the economic slowdown and greater North American gas supply has resulted in significant declines in natural gas prices from mid-2008. While oil and NGL prices have steadily improved since the beginning of second quarter 2009, natural gas prices have remained depressed. Natural gas prices are generally determined by North American supply and demand. The New York Mercantile Exchange (“NYMEX”) monthly settlement prices for natural gas averaged $4.02 per mcf in 2011, with a high of $4.43 per mcf in February and a low of $3.41 per mcf in December. Natural gas prices continue to be under pressure due to concerns over excess supply of natural gas due to the high productivity of emerging shale plays in the United States and continued lower product demand caused by a weakened economy and mild weather. The unseasonably warm winter experienced in the Northeastern United States has significantly impacted demand for natural gas since it is a primary heating source.
Significant factors that will impact 2012 crude oil prices include the response to the worldwide economic decline, political and economic developments in the Middle East, demand in Asian and European markets, and the extent to which members of the Organization of Petroleum Exporting Countries and other oil exporting nations are able to manage oil supply through export quotas. NYMEX monthly settlement prices for oil averaged $95.24 per barrel in 2011, with a high of $110.04 per barrel in April and a low of $85.61 per barrel in September.
3
Table of Contents
Segment and Geographical Information
Our operations consist of one reportable segment. We have a single, company-wide management team that administers all properties as a whole rather than by discrete operating segments. We track only basic operational data by area. We do not maintain complete separate financial statement information by area. We measure financial performance as a single enterprise and not on an area-by-area basis. We focus on both unconventional resource plays and conventional plays in the Appalachian and Southwestern regions of the United States.
Outlook for 2012
Our capital expenditure budget for 2012 has been initially set at approximately $1.6 billion. As has been our historical practice, we will periodically review our capital expenditures throughout the year and adjust the budget based on commodity prices and drilling success. The 2012 budget includes $1.3 billion for drilling, $215.0 million for land, $47.0 million for seismic and $73.0 million for the expansion and enhancement of gathering systems and facilities. Approximately 88% of the budget is attributable to the Appalachian region and 12% to the Southwestern region. At December 31, 2011, approximately 69% of our expected 2012 natural gas, NGL and oil production is hedged. For a complete discussion of our hedging activities, a listing of open contracts at December 31, 2011 and the estimated fair value of these contracts as of that date, see Note 11 to our consolidated financial statements.
Production, Price and Cost History
The following table sets forth information regarding natural gas, natural gas liquids, and oil production, realized prices and production costs for the last three years. For additional information see “Item 7. Management’s Discussion and Analysis of Financial Condition and Results of Operations.”
| Year Ended December 31, | ||||||||||||
| 2011 | 2010 | 2009 | ||||||||||
| Production |
||||||||||||
| Natural gas (Mmcf) |
145,206 | 106,148 | 90,570 | |||||||||
| Natural gas liquids (Mbbls) |
5,352 | 3,600 | 1,585 | |||||||||
| Crude oil (Mbbls) |
1,960 | 1,934 | 2,523 | |||||||||
| Total (Mmcfe) (a) |
189,077 | 139,357 | 115,219 | |||||||||
| Average sales prices (wellhead) |
||||||||||||
| Natural gas (per mcf) |
$ | 4.21 | $ | 4.54 | $ | 4.00 | ||||||
| Natural gas liquids (per bbl) |
50.23 | 39.75 | 30.34 | |||||||||
| Crude oil (per bbl) |
86.22 | 69.18 | 54.94 | |||||||||
| Total (per mcfe) (a) |
5.55 | 5.44 | 4.76 | |||||||||
| Average realized prices (including derivatives that qualify for hedge accounting): |
||||||||||||
| Natural gas (per mcf) |
$ | 5.06 | $ | 5.15 | $ | 6.10 | ||||||
| Natural gas liquids (per bbl) |
50.23 | 39.75 | 30.34 | |||||||||
| Crude oil (per bbl) |
86.22 | 69.19 | 59.69 | |||||||||
| Total (per mcfe) (a) |
6.21 | 5.91 | 6.52 | |||||||||
| Average realized prices (including all derivative settlements and third party transportation costs) |
||||||||||||
| Natural gas (per mcf) |
$ | 4.43 | $ | 4.89 | $ | 7.65 | ||||||
| Natural gas liquids (per bbl) |
50.82 | 39.75 | 30.34 | |||||||||
| Crude oil (per bbl) |
81.34 | 69.19 | 62.57 | |||||||||
| Total (per mcfe) (a) |
5.68 | 5.71 | 7.80 | |||||||||
| Production costs |
||||||||||||
| Lease operating (per mcfe) |
$ | 0.57 | $ | 0.66 | $ | 0.79 | ||||||
| Workovers (per mcfe) |
0.02 | 0.02 | 0.04 | |||||||||
| Stock-based compensation (per mcfe) |
0.01 | 0.01 | 0.02 | |||||||||
|
|
|
|
|
|
|
|||||||
| Total (per mcfe) |
$ | 0.60 | $ | 0.69 | $ | 0.85 | ||||||
|
|
|
|
|
|
|
|||||||
| (a) | Oil and NGLs are converted at the rate of one barrel equals six mcf based upon the approximate relative energy content of oil to natural gas, which is not indicative of the relationship of oil and natural gas prices. |
4
Table of Contents
Proved Reserves
The following table sets forth our estimated proved reserves for 2011, 2010 and 2009 based on the average of prices on the first day of each month of the given fiscal year, in accordance with the SEC rules that became effective on December 31, 2009. We have no natural gas, NGL or oil reserves from non-traditional sources. Additionally, we do not provide optional disclosures of probable or possible reserves:
| Summary of Oil and Gas Reserves as of Fiscal Year-End Based on Average Fiscal-Year Prices |
||||||||||||||||||||
| Reserve Category |
Natural Gas (Mmcf) |
NGLs (Mbbls) |
Oil (Mbbls) |
Total (Mmcfe)(a) |
% | |||||||||||||||
| 2011: |
||||||||||||||||||||
| Proved |
||||||||||||||||||||
| Developed |
1,907,209 | 64,472 | 17,872 | 2,401,274 | 48 | % | ||||||||||||||
| Undeveloped |
2,102,467 | 78,043 | 13,660 | 2,652,687 | 52 | % | ||||||||||||||
|
|
|
|
|
|
|
|
|
|||||||||||||
| Total Proved |
4,009,676 | 142,515 | 31,532 | 5,053,961 | ||||||||||||||||
|
|
|
|
|
|
|
|
|
|||||||||||||
| 2010: |
||||||||||||||||||||
| Proved |
||||||||||||||||||||
| Developed |
1,762,766 | 53,071 | 17,050 | 2,183,488 | 49 | % | ||||||||||||||
| Undeveloped |
1,803,760 | 69,651 | 6,189 | 2,258,802 | 51 | % | ||||||||||||||
|
|
|
|
|
|
|
|
|
|||||||||||||
| Total Proved |
3,566,526 | 122,722 | 23,239 | 4,442,290 | ||||||||||||||||
|
|
|
|
|
|
|
|
|
|||||||||||||
| 2009: |
||||||||||||||||||||
| Proved |
||||||||||||||||||||
| Developed |
1,445,705 | 26,205 | 20,626 | 1,726,696 | 55 | % | ||||||||||||||
| Undeveloped |
1,169,012 | 25,382 | 13,457 | 1,402,043 | 45 | % | ||||||||||||||
|
|
|
|
|
|
|
|
|
|||||||||||||
| Total Proved |
2,614,717 | 51,587 | 34,083 | 3,128,739 | ||||||||||||||||
|
|
|
|
|
|
|
|
|
|||||||||||||
| a) | Oil and NGLs are converted to mcfe at the rate of one barrel equals six mcf based upon the relative energy content of oil to natural gas, which is not indicative of the relationship of oil and natural gas prices. |
| Summary of Oil and Gas Reserves as of Fiscal Year-End Based on End of Year Prices |
||||||||||||||||||||
| Reserve Category |
Natural Gas (Mmcf) |
NGLs (Mbbls) |
Oil (Mbbls) |
Total (Mmcfe) (a) |
% | |||||||||||||||
| 2008: |
||||||||||||||||||||
| Proved |
||||||||||||||||||||
| Developed |
1,337,978 | 16,398 | 32,611 | 1,632,032 | 62 | % | ||||||||||||||
| Undeveloped |
875,568 | 7,451 | 16,876 | 1,021,531 | 38 | % | ||||||||||||||
|
|
|
|
|
|
|
|
|
|||||||||||||
| Total proved |
2,213,546 | 23,849 | 49,487 | 2,653,563 | ||||||||||||||||
|
|
|
|
|
|
|
|
|
|||||||||||||
| 2007: |
||||||||||||||||||||
| Proved |
||||||||||||||||||||
| Developed |
1,144,709 | 13,487 | 33,528 | 1,426,801 | 64 | % | ||||||||||||||
| Undeveloped |
688,088 | 4,261 | 15,384 | 805,961 | 36 | % | ||||||||||||||
|
|
|
|
|
|
|
|
|
|||||||||||||
| Total proved |
1,832,797 | 17,748 | 48,912 | 2,232,762 | ||||||||||||||||
|
|
|
|
|
|
|
|
|
|||||||||||||
| (a) | Oil and NGLs are converted to mcfe at the rate of one barrel equals six mcf based upon the relative energy content of oil to natural gas, which is not indicative of the relationship of oil and natural gas prices. |
5
Table of Contents
The following table sets forth summary information by area with respect to estimated proved reserves at December 31, 2011:
| Reserve Volumes | PV-10 (a) | |||||||||||||||||||||||||||
| Natural Gas (Mmcf) |
NGL (Mbbls) |
Oil (Mbbls) |
Total (Mmcfe) |
% | Amount (In thousands) |
% | ||||||||||||||||||||||
| Appalachian Region |
3,574,038 | 104,330 | 13,408 | 4,280,466 | 85 | % | $ | 4,516,664 | 74 | % | ||||||||||||||||||
| Southwestern Region |
435,638 | 38,185 | 18,124 | 773,495 | 15 | % | 1,567,147 | 26 | % | |||||||||||||||||||
|
|
|
|
|
|
|
|
|
|
|
|
|
|
|
|||||||||||||||
| Total |
4,009,676 | 142,515 | 31,532 | 5,053,961 | 100 | % | $ | 6,083,811 | 100 | % | ||||||||||||||||||
|
|
|
|
|
|
|
|
|
|
|
|
|
|
|
|||||||||||||||
| (a) | PV-10 was prepared using the twelve-month average prices for 2011, discounted at 10% per annum. Year-end PV-10 is a non-GAAP financial measure as defined by the SEC. We believe that the presentation of PV-10 is relevant and useful to our investors as supplemental disclosure to the standardized measure, or after tax amount, because it presents the discounted future net cash flows attributable to our proved reserves prior to taking into account future corporate income taxes and our current tax structure. While the standardized measure is dependent on the unique tax situation of each company, PV-10 is based on prices and discount factors that are consistent for all companies. Because of this, PV-10 can be used within the industry and by creditors and securities analysts to evaluate estimated net cash flows from proved reserves on a more comparable basis. The difference between the standardized measure and the PV-10 amount is the discounted estimated future income tax of $1.6 billion at December 31, 2011. Included in the $6.1 billion PV-10 is $4.1 billion (pre-tax) related to proved developed reserves. |
Reserve Estimation
All reserve information in this report is based on estimates prepared by our petroleum engineering staff. We also have the following independent petroleum consultants conduct an audit of our year-end reserves: DeGolyer and MacNaughton (Southwestern) and Wright and Company, Inc. (Appalachian). These engineers were selected for their geographic expertise and their historical experience in engineering certain properties. At December 31, 2011, these consultants collectively audited approximately 89% of our proved reserves. Copies of the summary reserve reports prepared by each of these independent petroleum consultants are included as an exhibit to this Annual Report on Form 10-K. The technical person at each independent petroleum consulting firm responsible for reviewing the reserve estimates presented herein meet the requirements regarding qualifications, independence, objectivity and confidentiality set forth in the Standards Pertaining to the Estimating and Auditing of Oil and Gas Reserves Information promulgated by the Society of Petroleum Engineers. We maintain an internal staff of petroleum engineers and geoscience professionals who work closely with our independent petroleum consultants to ensure the integrity, accuracy and timeliness of data furnished to independent petroleum consultants for their reserve audit process. Throughout the year, our technical team meets periodically with representatives of each of our independent petroleum consultants to review properties and discuss methods and assumptions. While we have no formal committee specifically designated to review reserves reporting and the reserves estimation process, our senior management reviews and approves any internally estimated significant changes to our proved reserves. We provide historical information to our consultants for our largest producing properties such as ownership interest, natural gas, NGL and oil production, well test data, commodity prices and operating and development costs. The consultants perform an independent analysis and differences are reviewed with our Senior Vice President of Reservoir Engineering and Economics. In some cases, additional meetings are held to review additional reserve work performed by the technical teams related to any identified reserve differences.
Historical variances between our reserve estimates and the aggregate estimates of our consultants have been less than 5%. All of our reserve estimates are reviewed and approved by our Senior Vice President of Reservoir Engineering and Economics, who reports directly to our President and Chief Executive Officer. Our Senior Vice President of Reservoir Engineering and Economics holds a Bachelor of Science degree in Electrical Engineering from the Pennsylvania State University. Before joining Range, he held various technical and managerial positions with Amoco, Hunt Oil and Union Pacific Resources and has more than thirty years of experience in the oil and gas industry. During the year, our reserves group may also perform separate, detailed technical reviews of reserve estimates for significant acquisitions or for properties with problematic indicators such as excessively long lives, sudden changes in performance or changes in economic or operation conditions. We did not file any reports during the year ended December 31, 2011 with any federal authority or agency with respect to our estimate of natural gas and oil reserves.
6
Table of Contents
Reserve Technologies
Proved reserves are those quantities of natural gas, natural gas liquids and oil, which, by analysis of geoscience and engineering data, can be estimated with reasonable certainty to be economically producible from a given date forward, from known reservoirs, and under existing economic conditions, operating methods, and government regulations. The term “reasonable certainty” implies a high degree of confidence that the quantities of natural gas, NGL and oil actually recovered will equal or exceed the estimate. To achieve reasonable certainty, our internal technical staff employs technologies that have been demonstrated to yield results with consistency and repeatability. The technologies and economic data used in the estimation of our proved reserves include, but are not limited to, empirical evidence through drilling results and well performance, well logs, geologic maps and available downhole and production data, seismic data, well test data and reservoir simulation modeling.
Reporting of Natural Gas Liquids
We produce natural gas liquids, or NGLs, as part of the processing of our natural gas. The extraction of NGLs in the processing of natural gas reduces the volume of natural gas available for sale. At December 31, 2011, NGLs represented approximately 17% of our total proved reserves on an mcf equivalent basis. NGLs are products sold by the gallon. In reporting proved reserves and production of NGLs, we have included production and reserves in barrels. Prices for a barrel of NGLs in 2011 averaged approximately 58% lower than the average prices for equivalent volumes of oil. We report all production information related to natural gas net of the effect of any reduction in natural gas volumes resulting from the processing of NGLs.
Proved Undeveloped Reserves (PUDs)
As of December 31, 2011, our PUDs totaled 13.7 Mmbbls of crude oil, 78.0 Mmbbls of NGLs and 2.1 Tcf of natural gas, for a total of 2.7 Tcfe. Costs incurred relating to the development of PUDs were approximately $374.2 million in 2011. Approximately 92% of our PUDs at year-end 2011 were associated with our major development areas in our Marcellus and Nora properties. All PUD drilling locations are scheduled to be drilled prior to the end of 2016 with more than 69% of the future development costs to be spent in the next three years. Changes in PUDs that occurred during the year were due to:
| • | conversion of approximately 364.2 Bcfe PUDs into proved developed reserves; |
| • | new PUDs added of 1.2 Tcfe; and |
| • | reductions of approximately 408.7 Bcfe in PUDs due to sales of properties and a 15.1 Bcfe negative revision with reserves reclassified to unproved because of a slower pace of development activity beyond the five-year development horizon partially offset by a favorable performance revision. |
Proved Reserves (PV-10)
The following table sets forth the estimated future net cash flows, excluding open hedging contracts, from proved reserves, the present value of those net cash flows discounted 10% (PV-10), and the expected benchmark prices and average field prices used in projecting net cash flows over the past five years. Field prices, or wellhead prices reported below, are net of third party transportation, gathering and compression expense paid by Range (in millions, except prices):
| Year Ended December 31, | ||||||||||||||||||||
| 2011 | 2010 | 2009 | 2008 | 2007 | ||||||||||||||||
| Future net cash flows |
$ | 15,610 | $ | 12,516 | $ | 6,721 | $ | 8,441 | $ | 11,908 | ||||||||||
| Present value |
||||||||||||||||||||
| Before income tax |
6,084 | 4,647 | 2,593 | 3,400 | 5,205 | |||||||||||||||
| After income tax (Standardized Measure) |
4,515 | 3,479 | 2,091 | 2,581 | 3,666 | |||||||||||||||
| Benchmark prices (NYMEX) |
||||||||||||||||||||
| Gas price (per mcf) |
4.12 | 4.38 | 3.87 | 5.71 | 6.80 | |||||||||||||||
| Oil price (per barrel) |
95.61 | 79.81 | 60.85 | 44.60 | 95.98 | |||||||||||||||
| Wellhead prices |
||||||||||||||||||||
| Gas price (per mcf) |
3.55 | 3.70 | 3.19 | 5.23 | 6.44 | |||||||||||||||
| Oil price (per barrel) |
85.59 | 72.51 | 54.65 | 42.76 | 91.88 | |||||||||||||||
| NGL price (per barrel) |
49.24 | 39.14 | 34.05 | 25.00 | 52.64 | |||||||||||||||
7
Table of Contents
Future net cash flows represent projected revenues from the sale of proved reserves net of production and development costs (including operating expenses and production taxes). Prices for 2011, 2010 and 2009 were based on a twelve-month unweighted average of the first day of the month pricing, without escalation. Prices for 2008 and 2007 were based on prices in effect at December 31 of each year, without escalation, in accordance with SEC rules in effect during those years. Such calculations are also based on costs in effect at December 31 of each year, without escalation. We do not believe the proposed impact fee in Pennsylvania will impact our reserves. There can be no assurance that the proved reserves will be produced in the future or that prices and costs will remain constant. There are numerous uncertainties inherent in estimating reserves and related information and different reservoir engineers often arrive at different estimates for the same properties.
Property Overview
Our natural gas and oil operations are concentrated in the Appalachian and Southwestern regions of the United States. Our properties consist of interests in developed and undeveloped natural gas and oil leases in these regions. These interests entitle us to drill for and produce natural gas, NGLs and oil from specific areas. Our interests are mostly in the form of working interests and, to a lesser extent, royalty and overriding royalty interests. We have a single company-wide management team that administers all properties as a whole rather than by discrete operating segments; therefore, segment reporting is not applicable to us. We track only basic operational data by area. We do not maintain complete separate financial statement information by area. We measure financial performance as a single enterprise and not on an area-by-area basis.
The table below summarizes data for our operating regions for the year-ended December 31, 2011.
| Region |
Average Daily Production (Mcfe per day) |
Production (Mmcfe) |
Percentage of Production |
Proved Reserves (Mmcfe) |
Percentage
of Proved Reserves |
|||||||||||||||
| Appalachian |
393,562 | 143,650 | 76 | % | 4,280,466 | 85 | % | |||||||||||||
| Southwestern |
124,457 | 45,427 | 24 | % | 773,495 | 15 | % | |||||||||||||
|
|
|
|
|
|
|
|
|
|
|
|||||||||||
| 518,019 | 189,077 | 100 | % | 5,053,961 | 100 | % | ||||||||||||||
|
|
|
|
|
|
|
|
|
|
|
|||||||||||
The following table summarizes our costs incurred by operating region for 2011 (in thousands):
| Region |
Acreage Purchases |
Development Costs |
Exploration Costs |
Gathering Facilities |
Asset Retirement Obligations |
Total | ||||||||||||||||||
| Appalachian |
$ | 166,228 | $ | 912,951 | $ | 259,721 | $ | 52,949 | $ | 23,887 | $ | 1,415,736 | ||||||||||||
| Southwestern |
54,348 | 94,098 | 48,566 | 438 | 174 | 197,624 | ||||||||||||||||||
|
|
|
|
|
|
|
|
|
|
|
|
|
|||||||||||||
| Total costs incurred |
$ | 220,576 | $ | 1,007,049 | $ | 308,287 | $ | 53,387 | $ | 24,061 | $ | 1,613,360 | ||||||||||||
|
|
|
|
|
|
|
|
|
|
|
|
|
|||||||||||||
8
Table of Contents
Approximately 82% of our proved reserves at December 31, 2011 are located in the Marcellus Shale and the Nora Area (in the western portion of Virginia) in our Appalachia region. Each of these plays has a large portfolio of drilling opportunities. Our reserve estimates do not include any probable or possible reserves. The following table below sets forth annual production volumes, sales price and cost data for our largest fields as of December 31, 2011 (those whose reserves are greater than 15% of our total proved reserves on December 31, 2011). Nora is located in the western portion of Virginia.
| Year Ended December 31, 2011 | ||||||||
| Marcellus | Nora | |||||||
| Production information: |
||||||||
| Natural gas (Mmcf) |
80,554 | 27,551 | ||||||
| Natural gas liquids (Mbbls) |
3,423 | — | ||||||
| Crude oil (Mbbls) |
695 | — | ||||||
| Total Mmcfe (a) |
105,264 | 27,551 | ||||||
| Average sales prices: (b) |
||||||||
| Natural gas (per mcf) |
$ | 3.17 | $ | 2.95 | ||||
| Natural gas liquids (per bbl) |
51.83 | — | ||||||
| Crude oil (per bbl) |
74.84 | — | ||||||
| Total (per mcfe) |
4.60 | 2.95 | ||||||
| Production costs: |
||||||||
| Lease operating (per mcfe) |
$ | 0.33 | $ | 0.53 | ||||
| Production and ad valorem tax (per mcfe) |
— | 0.12 | ||||||
| (a) | Oil and NGLs are converted at the rate of one barrel equals six mcf based upon the approximate relative energy content of oil to natural gas, which is not necessarily indicative of the relationship of oil and natural gas prices. |
| (b) | We do not record hedging or the results of hedging at the field level. Includes third party transportation, gathering and compression expense. |
| Year Ended December 31, 2010 | ||||||||
| Marcellus | Nora | |||||||
| Production information: |
||||||||
| Natural gas (Mmcf) |
39,577 | 24,676 | ||||||
| Natural gas liquids (Mbbls) |
2,209 | — | ||||||
| Crude oil (Mbbls) |
496 | — | ||||||
| Total Mmcfe (a) |
55,802 | 24,676 | ||||||
| Average sales prices: (b) |
||||||||
| Natural gas (per mcf) |
$ | 3.56 | $ | 3.07 | ||||
| Natural gas liquids (per bbl) |
41.44 | — | ||||||
| Crude oil (per bbl) |
48.98 | — | ||||||
| Total (per mcfe) |
4.60 | 3.07 | ||||||
| Production costs: |
||||||||
| Lease operating (per mcfe) |
$ | 0.37 | $ | 0.55 | ||||
| Production and ad valorem tax (per mcfe) |
— | 0.13 | ||||||
| (a) | Oil and NGLs are converted at the rate of one barrel equals six mcf based upon the approximate relative energy content of oil to natural gas, which is not necessarily indicative of the relationship of oil and natural gas prices. |
| (b) | We do not record hedging or the results of hedging at the field level. Includes third party transportation, gathering and compression expense. |
9
Table of Contents
| Year Ended December 31, 2009 | ||||||||
| Marcellus | Nora | |||||||
| Production information: |
||||||||
| Natural gas (Mmcf) |
15,336 | 20,451 | ||||||
| Natural gas liquids (Mbbls) |
721 | — | ||||||
| Crude oil (Mbbls) |
218 | — | ||||||
| Total Mmcfe (a) |
20,969 | 20,451 | ||||||
| Average sales prices: (b) |
||||||||
| Natural gas (per mcf) |
$ | 2.69 | $ | 3.18 | ||||
| Natural gas liquids (per bbl) |
33.84 | — | ||||||
| Crude oil (per bbl) |
49.93 | — | ||||||
| Total (per mcfe) |
3.65 | 3.18 | ||||||
| Production costs: |
||||||||
| Lease operating (per mcfe) |
$ | 0.36 | $ | 0.57 | ||||
| Production and ad valorem tax (per mcfe) |
— | 0.17 | ||||||
| (a) | Oil and NGLs are converted at the rate of one barrel equals six mcf based upon the approximate relative energy content of oil to gas, which is not necessarily indicative of the relationship of oil and gas prices. |
| (b) | We do not record hedging or the results of hedging at the field level. Includes third party transportation, gathering and compression expense. |
Appalachian Region
Our properties in this area are located in the Appalachian Basin in the northeastern United States, principally in Pennsylvania, West Virginia and Virginia. The reserves principally produce from the Marcellus Shale, the Pennsylvanian (coalbed formation), Berea, Big Lime, Huron Shale, Medina and Upper Devonian formations at depths ranging from 2,500 to 9,000 feet. We own 5,051 net producing wells, 86% of which we operate, and approximately 3,400 miles of transportation and gas gathering lines. Our average working interest is 71%. We have approximately 1.8 million gross (1.4 million net) acres under lease, which includes 290,000 acres in which we also own a royalty interest.
Reserves at December 31, 2011 were 4.3 Tcfe, an increase of 1.4 Tcfe, or 51%, from 2010 with drilling additions and a favorable reserve revision for performance somewhat offset by production. Annual production increased 53% over 2010. During 2011, we spent $1.2 billion in this region to drill 224 (213.2 net) development wells, of which all were productive, and 34.0 (24.6 net) exploratory wells, of which 33 (23.6 net) were productive. At December 31, 2011, the Appalachian region had an inventory of over 1,700 proven drilling locations and 600 proven recompletions. During the year, the Appalachian region drilled 143 proven locations, added 449 new proven locations and deleted 613 proven locations with reserves reclassified to unproved because of a slower pace of development activity beyond the five-year development horizon as required by the SEC.
Marcellus Shale
We began operations in the Marcellus Shale in Pennsylvania during 2004. The Marcellus Shale is a non-conventional reservoir which produces natural gas, NGLs and oil. This has been our largest investment area over the last four years. We had 626 proven drilling locations at December 31, 2011. Our 2011 production from the Marcellus Shale was 89% greater than 2010. During 2011, we drilled 142.6 net development wells and 24.1 net exploratory wells in the Marcellus Shale, of which 165.7 net wells were successful. In 2012, we plan to drill 177 net wells. During 2011, we had approximately twelve drilling rigs in the field and expect to run an average of eleven rigs throughout 2012.
We have long-term agreements with third parties to provide gathering and processing services and infrastructure assets in the Marcellus Shale. In fourth quarter 2009, MarkWest Liberty Midstream, L.L.C. completed a phase two expansion, pursuant to these agreements. This expansion included an additional 120,000 mcf per day of cryogenic natural gas processing, 20 additional miles of transportation and gathering and residue gas pipelines and 21,000 horsepower of additional compression. During 2010, 200 Mmcf per day of additional processing capacity was brought on line in May, increasing the total processing capacity committed to Range to 350 Mmcf per day. At the end of 2011, this processing capacity was increased to 415 Mmcf per day. In 2011, we executed an ethane sales contract for the liquid-rich gas in southwestern Pennsylvania whereby a third party will transport ethane from the tailgate of the third-party processing and fractionation facilities to the international border for further delivery into Canada. Initial deliveries are expected to commence in late 2013. In January 2012, we executed a second ethane agreement whereby a third party will transport ethane from the tailgate of the third-party processing and fractionation facility to the Gulf Coast. Initial deliveries are expected in the first quarter of 2014.
10
Table of Contents
Since 2008, we have entered into various firm transportation agreements to provide gas gathering and transportation from southwestern and northeastern Pennsylvania which, at December 31, 2011 provides commitments for 822,905 Mcf per day. Some of our agreements, which extend to 2028, are contingent on pipeline modifications. To support our drilling efforts and to control costs, we have contracts with drilling contractors to use three drilling rigs through 2014, and agreements for hydraulic fracturing services including related equipment, material and labor through 2012 in southwestern Pennsylvania and through 2013 in northeastern Pennsylvania.
Nora Area
In 2004, we acquired natural gas properties in the Nora Area, which is located in the western portion of Virginia. In 2007, through an acquisition, we equalized our working interests in a portion of the field with EQT Corporation and entered into a joint development plan. In 2010, we acquired additional proved and unproved natural gas properties in the Nora Area for approximately $134.5 million. We have over 1,125 proven drilling locations in the Nora Area. Production in the Nora Area increased from 67,607 Mcfe per day in 2010 to 75,483 Mcfe per day in 2011. During 2011, we drilled 70.6 net development wells and 0.5 net exploratory wells and achieved a 100% drilling success rate. In 2012, we plan to drill 30 net wells.
Southwestern Region
The Southwestern region includes drilling, production and field operations in the Permian Basin of West Texas, the Delaware Basin of New Mexico, the East Texas Basin, as well as in the Texas Panhandle, Anadarko Basin of western Oklahoma, Ardmore Basin of southern Oklahoma, Nemaha Uplift of northern Oklahoma and Kansas and Mississippi. In the Southwestern region, we own 1,636 net producing wells, 93% of which we operate. Our average working interest is 79%. We have approximately 890,000 gross (598,000 net) acres under lease.
Excluding our Barnett Shale assets that were sold in April 2011, total proved reserves in the Southwestern region increased 74.4 Bcfe, or 11%, at December 31, 2011, when compared to year-end 2010. Drilling additions (88.3 Bcfe) and a favorable performance reserve revision of 47.5 Bcfe was partially offset by production. Annual production volumes decreased 1% from 2010, excluding our Barnett Shale production. During 2011, this region spent $142.7 million to drill 38 (23.3 net) development wells, all of which were productive, and 5 (4.6 net) exploratory wells, all of which were productive. During the year, the region achieved a 100% drilling success rate.
At December 31, 2011, the Southwestern region had a development inventory of 135 proven drilling locations and 310 proven recompletions. During the year, the Southwestern region drilled 14 proven locations and added 33 new proven locations. Development projects include recompletions and infill drilling. These activities also include increasing reserves and production through cost control, upgrading lifting equipment, improving gathering systems and surface facilities, and performing restimulations and refracturing operations.
Producing Wells
The following table sets forth information relating to productive wells at December 31, 2011. We also own royalty interests in an additional 2,673 wells in which we do not own a working interest. If we own both a royalty and a working interest in a well, such interests are included in the table below. Wells are classified as natural gas or crude oil according to their predominant production stream. We do not have a significant number of dual completions.
| Total Wells | Average Working |
|||||||||||
| Gross | Net | Interest | ||||||||||
| Natural gas |
8,370 | 6,030 | 72 | % | ||||||||
| Crude oil |
768 | 657 | 86 | % | ||||||||
|
|
|
|
|
|||||||||
| Total |
9,138 | 6,687 | 73 | % | ||||||||
|
|
|
|
|
|||||||||
The day-to-day operations of natural gas and oil properties are the responsibility of the operator designated under pooling or operating agreements. The operator supervises production, maintains production records, employs or contracts for field personnel and performs other functions. An operator receives reimbursement for direct expenses incurred in the performance of its duties as well as monthly per-well producing and drilling overhead reimbursement at rates customarily charged by unaffiliated third parties. The charges customarily vary with the depth and location of the well being operated.
11
Table of Contents
Drilling Activity
The following table summarizes drilling activity for the past three years. Gross wells reflect the sum of all wells in which we own an interest. Net wells reflect the sum of our working interests in gross wells. As of December 31, 2011, we were in the process of drilling 110.0 gross (98.1 net) wells.
| 2011 | 2010 | 2009 | ||||||||||||||||||||||
| Gross | Net | Gross | Net | Gross | Net | |||||||||||||||||||
| Development wells |
||||||||||||||||||||||||
| Productive |
262.0 | 236.5 | 353.0 | 253.4 | 441.0 | 270.4 | ||||||||||||||||||
| Dry |
— | — | 3.0 | 3.0 | 1.0 | 0.6 | ||||||||||||||||||
| Exploratory wells |
||||||||||||||||||||||||
| Productive |
38.0 | 28.2 | 8.0 | 6.4 | 20.0 | 13.7 | ||||||||||||||||||
| Dry |
1.0 | 1.0 | 3.0 | 3.0 | 1.0 | 0.7 | ||||||||||||||||||
| Total wells |
||||||||||||||||||||||||
| Productive |
300.0 | 264.7 | 361.0 | 259.8 | 461.0 | 284.1 | ||||||||||||||||||
| Dry |
1.0 | 1.0 | 6.0 | 6.0 | 2.0 | 1.3 | ||||||||||||||||||
|
|
|
|
|
|
|
|
|
|
|
|
|
|||||||||||||
| Total |
301.0 | 265.7 | 367.0 | 265.8 | 463.0 | 285.4 | ||||||||||||||||||
|
|
|
|
|
|
|
|
|
|
|
|
|
|||||||||||||
| Success ratio |
99.7 | % | 99.6 | % | 98.4 | % | 97.7 | % | 99.6 | % | 99.5 | % | ||||||||||||
Gross and Net Acreage
We own interests in developed and undeveloped natural gas and oil acreage. These ownership interests generally take the form of working interests in oil and natural gas leases that have varying terms. Developed acreage includes leased acreage that is allocated or assignable to producing wells or wells capable of production even though shallower or deeper horizons may not have been fully explored. Undeveloped acreage includes leased acres on which wells have not been drilled or completed to a point that would permit the production of commercial quantities of natural gas or oil, regardless of whether or not the acreage contains proved reserves.
The following table sets forth certain information regarding the developed and undeveloped acreage in which we own a working interest as of December 31, 2011. Acreage related to royalty, overriding royalty and other similar interests is excluded from this summary:
| Developed Acres | Undeveloped Acres | Total Acres | ||||||||||||||||||||||
| Gross | Net | Gross | Net | Gross | Net | |||||||||||||||||||
| Alabama |
— | — | 28,297 | 25,726 | 28,297 | 25,726 | ||||||||||||||||||
| Illinois |
— | — | 13,216 | 6,742 | 13,216 | 6,742 | ||||||||||||||||||
| Kansas |
— | — | 36,634 | 34,276 | 36,634 | 34,276 | ||||||||||||||||||
| Louisiana |
5,513 | 1,379 | 628 | 158 | 6,141 | 1,537 | ||||||||||||||||||
| Mississippi |
5,404 | 3,152 | 15,829 | 5,339 | 21,233 | 8,491 | ||||||||||||||||||
| New Mexico |
6,890 | 4,967 | 1,200 | 912 | 8,090 | 5,879 | ||||||||||||||||||
| Oklahoma |
185,052 | 110,256 | 150,619 | 108,442 | 335,671 | 218,698 | ||||||||||||||||||
| Pennsylvania |
729,194 | 642,261 | 489,855 | 436,607 | 1,219,049 | 1,078,868 | ||||||||||||||||||
| Texas |
229,927 | 140,241 | 210,453 | 156,074 | 440,380 | 296,315 | ||||||||||||||||||
| Virginia |
118,636 | 75,528 | 239,831 | 150,611 | 358,467 | 226,139 | ||||||||||||||||||
| West Virginia |
66,367 | 65,138 | 53,571 | 53,479 | 119,938 | 118,617 | ||||||||||||||||||
|
|
|
|
|
|
|
|
|
|
|
|
|
|||||||||||||
| 1,346,983 | 1,042,922 | 1,240,133 | 978,366 | 2,587,116 | 2,021,288 | |||||||||||||||||||
|
|
|
|
|
|
|
|
|
|
|
|
|
|||||||||||||
| Average working interest |
77 | % | 79 | % | 78 | % | ||||||||||||||||||
|
|
|
|
|
|
|
|||||||||||||||||||
12
Table of Contents
Undeveloped Acreage Expirations
The table below summarizes by year our undeveloped acreage scheduled to expire in the next five years.
| Acres | % of Total | |||||||||
| As of December 31, |
Gross | Net | Undeveloped | |||||||
| 2012 |
250,555 | 214,079 | 24% | |||||||
| 2013 |
196,650 | 169,122 | 19% | |||||||
| 2014 |
257,437 | 213,945 | 24% | |||||||
| 2015 |
92,277 | 79,172 | 9% | |||||||
| 2016 |
63,831 | 52,036 | 6% | |||||||
We have leased acreage that is subject to lease expiration if initial wells are not drilled within a specified period, generally between three to five years. However, we have in the past and expect in the future, to be able to extend the lease terms of some of these leases and exchange or sell some of these leases with other companies. The expirations included in the table above do not take into account the fact that we may be able to extend the lease terms. We do not expect to lose significant lease acreage because of failure to drill due to inadequate capital, equipment or personnel. However, based on our evaluation of prospective economics, we have allowed acreage to expire from time to time and expect to allow additional acreage to expire in the future.
Title to Properties
We believe that we have satisfactory title to all of our producing properties in accordance with generally accepted industry standards. As is customary in the industry, in the case of undeveloped properties, often minimal investigation of record title is made at the time of lease acquisition. Investigations are made before the consummation of an acquisition of producing properties and before commencement of drilling operations on undeveloped properties. Individual properties may be subject to burdens that we believe do not materially interfere with the use or affect the value of the properties. Burdens on properties may include:
| • | customary royalty interests; |
| • | liens incident to operating agreements and for current taxes; |
| • | obligations or duties under applicable laws; |
| • | development obligations under oil and gas leases; or |
| • | net profit interests. |
Employees
As of January 1, 2012, we had 756 full-time employees, 251 of whom were field personnel. All full-time employees are eligible to receive equity awards approved by the Compensation Committee of the Board of Directors. No employees are covered by a labor union or other collective bargaining arrangement. We believe that the relationship with our employees is excellent. We regularly use independent consultants and contractors to perform various professional services, particularly in the areas of drilling, completion, field, on-site production services and certain accounting functions.
Available Information
Our internet website is available under the name http://www.rangeresources.com. Information contained on or connected to our website is not incorporated by reference into this Form 10-K and should not be considered part of this report or any other filing we make with the SEC. We make available, free of charge, on our website, the annual report on Form 10-K, quarterly reports on Form 10-Q, current reports on Form 8-K and amendments to those reports, as soon as reasonably practicable after providing such reports to the SEC. In addition, other information such as company presentations is also available on our website. Also, our Corporate Governance Guidelines, the charters of the Audit Committee, the Compensation Committee, the Dividend Committee, and the Governance and Nominating Committee, and the Code of Business Conduct and Ethics are available on our website and in print to any stockholder who provides a written request to the Corporate Secretary at 100 Throckmorton Street, Suite 1200, Fort Worth, Texas 76102. Our Code of Business Conduct and Ethics applies to all directors, officers and employees, including the chief executive officer and senior financial officer.
13
Table of Contents
We file annual reports on Form 10-K, quarterly reports on Form 10-Q, current reports on Form 8-K, proxy statements and other documents with the SEC under the Securities Exchange Act of 1934. The public may read and copy any materials that we file with the SEC at the SEC’s Public Reference Room at 100 F Street, NE, Washington, DC 20549. The public may obtain information on the operation of the Public Reference Room by calling the SEC at 1-800-SEC-0330. Also, the SEC maintains an internet website that contains reports, proxy and information statements, and other information regarding issuers, including Range, that file electronically with the SEC. The public can obtain any document we file with the SEC at http://www.sec.gov.
Competition
Intense competition exists in all sectors of the oil and gas industry and in particular, we encounter substantial competition in developing and acquiring natural gas and oil properties, securing and retaining personnel, conducting drilling and field operations and marketing production. Competitors in exploration, development, acquisitions and production include the major oil companies as well as numerous independent oil and gas companies, individual proprietors and others. Although our sizable acreage position and core area concentration provide some competitive advantages, many competitors have financial and other resources substantially exceeding ours. Therefore, competitors may be able to pay more for desirable leases and evaluate, bid for and purchase a greater number of properties or prospects than our financial or personnel resources allow. Our ability to replace and expand our reserve base depends on our ability to attract and retain quality personnel and identify and acquire suitable producing properties and prospects for future drilling. For additional information, see “Item 1A. Risk Factors.”
Marketing and Customers
We market the majority of our natural gas, NGL and oil production from the properties we operate for both our interest and that of the other working interest owners and royalty owners. Natural gas, NGLs and oil purchasers are selected on the basis of price, credit quality and service reliability. For a summary of purchasers of our natural gas, NGLs and oil production that accounted for 10% or more of consolidated revenue, see Note 16 to our consolidated financial statements. Because alternative purchasers of natural gas and oil are usually readily available, we believe that the loss or any of these purchasers would not have a material adverse effect on our operations. We sell our gas pursuant to a variety of contractual arrangements, generally month-to-month and one to five-year contracts. We sell less than 10% of our production subject to contracts longer than five years. Pricing on the month-to-month and short-term contracts is based largely on the New York Mercantile Exchange (“NYMEX”) pricing, with fixed or floating basis. For one to five-year contracts, our natural gas is sold on NYMEX pricing, published regional index pricing or percentage of proceeds sales based on local indices. We sell less than 0.1% of our production under long-term fixed price contracts. Many contracts contain provisions for periodic price adjustment, redetermination and other terms customary in the industry. In the Marcellus Shale, our natural gas is sold to utilities, marketing companies and industrial users. In areas other than the Marcellus Shale, our natural gas is sold to mid stream companies along with utilities and industrial users. Our oil is sold under contracts ranging in terms from month-to-month, up to as long as one year. The pricing for oil is based upon the posted prices set by major purchasers in the production area, reporting publications, or upon NYMEX pricing or fixed pricing. All oil pricing is adjusted for quality and transportation differentials. Our NGL production is typically sold to natural gas processors or, in some cases, to other purchasers or users of NGLs. Currently, there is little demand, or existing facilities to create demand, for ethane in the Appalachian region so, for our Appalachian production volumes, ethane remains in the natural gas stream. For additional information, see “Risk Factors – Our business depends on natural gas and oil transportation and processing facilities, most of which are owned by others and our ability to contract with those parties,” in Item 1A of this report.
We enter into hedging transactions with unaffiliated third parties for a varying portion of our production to achieve more predictable cash flows and to reduce our exposure to short-term fluctuations in natural gas, NGL and oil prices. For a more detailed discussion, see the information set forth in “Item 7. Management’s Discussion and Analysis of Financial Condition and Results of Operations” and “Item 7A. Quantitative and Qualitative Disclosures about Market Risk.” Proximity to local markets, availability of competitive fuels and overall supply and demand are factors affecting the prices for which our production can be sold. Market volatility due to fluctuating weather conditions, international political developments, overall energy supply and demand, economic growth rates and other factors in the United States and worldwide have had, and will continue to have, a significant effect on energy prices.
We incur gathering and transportation expenses to move our natural gas and crude oil from the wellhead and tanks to purchaser specified delivery points. These expenses vary based on volume, distance shipped and the fee charged by the third-party transporters. In the Southwestern region, our natural gas and oil production is transported primarily through third-party trucks, field gathering systems and transmission pipelines. Transportation capacity on these gathering and transportation systems and pipelines is occasionally constrained. In Appalachia, we own approximately 3,400 miles of gas gathering and transportation pipelines, which transport a portion of our Appalachian gas production and third-party gas to transmission lines and directly to end-users, and interstate pipelines. Our remaining Appalachian gas volume is transported on third-party pipelines on which, in some cases, we hold long-term contractual capacity. For additional information, see “Risk Factors – Our business depends on natural gas and oil transportation and processing facilities, most of which are owned by others and our ability to contract with those parties,” in Item 1A of this report.
14
Table of Contents
We have not experienced significant difficulty to date in finding a market for all of our production as it becomes available or in transporting our production to those markets; however, there is no assurance that we will always be able to transport and market all of our production or obtain favorable prices.
Seasonal Nature of Business
Generally, but not always, the demand for natural gas decreases during the summer months and increases during the winter months. Seasonal anomalies such as mild winters or hot summers sometimes lessen this fluctuation. In addition, pipelines, utilities, local distribution companies and industrial end users utilize natural gas storage facilities and purchase some of their anticipated winter requirements during the summer. This can also lessen seasonal demand.
Governmental Regulation
Our operations are substantially affected by federal, state and local laws and regulations. In particular, natural gas and oil production and related operations are, or have been, subject to taxes and numerous other laws and regulations. All of the jurisdictions in which we own or operate producing crude oil and natural gas properties have statutory provisions regulating the exploration for and production of crude oil and natural gas, including provisions related to permits for the drilling of wells, bonding requirements to drill or operate wells, the location of wells, the method of drilling and casing wells, the surface use and restoration of properties upon which wells are drilled, sourcing and disposal of water used in the drilling and completion process, and the abandonment of wells. Our operations are also subject to various conservation laws and regulations. These include the regulation of the size of drilling and spacing units or proration units, the number of wells which may be drilled in an area, and the unitization or pooling of crude oil and natural gas wells, as well as regulations that generally prohibit the venting or flaring of natural gas, and impose certain requirements regarding the ratability or fair apportionment of production from fields and individual wells.
In August 2005, Congress enacted the Energy Policy Act of 2005 (“EPAct 2005”). Among other matters, the EPAct 2005 amends the Natural Gas Act (“NGA”), to make it unlawful for “any entity,” including otherwise non-jurisdictional producers such as Range, to use any deceptive or manipulative device or contrivance in connection with the purchase or sale of natural gas or the purchase or sale of transportation services subject to regulation by the Federal Energy Regulatory Commission (“FERC”), in contravention of rules prescribed by the FERC. On January 20, 2006, the FERC issued rules implementing this provision. The rules make it unlawful in connection with the purchase or sale of natural gas subject to the jurisdiction of FERC, or the purchase or sale of transportation services subject to the jurisdiction of FERC, for any entity, directly or indirectly, to use or employ any device, scheme or artifice to defraud; to make any untrue statement of material fact or omit any such statement necessary to make the statements not misleading; or to engage in any act or practice that operates as a fraud or deceit upon any person. EPAct 2005 also gives the FERC authority to impose civil penalties for violations of the NGA up to $1,000,000 per day per violation. The new anti-manipulation rule does not apply to activities that relate only to intrastate or other non-jurisdictional sale or gathering, but does apply to activities or otherwise non-jurisdictional entities to the extent the activities are conducted “in connection with” gas sales, purchases or transportation subject to FERC jurisdiction which includes the reporting requirements under Order Nos. 704 and 720, described below. It therefore reflects a significant expansion of FERC’s enforcement authority. Range has not been affected differently than any other producer of natural gas by this act.
Failure to comply with applicable laws and regulations can result in substantial penalties. The regulatory burden on the industry increases the cost of doing business and affects profitability. Although we believe we are in substantial compliance with all applicable laws and regulations, such laws and regulations are frequently amended or reinterpreted. Therefore, we are unable to predict the future costs or impact of compliance. Additional proposals and proceedings that affect the oil and gas industry are regularly considered by Congress, the states, the FERC, and the courts. We cannot predict when or whether any such proposals may become effective.
On December 26, 2007, FERC issued a final rule on the annual natural gas transaction reporting requirements, as amended by subsequent orders on rehearing (“Order 704”). Under Order 704, wholesale buyers and sellers of more than 2.2 million Mmbtus of physical natural gas in the previous calendar year, including natural gas gatherers and marketers, are now required to report, on May 1 of each year beginning in 2009, aggregate volumes of natural gas purchased or sold at wholesale in the prior calendar year to the extent such transactions utilize, contribute to, or may contribute to the formation of price indices. It is the responsibility of the reporting entity to determine which individual transactions should be reported based on the guidance of Order 704. Order 704 also requires market participants to indicate whether they report prices to any index publishers, and if so, whether their reporting complies with FERC’s policy statement on price reporting.
On November 20, 2008, FERC issued a final rule on the daily scheduled flow and capacity posting requirements (“Order 720”), which was modified on January 21, 2010 (“Order 720-A”) and July 21, 2010 (“Order 720-B”). Under Orders 720, 720-A and 720-B, major non-interstate pipelines, defined as certain non-interstate pipelines delivering, on an annual basis, more than an average of 50 million Mmbtus of gas over the previous three calendar years, are required to post daily certain information regarding the pipeline’s capacity and scheduled flows for each receipt and delivery point that has a design capacity equal to or greater than 15,000 Mmbtu per day.
15
Table of Contents
Environmental and Occupational Health and Safety Matters
Our operations are subject to numerous stringent federal, state and local statutes and regulations governing occupational health and safety, the discharge of materials into the environment or otherwise relating to environmental protection, some of which carry substantial administrative, civil and criminal penalties for failure to comply. These laws and regulations may require the acquisition of a permit before drilling commences, restrict the types, quantities and concentrations of various substances that can be released into the environment in connection with drilling, production and transporting through pipelines, govern the sourcing and disposal of water used in the drilling and completion process, limit or prohibit drilling activities in certain areas and on certain lands lying within wilderness, wetlands, frontier and other protected areas, require some form of remedial action to prevent or mitigate pollution from existing and former operations such as plugging abandoned wells or closing earthen impoundments and impose substantial liabilities for pollution resulting from operations or failure to comply with regulatory filings. In addition, these laws and regulations may restrict the rate of production.
The Comprehensive Environmental Response, Compensation and Liability Act, as amended (“CERCLA”), also known as the “Superfund” law, and comparable state laws impose liability, without regard to fault or the legality of the original conduct, on certain classes of persons who are considered to be responsible for the release of a “hazardous substance” into the environment. These persons may include owners or operators of the disposal site or sites where the release occurred and companies that disposed of or arranged for the disposal of the hazardous substances at the site where the release occurred. Under CERCLA, all of these persons may be subject to joint and several liabilities for the costs of cleaning up the hazardous substances that have been released into the environment, for damages to natural resources and for the costs of certain health studies. In addition, it is not uncommon for neighboring landowners and other third parties, pursuant to environmental statutes, common law or both, to file claims for personal injury and property damages allegedly caused by the release of hazardous substances or other pollutants into the environment. Although petroleum, including crude oil and natural gas, is not a “hazardous substance” under CERCLA, at least two courts have ruled that certain wastes associated with the production of crude oil may be classified as “hazardous substances” under CERCLA and that releases of such wastes may therefore give rise to liability under CERCLA. While we generate materials in the course of our operations that may be regulated as hazardous substances, we have not received notification that we may be potentially responsible for cleanup costs under CERCLA or comparable state laws. Other state laws regulate the disposal of oil and gas wastes, and new state and federal legislative initiatives that could have a significant impact on us may periodically be proposed and enacted.
We also may incur liability under the Resource Conservation and Recovery Act, as amended (“RCRA”) and comparable state laws, which impose requirements related to the handling and disposal of solid and hazardous wastes. While there is an exclusion from the definition of hazardous wastes for “drilling fluids, produced waters, and other wastes associated with the exploration, development, or production of crude oil, natural gas or geothermal energy,” these wastes may be regulated by the United States Environmental Protection Agency (“EPA”) or state agencies as non-hazardous solid waste. In addition, changes in law could result in the repeal of this exclusion; for instance, in September 2010, the Natural Resources Defense Council filed a petition for rulemaking with the EPA requesting reconsideration of the continued application of this RCRA exclusion but, to date, the EPA has not taken any action on the petition. Moreover, ordinary industrial wastes, such as paint wastes, waste solvents, laboratory wastes and waste compressor oils, can be regulated as hazardous wastes. Although the costs of managing wastes classified as hazardous waste may be significant, we do not expect to experience more burdensome costs than similarly situated companies.
We currently own or lease, and have in the past owned or leased, properties that for many years have been used for the exploration and production of crude oil and natural gas. Petroleum hydrocarbons or wastes may have been disposed of or released on or under the properties owned or leased by us, or on or under other locations where such materials have been taken for disposal. In addition, some of these properties have been operated by third parties whose treatment and disposal or release of petroleum hydrocarbons and wastes was not under our control. These properties and the materials disposed or released on them may be subject to CERCLA, RCRA and comparable state laws and regulations. Under such laws and regulations, we could be required to remove or remediate previously disposed wastes or property contamination, or to perform remedial activities to prevent future contamination.
The Federal Water Pollution Control Act, as amended and comparable state laws impose restrictions and strict controls regarding the discharge of pollutants, including produced waters and other oil and gas wastes, into federal and state waters. The discharge of pollutants into regulated waters is prohibited, except in accordance with the terms of a permit issued by the EPA or the state. These laws and any implementing regulations provide for administrative, civil and criminal penalties for any unauthorized discharges of oil and other substances in reportable quantities and may impose substantial potential liability for the costs of removal, remediation and damages. Pursuant to these laws and regulations, we may be required to obtain and maintain approvals or permits for the discharge of wastewater or storm water and are required to develop and implement spill prevention, control and countermeasure plans, also referred to as “SPCC plans,” in connection with on-site storage of greater than threshold quantities of oil. We regularly review our natural gas and oil properties to determine the need for new or updated SPCC plans and, where necessary, we will be developing or upgrading such plans, the costs of which are not expected to be substantial.
16
Table of Contents
The Oil Pollution Act of 1990, as amended, “OPA”, contains numerous requirements relating to the prevention of and response to oil spills into waters of the United States. The OPA subjects owners of facilities to strict, joint and several liability for all containment and cleanup costs and certain other damages arising from a spill, including, but not limited to, the costs of responding to a release of oil to surface waters. While we believe we have been in compliance with OPA, noncompliance could result in varying civil and criminal penalties and liabilities.
The Clean Air Act, as amended, and comparable state laws restrict the emission of air pollutants from many sources, including compressor stations. These laws and any implementing regulations may require us to obtain pre-approval for the construction or modification of certain projects or facilities expected to produce air emissions, impose stringent air permit requirements, or use specific equipment or technologies to control emissions. We may be required to incur certain capital expenditures in the next few years for air pollution control equipment in connection with maintaining or obtaining operating permits addressing other air emission-related issues. We do not believe that such requirements will have a material adverse effect on our operations.
Changes in environmental laws and regulations sometimes occur, and any changes that result in more stringent and costly well construction, drilling, water management or completion activities or waste handling, storage, transport, disposal or cleanup requirements for any substances used or produced in our operations could materially adversely affect our operations and financial position, as well as those of the oil and gas industry in general. For instance, recent scientific studies have suggested that emissions of certain gases commonly referred to as “greenhouse gases” and including carbon dioxide and methane, may be contributing to warming of the Earth’s atmosphere.
Congress has from time to time considered legislation to reduce emissions of greenhouse gases and at least 20 states have already taken legal measures to control emissions of greenhouse gases, primarily through the planned development of greenhouse gas emission inventories and/or regional greenhouse gas cap and trade programs. In California, for example, the California Global Warming Solutions Act of 2006 requires the California Air Resources Board to adopt regulations by 2012 that will achieve an overall reduction in greenhouse gas emissions from all sources in California of 25% by 2020.
On April 2, 2007, the United States Supreme Court held that, if the EPA found that greenhouse gas concentrations endanger public health and welfare, it was obligated to regulate their emissions under the Clean Air Act. On December 15, 2009, the EPA issued “Endangerment and Cause of Contribute Findings for Greenhouse Gases under section 202(a) of the Clean Air Act,” in which it concluded that the atmospheric concentrations of several greenhouse gases threaten the health and welfare of future generations, and that the combined emissions of these gases from motor vehicles contribute to the atmospheric concentrations of these key greenhouse gases, and, hence, to the threat of climate change. On April 1, 2010, the EPA and the Department of Transportation finalized rules that limit emissions of greenhouse gases from motor vehicles and on April 2, 2010, the EPA finalized a rule that declared greenhouse gases “subject to regulation” on January 2, 2011, the date on which EPA’s mobile source rules impose actual compliance obligations.
While the EPA’s endangerment findings and its rules on greenhouse gas emissions from mobile sources do not specifically address stationary sources, it is the EPA’s view that once the mobile source rules were finalized in April 2010, emissions of greenhouse gases from stationary sources became covered under the federal Prevention of Significant Deterioration (“PSD”) and Title V air permit programs, which apply to “major sources” of air emissions. The EPA reset the “major source” thresholds to higher levels in its “Prevention of Significant Deterioration and Title V Greenhouse Gas Tailoring Rule” than were originally set in the Clean Air Act. Consequently, for the first six months of 2011, greenhouse gas sources were required to undergo PSD or Title V review only if they were otherwise subject to PSD review or Title V permitting due to other emissions, and BACT review applied to the PSD applicant if the expected GHG emission increase is greater than 75,000 tons per year. Beginning on July 1, 2011, sources not otherwise brought into PSD or Title V were be required to undergo PSD or Title V review due to their greenhouse gas emissions alone, if in excess of 100,000 tons per year.
On September 22, 2009, the EPA finalized a greenhouse gas reporting rule establishing a national greenhouse gas emissions collection and reporting program. The EPA rules require covered entities to measure greenhouse gas emissions from specified large greenhouse gas emissions sources in the United States beginning in 2011 for emissions occurring in 2010. On November 8, 2010, the EPA finalized amendments to this greenhouse gas reporting rule, expanding the rule to require certain owners and operators of onshore crude oil and natural gas production and processing facilities to monitor greenhouse gas emissions beginning in 2011 and to report those emissions beginning in 2012, with the first year’s reporting deadline being extended to September 28, 2012. While we do not operate stationary sources that emit significant quantities of greenhouse gases, including carbon dioxide, we do utilize gas processing plants to process the natural gas that we produce and, thus if such processors were to incur increased costs to acquire and surrender emission allowances or otherwise to capture and dispose of greenhouse gases, it is possible that these costs, which might be significant, could be passed along to us as well as similarly situated producers. Moreover, any adoption of a program to tax the emission of carbon dioxide and other greenhouse gases potentially could be imposed on us and other similarly situated producers of natural gas. Although it is not possible at this time to predict how legislation or new regulations that may be adopted to address greenhouse gas emissions would impact our business, any such future laws and regulations could result in increased compliance costs or additional operating restrictions, and could have a
17
Table of Contents
material adverse effect on our business or demand for our products. Given the possible impact of legislation and/or regulation of carbon dioxide, methane and other greenhouse gases, we have considered and expect to continue to consider the impact of laws or regulations intended to address climate change on our operations. Under the new regulations, our operations require reporting or monitoring of carbon dioxide emissions. Since our emissions are minimal, we do not expect this to have a material effect on our operations. In addition, we also operate mobile equipment in the normal course of our business that emits carbon dioxide as well as some stationary engines that power compressors and pumping equipment. Methane is a primary constituent of natural gas and, like all oil and gas exploration and production companies, we produce significant quantities of natural gas; however, such production of natural gas, including its constituent hydrocarbon methane, is gathered and transported in pipelines under pressure and we therefore do not emit significant quantities of methane in connection with our operations. Given our lack of significant points of carbon dioxide emissions, we have focused most of our efforts on physical environmental ground, water and air issues in our operations.
We are also subject to the requirements of the federal Occupational Safety and Health Act, as amended (“OSHA”), and comparable state laws that regulate the protection of the health and safety of employees. In addition, OSHA’s hazard communication standard requires that information be maintained about hazardous materials used or produced in our operations and that this information be provided to employees, state and local government authorities and citizens. We believe that our operations are in substantial compliance with the OSHA requirements.
The federal Safe Drinking Water Act, as amended (“SDWA”) and comparable state laws regulate the nation’s public drinking water supply by regulating “public water systems” as well as underground sources of drinking water. Under the SDWA, EPA sets standards for drinking water quality and oversees the states, localities and water suppliers that implement those standards. The U.S. Senate and House of Representatives are currently considering bills entitled, the “Fracturing Responsibility and Awareness of Chemicals Act,” or the FRAC Act, to amend SDWA to repeal an exemption from regulation for hydraulic fracturing. Hydraulic fracturing is an important and commonly used process involving the injection of water, sand and small amounts of chemical additives under pressure into rock formations to stimulate oil or natural gas production. Sponsors of these bills have asserted that chemicals used in the fracturing process could adversely affect drinking water supplies. The proposed legislation would require the reporting and public disclosure of chemicals used in the fracturing process, which could result in third parties opposing the hydraulic fracturing process to initiate legal proceedings based on allegations that specific chemicals used in the fracturing process could adversely affect groundwater. In addition, these bills, if adopted, could establish an additional level of regulation at the federal level that could lead to operational delays or increased operating costs and could result in additional regulatory burdens that could make it more difficult to perform hydraulic fracturing and increase our costs of compliance and doing business as well as delay the development of unconventional gas resources from shale formations which are not commercial without the use of hydraulic fracturing.
The federal Endangered Species Act, as amended, restricts activities that may affect endangered and threatened species or their habitats. If endangered species are located in an area where we wish to conduct seismic surveys, development activities or abandonment operations, the work could be prohibited or delayed or expensive mitigation may be required. Moreover, the designation of previously unidentified endangered or threatened species could cause us to incur additional costs or become subject to operating restrictions or bans in the affected areas. For example, as a result of a settlement approved by the U.S. District Court for the District of Columbia on September 9, 2011, the U.S. Fish and Wildlife Service is required to make a determination over the next six years on the listing of more than 250 species as endangered or threatened under the Endangered Species Act. The designation of previously unprotected species in areas where we operate as threatened or endangered could cause us to incur increased costs arising from species protection measures or could result in limitations on our exploration and production activities that could have an adverse impact on our ability to develop and produce our reserves.
In summary, we believe we are in substantial compliance with currently applicable environmental laws and regulations. Although we have not experienced any material adverse effect from compliance with environmental requirements, there is no assurance that this will continue. We did not have any material capital or other non-recurring expenditures in connection with complying with environmental laws or environmental remediation matters in 2011, nor do we anticipate that such expenditures will be material in 2012. However, we regularly have expenditures to comply with environmental laws and those costs continue to increase as our operations expand.
18
Table of Contents
| ITEM 1A. | RISK FACTORS |
We are subject to various risks and uncertainties in the course of our business. The following summarizes the known material risks and uncertainties, which may adversely affect our business, financial condition or results of operations. Our business could also be impacted by additional risks and uncertainties not currently known to us or that we currently deem to be immaterial.
Risks Related to Our Business
Volatility of natural gas and oil prices significantly affects our cash flow and capital resources and could hamper our ability to produce natural gas, NGLs and oil economically
Natural gas, NGLs and oil prices are volatile, and a decline in prices adversely affects our profitability and financial condition. The oil and gas industry is typically cyclical, and prices for natural gas, NGLs and oil have been volatile. Over the past four years, the average NYMEX monthly settlement price of natural gas has been as high as $13.10 per mcf and as low as $2.84 mcf. During that same time frame, the oil settlement price was as high as $134.62 per barrel and as low as $33.87 per barrel. As of the end of January 2012, natural gas was $2.68 per mcf and oil was $98.46 per barrel. Natural gas prices are likely to affect us more than oil prices because approximately 79% of our December 31, 2011 proved reserves are natural gas. Natural gas prices are approaching historical lows. Historically, the industry has experienced downturns characterized by oversupply and/or weak demand. Long-term supply and demand for natural gas, NGLs and oil is uncertain and subject to a myriad of factors such as:
| • | the domestic and foreign supply of natural gas, NGLs and oil; |
| • | the price, availability and demand for alternative fuels and sources of energy; |
| • | weather conditions; |
| • | the level of consumer demand for natural gas, NGLs and oil; |
| • | the price and level of foreign imports; |
| • | U.S. domestic and worldwide economic conditions; |
| • | the availability, proximity and capacity of transportation facilities and processing facilities; |
| • | the effect of worldwide energy conservation efforts; |
| • | political conditions in natural gas and oil producing regions; and |
| • | domestic (federal, state and local) and foreign governmental regulations and taxes. |
Lower natural gas, NGL and oil prices may not only decrease our revenues on a per unit basis but also may reduce the amount of natural gas, NGL and oil that we can economically produce. A reduction in production could result in a shortfall in expected cash flows and require a reduction in capital spending or require additional borrowing. Without the ability to fund capital expenditures, we would be unable to replace reserves which would negatively affect our future rate of growth.
Producing natural gas, NGLs and oil may involve unprofitable efforts. As of December 31, 2011, the relationship between the price of oil and the price of natural gas is at an unprecedented spread. Normally, natural gas liquids production is a by-product of natural gas production. Due to the current differences in prices, we and other producers may choose to sell natural gas at below cost, or otherwise dispose of natural gas to allow for the sale of only natural gas liquids.
Information concerning our reserves and future net cash flow estimates is uncertain
There are numerous uncertainties inherent in estimating quantities of proved natural gas and oil reserves and their values, including many factors beyond our control. Estimates of proved reserves are by their nature uncertain. Although we believe these estimates are reasonable, actual production, revenues and costs to develop will likely vary from estimates and these variances could be material.
Reserve estimation is a subjective process that involves estimating volumes to be recovered from underground accumulations of natural gas and oil that cannot be directly measured. As a result, different petroleum engineers, each using industry-accepted geologic and engineering practices and scientific methods, may calculate different estimates of reserves and future net cash flows based on the same available data. Because of the subjective nature of natural gas, NGLs and oil reserve estimates, each of the following items may differ materially from the amounts or other factors estimated:
19
Table of Contents
| • | the amount and timing of natural gas, NGL and oil production; |
| • | the revenues and costs associated with that production; and |
| • | the amount and timing of future development expenditures. |
The discounted future net cash flows from our proved reserves included in this report should not be considered as the market value of the reserves attributable to our properties. As required by generally accepted accounting principles, the estimated discounted future net revenues from our proved reserves are based on a twelve month average price (first day of the month) while cost estimates are as of the end of the year. Actual future prices and costs may be materially higher or lower. In addition, the 10 percent discount factor that is required to be used to calculate discounted future net revenues for reporting purposes under generally accepted accounting principles is not necessarily the most appropriate discount factor based on the cost of capital in effect from time to time and risks associated with our business and the oil and gas industry in general.
If natural gas, NGL and oil prices decrease or drilling efforts are unsuccessful, we may be required to record writedowns of our natural gas and oil properties
In the past we have been required to write down the carrying value of certain of our natural gas and oil properties, and there is a risk that we will be required to take additional writedowns in the future. Writedowns may occur when natural gas and oil prices are low, or if we have downward adjustments to our estimated proved reserves, increases in our estimates of operating or development costs, deterioration in our drilling results or mechanical problems with wells where the cost to redrill or repair is not supported by the expected economics.
Accounting rules require that the carrying value of natural gas and oil properties be periodically reviewed for possible impairment. Impairment is recognized for the excess of book value over fair value when the book value of a proven property is greater than the expected undiscounted future net cash flows from that property and on acreage when conditions indicate the carrying value is not recoverable. We may be required to write down the carrying value of a property based on natural gas and oil prices at the time of the impairment review, or as a result of continuing evaluation of drilling results, production data, economics, divestiture activity, and other factors. While an impairment charge reflects our long-term ability to recover an investment, it does not impact cash or cash flow from operating activities, but it does reduce our reported earnings and increases our leverage ratios.
Significant capital expenditures are required to replace our reserves
Our exploration, development and acquisition activities require substantial capital expenditures. Historically, we have funded our capital expenditures through a combination of cash flow from operations, our bank credit facility and debt and equity issuances. We have also engaged in asset monetization transactions. Future cash flows are subject to a number of variables, such as the level of production from existing wells, prices of natural gas, NGL and oil and our success in developing and producing new reserves. If our access to capital were limited due to numerous factors, which could include a decrease in revenues due to lower natural gas, NGLs and oil prices or decreased production or deterioration of the credit and capital markets, we would have a reduced ability to replace our reserves. We may not be able to incur additional bank debt, issue debt or equity, engage in asset monetization or access other methods of financing on an economic basis to meet our reserve replacement requirements.
The amount available for borrowing under our bank credit facility is subject to a borrowing base, which is determined by our lenders, at their discretion, taking into account our estimated proved reserves and is subject to periodic redeterminations based on pricing models determined by the lenders at such time. Declines in natural gas, NGL and oil prices adversely impact the value of our estimated proved reserves and, in turn, the market values used by our lenders to determine our borrowing base. If commodity prices (particularly natural gas prices) continue to decline, it will have similar adverse effects on our reserves and borrowing base.
Our future success depends on our ability to replace reserves that we produce
Because the rate of production from natural gas and oil properties generally declines as reserves are depleted, our future success depends upon our ability to economically find or acquire and produce additional natural gas, NGL and oil reserves. Except to the extent that we acquire additional properties containing proved reserves, conduct successful exploration and development activities or, through engineering studies, identify additional behind-pipe zones or secondary recovery reserves, our proved reserves will decline as reserves are produced. Future natural gas, NGL and oil production, therefore, is highly dependent upon our level of success in acquiring or finding additional reserves that are economically recoverable. We cannot assure you that we will be able to find or acquire and develop additional reserves at an acceptable cost.
20
Table of Contents
We acquire significant amounts of unproved property to further our development efforts. Development and exploratory drilling and production activities are subject to many risks, including the risk that no commercially productive reservoirs will be discovered. We acquire both producing and unproved properties as well as lease undeveloped acreage that we believe will enhance growth potential and increase our earnings over time. However, we cannot assure you that all prospects will be economically viable or that we will not abandon our initial investments. Additionally, there can be no assurance that unproved property acquired by us or undeveloped acreage leased by us will be profitably developed, that new wells drilled by us in prospects that we pursue will be productive or that we will recover all or any portion of our investment in such unproved property or wells.
Our indebtedness could limit our ability to successfully operate our business
We are leveraged and our exploration and development program will require substantial capital resources depending on the level of drilling and the expected cost of services. Our existing operations will also require ongoing capital expenditures. In addition, if we decide to pursue additional acquisitions, our capital expenditures will increase, both to complete such acquisitions and to explore and develop any newly acquired properties.
The degree to which we are leveraged could have other important consequences, including the following:
| • | we may be required to dedicate a substantial portion of our cash flows from operations to the payment of our indebtedness, reducing the funds available for our operations; |
| • | a portion of our borrowings are at variable rates of interest, making us vulnerable to increases in interest rates; |
| • | we may be more highly leveraged than some of our competitors, which could place us at a competitive disadvantage; |
| • | our degree of leverage may make us more vulnerable to a downturn in our business or the general economy; |
| • | we are subject to numerous financial and other restrictive covenants contained in our existing credit agreements the breach of which could materially and adversely impact our financial performance; |
| • | our debt level could limit our flexibility to grow the business and in planning for, or reacting to, changes in our business and the industry in which we operate; and |
| • | we may have difficulties borrowing money in the future. |
Despite our current levels of indebtedness, we still may be able to incur substantially more debt. This could further increase the risks described above. In addition to those risks above, we may not be able to obtain funding on acceptable terms.
Our business is subject to operating hazards that could result in substantial losses or liabilities that may not be fully covered under our insurance policies
Natural gas, NGL and oil operations are subject to many risks, including well blowouts, craterings, explosions, uncontrollable flows of oil, natural gas or well fluids, fires, formations with abnormal pressures, pipeline ruptures or spills, pollution, releases of toxic gases and other environmental hazards and risks. If any of these hazards occur, we could sustain substantial losses as a result of:
| • | injury or loss of life; |
| • | severe damage to or destruction of property, natural resources and equipment; |
| • | pollution or other environmental damage; |
| • | clean-up responsibilities; |
| • | regulatory investigations and penalties; or |
| • | suspension of operations. |
We maintain insurance against some, but not all, of these potential risks and losses. We may elect not to obtain insurance if we believe that the cost of available insurance is excessive relative to the risks presented. We have experienced substantial increases in premiums, especially in areas affected by hurricanes and tropical storms. Insurers have imposed revised limits affecting how much the insurers will pay on actual storm claims plus the cost to re-drill wells where substantial damage has been incurred. Insurers are also requiring us to retain larger deductibles and reducing the scope of what insurable losses will include. Even with the increase in future insurance premiums, coverage will be reduced, requiring us to bear a greater potential risk if our natural gas and oil properties are damaged. In addition, pollution and environmental risks generally are not fully insurable. If a significant accident or other event occurs that is not fully covered by insurance, it could have a material adverse affect on our financial condition and results of operations.
21
Table of Contents
Additionally, we rely to a large extent on facilities owned and operated by third parties, and damage to or destruction of those third-party facilities could affect our ability to produce, transport and sell our production. We maintain business interruption insurance related to a third party processing plant in Pennsylvania where we are insured for potential losses from the interruption of production caused by loss of or damage to the processing plant.
We are subject to financing and interest rate exposure risks
Our business and operating results can be harmed by factors such as the availability, terms of and cost of capital, increases in interest rates or a reduction in our credit rating. These changes could cause our cost of doing business to increase, limit our ability to pursue acquisition opportunities, reduce cash flow used for drilling and place us at a competitive disadvantage. For example, at December 31, 2011, approximately 91% of our debt is at fixed interest rates with the remaining 9% subject to variable interest rates.
Continuing disruptions and volatility in the global finance markets may lead to a contraction in credit availability impacting our ability to finance our operations. We require continued access to capital; a significant reduction in cash flows from operations or the availability of credit could materially and adversely affect our ability to achieve our planned growth and operating results. We are exposed to some credit risk related to our bank credit facility to the extent that one or more of our lenders may be unable to provide necessary funding to us under our existing revolving line of credit if it experiences liquidity problems.
Difficult conditions in the global capital markets, the credit markets and the economy in general may materially adversely affect our business and results of operations
Access to capital is essential to our business. Global financial markets have been disrupted while volatile and economic conditions remain weak. As a result of concerns about the stability of financial markets in general and the solvency of counterparties specifically, access to credit markets has become less predictable, as many lenders and institutional investors have increased interest rates, enacted tighter lending standards and limited the amount of funding available to borrowers. As a result, we may be unable to obtain adequate funding under our current credit facility because (i) our lending counterparties may be unwilling or unable to meet their funding obligations or (ii) the amount we may borrow under our current credit facility could be reduced as a result of lower natural gas, NGLs or oil prices, declines in reserves, stricter lending requirements or regulations, or for other reasons.
Due to these factors, we cannot be certain that funding will be available on acceptable terms, or at all. If funding is not available when needed, or is available only on unfavorable terms, we may be unable to implement our business plans take advantage of business opportunities, or respond to competitive pressures, any of which could have a material adverse effect on our production, revenues and results of operations.
Hedging transactions may limit our potential gains and involve other risks
To manage our exposure to price risk, we currently and may in the future enter into derivative arrangements, utilizing commodity derivatives with respect to a portion of our future production. The goal of these hedges is to lock in prices so as to limit volatility and increase the predictability of cash flow. These transactions limit our potential gains if natural gas, NGLs and oil prices rise above the price established by the hedge.
In addition, derivative transactions may expose us to the risk of financial loss in certain circumstances, including instances in which:
| • | our production is less than expected; |
| • | the counterparties to our futures contracts fail to perform on their contract obligations; or |
| • | an event materially impacts natural gas, NGL or oil prices or the relationship between the hedged price index and the natural gas or oil sales price. |
We cannot assure you that any derivative transaction we may enter into will adequately protect us from declines in the prices of natural gas, NGLs or oil. On the other hand, where we choose not to engage in derivative transactions in the future, we may be more adversely affected by changes in natural gas, NGLs or oil prices than our competitors who engage in derivative transactions.
22
Table of Contents
The recent adoption of derivatives legislation by the United States Congress could have an adverse effect on our ability to use derivative instruments to reduce the effect of commodity price, interest rate and other risks associated with our business.
The United States Congress adopted comprehensive financial reform legislation that establishes federal oversight and regulation of the over-the-counter derivatives market and entities, such as us, that participate in that market. The new legislation, known as the Dodd-Frank Wall Street Reform and Consumer Protection Act (the “Act”), was signed into law by the President on July 21, 2010 and requires the Commodities Futures Trading Commission (the “CFTC”) and the SEC to promulgate rules and regulations implementing the new legislation within 360 days from the date of enactment, though final rules have yet to be issued. In its rulemaking under the Act, the CFTC has proposed regulations to set position limits for certain futures and options contracts in the major energy markets and for swaps that are their economic equivalents. Certain bona fide hedging transactions or positions would be exempt from these position limits. It is not possible at this time to predict when the CFTC will finalize these regulations. The financial reform legislation may also require us to comply with margin requirements and with certain clearing and trade-execution requirements in connection with our derivative activities, although the application of those provisions to us is uncertain at this time. The financial reform legislation may also require the counterparties to our derivative instruments to spin off some of their derivatives activities to a separate entity, which may not be as creditworthy as the current counterparty. The new legislation and any new regulations could significantly increase the cost of derivative contracts (including requirements to post collateral which could adversely affect our available liquidity), materially alter the terms of derivative contracts, reduce the availability of derivatives to protect against risks that we encounter, reduce our ability to monetize or restructure our existing derivative contracts, and increase our exposure to less creditworthy counterparties. If we reduce our use of derivatives as a result of the legislation and regulations, our results of operations may become more volatile and our cash flows may be less predictable, which could adversely affect our ability to plan for and fund capital expenditures. Our revenues could therefore be adversely affected if a consequence of the legislation and regulations is to lower commodity prices. Any of these consequences could have a material, adverse effect on us, our financial condition, and our results of operations.
Many of our current and potential competitors have greater resources than we have and we may not be able to successfully compete in acquiring, exploring and developing new properties
We face competition in every aspect of our business, including, but not limited to, acquiring reserves and leases, obtaining goods, services and employees needed to operate and manage our business and marketing natural gas, NGLs or oil. Competitors include multinational oil companies, independent production companies and individual producers and operators. Many of our competitors have greater financial and other resources than we do. As a result, these competitors may be able to address these competitive factors more effectively than we can or weather industry downturns more easily than we can.
The demand for field services and their ability to meet that demand may limit our ability to drill and produce our natural gas and oil properties
In a rising price environment, such as those experienced in 2007 and early 2008, well service providers and related equipment and personnel were in short supply. This caused escalating prices, the possibility of poor services coupled with potential damage to downhole reservoirs and personnel injuries. Such pressures increased the actual cost of services, extended the time to secure such services and added costs for damages due to accidents sustained from the over use of equipment and inexperienced personnel. In some cases, we are operating in areas where services and infrastructure are limited, or do not exist or in urban areas which are more restrictive.
A change in the jurisdictional characterization of some of our assets by federal, state or local regulatory agencies or a change in policy by those agencies may result in increased regulation of our assets, which may cause our revenues to decline and operating expenses to increase
Section 1(b) of the Natural Gas Act of 1938 (“NGA”) exempts natural gas gathering facilities from regulation by the Federal Energy Regulatory Commission (“FERC”) as a natural gas company under the NGA. We believe that the natural gas pipelines in our gathering systems meet the traditional tests FERC has used to establish a pipeline’s status as a gatherer not subject to regulation as a natural gas company. However, the distinction between FERC-regulated transmission services and federally unregulated gathering services is the subject of ongoing litigation, so the classification and regulation of our gathering facilities are subject to change based on future determinations by FERC, the courts, or Congress.
While our natural gas gathering operations are generally exempt from FERC regulation under the NGA, our gas gathering operations may be subject to certain FERC reporting and posting requirements in a given year. FERC has issued a final rule requiring certain participants in the natural gas market, including certain gathering facilities and natural gas marketers that engage in a minimum level of natural gas sales or purchases, to submit annual reports to FERC on the aggregate volumes of natural gas purchased or sold at wholesale in the prior calendar year to the extent such transactions utilize, contribute to, or may contribute to, the formation of price indices. In addition, FERC has issued a final rule requiring major non-interstate
23
Table of Contents
pipelines, defined as certain non-interstate pipelines delivering more than an average of 50 million MMBtu of gas over the previous three calendar years, to post daily, certain information regarding the pipeline’s capacity and scheduled flows for each receipt and delivery point that has design capacity equal to or greater than 15,000 MMBtu per day.
Other FERC regulations may indirectly impact our businesses and the markets for products derived from these businesses. FERC’s policies and practices across the range of its natural gas regulatory activities, including, for example, its policies on open access transportation, gas quality, ratemaking, capacity release and market center promotion, may indirectly affect the intrastate natural gas market. In recent years, FERC has pursued pro-competitive policies in its regulation of interstate natural gas pipelines. However, we cannot assure you that FERC will continue this approach as it considers matters such as pipelines rates and rules and policies that may affect rights of access to transportation capacity. For more information regarding the regulation of our operations, please see “Government Regulation” in Items 1 and 2 of this report.
Should we fail to comply with all applicable FERC administered statutes, rules, regulations and orders, we could be subject to substantial penalties and fines
Under the Energy Policy Act of 2005, FERC has civil penalty authority under the NGA to impose penalties for current violations of up to $1 million per day for each violation and disgorgement of profits associated with any violation. While our operations have not been regulated as a natural gas company by FERC under the NGA, FERC has adopted regulations that may subject certain of our otherwise non-FERC jurisdiction facilities to FERC annual reporting and daily scheduled flow and capacity posting requirements. We also must comply with the anti-market manipulation rules enforced by FERC. Additional rules and legislation pertaining to those and other matters may be considered or adopted by FERC from time to time. Failure to comply with those regulations in the future could subject Range to civil penalty liability. For more information regarding regulation of our operations, please see “Government Regulation” in Items 1 and 2 of this report.
The natural gas and oil industry is subject to extensive regulation
The natural gas and oil industry is subject to various types of regulations in the United States by local, state and federal agencies. Legislation affecting the industry is under constant review for amendment or expansion, frequently increasing our regulatory burden. Numerous departments and agencies, both state and federal, are authorized by statute to issue rules and regulations binding on participants in the natural gas and oil industry. Compliance with such rules and regulations often increases our cost of doing business, delays our operations and, in turn, decreases our profitability.
Our operations are subject to numerous and increasingly strict federal, state and local laws, regulations and enforcement policies relating to the environment. We may incur significant costs and liabilities in complying with existing or future environmental laws, regulations and enforcement policies and may incur costs arising out of property or natural resource damage or injuries to employees and other persons. These costs may result from our current and former operations and even may be caused by previous owners of property we own or lease or relate to third party sites where we have taken materials for recycling or disposal. Any past, present or future failure by us to completely comply with environmental laws, regulations and enforcement policies could cause us to incur substantial fines, sanctions or liabilities from cleanup costs or other damages. Incurrence of those costs or damages could reduce or eliminate funds available for exploration, development or acquisitions or cause us to incur losses. Matters subject to regulation include:
| • | the amounts and types of substances and materials that may be released into the environment; |
| • | response to unexpected releases to the environment; |
| • | reports and permits concerning exploration, drilling, production and other operations; |
| • | the spacing of wells; |
| • | unitization and pooling of properties; |
| • | calculating royalties on oil and gas produced under federal and state leases; and |
| • | taxation. |
Under these laws, we could be liable for personal injuries, property damage, oil spills, discharge of hazardous materials, remediation and clean-up costs, natural resource damages and other environmental damages. We also could be required to install expensive pollution control measures or limit or cease activities on lands located within wilderness, wetlands or other environmentally or politically sensitive areas. Failure to comply with these laws also may result in the suspension or termination of our operations and subject us to administrative, civil and criminal penalties as well as the imposition of corrective action orders.
24
Table of Contents
Climate change is receiving increasing attention from scientists, legislators and governmental agencies. There is an ongoing debate as to the extent to which our climate is changing, the potential causes of this change and its potential impacts. Some attribute global warming to increased levels of greenhouse gases, including carbon dioxide and methane, which has led to significant legislative and regulatory efforts to limit greenhouse gas emissions.
There are a number of legislative and regulatory proposals to address greenhouse gas emissions, which are in various phases of discussion or implementation. The outcome of federal and state actions to address global climate change could result in a variety of regulatory programs including potential new regulations to control or restrict emissions, taxes or other charges to deter emissions of greenhouse gases, energy efficiency requirements to reduce demand, or other regulatory actions. These actions could:
| • | result in increased costs associated with our operations; |
| • | increase other costs to our business; |
| • | affect the demand for natural gas; and |
| • | impact the prices we charge our customers. |
Adoption of federal or state requirements mandating a reduction in greenhouse gas emissions could have far-reaching and significant impacts on the energy industry and the U.S. economy. We cannot predict the potential impact of such laws or regulations on our future consolidated financial condition, results of operations or cash flows. For more information regarding the environmental regulation of our business, see “Environment and Occupational Health and Safety Matters” in Items 1 and 2 of this report.
Certain federal income tax deductions currently available with respect to natural gas and oil exploration and development may be eliminated, and additional state taxes on natural gas extraction may be imposed, as a result of future legislation.
Legislation has been proposed that would, if enacted into law, make significant changes to U.S. federal income tax laws, including the elimination of certain U.S. federal income tax benefits currently available to oil and gas exploration and production companies. Such changes include, but are not limited to, (i) the repeal of the percentage depletion allowance for oil and gas properties; (ii) the elimination of current deductions for intangible drilling and development costs; (iii) the elimination of the deduction for certain U.S. production activities; and (iv) an extension of the amortization period for certain geological and geophysical expenditures. It is unclear, however, whether any such changes will be enacted or how soon such changes could be effective. As of December 31, 2011, we had a tax basis of $1.4 billion related to prior year capitalized intangible drilling costs, which will be amortized over the next five years.
The passage of this legislation or any other similar change in U.S. federal income tax law could eliminate or postpone certain tax deductions that are currently available with respect to natural gas and oil exploration and development, and any such change could negatively affect our financial condition and results of operations.
In February 2012, the state legislature of Pennsylvania passed a new natural gas impact fee in Pennsylvania, where the majority of our acreage in the Marcellus Shale is located. The legislation imposes an annual fee on natural gas and oil operators for each well drilled for a period of fifteen years. The fee is on a sliding scale set by the Public Utility Commission and is based on two factors: changes in the Consumer Price Index and the average New York Mercantile Exchange’s natural gas prices from the last day of each month. The estimated total fees per well based on today’s current natural gas price is $240,000 over the 15 year period. The passage of this legislation increases the financial burden on our operations in the Marcellus Shale.
Acquisitions are subject to the risks and uncertainties of evaluating reserves and potential liabilities and may be disruptive and difficult to integrate into our business
We could be subject to significant liabilities related to our acquisitions. It generally is not feasible to review in detail every individual property included in an acquisition. Ordinarily, a review is focused on higher valued properties. However, even a detailed review of all properties and records may not reveal existing or potential problems in all of the properties, nor will it permit us to become sufficiently familiar with the properties to assess fully their deficiencies and capabilities. We do not always inspect every well we acquire, and environmental problems, such as groundwater contamination, are not necessarily observable even when an inspection is performed.
In addition, there is intense competition for acquisition opportunities in our industry. Competition for acquisitions may increase the cost of, or cause us to refrain from, completing acquisitions. Our acquisition strategy is dependent upon, among other things, our ability to obtain debt and equity financing and, in some cases, regulatory approvals. Our ability to pursue our acquisition strategy may be hindered if we are unable to obtain financing on terms acceptable to us or regulatory approvals.
25
Table of Contents
Acquisitions often pose integration risks and difficulties. In connection with recent and future acquisitions, the process of integrating acquired operations into our existing operations may result in unforeseen operating difficulties and may require significant management attention and financial resources that would otherwise be available for the ongoing development or expansion of existing operations. Future acquisitions could result in our incurring additional debt, contingent liabilities, expenses and diversion of resources, all of which could have a material adverse effect on our financial condition and operating results.
Our success depends on key members of our management and our ability to attract and retain experienced technical and other professional personnel
Our success is highly dependent on our management personnel and none of them is currently subject to an employment contract. The loss of one or more of these individuals could have a material adverse effect on our business. Furthermore, competition for experienced technical and other professional personnel remains strong. If we cannot retain our current personnel or attract additional experienced personnel, our ability to compete could be adversely affected. Also, the loss of experienced personnel could lead to a loss of technical expertise.
Drilling is an uncertain and costly activity
The cost of drilling, completing, and operating a well is often uncertain, and many factors can adversely affect the economics of a well. Our efforts will be uneconomical if we drill dry holes or wells that are productive but do not produce enough natural gas, NGLs and oil to be commercially viable after drilling, operating and other costs. Furthermore, our drilling and producing operations may be curtailed, delayed, or canceled as a result of other factors, including:
| • | high costs, shortages or delivery delays of drilling rigs, equipment, water for hydraulic fracturing services, labor, or other services; |
| • | unexpected operational events and drilling conditions; |
| • | reductions in natural gas, NGLs and oil prices; |
| • | limitations in the market for natural gas, NGLs and oil; |
| • | adverse weather conditions; |
| • | facility or equipment malfunctions; |
| • | equipment failures or accidents; |
| • | title problems; |
| • | pipe or cement failures; |
| • | casing collapses; |
| • | compliance with, or changes in environmental, tax and other governmental requirements; |
| • | environmental hazards, such as natural gas leaks, oil spills, pipeline ruptures, and discharges of toxic gases; |
| • | lost or damaged oilfield drilling and service tools; |
| • | unusual or unexpected geological formations; |
| • | loss of drilling fluid circulation; |
| • | pressure or irregularities in formations; |
| • | fires; |
| • | natural disasters; |
| • | surface craterings and explosions; and |
| • | uncontrollable flows of oil, natural gas or well fluids. |
If any of these factors were to occur with respect to a particular field, we could lose all or a part of our investment in the field, or we could fail to realize the expected benefits from the field, either of which could materially and adversely affect our revenue and profitability.
26
Table of Contents
New technologies may cause our current exploration and drilling methods to become obsolete
The natural gas and oil industry is subject to rapid and significant advancements in technology, including the introduction of new products and services using new technologies. As competitors use or develop new technologies, we may be placed at a competitive disadvantage, and competitive pressures may force us to implement new technologies at a substantial cost. In addition, competitors may have greater financial, technical and personnel resources that allow them to enjoy technological advantages and may in the future allow them to implement new technologies before we can. One or more of the technologies that we currently use or that we may implement in the future may become obsolete. We cannot be certain that we will be able to implement technologies on a timely basis or at a cost that is acceptable to us. If we are unable to maintain technological advancements consistent with industry standards, our operations and financial condition may be adversely affected.
New legislation and regulatory initiatives relating to hydraulic fracturing could result in increased costs and additional operating restrictions or delays.
Hydraulic fracturing involves the injection of water, sand and small amounts of additives under pressure into rock formations to stimulate hydrocarbon (natural gas and oil) production. We find that the use of hydraulic fracturing is necessary to produce commercial quantities of natural gas and oil from many reservoirs, especially shale formations such as the Marcellus Shale. The process is typically regulated by state oil and gas commissions. However, the EPA, recently asserted federal regulatory authority over hydraulic fracturing involving diesel additives under the Safe Drinking Water Act’s Underground Injection Control Program. While the EPA has begun the process of drafting guidance documents to enforce or implement this newly asserted regulatory authority, industry groups have filed suit challenging the EPA’s recent decision. There are certain governmental reviews either underway or being proposed that focus on environmental aspects of hydraulic fracturing practices. The White House Council on Environmental Quality is coordinating an administration-wide review of hydraulic fracturing practices, and a committee of the United States House of Representatives has conducted an investigation of hydraulic fracturing practices. Furthermore, a number of federal agencies are analyzing, or have been requested to review a variety of environmental issues associated with hydraulic fracturing. The EPA has commenced a study of potential environmental effects of hydraulic fracturing on drinking water and groundwater, with initial results expected to be available by late 2012 and final results by 2014 and, more recently in October 2011, the EPA announced that it is launching a study regarding wastewater resulting from hydraulic fracturing activities and currently plans to propose standards by 2014 that such wastewater must meet before being transported to a treatment plant. Also, the U.S. Department of Energy is conducting an investigation into practices the agency could recommend to better protect the environment from drilling using hydraulic fracturing completion methods and the U.S. Department of the Interior has proposed disclosure, well testing and monitoring requirements for hydraulic fracturing on federal lands. At the same time, legislation has been introduced before Congress to provide for federal regulation of hydraulic fracturing and to require disclosure of the chemicals used in the fracturing process. In addition, some states have adopted, and other states are considering adopting, regulations that could impose more stringent permitting, disclosure and well construction requirements on hydraulic fracturing operations. For example, Texas, Pennsylvania, Colorado, West Virginia and Wyoming have each adopted a variety of well construction, set back, or disclosure regulations limiting how fracturing can be performed and requiring various degrees of chemical disclosure. If new laws or regulations that significantly restrict hydraulic fracturing are adopted, such laws could make it more difficult or costly for us to perform fracturing to stimulate production from tight formations. In addition, if hydraulic fracturing becomes regulated at the federal level as a result of federal legislation or regulatory initiatives by the EPA, our fracturing activities could become subject to additional permitting requirements and also to attendant permitting delays and potential increases in costs.
Additionally, on December 7, 2010, the EPA issued an order to us to take certain action with regard to the existence of natural gas in two water wells located in southern Parker County, Texas that the EPA concluded resulted from two of our wells in the Barnett Shale formation, thousands of feet below the impacted aquifer. On January 18, 2011, the EPA filed an action in federal court to enforce the order and its penalty provisions of up to $16,500 per day per violation. On June 24, 2011, the court issued an order staying the enforcement action, pending a ruling on Range’s challenge of the order in the United States Court of Appeals for the Fifth Circuit which Range filed in January 21, 2011, seeking to invalidate the order. While we are vigorously contesting this enforcement action and seeking relief from the order in federal appeals court, we cannot predict the outcome of either the enforcement action or appeal. However, we do not believe the ultimate resolution of this matter will have a material impact on our financial position, statement of operations or cash flows. Please see “Action by the United States Environmental Protection Agency” in Item 3 of this report.
Our business depends on natural gas and oil transportation and NGL processing facilities, most of which are owned by others and our ability to contract with those parties
Our ability to sell our natural gas, NGLs and oil production depends in part on the availability, proximity and capacity of pipeline systems and processing facilities owned by third parties and our ability to contract with those third parties. The lack of available capacity on these systems and facilities could result in the shut-in of producing wells or the delay or discontinuance of development plans for properties. Although we have some contractual control over the transportation of our product, material changes in these business relationships could materially affect our operations. In some cases, we do not purchase firm transportation on third party facilities and therefore, our production transportation can be interrupted by those
27
Table of Contents
having firm arrangements. We have entered into long-term agreements with third parties to provide natural gas gathering and processing services in the Marcellus Shale. Federal and state regulation of natural gas and oil production and transportation, tax and energy policies, changes in supply and demand, pipeline pressures, damage to or destruction of pipelines and general economic conditions could adversely affect our ability to produce, gather and transport natural gas, NGLs and oil. If any of these third party pipelines and other facilities become partially or fully unavailable to transport or process our product, or if the natural gas quality specifications for a natural gas pipeline or facility changes so as to restrict our ability to transport natural gas on those pipelines or facilities, our revenues could be adversely affected.
The disruption of third-party facilities due to maintenance and/or weather could negatively impact our ability to market and deliver our products. In particular, the disruption of certain third-party natural gas processing facilities in the Marcellus Shale could materially affect our ability to market and deliver natural gas production in that area. We have no control over when or if such facilities are restored and generally have no control over what prices will be charged. A total shut-in of production could materially affect us due to a lack of cash flow, and if a substantial portion of the production is hedged at lower than market prices, those financial hedges would have to be paid from borrowings absent sufficient cash flow.
Currently, there is little demand, or facilities to supply the existing demand, for ethane in the Appalachian region so, for our Appalachian production volumes, ethane remains in the natural gas stream. We currently have waivers from two transmission pipelines that allow us to leave ethane in the residue natural gas. We currently believe the limits are sufficient to cover our production through 2014. We have recently announced two ethane agreements where we have contracted to either sell or transport ethane from our Marcellus Shale area, both to begin operations in late 2013 or early 2014. We cannot assure you that these facilities will become available. If we are not able to sell ethane in 2014, we may be required to curtail production which will adversely affect our revenues.
Any failure to meet our debt obligations could harm our business, financial condition and results of operations
If our cash flow and capital resources are insufficient to fund our debt obligations, we may be forced to sell assets, seek additional equity or restructure our debt. In addition, any failure to make scheduled payments of interest and principal on our outstanding indebtedness would likely result in a reduction of our credit rating, which could harm our ability to incur additional indebtedness on acceptable terms. Our cash flow and capital resources may be insufficient for payment of interest on and principal of our debt in the future and any such alternative measures may be unsuccessful or may not permit us to meet scheduled debt service obligations, which could cause us to default on our obligations and impair our liquidity.
We exist in a litigious environment
Any constituent could bring suit regarding our existing or planned operations or allege a violation of an existing contract. Any such action could delay when planned operations can actually commence or could cause a halt to existing production until such alleged violations are resolved by the courts. Not only could we incur significant legal and support expenses in defending our rights, but halting existing production or delaying planned operations could impact our future operations and financial condition. Such legal disputes could also distract management and other personnel from their primary responsibilities.
Our financial statements are complex
Due to United States generally accepted accounting principles and the nature of our business, our financial statements continue to be complex, particularly with reference to hedging, asset retirement obligations, equity awards, deferred taxes, the accounting for our deferred compensation plans and discontinued operations. We expect such complexity to continue and possibly increase.
Risks Related to Our Common Stock
Common stockholders will be diluted if additional shares are issued
In 2004, 2005, 2006 and 2007, we sold 48.3 million shares of common stock to finance acquisitions. In 2008, we sold 4.4 million shares of common stock with the proceeds used to pay down a portion of the outstanding balance of our bank credit facility. In 2009, we issued 744,000 shares of common stock to purchase acreage in the Marcellus Shale. In 2010, we issued 380,000 shares of common stock to purchase acreage in the Marcellus Shale. Our ability to repurchase securities for cash is limited by our bank credit facility and our senior subordinated note agreements. We also issue restricted stock and stock appreciation rights to our employees and directors as part of their compensation. In addition, we may issue additional shares of common stock, additional subordinated notes or other securities or debt convertible into common stock, to extend maturities or fund capital expenditures, including acquisitions. If we issue additional shares of our common stock in the future, it may have a dilutive effect on our current outstanding stockholders.
28
Table of Contents
Dividend limitations
Limits on the payment of dividends and other restricted payments, as defined, are imposed under our bank credit facility and under our senior subordinated note agreements. These limitations may, in certain circumstances, limit or prevent the payment of dividends independent of our dividend policy.
Our stock price may be volatile and you may not be able to resell shares of our common stock at or above the price you paid
The price of our common stock fluctuates significantly, which may result in losses for investors. The market price of our common stock has been volatile. From January 1, 2009 to December 31, 2011, the price of our common stock reported by the New York Stock Exchange ranged from a low of $30.90 per share to a high of $77.24 per share. We expect our stock to continue to be subject to fluctuations as a result of a variety of factors, including factors beyond our control. These factors include:
| • | changes in natural gas, NGLs and oil prices; |
| • | variations in quarterly drilling, recompletions, acquisitions and operating results; |
| • | changes in governmental regulation; |
| • | changes in financial estimates by securities analysts; |
| • | changes in market valuations of comparable companies; |
| • | additions or departures of key personnel; or |
| • | future sales of our stock and changes in our capital structure. |
We may fail to meet expectations of our stockholders or of securities analysts at some time in the future and our stock price could decline as a result.
| ITEM 1B. | UNRESOLVED STAFF COMMENTS |
None.
| ITEM 3. | LEGAL PROCEEDINGS |
We are the subject of, or party to, a number of pending or threatened legal actions and claims arising in the ordinary course of our business. While many of these matters involve inherent uncertainty, we believe that the amount of the liability, if any, ultimately incurred with respect to proceedings or claims will not have a material adverse effect on our consolidated financial position as a whole or on our liquidity, capital resources or future annual results of operations. We will continue to evaluate our litigation on a quarter-by-quarter basis and will establish and adjust any litigation reserves as appropriate to reflect our assessment of the then current status of litigation.
Action by the United States Environmental Protection Agency
On December 7, 2010, the EPA, Region VI, issued an administrative order (the “Order”) to Range, and our subsidiary Range Production Company, directing us to take certain action with regard to the existence of natural gas in two water wells in southern Parker County, Texas. The Order was issued without prior notice and without an opportunity for us to respond to the allegations on which the order was based, including the EPA’s conclusion that two of our subsidiary’s wells completed and producing from the Barnett Shale formation at a depth of approximately 5,800 feet caused or contributed to the presence of natural gas in the aquifer which is found at a depth of approximately 200-400 feet. Because we believe the Order was factually baseless and legally deficient, we advised the EPA that we would not voluntarily comply with the Order. Instead we requested that the EPA review additional data provided by us to the EPA and withdraw the Order based on the fact the conclusions in the Order were based on insufficient data and incorrect analysis. Additionally, the Texas Railroad Commission (the “Commission”), the state agency with jurisdiction over our operations of the wells, had an ongoing investigation into the occurrence of natural gas in one of the two subject water wells (an investigation in which we were cooperating) and, in reaction to the Order, ordered a hearing to address the conclusions in the Order. The EPA declined to participate in the Commission hearing held on January 19 and 20, 2011. The Commission entered an order March 22, 2011 confirming that Range did not cause or contribute to the natural gas in the water aquifer and has closed its investigation.
Prior to the Railroad Commission hearing, in cooperation with the Commission’s Oil and Gas Division, we conducted a further investigation, in addition to the investigative efforts made from August 2010 to December 2010, including additional gas sampling, water sampling, soil sampling and analyses of natural gas from our wells, water from more than 25 area water wells and several hundred soil gas samples. Expert witness testimony and other evidence at the Commission hearing
29
Table of Contents
demonstrated, in summary, that: (i) it is impossible for hydraulic fracturing of our wells to have caused any harm to any water aquifer at the depths of the subject aquifer; (ii) isotopic and compositional gas sample analysis demonstrated that the source of the natural gas in the water aquifer is a shallow rock formation known as the Strawn formation which lies directly beneath the water aquifer and has geologic connection to the water aquifer including flow pathways for gas and water to move from the Strawn formation to the aquifer, (iii) the EPA’s factual conclusions from its isotopic analysis are flawed and do not support the legal conclusions in the Order; (iv) our wells are sound with properly designed and constructed wellbores that are not a pathway for natural gas to flow into the water aquifer; (v) a number of other water wells in the area, which predate the drilling and completion of our wells, are known to contain natural gas and have actually produced significant quantities of natural gas; (vi) a number of other water wells in the area have been drilled through the water aquifer into the Strawn formation, providing additional potential pathways beyond the geologic connection of the Strawn to the water aquifer, for natural gas to migrate from the Strawn into the water aquifer; (vii) the water sampling demonstrates that water from the aquifer is safe to drink; and (viii) provided the water wells in the area are properly vented, human health is protected and any safety hazards associated with the levels of natural gas in the water wells are removed.
Without waiting to consider the outcome of the Railroad Commission hearing or taking the opportunity to review the extensive evidence submitted to the Railroad Commission in the hearing and in the investigation, on January 18, 2011, the EPA filed an action in the United States District Court for the Northern District of Texas, Dallas Division, seeking a judgment enforcing the Order and of up to $16,500 per day for each alleged violation of the Order. On June 14, 2011, the court issued an order staying the enforcement action, pending a ruling on Range’s challenge of the Order in the United States Court of Appeals for the Fifth Circuit which Range filed on January 21, 2011, seeking to invalidate the Order on the basis of the factual errors and legal deficiencies. Oral argument in the Fifth Circuit was held on October 3, 2011 but the Fifth Circuit has not yet ruled. While we believe that the Order lacks sufficient factual and legal bases, and Range will vigorously pursue the appeal of the Order and defend stay of the enforcement action, at this time we cannot predict the outcome of either the enforcement action or the appeal. However, we do not believe the ultimate resolution of this matter will have a material impact on our financial position, statement of operations or cash flows.
| ITEM 4. | MINE SAFETY DISCLOSURES |
Not applicable.
30
Table of Contents
| ITEM 5. | MARKET FOR REGISTRANT’S COMMON EQUITY, RELATED STOCKHOLDER MATTERS AND ISSUER PURCHASES OF EQUITY SECURITIES |
Our common stock is listed on the New York Stock Exchange (“NYSE”) under the symbol “RRC.” During 2011, trading volume averaged 2.6 million shares per day. The following table shows the quarterly high and low sale prices and cash dividends declared as reported on the NYSE composite tape for the past two years.
| High | Low | Cash Dividends Declared |
||||||||||
| 2010 |
||||||||||||
| First quarter |
$ | 54.65 | $ | 44.68 | $ | 0.04 | ||||||
| Second quarter |
53.64 | 40.00 | 0.04 | |||||||||
| Third quarter |
43.12 | 32.25 | 0.04 | |||||||||
| Fourth quarter |
46.25 | 35.11 | 0.04 | |||||||||
| 2011 |
||||||||||||
| First quarter |
$ | 59.23 | $ | 44.20 | $ | 0.04 | ||||||
| Second quarter |
59.64 | 50.55 | 0.04 | |||||||||
| Third quarter |
77.24 | 51.56 | 0.04 | |||||||||
| Fourth quarter |
74.93 | 52.21 | 0.04 | |||||||||
Between January 1, 2012 and February 17, 2012, the common stock traded at prices between $54.16 and $63.37 per share. Our senior subordinated notes are not listed on an exchange, but trade over-the-counter.
Holders of Record
On February 17, 2012, there were approximately 1,353 holders of record of our common stock.
Dividends
The payment of dividends is subject to declaration by the Board of Directors and depends on earnings, capital expenditures and various other factors. The Board of Directors declared quarterly dividends of $0.04 per common share for each of the four quarters of 2011, 2010 and 2009. The bank credit facility and our senior subordinated notes allow for the payment of common and preferred dividends, with certain limitations. The determination of the amount of future dividends, if any, to be declared and paid is at the sole discretion of our board and will depend upon our level of earnings and capital expenditures and other matters that the board deems relevant. Dividends on Range common stock are limited to our legally available funds. For more information, see Item 7 of this report “Management’s Discussion and Analysis of Financial Condition and Results of Operations.”
Issuer Purchases of Equity Securities
We have a repurchase program approved by the Board of Directors in 2008 for the repurchase of up to $10.0 million of common stock based on market conditions and opportunities. There were no repurchases during 2009, 2010 or 2011. As of December 31, 2011, we have $6.8 million remaining under this authorization.
31
Table of Contents
Stockholder Return Performance Presentation*
The following graph is included in accordance with the SEC’s executive compensation disclosure rules. This historic stock price performance is not necessarily indicative of future stock performance. The graph compares the change in the cumulative total return of Range’s common stock, the Dow Jones U.S. Exploration and Production Index, and the S&P 500 Index for the five years ended December 31, 2011. The graph assumes that $100 was invested in the Company’s common stock and each index on December 31, 2006, and that dividends were reinvested.
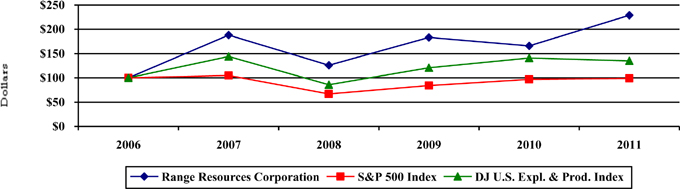
| 2006 | 2007 | 2008 | 2009 | 2010 | 2011 | |||||||||||||||||||
| Range Resources Corporation |
$ | 100 | $ | 188 | $ | 126 | $ | 183 | $ | 166 | $ | 229 | ||||||||||||
| S&P 500 Index |
100 | 105 | 67 | 84 | 97 | 99 | ||||||||||||||||||
| DJ U.S. Expl. & Prod. Index |
100 | 144 | 86 | 121 | 141 | 135 | ||||||||||||||||||
| * | The performance graph and the information contained in this section is not “soliciting material,” is being “furnished” not “filed” with the SEC and is not to be incorporated by reference into any of our filings under the Securities Act or the Exchange Act whether made before or after the date hereof and irrespective of any general incorporation language contained in such filing. |
32
Table of Contents
| ITEM 6. | SELECTED FINANCIAL DATA |
The following table shows selected financial information for the five years ended December 31, 2011. Significant producing property acquisitions and dispositions may affect the comparability of year-to-year financial and operating data. In the first half of 2011, we sold our Barnett Shale properties for proceeds of $889.3 million, including certain derivative contracts assumed by the buyer. In the first half of 2010, we sold our Ohio properties for proceeds of $323.0 million. The financial and statistical data contained in the following discussion reflect our Barnett Shale operations, which were substantially all sold in April 2011 and our Gulf of Mexico operations, which were sold in 2007, as discontinued operations. This information should be read in conjunction with Item 7 of this report “Management’s Discussion and Analysis of Financial Condition and Results of Operations,” and our consolidated financial statements and related notes included elsewhere in this report.
| Year Ended December 31, | ||||||||||||||||||||
| 2011 | 2010 | 2009 | 2008 | 2007 | ||||||||||||||||
| (in thousands, except per share data) | ||||||||||||||||||||
| Statements of Operations Data: |
||||||||||||||||||||
| Natural gas, NGL and oil sales |
$ | 1,173,266 | $ | 823,290 | $ | 751,749 | $ | 994,769 | $ | 746,751 | ||||||||||
| Total revenues and other income |
1,218,656 | 951,636 | 819,166 | 1,092,882 | 744,596 | |||||||||||||||
| Total costs and expenses |
1,140,393 | 812,028 | 734,393 | 582,609 | 526,035 | |||||||||||||||
| Income from continuing operations |
42,706 | 88,698 | 38,980 | 329,093 | 133,553 | |||||||||||||||
| Discontinued operations (net of tax) |
15,320 | (327,954 | ) | (92,850 | ) | 21,947 | 83,715 | |||||||||||||
| Net income (loss) |
58,026 | (239,256 | ) | (53,870 | ) | 351,040 | 217,268 | |||||||||||||
| Income from continuing operations per share: |
||||||||||||||||||||
| -Basic |
$ | 0.26 | $ | 0.56 | $ | 0.25 | $ | 2.18 | $ | 0.93 | ||||||||||
| -Diluted |
0.26 | 0.55 | 0.24 | 2.11 | 0.89 | |||||||||||||||
| Net income (loss) |
||||||||||||||||||||
| -Basic |
0.36 | (1.53 | ) | (0.35 | ) | 2.32 | 1.51 | |||||||||||||
| -Diluted |
0.36 | (1.52 | ) | (0.34 | ) | 2.25 | 1.45 | |||||||||||||
| Balance Sheets Data: |
||||||||||||||||||||
| Current assets (a) |
$ | 315,263 | $ | 1,113,570 | $ | 182,810 | $ | 406,557 | $ | 262,244 | ||||||||||
| Current liabilities (b) |
511,932 | 443,690 | 321,634 | 355,760 | 305,863 | |||||||||||||||
| Natural gas and oil properties, net |
5,157,566 | 4,084,013 | 3,551,635 | 3,466,028 | 2,665,324 | |||||||||||||||
| Total assets |
5,845,470 | 5,511,714 | 5,403,411 | 5,554,125 | 4,005,723 | |||||||||||||||
| Bank debt |
187,000 | 274,000 | 324,000 | 693,000 | 303,500 | |||||||||||||||
| Subordinated notes |
1,787,967 | 1,686,536 | 1,383,833 | 1,097,562 | 847,158 | |||||||||||||||
| Stockholders’ equity (c) |
2,392,420 | 2,223,761 | 2,378,589 | 2,451,342 | 1,717,736 | |||||||||||||||
| Weighted average diluted shares outstanding |
159,441 | 158,428 | 158,778 | 155,943 | 149,911 | |||||||||||||||
| Cash dividends declared per common share |
0.16 | 0.16 | 0.16 | 0.16 | 0.13 | |||||||||||||||
| Statements of Cash Flows Data: |
||||||||||||||||||||
| Net cash provided from operating activities |
$ | 631,637 | $ | 513,322 | $ | 591,675 | $ | 824,767 | $ | 642,291 | ||||||||||
| Net cash used in investing activities |
(547,981 | ) | (798,858 | ) | (473,807 | ) | (1,731,777 | ) | (1,020,572 | ) | ||||||||||
| Net cash (used in) provided from financing activities |
(86,412 | ) | 287,617 | (117,854 | ) | 903,745 | 379,917 | |||||||||||||
| (a) | 2010 includes $877.6 million assets of discontinued operations compared to $43.5 million in 2009. 2009 includes $8.1 million deferred tax assets compared to $26.9 million in 2007. 2011 includes $173.9 million of unrealized derivative assets compared to $123.3 million in 2010, $21.5 million in 2009, $221.4 million in 2008 and $53.0 million in 2007. |
| (b) | 2010 includes $352,000 of unrealized derivative liabilities compared to $14.5 million in 2009, $10,000 in 2008 and $30.5 million in 2007. 2011 includes a $56.6 million deferred tax liability compared to $11.8 million in 2010 and $33.0 million in 2008. |
| (c) | Stockholders’ equity includes other comprehensive income (loss) of $156.6 million in 2011 compared to $67.5 million in 2010, $6.4 million in 2009, $77.5 million in 2008 and ($26.8 million) in 2007. |
33
Table of Contents
| ITEM 7. | MANAGEMENT’S DISCUSSION AND ANALYSIS OF FINANCIAL CONDITION AND RESULTS OF OPERATIONS |
The following discussion is intended to assist you in understanding our business and results of operations together with our present financial condition. Certain sections of Management’s Discussion and Analysis of Financial Condition and Results of Operations include forward-looking statements concerning trends or events potentially affecting our business. These statements contain words such as “anticipates,” “believes,” “expects,” “targets,” “plans,” “projects,” “could,” “may,” “should,” “would” or similar words indicating that future outcomes are uncertain. In accordance with “safe harbor” provisions for the Private Securities Litigation Reform Act of 1995, these statements are accompanied by cautionary language identifying important factors, though not necessarily all such factors, which could cause future outcomes to differ materially from those set forth in the forward-looking statements. Management’s Discussion and Analysis of Financial Condition and Results of Operations should be read in conjunction with the information under Items 1 and 2. Business and Properties, Item 1A. Risk Factors, Item 6. Selected Financial Data and Item 8. Financial Statements Data in this report. Unless otherwise indicated, the information included herein relates to our continuing operations.
Overview of Our Business
We are an independent natural gas, natural gas liquids and oil company engaged in the exploration, development and acquisition of natural gas and crude oil properties in the Appalachian and Southwestern regions of the United States. We operate in one segment and have a single company-wide management team that administers all properties as a whole rather than by discrete operating segments. We track only basic operational data by area. We do not maintain complete separate financial statement information by area. We measure financial performance as a single enterprise and not on an area-by-area basis.
Our objective is to build stockholder value through consistent growth in reserves and production on a cost-efficient basis. Our strategy to achieve our objective is to increase reserves and production through internally generated drilling projects occasionally coupled with complementary acquisitions. Our revenues, profitability and future growth depend substantially on prevailing prices for natural gas, natural gas liquids (“NGLs”) and crude oil and on our ability to economically find, develop, acquire and produce natural gas, NGLs and oil reserves. We use the successful efforts method of accounting for our natural gas, natural gas liquids and oil activities. Our corporate headquarters is located in Fort Worth, Texas.
Industry Environment
We operate entirely within the United States. As traditional basins in the U.S. have matured, exploration and production has shifted to unconventional “resource” plays, typically shale reservoirs that historically were not thought to be productive for natural gas and oil. These plays cover large areas, provide multi-year inventories of drilling opportunities and, with modern oil and gas technology, have sustainable lower risk and higher growth profiles. The economics of these plays have been enhanced by continued advancements in drilling and completion technologies. These advancements make these plays more resilient to lower commodity prices while increasing the domestic supply of natural gas. Examples of such technological advancements include advanced 3-D seismic processing, hydraulic reservoir fracture stimulation using almost one hundred percent sand and water, advances in well logging and analysis, horizontal drilling and completion technologies and automated remote well monitoring and control devices.
Natural gas, NGLs and oil are commodities. The price that we receive for the natural gas we produce is largely a function of market supply and demand in the United States. Demand is impacted by general economic conditions, weather and other seasonal conditions, including hurricanes and tropical storms. Over or under supply of natural gas can result in price volatility. Factors impacting the future supply balance are the growth in domestic gas production and the United States’ LNG import and pending export capacity. Gas supplies in the United States have increased as a result of recent expansion in domestic unconventional gas production. As a result, natural gas prices are approaching historical lows. Crude oil prices are generally determined by global supply and demand, geopolitical factors and currency exchange rates.
The reduced liquidity provided by the worldwide financial markets and other factors that resulted in an economic slowdown in the United States and other industrialized countries in 2008 also resulted in reductions in worldwide energy demand. At the same time, North American gas supply increased as a result of the expansion in domestic unconventional natural gas production. The combination of lower demand due to the economic slowdown and greater North American gas supply resulted in declines in natural gas prices from their highs in mid-2008. While oil and NGL prices have steadily improved since the beginning of second quarter 2009, natural gas prices have remained depressed. Natural gas prices continue to be low due to lower domestic demand and concerns over excess supply due to the high productivity of several emerging shale plays in the United States.
34
Table of Contents
Natural gas, NGLs and oil prices affect:
| • | the amount of cash flow available to us for capital expenditures; |
| • | our ability to borrow and raise additional capital; |
| • | the quantity of natural gas, NGLs and oil that we can economically produce; |
| • | revenues and profitability; and |
| • | the accounting for our natural gas, NGLs and oil activities. |
Natural gas prices are likely to affect us more than oil prices because approximately 79% of our proved reserves are natural gas. Any continued or extended decline in natural gas and oil prices could have a material adverse effect on our financial position, results of operations, cash flows and access to capital. To achieve more predictable cash flows and to reduce our exposure to downward price fluctuations, we currently and may in the future use derivative instruments to hedge future sales prices on our natural gas, NGLs and oil production. The use of derivative instruments has in the past and may in the future, prevent us from realizing the full benefit of upward price movements but also partially protects us from declining price movements.
Source of Our Revenues
We derive our revenues from the sale of natural gas, NGLs and oil that is produced from our properties. Revenues from product sales are a function of the volumes produced, prevailing market prices, product quality, gas Btu content and transportation costs. We generally sell natural gas, NGLs and oil under two types of agreements, which are common in our industry. Both types of agreements include transportation charges. One type of agreement is a netback agreement, under which we sell natural gas and oil at the wellhead and collect a price, net of transportation incurred by the purchaser. In this case, we record revenue at the price we received from the purchaser. In the case of NGLs, we generally receive a net price from the purchaser (which is net of processing costs) and is also recorded in revenue at the net price we receive from the purchaser. Under the other type of agreement, we sell natural gas or oil at a specific delivery point, pay transportation to a third party and receive proceeds from the purchaser with no transportation deduction. In that case, we record transportation costs as transportation, gathering and compression expense. Also included in total revenues and other income are the effects of derivative accounting. Derivatives included in natural gas, NGLs and oil sales reflect settlements on those derivatives that qualify for hedge accounting. Cash settlements of derivative contracts that are not accounted for as hedges are included in derivative fair value income in the accompanying statements of operations. Other revenues also include gains on sales of assets, transportation revenue we receive from gathering lines we own and equity method investments. Discontinued operations include our Barnett Shale properties which were sold in April 2011. Unless indicated otherwise, the information included herein relates to our continuing operations.
Principal Components of Our Cost Structure
| • | Direct operating. These are day-to-day costs incurred to bring hydrocarbons out of the ground and to the market together with the daily costs incurred to maintain our producing properties. Such costs also include compensation of our field employees, maintenance, repairs and workovers expenses related to our natural gas and oil properties. These costs are expected to remain a function of supply and demand. Direct operating expenses also include stock-based compensation expense (non-cash) associated with grants of stock appreciation rights (SARs) as part of the compensation of field employees. |
| • | Transportation, gathering and compression. Under some of our sales arrangements, we sell natural gas at a specific delivery point, pay transportation, gathering and compression costs to a third party and receive proceeds from the purchaser with no deduction. These costs represent those transportation, gathering and compression costs paid by Range to third parties. |
| • | Production and ad valorem taxes. Production taxes are paid on produced natural gas and oil based on a percentage of market prices (not hedged prices) or at fixed rates established by federal, state or local taxing authorities. Ad valorem taxes are generally based on reserve values at the end of each year. |
| • | Exploration. These are geological and geophysical costs, including payroll and benefits for the geological and geophysical staff, seismic costs, delay rentals and the costs of unsuccessful exploratory dry holes. Exploration expense also includes stock-based compensation expense (non-cash) associated with grants of SARs and the amortization of restricted stock grants as part of the compensation of our exploration staff. |
| • | Abandonment and impairment of unproved properties. This category includes unproved property impairment and costs associated with lease expirations. |
| • | General and administrative. These costs include overhead, including payroll and benefits for our corporate staff, costs of maintaining our headquarters, costs of managing our production and development operations, franchise |
35
Table of Contents
| taxes, audit and other professional fees and legal compliance. Included in this category are overhead expense reimbursements we receive from working interest owners of properties, for which we serve as the operator. These reimbursements are received during both the drilling and operational stages of a property’s life. General and administrative expense also includes stock-based compensation expense (non-cash) associated with grants of SARs and the amortization of restricted stock grants as part of the compensation of our corporate staff. |
| • | Deferred compensation plan. These costs relate to the increase or decrease in the value of the liability associated with our deferred compensation plan. Our deferred compensation plan gives directors, officers and key employees the ability to defer all or a portion of their salaries and bonuses and invest in our common stock or make other investments at the individual’s discretion. The assets of this plan are held in a grantor trust and are available to satisfy the claims of our creditors in the event of bankruptcy or insolvency. |
| • | Interest. We typically finance a portion of our working capital requirements and acquisitions with borrowings under our bank credit facility and with longer-term debt securities. As a result, we incur interest expense that is affected by both fluctuations in interest rates and our financing decisions. We will likely continue to incur interest expense as we continue to grow. We currently have no capitalized interest. |
| • | Depreciation, depletion and amortization. This includes the systematic expensing of the capitalized costs incurred to acquire, explore and develop natural gas, NGLs and oil. As a successful efforts company, we capitalize all costs associated with our acquisition and development efforts and all successful exploration efforts, and apportion these costs to each unit of production through depreciation, depletion and amortization expense. This expense also includes the systematic, monthly accretion of the future abandonment costs of tangible assets such as wells, service assets, pipelines, and other facilities. |
| • | Income taxes. We are subject to state and federal income taxes but are currently not in a cash taxpaying position for federal income taxes, primarily due to the current deductibility of intangible drilling costs (“IDC”). We do pay some state income taxes where our IDC deductions do not exceed our taxable income or where state income taxes are determined on a basis other than federal taxable income. Currently, substantially all of our federal taxes are deferred and we anticipate using all of our net operating loss carryforwards. For additional information, see “Risk Factors-Certain federal income tax deductions currently available with respect to natural gas and oil exploration and development may be eliminated, and additional state taxes on natural gas extraction may be imposed, as a result of future legislation,” in Item 1A of this report. |
Management’s Discussion and Analysis of Income and Operations
Market Conditions
Prices for various quantities of natural gas, NGLs and oil that we produce significantly impact our revenues and cash flows. Prices for commodities, such as hydrocarbons, are inherently volatile. The following table lists average New York Mercantile Exchange (“NYMEX”) prices for natural gas and oil for the year ended December 31, 2011, 2010 and 2009.
| Year Ended December 31, |
||||||||||||
| 2011 | 2010 | 2009 | ||||||||||
| Average NYMEX prices (a) |
||||||||||||
| Natural gas (per mcf) |
$ | 4.02 | $ | 4.39 | $ | 4.02 | ||||||
| Oil (per bbl) |
$ | 95.24 | $ | 79.59 | $ | 60.48 | ||||||
| (a) | Based on average of bid week prompt month prices. |
Overview of 2011 Results
During 2011, we achieved the following financial and operating results:
| • | achieved 36% production growth (excluding our Barnett Shale properties); |
| • | achieved 43% proved reserve growth (excluding our divested Barnett Shale properties); |
| • | drilled 266 net wells with a 99.6% success rate; |
| • | continued expansion of our activities in the Marcellus Shale by growing production, proving up acreage and acquiring additional unproved acreage; |
| • | reduced direct operating expenses per mcfe 13%; |
| • | reduced our DD&A rate 9%; |
36
Table of Contents
| • | maintained a strong balance sheet by issuing $500.0 million of new 10-year senior subordinated notes and achieving a debt to capitalization ratio of 45% at December 31, 2011; |
| • | used a portion of the proceeds from the issuance of $500.0 million of our 5.75% senior subordinated notes due 2021 to redeem all $150.0 million aggregate principal amount of our 6.375% senior subordinated notes due 2015 and $250.0 million aggregate principal amount of our 7.5% senior subordinated notes due 2016; |
| • | entered into additional derivative contracts for 2012, 2013 and 2014; |
| • | received $849.3 million of proceeds from the sale of our Barnett Shale assets and $53.9 million of proceeds from the sale of other assets; |
| • | realized $631.6 million of cash flow from operating activities; and |
| • | ended the year with stockholders’ equity of $2.4 billion. |
Operationally, our 2011 performance reflects another year of successfully executing our strategy of growth through drilling. Our success enabled us to increase proved reserves by approximately 612.0 Bcfe, which is more than three times 2011 production. Excluding the sale of our Barnett Shale properties, proved reserves increased by 1.5 Tcf, which is more than eight times 2011 production. As evidenced by history, the prices of our production is volatile and we have no control over them. Therefore, to improve our profitability, we focus our efforts on improving operating efficiency. As reservoirs are depleted and production rates decline, per unit production costs will generally increase. To lessen this effect, we concentrate our production in core areas where we can achieve economies of scale to help manage our operating costs. Our efforts resulted in lower direct operating expense on a per mcfe basis for 2011 when compared to 2010 and 2009. We also continued to expand and develop our natural gas shale plays with most of our focus on the Marcellus Shale where the operating costs are lower. We exited the year producing approximately 410.0 Mmcfe per day in the Marcellus Shale. We drilled 167 net wells, increasing our Marcellus Shale reserves to over 3.4 Tcfe. We continue to evaluate our Marcellus Shale leases and formulate our development plans for this area.
Total revenues increased 28% in 2011 over the same period of 2010. This increase was due to higher production and higher realized prices partially offset by lower gains on sale of assets. Our 2011 production growth was due to the continued success of our drilling program, particularly in the Marcellus Shale. As discussed in Item 1A of this report, significant changes in natural gas, NGL and oil prices can have a material impact on our results of operations and our balance sheet, including the fair value of our derivatives.
2012 Outlook
For 2012, the Board has approved a $1.6 billion capital budget for natural gas, NGLs and oil related activities, excluding proved property acquisitions, for which we do not budget. We expect to fund our 2012 capital budget expenditures with cash flows from operations and proceeds from asset sales. As has been our historical practice, we will periodically review our capital expenditures throughout the year and adjust the budget based on commodity prices, drilling success and other factors. To the extent our capital requirements exceed our internally generated cash flow, proceeds from asset sales and our committed capacity under our bank credit facility, then debt or equity may be issued to fund these requirements. The price risk on a portion of our forecasted natural gas, NGLs and oil production for 2012 is mitigated using commodity derivative contracts and we intend to continue to enter into these transactions. The prices we receive for our natural gas, NGLs and oil production are largely based on current market prices, which are beyond our control.
Natural Gas, NGLs and Oil Sales, Production and Realized Price Calculations
Our revenues vary from year to year as a result of changes in realized commodity prices and production volumes. We generally sell natural gas, NGLs and oil under two types of agreements, which are common in our industry. Natural gas, NGLs and oil sales include netback arrangements where we sell natural gas and oil at the wellhead and collect a price, net of transportation incurred by the purchaser. We record revenue at the price we receive from the purchaser. Revenues also include arrangements where we sell natural gas or oil at a specific delivery point and receive proceeds from the purchaser with no transportation deduction. Third party transportation costs we incur to get our commodity to the delivery point are reported in transportation, gathering and compression expense. Hedges included in natural gas, NGLs and oil sales reflect settlements on those derivatives that qualify for hedge accounting. Cash settlements of derivative contracts that are not accounted for as hedges are included in derivative fair value income in the accompanying statements of operations. In 2011, natural gas, NGLs and oil sales increased 43% from 2010 with a 36% increase in production and a 5% increase in realized prices. In 2010, natural gas, NGLs and oil sales increased 10% from 2009 due to a 9% decrease in realized prices partially offset by a 21% increase in production. The following table illustrates the primary components of natural gas, NGLs and oil sales for each of the last three years (in thousands):
37
Table of Contents
| 2011 | 2010 | 2009 | ||||||||||
| Natural gas, NGLs and oil sales |
||||||||||||
| Gas wellhead |
$ | 611,864 | $ | 481,564 | $ | 362,128 | ||||||
| Gas hedges realized |
123,595 | 64,749 | 190,934 | |||||||||
|
|
|
|
|
|
|
|||||||
| Total gas revenue |
$ | 735,459 | $ | 546,313 | $ | 553,062 | ||||||
|
|
|
|
|
|
|
|||||||
| Total NGLs revenue |
$ | 268,846 | $ | 143,132 | $ | 48,094 | ||||||
|
|
|
|
|
|
|
|||||||
| Oil wellhead |
$ | 168,961 | $ | 133,822 | $ | 138,597 | ||||||
| Oil hedges realized |
— | 23 | 11,996 | |||||||||
|
|
|
|
|
|
|
|||||||
| Total oil revenue |
$ | 168,961 | $ | 133,845 | $ | 150,593 | ||||||
|
|
|
|
|
|
|
|||||||
| Combined wellhead |
$ | 1,049,671 | $ | 758,518 | $ | 548,819 | ||||||
| Combined hedges |
123,595 | 64,772 | 202,930 | |||||||||
|
|
|
|
|
|
|
|||||||
| Total natural gas, NGLs and oil sales |
$ | 1,173,266 | $ | 823,290 | $ | 751,749 | ||||||
|
|
|
|
|
|
|
|||||||
Our production continues to grow through drilling success as we place new wells on production and through additions from acquisitions partially offset by the natural decline of our natural gas and oil wells and asset sales. For 2011, our production volumes increased 53% in our Appalachian region and declined 1% in our Southwestern region. For 2010, our production volumes increased 43% in our Appalachian region and declined 8% in our Southwestern region. Included in the 2010 increase in our Appalachian region is the effect of the sale of our Ohio tight gas sand properties. Our production for each of the last three years is set forth in the following table:
| 2011 | 2010 | 2009 | ||||||||||
| Production (a) |
||||||||||||
| Natural gas (mcf) |
145,206,124 | 106,147,511 | 90,570,364 | |||||||||
| NGLs (bbls) |
5,352,181 | 3,600,469 | 1,585,332 | |||||||||
| Crude oil (bbls) |
1,959,608 | 1,934,417 | 2,522,784 | |||||||||
| Total (mcfe) (b) |
189,076,858 | 139,356,832 | 115,219,062 | |||||||||
| Average daily production (a) |
||||||||||||
| Natural gas (mcf) |
397,825 | 290,815 | 248,138 | |||||||||
| NGLs (bbls) |
14,664 | 9,864 | 4,343 | |||||||||
| Crude oil (bbls) |
5,369 | 5,300 | 6,912 | |||||||||
| Total (mcfe) (b) |
518,019 | 381,800 | 315,668 | |||||||||
| (a) | Represents volumes sold regardless of when produced. |
| (b) | Oil and NGLs are converted to mcfe at the rate of one barrel equals six mcf based upon the approximate relative energy content of oil and natural gas, which is not necessarily indicative of the relationship of oil and natural gas prices. |
Our average realized price (including all derivative settlements and third-party transportation costs) received during 2011 was $5.68 per mcfe compared to $5.71 per mcfe in 2010 and $7.80 per mcfe in 2009. Because we record transportation costs on two separate bases, as required by GAAP, we believe computed final realized prices should include the impact of transportation, gathering and compression expense. Our average realized price (including all derivative settlements and third-party transportation costs) calculation also includes all cash settlements for derivatives, whether or not they qualify for hedge accounting, except for the year ended December 31, 2010, we have excluded from average realized price calculations a $15.7 million gain related to an early settlement of oil collars. Average sales prices (wellhead) do not include derivative settlements or third party transportation costs which are reported in transportation, gathering and compression expense on the accompanying statements of operations. Average sales prices (wellhead) do include transportation costs where we receive net proceeds. Average realized price calculations for each of the last three years are shown below:
38
Table of Contents
| 2011 | 2010 | 2009 | ||||||||||
| Average Prices |
||||||||||||
| Average sales prices (wellhead): |
||||||||||||
| Natural gas (per mcf) |
$ | 4.21 | $ | 4.54 | $ | 4.00 | ||||||
| NGLs (per bbl) |
50.23 | 39.75 | 30.34 | |||||||||
| Crude oil (per bbl) |
86.22 | 69.18 | 54.94 | |||||||||
| Total (per mcfe) (a) |
5.55 | 5.44 | 4.76 | |||||||||
| Average realized prices (including derivatives that qualify for hedge accounting): |
||||||||||||
| Natural gas (per mcf) |
5.06 | 5.15 | 6.10 | |||||||||
| NGLs (per bbl) |
50.23 | 39.75 | 30.34 | |||||||||
| Crude oil (per bbl) |
86.22 | 69.19 | 59.69 | |||||||||
| Total (per mcfe) (a) |
6.21 | 5.91 | 6.52 | |||||||||
| Average realized prices (including all derivative settlements and third party transportation costs paid by Range): |
||||||||||||
| Natural gas (per mcf) |
4.43 | 4.89 | 7.65 | |||||||||
| NGLs (per bbl) |
50.82 | 39.75 | 30.34 | |||||||||
| Crude oil (per bbl) |
81.34 | 69.19 | 62.57 | |||||||||
| Total (per mcfe) (a) |
5.68 | 5.71 | 7.80 | |||||||||
| (a) | Oil and NGLs are converted at the rate of one barrel equals six mcf based upon the approximate relative energy content of oil to natural gas, which is not indicative of the relationship of oil and natural gas prices. |
Derivative fair value income was $40.1 million in 2011 compared to $51.6 million in 2010 and to $66.4 million in 2009. Some of our derivatives do not qualify for hedge accounting and are accounted for using the mark-to-market accounting method whereby all realized and unrealized gains and losses related to these contracts are included in derivative fair value income in the accompanying consolidated statements of operations. Mark-to-market accounting treatment creates volatility in our revenues as unrealized gains and losses from derivatives are included in total revenues and are not included in accumulated other comprehensive income in the accompanying consolidated balance sheets. As commodity prices increase or decrease, such changes will have an opposite effect on the mark-to-market value of our derivatives. Any gains on our derivatives will be offset by lower wellhead revenues in the future or any losses will be offset by higher future wellhead revenues based on the value at the settlement date. At December 31, 2011, all of our derivative contracts were recorded at their fair value, which was a net asset of $251.3 million, an increase of $133.6 million from the $117.7 million net asset recorded as of December 31, 2010. At times, we have also entered into basis swap agreements to limit volatility caused by changing differentials between index and regional prices received. These basis swaps do not qualify for hedge accounting and are marked to market. Hedge ineffectiveness, also included in derivative fair value income, is associated with contracts that qualify for hedge accounting. The ineffective portion is calculated as the difference between the change in the fair value of the derivative and the estimated change in future cash flows from the item being hedged.
The following table presents information about the components of derivative fair value income for each of the years in the three-year period ended December 31, 2011 (in thousands):
| 2011 | 2010 | 2009 | ||||||||||
| Change in fair value of derivatives that do not qualify for hedge accounting (a) |
$ | 15,762 | $ | (2,086 | ) | $ | (115,909 | ) | ||||
| Realized gain (loss) on settlements – natural gas (b) (c) |
14,743 | 35,988 | 171,998 | |||||||||
| Realized gain (loss) on settlements – oil (b) (c) |
(9,574 | ) | — | 7,304 | ||||||||
| Realized gain (loss) on settlement – NGLs (b) (c) |
9,612 | — | — | |||||||||
| Realized gain on early settlement of oil derivatives (d) |
— | 15,697 | — | |||||||||
| Hedge ineffectiveness – realized (c) |
7,361 | (352 | ) | 4,749 | ||||||||
| – unrealized (a) |
2,183 | 2,387 | (1,696 | ) | ||||||||
|
|
|
|
|
|
|
|||||||
| Derivative fair value income |
$ | 40,087 | $ | 51,634 | $ | 66,446 | ||||||
|
|
|
|
|
|
|
|||||||
| (a) | These amounts are unrealized and are not included in average realized price calculations. |
| (b) | These amounts represent realized gains and losses on settled derivatives that do not qualify for hedge accounting. |
| (c) | These settlements are included in average realized price calculations (including all derivative settlements and third party transportation costs paid by Range). |
| (d) | This early settlement is not included in average realized price calculations. |
39
Table of Contents
Gain on the sale of assets was $2.3 million in 2011 compared to $76.6 million in 2010 and $10.4 million in 2009. During 2011, we exchanged unproved property in Ohio for unproved property in Pennsylvania and recorded a gain of $4.5 million which is offset by a $1.7 million loss on sale of certain derivatives assumed by the buyer of our Barnett Shale properties. During 2010, we sold our tight gas sand properties in Ohio for proceeds of approximately $323.0 million and recorded a gain of $77.6 million. The 2009 period includes a $10.4 million gain on the sale of Marcellus acreage.
Other revenue in 2011 was a gain of $3.0 million compared to a gain of $70,000 in 2010 and a loss of $9.4 million in 2009. The 2011 period includes a loss from equity method investments of $1.0 million offset by transportation and gathering revenue of $706,000 and proceeds from a lawsuit settlement and other income. The 2010 period includes a loss from equity method investments of $1.5 million partially offset by proceeds of $486,000 from a lawsuit settlement and $1.0 million of transportation and gathering revenue. The 2009 period includes a loss from equity method investments of $13.7 million partially offset by proceeds of $3.8 million from a lawsuit settlement and $486,000 of transportation and gathering revenue.
We believe some of our expense fluctuations are best analyzed on a unit-of-production, or per mcfe, basis. The following presents information about certain of our expenses on a per mcfe basis for 2011, 2010 and 2009.
| Year Ended December 31, | Year Ended December 31, | |||||||||||||||||||||||||||||||
| 2011 | 2010 | Change | % Change |
2010 | 2009 | Change | % Change |
|||||||||||||||||||||||||
| Direct operating expense |
$ | 0.60 | $ | 0.69 | $ | (0.09 | ) | (13 | %) | $ | 0.69 | $ | 0.85 | $ | (0.16 | ) | (19 | %) | ||||||||||||||
| Production and ad valorem tax expense |
0.15 | 0.19 | (0.04 | ) | (21 | %) | 0.19 | 0.22 | (0.03 | ) | (14 | %) | ||||||||||||||||||||
| General and administrative expense |
0.80 | 1.01 | (0.21 | ) | (21 | %) | 1.01 | 1.00 | 0.01 | 1 | % | |||||||||||||||||||||
| Interest expense |
0.66 | 0.65 | 0.01 | 2 | % | 0.65 | 0.65 | — | — | |||||||||||||||||||||||
| Depletion, depreciation and amortization expense |
1.80 | 1.98 | (0.18 | ) | (9 | %) | 1.98 | 2.32 | (0.34 | ) | (15 | %) | ||||||||||||||||||||
Direct operating expense was $113.0 million in 2011 compared to $96.3 million in 2010 and $98.3 million in 2009. We experience increases in operating expenses as we add new wells and maintain production from existing properties. In 2010 and 2009, this effect was more than offset by asset sales, lower overall industry costs and lower workover expenses. On an absolute basis, our spending for direct operating expenses for 2011 increased 17% due to an increase in the number of producing wells. On an absolute dollar basis, our spending for direct operating expenses for 2010 was lower when compared to 2009 despite higher production levels, reflecting our asset sales and lower overall industry costs. The sale of our Ohio properties in 2010 and the sale of our New York and West Texas properties in 2009 make comparisons of 2010 to 2009 difficult. On a pro forma basis, excluding our Ohio, New York and West Texas sold properties, 2009 direct operating expenses from continuing operations would have been $75.7 million and 2010 direct operating expense would have been $93.6 million. We incurred $3.6 million of workover costs in 2011 compared to $3.4 million of workover costs in 2010 and $5.0 million in 2009.
On a per mcfe basis, operating expense for 2011 decreased $0.09 or 13% from the same period of 2010, with the decrease consisting of lower well service costs. On a per mcfe basis, direct operating expense for 2010 decreased $0.16 or 19% from the same period of 2009, with the decrease consisting of primarily lower workover costs ($0.02 per mcfe), lower overall well service costs and asset sales. On a pro forma basis, excluding the sale of our Ohio properties in 2010 and the sale of our New York and West Texas properties in 2009, 2009 direct operating expense would have been $0.74 per mcfe and 2010 direct operating expense would have been $0.68 per mcfe. We expect to continue to experience lower costs per mcfe as we increase production from our Marcellus Shale wells due to their lower operations cost relative to our other operating areas. Stock-based compensation expense represents the amortization of SARs as part of the compensation of field employees. The following table summarizes direct operating expenses per mcfe for 2011, 2010 and 2009:
| Year Ended December 31, | Year Ended December 31, | |||||||||||||||||||||||||||||||
| 2011 | 2010 | Change | % Change |
2010 | 2009 | Change | % Change |
|||||||||||||||||||||||||
| Lease operating expense |
$ | 0.57 | $ | 0.66 | $ | (0.09 | ) | (14 | %) | $ | 0.66 | $ | 0.79 | $ | (0.13 | ) | (16 | %) | ||||||||||||||
| Workovers |
0.02 | 0.02 | — | — | % | 0.02 | 0.04 | (0.02 | ) | (50 | %) | |||||||||||||||||||||
| Stock-based compensation (non-cash) |
0.01 | 0.01 | — | — | % | 0.01 | 0.02 | (0.01 | ) | (50 | %) | |||||||||||||||||||||
|
|
|
|
|
|
|
|
|
|
|
|
|
|||||||||||||||||||||
| Total direct operating expenses |
$ | 0.60 | $ | 0.69 | $ | (0.09 | ) | (13 | %) | $ | 0.69 | $ | 0.85 | $ | (0.16 | ) | (19 | %) | ||||||||||||||
|
|
|
|
|
|
|
|
|
|
|
|
|
|||||||||||||||||||||
40
Table of Contents
Production and ad valorem taxes are paid based on market prices, not hedged prices. These costs were $27.7 million in 2011 compared to $26.1 million in 2010 and $25.5 million in 2009. On a per mcfe basis, production and ad valorem taxes decreased to $0.15 in 2011 compared to $0.19 in 2010 due to an increase in production volumes not subject to production or ad valorem taxes. On a per mcfe basis, production and ad valorem taxes decreased to $0.19 in 2010 from $0.22 in 2009 due to an increase in production volumes not subject to production or ad valorem taxes. We estimate our 2012 production and ad valorem taxes per mcfe may increase $0.19 per mcfe, due to the passage in February 2012 of an “impact fee” in Pennsylvania on Marcellus Shale production.
General and administrative expense was $151.2 million for 2011 compared to $140.6 million for 2010 and $115.3 million in 2009. The 2011 increase of $10.6 million when compared to 2010 is due to higher salaries and benefits ($9.3 million), an increase in stock-based compensation ($2.1 million), an increase in legal fees ($1.4 million) somewhat offset by lower bad debt expense. Our number of employees increased 9% during 2011. The 2010 increase of $25.3 million when compared to 2009 is due to higher salaries and benefits ($4.6 million), an increase in legal fees and legal settlements ($4.2 million), an increase in community relations costs ($6.5 million), higher bad debt expense ($2.3 million), higher office expenses, including information technology ($1.8 million), and higher industry trade association dues and inventory adjustments. While our number of employees declined 9% during 2010 due to our asset sales, we continue to incur higher wages which we consider necessary to remain competitive in the industry. Our personnel costs continue to increase as we invest in our technical teams and other staffing to support our expansion into the Marcellus Shale in Appalachia. Stock-based compensation expense represents the amortization of restricted stock grants and SARs granted to our employees and directors as part of compensation. The following table summarizes general and administrative expenses per mcfe for 2011, 2010 and 2009:
| Year Ended December 31, | Year Ended December 31, | |||||||||||||||||||||||||||||||
| 2011 | 2010 | Change | % Change |
2010 | 2009 | Change | % Change |
|||||||||||||||||||||||||
| General and administrative |
$ | 0.61 | $ | 0.76 | $ | (0.15 | ) | (20 | %) | $ | 0.76 | $ | 0.71 | $ | 0.05 | 7 | % | |||||||||||||||
| Stock-based compensation (non-cash) |
0.19 | 0.25 | (0.06 | ) | (24 | %) | 0.25 | 0.29 | (0.04 | ) | (14 | %) | ||||||||||||||||||||
|
|
|
|
|
|
|
|
|
|
|
|
|
|||||||||||||||||||||
| Total general and administrative expenses |
$ | 0.80 | $ | 1.01 | $ | (0.21 | ) | (21 | %) | $ | 1.01 | $ | 1.00 | $ | 0.01 | 1 | % | |||||||||||||||
|
|
|
|
|
|
|
|
|
|
|
|
|
|||||||||||||||||||||
Interest expense was $125.1 million for 2011 compared to $90.7 million for 2010 and $75.3 million in 2009. The following table presents information about interest expense for each of the years in the three-year period ended December 31, 2011 (in thousands):
| 2011 | 2010 | 2009 | ||||||||||
| Bank credit facility |
$ | 8,856 | $ | 11,420 | $ | 16,885 | ||||||
| Subordinated notes |
123,721 | 111,892 | 95,076 | |||||||||
| Other |
7,266 | 7,880 | 5,406 | |||||||||
| Allocated to discontinued operations |
(14,791 | ) | (40,527 | ) | (42,106 | ) | ||||||
|
|
|
|
|
|
|
|||||||
| Total interest expense |
$ | 125,052 | $ | 90,665 | $ | 75,261 | ||||||
|
|
|
|
|
|
|
|||||||
The increase in interest expense for 2011 from the same period of 2010 was due to an increase in outstanding debt balances. In May 2011, we issued $500.0 million of 5.75% senior subordinated notes due 2012. We used the proceeds for general corporate purposes and to purchase or redeem $150.0 million of our 6.375% senior subordinated notes due 2015 and $250.0 million of our 7.5% senior subordinated notes due 2016. Interest expense for 2010 increased $15.4 million from the same period of 2009 due to the refinancing of certain debt from floating rates to higher fixed rates. In August 2010, we issued $500.0 million of 6.75% senior subordinated notes due 2020. The proceeds from this issuance were used to retire bank debt which carried a lower interest rate and to redeem all $200.0 million of our 7.375% senior subordinated notes due 2013. The 2011, 2010 and 2009 note issuances were undertaken to better match the maturities of our debt with the life of our properties and to give us greater liquidity for the near term. Average debt outstanding on the bank credit facility for 2011 was $175.6 million compared to $351.1 million for 2010 and $584.5 million for 2009 and the weighted average interest rate on the bank credit facility was 2.2% in 2011 compared to 2.2% in 2010 and 2.4% in 2009.
Depletion, depreciation and amortization (“DD&A”) was $341.2 million in 2011 compared to $275.2 million in 2010 and $267.1 million in 2009. The increase in 2011 when compared to 2010 is due to a 7% decrease in depletion rates more than offset by a 36% increase in production. The increase in 2010 when compared to 2009 is due to a 9% decrease in depletion rates and lower depreciation expense partially offset by a 21% increase in production. 2009 included accelerated depreciation expense of $10.3 million on an interim processing plant in Appalachia that was dismantled in first quarter 2010 and replaced with permanent facilities.
41
Table of Contents
On a per mcfe basis, DD&A decreased to $1.80 in 2011 compared to $1.98 in 2010 and $2.32 in 2009. Depletion expense, the largest component of DD&A, was $1.69 per mcfe in 2011 compared to $1.82 per mcfe in 2010 and $1.99 per mcfe in 2009. We have historically adjusted our depletion rates in the fourth quarter of each year based on the year-end reserve report and other times during the year when circumstances indicate there has been a significant change in reserves or costs. We currently expect our DD&A rate to be between $1.65 and $1.68 in 2012, based on our current production estimates. In areas where we are actively drilling, such as the Marcellus area, fourth quarter 2011 depletion rates were lower than 2010 and 2009 depletion rates. Depletion rates in new plays tend to be higher in the beginning as increased initial outlays are amortized over proved reserves based on early stages of evaluations. The decrease in the DD&A per mcfe in 2011 when compared to 2010 is due to lower depreciation expense and the mix of our production. The decrease in the DD&A per mcfe in 2010 when compared to 2009 is related to lower depreciation expense and the mix of our production. The following table summarizes DD&A expense per mcfe for 2011, 2010 and 2009:
| Year Ended December 31, | Year Ended December 31, | |||||||||||||||||||||||||||||||
| 2011 | 2010 | Change | % Change |
2010 | 2009 | Change | % Change |
|||||||||||||||||||||||||
| Depletion and amortization |
$ | 1.69 | $ | 1.82 | $ | (0.13 | ) | (7 | %) | $ | 1.82 | $ | 1.99 | $ | (0.17 | ) | (9 | %) | ||||||||||||||
| Depreciation |
0.08 | 0.12 | (0.04 | ) | (33 | %) | 0.12 | 0.28 | (0.16 | ) | (57 | %) | ||||||||||||||||||||
| Accretion and other |
0.03 | 0.04 | (0.01 | ) | (25 | %) | 0.04 | 0.05 | (0.01 | ) | (20 | %) | ||||||||||||||||||||
|
|
|
|
|
|
|
|
|
|
|
|
|
|||||||||||||||||||||
| Total DD&A expense |
$ | 1.80 | $ | 1.98 | $ | (0.18 | ) | (9 | %) | $ | 1.98 | $ | 2.32 | $ | (0.34 | ) | (15 | %) | ||||||||||||||
|
|
|
|
|
|
|
|
|
|
|
|
|
|||||||||||||||||||||
Other Operating Expenses
Our total operating expenses also include other expenses that generally do not trend with production. These expenses include stock-based compensation, transportation, gathering and compression, exploration expense, abandonment and impairment of unproved properties and deferred compensation plan expenses. In 2011, stock-based compensation was a component of direct operating expense ($2.0 million), exploration expense ($4.1 million), general and administrative expense ($36.2 million) for a total of $43.8 million. In 2010, stock-based compensation was a component of direct operating expense ($2.0 million), exploration expense ($4.2 million), general and administrative expense ($34.2 million) and termination costs ($2.8 million) for a total of $44.4 million. In 2009, stock-based compensation was a component of direct operating expense ($2.5 million), exploration expense ($4.7 million) and general and administrative expense ($33.3 million) and termination costs of $332,000 for a total of $41.6 million. Stock-based compensation includes the amortization of restricted stock grants and SARs grants.
Transportation, gathering and compression expense was $120.8 million in 2011 compared to $62.8 million in 2010 and $37.2 million in 2009. These third party costs are higher in each year due to our production growth in the Marcellus Shale where we have third party gathering and compression agreements. Previously, these costs were reflected as a component of natural gas, NGLs and oil sales. See Note 2 to the accompanying financial statements for information regarding this revision. We have included these costs in the calculation of average realized prices (including all derivative settlements and third party transportation expenses paid by Range).
Exploration expense was $81.4 million in 2011 compared to $60.5 million in 2010 and $44.3 million in 2009. Exploration expense was significantly higher in 2011 when compared to 2010 due to higher seismic and personnel costs. Exploration expense was significantly higher in 2010 when compared to 2009 due to higher delay rental costs, or the costs we incur to defer the commencement of drilling, primarily in our Marcellus Shale operations. The following table details our exploration related expenses for 2011, 2010 and 2009 (in thousands):
| Year Ended December 31, | Year Ended December 31, | |||||||||||||||||||||||||||||||
| 2011 | 2010 | Change | % Change |
2010 | 2009 | Change | % Change |
|||||||||||||||||||||||||
| Seismic |
$ | 40,672 | $ | 22,393 | $ | 18,279 | 82 | % | $ | 22,393 | $ | 19,834 | $ | 2,559 | 13 | % | ||||||||||||||||
| Delay rentals and other |
19,282 | 19,075 | 207 | 1 | % | 19,075 | 6,836 | 12,239 | 179 | % | ||||||||||||||||||||||
| Personnel expense |
13,417 | 11,129 | 2,288 | 21 | % | 11,129 | 10,743 | 386 | 4 | % | ||||||||||||||||||||||
| Stock-based compensation expense |
4,108 | 4,209 | (101 | ) | (2 | %) | 4,209 | 4,703 | (494 | ) | (11 | %) | ||||||||||||||||||||
| Dry hole expense |
3,888 | 3,700 | 188 | 5 | % | 3,700 | 2,160 | 1,540 | 71 | % | ||||||||||||||||||||||
|
|
|
|
|
|
|
|
|
|
|
|
|
|||||||||||||||||||||
| Total exploration expense |
$ | 81,367 | $ | 60,506 | $ | 20,861 | 34 | % | $ | 60,506 | $ | 44,276 | $ | 16,230 | 37 | % | ||||||||||||||||
|
|
|
|
|
|
|
|
|
|
|
|
|
|||||||||||||||||||||
Abandonment and impairment of unproved properties was $79.7 million in 2011 compared to $49.7 million in 2010 and $36.9 million in 2009. We assess individually significant unproved properties for impairment on a quarterly basis and recognize a loss where circumstances indicate impairment in value. In determining whether a significant unproved property is impaired we consider numerous factors including, but not limited to, current exploration plans, favorable or unfavorable activity on the property being evaluated and/or adjacent properties, our geologists’ evaluation of the property and the remaining
42
Table of Contents
months in the lease term for the property. Impairment of individually insignificant unproved properties is assessed and amortized on an aggregate basis based on our average holding period, expected forfeiture rate and anticipated drilling success. As we continue to review our acreage positions and high grade our drilling inventory based on the current price environment, additional leasehold impairments and abandonments will likely be recorded. The increase from 2009 to 2010 and 2011 is primarily related to our Marcellus Shale operations and is due, in part, to lower natural gas prices and plans to move towards areas with higher expectation of wet gas.
Termination costs in 2010 includes severance costs of $5.1 million related to the sale of our Ohio properties and $2.8 million of non-cash stock-based compensation expense related to the accelerated vesting of SARs and restricted stock as part of the severance agreement for our Ohio personnel. Termination costs in 2009 represent severance costs related to the closing of our Houston office ($1.6 million), $332,000 of non-cash stock-based compensation expense related to the accelerated vesting of SARs and restricted stock as part of the severance agreement for our Houston personnel and $635,000 of severance costs related to the sale of our New York properties.
Deferred compensation plan expense was a loss of $43.2 million in 2011 compared to a gain of $10.2 million in 2010 and a loss of $31.1 million in 2009. Our stock price increased to $61.94 at December 31, 2011 compared to $44.98 at December 31, 2010. Our stock price decreased to $44.98 at December 31, 2010 compared to $49.85 at December 31, 2009. The stock price increased to $49.85 at December 31, 2009 compared to $34.39 at December 31, 2008. This non-cash item relates to the increase or decrease in value of the liability associated with our common stock that is vested and held in our deferred compensation plan. The deferred compensation liability is adjusted to fair value by a charge or a credit to deferred compensation plan expense.
Loss on early extinguishment of debt for 2011 was $18.6 million compared to $5.4 million in 2010. In May and June 2011, we purchased or redeemed our 6.375% senior subordinated notes due 2015 at a price equal to 102.31% and we purchased or redeemed our 7.5% senior subordinated notes due 2016 at a price equal to 103.95%. We recorded a loss on extinguishment of debt of $18.6 million which includes a call premium and other consideration of $13.3 million and expensing of related deferred financing costs on the repurchased debt. In August 2010, we redeemed our 7.375% senior subordinated notes due 2013 at a redemption price equal to 101.229%. We recorded a loss on extinguishment of debt of $5.4 million which includes call premium costs of $2.5 million and expensing of related deferred financing costs on the repurchased debt.
Impairment of proved properties increased to $38.7 million in 2011 compared to $6.5 million in 2010 and $930,000 in 2009. The year ended 2011 includes a $31.2 million impairment related to our East Texas properties and $7.5 million related to our Gulf Coast onshore properties. Our analysis of these properties reflected undiscounted cash flows were less than their carrying value. We compared the carrying value to their estimated fair value and recognized an impairment charge. These assets were evaluated for impairment due to declining reserves and natural gas prices and, in the case of certain of our East Texas properties, the possibility of a sale. The year ended 2010 includes a $6.5 million impairment related to our onshore Gulf Coast properties. In 2009, we recognized $930,000 impairment related to our Michigan properties. In 2010 and 2009, these assets were reviewed for impairment due to declining reserves and natural gas prices.
Income tax expense was $35.6 million compared to $50.9 million in 2010 and $45.8 million in 2009. The 2011 decrease in income taxes reflects a 44% decrease in income from continuing operations when compared to the same period of 2010. The 2010 increase in income taxes reflects a 65% increase in income from continuing operations before income taxes when compared to the same period of 2009. The effective tax rate was 45.4% in 2011 compared to 36.5% in 2010 and 54.0% in 2009. For the year ended December 31, 2011, the current income tax expense of $637,000 is related to state income taxes. The 2011 effective tax rate was different than the statutory tax rate due to state income taxes and an increase in our valuation allowances related to our deferred tax asset for future deferred compensation plan distributions of senior executives to the extent their estimated future compensation (including these distributions) would exceed the $1.0 million deductible limit provided under section 162 (m) of the Internal Revenue Code. The year ended December 31, 2011 also includes a favorable adjustment of $3.9 million to reflect updated state tax rates used to establish deferred taxes due to a change in our state apportionment factors. The 2010 effective tax rate was different than the statutory rate of 35% due to an increase in our valuation allowances related to our deferred tax asset for future deferred compensation plan distributions in excess of the $1.0 million deductible limit provided under section 162(m) of the Internal Revenue Code. For the year ended December 31, 2010, the current income tax benefit of $836,000 is related to state income taxes. For the year ended December 31, 2009, the current income tax benefit of $636,000 includes state income taxes of $364,000 and a federal income tax benefit of $1.0 million. For the year ended December 31, 2009, the effective tax rate was different than the statutory rate of 35% due to an unfavorable $16.3 million charge to reflect updated state apportionment factors in certain higher-rate states, offset by a benefit related to a partial release of valuation allowance on our capital loss carryforward. We expect our effective tax rate to be approximately 40% for 2012.
Discontinued operations include the operating results and impairment losses related to our Barnett properties. Substantially all of these properties were sold in April 2011 for proceeds of $889.3 million including certain derivatives assumed by the buyer and we recorded a gain of $4.8 million on the sale. Discontinued operations in 2011 was income of $15.3 million compared to a loss of $328.0 million in 2010 and a loss of $92.9 million in 2009. The year ended 2010
43
Table of Contents
includes an impairment charge of $463.2 million. While these properties did not meet held for sale criteria as of December 31, 2010, our analysis reflected undiscounted cash flows for these properties were less than their carrying value. Therefore, we compared the carrying value of these properties to their estimated fair value and recognized an impairment charge. See also Note 4 to the accompanying financial statements. Interest expense is allocated to discontinued operations based on the ratio of net assets of discontinued operations to our consolidated net assets plus long-term debt.
Management’s Discussion and Analysis of Financial Condition, Capital Resources and Liquidity
Our main sources of liquidity and capital resources are internally generated cash flow from operations, a bank credit facility with uncommitted and committed availability, asset sales and access to the debt and equity capital markets. We continue to take steps to ensure adequate capital resources and liquidity to fund our capital expenditure program. During 2011, we sold our Barnett Shale properties for proceeds of approximately $889.3 million. We used these proceeds to repay amounts under our bank credit facility and increase cash. In 2011, we entered into additional commodity derivative contracts for 2012, 2013 and 2014 to protect future cash flows.
During 2011, our net cash provided from continuing operations of $610.2 million and proceeds from the sale of assets of $903.3 million (including proceeds from the sale of our Barnett Shale properties) were used to fund $1.4 billion of capital expenditures (including acquisitions). At December 31, 2011, we had $92,000 in cash and total assets of $5.8 billion. As of December 31, 2011 and 2010, our total debt and capitalization were as follows (in thousands):
| 2011 | 2010 | |||||||
| Bank debt |
$ | 187,000 | $ | 274,000 | ||||
| Senior subordinated notes |
1,787,967 | 1,686,536 | ||||||
|
|
|
|
|
|||||
| Total debt |
1,974,967 | 1,960,536 | ||||||
| Stockholders’ equity |
2,392,420 | 2,223,761 | ||||||
|
|
|
|
|
|||||
| Total capitalization |
$ | 4,367,387 | $ | 4,184,297 | ||||
|
|
|
|
|
|||||
| Debt to capitalization ratio |
45.2 | % | 46.9 | % | ||||
Long-term debt at December 31, 2011 totaled $2.0 billion, including $187.0 million of bank credit facility debt and $1.8 billion of senior subordinated notes. Our available committed borrowing capacity at December 31, 2011 was $1.3 billion. Cash is required to fund capital expenditures necessary to offset inherent declines in production and reserves that are typical in the oil and natural gas industry. Future success in growing reserves and production will be highly dependent on capital resources available and the success of finding or acquiring additional reserves. We currently believe that net cash generated from operating activities, unused committed borrowing capacity under the bank credit facility and proceeds from asset sales combined with our natural gas, NGLs and oil derivatives currently in place will be adequate to satisfy near-term financial obligations and liquidity needs. To the extent our capital requirements exceed our internally generated cash flow and proceeds from asset sales, debt or equity may be issued to fund these requirements. Long-term cash flows are subject to a number of variables including the level of production and prices as well as various economic conditions that have historically affected the oil and natural gas business. A material drop in natural gas, NGLs and oil prices or a reduction in production and reserves would reduce our ability to fund capital expenditures, reduce debt, meet financial obligations and remain profitable. We operate in an environment with numerous financial and operating risks, including, but not limited to, the inherent risks of the search for, development and production of natural gas, NGLs and oil, the ability to buy properties and sell production at prices which provide an attractive return and the highly competitive nature of the industry. Our ability to expand our reserve base is, in part, dependent on obtaining sufficient capital through internal cash flow, bank borrowings, asset sales or the issuance of debt or equity securities. There can be no assurance that internal cash flow and other capital sources will provide sufficient funds to maintain capital expenditures that we believe are necessary to offset inherent declines in production and proven reserves.
Our opinions concerning liquidity and our ability to avail ourselves in the future of the financing options mentioned in the above forward-looking statements are based on currently available information. If this information proves to be inaccurate, future availability of financing may be adversely affected. Factors that affect the availability of financing include our performance, the state of the worldwide debt and equity markets, investor perceptions and expectations of past and future performance, the global financial climate and, in particular, with respect to borrowings, the level of our working capital or outstanding debt and credit ratings by rating agencies. For additional information, see “Risk Factors-Difficult Conditions in the global capital markets, the credit markets and the economy generally may materially adversely affect our business and results of operations” in Item 1A of this report.
44
Table of Contents
Credit Arrangements
As of December 31, 2011, we maintained a $2.0 billion revolving credit facility, which we refer to as our bank credit facility. The bank credit facility was secured by substantially all of our assets and has a maturity date of February 18, 2016. Availability under the bank credit facility was subject to a borrowing base set by the lenders semi-annually with an option to set more often in certain circumstances. The borrowing base was dependent on a number of factors but primarily the lenders’ assessment of future cash flows. Redeterminations of the borrowing base required approval of two thirds of the lenders; increases required 97% approval.
Our bank debt and our subordinated notes impose limitations on the payment of dividends and other restricted payments (as defined under the debt agreements for our bank debt and our subordinated notes). The debt agreements also contain customary covenants relating to debt incurrence, working capital, dividends and financial ratios. We were in compliance with all covenants at December 31, 2011.
Capital Requirements
Our primary needs for cash are for exploration, development and acquisition of natural gas and oil properties, repayment of principal and interest on outstanding debt and payment of dividends. During 2011, $1.2 billion of capital was expended on drilling projects. Also in 2011, $226.5 million was expended on acquisitions of unproved acreage, primarily in the Marcellus Shale. Our 2011 capital program, excluding acquisitions, was funded by net cash flow from operations, proceeds from asset sales and borrowings under our credit facility. Our capital expenditure budget for 2012 is currently set at $1.6 billion, excluding acquisitions. To the extent capital requirements exceed internally generated cash flow, proceeds from asset sales and our committed capacity under our bank credit facility, then debt or equity may be issued to fund these requirements. We monitor our capital expenditures on an ongoing basis, adjusting the amount up or down and also between our operating regions, depending on commodity prices, cash flow and projected returns. Also, our obligations may change due to acquisitions, divestitures and continued growth. We may issue additional shares of stock, subordinated notes or other debt securities to fund capital expenditures, acquisitions, extend maturities or to repay debt.
The forward-looking statements about our capital budget are based on current expectations, estimates and projections and are not guarantees of future performance. Actual results may differ materially from these expectations, estimates and projections and are subject to certain risks, uncertainties and other factors, some of which are beyond our control and are difficult to predict. Some factors that could cause actual results to differ materially include prices of and demand for natural gas and oil, actions of competitors, disruptions or interruptions of our production and unforeseen hazards such as weather conditions, acts of war or terrorists acts and the government or military response, and other operating and economic considerations.
Proved Reserves
To maintain and grow production and cash flow, we must continue to develop existing proved reserves and locate or acquire new natural gas, NGLs and oil reserves being produced. The following is a discussion of proved reserves, reserve additions and revisions and future net cash flows from proved reserves.
| Year End December 31, | ||||||||||||
| 2011 | 2010 | 2009 | ||||||||||
| (Mmcfe) | ||||||||||||
| Proved Reserves: |
||||||||||||
| Beginning of year |
4,442,290 | 3,128,739 | 2,653,565 | |||||||||
| Reserve additions |
1,493,357 | 1,410,359 | 769,939 | |||||||||
| Reserve revisions |
224,542 | 148,558 | 3,890 | |||||||||
| Purchases |
— | 124,981 | — | |||||||||
| Sales |
(903,983 | ) | (189,558 | ) | (139,543 | ) | ||||||
| Production |
(202,245 | ) | (180,789 | ) | (159,112 | ) | ||||||
|
|
|
|
|
|
|
|||||||
| End of year (a) |
5,053,961 | 4,442,290 | 3,128,739 | |||||||||
|
|
|
|
|
|
|
|||||||
| Proved Developed Reserves: |
||||||||||||
| Beginning of year |
2,183,488 | 1,726,696 | 1,632,032 | |||||||||
| End of year |
2,401,274 | 2,183,488 | 1,726,696 | |||||||||
| (a) | 2010 includes 906,371 Mmcfe related to our Barnett Shale properties. |
45
Table of Contents
Our proved reserves at year-end 2011 were 5.1 Tcf compared to 4.4 Tcf at year-end 2010 and 3.1 Tcf at year-end 2009. Natural gas comprised approximately 79%, 80% and 84% of our proved reserves at year-end 2011, 2010 and 2009.
Reserve Additions and Revisions. During 2011, we added approximately 1.5 Tcfe of proved reserves from drilling activities and evaluations of proved areas, primarily in the Marcellus Shale. Approximately 87% of the 2011 reserve additions were attributable to natural gas. Revisions of previous estimates of 225 Bcfe for the year ended December 31, 2011 were primarily positive performance revisions for natural gas properties, primarily in the Marcellus Shale.
During 2010, we added approximately 1.4 Tcfe of proved reserves from drilling activities and evaluations of proved areas primarily in the Marcellus Shale and the Barnett Shale. Approximately 77% of reserve additions were attributable to natural gas reserves. Revisions of previous estimates of 148.6 Bcfe for the year ended December 31, 2010 included a positive revision of 40.5 Bcfe due to an increase in the average natural gas price used for the December 31, 2010 reserve estimation as compared to the price used in the previous year estimate. Revisions of previous estimates in 2010 also include positive performance revisions for natural gas properties primarily in the Barnett Shale.
During 2009, we added approximately 769.9 Bcfe of proved reserves from drilling activities and evaluations of proved areas primarily in the Barnett Shale and the Marcellus Shale. Approximately 81% of 2009 reserve additions were attributable to natural gas reserves. Positive performance revisions of 89.9 Bcfe, primarily in the Marcellus Shale, were mostly offset by a negative price revision of 86.0 Bcfe due to a decrease in the natural gas price used for the December 31, 2009 reserve estimation as compared to the price used in the previous year estimate, resulting in a net positive revision of previous estimates of 3.9 Bcfe.
Sales. In 2011, we sold approximately 904.0 Bcfe of reserves primarily related to the sale of our Barnett properties. In 2010, we sold approximately 189.6 Bcfe reserves primarily related to our Ohio properties and in 2009 we sold 139.5 Bcfe of reserves related to our New York and West Texas properties.
Future Net Cash Flows. At December 31, 2011, the present value (discounted at 10%) of estimated future net cash flows from our proved reserves was $6.1 billion. This present value was calculated based on the unweighted average first-day-of-the-month oil and gas prices for the prior twelve months held flat for the life of the reserves. The present value of our estimated future net cash flows at December 31, 2010 was $4.6 billion. At December 31, 2011, the after tax present value of estimated future net cash flows from our proved reserves was $4.5 billion compared to $3.5 billion at December 31, 2010.
The present value of future net cash flows does not purport to be an estimate of the fair market value of our proved reserves. An estimate of fair value would also take into account, among other things, anticipated changes in future prices and costs, the expected recovery of reserves in excess of proved reserves and a discount factor more representative of the time value of money to the evaluating party and the perceived risks inherent in producing oil and gas.
Cash Flow
Cash flows from operations are primarily affected by production volumes and commodity prices, net of the effects of settlements of our derivatives. Our cash flows from operations also are impacted by changes in working capital. We generally maintain low cash and cash equivalent balances because we use available funds to reduce our bank debt. Short-term liquidity needs are satisfied by borrowings under our bank credit facility. Because of this, and since our principal source of operating cash flows (proved reserves to be produced in the following year) cannot be reported as working capital, we often have low or negative working capital. We sell a large portion of our production at the wellhead under floating market contracts. From time to time, we enter into various derivative contracts to provide an economic hedge of our exposure to commodity price risk associated with anticipated future natural gas, NGLs and oil production. The production we hedge has and will continue to vary from year to year depending on, among other things, our expectation of future commodity prices. Any payments due to counterparties under our derivative contracts should ultimately be funded by prices received from the sale of our production. Production receipts, however, often lag payments to the counterparties. Any interim cash needs are funded by borrowings under the bank credit facility. As of December 31, 2011, we have entered into hedging agreements covering 193.8 Bcfe for 2012, 113.9 Bcfe for 2013 and 41.6 Bcfe for 2014.
Net cash provided from continuing operations in 2011 was $610.2 million compared to $433.9 million in 2010 and $554.2 million in 2009. Cash provided from continuing operations is largely dependent upon commodity prices and production, net of the effects of settlement of our derivative contracts. The increase in cash provided from operating activities from 2010 to 2011 reflects a 36% increase in production somewhat offset by lower realized prices (a decline of 1%) and higher operating costs. The decrease in cash provided from operating activities from 2009 to 2010 reflects lower price realized prices (a decline of 27%) somewhat offset by a 21% increase in production. As of December 31, 2011, we have hedged approximately 69% of our projected 2012 production. Net cash provided from continuing operations is also affected by working capital changes or the timing of cash receipts and disbursements. Changes in working capital (as reflected in our consolidated statements of cash flows) for 2011 was a negative $41.0 million compared to a negative $6.1 million for 2010 and negative $35.8 million in 2009. The increase in negative working capital is primarily due to increasing revenues.
46
Table of Contents
Net cash provided from discontinued operations for 2011 was $21.4 million compared to $79.4 million in 2010 and $37.5 million in 2009. Substantially all of our Barnett Shale properties were sold in April 2011 with a February 1, 2011 effective date. The increase in cash provided from discontinued operations for our Barnett Shale properties from 2009 to 2010 reflects a 26% increase in realized prices somewhat offset by a 6% decline in production.
Net cash used in investing activities from continuing operations in 2011 was $1.4 billion compared to $714.7 million in 2010 and $289.0 million in 2009.
During 2011, we:
| • | spent $1.2 billion on natural gas and oil property additions; |
| • | spent $226.5 million on acreage primarily in the Marcellus Shale; and |
| • | received proceeds of $53.9 million primarily related to the sale of a low pressure pipeline and various proved and unproved properties. |
During 2010, we:
| • | spent $732.9 million on natural gas and oil property additions; |
| • | spent $296.5 million on acquisitions, including purchasing unproved and proved properties in Virginia for $134.5 million and Marcellus Shale leaseholds; and |
| • | received proceeds of $327.8 million primarily from the sale of our Ohio natural gas and oil properties. |
During 2009, we:
| • | spent $356.3 million on natural gas and oil property additions; |
| • | spent $139.3 million on acreage primarily in the Marcellus Shale; |
| • | received proceeds of $234.1 million primarily from the sale of West Texas and New York natural gas and oil properties; and |
| • | contributed $6.4 million of capital to Nora Gathering, LLC, an equity method investment. |
Net cash used in investing activities from discontinued operations for 2011 was an increase of $840.7 million compared to a decrease of $84.2 million in 2010 and a decrease of $184.9 million in 2009. In 2011, we received proceeds of $849.3 million from the sale of our Barnett Shale assets. We spent $84.2 million on natural gas and oil property additions in 2010 compared to spending of $184.9 million in 2009.
Net cash (used in) provided from financing activities in 2011 was a decrease of $86.4 million compared to an increase of $287.6 million in 2010 and a decrease of $117.9 million in 2009. Historically, sources of financing have been primarily bank borrowings and capital raised through equity and debt offerings.
During 2011, we:
| • | borrowed $887.8 million and repaid $974.8 million under our bank credit facility; ending the year with $87.0 million lower bank debt; |
| • | issued $500.0 million aggregate principal amounts of our 5.75% senior subordinated notes due 2021; and |
| • | used some of the proceeds from the sale of the 5.75% senior subordinated notes to purchase or redeem all $150.0 million aggregate principal amount of our 6.375% senior subordinated notes due 2015 and $250.0 million aggregate principal amount of our 7.5% senior subordinated notes due 2016 including related expenses. |
During 2010, we:
| • | borrowed $1.1 billion and repaid $1.1 billion under our bank credit facility, ending the year with $50.0 million lower bank debt; |
| • | issued $500.0 million aggregate principal amounts of our 6.75% senior subordinated notes due 2020; and |
47
Table of Contents
| • | used some of the proceeds from the sale of 6.75% senior subordinated notes to redeem all $200.0 million aggregate principal amount of our 7.375% senior subordinated notes due 2013 including related expense. |
During 2009, we:
| • | borrowed $707.0 million and repaid $1.1 billion under our bank credit facility, ending the year with $369 million lower bank debt; and |
| • | issued $300.0 million aggregate principal amounts of our 8% senior subordinated notes due 2019, at a discount. |
Cash Dividend Payments
The amount of future dividends is subject to declaration by the Board of Directors and primarily depends on earnings, capital expenditures and various other factors. In 2011, we paid $25.8 million in dividends to our common shareholders ($0.04 per share each quarter). In 2010, we paid $25.6 million in dividends to our common shareholders ($0.04 per share each quarter). In 2009, we paid $25.2 million in dividends to our common shareholders ($0.04 per share each quarter).
Cash Contractual Obligations
Our contractual obligations include long-term debt, operating leases, drilling commitments, derivative obligations, asset retirement obligations and transportation commitments. As of December 31, 2011, we do not have any capital leases. As of December 31, 2011, we do not have any significant off-balance sheet debt or other such unrecorded obligations and we have not guaranteed any debt of any unrelated party. As of December 31, 2011, we had a total of $28.6 million of letters of credit outstanding under our bank credit facility. The table below provides estimates of the timing of future payments that we are obligated to make based on agreements in place at December 31, 2011. In addition to the contractual obligations listed on the table below, our balance sheet at December 31, 2011 reflects accrued interest payable on our bank debt of $2.0 million which is payable in first quarter 2012. We expect to make interest payments of $18.8 million per year on our 7.5% senior subordinated notes, $18.1 million per year on our 7.25% senior subordinated notes, $24.0 million per year on our 8% senior subordinated notes, $33.8 million per year on our 6.75% senior subordinated notes and $28.8 million per year on our 5.75% senior subordinated notes.
The following summarizes our contractual financial obligations at December 31, 2011 and their future maturities. We expect to fund these contractual obligations with cash generated from operating activities, borrowings under our bank credit facility, additional debt issuances and proceeds from asset sales (in thousands).
| Payment due by period | ||||||||||||||||||||||||||
| 2012 | 2013 | 2014 | 2015 and 2016 |
Thereafter | Total | |||||||||||||||||||||
| Bank debt due 2016 |
$ | — | $ | — | $ | — | $ | 187,000 | (a) | $ | — | $ | 187,000 | |||||||||||||
| 7.5% senior subordinated notes due 2017 |
— | — | — | — | 250,000 | 250,000 | ||||||||||||||||||||
| 7.25% senior subordinated notes due 2018 |
— | — | — | — | 250,000 | 250,000 | ||||||||||||||||||||
| 8.0% senior subordinated notes due 2019 |
— | — | — | — | 300,000 | 300,000 | ||||||||||||||||||||
| 6.75% senior subordinated notes due 2020 |
— | — | — | — | 500,000 | 500,000 | ||||||||||||||||||||
| 5.75% senior subordinated notes due 2021 |
— | — | — | — | 500,000 | 500,000 | ||||||||||||||||||||
| Operating leases |
12,118 | 11,410 | 10,923 | 19,193 | 27,701 | 81,345 | ||||||||||||||||||||
| Drilling rig commitments |
24,998 | 14,673 | 896 | — | — | 40,567 | ||||||||||||||||||||
| Transportation commitments |
103,030 | 102,693 | 102,221 | 198,722 | 506,798 | 1,013,464 | ||||||||||||||||||||
| Hydraulic fracturing services |
70,080 | 52,560 | — | — | — | 122,640 | ||||||||||||||||||||
| Other purchase obligations |
3,133 | 2,637 | 158 | 314 | 1,626 | 7,868 | ||||||||||||||||||||
| Seismic agreements |
7,208 | 1,815 | — | — | — | 9,023 | ||||||||||||||||||||
| Derivative obligations (b) |
— | 173 | — | — | — | 173 | ||||||||||||||||||||
| Asset retirement obligation liability (c) |
5,005 | 8,725 | 240 | 1,464 | 66,508 | 81,942 | ||||||||||||||||||||
|
|
|
|
|
|
|
|
|
|
|
|
|
|||||||||||||||
| Total contractual obligations (d) |
$ | 225,572 | $ | 194,686 | $ | 114,438 | $ | 406,693 | $ | 2,402,633 | $ | 3,344,022 | ||||||||||||||
|
|
|
|
|
|
|
|
|
|
|
|
|
|||||||||||||||
| (a) | Due at termination date of our bank credit facility. Interest paid on our bank credit facility would be approximately $4.0 million each year assuming no change in the interest rate or outstanding balance. |
| (b) | Derivative obligations represent net open derivative contracts valued as of December 31, 2011. While such payments will be funded by higher prices received from the sale of our production, production receipts may be received after our payments to counterparties, which can result in borrowings under our bank credit facility. |
| (c) | The ultimate settlement amount and timing cannot be precisely determined in advance. See Note 9 to our consolidated financial statements. |
| (d) | This table excludes the liability for the deferred compensation plans since these obligations will be funded with existing plan assets. |
48
Table of Contents
In addition to the amounts included in the above table, we have contracted with several pipeline companies through 2028 to deliver natural gas production volumes in Appalachia from certain Marcellus Shale wells. The agreements are contingent on certain pipeline modifications and are for 143,000 mcfe per day in 2012, 251,900 mcfe per day in 2013, 346,400 mcfe per day in 2014, 363,000 mcfe per day in 2015, 438,800 mcfe per day in 2016 and 443,000 mcfe per day for the remainder of the contractual term.
Delivery Commitments
We have various volume delivery commitments that are primarily related to our Midcontinent and Marcellus Shale areas. We may purchase third party volumes to satisfy our commitments or pay demand fees for commitment shortfalls, should they occur. As of December 31, 2011, our delivery commitments through 2028 were as follows:
| Year Ending December 31, |
Natural Gas and NGLs (mcfe per day) |
|||
| 2012 |
1,370 | |||
| 2013 |
33,434 | |||
| 2014 |
96,174 | |||
| 2015 |
98,913 | |||
| 2016 |
99,589 | |||
| Thereafter |
90,000 | |||
Other
We lease acreage that is generally subject to lease expiration if initial wells are not drilled within a specified period, generally between three to five years. We do not expect to lose significant lease acreage because of failure to drill due to inadequate capital, equipment or personnel. However, based on our evaluation of prospective economics, including the cost of infrastructure to connect production, we have allowed acreage to expire and will allow additional acreage to expire in the future. To date, our expenditures to comply with environmental or safety regulations have not been a significant component of our cost structure and is not expected to be significant in the future. However, new regulations, enforcement policies, claims for damages or other events could result in significant future costs.
Hedging – Oil and Gas Prices
We use commodity-based derivative contracts to manage exposures to commodity price fluctuations. We do not enter into these arrangements for speculative or trading purposes. We do not utilize complex derivatives as we typically utilize commodity swap, collar and call option contracts to (1) reduce the effect of price volatility on the commodities we produce and sell and (2) support our annual capital budget and expenditure plans. In 2011, we also entered into NGL derivative swap contracts from the natural gasoline component of natural gas liquids. While there is a risk that the financial benefit of rising natural gas, NGLs and oil prices may not be captured, we believe the benefits of stable and predictable cash flow are more important. Among these benefits are a more efficient utilization of existing personnel and planning for future staff additions, the flexibility to enter into long-term projects requiring substantial committed capital, smoother and more efficient execution of our ongoing development drilling and production enhancement programs, more consistent returns on invested capital, and better access to bank and other credit markets.
At December 31, 2011, we had open swap contracts covering 66.8 Bcf of natural gas at prices averaging $4.06 per mcf, 1.8 million barrels of oil at prices averaging $94.43 per barrel and 6.6 million barrels of NGLs (the C5 component of NGLs) at prices averaging $93.30 per barrel. We had collars covering 206.4 Bcf of gas at weighted average floor and cap prices of $4.76 to $5.27 per mcf and 2.6 million barrels of oil at weighted average floor and cap prices of $83.26 to $94.28 per barrel. We also have sold call options covering 1.7 millions of barrels of oil at a weighted average price of $85.00 per barrel. The fair value, represented by the estimated amount that would be realized or payable on termination, based on a comparison of the contract price and a reference price, generally NYMEX, approximated a pretax gain of $251.3 million at December 31, 2011. The contracts expire monthly through December 2014.
49
Table of Contents
At December 31, 2011, the following commodity derivative contracts were outstanding:
| Period |
Contract Type |
Volume Hedged |
Weighted Average Hedge Price | |||
| Natural Gas |
||||||
| 2012 |
Collars | 234,887 Mmbtu/day | $ 4.99–$ 5.50 | |||
| 2013 |
Collars | 240,000 Mmbtu/day | $ 4.73–$ 5.20 | |||
| 2014 |
Collars | 90,000 Mmbtu/day | $ 4.25–$ 4.85 | |||
| 2012 |
Swaps | 182,986 Mmbtu/day | $4.06 | |||
| Crude Oil |
||||||
| 2012 |
Collars | 2,000 bbls/day | $ 70.00–$ 80.00 | |||
| 2013 |
Collars | 3,000 bbls/day | $ 90.60–$ 100.00 | |||
| 2014 |
Collars | 2,000 bbls/day | $ 85.55–$ 100.00 | |||
| 2012 |
Call options | 4,700 bbls/day | $85.00 | |||
| 2013 |
Swaps | 3,000 bbls/day | $95.55 | |||
| 2014 |
Swaps | 2,000 bbls/day | $92.75 | |||
| NGLs (Natural Gasoline) |
||||||
| 2012 |
Swaps | 12,000 bbls/day | $96.28 | |||
| 2013 |
Swaps | 6,000 bbls/day | $87.33 | |||
Interest Rates
At December 31, 2011, we had $2.0 billion of debt outstanding. Of this amount, $1.8 billion bears interest at fixed rates averaging 6.9%. Bank debt totaling $187.0 million bears interest at floating rates, which averaged 2.2% at year-end 2011. The 30-day LIBOR rate on December 31, 2011 was 0.3%. A 1% increase in short-term interest rates on the floating-rate debt outstanding at December 31, 2011 would cost us approximately $1.9 million in additional annual interest expense.
Off-Balance Sheet Arrangements
We do not currently utilize any off-balance sheet arrangements with unconsolidated entities to enhance our liquidity or capital resource position, or for any other purpose. However, as is customary in the oil and gas industry, we have various contractual work commitments some of which are described above under cash contractual obligations.
Inflation and Changes in Prices
Our revenues, the value of our assets and our ability to obtain bank loans or additional capital on attractive terms have been and will continue to be affected by changes in natural gas, NGLs and oil prices and the costs to produce our reserves. Natural gas, NGLs and oil prices are subject to significant fluctuations that are beyond our ability to control or predict. Although certain of our costs and expenses are affected by general inflation, inflation does not normally have a significant effect on our business. We expect costs in 2012 to continue to be a function of supply and demand.
Management’s Discussion of Critical Accounting Estimates
Our discussion and analysis of our financial condition and results of operations are based upon consolidated financial statements, which have been prepared in accordance with accounting principles generally accepted in the United States. The preparation of our financial statements requires us to make estimates and assumptions that affect the reported amounts of assets and liabilities, the disclosure of contingent assets and liabilities at year-end, the reported amounts of revenues and expenses during the year and proved natural gas and oil reserves. Some accounting policies involve judgments and uncertainties to such an extent there is a reasonable likelihood that materially different amounts could have been reported under different conditions, or if different assumptions had been used. We evaluate our estimates and assumptions on a regular basis. We base our estimates on historical experience and various other assumptions that we believe are reasonable under the circumstances, the results of which form the basis for making judgments about the carrying value of assets and liabilities that are not readily apparent from other sources. Actual results could differ from the estimates and assumptions used.
Certain accounting estimates are considered to be critical if (a) the nature of the estimates and assumptions is material due to the level of subjectivity and judgment necessary to account for highly uncertain matters or the susceptibility of such matters to changes; and (b) the impact of the estimates and assumptions on financial condition or operating performance is material.
50
Table of Contents
Natural Gas and Oil Properties
We follow the successful efforts method of accounting for natural gas and oil producing activities. Unsuccessful exploration drilling costs are expensed and can have a significant effect on reported operating results. Successful exploration drilling costs and all development costs are capitalized and systematically charged to expense using the units of production method based on proved developed natural gas and oil reserves as estimated by our engineers and audited by independent engineers. Costs incurred for exploratory wells that find reserves that cannot yet be classified as proved are capitalized on our balance sheet if (a) the well has found a sufficient quantity of reserves to justify its completion as a producing well and (b) we are making sufficient progress assessing the reserves and the economic and operating viability of the project. Proven property leasehold costs are amortized to expense using the units of production method based on total proved reserves. Properties are assessed for impairment as circumstances warrant (at least annually) and impairments to value are charged to expense. The successful efforts method inherently relies upon the estimation of proved reserves, which includes proved developed and proved undeveloped volumes.
Proved reserves are defined by the SEC as those volumes of natural gas, natural gas liquids, condensate and crude oil that geological and engineering data demonstrate with reasonable certainty are recoverable in future years from known reservoirs under existing economic and operating conditions. Proved developed reserves are volumes expected to be recovered through existing wells with existing equipment and operating methods. Although our engineers are knowledgeable of and follow the guidelines for reserves established by the SEC, including the rule revisions designed to modernize the oil and gas company reserves reporting requirements which we adopted effective December 31, 2009, the estimation of reserves requires engineers to make a significant number of assumptions based on professional judgment. Reserve estimates are updated at least annually and consider recent production levels and other technical information. Estimated reserves are often subject to future revisions, which could be substantial, based on the availability of additional information, including: reservoir performance, new geological and geophysical data, additional drilling, technological advancements, price and cost changes and other economic factors. Changes in natural gas, NGLs and oil prices can lead to a decision to start-up or shut-in production, which can lead to revisions to reserve quantities. Reserve revisions in turn cause adjustments in our depletion rates. We cannot predict what reserve revisions may be required in future periods. Reserve estimates are reviewed and approved by our Senior Vice President of Reservoir Engineering and Economics who reports directly to our President and Chief Executive Officer. For additional discussion, see “Proved Reserves,” in Item 1 of this report. To further ensure the reliability of our reserve estimates, we engage independent petroleum consultants to audit our estimates of proved reserves. Independent petroleum consultants audited approximately 89% of our reserves in 2011 compared to 90% in 2010 and 88% in 2009. Historical variances between our reserve estimates and the aggregate estimates of our consultants have been less than 5%. The reserves included in this report are those reserves estimated by our petroleum engineering staff. Beginning December 31, 2009, reserve estimates are based on an average of prices in the prior 12-month period, using the closing prices on the first day of each month. In previous periods, reserve estimates were based upon prices at December 31. Neither of these prices should be expected to reflect future market conditions.
Depletion rates are determined based on reserve quantity estimates and the capitalized costs of producing properties. As the estimated reserves are adjusted, the depletion expense for a property will change, assuming no change in production volumes or the capitalized costs. While total depletion expense for the life of a property is limited to the property’s total cost, proved reserve revisions result in a change in the timing of when depletion expense is recognized. Downward revisions of proved reserves may result in an acceleration of depletion expense, while upward revisions tend to lower the rate of depletion expense recognition. Based on proved reserves at December 31, 2011, we estimate that a 1% change in proved reserves would increase or decrease 2012 depletion expense by approximately $4.1 million (based on current production estimates). Estimated reserves are used as the basis for calculating the expected future cash flows from a property asset groups, which are used to determine whether that property may be impaired. Reserves are also used to estimate the supplemental disclosure of the standardized measure of discounted future net cash flows relating to natural gas and oil producing activities and reserve quantities in Note 20 to our consolidated financial statements. Changes in the estimated reserves are considered a change in estimate for accounting purposes and are reflected on a prospective basis. We adopted the new SEC accounting and disclosure regulations for oil and gas companies effective December 31, 2009 which was accounted for prospectively. We estimated the effect of this change in estimate was an increase to depletion, depreciation and amortization expense (including our Barnett Shale properties) in fourth quarter 2009 of approximately $3.4 million primarily due to lower prices reflected in our estimated reserves.
We monitor our long-lived assets recorded in natural gas and oil properties in our consolidated balance sheets to ensure they are fairly presented. We must evaluate our properties for potential impairment when circumstances indicate that the carrying value of an asset could exceed its fair value. A significant amount of judgment is involved in performing these evaluations since the results are based on estimated future events. Such events include a projection of future natural gas, NGLs and oil prices, an estimate of the ultimate amount of recoverable natural gas, NGLs and oil reserves that will be produced from the property asset groups future production, future production costs, future abandonment costs, and future inflation. The need to test a property asset group for impairment can be based on several factors, including a significant reduction in sales prices for natural gas, NGLs and/or oil, unfavorable adjustments to reserves, physical damage to production equipment and facilities, a change in costs, or other changes to contracts or environmental regulations. Our natural gas and oil properties are reviewed for
51
Table of Contents
potential impairments at the lowest levels for which there are identifiable cash flows that are largely independent of other groups of assets. All of these factors must be considered when testing a property asset groups carrying value for impairment. The review is done by determining if the historical cost of proved properties less the applicable accumulated depreciation, depletion and amortization is less than the estimated undiscounted future net cash flows. The expected future net cash flows are estimated based on our plans to produce and develop reserves. Expected future net cash inflows from the sale of produced reserves is calculated based on estimated future prices and estimated operating and development costs. We estimate prices based upon market related information including published futures prices. The estimated future level of production is based on assumptions surrounding future levels of prices and costs, field decline rates, market demand and supply and the economic and regulatory climates. In certain circumstances, we also consider potential sales of properties to third parties in our estimates of future cash flows. When the carrying value exceeds the sum of future net cash flows, an impairment loss is recognized for the difference between the estimated fair market value (as determined by discounted future net cash flows using a discount rate similar to that used by market participants) and the carrying value of the asset. We cannot predict whether impairment charges may be required in the future.
Our historical impairment of producing properties has been $38.7 million in 2011, $6.5 million in 2010 and $930,000 in 2009. In 2011, an impairment was recorded on our East Texas properties of $31.2 million due to lower reserves, lower natural gas prices and including the possibility of a sale. An impairment of $7.5 million was also recorded in 2011 related to our Gulf Coast onshore properties due to lower reserves and lower natural gas prices. In 2010, an impairment was recorded on our Gulf Coast properties and in 2009, an impairment was recorded on our Michigan properties due to lower reserves and natural gas prices. While our Barnett Shale properties did not meet held for sale criteria as of December 31, 2010, our analysis reflected undiscounted cash flows for these properties were less than their carrying value. We therefore compared the carrying value of the Barnett Shale properties to the estimated fair value of such properties and recognized an impairment charge of $463.2 million in fourth quarter 2010, which is recorded in discontinued operations. Our estimated fair value included an estimate of the potential sales price for the Barnett Shale properties in the estimated future cash flows. On April 29, 2011, we sold substantially all of these assets. We believe that a sensitivity analysis regarding the effect of changes in assumptions on estimated impairment is impractical to provide because of the number of assumptions and variables involved which have interdependent effects on the potential outcome. If natural gas, NGL and oil prices decrease or drilling efforts are unsuccessful, we may be required to record additional impairments.
We evaluate our unproved property investment periodically for impairment. The majority of these costs generally relate to the acquisition of leaseholds. The costs are capitalized and evaluated (at least quarterly) as to recoverability, based on changes brought about by economic factors and potential shifts in business strategy employed by management. Impairment of a significant portion of our unproved properties is assessed and amortized on an aggregate basis based on our average holding period, expected forfeiture rate and anticipated drilling success. Potential impairment of individually significant unproved property is assessed on a property-by-property basis considering a combination of time, geologic and engineering factors. Unproved properties had a net book value of $748.6 million at December 31, 2011 compared to $648.1 million at December 31, 2010. We have recorded abandonment and impairment expense related to unproved properties of $79.7 million in 2011 compared to $49.7 million in 2010 and $36.9 million in 2009.
Natural Gas and Oil Derivatives
All derivative instruments are recorded on our consolidated balance sheets as either an asset or a liability measured at its fair value. Changes in a derivative’s fair value are recognized in earnings unless specific hedge accounting criteria are met. All of our derivative instruments are issued to manage the price risk attributable to our expected natural gas, NGLs and oil production. In determining the amounts to be recorded for our open hedge contracts, we are required to estimate the fair value of the derivative. Our derivatives are measured using a market approach using third-party pricing services which have been corroborated with data from active markets or broker quotes. Our third party pricing service uses observable market prices and we do not adjust the valuations. While we remain at risk for possible changes in the market value of commodity derivatives, such risk should be mitigated by price changes in the underlying physical commodity. The determination of fair values includes various factors including the impact of our nonperformance risk on our liabilities and the credit standing of our counterparties. As of December 31, 2011, our counterparties include eleven financial institutions, all but two of which are secured lenders in our bank credit facility. For those counterparties that are not secured lenders in our bank credit facility or those for which we do not have master netting arrangements, net derivative asset values are determined in part, by reviewing credit default swap spreads for the counterparties. Net derivative liabilities are determined, in part, by using our market credit spread.
Through December 31, 2011, we have elected to designate our commodity derivative instruments that qualify for hedge accounting as cash flow hedges. To designate a derivative as a cash flow hedge, we document at the hedge’s inception our assessment that the derivative will be highly effective in offsetting expected changes in cash flows from the item hedged. This assessment, which is updated at least quarterly, is based on the most recent relevant historical correlation between the derivative and the item hedged. The ineffective portion of the hedge is calculated as the difference between the change in fair value of the derivative and the estimated change in cash flows from the item hedged. If, during the derivative’s term, we
52
Table of Contents
determine the hedge is no longer highly effective, hedge accounting is prospectively discontinued and any remaining unrealized gains or losses, based on the effective portion of the derivative at that date, are reclassified to earnings as natural gas, NGL and oil sales when the underlying transaction occurs. If it is determined that the designated hedged transaction is not probable to occur, any unrealized gains or losses are recognized immediately in derivative fair value income in the accompanying statements of operations. During 2010, there were gains of $11.6 million compared to gains of $5.4 million in 2009 reclassified into earnings as a result of the discontinuance of hedge accounting treatment for our derivatives. In 2011, we did not discontinue hedge accounting on any of our hedges.
We apply hedge accounting to qualifying derivatives used to manage price risk associated with our natural gas, NGLs and oil production. Accordingly, we record changes in the fair value of our qualifying derivative contracts, including changes associated with time value, in accumulated other comprehensive income (“AOCI”) in the accompanying consolidated balance sheets. Gains or losses on these swap and collar contracts are reclassified out of AOCI and into natural gas, NGL and oil sales when the underlying physical transaction occurs. Any hedge ineffectiveness associated with contracts qualifying for and designated as a cash flow hedge (which represents the amount by which the change in the fair value of the derivative differs from the change in the cash flows of the forecasted sale of production) is reported currently each period in derivative fair value in income the accompanying consolidated statements of operations. Ineffectiveness can be associated with open positions (unrealized) or can be associated with closed contracts (realized).
Realized and unrealized gains and losses on derivatives that are not designated as hedges are accounted for using the mark-to-market accounting method. We recognize all unrealized and realized gains and losses related to these contracts in derivative fair value income in the accompanying consolidated statements of operations. At times, we have also entered into basis swap agreements which do not qualify for hedge accounting and are marked to market. The price we receive for our natural gas production can be more or less than the NYMEX price because of adjustments for delivery location (“basis”), relative quality and other factors; therefore, at times we have entered into basis swap agreements that effectively fix our basis adjustments. Cash flows from our derivative contract settlements are reflected in cash flow provided from operating activities in the accompanying consolidated statements of cash flows.
Asset Retirement Obligations
We have significant obligations to remove tangible equipment and restore land at the end of natural gas and oil production operations. Removal and restoration obligations are primarily associated with plugging and abandoning wells. Estimating the future asset removal costs is difficult and requires us to make estimates and judgments because most of the removal obligations are many years in the future and contracts and regulations often have vague descriptions of what constitutes removal. Asset removal technologies and costs are constantly changing, as are regulatory, political, environmental, safety and public relations considerations.
Inherent in the fair value calculation are numerous assumptions and judgments including the ultimate retirement costs, inflation factors, credit-adjusted discount rates, timing of retirement, and changes in the legal, regulatory, environmental and political environments. To the extent future revisions to these assumptions impact the present value of the existing asset retirement obligation (“ARO”), a corresponding adjustment is made to the natural gas and oil property balance. For example, as we analyze actual plugging and abandonment information, we may revise our estimate of current costs, the assumed annual inflation of the costs and/or the assumed productive lives of our wells. During 2011, we increased our existing estimated ARO by $20.8 million or approximately 34% of the asset retirement obligation at December 31, 2010. This increase was due to an increase in estimated costs to plug and abandon our wells. During 2010, we decreased our existing estimated ARO by $7.9 million or approximately 10% of the asset retirement obligation at December 31, 2009. This decrease was due to a change in the productive lives of our wells. In addition, increases in the discounted ARO liability resulting from the passage of time are reflected as accretion expense, a component of depletion, depreciation and amortization in the accompanying consolidated statements of operations. Because of the subjectivity of assumptions and the relatively long lives of most of our wells, the costs to ultimately retire our wells may vary significantly from prior estimates.
Deferred Taxes
We are subject to income and other taxes in all areas in which we operate. When recording income tax expense, certain estimates are required because income tax returns are generally filed many months after the close of a calendar year, tax returns are subject to audit, which can take years to complete, and future events often impact the timing of when income tax expenses and benefits are recognized. We have deferred tax assets relating to tax operating loss carryforwards and other deductible differences. We routinely evaluate deferred tax assets to determine the likelihood of realization and we must estimate our expected future taxable income to complete this assessment. Numerous assumptions are inherent in the estimation of future taxable income, including assumptions about matters that are dependent on future events such as future operating conditions (particularly related to prevailing natural gas, NGLs and oil prices) and future financial conditions. The estimates or assumptions used in determining future taxable income are consistent with those used in our internal budgets and forecasts. A valuation allowance is recognized on deferred tax assets when we believe that certain of these assets are more likely than not to be realized.
53
Table of Contents
In determining deferred tax liabilities, accounting rules require AOCI to be considered, even though such income or loss has not yet been earned. At year-end 2011, deferred tax liabilities exceeded deferred tax assets by $767.1 million with $98.1 million of deferred tax liability related to net deferred hedging gains in AOCI. At year-end 2010, deferred tax liabilities exceeded deferred tax assets by $683.9 million, with $43.6 million of deferred tax liabilities related to unrealized hedging gains included in AOCI.
We may be challenged by taxing authorities over the amount and/or timing of recognition of revenues and deductions in our various income tax returns. Although we believe that we have adequately provided for all taxes, gains or losses could occur in the future due to changes in estimates or resolution of outstanding tax matters.
Contingent Liabilities
A provision for legal, environmental and other contingent matters is charged to expense when the loss is probable and the cost or range of cost can be reasonably estimated. Judgment is often required to determine when expenses should be recorded for legal, environmental and contingent matters. In addition, we often must estimate the amount of such losses. In many cases, our judgment is based on the input of our legal advisors and on the interpretation of laws and regulations, which can be interpreted differently by regulators and/or the courts. Actual costs can differ from estimates for many reasons. We monitor known and potential legal, environmental and other contingent matters and make our best estimate of when to record losses for these matters based on available information. Although we continue to monitor all contingencies closely, particularly our outstanding litigation, we currently have no material accruals for contingent liabilities.
Revenue Recognition
Natural gas, natural gas liquids and oil sales are recognized when the products are sold and delivery to the purchaser has occurred. We use the sales method to account for gas imbalances, recognizing revenue based on gas delivered rather than our working interest share of gas produced. We generally sell natural gas, oil and NGLs under two types of agreements, which are common in our industry. Both types of agreements include transportation charges. We report our gathering and transportation costs in accordance with Financial Accounting Standards Board Section 605-45-05 of Subtopic 605-45 for Revenue Recognition. One type of agreement is a netback arrangement, under which we sell natural gas and oil at the wellhead and collect a price, net of transportation incurred by the purchaser. In this case, we record revenue at the price we received from the purchaser. In the case of NGLs, we receive a net price from the purchaser (which is net of processing costs) which is also recorded in revenue at the net price we receive from the purchaser. Under the other arrangement, we sell natural gas or oil at a specific delivery point, pay transportation, gathering and compression to a third party and receive proceeds from the purchaser with no deduction. In that case, we record these costs as transportation, gathering and compression expense.
Stock-based Compensation Arrangements
The fair value of stock options and stock-settled SARs is estimated on the date of grant using the Black-Scholes-Merton option-pricing model. The model employs various assumptions, based on management’s best estimates at the time of the grant, which impact the fair value calculated and ultimately, the expense that is recognized over the life of the award. We have utilized historical data and analyzed current information to reasonably support these assumptions. The fair value of restricted stock awards (“Liability Awards”) and restricted stock unit awards (“Equity Awards”) is determined based on the fair market value of our common stock on the date of grant.
We recognize stock-based compensation expense on a straight-line basis over the requisite service period for the entire award. The expense we recognize is net of estimated forfeitures. We estimate our forfeiture rate based on prior experience and adjust it as circumstances warrant. Substantially all Liability Awards are deposited in our deferred compensation plans at the time of grant and are classified as a liability due to the fact that these awards are expected to be settled wholly or partially in cash. The fair value of the Liability Awards is updated at each balance sheet date with changes in the fair value of the vested portion of the awards recorded as increases or decreases to deferred compensation plan expense on the accompanying statement of operations.
54
Table of Contents
Accounting Standards Not Yet Adopted
In May 2011, the FASB issued Accounting Standards Update No. 2011-04, “Amendments to Achieve Common Fair Value Measurement and Disclosure Requirements in U.S. GAAP and International Financial Reporting Standards.” This pronouncement was issued to provide a consistent definition of fair value and ensure that the fair value measurement and disclosure requirements are similar between U.S. GAAP and IFRS. ASU 2011-04 changes certain fair value measurement principles and enhances the disclosure requirements, particularly for Level 3 fair value measurements. This pronouncement is effective for reporting periods beginning on or after December 15, 2011, with early adoption prohibited. The new guidance will require prospective application. The adoption of ASU 2011-04 is not expected to have a material effect on our consolidated financial statements, but may require additional disclosures.
| ITEM 7A. | QUANTITIVE AND QUALITATIVE DISCLOSURES ABOUT MARKET RISK |
The primary objective of the following information is to provide forward-looking quantitative and qualitative information about our potential exposure to market risks. The term “market risk” refers to the risk of loss arising from adverse changes in natural gas, NGLs and oil prices and interest rates. The disclosures are not meant to be precise indicators of expected future losses, but rather indicators of reasonably possible losses. This forward-looking information provides indicators of how we view and manage our ongoing market-risk exposure. All of our market-risk sensitive instruments were entered into for purposes other than trading. All accounts are US dollar denominated.
Market Risk
We are exposed to market risks related to the volatility of natural gas, NGLs and oil prices. We employ various strategies, including the use of commodity derivative instruments, to manage the risks related to these price fluctuations. These derivatives instruments apply to a varying portion of our production and provide only partial price protection. These arrangements limit the benefit to us of increases in prices but offer protection in the event of price declines. Further, if our counterparties defaulted, this protection might be limited as we might not receive the benefits of the derivatives. Realized prices are primarily driven by worldwide prices for oil and spot market prices for North American gas production. Natural gas and oil prices have been volatile and unpredictable for many years. Natural gas prices affect us more than oil prices because approximately 79% of our December 31, 2011 proved reserves are natural gas. We are also exposed to market risks related to changes in interest rates. These risks did not change materially from December 31, 2010 to December 31, 2011.
Commodity Price Risk
We use commodity-based derivative contracts to manage exposures to commodity price fluctuations. We do not enter into these arrangements for speculative or trading purposes. We do not utilize complex derivatives such as swaptions, knockouts or extendable swaps. At times, certain of our derivatives are swaps where we receive a fixed price for our production and pay market prices to the counterparty. Our derivatives program also includes collars, which establishes a minimum floor price and a predetermined ceiling price. We have also entered into call option derivative contracts under which we sold call options in exchange for a premium from the counterparty. At the time of settlement of these monthly call options, if the market price exceeds the fixed price of the call option, we will pay the counterparty such excess and if the market settle below the fixed price of the call option, no payment is due from either party. At December 31, 2011, our derivatives program includes swaps, collars and call options. As of December 31, 2011, we had open swap contracts covering 66.8 Bcf of natural gas at price averaging $4.06 per mcf, 1.8 million barrels of oil at prices averaging $94.43 per barrel and 6.6 million barrels of NGLs (the C5 component of NGLs) at prices averaging $93.30 per barrel. We had collars covering 206.4 Bcf of gas at weighted floor and cap prices of $4.76 to $5.27 per mcf and 2.6 million barrels of oil at weighted average floor and cap prices of $83.26 to $94.28 per barrel. We also have sold call options covering 1.7 million barrels of oil at a weighted average price of $85.00 per barrel. These contracts expire monthly through December 2014. The fair value, represented by the estimated amount that would be realized upon immediate liquidation as of December 31, 2011, approximated a net unrealized pre-tax gain of $251.3 million compared to a gain of $117.7 million at December 31, 2010. This change is primarily related to the expiration of natural gas and oil derivative contracts during 2011 and to the natural gas, NGLs and oil futures prices as of December 31, 2011, in relation to the new commodity derivative contracts we entered into during 2011 for 2012, 2013 and 2014.
55
Table of Contents
At December 31, 2011, the following commodity derivative contracts were outstanding:
| Period |
Contract Type |
Volume Hedged |
Weighted Average Hedge Price |
Fair Market Value | ||||
| (in thousands) | ||||||||
| Natural Gas |
||||||||
| 2012 |
Collars | 234,887 Mmbtu/day | $ 4.99–$ 5.50 | $148,384 | ||||
| 2013 |
Collars | 240,000 Mmbtu/day | $ 4.73–$ 5.20 | $75,466 | ||||
| 2014 |
Collars | 90,000 Mmbtu/day | $ 4.25–$ 4.85 | $4,378 | ||||
| 2012 |
Swaps | 182,986 Mmbtu/day | $4.06 | $54,162 | ||||
| Crude Oil |
||||||||
| 2012 |
Collars | 2,000 bbls/day | $ 70.00–$ 80.00 | $(14,653) | ||||
| 2013 |
Collars | 3,000 bbls/day | $ 90.60–$ 100.00 | $(1,142) | ||||
| 2014 |
Collars | 2,000 bbls/day | $ 85.55–$ 100.00 | $(812) | ||||
| 2012 |
Call options | 4,700 bbls/day | $85.00 | $(29,348) | ||||
| 2013 |
Swaps | 3,000 bbls/day | $95.55 | $(242) | ||||
| 2014 |
Swaps | 2,000 bbls/day | $92.75 | $(21) | ||||
| NGLs (Natural Gasoline) |
||||||||
| 2012 |
Swaps | 12,000 bbls/day | $96.28 | $15,376 | ||||
| 2013 |
Swaps | 6,000 bbls/day | $87.33 | $(221) | ||||
We expect our NGL production to continue to increase. In our Marcellus Shale operations, propane is a large product component of our NGL production and we believe NGL prices are somewhat seasonal. Therefore, the percentage of NGL prices to NYMEX WTI (or West Texas Intermediate) will vary due to product components, seasonality and geographic supply and demand.
As of December 31, 2011, the relationship between the price of oil and the price of natural gas is at an unprecedented spread. Normally, natural gas liquids production is a by-product of natural gas production. Due to the current differences in prices, we and other producers may choose to sell natural gas at below cost or otherwise dispose of natural gas to allow for the sale of only natural gas liquids. We and other producers may also elect to produce natural gas at a loss to hold undeveloped acreage.
Currently, there is little demand, or facilities to supply the existing demand, for ethane in the Appalachian region so, for our Appalachian production volumes, ethane remains in the natural gas stream. We currently have waivers from two transmission pipelines that allow us to leave ethane in the residue natural gas. We believe the limits are sufficient to cover our production through 2014. We have recently announced two ethane agreements where we have contracted to either sell or transport ethane from our Marcellus Shale area, both to begin operations in late 2013 and early 2014. We cannot assure you that these facilities will become available. If we are not able to sell ethane in 2014, we may be required to curtail production which will adversely affect our revenues.
Other Commodity Risk
We are impacted by basis risk, caused by factors that affect the relationship between commodity futures prices reflected in derivative commodity instruments and the cash market price of the underlying commodity. Natural gas transaction prices are frequently based on industry reference prices that may vary from prices experienced in local markets. If commodity price changes in one region are not reflected in other regions, derivative commodity instruments may no longer provide the expected hedge, resulting in increased basis risk. At times, we have entered into basis swap agreements. The price we receive for our gas production can be more or less than the NYMEX price because of adjustments for delivery location (“basis”), relative quality and other factors; therefore, we have entered into basis swap agreements in the past that effectively fix the basis adjustments. We currently have not entered into any basis swaps agreements.
The following table shows the fair value of our collars, swaps and call options and the hypothetical change in fair value that would result from a 10% and a 25% change in commodity prices at December 31, 2011. We remain at risk for possible changes in the market value of commodity derivative instruments; however, such risks should be mitigated by price changes in the underlying physical commodity (in thousands):
56
Table of Contents
| Hypothetical Change in Fair Value |
Hypothetical Change in Fair Value |
|||||||||||||||||||
| Increase of | Decrease of | |||||||||||||||||||
| Fair Value | 10% | 25% | 10% | 25% | ||||||||||||||||
| Collars |
$ | 211,621 | $ | (90,276 | ) | $ | (225,306 | ) | $ | 91,220 | $ | 229,322 | ||||||||
| Call options |
(29,348 | ) | (14,280 | ) | (37,617 | ) | 12,319 | 23,980 | ||||||||||||
| Swaps |
69,054 | (96,836 | ) | (241,981 | ) | 97,281 | 243,259 | |||||||||||||
Our commodity-based contracts expose us to the credit risk of non-performance by the counterparty to the contracts. Our exposure is diversified among major investment grade financial institutions and we have master netting agreements with the majority of our counterparties that provide for offsetting payables against receivables from separate derivative contracts. Our derivative contracts are with multiple counterparties to minimize our exposure to any individual counterparty. At December 31, 2011, our derivative counterparties include eleven financial institutions, of which all but two are secured lenders in our bank credit facility. Counterparty credit risk is considered when determining the fair value of our derivative contracts. While counterparties are major investment grade financial institutions, the fair value of our derivative contracts have been adjusted to account for the risk of non-performance by certain of our counterparties, which was immaterial.
Interest Rate Risk
We are exposed to interest rate risk on our bank debt. We attempt to balance variable rate debt, fixed rate debt and debt maturities to manage interest costs, interest rate volatility and financing risk. This is accomplished through a mix of fixed rate senior subordinated debt and variable rate bank debt. At December 31, 2011, we had $2.0 billion of debt outstanding. Of this amount, $1.8 billion bears interest at a fixed rate averaging 6.9%. Bank debt totaling $187.0 million bears interest at floating rates, which was 2.2% on that date. On December 31, 2011, the 30-day LIBOR rate was 0.3%. A 1% increase in short-term interest rates on the floating-rate debt outstanding at December 31, 2011 would cost us approximately $1.9 million in additional annual interest expense.
The fair value of our subordinated debt is based on year-end quoted market prices. The following table presents information on these fair values (in thousands):
| Carrying Value |
Fair Value |
|||||||
| Fixed rate debt: |
||||||||
| Senior Subordinated Notes due 2017 |
$ | 250,000 | $ | 265,625 | ||||
| (The interest rate is fixed at a rate of 7.5%) |
||||||||
| Senior Subordinated Notes due 2018 |
250,000 | 267,500 | ||||||
| (The interest rate is fixed at a rate of 7.25%) |
||||||||
| Senior Subordinated Notes due 2019 |
287,967 | 334,500 | ||||||
| (The interest rate is fixed at a rate of 8.0%) |
||||||||
| Senior Subordinated Notes due 2020 |
500,000 | 555,000 | ||||||
| (The interest rate is fixed at a rate of 6.75%) |
||||||||
| Senior Subordinated Notes due 2021 |
500,000 | 541,250 | ||||||
| (The interest rate is fixed at a rate of 5.75%) |
||||||||
|
|
|
|
|
|||||
| $ | 1,787,967 | $ | 1,963,875 | |||||
|
|
|
|
|
|||||
57
Table of Contents
| ITEM 8. | FINANCIAL STATEMENTS AND SUPPLEMENTARY DATA |
For financial statements required by Item 8, see Item 15 in Part IV of this report.
| ITEM 9. | CHANGES IN AND DISAGREEMENTS WITH ACCOUNTANTS ON ACCOUNTING AND FINANCIAL DISCLOSURE |
None.
| ITEM 9A. | CONTROLS AND PROCEDURES |
Evaluation of Disclosure Controls and Procedures. As required by Rule 13a-15(b) under the Exchange Act, we have evaluated, under the supervision and with the participation of our management, including our principal executive officer and principal financial officer, the effectiveness of the design and operation of our disclosure controls and procedures (as defined in Rules 13a-15(e) and 15d-15(e) under the Exchange Act) as of the end of the period covered by this report. Our disclosure controls and procedures are designed to provide reasonable assurance that the information required to be disclosed by us in reports that we file under the Exchange Act is accumulated and communicated to our management, including our principal executive officer and principal financial officer, as appropriate, to allow timely decisions regarding required disclosure and is recorded, processed, summarized and reported within the time periods specified in the rules and forms of the SEC. Based on that evaluation, our Chief Executive Officer and our Chief Financial Officer concluded that our disclosure controls and procedures are effective as of December 31, 2011.
Management’s Annual Report on Internal Control over Financial Reporting and Attestation Report of Registered Public Accounting Firm. Pursuant to Section 404 of the Sarbanes-Oxley Act of 2002, we have included a report of management’s assessment of the design and effectiveness of its internal controls as part of this report for the fiscal year ended December 31, 2011. Ernst & Young LLP, our registered public accountants, also attested to, and reported on, the effectiveness of internal control over financial reporting. Management’s report and the independent public accounting firm’s attestation report are included in our 2011 Financial Statements in Item 15 under the captions “Management’s Report on Internal Control over Financial Reporting” and “Report of Independent Registered Public Accounting Firm on Internal Control over Financial Reporting.”
Changes in Internal Control over Financial Reporting. As of the end of the period covered by this report, we carried out an evaluation, under the supervision and with the participation of our Chief Executive Officer and Chief Financial Officer, of our internal control over financial reporting to determine whether any changes occurred during fourth quarter 2011 that have materially affected, or are reasonably likely to materially affect, our internal control over financial reporting. Based on that evaluation, there were no changes in our internal control over financial reporting or in other factors that have materially affected or are reasonably likely to materially affect our internal control over financial reporting.
None.
58
Table of Contents
| ITEM 10. | DIRECTORS, EXECUTIVE OFFICERS AND CORPORATE GOVERNANCE |
The officers and directors are listed below with a description of their experience and certain other information. Each director was elected for a one-year term at the 2011 annual stockholders’ meeting. Officers are appointed by our board of directors.
| Age |
Office Held Since |
Position | ||||
| Charles L. Blackburn |
84 | 2003 | Director | |||
| Anthony V. Dub |
62 | 1995 | Director | |||
| V. Richard Eales |
75 | 2001 | Lead Independent Director | |||
| Allen Finkelson |
65 | 1994 | Director | |||
| Jim M. Funk |
62 | 2008 | Director | |||
| Jonathan S. Linker |
63 | 2002 | Director | |||
| Kevin S. McCarthy |
52 | 2005 | Director | |||
| John H. Pinkerton |
57 | 1990 | Director, Executive Chairman | |||
| Jeffrey L. Ventura |
54 | 2003 | Director, President & Chief Executive Officer | |||
| Roger S. Manny |
54 | 2003 | Executive Vice President & Chief Financial Officer | |||
| Alan W. Farquharson |
54 | 2007 | Senior Vice President – Reservoir Engineering & Economics | |||
| David P. Poole |
49 | 2008 | Senior Vice President – General Counsel & Corporate Secretary | |||
| Chad L. Stephens |
56 | 1990 | Senior Vice President – Corporate Development | |||
| Ray N. Walker, Jr. |
54 | 2010 | Senior Vice President – Chief Operating Officer | |||
| Rodney L. Waller |
62 | 1999 | Senior Vice President | |||
| Mark D. Whitley |
60 | 2005 | Senior Vice President – Northern Appalachia and Southwest Divisions | |||
| Dori A. Ginn |
54 | 2009 | Vice President, Controller and Principal Accounting Officer |
Charles L. Blackburn was first elected as a director in 2003. Mr. Blackburn has more than 40 years experience in oil and gas exploration and production serving in several executive and board positions. Previously, he served as Chairman and Chief Executive Officer of Maxus Energy Corporation from 1987 until that company’s sale to YPF Socieded Anonima in 1995. Maxus was the oil and gas producer which remained after Diamond Shamrock Corporation’s spin-off of its refining and marketing operations. Mr. Blackburn joined Diamond Shamrock in 1986 as President of their exploration and production subsidiary. From 1952 through 1986, Mr. Blackburn was with Shell Oil Company, serving as Director and Executive Vice President for exploration and production for the final ten years of that period. Mr. Blackburn has previously served on the Boards of Anderson Clayton and Co. (1978-1986), King Ranch Corp. (1987-1988), Penrod Drilling Co. (1988-1991), Landmark Graphics Corp. (1992-1996) and Lone Star Technologies, Inc. (1991-2001). Mr. Blackburn received his Bachelor of Science degree in Engineering Physics from the University of Oklahoma.
Anthony V. Dub became a director in 1995. Mr. Dub is Chairman of Indigo Capital, LLC, a financial advisory firm based in New York. Before forming Indigo Capital in 1997, he served as an officer of Credit Suisse First Boston (“CSFB”). Mr. Dub joined CSFB in 1971 and was named a Managing Director in 1981. Mr. Dub led a number of departments during his 26 year career at CSFB including the Investment Banking Department. After leaving CSFB, Mr. Dub became Vice Chairman and a director of Capital IQ, Inc. until its sale to Standard & Poor’s in 2004. Capital IQ is a leader in helping organizations capitalize on synergistic integration of market intelligence, institutional knowledge and relationships. Mr. Dub received a Bachelor of Arts degree, magna cum laude, from Princeton University.
V. Richard Eales became a director in 2001 and was selected as Lead Independent Director in 2008. Mr. Eales has over 35 years of experience in the energy, technology and financial industries. He is currently retired, having been a financial consultant serving energy and information technology businesses from 1999 through 2002. Mr. Eales was employed by Union Pacific Resources Group Inc. from 1991 to 1999 serving as Executive Vice President from 1995 through 1999. Before 1991, Mr. Eales served in various financial capacities with Butcher & Singer and Janney Montgomery Scott, investment banking firms, as CFO of Novell, Inc., a technology company, and in the treasury department of Mobil Oil Corporation. Mr. Eales received his Bachelor of Chemical Engineering degree from Cornell University and his Master’s degree in Business Administration from Stanford University.
59
Table of Contents
Allen Finkelson became a director in 1994. Mr. Finkelson was a partner at Cravath, Swaine & Moore LLP from 1977 to 2011, with the exception of the period 1983 through 1985, when he was a managing director of Lehman Brothers Kuhn Loeb Incorporated. Mr. Finkelson joined Cravath, Swaine & Moore, LLP in 1971. Mr. Finkelson earned a Bachelor of Arts from St. Lawrence University and a J.D. from Columbia University School of Law.
James M. Funk became a director in December 2008. Mr. Funk is an independent consultant and producer with over 30 years of experience in the energy industry. Mr. Funk served as Sr. Vice President of Equitable Resources and President of Equitable Production Co. from June 2000 until December 2003 and has been an independent consultant and oil and gas producer since that time. Previously, Mr. Funk was employed by Shell Oil Company for 23 years in senior management and technical positions. Mr. Funk has previously served on the boards of Westport Resources (2000 to 2004) and Matador Resources Company (2003 to 2008). Mr. Funk currently serves as a Director of Superior Energy Services, Inc., a public oil field services company headquartered in New Orleans, Louisiana and Sonde Resources Corp., a public company headquartered in Calgary, Alberta. Mr. Funk received an B.A. degree in Geology from Wittenberg University, a M.S. in Geology from the University of Connecticut, and a PhD in Geology from the University of Kansas. Mr. Funk is a Certified Petroleum Geologist.
Jonathan S. Linker became a director in 2002. Mr. Linker previously served as a director of Range from 1998 to 2000. He has been active in the energy industry for over 37 years. Mr. Linker joined First Reserve Corporation in 1988 and was a Managing Director of the firm from 1996 through 2001. Mr. Linker is currently Manager of Houston Energy Advisors LLC, an investment advisor providing management and investment services to two private equity funds. Mr. Linker has been President and a director of IDC Energy Corporation since 1987, a director and officer of Sunset Production Corporation since 1991 serving currently as Chairman, and Manager of Shelby Resources Inc., all small, privately-owned exploration and production companies. Mr. Linker received a Bachelor of Arts in Geology from Amherst College, a Masters in Geology from Harvard University and an MBA from Harvard Graduate School of Business Administration.
Kevin S. McCarthy became a director in 2005. Mr. McCarthy is Chairman, Chief Executive Officer and President of Kayne Anderson MLP Investment Company, Kayne Anderson Energy Total Return Fund, Inc. and Kayne Anderson Energy Development Company, which are each NYSE listed closed-end investment companies. Mr. McCarthy joined Kayne Anderson Capital Advisors as a Senior Managing Director in 2004 from UBS Securities LLC where he was global head of energy investment banking. In this role, he had senior responsibility for all of UBS’ energy investment banking activities, including direct responsibilities for securities underwriting and mergers and acquisitions in the energy industry. From 1995 to 2000, Mr. McCarthy led the energy investment banking activities of Dean Witter Reynolds and then PaineWebber Incorporated. He began his investment banking career in 1984. He is also on the board of directors of Pro Petro Services, Inc. and Direct Fuel Partners, L.P, (two private energy companies). He earned a Bachelor of Arts in Economics and Geology from Amherst College and an MBA in Finance from the University of Pennsylvania’s Wharton School.
John H. Pinkerton, Executive Chairman and a director, became a director in 1988 and was elected Chairman of the Board of Directors in 2008. He joined Range as President in 1990 and was appointed Chief Executive Officer in 1992. Previously, Mr. Pinkerton was employed by Snyder Oil Corporation, serving in numerous capacities, the last of which was Senior Vice President. Mr. Pinkerton currently serves on the Board of Trustees of Texas Christian University and is a member of the Executive Committee of America’s Natural Gas Alliance (ANGA). Mr. Pinkerton received his Bachelor of Arts in Business Administration from Texas Christian University and a Master’s degree from the University of Texas at Arlington.
Jeffrey Ventura, President & Chief Executive Officer and a director, joined Range in 2003 as Chief Operating Officer and became a director in 2005. Mr. Ventura was named Chief Executive Officer effective January 1, 2012. Previously, Mr. Ventura served as President and Chief Operating Officer of Matador Petroleum Corporation which he joined in 1997. Prior to his service at Matador, Mr. Ventura spent eight years at Maxus Energy Corporation where he managed various engineering, exploration and development operations and was responsible for coordination of engineering technology. Previously, Mr. Ventura was with Tenneco Oil Exploration and Production, where he held various engineering and operating positions. Mr. Ventura holds a Bachelor of Science degree in Petroleum and Natural Gas Engineering from the Pennsylvania State University.
Roger S. Manny, Executive Vice President & Chief Financial Officer. Mr. Manny joined Range in 2003. Previously, Mr. Manny served as Executive Vice President and Chief Financial Officer of Matador Petroleum Corporation from 1998 until joining Range. Before 1998, Mr. Manny spent 18 years at Bank of America and its predecessors where he served as Senior Vice President in the energy group. Mr. Manny holds a Bachelor of Business Administration degree from the University of Houston and a Masters of Business Administration from Houston Baptist University.
60
Table of Contents
Alan W. Farquharson, Senior Vice President – Reservoir Engineering & Economics, joined Range in 1998. Mr. Farquharson has held the positions of Manager and Vice President of Reservoir Engineering before being promoted to Senior Vice President –Reservoir Engineering in February 2007 and his current position in January 2012 with his assumption of additional responsibilities for strategic allocation of capital. Previously, Mr. Farquharson held positions with Union Pacific Resources including Engineering Manager Business Development – International. Before that, Mr. Farquharson held various technical and managerial positions at Amoco and Hunt Oil. He holds a Bachelor of Science degree in Electrical Engineering from the Pennsylvania State University.
David P. Poole, Senior Vice President – General Counsel & Corporate Secretary, joined Range in June 2008. Mr. Poole has over 23 years of legal experience. From May 2004 until March 2008 he was with TXU Corp., serving last as Executive Vice President – Legal, and General Counsel. Prior to joining TXU, Mr. Poole spent 16 years with Hunton & Williams LLP and its predecessor, where he was a partner and last served as the Managing Partner of the Dallas office. Mr. Poole graduated from Texas Tech University with a B.S. in Petroleum Engineering and received a J.D. magna cum laude from Texas Tech University School of Law.
Chad L. Stephens, Senior Vice President – Corporate Development, joined Range in 1990. Before 2002, Mr. Stephens held the position of Senior Vice President – Southwest. Previously, Mr. Stephens was with Duer Wagner & Co., an independent oil and gas producer for approximately two years. Before that, Mr. Stephens was an independent oil operator in Midland, Texas for four years. From 1979 to 1984, Mr. Stephens was with Cities Service Company and HNG Oil Company. Mr. Stephens holds a Bachelor of Arts degree in Finance and Land Management from the University of Texas.
Ray N. Walker, Jr., Senior Vice President – Chief Operating Officer, joined Range in 2006 and was elected to his current position in January 2012. Previously, Mr. Walker served as Senior Vice President-Environment, Safety and Regulatory and previously as Senior Vice President-Marcellus Shale where he led the development of the Company’s Marcellus Shale division. Mr. Walker is a Registered Petroleum Engineer with more than 35 years of oil and gas operations and management experience having previously been employed by Halliburton in various technical and management roles, Union Pacific Resources and several private companies in which Mr. Walker served as an officer. Mr. Walker has a Bachelor of Science degree, in Agricultural Engineering from Texas A&M University.
Rodney L. Waller, Senior Vice President joined Range in 1999. Mr. Waller served as Corporate Secretary from 1999 until 2008. Previously, Mr. Waller was Senior Vice President of Snyder Oil Corporation. Before joining Snyder, Mr. Waller was with Arthur Andersen. Mr. Waller is a certified public accountant and petroleum land man. Mr. Waller received a Bachelor of Arts degree in Accounting from Harding University.
Mark D. Whitley, Senior Vice President – Northern Appalachia and Southwest Divisions, joined Range in 2005. Previously, he served as Vice President – Operations with Quicksilver Resources for two years. Before joining Quicksilver, he served as Production/Operation Manager for Devon Energy, following the merger of Mitchell Energy with Devon. From 1982 to 2002, Mr. Whitley held a variety of technical and managerial roles with Mitchell Energy. Notably, he led the team of engineers at Mitchell Energy who applied new stimulation techniques to unlock the shale gas potential in the Barnett Shale formation in the Fort Worth Basin. Previous positions included serving as a production and reservoir engineer with Shell Oil. He holds a Bachelor’s degree in Chemical Engineering from Worcester Polytechnic Institute and a Master’s degree in Chemical Engineering from the University of Kentucky.
Dori A. Ginn, Vice President, Controller and Principal Accounting Officer, joined Range in 2001. Ms. Ginn has held the positions of Financial Reporting Manager, Vice President and Controller before being elected to Principal Accounting Officer in September 2009. Prior to joining Range, she held various accounting positions with Doskocil Manufacturing Company and Texas Oil and Gas Corporation. Ms. Ginn received a Bachelor of Business Administration in Accounting from the University of Texas at Arlington. She is a certified public accountant.
61
Table of Contents
Section 16(a) Beneficial Ownership Reporting Compliance
See the material appearing under the heading “Section 16(a) Beneficial Ownership Reporting Compliance” in the Range Proxy Statement for the 2012 Annual Meeting of Stockholders which is incorporated herein by reference. Section 16(a) of the Exchange Act requires our directors, officers (including a person performing a principal policy-making function) and persons who own more than 10% of a registered class of our equity securities to file with the Commission initial reports of ownership and reports of changes in ownership of our common stock and other equity securities. Directors, officers and 10% holders are required by Commission regulations to send us copies of all of the Section 16(a) reports they file. Based solely on a review of the copies of the forms sent to us and the representations made by the reporting persons to us, we believe that, other than as described below, during the fiscal year ended December 31, 2011, our directors, officers and 10% holders complied with all filing requirements under Section 16(a) of the Exchange Act, with the following exceptions. Ms. Ginn had a delinquent Form-4 filing on May 3, 2011 for a transaction occurring on February 20, 2010. Mr. Farquharson had a delinquent Form-4 filing on December 29, 2011 for a transaction occurring on December 22, 2011. Mr. Manny had a delinquent Form-4 filing on December 22, 2011 for a transaction occurring on October 21, 2011.
Code of Ethics
Code of Ethics. We have adopted a Code of Ethics that applies to our principal executive officers, principal financial officer, principal accounting officer, or persons performing similar functions (as well as directors and all other employees). A copy is available on our website, www.rangeresources.com and a copy in print will be provided to any person without charge, upon request. Such requests should be directed to the Corporate Secretary, 100 Throckmorton Street, Suite 1200, Fort Worth, Texas 76102 or by calling (817) 870-2601. We intend to disclose any amendments to or waivers of the Code of Ethics on behalf of our Chief Executive Officer, Chief Financial Officer, Controller and persons performing similar functions on our website, under the Corporate Governance caption, promptly following the date of such amendment or waiver.
Identifying and Evaluating Nominees for Directors
See the material under the heading “Consideration of Director Nominees” in the Range Proxy Statement for the 2012 Annual Meeting of stockholders, which is incorporated herein by reference.
Audit Committee
See the material under the heading “Audit Committee” in the Range Proxy Statement for the 2012 Annual Meeting of stockholders, which is incorporated herein by reference.
NYSE 303A Certification
The Chief Executive Officer of Range Resources Corporation made an unqualified certification to the NYSE with respect to the Company’s compliance with the NYSE Corporate Governance listing standards on June 3, 2011.
| ITEM 11. | EXECUTIVE COMPENSATION |
Information required by this item is incorporated by reference to such information as set forth in the Range Proxy Statement for the 2012 Annual Meeting of stockholders.
| ITEM 12. | SECURITY OWNERSHIP OF CERTAIN BENEFICIAL OWNERS AND MANAGEMENT AND RELATED STOCKHOLDER MATTERS |
Information required by this item is incorporated by reference to such information as set forth in the Range Proxy Statement for the 2012 Annual Meeting of stockholders.
| ITEM 13. | CERTAIN RELATIONSHIPS AND RELATED TRANSACTIONS AND DIRECTOR INDEPENDENCE |
Information required by this item is incorporated by reference to such information as set forth in the Range Proxy Statement for the 2012 Annual Meeting of stockholders.
| ITEM 14. | PRINCIPAL ACCOUNTANT FEES AND SERVICES |
Information required by this item is incorporated by reference to such information as set forth in the Range Proxy Statement for the 2012 Annual Meeting of stockholders.
62
Table of Contents
| ITEM 15. | EXHIBITS AND FINANCIAL STATEMENT SCHEDULES |
| (a) | Documents filed as part of the report: |
| 1. | Financial Statements: |
| 2. | All other schedules are omitted because they are not applicable, not required, or because the required information is included in the financial statements or related notes. |
| 3. | Exhibits: |
| (a) | See Index of Exhibits on page 67 for a description of the exhibits filed as a part of this report. |
63
Table of Contents
GLOSSARY OF CERTAIN DEFINED TERMS
The terms defined in this glossary are used in this report.
Bbl. One stock tank barrel, or 42 U.S. gallons liquid volumes, used herein in reference to crude oil or other liquid hydrocarbons.
Bcf. One billion cubic feet of gas.
Bcfe. One billion cubic feet of natural gas equivalents, based on a ratio of 6 mcf for each barrel of oil or NGL, which reflects relative energy content.
development well. A well drilled within the proved area of an oil or natural gas reservoir to the depth of a stratigraphic horizon known to be productive.
dry hole. A well found to be incapable of producing oil or natural gas in sufficient economic quantities.
exploratory well. A well drilled to find oil or gas in an unproved area, to find a new reservoir in an existing field or to extend a known reservoir.
gross acres or gross wells. The total acres or wells, as the case may be, in which a working interest is owned.
Mbbl. One thousand barrels of crude oil or other liquid hydrocarbons.
Mcf. One thousand cubic feet of gas.
Mcf per day. One thousand cubic feet of gas per day.
Mcfe. One thousand cubic feet of natural gas equivalents, based on a ratio of 6 mcf for each barrel of oil or NGL, which reflects relative energy content.
Mmbbl. One million barrels of crude oil or other liquid hydrocarbons.
Mmbtu. One million British thermal units. A British thermal unit is the heat required to raise the temperature of one pound of water from 58.5 to 59.5 degrees Fahrenheit.
Mmcf. One million cubic feet of gas.
Mmcfe. One million cubic feet of gas equivalents.
NGLs. Natural gas liquids.
net acres or net wells. The sum of the fractional working interests owned in gross acres or gross wells.
present value (PV). The present value of future net cash flows, using a 10% discount rate, from estimated proved reserves, using constant prices and costs in effect on the date of the report (unless such prices or costs are subject to change pursuant to contractual provisions). The after tax present value is the Standardized Measure.
productive well. A well that is producing oil or gas or that is capable of production.
proved developed non-producing reserves. Reserves that consist of (i) proved reserves from wells which have been completed and tested but are not producing due to lack of market or minor completion problems which are expected to be corrected and (ii) proved reserves currently behind the pipe in existing wells and which are expected to be productive due to both the well log characteristics and analogous production in the immediate vicinity of the wells.
proved developed reserves. Proved reserves that can be expected to be recovered through existing wells with existing equipment and operating methods.
64
Table of Contents
proved reserves. The estimated quantities of crude oil, natural gas and natural gas liquids which geological and engineering data demonstrate with reasonable certainty to be recoverable in future years from known reservoirs under existing economic and operating conditions.
proved undeveloped reserves. Proved reserves that are expected to be recovered from new wells on undrilled acreage, or from existing wells where a relatively major expenditure is required for recompletion.
recompletion. The completion for production an existing well bore in another formation from that in which the well has been previously completed.
reserve life. Proved reserves at a point in time divided by the then production rate (annual or quarterly).
royalty acreage. Acreage represented by a fee mineral or royalty interest which entitles the owner to receive free and clear of all production costs a specified portion of the oil and gas produced or a specified portion of the value of such production.
royalty interest. An interest in an oil and gas property entitling the owner to a share of oil and natural gas production free of costs of production.
Standardized Measure. The present value, discounted at 10%, of future net cash flows from estimated proved reserves after income taxes, calculated holding prices and costs constant at amounts in effect on the date of the report (unless such prices or costs are subject to change pursuant to contractual provisions) and otherwise in accordance with the Commission’s rules for inclusion of oil and gas reserve information in financial statements filed with the Commission.
working interest. The operating interest that gives the owner the right to drill, produce and conduct operating activities on the property and a share of production, subject to all royalties, overriding royalties and other burdens, and to all costs of exploration, development and operations, and all risks in connection therewith.
65
Table of Contents
Pursuant to the requirements of Section 13 or 15(d) of the Securities Exchange Act of 1934, the registrant has duly caused this report to be signed on its behalf by the undersigned, thereunto duly authorized.
| RANGE RESOURCES CORPORATION | ||||||
| Dated: February 22, 2012 | By: | /S/ JEFFREY L. VENTURA | ||||
| Jeffrey L. Ventura | ||||||
| President and Chief Executive Officer | ||||||
Pursuant to the requirements of the Securities Exchange Act of 1934, this report has been signed below by the following persons on behalf of the registrant and in the capacity and on the dates indicated.
| Signature |
Capacity |
Date | ||
| /s/ JEFFREY L. VENTURA |
Director, President and Chief Executive Officer | February 22, 2012 | ||
| Jeffrey L. Ventura |
||||
| /s/ JOHN H. PINKERTON |
Director, Executive Chairman of the Board | February 22, 2012 | ||
| John H. Pinkerton |
||||
| /s/ ROGER S. MANNY |
Executive Vice President and Chief Financial Officer | February 22, 2012 | ||
| Roger S. Manny |
||||
| /s/ DORI A. GINN |
Vice President, Controller and Principal Accounting Officer | February 22, 2012 | ||
| Dori A. Ginn |
||||
| /s/ CHARLES L. BLACKBURN |
Director | February 22, 2012 | ||
| Charles L. Blackburn |
||||
| /s/ ANTHONY V. DUB |
Director | February 22, 2012 | ||
| Anthony V. Dub |
||||
| /s/ V. RICHARD EALES |
Lead Independent Director | February 22, 2012 | ||
| V. Richard Eales |
||||
| /s/ ALLEN FINKELSON |
Director | February 22, 2012 | ||
| Allen Finkelson |
||||
| /s/ JAMES M. FUNK |
Director | February 22, 2012 | ||
| James M. Funk |
||||
| /s/ JONATHAN S. LINKER |
Director | February 22, 2012 | ||
| Jonathan S. Linker |
||||
| /s/ KEVIN S. MCCARTHY |
Director | February 22, 2012 | ||
| Kevin S. McCarthy |
||||
66
Table of Contents
RANGE RESOURCES CORPORATION
F-1
Table of Contents
MANAGEMENT’S REPORT ON INTERNAL CONTROL OVER FINANCIAL REPORTING
To the Stockholders of
Range Resources Corporation:
Management is responsible for establishing and maintaining adequate internal control over financial reporting (as defined in Rule 13a-15(f) under the Securities Exchange Act of 1934). Our internal control over financial reporting is designed to provide reasonable assurance to management and the board of directors regarding the preparation and fair presentation of published financial statements. Because of its inherent limitations, internal control over financial reporting may not prevent or detect misstatements. Also, projections of any evaluation of effectiveness to future periods are subject to the risk that controls may become inadequate because of changes in conditions, or that the degree of compliance with the policies or procedures may deteriorate. Therefore, even those systems determined to be effective can provide only reasonable assurance with respect to financial statement preparation and presentation. Management assessed the effectiveness of our internal control over financial reporting as of December 31, 2011. In making this assessment, management used the criteria set forth by the Committee of Sponsoring Organizations of the Treadway Commission (COSO) in Internal Control – Integrated Framework. Based on our assessment, we believe that, as of December 31, 2011, our internal control over financial reporting is effective based on those criteria.
Ernst and Young, LLP, the independent registered public accounting firm that audited our financial statements included in this annual report, has issued an attestation report on our internal control over financial reporting as of December 31, 2011. This report appears on the following page.
| By: | /s/ JEFFREY L. VENTURA | By: | /s/ ROGER S. MANNY | |||||
| Jeffrey L. Ventura President and Chief Executive Officer |
Roger S. Manny Executive Vice President and Chief Financial Officer | |||||||
Fort Worth, Texas
February 22, 2012
F-2
Table of Contents
REPORT OF INDEPENDENT REGISTERED PUBLIC
ACCOUNTING FIRM ON INTERNAL CONTROL OVER FINANCIAL REPORTING
To the Board of Directors and Stockholders of
Range Resources Corporation:
We have audited Range Resources Corporation’s internal control over financial reporting as of December 31, 2011, based on criteria established in Internal Control – Integrated Framework issued by the Committee of Sponsoring Organizations of the Treadway Commission (the COSO criteria). Range Resources Corporation’s management is responsible for maintaining effective internal control over financial reporting and for its assessment of the effectiveness of internal control over financial reporting included in the accompanying Management’s Report on Internal Control over Financial Reporting. Our responsibility is to express an opinion on the Company’s internal control over financial reporting based on our audit.
We conducted our audit in accordance with the standards of the Public Company Accounting Oversight Board (United States). Those standards require that we plan and perform the audit to obtain reasonable assurance about whether effective internal control over financial reporting was maintained in all material respects. Our audit included obtaining an understanding of internal control over financial reporting, assessing the risk that a material weakness exists, testing and evaluating the design and operating effectiveness of internal control based on the assessed risk, and performing such other procedures as we considered necessary in the circumstances. We believe that our audit provides a reasonable basis for our opinion.
A company’s internal control over financial reporting is a process designed to provide reasonable assurance regarding the reliability of financial reporting and the preparation of financial statements for external purposes in accordance with generally accepted accounting principles. A company’s internal control over financial reporting includes those policies and procedures that (1) pertain to the maintenance of records that, in reasonable detail, accurately and fairly reflect the transactions and dispositions of the assets of the company; (2) provide reasonable assurance that transactions are recorded as necessary to permit preparation of financial statements in accordance with generally accepted accounting principles, and that receipts and expenditures of the company are being made only in accordance with authorizations of management and directors of the company; and (3) provide reasonable assurance regarding prevention or timely detection of unauthorized acquisition, use, or disposition of the company’s assets that could have a material effect on the financial statements.
Because of its inherent limitations, internal control over financial reporting may not prevent or detect misstatements. Also, projections of any evaluation of effectiveness to future periods are subject to the risk that controls may become inadequate because of changes in conditions, or that the degree of compliance with the policies or procedures may deteriorate.
In our opinion, Range Resources Corporation maintained, in all material respects, effective internal control over financial reporting as of December 31, 2011, based on the COSO criteria.
We also have audited, in accordance with the standards of the Public Company Accounting Oversight Board (United States), the consolidated balance sheets of Range Resources Corporation as of December 31, 2011 and 2010 and the related consolidated statements of operations, stockholders’ equity, comprehensive income (loss) and cash flows for each of the three years in the period ended December 31, 2011 and our report dated February 22, 2012 expressed an unqualified opinion thereon.
/s/ Ernst & Young LLP
Fort Worth, Texas
February 22, 2012
F-3
Table of Contents
REPORT OF INDEPENDENT REGISTERED PUBLIC ACCOUNTING FIRM
To the Board of Directors and Stockholders of
Range Resources Corporation:
We have audited the accompanying consolidated balance sheets of Range Resources Corporation (the “Company”) as of December 31, 2011 and 2010, and the related consolidated statements of operations, stockholders’ equity, comprehensive income (loss) and cash flows for each of the three years in the period ended December 31, 2011. These consolidated financial statements are the responsibility of the Company’s management. Our responsibility is to express an opinion on these consolidated financial statements based on our audits.
We conducted our audits in accordance with the standards of the Public Company Accounting Oversight Board (United States). Those standards require that we plan and perform the audit to obtain reasonable assurance about whether the consolidated financial statements are free of material misstatement. An audit includes examining, on a test basis, evidence supporting the amounts and disclosures in the financial statements. An audit also includes assessing the accounting principles used and significant estimates made by management, as well as evaluating the overall financial statement presentation. We believe that our audits provide a reasonable basis for our opinion.
In our opinion, the consolidated financial statements referred to above present fairly, in all material respects, the consolidated financial position of Range Resources Corporation at December 31, 2011 and 2010, and the consolidated results of its operations and its cash flows for each of the three years in the period ended December 31, 2011, in conformity with U.S. generally accepted accounting principles.
As discussed in Note 20 to the consolidated financial statements, the Company has changed its reserve estimates and related disclosures as a result of the 2009 adoption of new oil and gas reserve estimation and disclosure requirements.
We also have audited, in accordance with the standards of the Public Company Accounting Oversight Board (United States), Range Resources Corporation’s internal control over financial reporting as of December 31, 2011, based on criteria established in Internal Control – Integrated Framework issued by the Committee of Sponsoring Organizations of the Treadway Commission and our report dated February 22, 2012 expressed an unqualified opinion thereon.
/s/ Ernst & Young LLP
Fort Worth, Texas
February 22, 2012
F-4
Table of Contents
RANGE RESOURCES CORPORATION
(In thousands, except per share data)
| December 31, | ||||||||
| 2011 | 2010 | |||||||
| Assets |
||||||||
| Current assets: |
||||||||
| Cash and cash equivalents |
$ | 92 | $ | 2,848 | ||||
| Accounts receivable, less allowance for doubtful accounts of $4,015 and $5,001 |
127,180 | 88,536 | ||||||
| Assets of discontinued operations |
— | 877,579 | ||||||
| Unrealized derivative gain |
173,921 | 123,255 | ||||||
| Inventory and other |
14,070 | 21,352 | ||||||
|
|
|
|
|
|||||
| Total current assets |
315,263 | 1,113,570 | ||||||
|
|
|
|
|
|||||
| Unrealized derivative gain |
77,579 | — | ||||||
| Equity method investments |
138,130 | 155,105 | ||||||
| Natural gas and oil properties, successful efforts method |
6,784,027 | 5,390,391 | ||||||
| Accumulated depletion and depreciation |
(1,626,461 | ) | (1,306,378 | ) | ||||
|
|
|
|
|
|||||
| 5,157,566 | 4,084,013 | |||||||
|
|
|
|
|
|||||
| Transportation and field assets |
123,349 | 134,980 | ||||||
| Accumulated depreciation and amortization |
(70,671 | ) | (60,931 | ) | ||||
|
|
|
|
|
|||||
| 52,678 | 74,049 | |||||||
|
|
|
|
|
|||||
| Other assets |
104,254 | 84,977 | ||||||
|
|
|
|
|
|||||
| Total assets |
$ | 5,845,470 | $ | 5,511,714 | ||||
|
|
|
|
|
|||||
| Liabilities |
||||||||
| Current liabilities: |
||||||||
| Accounts payable |
$ | 311,369 | $ | 289,109 | ||||
| Asset retirement obligations |
5,005 | 4,020 | ||||||
| Accrued liabilities |
109,109 | 71,935 | ||||||
| Liabilities of discontinued operations |
653 | 34,237 | ||||||
| Deferred tax liability |
56,595 | 11,848 | ||||||
| Accrued interest |
29,201 | 32,189 | ||||||
| Unrealized derivative loss |
— | 352 | ||||||
|
|
|
|
|
|||||
| Total current liabilities |
511,932 | 443,690 | ||||||
|
|
|
|
|
|||||
| Bank debt |
187,000 | 274,000 | ||||||
| Subordinated notes |
1,787,967 | 1,686,536 | ||||||
| Deferred tax liability |
710,490 | 672,041 | ||||||
| Unrealized derivative loss |
173 | 13,412 | ||||||
| Liabilities of discontinued operations |
— | 3,901 | ||||||
| Deferred compensation liability |
169,188 | 134,488 | ||||||
| Asset retirement obligations and other liabilities |
86,300 | 59,885 | ||||||
|
|
|
|
|
|||||
| Total liabilities |
3,453,050 | 3,287,953 | ||||||
|
|
|
|
|
|||||
| Commitments and contingencies |
||||||||
| Stockholders’ Equity |
||||||||
| Preferred stock, $1 par, 10,000,000 shares authorized, none issued and outstanding |
— | — | ||||||
| Common stock, $0.01 par, 475,000,000 shares authorized, 161,302,973 issued at December 31, 2011 and 160,113,608 issued at December 31, 2010 |
1,613 | 1,601 | ||||||
| Common stock held in treasury, 171,426 shares at December 31, 2011 and 204,556 shares at December 31, 2010 |
(6,343 | ) | (7,512 | ) | ||||
| Additional paid-in capital |
1,866,554 | 1,820,503 | ||||||
| Retained earnings |
373,969 | 341,699 | ||||||
| Accumulated other comprehensive income |
156,627 | 67,470 | ||||||
|
|
|
|
|
|||||
| Total stockholders’ equity |
2,392,420 | 2,223,761 | ||||||
|
|
|
|
|
|||||
| Total liabilities and stockholders’ equity |
$ | 5,845,470 | $ | 5,511,714 | ||||
|
|
|
|
|
|||||
See accompanying notes.
F-5
Table of Contents
RANGE RESOURCES CORPORATION
CONSOLIDATED STATEMENTS OF OPERATIONS
(In thousands, except per share data)
| Year Ended December 31, | ||||||||||||
| 2011 | 2010 | 2009 | ||||||||||
| Revenues and other income: |
||||||||||||
| Natural gas, NGLs and oil sales |
$ | 1,173,266 | $ | 823,290 | $ | 751,749 | ||||||
| Derivative fair value income |
40,087 | 51,634 | 66,446 | |||||||||
| Gain on the sale of assets |
2,260 | 76,642 | 10,413 | |||||||||
| Other |
3,043 | 70 | (9,442 | ) | ||||||||
|
|
|
|
|
|
|
|||||||
| Total revenues and other income |
1,218,656 | 951,636 | 819,166 | |||||||||
|
|
|
|
|
|
|
|||||||
| Costs and expenses: |
||||||||||||
| Direct operating |
112,972 | 96,274 | 98,251 | |||||||||
| Transportation, gathering and compression |
120,755 | 62,837 | 37,185 | |||||||||
| Production and ad valorem taxes |
27,666 | 26,107 | 25,536 | |||||||||
| Exploration |
81,367 | 60,506 | 44,276 | |||||||||
| Abandonment and impairment of unproved properties |
79,703 | 49,738 | 36,935 | |||||||||
| General and administrative |
151,191 | 140,571 | 115,319 | |||||||||
| Termination costs |
— | 8,452 | 2,479 | |||||||||
| Deferred compensation plan |
43,209 | (10,216 | ) | 31,073 | ||||||||
| Interest expense |
125,052 | 90,665 | 75,261 | |||||||||
| Loss on early extinguishment of debt |
18,576 | 5,351 | — | |||||||||
| Depletion, depreciation and amortization |
341,221 | 275,238 | 267,148 | |||||||||
| Impairment of proved properties |
38,681 | 6,505 | 930 | |||||||||
|
|
|
|
|
|
|
|||||||
| Total costs and expenses |
1,140,393 | 812,028 | 734,393 | |||||||||
|
|
|
|
|
|
|
|||||||
| Income from continuing operations before income taxes |
78,263 | 139,608 | 84,773 | |||||||||
| Income tax expense (benefit) |
||||||||||||
| Current |
637 | (836 | ) | (636 | ) | |||||||
| Deferred |
34,920 | 51,746 | 46,429 | |||||||||
|
|
|
|
|
|
|
|||||||
| 35,557 | 50,910 | 45,793 | ||||||||||
|
|
|
|
|
|
|
|||||||
| Income from continuing operations |
42,706 | 88,698 | 38,980 | |||||||||
| Discontinued operations, net of taxes |
15,320 | (327,954 | ) | (92,850 | ) | |||||||
|
|
|
|
|
|
|
|||||||
| Net income (loss) |
$ | 58,026 | $ | (239,256 | ) | $ | (53,870 | ) | ||||
|
|
|
|
|
|
|
|||||||
| Income (loss) per common share: |
||||||||||||
| Basic-income from continuing operations |
$ | 0.26 | $ | 0.56 | $ | 0.25 | ||||||
| -discontinued operations |
0.10 | (2.09 | ) | (0.60 | ) | |||||||
|
|
|
|
|
|
|
|||||||
| -net income (loss) |
$ | 0.36 | $ | (1.53 | ) | $ | (0.35 | ) | ||||
|
|
|
|
|
|
|
|||||||
| Diluted-income from continuing operations |
$ | 0.26 | $ | 0.55 | $ | 0.24 | ||||||
| -discontinued operations |
0.10 | (2.07 | ) | (0.58 | ) | |||||||
|
|
|
|
|
|
|
|||||||
| -net income (loss) |
$ | 0.36 | $ | (1.52 | ) | $ | (0.34 | ) | ||||
|
|
|
|
|
|
|
|||||||
| Weighted average common shares outstanding: |
||||||||||||
| Basic |
158,030 | 156,874 | 154,514 | |||||||||
| Diluted |
159,441 | 158,428 | 158,778 | |||||||||
See accompanying notes.
F-6
Table of Contents
RANGE RESOURCES CORPORATION
CONSOLIDATED STATEMENTS OF COMPREHENSIVE INCOME (LOSS)
(In thousands)
| December 31, | ||||||||||||
| 2011 | 2010 | 2009 | ||||||||||
| Net income (loss) |
$ | 58,026 | $ | (239,256 | ) | $ | (53,870 | ) | ||||
| Other comprehensive income (loss): |
||||||||||||
| Realized loss (gain) on hedge derivative contract settlements reclassified into earnings from other comprehensive income (loss), net of taxes |
(82,196 | ) | (39,931 | ) | (127,965 | ) | ||||||
| Change in unrealized deferred hedging gains (losses), net of taxes |
171,353 | 100,980 | 56,879 | |||||||||
|
|
|
|
|
|
|
|||||||
| Total comprehensive income (loss) |
$ | 147,183 | $ | (178,207 | ) | $ | (124,956 | ) | ||||
|
|
|
|
|
|
|
|||||||
See accompanying notes.
F-7
Table of Contents
RANGE RESOURCES CORPORATION
CONSOLIDATED STATEMENTS OF CASH FLOWS
(In thousands)
| Year Ended December 31, | ||||||||||||
| 2011 | 2010 | 2009 | ||||||||||
| Operating activities: |
||||||||||||
| Net income (loss) |
$ | 58,026 | $ | (239,256 | ) | $ | (53,870 | ) | ||||
| Adjustments to reconcile net income (loss) to net cash provided from operating activities: |
||||||||||||
| (Gain) loss from discontinued operations |
(15,320 | ) | 327,954 | 92,850 | ||||||||
| Loss (gain) from equity method investments, net of distributions |
16,871 | (7,366 | ) | 6,693 | ||||||||
| Deferred income tax expense |
34,920 | 51,746 | 46,429 | |||||||||
| Depletion, depreciation and amortization and proved property impairment |
379,902 | 281,743 | 268,078 | |||||||||
| Exploration dry hole costs |
3,888 | 3,700 | 2,159 | |||||||||
| Mark-to-market on natural gas and oil derivatives not designated as hedges (gain) loss |
(15,762 | ) | 2,086 | 115,909 | ||||||||
| Abandonment and impairment of unproved properties |
79,703 | 49,738 | 36,935 | |||||||||
| Unrealized derivative (gain) loss |
(2,183 | ) | (2,387 | ) | 1,696 | |||||||
| Allowance for bad debts |
946 | 3,608 | 1,351 | |||||||||
| Amortization of deferred financing costs, loss on extinguishment of debt and other |
25,458 | 10,072 | 8,755 | |||||||||
| Deferred and stock-based compensation |
86,979 | 34,964 | 73,402 | |||||||||
| Gain on the sale of assets and other |
(2,259 | ) | (76,642 | ) | (10,413 | ) | ||||||
| Changes in working capital: |
||||||||||||
| Accounts receivable |
(52,112 | ) | (6,512 | ) | 13,396 | |||||||
| Inventory and other |
865 | (333 | ) | (1,463 | ) | |||||||
| Accounts payable |
738 | 2,867 | (44,765 | ) | ||||||||
| Accrued liabilities and other |
9,540 | (2,096 | ) | (2,935 | ) | |||||||
|
|
|
|
|
|
|
|||||||
| Net cash provided from continuing operations |
610,200 | 433,886 | 554,207 | |||||||||
| Net cash provided from discontinued operations |
21,437 | 79,436 | 37,468 | |||||||||
|
|
|
|
|
|
|
|||||||
| Net cash provided from operating activities |
631,637 | 513,322 | 591,675 | |||||||||
|
|
|
|
|
|
|
|||||||
| Investing activities: |
||||||||||||
| Additions to natural gas and oil properties |
(1,199,545 | ) | (732,860 | ) | (356,329 | ) | ||||||
| Additions to field service assets |
(11,607 | ) | (14,944 | ) | (33,098 | ) | ||||||
| Acreage and proved property purchases |
(226,500 | ) | (296,503 | ) | (139,288 | ) | ||||||
| Investment in equity method investments and other assets |
— | (45 | ) | 7,076 | ||||||||
| Proceeds from disposal of assets |
53,926 | 327,765 | 234,076 | |||||||||
| Purchase of marketable securities held by the deferred compensation plan |
(25,388 | ) | (17,670 | ) | (7,470 | ) | ||||||
| Proceeds from the sales of marketable securities held by the deferred compensation plan |
20,410 | 19,572 | 6,079 | |||||||||
|
|
|
|
|
|
|
|||||||
| Net cash used in investing activities from continuing operations |
(1,388,704 | ) | (714,685 | ) | (288,954 | ) | ||||||
| Net cash provided from (used in) investing activities from discontinued operations |
840,723 | (84,173 | ) | (184,853 | ) | |||||||
|
|
|
|
|
|
|
|||||||
| Net cash used in investing activities |
(547,981 | ) | (798,858 | ) | (473,807 | ) | ||||||
|
|
|
|
|
|
|
|||||||
| Financing activities: |
||||||||||||
| Borrowing on credit facilities |
887,826 | 1,055,000 | 707,000 | |||||||||
| Repayment on credit facilities |
(974,826 | ) | (1,105,000 | ) | (1,076,000 | ) | ||||||
| Issuance of subordinated notes |
500,000 | 500,000 | 285,201 | |||||||||
| Repayment of subordinated notes |
(413,697 | ) | (202,458 | ) | — | |||||||
| Dividends paid |
(25,756 | ) | (25,574 | ) | (25,169 | ) | ||||||
| Debt issuance costs |
(22,003 | ) | (9,600 | ) | (6,399 | ) | ||||||
| Issuance of common stock |
619 | 5,903 | 12,737 | |||||||||
| Change in cash overdrafts |
(51,474 | ) | 64,100 | (22,370 | ) | |||||||
| Proceeds from the sales of common stock held by the deferred compensation plan |
12,899 | 5,246 | 7,201 | |||||||||
| Purchases of common stock held by the deferred compensation plan and other treasury stock purchases |
— | — | (55 | ) | ||||||||
|
|
|
|
|
|
|
|||||||
| Net cash (used in) provided from financing activities |
(86,412 | ) | 287,617 | (117,854 | ) | |||||||
|
|
|
|
|
|
|
|||||||
| (Decrease) increase in cash and cash equivalents |
(2,756 | ) | 2,081 | 14 | ||||||||
| Cash and cash equivalents at beginning of year |
2,848 | 767 | 753 | |||||||||
|
|
|
|
|
|
|
|||||||
| Cash and cash equivalents at end of year |
$ | 92 | $ | 2,848 | $ | 767 | ||||||
|
|
|
|
|
|
|
|||||||
See accompanying notes.
F-8
Table of Contents
RANGE RESOURCES CORPORATION
CONSOLIDATED STATEMENTS OF STOCKHOLDERS’ EQUITY
(In thousands, except per share data)
| Common stock | Treasury common stock |
Additional paid- in capital |
Retained earnings |
Accumulated
other comprehensive income (loss) |
Total | |||||||||||||||||||||||
| Shares | Par value | |||||||||||||||||||||||||||
| Balance as of December 31, 2008 |
155,609 | $ | 1,556 | $ | (8,557 | ) | $ | 1,695,268 | $ | 685,568 | $ | 77,507 | $ | 2,451,342 | ||||||||||||||
| Issuance of common stock |
2,727 | 27 | — | 57,574 | — | — | 57,601 | |||||||||||||||||||||
| Stock-based compensation expense |
— | — | — | 19,771 | — | — | 19,771 | |||||||||||||||||||||
| Common dividends declared ($0.16 per share) |
— | — | — | — | (25,169 | ) | — | (25,169 | ) | |||||||||||||||||||
| Treasury stock issuance |
— | — | 593 | (593 | ) | — | — | — | ||||||||||||||||||||
| Other comprehensive loss |
— | — | — | — | — | (71,086 | ) | (71,086 | ) | |||||||||||||||||||
| Net loss |
— | — | — | — | (53,870 | ) | — | (53,870 | ) | |||||||||||||||||||
|
|
|
|
|
|
|
|
|
|
|
|
|
|
|
|||||||||||||||
| Balance as of December 31, 2009 |
158,336 | 1,583 | (7,964 | ) | 1,772,020 | 606,529 | 6,421 | 2,378,589 | ||||||||||||||||||||
| Issuance of common stock |
1,778 | 18 | — | 26,138 | — | — | 26,156 | |||||||||||||||||||||
| Stock-based compensation expense |
— | — | — | 22,797 | — | — | 22,797 | |||||||||||||||||||||
| Common dividends declared ($0.16 per share) |
— | — | — | — | (25,574 | ) | — | (25,574 | ) | |||||||||||||||||||
| Treasury stock issuance |
— | — | 452 | (452 | ) | — | — | — | ||||||||||||||||||||
| Other comprehensive income |
— | — | — | — | — | 61,049 | 61,049 | |||||||||||||||||||||
| Net loss |
— | — | — | — | (239,256 | ) | — | (239,256 | ) | |||||||||||||||||||
|
|
|
|
|
|
|
|
|
|
|
|
|
|
|
|||||||||||||||
| Balance as of December 31, 2010 |
160,114 | 1,601 | (7,512 | ) | 1,820,503 | 341,699 | 67,470 | 2,223,761 | ||||||||||||||||||||
| Issuance of common stock |
1,189 | 12 | — | 8,870 | — | — | 8,882 | |||||||||||||||||||||
| Stock-based compensation expense |
— | — | — | 26,674 | — | — | 26,674 | |||||||||||||||||||||
| Tax benefit of stock compensation |
— | — | — | 11,676 | — | — | 11,676 | |||||||||||||||||||||
| Common dividends declared ($0.16 per share) |
— | — | — | — | (25,756 | ) | — | (25,756 | ) | |||||||||||||||||||
| Treasury stock issuance |
— | — | 1,169 | (1,169 | ) | — | — | — | ||||||||||||||||||||
| Other comprehensive income |
— | — | — | — | — | 89,157 | 89,157 | |||||||||||||||||||||
| Net income |
— | — | — | — | 58,026 | — | 58,026 | |||||||||||||||||||||
|
|
|
|
|
|
|
|
|
|
|
|
|
|
|
|||||||||||||||
| Balance as of December 31, 2011 |
161,303 | $ | 1,613 | $ | (6,343 | ) | $ | 1,866,554 | $ | 373,969 | $ | 156,627 | $ | 2,392,420 | ||||||||||||||
|
|
|
|
|
|
|
|
|
|
|
|
|
|
|
|||||||||||||||
See accompanying notes.
F-9
Table of Contents
RANGE RESOURCES CORPORATION
NOTES TO CONSOLIDATED FINANCIAL STATEMENTS
(1) SUMMARY OF ORGANIZATION AND NATURE OF BUSINESS
Range Resources Corporation (“Range,” “we,” “us,” or “our”) is a Fort Worth, Texas-based independent natural gas and oil company primarily engaged in the exploration, development and acquisition of natural gas properties in the Appalachian and Southwestern regions of the United States. Our objective is to build stockholder value through consistent growth in reserves and production on a cost-efficient basis. Range is a Delaware corporation with our common stock listed and traded on the New York Stock Exchange under the symbol “RRC.”
(2) SUMMARY OF SIGNIFICANT ACCOUNTING POLICIES
Basis of Presentation and Principles of Consolidation
The accompanying consolidated financial statements include the accounts of all of our subsidiaries. Investments in entities over which we have significant influence, but not control, are accounted for using the equity method of accounting and are carried at our share of net assets plus loans and advances. Income from equity method investments represents our proportionate share of income generated by equity method investees and is included in other revenues in the accompanying consolidated statements of operations. All material intercompany balances and transactions have been eliminated.
Discontinued Operations
During February 2011, we entered into an agreement to sell our Barnett Shale assets. Accordingly, in the first quarter 2011, we classified these assets and liabilities as discontinued operations in the accompanying consolidated balance sheets along with the historical results of the operations from such properties as discontinued operations, net of tax, in the accompanying statements of operations. See also Note 3 and Note 4 for more information regarding the sale of our Barnett Shale assets. Unless otherwise indicated, the information in these notes relate to our continuing operations.
Use of Estimates
The preparation of financial statements in accordance with generally accepted accounting principles in the United States requires us to make estimates and assumptions that affect the reported amounts of assets and liabilities, the disclosure of contingent assets and liabilities at year-end, the reported amounts of revenues and expenses during the year and the reported amount of proved natural gas, natural gas liquids (“NGLs”) and oil reserves. We base our estimates on historical experience and various other assumptions that we believe are reasonable under the circumstances, the results of which form the basis for making judgments that are not readily apparent from other sources. Actual results could differ from these estimates and changes in these estimates are recorded when known.
Reclassifications
Certain reclassifications have been made to prior years’ reported amounts in order to conform with the current year presentation. This includes the reclassification of transportation and gathering revenue into other revenue. These reclassifications did not impact our net income from continuing operations, stockholders’ equity or cash flows.
F-10
Table of Contents
Revision for Transportation, Gathering and Compression Expenses
As a result of our production growth and commencement of various transportation and gathering agreements in 2010 and 2011, we have revised our presentation of third party transportation and gathering costs to properly report such costs as a component of operating expenses in the accompanying statement of operations in accordance with Financial Accounting Standards Board (“FASB”) Section 605-45-05 of Subtopic 605-45 for Revenue Recognition. Previously, these costs were reflected as a component of natural gas, NGLs and oil sales. For more information on the accounting for these agreements, see Revenue Recognition, Gas Imbalances and Receivables below. We have concluded that this revision is not material to our financial statements and the net effect of these revisions did not impact our net income, stockholders’ equity or cash flows; however, previously reported natural gas, NGL and oil sales have increased and total operating expenses have increased by the same amount. The following reflects the revisions made (in thousands):
| 2010 | 2009 | |||||||
| Natural gas, NGL and oil sales, previously reported |
$ | 760,453 | $ | 714,564 | ||||
| Revision of transportation, gathering and compression expenses |
62,837 | 37,185 | ||||||
|
|
|
|
|
|||||
| Natural gas, NGL and oil sales, reported |
$ | 823,290 | $ | 751,749 | ||||
|
|
|
|
|
|||||
The corresponding amounts have been reflected in transportation, gathering and compression expenses for 2010 and 2009 as shown below (in thousands):
| 2010 | 2009 | |||||||
| Transportation, gathering and compression expenses, previously reported |
$ | — | $ | — | ||||
| Revision of transportation, gathering and compression expenses |
62,837 | 37,185 | ||||||
|
|
|
|
|
|||||
| Transportation, gathering and compression, reported |
$ | 62,837 | $ | 37,185 | ||||
|
|
|
|
|
|||||
Income per Common Share
Basic income (loss) per common share is calculated based on the weighted average number of common shares outstanding. Diluted income (loss) per common share assumes issuance of stock compensation awards, provided the effect is not antidilutive.
Business Segment Information
We have evaluated how we are organized and managed and have identified only one operating segment, which is the exploration and production of natural gas, NGLs and oil. We consider our gathering, processing and marketing functions as ancillary to our natural gas and oil producing activities. Operating segments are defined as components of an enterprise that engage in activities from which it may earn revenues and incur expenses for which separate operational financial information is available and this information is regularly evaluated by the chief operating decision maker for the purpose of allocating resources and assessing performance.
We have a single company-wide management team that administers all properties as a whole rather than by discrete operating segments. We track only basic operational data by area. We do not maintain complete separate financial statement information by area. We measure financial performance as a single enterprise and not on an area-by-area basis. Throughout the year, we allocate capital resources on a project-by-project basis, across our entire asset base to maximize profitability without regard to individual areas or segments.
Revenue Recognition, Gas Imbalances and Receivables
Natural gas, NGL and oil sales are recognized when the products are sold and delivery to the purchaser has occurred. We generally sell natural gas, NGLs and oil under two types of agreements, which are common in our industry. Both types of agreements include transportation charges. As described in the revision section above, we are reporting our gathering and transportation costs in accordance with FASB Section 605-45-05 of Subtopic 605-45 for Revenue Recognition. One type of agreement is a netback arrangement, under which we sell natural gas and oil at the wellhead and collect a price, net of transportation incurred by the purchaser. In this case, we record revenue at the price we received from the purchaser. In the case of NGLs, we generally receive a net price from the purchaser (which is net of processing costs) which is also recorded in revenue at the net price we generally receive from the purchaser. Under the other arrangement, we sell natural gas or oil at a specific delivery point, pay transportation expenses to a third party and receive proceeds from the purchaser with no transportation deduction. In that case, we record revenue at the price received from the purchaser and record the expenses we incur as transportation, gathering and compression expense.
F-11
Table of Contents
Although receivables are concentrated in the oil and gas industry, we do not view this as an unusual credit risk. We provide for an allowance for doubtful accounts for specific receivables judged unlikely to be collected based on the age of the receivable, our experience with the debtor, potential offsets to the amount owed and economic conditions. In certain instances, we require purchasers to post stand-by letters of credit. Many of our receivables are from joint interest owners of properties we operate. Thus, we may have the ability to withhold future revenue disbursements to recover any non-payment of joint interest billings. We have allowances for doubtful accounts relating to exploration and production receivables of $4.0 million at December 31, 2011 compared to $5.0 million at December 31, 2010. During the year ended 2011, we recorded bad debt expense of $946,000 compared to $3.6 million in 2010 and $1.4 million in 2009.
We use the sales method to account for gas imbalances, recognizing revenue based on gas delivered rather than our working interest share of the gas produced. A liability is recognized when the imbalance exceeds the estimate of remaining reserves. At December 31, 2011, we had recorded a net liability of $50,000 for those wells where it was determined that there were insufficient reserves to recover the imbalance situation.
Cash and Cash Equivalents
Cash and cash equivalents include cash on hand and on deposit and investments in highly liquid debt instruments with maturities of three months or less.
Marketable Securities
Investments in unaffiliated equity securities held in our deferred compensation plans qualify as trading securities and are recorded at fair value. Investments held in the deferred compensation plans consist of various publicly-traded mutual funds. These funds are made up of investments which include equity securities and money market instruments.
Inventories
Inventories consist primarily of tubular goods used in our operations and are stated at the lower of specific cost of each inventory item or market, on a first-in, first-out basis. Our inventory is primarily acquired for use in future drilling operations or repair operations. In 2011, we sold tubular goods and other inventory for proceeds of $8.0 million and recorded a gain of $359,000.
Natural Gas and Oil Properties
We follow the successful efforts method of accounting for natural gas and oil producing activities. Costs to drill exploratory wells that do not find proved reserves, geological and geophysical costs, delay rentals and costs of carrying and retaining unproved properties are expensed. Costs incurred for exploratory wells that find reserves that cannot yet be classified as proved are capitalized if (a) the well has found a sufficient quantity of reserves to justify its completion as a producing well and (b) we are making sufficient progress assessing the reserves and the economic and operating viability of the project. The status of suspended well costs is monitored continuously and reviewed not less than quarterly. We capitalize successful exploratory wells and all developmental wells, whether successful or not. NGLs and oil are converted to gas equivalent basis or mcfe at the rate of one barrel of oil equating to 6 mcf of natural gas which is based upon the approximated relative energy content of oil to natural gas, which is not necessarily indicative of the relationship of oil and natural gas prices. Depreciation, depletion and amortization of proved producing properties is provided on the units of production method. Historically, we have adjusted our depletion rates in the fourth quarter of each year based on the year-end reserve report and other times during the year when circumstances indicate there has been a significant change in reserves or costs. We adopted the new SEC accounting and disclosure regulations for oil and gas companies effective December 31, 2009. Accounting Standards Codification (ASC) 2010-3 clarified that the effect of the change in price encompassed in the new SEC rules was a change in accounting principle inseparable from a change in estimate for 2009 and was accounted for prospectively. For 2009, we estimated the effect of this change in estimate increased depletion, depreciation and amortization expense by approximately $3.4 million ($2.2 million after tax) primarily due to lower prices reflected in our estimated reserves.
Our natural gas and oil producing properties are reviewed for impairment periodically as events or changes in circumstances indicate that the carrying amount of an asset may not be recoverable. These assets are reviewed for potential impairments at the lowest levels for which there are identifiable cash flows that are largely independent of other groups of assets. The review is done by determining if the historical cost of proved properties less the applicable accumulated depreciation, depletion and amortization is less than the estimated expected undiscounted future net cash flows. The expected future net cash flows are estimated based on our plans to produce and develop reserves. Expected future net cash inflow from the sale of produced reserves is calculated based on estimated future prices and estimated operating and development costs. We estimate prices based upon market related information including published futures prices. The estimated future level of production is based on assumptions surrounding future levels of prices and costs, field decline rates, market demand and supply, and the economic and regulatory climates. In certain circumstances, we also consider potential sales of properties to third parties in our estimates of cash flows. When the carrying value exceeds the sum of future net cash flows, an impairment loss is recognized for the
F-12
Table of Contents
difference between the estimated fair market value (as determined by discounted future net cash flows using a discount rate similar to that used by market participants) and the carrying value of the asset. A significant amount of judgment is involved in performing these evaluations since the results are based on estimated future events. Such events include a projection of future natural gas and oil prices, an estimate of the ultimate amount of recoverable natural gas and oil reserves that will be produced from an asset group, the timing of future production, future production costs, future abandonment costs and future inflation. We cannot predict whether impairment charges may be required in the future. If natural gas, NGLs and oil prices decrease or drilling efforts are unsuccessful, we may be required to record additional impairments. For additional information regarding proved property impairments, see Note 12.
Proceeds from the disposal of natural gas and oil producing properties that are part of an amortization group are credited to the net book value of the amortization group with no immediate effect on income. However, gain or loss is recognized if the disposition is significant enough to materially impact the depletion rate of the remaining properties in the amortization base.
We evaluate our unproved property investment periodically for impairment. The majority of these costs generally relate to the acquisition of leasehold costs. The costs are capitalized and evaluated (at least quarterly) as to recoverability, based on changes brought about by economic factors and potential shifts in business strategy employed by management. Impairment of a significant portion of our unproved properties is assessed and amortized on an aggregate basis based on our average holding period, expected forfeiture rate and anticipated drilling success. Impairment of individually significant unproved property is assessed on a property-by-property basis considering a combination of time, geologic and engineering factors. Unproved properties had a net book value of $748.6 million in 2011 compared to $648.1 million in 2010. Assets of discontinued operations include unproved properties of $163.7 million at December 31, 2010. We have recorded abandonment and impairment expense related to unproved properties from continuing operations of $79.7 million in 2011 compared to $49.7 million in 2010 and to $36.9 million in 2009.
Transportation and Field Assets
Our gas transportation and gathering systems are generally located in proximity to certain of our principal fields. Depreciation on these pipeline systems is provided on the straight-line method based on estimated useful lives of 10 to 15 years. We receive third-party income for providing field service and certain transportation services, which is recognized as earned. Depreciation on the associated assets is calculated on the straight-line method based on estimated useful lives ranging from five to seven years. Transportation and field assets also includes other property and equipment such as buildings, furniture and fixtures, leasehold improvements, data processing and communication equipment. These items are generally depreciated by individual components on a straight line basis over their economic useful life, which is generally from 3 to 15 years. Leasehold improvements are amortized over the lesser of their economic useful lives or the underlying terms of the associated leases. Depreciation expense was $16.2 million in 2011 compared to $16.1 million in 2010 and $31.6 million in 2009. The fourth quarter 2009 includes accelerated depreciation expense of $10.3 million related to an interim processing plant in our Appalachian region that was dismantled in first quarter 2010 and replaced with permanent facilities.
Other Assets
The expenses of issuing debt are capitalized and included in other assets in the accompanying consolidated balance sheets. These costs are amortized over the expected life of the related instruments. When a security is retired before maturity or modifications significantly change the cash flows, related unamortized costs are expensed. Other assets at December 31, 2011 include $39.4 million of unamortized debt issuance costs, $50.2 million of marketable securities held in our deferred compensation plans and $14.4 million of other investments including land.
Accounts Payable
Included in accounts payable at December 31, 2011 and 2010, are liabilities of approximately $45.7 million and $97.2 million representing the amount by which checks issued, but not presented to our banks for collection, exceeded balances in our applicable bank accounts.
Stock-based Compensation Arrangements
The fair value of stock options and stock-settled SARs is estimated on the date of grant using the Black-Scholes-Merton option-pricing model. The model employs various assumptions, based on management’s best estimates at the time of the grant, which impact the fair value calculated and ultimately, the expense that is recognized over the life of the award. We have utilized historical data and analyzed current information to reasonably support these assumptions. The fair value of restricted stock awards (“Liability Awards”) and restricted stock unit awards (“Equity Awards”) is determined based on the fair market value of our common stock on the date of grant.
F-13
Table of Contents
We recognize stock-based compensation expense on a straight-line basis over the requisite service period for the entire award. The expense we recognize is net of estimated forfeitures. We estimate our forfeiture rate based on prior experience and adjust it as circumstances warrant. Substantially all Liability Awards are deposited in our deferred compensation plans at the time of grant and are classified as a liability due to the fact that these awards are expected to be settled wholly or partially in cash. The fair value of the Liability Awards is updated at each balance sheet date with changes in the fair value of the vested portion of the awards recorded as increases or decreases to deferred compensation plan expense in the accompanying statement of operations.
Derivative Financial Instruments and Hedging
All of our derivative instruments are issued to manage the price risk attributable to our expected natural gas, NGLs and oil production. While there is risk that the financial benefit of rising natural gas, NGLs and oil prices may not be captured, we believe the benefits of stable and predictable cash flow are more important. Among these benefits are more efficient utilization of existing personnel and planning for future staff additions, the flexibility to enter into long-term projects requiring substantial committed capital, smoother and more efficient execution of our ongoing development drilling and production enhancement programs, more consistent returns on invested capital and better access to bank and other capital markets. Every unsettled derivative instrument is recorded on the accompanying consolidated balance sheets as either an asset or a liability measured at its fair value. Changes in a derivative’s fair value are recognized in earnings unless specific hedge accounting criteria are met. Cash flows from derivative contract settlements are reflected in operating activities in the accompanying consolidated statements of cash flows.
Through December 2011, we have elected to designate our commodity derivative instruments that qualify for hedge accounting as cash flow hedges. To designate a derivative as a cash flow hedge, we document at the hedge’s inception our assessment that the derivative will be highly effective in offsetting expected changes in cash flows from the item hedged. This assessment, which is updated at least quarterly, is generally based on the most recent relevant historical correlation between the derivative and the item hedged. The ineffective portion of the hedge is calculated as the difference between the change in fair value of the derivative and the estimated change in cash flows from the item hedged. If, during the derivative’s term, we determine the hedge is no longer highly effective, hedge accounting is prospectively discontinued and any remaining unrealized gains or losses, based on the effective portion of the derivative at that date, are reclassified to earnings as natural gas, NGLs and oil sales when the underlying transaction occurs. If it is determined that the designated hedged transaction is probable to not occur, any unrealized gains or losses is recognized immediately in derivative fair value income in the accompanying consolidated statements of operations. During 2010, we recognized a pre-tax gain of $11.6 million compared to a pre-tax gain of $5.4 million in 2009 as a result of the discontinuance of hedge accounting treatment for certain of our derivatives. In 2011, we did not discontinue hedge accounting on any of our hedges.
We apply hedge accounting to qualifying derivatives (or “hedge derivatives”) used to manage price risk associated with our natural gas, NGLs and oil production. Accordingly, we record changes in the fair value of our hedge derivative contracts, including changes associated with time value, in accumulated other comprehensive income (“AOCI”) in the stockholders’ equity section of the accompanying consolidated balance sheets. Gains or losses on these hedge derivative contracts are reclassified out of AOCI and into natural gas, NGLs and oil sales when the underlying physical transaction occurs and the hedging contract is settled. Any hedge ineffectiveness associated with a contract qualifying and designated as a cash flow hedge (which represents the amount by which the change in the fair value of the derivative differs from the change in the cash flows of the forecasted sale of production) is reported currently each period in derivative fair value income on the accompanying consolidated statement of operations. Ineffectiveness can be associated with open positions (unrealized) or can be associated with closed contracts (realized).
Realized and unrealized gains and losses on derivatives that are not designated as hedges (or “non-hedge derivatives”) are accounted for using the mark-to-market accounting method. We recognize all unrealized and realized gains and losses related to these contracts in each period in derivative fair value income in the accompanying consolidated statements of operations. At times, we have also entered into basis swap agreements which do not qualify for hedge accounting and are marked to market. The price we receive for our gas production can be more or less than the NYMEX price because of adjustments for delivery location (“basis”), relative quality and other factors; therefore, we may enter into basis swap agreement that effectively fix our basis adjustments.
Asset Retirement Obligations
The fair value of asset retirement obligations is recognized in the period they are incurred, if a reasonable estimate of fair value can be made. Asset retirement obligations primarily relate to the abandonment of natural gas and oil producing facilities and include costs to dismantle and relocate or dispose of production platforms, gathering systems, wells and related structures. Estimates are based on historical experience of plugging and abandoning wells, estimated remaining lives of those wells based on reserve estimates, external estimates as to the cost to plug and abandon the wells in the future and federal and state regulatory requirements. Depreciation of capitalized asset retirement costs and accretion of asset retirement obligations are recorded over time. The depreciation will generally be determined on a units-of-production basis while accretion to be recognized will escalate over the life of the producing assets.
F-14
Table of Contents
Deferred Taxes
Deferred tax assets and liabilities are recognized for the estimated future tax consequences attributable to the differences between the financial statement carrying amounts of assets and liabilities and their tax bases as reported in our filings with the respective taxing authorities. Deferred tax assets are recorded when it is more likely than not that they will be realized. The realization of deferred tax assets is assessed periodically based on several interrelated factors. These factors include our expectation to generate sufficient taxable income including tax credits and operating loss carryforwards. We do not recognize a deferred tax asset for excess tax benefits that have not been realized.
Accumulated Other Comprehensive Income
The following details the components of AOCI and related tax effects for the three years ended December 31, 2011. Amounts included in AOCI relate to our derivative activity (in thousands).
| Gross | Tax Effect | Net of Tax | ||||||||||
| Accumulated other comprehensive income at December 31, 2008 |
$ | 122,252 | $ | (44,745 | ) | $ | 77,507 | |||||
| Contract settlements reclassified to income |
(203,119 | ) | 75,154 | (127,965 | ) | |||||||
| Change in unrealized deferred hedging gains |
91,059 | (34,180 | ) | 56,879 | ||||||||
|
|
|
|
|
|
|
|||||||
| Accumulated other comprehensive income at December 31, 2009 |
10,192 | (3,771 | ) | 6,421 | ||||||||
| Contract settlements reclassified to income |
(64,772 | ) | 24,841 | (39,931 | ) | |||||||
| Change in unrealized deferred hedging gains |
165,642 | (64,662 | ) | 100,980 | ||||||||
|
|
|
|
|
|
|
|||||||
| Accumulated other comprehensive income at December 31, 2010 |
111,062 | (43,592 | ) | 67,470 | ||||||||
| Contract settlements reclassified to income |
(132,201 | ) | 50,005 | (82,196 | ) | |||||||
| Change in unrealized deferred hedging gains |
275,817 | (104,464 | ) | 171,353 | ||||||||
|
|
|
|
|
|
|
|||||||
| Accumulated other comprehensive income at December 31, 2011 |
$ | 254,678 | $ | (98,051 | ) | $ | 156,627 | |||||
|
|
|
|
|
|
|
|||||||
Accounting Pronouncements Implemented
Recently Adopted
In June 2011, the FASB issued Accounting Standards Update (“ASU”) No. 201-05, “Presentation of Comprehensive Income,” which was issued to enhance comparability between entities that report under U.S. GAAP and International Financial Reporting Standards (“IFRS”), and to provide a more consistent method of presenting non-owner transactions that affect an entity’s equity. ASU 2011-05 eliminates the option to report other comprehensive income and its components in the statement of changes in stockholders’ equity and requires an entity to present the total of comprehensive income, the components of net income and the components of other comprehensive income either in a single continuous statement or in two separate but consecutive statements. This pronouncement is effective for fiscal years, and interim periods within those years, beginning after December 15, 2011. Early adoption of the new guidance is permitted and full retrospective application is required. We adopted this new requirement in third quarter 2011 and since ASU 2011-05 only amended presentation requirements, it did not have a material effect on our consolidated financial statements.
Accounting Pronouncements Not Yet Adopted
In May 2011, the FASB issued ASU No. 2011-04, “Amendments to Achieve Common Fair Value Measurement and Disclosure Requirements in U.S. GAAP and IFRS.” This pronouncement was issued to provide a consistent definition of fair value and ensure that the fair value measurement and disclosure requirements are similar between U.S. GAAP and IFRS. ASU 2011-04 changes certain fair value measurement principles and enhances the disclosure requirements, particularly for Level 3 fair value measurements. This pronouncement is effective for reporting periods beginning on or after December 15, 2011, with early adoption prohibited. The new guidance will require prospective application. The adoption of ASU 2011-04 is not expected to have a material effect on our consolidated financial statements, but may require additional disclosures.
F-15
Table of Contents
(3) DISPOSITIONS AND ACQUISITIONS
2011 Dispositions
In February 2011, we entered into an agreement to sell substantially all of our Barnett Shale properties located in North Central Texas (Dallas, Denton, Ellis, Hill, Hood, Johnson, Parker, Tarrant and Wise Counties), which also included the assumption of certain derivative contracts by the buyer and was subject to normal post-closing adjustments. We closed substantially all of this sale in April 2011 and closed the remainder in August 2011. The gross cash proceeds were approximately $889.3 million, including certain derivative contracts assumed by the buyer. The agreements had a February 1, 2011 effective date and consequently operating net revenues after February 2011 were a downward adjustment to the sales price. We recorded a pretax gain of $4.8 million in discontinued operations related to this sale. In the accompanying December 31, 2010 balance sheet, we have classified these assets and liabilities as discontinued operations. As indicated in Notes 2 and 4, the historic results of our Barnett Shale operations are presented as discontinued operations.
As part of the sale of our Barnett Shale properties, certain derivative contracts were assumed by the buyer. We received proceeds of $40.0 million for these derivative contracts and recorded a loss of $1.7 million in second quarter 2011, which is included in continuing operations. As required by cash flow hedge accounting rules, a $25.1 million pretax gain in AOCI related to these hedges was recognized in earnings during 2011 as the hedged production occurred. The hedges assumed by the buyer as part of the sale were not designated to our Barnett Shale production and were sold to balance our volumes hedged.
In fourth quarter 2011, we exchanged unproved property in Ohio for unproved property in Pennsylvania where we also received $11.5 million in cash as part of the transaction. We recorded a $4.5 million gain related to this transaction. In third quarter 2011, we sold various producing properties located in East Texas for proceeds of $10.5 million. We recognized an impairment charge of $31.2 million in third quarter 2011 related to these East Texas properties. For additional information on this impairment, see Note 12. Also in third quarter 2011, we sold producing properties in Pennsylvania for proceeds of $5.4 million, with no gain or loss recognized, as the sale did not materially impact the depletion rate of the remaining properties in the amortization base. In the first quarter 2011, we sold a low pressure pipeline for $14.7 million in proceeds, with no gain or loss recognized.
2010 Dispositions
In February 2010, we entered into an agreement to sell our tight gas sand properties in Ohio. We closed approximately 90% of the sale in March 2010 and closed the remainder in June 2010. The total proceeds we received were approximately $323.0 million and we recorded a gain of $77.6 million. The agreement had an effective date of January 1, 2010, and consequently operating net revenue after January 1, 2010 was a downward adjustment to the selling price. The proceeds we received were placed in a like-kind exchange account and in June 2010, we used a portion of the proceeds to purchase proved and unproved natural gas properties in Virginia. In September 2010, the like-kind exchange account was closed and the remaining balance of $135.0 million was used to repay amounts outstanding under our credit facility.
2009 Dispositions
In second quarter 2009, we sold certain oil properties located in West Texas for proceeds of $181.8 million. In fourth quarter 2009, we sold natural gas properties in New York for proceeds of $36.3 million. The proceeds from the sale of these properties were credited to natural gas and oil properties, with no gain or loss recognized, as the dispositions did not materially impact the depletion rate of the remaining properties in the amortization base. Additionally, in fourth quarter 2009, we sold Marcellus Shale acreage for $11.2 million and we recognized a gain of $10.4 million.
Acquisitions
Acquisitions are accounted for as purchases and, accordingly, the results of operations are included in the accompanying statements of operations from the closing date of the acquisition. Purchase prices are allocated to acquired assets and assumed liabilities based on their estimated fair value at the time of the acquisition. In the past, acquisitions have been funded with internal cash flow, bank borrowings and the issuance of debt and equity securities.
In June 2010, we purchased proved and unproved natural gas properties in Virginia for approximately $134.5 million. After recording asset retirement obligations, the purchase price allocated $131.3 million to proved property and $3.7 million to unproved property. We used proceeds from our like-kind exchange account to fund this acquisition (see 2010 Dispositions above). No pro forma information has been provided as the acquisition was not considered significant.
F-16
Table of Contents
(4) DISCONTINUED OPERATIONS
The following table represents the components of our Barnett Shale operations as discontinued operations for the years ended December 31, 2011, 2010 and 2009 (in thousands).
| Year Ended December 31, | ||||||||||||
| 2011 | 2010 | 2009 | ||||||||||
| Revenues and other income: |
||||||||||||
| Natural gas, NGL and oil sales |
$ | 59,185 | $ | 157,778 | $ | 139,357 | ||||||
| Transportation and gathering |
6 | 35 | — | |||||||||
| Gain on the sale of assets |
4,771 | 955 | — | |||||||||
| Other |
4 | 32 | 3 | |||||||||
|
|
|
|
|
|
|
|||||||
| Total revenues and other income |
63,966 | 158,800 | 139,360 | |||||||||
|
|
|
|
|
|
|
|||||||
| Costs and expenses: |
||||||||||||
| Direct operating |
10,080 | 35,328 | 34,960 | |||||||||
| Transportation, gathering and compression |
5,257 | 8,624 | 14,000 | |||||||||
| Production and ad valorem taxes |
1,309 | 7,545 | 6,633 | |||||||||
| Exploration |
37 | 581 | 2,209 | |||||||||
| Abandonment and impairment of unproved properties |
— | 20,233 | 76,603 | |||||||||
| Interest expense (a) |
14,791 | 40,527 | 42,106 | |||||||||
| Depletion, depreciation and amortization |
8,894 | 88,269 | 106,354 | |||||||||
| Impairment of proved properties |
— | 463,244 | — | |||||||||
|
|
|
|
|
|
|
|||||||
| Total costs and expenses |
40,368 | 664,351 | 282,865 | |||||||||
|
|
|
|
|
|
|
|||||||
| Income (loss) before income taxes |
23,598 | (505,551 | ) | (143,505 | ) | |||||||
| Income tax expense (benefit) |
||||||||||||
| Current |
— | — | — | |||||||||
| Deferred |
8,278 | (177,597 | ) | (50,655 | ) | |||||||
|
|
|
|
|
|
|
|||||||
| 8,278 | (177,597 | ) | (50,655 | ) | ||||||||
|
|
|
|
|
|
|
|||||||
| Net income (loss) from discontinued operations |
$ | 15,320 | $ | (327,954 | ) | $ | (92,850 | ) | ||||
|
|
|
|
|
|
|
|||||||
| (a) | Interest expense is allocated to discontinued operations based on the ratio of net assets of discontinued operations to our consolidated net assets plus long-term debt. |
F-17
Table of Contents
The carrying values of our Barnett operations were included in discontinued operations in the accompanying consolidated balance sheets, which is comprised of the following (in thousands):
| December 31, | ||||||||
| 2011 | 2010 | |||||||
| Composition of assets of discontinued operations: |
||||||||
| Natural gas properties and oil properties, net |
$ | — | $ | 838,044 | ||||
| Transportation and field assets, net |
— | 684 | ||||||
| Accounts receivable |
— | 30,575 | ||||||
| Unrealized derivative gain |
— | 8,195 | ||||||
| Inventory and other |
— | 81 | ||||||
|
|
|
|
|
|||||
| Total current assets of discontinued operations |
$ | — | $ | 877,579 | ||||
|
|
|
|
|
|||||
| Composition of liabilities of discontinued operations: |
||||||||
| Accounts payable |
$ | — | $ | 23,366 | ||||
| Accrued liabilities |
653 | 10,871 | ||||||
| Asset retirement obligations |
— | — | ||||||
|
|
|
|
|
|||||
| Total current liabilities of discontinued operations |
$ | 653 | $ | 34,237 | ||||
|
|
|
|
|
|||||
| Asset retirement obligations |
$ | — | $ | 1,980 | ||||
| Other liabilities |
— | 1,921 | ||||||
|
|
|
|
|
|||||
| Total long-term liabilities of discontinued operations |
$ | — | $ | 3,901 | ||||
|
|
|
|
|
|||||
(5) INCOME TAXES
Our income tax expense from continuing operations was $35.6 million for the year ended December 31, 2011 compared to $50.9 million in 2010 and $45.8 million in 2009. Reconciliation between the statutory federal income tax rate and our effective income tax rate is as follows:
| Year Ended December 31, | ||||||||||||
| 2011 | 2010 | 2009 | ||||||||||
| Federal statutory tax rate |
35.0 | % | 35.0 | % | 35.0 | % | ||||||
| State |
7.0 | (0.2 | ) | 20.6 | ||||||||
| Non-deductible executive compensation |
3.5 | 0.2 | — | |||||||||
| Valuation allowance |
(0.4 | ) | 1.4 | (1.9 | ) | |||||||
| Other |
0.3 | 0.1 | 0.3 | |||||||||
|
|
|
|
|
|
|
|||||||
| Consolidated effective tax rate |
45.4 | % | 36.5 | % | 54.0 | % | ||||||
|
|
|
|
|
|
|
|||||||
F-18
Table of Contents
Income tax provision attributable to income from continuing operations before income taxes consists of the following:
| Year Ended December 31, | ||||||||||||
| 2011 | 2010 | 2009 | ||||||||||
| (in thousands) | ||||||||||||
| Current: |
||||||||||||
| U.S. federal |
$ | — | $ | — | $ | (1,000 | ) | |||||
| U.S. state and local |
637 | (836 | ) | 364 | ||||||||
|
|
|
|
|
|
|
|||||||
| $ | 637 | $ | (836 | ) | $ | (636 | ) | |||||
|
|
|
|
|
|
|
|||||||
| Deferred: |
||||||||||||
| U.S. federal |
$ | 30,055 | $ | 51,280 | $ | 29,085 | ||||||
| U.S. state and local |
4,865 | 466 | 17,344 | |||||||||
|
|
|
|
|
|
|
|||||||
| $ | 34,920 | $ | 51,746 | $ | 46,429 | |||||||
|
|
|
|
|
|
|
|||||||
| Total income tax expense |
$ | 35,557 | $ | 50,910 | $ | 45,793 | ||||||
|
|
|
|
|
|
|
|||||||
Significant components of deferred tax assets and liabilities are as follows:
| December 31, | ||||||||
| 2011 | 2010 | |||||||
| (in thousands) | ||||||||
| Deferred tax assets: |
||||||||
| Current |
||||||||
| Deferred compensation |
$ | 8,607 | $ | 5,857 | ||||
| Current portion of asset retirement obligation |
2,011 | 1,579 | ||||||
| Other |
1,423 | 4,106 | ||||||
| Current portion of net operating loss carryforward |
— | 17,586 | ||||||
|
|
|
|
|
|||||
| Total current |
12,041 | 29,128 | ||||||
|
|
|
|
|
|||||
| Non-current |
||||||||
| Net operating loss carryforward |
63,568 | 85,120 | ||||||
| Deferred compensation |
64,176 | 49,933 | ||||||
| AMT credits and other credits |
3,505 | 3,211 | ||||||
| Non-current portion of asset retirement obligation |
30,358 | 23,127 | ||||||
| Cumulative unrealized mark-to-market loss |
2,373 | 9,826 | ||||||
| Other |
22,076 | 23,481 | ||||||
| Valuation allowance |
(4,534 | ) | (4,841 | ) | ||||
|
|
|
|
|
|||||
| Total non-current |
181,522 | 189,857 | ||||||
|
|
|
|
|
|||||
| Deferred tax liabilities: |
||||||||
| Current |
||||||||
| Net unrealized gain in AOCI related to hedge derivatives |
(68,636 | ) | (40,976 | ) | ||||
|
|
|
|
|
|||||
| Total current |
(68,636 | ) | (40,976 | ) | ||||
|
|
|
|
|
|||||
| Non-current |
||||||||
| Depreciation, depletion and investments |
(862,597 | ) | (858,502 | ) | ||||
| Net unrealized gain in AOCI related to hedge derivatives |
(29,415 | ) | (2,616 | ) | ||||
| Other |
— | (780 | ) | |||||
|
|
|
|
|
|||||
| Total non-current |
(892,012 | ) | (861,898 | ) | ||||
|
|
|
|
|
|||||
| Net deferred tax liability |
$ | (767,085 | ) | $ | (683,889 | ) | ||
|
|
|
|
|
|||||
F-19
Table of Contents
At December 31, 2011, deferred tax liabilities exceeded deferred tax assets by $767.1 million, with $98.1 million of deferred tax liability related to net deferred hedging gains included in AOCI. As of December 31, 2011, we have a $4.5 million valuation allowance on the deferred tax asset related to our deferred compensation plan for planned future distributions to certain executives to the extent that their estimated future compensation plus distribution amounts would exceed the $1.0 million deductible limit provided under I.R.C. Section 162(m). As of December 31, 2010, we had a $4.8 million valuation allowance on the deferred tax asset related to our deferred compensation plan.
At December 31, 2011, we had regular net operating loss (“NOL”) carryforwards of $299.0 million and alternative minimum tax (“AMT”) NOL carryforwards of $261.3 million that expire between 2012 and 2031. We are expecting to generate approximately $50.0 million in federal taxable income in 2011 in order to utilize net operating loss carryforwards that expire in 2012. Our deferred tax asset related to regular NOL carryforwards at December 31, 2011 was $32.6 million, which is net of the Accounting Standards Codification 718 Stock Compensation reduction for unrealized benefits. Regular NOLs generally offset taxable income and to such extent, no income tax payments are required. At December 31, 2011, we have AMT credit carryforwards of $665,000 that are not subject to limitation or expiration.
We file consolidated tax returns in the United States federal jurisdiction. We file separate company state income tax returns in Louisiana, Mississippi, Pennsylvania and Virginia and file consolidated or unitary state income tax returns in New Mexico, Oklahoma, Texas and West Virginia. We are subject to U.S. Federal income tax examinations for the years after 2007 and we are subject to various state tax examinations for years after 2006. We have not extended the statute of limitation period in any income tax jurisdiction. Our policy is to recognize interest related to income tax expense in interest expense and penalties in general and administrative expense. We do not have any accrued interest or penalties related to tax amounts as of December 31, 2011. Throughout 2011, our unrecognized tax benefits were not material.
(6) INCOME (LOSS) PER COMMON SHARE
Basic income or loss per share attributable to common shareholders is computed as (i) income or loss attributable to common shareholders (ii) less income allocable to participating securities (iii) divided by weighted average basic shares outstanding. Diluted income or loss per share attributable to common stockholders is computed as (i) basic income or loss attributable to common shareholders (ii) plus diluted adjustments to income allocable to participating securities (iii) divided by weighted average diluted shares outstanding. The following table sets forth a reconciliation of income or loss attributable to common shareholders to basic income or loss attributable to common shareholders and to diluted income or loss attributable to common shareholders (in thousands except per share amounts):
| Twelve Months Ended December 31, 2011 |
Twelve Months Ended December 31, 2010 |
Twelve Months Ended December 31, 2009 |
||||||||||||||||||||||||||||||||||
| Continuing Operations |
Discontinued Operations |
Total | Continuing Operations |
Discontinued Operations |
Total | Continuing Operations |
Discontinued Operations |
Total | ||||||||||||||||||||||||||||
| Income (loss) as reported |
$ | 42,706 | $ | 15,320 | $ | 58,026 | $ | 88,698 | $ | (327,954 | ) | $ | (239,256 | ) | $ | 38,980 | $ | (92,850 | ) | $ | (53,870 | ) | ||||||||||||||
| Participating basic earnings (a) |
(763 | ) | (274 | ) | (1,037 | ) | (1,574 | ) | 1,120 | (454 | ) | — | — | — | ||||||||||||||||||||||
|
|
|
|
|
|
|
|
|
|
|
|
|
|
|
|
|
|
|
|||||||||||||||||||
| Basic income (loss) attributed to common shareholders |
41,943 | 15,046 | 56,989 | 87,124 | (326,834 | ) | (239,710 | ) | 38,980 | (92,850 | ) | (53,870 | ) | |||||||||||||||||||||||
| Reallocation of participating earnings (a) |
3 | 2 | 5 | 11 | (11 | ) | — | — | — | — | ||||||||||||||||||||||||||
|
|
|
|
|
|
|
|
|
|
|
|
|
|
|
|
|
|
|
|||||||||||||||||||
| Diluted income (loss) attributed to common shareholders |
$ | 41,946 | $ | 15,048 | $ | 56,994 | $ | 87,135 | $ | (326,845 | ) | $ | (239,710 | ) | $ | 38,980 | $ | (92,850 | ) | $ | (53,870 | ) | ||||||||||||||
|
|
|
|
|
|
|
|
|
|
|
|
|
|
|
|
|
|
|
|||||||||||||||||||
| Income (loss) per common share: |
||||||||||||||||||||||||||||||||||||
| Basic |
$ | 0.26 | $ | 0.10 | $ | 0.36 | $ | 0.56 | $ | (2.09 | ) | $ | (1.53 | ) | $ | 0.25 | $ | (0.60 | ) | $ | (0.35 | ) | ||||||||||||||
| Diluted |
$ | 0.26 | $ | 0.10 | $ | 0.36 | $ | 0.55 | $ | (2.07 | ) | $ | (1.52 | ) | $ | 0.24 | $ | (0.58 | ) | $ | (0.34 | ) | ||||||||||||||
| (a) | Restricted Stock Awards represent participating securities because they participate in nonforfeitable dividends or distributions with common equity owners. Income allocable to participating securities represents the distributed and undistributed earnings attributable to the participating securities. Participating securities, however, do not participate in undistributed net losses. |
F-20
Table of Contents
The following table provides a reconciliation of basic weighted average common shares outstanding to diluted weighted average common shares outstanding (in thousands):
| Year Ended December 31, | ||||||||||||
| 2011 | 2010 | 2009 | ||||||||||
| Denominator: |
||||||||||||
| Weighted average common shares outstanding – basic |
158,030 | 156,874 | 154,514 | |||||||||
| Effect of dilutive securities: |
||||||||||||
| Director and employee stock options and SARs |
1,411 | 1,554 | 4,264 | |||||||||
|
|
|
|
|
|
|
|||||||
| Weighted average common shares outstanding – diluted |
159,441 | 158,428 | 158,778 | |||||||||
|
|
|
|
|
|
|
|||||||
Weighted average common shares – basic excludes 2.9 million shares at December 31, 2011, 2.8 million shares at December 31, 2010 and 2.6 million shares at December 31, 2009 of restricted stock Liability Awards held in our deferred compensation plans (although all awards are issued and outstanding upon grant). Stock appreciation rights (“SARs”) of 795,000, 2.1 million and 1.1 million shares for the years ended December 31, 2011, 2010 and 2009 were outstanding but not included in the computations of diluted net income per share because the grant prices of the SARs were greater than the average market price of the common shares and would be anti-dilutive to the computations.
(7) SUSPENDED EXPLORATORY WELL COSTS
We capitalize exploratory well costs until a determination is made that the well has either found proved reserves or that it is impaired. Capitalized exploratory well costs are presented in natural gas and oil properties in the accompanying consolidated balance sheets. If an exploratory well is determined to be impaired, the well costs are charged to exploration expense in the accompanying consolidated statements of operations. The following table reflects the changes in capitalized exploratory well costs for the year ended December 31, 2011, 2010 and 2009 (in thousands except for number of projects):
| 2011 | 2010 | 2009 | ||||||||||
| Balance at beginning of period |
$ | 23,908 | $ | 19,052 | $ | 47,623 | ||||||
| Additions to capitalized exploratory well costs pending the determination of proved reserves |
86,996 | 28,897 | 26,216 | |||||||||
| Reclassifications to wells, facilities and equipment based on determination of proved reserves |
(17,516 | ) | (24,041 | ) | (52,849 | ) | ||||||
| Capitalized exploratory well costs charged to expense |
— | — | (1,938 | ) | ||||||||
|
|
|
|
|
|
|
|||||||
| Balance at end of period |
93,388 | 23,908 | 19,052 | |||||||||
| Less exploratory well costs that have been capitalized for a period of one year or less |
(83,860 | ) | (13,181 | ) | (10,778 | ) | ||||||
|
|
|
|
|
|
|
|||||||
| Capitalized exploratory well costs that have been capitalized for a period greater than one year |
$ | 9,528 | $ | 10,727 | $ | 8,274 | ||||||
|
|
|
|
|
|
|
|||||||
| Number of projects that have exploratory well costs that have been capitalized for a period greater than one year |
3 | 4 | 6 | |||||||||
|
|
|
|
|
|
|
|||||||
As of December 31, 2011, the $9.5 million of capitalized exploratory well costs that have been capitalized for more than one year relates primarily to wells waiting on pipelines, with all three wells in our Marcellus Shale area. The following table provides an aging of capitalized exploratory well costs that have been suspended for more than one year as of December 31, 2011 (in thousands):
| Total | 2011 | 2010 | 2009 | 2008 | ||||||||||||||||
| Capitalized exploratory well costs that have been capitalized for more than one year |
$ | 9,528 | $ | 414 | $ | 4,707 | $ | 2,884 | $ | 1,523 | ||||||||||
|
|
|
|
|
|
|
|
|
|
|
|||||||||||
F-21
Table of Contents
(8) INDEBTEDNESS
We had the following debt outstanding as of the dates shown below (bank debt interest rate at December 31, 2011 is shown parenthetically) (in thousands). No interest was capitalized during 2011, 2010, and 2009:
| December 31, | ||||||||
| 2011 | 2010 | |||||||
| Bank debt (2.2%) |
$ | 187,000 | $ | 274,000 | ||||
| Senior subordinated notes: |
||||||||
| 6.375% senior subordinated notes due 2015 |
— | 150,000 | ||||||
| 7.5% senior subordinated notes due 2016, net of $317 discount |
— | 249,683 | ||||||
| 7.5% senior subordinated notes due 2017 |
250,000 | 250,000 | ||||||
| 7.25% senior subordinated notes due 2018 |
250,000 | 250,000 | ||||||
| 8.0% senior subordinated notes due 2019, net of $12,033 and $13,147 discount, respectively |
287,967 | 286,853 | ||||||
| 6.75% senior subordinated notes due 2020 |
500,000 | 500,000 | ||||||
| 5.75% senior subordinated notes due 2021 |
500,000 | — | ||||||
|
|
|
|
|
|||||
| Total debt |
$ | 1,974,967 | $ | 1,960,536 | ||||
|
|
|
|
|
|||||
Bank Debt
In February 2011, we entered into an amended and restated revolving bank facility, which we refer to as our bank debt or our bank credit facility, which is secured by substantially all of our assets. The bank credit facility provides for an initial commitment equal to the lesser of the facility amount or the borrowing base. On December 31, 2011, the facility amount was $1.5 billion and the borrowing base was $2.0 billion. The bank credit facility provides for a borrowing base subject to redeterminations semi-annually and for event-driven unscheduled redeterminations. Our current bank group is comprised of twenty-six financial institutions, with no one bank holding more than 7% of the total facility. The facility amount may be increased to the borrowing base amount with twenty-days notice, subject to payment of a mutually acceptable commitment fee to those banks agreeing to participate in the facility increase. As of December 31, 2011, the outstanding balance under the bank credit facility was $187.0 million as well as $28.6 million of undrawn letters of credit leaving $1.3 billion of borrowing capacity available under the facility amount. The facility matures on February 18, 2016. Borrowings under the bank facility can either be at the Alternate Base Rate (as defined) plus a spread ranging from 0.50% to 1.5% or LIBOR borrowings at the Adjusted LIBO Rate (as defined) plus a spread ranging from 1.5% to 2.5%. The applicable spread is dependent upon borrowings relative to the borrowing base. We may elect, from time to time, to convert all or any part of our LIBOR loans to base rate loans or to convert all or any of the base rate loans to LIBOR loans. The weighted average interest rate was 2.2% for the year ended December 31, 2011 compared to 2.2% for the year ended December 31, 2010 and 2.4% for the year ended December 31, 2009. A commitment fee is paid on the undrawn balance based on an annual rate of 0.375% to 0.50%. At December 31, 2011, the commitment fee was 0.375% and the interest rate margin was 1.5% on our LIBOR loans and 0.5% on our base rate loans.
F-22
Table of Contents
Senior Subordinated Notes
In May 2011, we issued $500.0 million aggregate principal amount of 5.75% senior subordinated notes due 2021 (“5.75% Notes”) for net proceeds after underwriting discounts and commissions of $491.3 million. The 5.75% Notes were issued at par. Interest on the 5.75% Notes is payable semi-annually in June and December and is guaranteed by all of our current subsidiaries. We may redeem the 5.75% Notes, in whole or in part, at any time on or after June 1, 2016, at redemption prices of 102.875% of the principal amount as of June 1, 2016, declining to 100.0% on June 1, 2019 and thereafter. Before June 2014, we may redeem up to 35% of the original aggregate principal amount of the 5.75% Notes at a redemption price equal to 105.75% of the principal amount thereof, plus accrued and unpaid interest, if any, with the proceeds of certain equity offerings, provided that 65% of the aggregate principal amount of 5.75% Notes remains outstanding immediately after the occurrence of such redemption and also provided such redemption shall occur within 60 days of the date of the closing of the equity offering. On closing, we used $112.9 million of the proceeds to purchase our 6.375% senior subordinated notes due 2015 and $207.1 million of the proceeds to purchase our 7.5% senior subordinated notes due 2016 as part of the tender offer and redemption described below.
If we experience a change of control, bondholders may require us to repurchase all or a portion of all of our senior subordinated notes at 101% of the principal amount plus accrued and unpaid interest, if any. All of the senior subordinated notes and the guarantees by our subsidiary guarantors are general, unsecured obligations and are subordinated to our bank debt and will be subordinated to future senior debt that we or our subsidiary guarantors are permitted to incur under the bank credit facility and the indentures governing the subordinated notes.
Early Extinguishment of Debt
In May 2011, we commenced cash tender offers to purchase the entire outstanding $150.0 million principal amount of our 6.375% senior subordinated notes due 2015 and $250.0 million principal amount of our 7.5% senior subordinated notes due 2016. On May 25, 2011, after the expiration of the tender offers, we accepted for purchase $108.9 million in principal of the 2015 notes at 102.375% of par and $198.8 million in principal of the 2016 notes for 104.00% of par. We subsequently called the remaining 2015 and 2016 notes, redeeming all of the remaining outstanding 2015 notes ($41.1 million) at 102.125% of par on June 24, 2011 and redeeming all of the remaining 2016 notes ($51.2 million) at 103.75% of par on June 24, 2011. During 2011, we recognized an $18.6 million loss on extinguishment of debt, including transaction call premium cost as well as expensing of deferred financing cost on repurchased debt.
Guarantees
Range Resources Corporation is a holding company which owns no operating assets and has no significant operations independent of its subsidiaries. The guarantees by our subsidiaries of our senior subordinated notes are full and unconditional and joint and several; any subsidiaries other than the subsidiary guarantors are minor subsidiaries.
Debt Covenants and Maturity
Our bank credit facility contains negative covenants that limit our ability, among other things, to pay cash dividends, incur additional indebtedness, sell assets, enter into certain hedging contracts, change the nature of our business or operations, merge, consolidate, or make investments. In addition, we are required to maintain a ratio of debt to EBITDAX (as defined in the credit agreement) of no greater than 4.25 to 1.0 and a current ratio (as defined in the credit agreement) of no less than 1.0 to 1.0. We were in compliance with our covenants under the bank credit facility at December 31, 2011.
The indentures governing our senior subordinated notes contain various restrictive covenants that are substantially identical to each other and may limit our ability to, among other things, pay cash dividends, incur additional indebtedness, sell assets, enter into transactions with affiliates, or change the nature of our business. At December 31, 2011, we were in compliance with these covenants.
F-23
Table of Contents
Following is the principal maturity schedule for our long-term debt outstanding as of December 31, 2011 (in thousands):
| Year Ended December 31, |
||||
| 2012 |
$ | — | ||
| 2013 |
— | |||
| 2014 |
— | |||
| 2015 |
— | |||
| 2016 |
187,000 | |||
| 2017 |
250,000 | |||
| Thereafter | 1,537,967 | |||
|
|
|
|||
| $ | 1,974,967 | |||
|
|
|
|||
(9) ASSET RETIREMENT OBLIGATIONS
Our asset retirement obligations primarily represent the estimated present value of the amounts we will incur to plug, abandon and remediate our producing properties at the end of their productive lives. Significant inputs used in determining such obligations include estimates of plugging and abandonment costs, estimated future inflation rates and well life. The inputs are calculated based on historical data as well as current estimated costs. A reconciliation of our liability for plugging and abandonment costs for the years ended December 31, 2011 and 2010 is as follows (in thousands):
| 2011 | 2010 | |||||||
| Beginning of period – continuing operations |
$ | 60,693 | $ | 76,589 | ||||
| Liabilities incurred |
3,265 | 1,495 | ||||||
| Acquisitions-continuing operations |
— | 556 | ||||||
| Liabilities settled |
(4,717 | ) | (2,331 | ) | ||||
| Disposition of wells |
(716 | ) | (12,891 | ) | ||||
| Accretion expense-continuing operations |
5,488 | 5,137 | ||||||
| Change in estimate |
20,797 | (7,862 | ) | |||||
|
|
|
|
|
|||||
| End of period – continuing operations |
84,810 | 60,693 | ||||||
|
|
|
|
|
|||||
| Less current portion |
(5,005 | ) | (4,020 | ) | ||||
|
|
|
|
|
|||||
| Long-term asset retirement obligations – continuing operations |
$ | 79,805 | $ | 56,673 | ||||
|
|
|
|
|
|||||
| Asset retirement obligations-discontinued operations |
$ | — | $ | 1,980 | ||||
|
|
|
|
|
|||||
Accretion expense is recognized as a component of depreciation, depletion and amortization expense in the accompanying statements of operations.
F-24
Table of Contents
(10) CAPITAL STOCK
We have authorized capital stock of 485.0 million shares which includes 475.0 million shares of common stock and 10.0 million shares of preferred stock. The following is a schedule of changes in the number of common shares outstanding since the beginning of 2009:
| Year Ended December 31, | ||||||||||||
| 2011 | 2010 | 2009 | ||||||||||
| Beginning balance |
159,909,052 | 158,118,937 | 155,375,487 | |||||||||
| Shares issued in lieu of cash bonuses |
— | — | 184,926 | |||||||||
| Stock options/SARs exercised |
862,774 | 991,988 | 1,384,861 | |||||||||
| Restricted stock grants |
326,591 | 405,127 | 413,353 | |||||||||
| Issued for acreage purchases |
— | 380,229 | 743,737 | |||||||||
| Treasury shares |
33,130 | 12,771 | 16,573 | |||||||||
|
|
|
|
|
|
|
|||||||
| Ending balance |
161,131,547 | 159,909,052 | 158,118,937 | |||||||||
|
|
|
|
|
|
|
|||||||
Treasury Stock
In 2008, the Board of Directors approved up to $10.0 million of repurchases of common stock based on market conditions and opportunities. During 2008, we repurchased 78,400 shares of common stock an average price of $41.11 for a total of $3.2 million. As of December 31, 2011, we have $6.8 million remaining authorization to repurchase shares.
Shelf Registration Statement
In June 2009, we filed a shelf registration statement with the Securities and Exchange Commission to potentially offer securities which include debt securities or common stock. The securities will be offered at prices and on terms to be determined at the time of sale. Net proceeds from the sale of such securities will be used for general corporate purposes, including a reduction of bank debt. Also in June 2009, we issued a $200.0 million registration statement where we may, from time to time, sell shares of our common stock in connection with an acquisition or business combination. As of December 31, 2011, we have $156.4 million remaining under this acquisition and business combination registration statement.
Common Stock Dividends
The Board of Directors declared quarterly dividends of $0.04 per common share for each of the four quarters of 2011, 2010 and 2009. The determination of the amount of future dividends, if any, to be declared and paid is at the sole discretion of the Board of Directors and will depend on our financial condition, earnings and cash flow from operations, level of capital expenditures, our future business prospects and other matters our Board of Directors deem relevant. Our bank credit facility and our senior subordinated notes allow for the payment of common dividends, with certain limitations. Dividends are limited to our legally available funds.
(11) DERIVATIVE ACTIVITIES
We use commodity-based derivative contracts to manage exposure to commodity price fluctuations. We do not enter into these arrangements for speculative or trading purposes. We do not utilize complex derivatives as we typically utilize commodity swap, collar or call option contracts to (1) reduce the effect of price volatility of the commodities we produce and sell and (2) support our annual capital budget and expenditure plans. In 2011, we entered into NGL derivative swap contracts for the natural gasoline (or C5) component of natural gas liquids. In 2010, we entered into call option derivative contracts under which we sold call options on crude oil in exchange for a cash premium received from the counterparty. At the time of settlement of these monthly call options, if the market price exceeds the fixed price of the call option, we will pay the counterparty such excess and if the market price settles below the fixed price of the call option, no payment is due from either party. At December 31, 2011, we had open swap contracts covering 66.8 Bcf of natural gas at prices averaging $4.06 per mcf, 1.8 million barrels of oil at prices averaging $94.43 per barrel and 6.6 million barrels of NGLs (the C5 component of NGLs) at prices averaging $93.30 per barrel. At December 31, 2011, we had collars covering 206.4 Bcf of gas at weighted average floor and cap prices of $4.76 to $5.27 per mcf and 2.6 million barrels of oil at weighted average floor and cap prices of $83.26 to $94.28 per barrel. At December 31, 2011, we also had sold call options for 1.7 million barrels of oil at a weighted average price of $85.00 per barrel. Their fair value, represented by the estimated amount that would be realized upon termination, based on a comparison of the contract price and a reference price, generally NYMEX, approximated a net unrealized pre-tax gain of $251.3 million at December 31, 2011. These contracts expire monthly through December 2014. The following table sets forth the derivative volumes by year as of December 31, 2011.
F-25
Table of Contents
| Period |
Contract Type |
Volume Hedged |
Weighted Average Hedge Price | |||
| Natural Gas | ||||||
| 2012 | Collars | 234,887 Mmbtu/day | $ 4.99–$ 5.50 | |||
| 2013 | Collars | 240,000 Mmbtu/day | $ 4.73–$ 5.20 | |||
| 2014 | Collars | 90,000 Mmbtu/day | $ 4.25–$ 4.85 | |||
| 2012 | Swaps | 182,986 Mmbtu/day | $4.06 | |||
| Crude Oil | ||||||
| 2012 | Collars | 2,000 bbls/day | $ 70.00–$ 80.00 | |||
| 2013 | Collars | 3,000 bbls/day | $ 90.60–$ 100.00 | |||
| 2014 | Collars | 2,000 bbls/day | $ 85.55–$ 100.00 | |||
| 2012 | Call options | 4,700 bbls/day | $85.00 | |||
| 2013 | Swaps | 3,000 bbls/day | $95.55 | |||
| 2014 | Swaps | 2,000 bbls/day | $92.75 | |||
| NGLs (Natural Gasoline) | ||||||
| 2012 | Swaps | 12,000 bbls/day | $96.28 | |||
| 2013 | Swaps | 6,000 bbls/day | $87.33 | |||
Every derivative instrument is required to be recorded on the balance sheet as either an asset or a liability measured at its fair value. Fair value is determined based on the difference between the fixed contract price and the underlying market price at the determination date. Changes in the fair value of our derivatives that qualify for hedge accounting are recorded as a component of AOCI in the stockholders’ equity section of the accompanying consolidated balance sheets, which is later transferred to natural gas, NGLs and oil sales when the underlying physical transaction occurs and the hedging contract is settled. As of December 31, 2011, an unrealized pre-tax derivative gain of $254.7 million was recorded in AOCI. This gain will be reclassified into earnings as a gain of $177.6 million in 2012, a gain of $73.5 million in 2013 and a gain of $3.5 million in 2014 as the contracts settle. The actual reclassification to earnings will be based on market prices at the contract settlement date. If the derivative does not qualify as a hedge or is not designated as a hedge, changes in fair value of these non-hedge derivatives are recognized in earnings in derivative fair value income.
For those derivative instruments that qualify for hedge accounting, settled transaction gains and losses are determined monthly, and are included as increases or decreases to natural gas, NGLs and oil sales in the period the hedged production is sold. Natural gas, NGLs and oil sales include $123.6 million of gains in 2011 compared to gains of $64.8 million in 2010 and gains of $202.9 million in 2009 related to settled hedging transactions. Any ineffectiveness associated with these hedge derivatives are reflected in derivative fair value income in the accompanying statements of operations. The ineffective portion is calculated as the difference between the changes in fair value of the derivative and the estimated change in future cash flows from the item hedged. Derivative fair value income for the year ended December 31, 2011 includes ineffective gains (unrealized and realized) of $9.5 million compared to $2.0 million in 2010 and $3.1 million in 2009.
Derivative fair value income
The following table presents information about the components of derivative fair value income in the three-year period ended December 31, 2011 (in thousands):
| 2011 | 2010 | 2009 | ||||||||||
| Change in fair value of derivatives that do not qualify for hedge accounting (a) |
$ | 15,762 | $ | (2,086 | ) | $ | (115,909 | ) | ||||
| Realized gain (loss) on settlement–natural gas (a) (b) |
14,743 | 35,988 | 171,998 | |||||||||
| Realized gain (loss) on settlement–oil (a) (b) |
(9,574 | ) | — | 7,304 | ||||||||
| Realized gain (loss) on settlement–NGL (a) (b) |
9,612 | — | — | |||||||||
| Realized gain on early settlement of oil derivatives |
— | 15,697 | — | |||||||||
| Hedge ineffectiveness–realized |
7,361 | (352 | ) | 4,749 | ||||||||
| –unrealized |
2,183 | 2,387 | (1,696 | ) | ||||||||
|
|
|
|
|
|
|
|||||||
| Derivative fair value income |
$ | 40,087 | $ | 51,634 | $ | 66,446 | ||||||
|
|
|
|
|
|
|
|||||||
| (a) | Derivatives that do not qualify for hedge accounting. |
| (b) | These amounts represent the realized gains and losses on settled derivatives that do not qualify for hedge accounting, which before settlement are included in the category above called the change in fair value of derivatives that do not qualify for hedge accounting. |
F-26
Table of Contents
Derivative assets and liabilities
The combined fair value of derivatives included in the accompanying consolidated balance sheets as of December 31, 2011 and 2010 is summarized below (in thousands). As of December 31, 2011, we are conducting derivative activities with eleven financial institutions, of which all but two are secured lenders in our bank credit facility. We believe all of these institutions are acceptable credit risks. At times, such risks may be concentrated with certain counterparties. The credit worthiness of our counterparties is subject to periodic review. The assets and liabilities are netted where derivatives with both gain and loss positions are held by a single counterparty and we have master netting arrangements.
| December 31, | ||||||||
| 2011 | 2010 | |||||||
| Derivative assets: |
||||||||
| Natural gas–swaps |
$ | 54,162 | $ | — | ||||
| –collars |
228,228 | 155,159 | ||||||
| –collars – discontinued operations |
— | 8,195 | ||||||
| Crude oil–swaps |
(263 | ) | — | |||||
| –collars |
(16,607 | ) | — | |||||
| –call options |
(29,348 | ) | (31,904 | ) | ||||
| NGL–swaps |
15,328 | — | ||||||
|
|
|
|
|
|||||
| $ | 251,500 | $ | 131,450 | |||||
|
|
|
|
|
|||||
| Derivative liabilities: |
||||||||
| Natural gas–collars |
$ | — | $ | 27,032 | ||||
| –basis swaps |
— | (352 | ) | |||||
| Crude oil–collars |
— | (12,051 | ) | |||||
| –call options |
— | (28,393 | ) | |||||
| NGL–swaps |
(173 | ) | — | |||||
|
|
|
|
|
|||||
| $ | (173 | ) | $ | (13,764 | ) | |||
|
|
|
|
|
|||||
The table below provides data about the fair value of our derivative contracts. Derivative assets and liabilities shown below are presented as gross assets and liabilities, without regard to master netting arrangements, which are considered in the presentation of derivative assets and liabilities in the accompanying consolidated balance sheets (in thousands):
| December 31, 2011 | December 31, 2010 | |||||||||||||||||||||||
| Assets | (Liabilities) |
|
Assets | (Liabilities) |
|
|||||||||||||||||||
| Carrying Value |
Carrying Value |
Net Carrying Value |
Carrying Value |
Carrying Value |
Net Carrying Value |
|||||||||||||||||||
| Derivatives that qualify for cash flow hedge accounting : |
||||||||||||||||||||||||
| Swaps (a) |
$ | 54,318 | $ | (419 | ) | $ | 53,899 | $ | — | $ | — | $ | — | |||||||||||
| Collars (a) |
228,228 | (1,954 | ) | 226,274 | 164,933 | — | 164,933 | |||||||||||||||||
| Collars – discontinued Operations (b) |
— | — | — | 8,195 | — | 8,195 | ||||||||||||||||||
|
|
|
|
|
|
|
|
|
|
|
|
|
|||||||||||||
| $ | 282,546 | $ | (2,373 | ) | $ | 280,173 | $ | 173,128 | $ | — | $ | 173,128 | ||||||||||||
|
|
|
|
|
|
|
|
|
|
|
|
|
|||||||||||||
| Derivatives that do not qualify for hedge accounting : |
||||||||||||||||||||||||
| Swaps (a) |
$ | 17,949 | $ | (2,794 | ) | $ | 15,155 | $ | — | $ | — | $ | — | |||||||||||
| Collars (a) |
— | (14,653 | ) | (14,653 | ) | 17,259 | (12,052 | ) | 5,207 | |||||||||||||||
| Call options (a) |
— | (29,348 | ) | (29,348 | ) | — | (60,297 | ) | (60,297 | ) | ||||||||||||||
| Basis swaps (a) |
— | — | — | — | (352 | ) | (352 | ) | ||||||||||||||||
|
|
|
|
|
|
|
|
|
|
|
|
|
|||||||||||||
| $ | 17,949 | $ | (46,795 | ) | $ | (28,846 | ) | $ | 17,259 | $ | (72,701 | ) | $ | (55,442 | ) | |||||||||
|
|
|
|
|
|
|
|
|
|
|
|
|
|||||||||||||
| (a) | Included in unrealized derivative gain or loss in the accompanying consolidated balance sheets. |
| (b) | Included in assets of discontinued operations. |
F-27
Table of Contents
The effects of our cash flow hedges (or those derivatives that qualify for hedge accounting) on accumulated other comprehensive income in the accompanying consolidated balance sheets is summarized below:
| Year Ended December 31, | ||||||||||||||||
| Change in Hedge Derivative Fair Value |
Realized Gain Reclassified from OCI into Revenue (a) |
|||||||||||||||
| 2011 | 2010 | 2011 | 2010 | |||||||||||||
| Swaps |
$ | 51,997 | $ | — | $ | — | $ | — | ||||||||
| Collars |
223,408 | 157,447 | 123,594 | 64,772 | ||||||||||||
| Collars – discontinued operations |
412 | 8,195 | 8,607 | — | ||||||||||||
| Income taxes |
(104,464 | ) | (64,662 | ) | (50,005 | ) | (24,841 | ) | ||||||||
|
|
|
|
|
|
|
|
|
|||||||||
| $ | 171,353 | $ | 100,980 | $ | 82,196 | $ | 39,931 | |||||||||
|
|
|
|
|
|
|
|
|
|||||||||
| (a) | For realized gains upon contract settlement, the reduction in AOCI is offset by an increase in natural gas, NGLs and oil sales. For realized losses upon contract settlement, the increase in AOCI is offset by a decrease in natural gas, NGLs and oil sales. |
The effects of our non-hedge derivatives (or those derivatives that do not qualify for hedge accounting) and the ineffective portion of our hedge derivatives on our consolidated statements of operations is summarized below:
| Year Ended December 31, | ||||||||||||||||||||||||||||||||||||
| Gain (Loss) Recognized in Income (Non-hedge Derivatives) |
Gain (Loss) Recognized in Income (Ineffective Portion) |
Derivative Fair Value Income |
||||||||||||||||||||||||||||||||||
| 2011 | 2010 | 2009 | 2011 | 2010 | 2009 | 2011 | 2010 | 2009 | ||||||||||||||||||||||||||||
| Swaps |
$ | 24,767 | $ | — | $ | 63,755 | $ | — | $ | — | $ | — | $ | 24,767 | $ | — | $ | 63,755 | ||||||||||||||||||
| Collars |
5,266 | 65,996 | 33,859 | 9,544 | 2,035 | 3,053 | 14,810 | 68,031 | 36,912 | |||||||||||||||||||||||||||
| Call options |
553 | (15,895 | ) | — | — | — | — | 553 | (15,895 | ) | — | |||||||||||||||||||||||||
| Basis swaps |
(43 | ) | (502 | ) | (34,221 | ) | — | — | — | (43 | ) | (502 | ) | (34,221 | ) | |||||||||||||||||||||
|
|
|
|
|
|
|
|
|
|
|
|
|
|
|
|
|
|
|
|||||||||||||||||||
| Total |
$ | 30,543 | $ | 49,599 | $ | 63,393 | $ | 9,544 | $ | 2,035 | $ | 3,053 | $ | 40,087 | $ | 51,634 | $ | 66,446 | ||||||||||||||||||
|
|
|
|
|
|
|
|
|
|
|
|
|
|
|
|
|
|
|
|||||||||||||||||||
(12) FAIR VALUE MEASUREMENTS
Fair value is the price that would be received to sell an asset or paid to transfer a liability in an orderly transaction between market participants at the measurement date. There are three approaches for measuring the fair value of assets and liabilities: the market approach, the income approach and the cost approach, each of which includes multiple valuation techniques. The market approach uses prices and other relevant information generated by market transactions involving identical or comparable assets or liabilities. The income approach uses valuation techniques to measure fair value by converting future amounts, such as cash flows or earnings, into a single present value amount using current market expectations about those future amounts. The cost approach is based on the amount that would currently be required to replace the service capacity of an asset. This is often referred to as current replacement cost. The cost approach assumes that the fair value would not exceed what it would cost a market participant to acquire or construct a substitute asset of comparable utility, adjusted for obsolescence.
The fair value accounting standards do not prescribe which valuation technique should be used when measuring fair value and does not prioritize among the techniques. These standards establish a fair value hierarchy that prioritizes the inputs used in applying the various valuation techniques. Inputs broadly refer to the assumptions that market participants use to make pricing decisions, including assumptions about risk. Level 1 inputs are given the highest priority in the fair value hierarchy while Level 3 inputs are given the lowest priority. The three levels of the fair value hierarchy are as follows.
| • | Level 1 – Observable inputs that reflect unadjusted quoted prices for identical assets or liabilities in active markets as of the reporting date. Active markets are those in which transactions for the asset or liability occur in sufficient frequency and volume to provide pricing information on an ongoing basis. |
| • | Level 2 – Observable market-based inputs or unobservable inputs that are corroborated by market data. These are inputs other than quoted prices in active markets included in Level 1, which are either directly or indirectly observable as of the reporting date. |
| • | Level 3 – Unobservable inputs that are not corroborated by market data and may be used with internally developed methodologies that result in management’s best estimate of fair value. |
F-28
Table of Contents
Valuation techniques that maximize the use of observable inputs are favored. Assets and liabilities are classified in their entirety based on the lowest priority level of input that is significant to the fair value measurement. The assessment of the significance of a particular input to the fair value measurement requires judgment and may affect the placement of assets and liabilities within the levels of the fair value hierarchy.
Fair Values-Recurring
We use a market approach for our recurring fair value measurements and endeavor to use the best information available. Accordingly, valuation techniques that maximize the use of observable impacts are favored. The following tables present the fair value hierarchy table for assets and liabilities measured at fair value, on a recurring basis (in thousands):
| Fair Value Measurements at December 31, 2011 Using: | ||||||||||||||||
| Quoted Prices in Active Markets for Identical Assets (Level 1) |
Significant Other Observable Inputs (Level 2) |
Significant Unobservable Inputs (Level 3) |
Total Carrying Value as of December 31, 2011 |
|||||||||||||
| Trading securities held in the deferred compensation plans |
$ | 50,237 | $ | — | $ | — | $ | 50,237 | ||||||||
| Derivatives–swaps |
— | 69,054 | — | 69,054 | ||||||||||||
| –collars |
— | 211,621 | — | 211,621 | ||||||||||||
| –call options |
— | (29,348 | ) | — | (29,348 | ) | ||||||||||
| Fair Value Measurements at December 31, 2010 Using: | ||||||||||||||||
| Quoted Prices in Active Markets for Identical Assets (Level 1) |
Significant Other Observable Inputs (Level 2) |
Significant Unobservable Inputs (Level 3) |
Total Carrying Value as of December 31, 2010 |
|||||||||||||
| Trading securities held in the deferred compensation plans |
$ | 47,794 | $ | — | $ | — | $ | 47,794 | ||||||||
| Derivatives–collars |
— | 170,140 | — | 170,140 | ||||||||||||
| –collars – discontinued operations |
— | 8,195 | — | 8,195 | ||||||||||||
| –call options |
— | (60,297 | ) | — | (60,297 | ) | ||||||||||
| –basis swaps |
— | (352 | ) | — | (352 | ) | ||||||||||
Our trading securities in Level 1 are exchange-traded and measured at fair value with a market approach using December 31, 2011 market values. Derivatives in Level 2 are measured at fair value with a market approach using third-party pricing services, which have been corroborated with data from active markets or broker quotes.
Our trading securities held in the deferred compensation plan are accounted for using the mark-to-market accounting method and are included in other assets in the accompanying consolidated balance sheets. We elected to adopt the fair value option to simplify our accounting for the investments in our deferred compensation plan. Interest, dividends, and mark-to-market gains/losses are included in deferred compensation plan expense in the accompanying statement of operations. For the year ended December 31, 2011, interest and dividends were $1.4 million and mark-to-market was a loss of $2.3 million. For the year ended December 31, 2010, interest and dividends were $864,000 and the mark-to-market was a gain of $11.5 million. For the year ended December 31, 2009, interest and dividends were $487,000 and the mark-to-market was a gain of $10.4 million.
F-29
Table of Contents
Fair Values-Non recurring
We review our long-lived assets for impairment, including proved natural gas and oil properties, whenever events or circumstances indicate the carrying value of those assets may not be recoverable. During the year ended December 31, 2011, we recognized charges for impairment of oil and gas properties in continuing operations of $38.7 million compared to $6.5 million in 2010 and $930,000 in 2009. Discontinued operations includes an impairment charge related to our Barnett Shale assets of $463.2 million in 2010.
Continuing Operations
Due to declines in commodity prices and estimated reserves over the last three years, there were indications that the carrying values of our oil and gas properties in East Texas, onshore Gulf Coast and Michigan may be impaired and undiscounted cash future cash flows attributed to these assets indicated their carrying amounts were not expected to be recovered. Their fair value was measured using an income approach based upon internal estimates of future production levels, prices, drilling and operating costs and discount rates, which are Level 3 inputs. In the case of certain of our East Texas properties, we also considered the potential sale of certain of these properties. We recorded non-cash charges during 2011 of $31.2 million related to our East Texas natural gas and oil properties and $7.5 million related to our Gulf Coast onshore properties. 2010 includes impairment charges of $6.5 million related to our Gulf Coast onshore properties and 2009 includes an impairment charge of $930,000 related to our Michigan properties.
In 2009, our investment in Whipstock Natural gas Services, LLC was evaluated for impairment due to reductions in business activity and continued losses. The fair value of this investment was measured using an income approach based upon internal estimates of business activity, prices and discount rates, which are Level 3 inputs. Based on this analysis, we determined our equity investment was not recoverable and an impairment of $9.0 million was recorded.
The following table presents the value of these assets measured at fair value on a nonrecurring basis (in thousands):
| Year Ended December 31, | ||||||||||||||||||||||||
| 2011 | 2010 | 2009 | ||||||||||||||||||||||
| Fair Value | Impairment | Fair Value | Impairment | Fair Value | Impairment | |||||||||||||||||||
| Natural gas and oil properties – continuing operations |
$ | 24,388 | $ | 38,681 | $ | 16,075 | $ | 6,505 | $ | 1,244 | $ | 930 | ||||||||||||
| Natural gas and oil properties – discontinued operations |
— | — | 835,913 | 463,244 | — | — | ||||||||||||||||||
| Equity investments |
— | — | — | — | 2,895 | 8,950 | ||||||||||||||||||
Discontinued Operations
Our Barnett properties did not meet held for sale criteria as of December 31, 2010 but our analysis reflected undiscounted cash flows for these properties were less than their carrying value. We compared the carrying value of the Barnett properties to the estimated fair value of the properties and recognized an impairment charge of $463.2 million in the fourth quarter of 2010, which is reflected in discontinued operations. The fair value of our Barnett properties considered the potential sale of these properties in addition to using an income approach with internal estimates which included reserve quantities, forward natural gas prices, anticipated drilling and operating costs and discount rates, which are Level 3 inputs.
F-30
Table of Contents
Fair Values – Reported
The following table presents the carrying amounts and the fair values of our financial instruments as of December 31, 2011 and 2010 (in thousands):
| December 31, 2011 | December 31, 2010 | |||||||||||||||
| Carrying Value |
Fair Value |
Carrying Value |
Fair Value |
|||||||||||||
| Assets: |
||||||||||||||||
| Commodity swaps, collars and call options |
$ | 251,500 | $ | 251,500 | $ | 123,255 | $ | 123,255 | ||||||||
| Commodity collars – discontinued operations |
— | — | 8,195 | 8,195 | ||||||||||||
| Marketable securities(a) |
50,237 | 50,237 | 47,794 | 47,794 | ||||||||||||
| Liabilities: |
||||||||||||||||
| Commodity swaps, collars, call options and basis swaps |
(173 | ) | (173 | ) | (13,764 | ) | (13,764 | ) | ||||||||
| Bank credit facility(b) |
(187,000 | ) | (187,000 | ) | (274,000 | ) | (274,000 | ) | ||||||||
| 6.375% senior subordinated notes due 2015(b) |
— | — | (150,000 | ) | (153,000 | ) | ||||||||||
| 7.5% senior subordinated notes due 2016(b) |
— | — | (249,683 | ) | (259,375 | ) | ||||||||||
| 7.5% senior subordinated notes due 2017(b) |
(250,000 | ) | (265,625 | ) | (250,000 | ) | (263,438 | ) | ||||||||
| 7.25% senior subordinated notes due 2018(b) |
(250,000 | ) | (267,500 | ) | (250,000 | ) | (263,750 | ) | ||||||||
| 8.0% senior subordinated notes due 2019(b) |
(287,967 | ) | (334,500 | ) | (286,853 | ) | (326,625 | ) | ||||||||
| 6.75% senior subordinated notes due 2020(b) |
(500,000 | ) | (555,000 | ) | (500,000 | ) | (515,625 | ) | ||||||||
| 5.75% senior subordinated notes due 2021(b) |
(500,000 | ) | (541,250 | ) | — | — | ||||||||||
| (a) | Marketable securities are held in our deferred compensation plans that are actively traded on major exchanges. |
| (b) | The book value of our bank debt approximates fair value because of its floating rate structure. The fair value of our senior subordinated notes is based on end of period market quotes. |
Our current assets and liabilities contain financial instruments, the most significant of which are trade accounts receivables and payables. We believe the carrying values of our current assets and liabilities approximate fair value. Our fair value assessment incorporates a variety of considerations, including (1) the short-term duration of the instruments and (2) our historical incurrence of and expected future insignificance of bad debt expense.
Concentrations of Credit Risk
As of December 31, 2011, our primary concentrations of credit risk are the risks of collecting accounts receivable and the risk of counterparties’ failure to perform under derivative obligations. Most of our receivables are from a diverse group of companies, including major energy companies, pipeline companies, local distribution companies, financial institutions and end-users in various industries. Letters of credit or other appropriate security are obtained as necessary to limit risk of loss. Our allowance for uncollectible receivables was $4.0 million at December 31, 2011 compared to $5.0 million at December 31, 2010. As of December 31, 2011, our derivative contracts consist of swaps, collars and call options. Our exposure is diversified primarily among major investment grade financial institutions, the majority of which we have master netting agreements which provides for offsetting payables against receivables from separate derivative contracts. To manage counterparty risk associated with our derivatives, we select and monitor our counterparties based on our assessment of their financial strength and or credit ratings. We may also limit the level of exposure with any single counterparty. At December 31, 2011 our derivative counterparties include eleven financial institutions, of which all but two are secured lenders in our bank credit facility. At December 31, 2011, our net derivative asset includes a receivable from two counterparties not included in our bank credit facility of $9.6 million. For those counterparties that are not secured lenders in our bank credit facility or for which we do not have master netting arrangements, net derivative asset values are determined in part, by reviewing credit default swap spreads for the counterparties. Net derivative liabilities are determined, in part, by using our market based credit spread. None of our derivative contracts have margin requirements or collateral provisions that would require funding prior to the scheduled cash settlement date. We have also entered into the International SWAP Dealers Association Master Agreements (“ISDA Agreements”) with our counterparties. The terms of the ISDA Agreements provide us and our counterparties with rights of set off upon the occurrence of defined acts of default by either us or a counterparty to a derivative, whereby the party not in default may set off all derivative liabilities owed to the defaulting party against all derivative asset receivables from the defaulting party.
F-31
Table of Contents
(13) STOCK-BASED COMPENSATION PLANS
Description of the Plans
The 2005 Equity Based Compensation Plan (the “2005 Plan”) authorizes the Compensation Committee of the Board of Directors to grant, among other things, stock options, stock appreciation rights and restricted stock awards to employees and directors. The 2004 Non-Employee Director Stock Option Plan (the “Director Plan”) allows such grants to our non-employee directors of our Board of Directors. The 2005 Plan was approved by stockholders in May 2005 and replaced our 1999 Stock Option Plan. No new grants have been made from the 1999 Stock Option Plan. The number of shares that may be issued under the 2005 Plan is equal to (i) 5.6 million shares (15.0 million less the 2.2 million shares issued under the 1999 Stock Option Plan before May 18, 2005, the effective date of the 2005 Plan and less the 7.2 million shares issuable pursuant to awards under the 1999 Stock Option Plan outstanding as of the effective date of the 2005 Plan) plus (ii) the number of shares subject to 1999 Stock Option Plan awards outstanding at May 18, 2005 that subsequently lapse or terminate without the underlying shares being issued plus (iii) subsequent shares approved by the shareholders. The Director Plan was approved by stockholders in May 2004 and no more than 450,000 shares of common stock may be issued under the Director Plan.
Stock-Based Awards
Stock options represent the right to purchase shares of stock in the future at the fair value of the stock on the date of grant. Most stock options granted under our stock option plans vest over a three-year period and expired five years from the date they are granted. Beginning in 2005, we began granting stock appreciation rights (“SARs”) to reduce the dilutive impact of our equity plans. Similar to stock options, SARs represent the right to receive a payment equal to the excess of the fair market value of shares of common stock on the date the right is exercised over the value of the stock on the date of grant. All SARs granted under the 2005 Plan will be settled in shares of stock, vest over a three-year period and have a maximum term of five years from the date they are granted. Beginning in first quarter 2011, the compensation committee also began granting restricted stock units under our equity-based stock compensation plans. These restricted stock units, which we refer to as restricted stock Equity Awards, vest over a three-year period. All awards granted have been issued at prevailing market prices at the time of grant and the vesting of these shares is based upon an employee’s continued employment with us.
The Compensation Committee also grants restricted stock to certain employees and non-employee directors of the Board of Directors as part of their compensation. Compensation expense is recognized over the balance of the vesting period, which is typically three years for employee grants and immediate vesting for non-employee directors. All restricted stock awards are issued at prevailing market prices at the time of the grant and the vesting is based upon an employee’s continued employment with us. Prior to vesting, all restricted stock awards have the right to vote such stock and receive dividends thereon. Upon grant of these restricted shares, which we refer to as restricted stock Liability Awards, the shares are placed in our deferred compensation plan and, upon vesting, employees are allowed to take withdrawals either in cash or in stock. These Liability Awards are classified as a liability and are remeasured at fair value each reporting period. This mark-to-market is reported in deferred compensation plan expense in the accompanying consolidated statements of operations. Historically, we have used authorized but unissued shares of stock when restricted stock is granted. However, we also utilize treasury shares when available.
In 2009, as part of the closure of our Houston office, unvested SARs and restricted stock grants were modified and fully vested effective with the closing of the office on November 1, 2009. The incremental compensation cost of this modification was $332,000. As part of the sale of our Ohio properties in 2010, unvested SARs and restricted stock grants were modified and fully vested effective with the date of the sale. The incremental compensation cost of this modification was $2.8 million. These modification costs are reported in termination costs in the accompanying consolidated statements of operations.
Total Stock-Based Compensation Expense
Stock-based compensation represents amortization of restricted stock grants and SARs expense. In 2011, stock-based compensation was allocated to operating expense ($2.0 million), exploration expense ($4.1 million), general and administrative expense ($36.2 million) for a total of $43.8 million. In 2010, stock-based compensation was allocated to operating expense ($2.0 million), exploration expense ($4.2 million), general and administrative expense ($34.2 million) and termination costs ($2.8 million) for a total of $44.4 million. In 2009, stock-based compensation was allocated to operating expense ($2.5 million), exploration expense ($4.7 million) general administrative expense ($33.3 million) and termination costs ($332,000) for a total of $41.6 million. Unlike the other forms of stock-based compensation mentioned above, the mark-to-market of the liability related to the vested restricted stock held in our deferred compensation plans is directly tied to the change in our stock price and not directly related to the functional expenses and therefore, is not allocated to the functional categories. For the year ended December 31, 2011, cash received upon exercise of stock options/SARs awards was $620,000. For the twelve months ended December 31, 2010 and 2009, tax benefits realized for deductions that were in excess of the stock-based compensation expense were not recognized due to our net operating loss position. In 2011, as a result of realizing federal taxable income, a tax benefit of $11.7 million has been recognized in our net operating loss carryforward for the excess tax deduction over our stock-based compensation expense.
F-32
Table of Contents
Stock and Option Plans
We have two active equity-based stock plans, the 2005 Plan and the Director Plan. Under these plans, incentive and non-qualified stock options, stock appreciation rights, restricted stock units and various other awards may be issued to directors and employees pursuant to decisions of the Compensation Committee, which is made up of non-employee, independent directors from the Board of Directors. All awards granted under these plans have been issued at prevailing market prices at the time of the grant. Of the 4.6 million grants outstanding at December 31, 2011, 635,000 of the grants relate to stock options with the remainder of 3.9 million grants relating to SARs. Information with respect to stock option and SARs activities is summarized below.
| Shares | Weighted Average Exercise Price |
|||||||
| Outstanding at December 31, 2008 |
7,248,666 | $ | 26.15 | |||||
| Granted |
1,714,165 | 36.90 | ||||||
| Exercised |
(1,717,584 | ) | 14.31 | |||||
| Expired/forfeited |
(90,535 | ) | 40.73 | |||||
|
|
|
|
|
|||||
| Outstanding at December 31, 2009 |
7,154,712 | 31.38 | ||||||
| Granted |
1,394,136 | 46.09 | ||||||
| Exercised |
(1,883,091 | ) | 20.49 | |||||
| Expired/forfeited |
(203,918 | ) | 48.18 | |||||
|
|
|
|
|
|||||
| Outstanding at December 31, 2010 |
6,461,839 | 37.20 | ||||||
| Granted |
843,485 | 51.17 | ||||||
| Exercised |
(2,511,989 | ) | 32.69 | |||||
| Expired/forfeited |
(234,726 | ) | 52.65 | |||||
|
|
|
|
|
|||||
| Outstanding at December 31, 2011 |
4,558,609 | $ | 41.47 | |||||
|
|
|
|
|
|||||
The following table shows information with respect to stock options and SARs outstanding and exercisable at December 31, 2011:
| Outstanding | Exercisable | |||||||||||||||||||
| Range of Exercise Prices |
Shares | Weighted Average Remaining Contractual Life (in years) |
Weighted Average Exercise Price |
Shares | Weighted Average Exercise Price |
|||||||||||||||
| $1.29 – $ 9.99 |
619,716 | 0.29 | $ | 3.41 | 619,716 | $ | 3.41 | |||||||||||||
| 10.00 – 19.99 |
15,435 | 3.73 | 19.63 | 15,435 | 19.63 | |||||||||||||||
| 20.00 – 29.99 |
— | — | — | — | — | |||||||||||||||
| 30.00 – 39.99 |
808,975 | 1.52 | 34.90 | 506,868 | 35.30 | |||||||||||||||
| 40.00 – 49.99 |
1,968,934 | 3.12 | 45.28 | 643,665 | 43.63 | |||||||||||||||
| 50.00 – 59.99 |
803,137 | 3.29 | 54.39 | 310,905 | 57.64 | |||||||||||||||
| 60.00 – 69.99 |
13,542 | 1.65 | 66.04 | 12,677 | 65.91 | |||||||||||||||
| 70.00 – 75.00 |
328,870 | 1.39 | 75.00 | 328,870 | 75.00 | |||||||||||||||
|
|
|
|
|
|
|
|
|
|
|
|||||||||||
| Total |
4,558,609 | 2.35 | $ | 41.47 | 2,438,136 | $ | 37.66 | |||||||||||||
|
|
|
|
|
|
|
|
|
|
|
|||||||||||
F-33
Table of Contents
Stock Appreciation Right Awards
During 2011, 2010 and 2009, we granted SARs to officers, non-officer employees and directors. The weighted average grant date fair value of these SARs, based on our Black-Scholes-Merton assumptions, is shown below:
| 2011 | 2010 | 2009 | ||||||||||
| Weighted average exercise price per share |
$ | 51.17 | $ | 46.09 | $ | 36.90 | ||||||
| Expected annual dividends per share |
0.31 | % | 0.35 | % | 0.44 | % | ||||||
| Expected life in years |
3.7 | 3.6 | 3.5 | |||||||||
| Expected volatility |
47 | % | 49 | % | 58 | % | ||||||
| Risk-free interest rate |
1.4 | % | 1.6 | % | 1.5 | % | ||||||
| Weighted average grant date fair value |
$ | 18.22 | $ | 17.01 | $ | 15.42 | ||||||
The dividend yield is based on the current annual dividend at the time of grant. The expected life was based on the historical exercise activity. The expected volatility factors are based on a combination of both the historical volatilities of the stock and implied volatility of traded options on our common stock. The risk-free interest rate is based on the U.S. Treasury yield curve in effect at the time of grant for periods commensurate with the expected terms of the options.
The total intrinsic value (the difference in value between exercise and market price) of stock options and SARs exercised during the years ended December 31, 2011 was $62.5 million compared to $50.6 million in 2010 and $50.9 million in 2009. As of December 31, 2011, the aggregate intrinsic value of the awards outstanding was $97.7 million. The aggregate intrinsic value and weighted average remaining contractual life of stock option/SARs awards currently exercisable was $63.6 million and 1.5 years. As of December 31, 2011, the number of fully vested awards and awards expected to vest was 4.4 million. The weighted average exercise price and weighted average remaining contractual life of these awards were $41.32 and 2.3 years and the aggregate intrinsic value was $94.7 million. As of December 31, 2011, unrecognized compensation cost related to the awards was $20.2 million, which is expected to be recognized over a weighted average period of 1.7 years.
Restricted Stock Awards
Equity Awards
In 2011, we granted 331,000 restricted stock Equity Awards to employees which generally vest over a three-year period. We recorded compensation expense for these awards of $4.2 million in the year ended December 31, 2011. As of December 31, 2011, there was $11.0 million of unrecognized compensation related to Equity Awards expected to be recognized over a weighted average period of 2.2 years. Equity Awards are not issued to employees until such time they are vested and the employees do not have the option to receive cash.
Liability Awards
In 2011, we granted 350,000 shares of restricted stock Liability Awards as compensation to directors and employees at an average price of $51.17. This grant included 16,000 issued to non-employee directors which vest immediately and 334,000 to employees with vesting generally over a three-year period. In 2010, we granted 413,000 shares of Liability Awards as compensation to directors and employees at an average price of $45.83. This grant included 21,000 issued to non-employee directors which vest immediately and 392,000 to employees with vesting generally over a three-year period. In 2009, we granted 686,000 shares of Liability Awards as compensation to directors and employees at an average price of $39.99. This grant included 23,000 issued to non-employee directors, which vest immediately and 663,000 to employees with vesting generally over a three-year period. We recorded compensation expense for these Liability Awards of $19.1 million in the year ended December 31, 2011 compared to $20.5 million in 2010 and $19.7 million in 2009. As of December 31, 2011, there was $21.0 million of unrecognized compensation related to Liability Awards expected to be recognized over a weighted average period of 1.7 years. Substantially all of these awards are held in our deferred compensation plan, are classified as liability and are remeasured at fair value each reporting period. This mark-to-market is reported in the deferred compensation expense in our consolidated statement of operations (see additional discussion below). The proceeds received from the sale of stock held in our deferred compensation plan was $12.9 million in 2011.
F-34
Table of Contents
A summary of the status of our non-vested restricted stock outstanding at December 31, 2011 is summarized below:
| Equity Awards | Liability Awards | |||||||||||||||
| Shares | Weighted Average Grant Date Fair Value |
Shares | Weighted Average Grant Date Fair Value |
|||||||||||||
| Outstanding at December 31, 2008 |
— | $ | — | 473,547 | $ | 48.50 | ||||||||||
| Granted |
— | — | 685,578 | 39.99 | ||||||||||||
| Vested |
— | — | (521,536 | ) | 40.91 | |||||||||||
| Forfeited |
— | — | (10,400 | ) | 40.83 | |||||||||||
|
|
|
|
|
|
|
|
|
|||||||||
| Outstanding at December 31, 2009 |
— | — | 627,189 | 45.64 | ||||||||||||
| Granted |
— | — | 413,422 | 45.83 | ||||||||||||
| Vested |
— | — | (439,361 | ) | 46.90 | |||||||||||
| Forfeited |
— | — | (18,499 | ) | 46.04 | |||||||||||
|
|
|
|
|
|
|
|
|
|||||||||
| Outstanding at December 31, 2010 |
— | — | 582,751 | 44.81 | ||||||||||||
| Granted |
331,209 | 49.56 | 349,840 | 51.17 | ||||||||||||
| Vested |
(88,854 | ) | 49.37 | (416,055 | ) | 45.50 | ||||||||||
| Forfeited |
(20,746 | ) | 49.45 | (29,292 | ) | 45.04 | ||||||||||
|
|
|
|
|
|
|
|
|
|||||||||
| Outstanding at December 31, 2011 |
221,609 | $ | 49.64 | 487,244 | $ | 48.76 | ||||||||||
|
|
|
|
|
|
|
|
|
|||||||||
401(k) Plan
We maintain a 401(k) benefit plan that allows employees to contribute up to 75% of their salary (subject to Internal Revenue Service limitations) on a pretax basis. Prior to 2008, we made discretionary contributions of our common stock to the 401(k) Plan annually. Beginning in 2008, we began matching up to 6% of salary in cash. All our contributions become fully vested after the individual employee has two years of service with us. In 2011, we contributed $3.3 million to the 401(k) Plan compared to $3.1 million in 2010. Employees have a variety of investment options in the 401(k) benefit plan.
Deferred Compensation Plan
Our deferred compensation plan gives directors, officers and key employees the ability to defer all or a portion of their salaries and bonuses and invest in Range common stock or make other investments at the individual’s discretion. Range provides a partial matching contribution which vests over three years. The assets of the plans are held in a grantor trust, which we refer to as the Rabbi Trust, and are therefore available to satisfy the claims of our creditors in the event of bankruptcy or insolvency. Our stock held in the Rabbi Trust is treated as a liability award as employees are allowed to take withdrawals from the Rabbi Trust either in cash or in Range stock. The liability for the vested portion of the stock held in the Rabbi Trust is reflected in the deferred compensation liability in the accompanying consolidated balance sheets and is adjusted to fair value each reporting period by a charge or credit to deferred compensation plan expense on our consolidated statements of operations. The assets of the Rabbi Trust, other than our common stock, are invested in marketable securities and reported at their market value in other assets in the accompanying consolidated balance sheets. The deferred compensation liability reflects the vested market value of the marketable securities and Range stock held in the Rabbi Trust. Changes in the market value of the marketable securities and changes in the fair value of the deferred compensation plan liability are charged or credited to deferred compensation plan expense each quarter. We recorded mark-to-market loss of $43.2 million in 2011 compared to mark-to-market income of $10.2 million in 2010 and mark-to-market loss of $31.1 million in 2009. The Rabbi Trust held 2.8 million shares (2.3 million of vested shares) of Range stock at December 31, 2011 compared to 2.9 million shares (2.3 million of vested shares) at December 31, 2010.
F-35
Table of Contents
(14) SUPPLEMENTAL CASH FLOW INFORMATION
| Year Ended December 31, | ||||||||||||
| 2011 | 2010 | 2009 | ||||||||||
| (in thousands) | ||||||||||||
| Net cash provided from operating activities included: |
||||||||||||
| Income taxes paid (refunded from) to taxing authorities |
$ | 675 | $ | (1,359 | ) | $ | 170 | |||||
| Interest paid |
133,103 | 116,766 | 108,685 | |||||||||
| Non-cash investing and financing activities included: |
||||||||||||
| Asset retirement costs (removed) capitalized, net |
24,061 | (6,370 | ) | 4,985 | ||||||||
| Unproved property purchased with stock |
— | 20,000 | 33,726 | |||||||||
| Shares issued in lieu of bonuses |
— | — | 6,312 | |||||||||
(15) COMMITMENTS AND CONTINGENCIES
Litigation
We are the subject of, or party to, a number of pending or threatened legal actions and claims arising in the ordinary course of our business. While many of these matters involve inherent uncertainty, we believe that the amount of the liability, if any, ultimately incurred with respect to proceedings or claims will not have a material adverse effect on our consolidated financial position as a whole or on our liquidity, capital resources or future annual results of operations. We will continue to evaluate our litigation on a quarter-by-quarter basis and will establish and adjust any litigation reserves as appropriate to reflect our assessment of the then current status of litigation.
Lease Commitments
We lease certain office space, office equipment, production facilities, compressors and transportation equipment under cancelable and non-cancelable leases. Rent expense under operating leases (including renewable monthly leases and amounts related to discontinued operations) totaled $18.6 million in 2011 compared to $18.5 million in 2010 and $18.8 million in 2009. Commitments related to these lease payments are not recorded in the accompanying consolidated balance sheets. Future minimum rental commitments under non-cancelable leases having remaining lease terms in excess of one year are as follows (in thousands):
| Operating Lease Obligations |
||||
| 2012 |
$ | 12,843 | ||
| 2013 |
11,648 | |||
| 2014 |
10,923 | |||
| 2015 |
10,755 | |||
| 2016 |
8,438 | |||
| Thereafter |
27,701 | |||
| Sublease rentals |
(963 | ) | ||
|
|
|
|||
| $ | 81,345 | |||
|
|
|
|||
F-36
Table of Contents
Transportation and Gathering Contracts
We have entered firm transportation and gathering contracts with various pipeline carriers for the future transportation and gathering of natural gas, NGLs and oil production primarily from our properties in Pennsylvania. Under these contracts, we are obligated to transport or gather minimum daily natural gas volumes, or pay for any deficiencies at a specified reservation fee rate. In most cases, our production committed to these pipelines is expected to exceed the minimum daily volumes provided in the contracts. As of December 31, 2011, future minimum transportation and gathering fees under our commitments are as follows (in thousands):
| Transportation and Gathering Contracts |
||||
| 2012 |
$ | 103,030 | ||
| 2013 |
102,693 | |||
| 2014 |
102,221 | |||
| 2015 |
99,298 | |||
| 2016 |
99,424 | |||
| Thereafter |
506,798 | |||
|
|
|
|||
| $ | 1,013,464 | |||
|
|
|
|||
In addition to the amounts included in the above table, we have contracted with several pipeline companies through 2028 to deliver natural gas and ethane production volumes in Appalachia from certain Marcellus Shale wells. These agreements, which are contingent on certain pipeline modifications, are for 143,000 mcfe per day in 2012, 251,900 mcfe per day in 2013, 346,400 mcfe per day in 2014, 363,000 mcfe per day in 2015, 438,800 mcfe per day in 2016 and 443,000 mcfe per day until the end of the contractual term.
Drilling Contracts
As of December 31, 2011, we have contracts with drilling contractors to use three drilling rigs with terms of up to three years and minimum future commitments of $25.0 million in 2012, $14.7 million in 2013 and $896,000 in 2014. Early termination of these contracts at December 31, 2011 would have required us to pay maximum penalties of $22.2 million. We do not expect to pay any early termination penalties related to these contracts.
Delivery Commitments
We have various volume delivery commitments that are primarily related to our Midcontinent and Marcellus areas. We may purchase third party volumes to satisfy our commitments or pay demand fees for commitment shortfalls, should they occur. As of December 31, 2011, our delivery commitments through 2028 were as follows:
| Year Ending December 31, |
Natural Gas and Ethane (mcfe per day) |
|||
| 2012 |
1,370 | |||
| 2013 |
33,434 | |||
| 2014 |
96,174 | |||
| 2015 |
98,913 | |||
| 2016 |
99,589 | |||
| Thereafter |
90,000 | |||
Other
We have agreements in place for hydraulic fracturing including related equipment, material and labor for $70.1 million in 2012 and $52.6 million in 2013. We also have agreements to purchase seismic data for $7.2 million in 2012 and $1.8 million in 2013. We have lease acreage that is generally subject to lease expiration if initial wells are not drilled within a specified period, generally between three to five years. We do not expect to lose significant lease acreage because of failure to drill due to inadequate capital, equipment or personnel. However, based on our evaluation of prospective economics, we have allowed acreage to expire and will allow additional acreage to expire in the future. To date, our expenditures to comply with environmental or safety regulations have not been a significant component of our cost structure and is not expected to be significant in the future. However, new regulations, enforcement policies, claims for damages or other events could result in significant future costs.
F-37
Table of Contents
(16) MAJOR CUSTOMERS
We market our production on a competitive basis. Natural gas is sold under various types of contracts including month-to-month, and one to five-year contracts. Pricing on the month-to-month and short-term contracts is based largely on NYMEX, with fixed or floating basis. For one to five-year contracts, we sell our natural gas on NYMEX pricing, published regional index pricing or percentage of proceeds sales based on local indices. We sell our oil under contracts ranging in terms from month-to-month, up to as long as one year. The price for oil is generally equal to a posted price set by major purchasers in the area or is based on NYMEX pricing or fixed pricing, adjusted for quality and transportation differentials. We sell to natural gas and oil purchasers on the basis of price, credit quality and service reliability. Our NGL production is typically sold to natural gas processors or, in some cases, to other purchasers or users of NGLs. For the year ended December 31, 2011, we had two customers that accounted for 10% or more of total natural gas, NGLs and oil sales. For the year ended December 31, 2010, we had no customers that accounted for 10% or more of total natural gas, NGLs and oil sales. For the year ended December 31, 2009, we had no customers that accounted for 10% or more of total natural gas, NGLs and oil sales. We believe that the loss of any one customer would not have an adverse effect on our ability to sell our Natural gas, NGLs and oil production.
(17) EQUITY METHOD INVESTMENTS
We account for our investments in entities over which we have significant influence, but not control, using the equity method of accounting. Under the equity method of accounting, we record our proportionate share of net earnings, declared dividends and partnership distributions based on the most recently available financial statements of the investee. We also evaluate our equity method investments for potential impairment whenever events or changes in circumstances indicate that there is an other than temporary decline in value of the investment. Such events may include sustained operating losses by the investee or long-term negative changes in the investee’s industry. For our investment in Whipstock, these indicators were present during the year ended December 31, 2009 and as a result, we recognized impairment charges of $9.0 million related to our equity method investment in 2009.
Investment in Whipstock Natural Gas Services, LLC
In 2006, we acquired a 50% interest in Whipstock Natural Gas Services, LLC (“Whipstock”), an unconsolidated investee in the business of providing oil and gas drilling equipment, well servicing rigs and equipment, and other well services in Appalachia. On the acquisition date, we contributed cash of $11.7 million representing the fair value of 50% of the membership interest in Whipstock.
Whipstock follows a calendar year basis of financial reporting consistent with us and our equity in Whipstock’s earnings from the acquisition date is included in other revenue in the accompanying statements of operations for 2011, 2010 and 2009. During the year ended December 31, 2009, we received $301,000 in cash distributions from Whipstock. In determining our proportionate share of the net earnings of Whipstock, certain adjustments are required to be made to Whipstock’s reported results to eliminate the profits recognized by Whipstock for services provided to us. For the year ended December 31, 2011, our equity in the losses of Whipstock totaled $487,000 compared to losses of $2.2 million in 2010 and losses of $13.1 million in 2009. In 2011, equity in the losses of Whipstock was reduced by $6,000 to eliminate the profit on services provided to us compared to $1.1 million in 2010 and $422,000 in 2009. In addition, equity in 2009 losses of Whipstock reflected a $9.0 million impairment charge due to an other than temporary decline in the fair value of our investment. Our fair value determination was based on a discounted cash flow analysis which qualifies as a level 3 fair value measurement in the fair value hierarchy table. Our net book value in this equity investment was $1.1 million at December 31, 2011. Range and Whipstock have entered into an agreement whereby Whipstock will provide us with the right of first refusal such that we will have the opportunity to secure services from Whipstock in preference to and in advance of Whipstock entering into additional commitments for services with other customers. All services provided to us are based on Whipstock’s usual and customary terms.
Investment in Nora Gathering, LLC
In May 2007, we completed the initial closing of a joint development arrangement with EQT Corporation (“EQT”). Pursuant to the terms of the arrangement, Range and EQT (“the parties”) agreed to, among other things, form a new pipeline and natural gas gathering operations entity, Nora Gathering, LLC (“NGLLC”). NGLLC is an unconsolidated investee created by the parties for the purpose of conducting pipeline, natural gas gathering, and transportation operations associated with the parties’ collective interests in properties in the Nora Field. In connection with the acquisition, we contributed cash of $94.7 million for a 50% membership interest in NGLLC. In 2011 or 2010, Range and EQT made no additional contributions to fund the expansion of the Nora Field gathering system infrastructure compared to $6.4 million of additional capital in 2009.
F-38
Table of Contents
NGLLC follows a calendar year basis of financial reporting consistent with Range and our equity in NGLLC earnings from the acquisition date is included in other revenue in the accompanying statements of operations for 2011, 2010 and 2009. There were no dividends or partnership distributions received from NGLLC during the years ended December 31, 2010 or December 31, 2009. In 2011, we received partnership distributions of $23.5 million. In determining our proportionate share of the net earnings of NGLLC, certain adjustments are required to be made to NGLLC’s reported results to eliminate the profits recognized by NGLLC included in the gathering and transportation fees charged to us on production in the Nora field. For the year ended December 31, 2011, our equity in the losses of NGLLC of $563,000 reflects a reduction of $7.7 million to eliminate the profit on the gathering and transportation fees charged to us. For the year ended December 31, 2010, our equity in the income of NGLLC of $684,000 reflects a reduction of $8.8 million to eliminate the profit on gathering and transportation fees charged to us. For the year ended December 31, 2009, our equity in the earnings of NGLLC of $629,600 reflects a reduction of $7.0 million to eliminate the profit on gathering and transportation fees charged to us. Our net book value in this equity investment was $137.0 million at December 31, 2011.
(18) OFFICE CLOSING AND EXIT ACTIVITIES
In February 2010, we entered into an agreement to sell our natural gas and oil properties in Ohio. The first quarter 2010 includes $5.1 million accrued severance costs, which is reflected in termination costs in the accompanying consolidated statements of operations. As part of their severance agreement, our Ohio employees’ vesting of SARs and restricted stock grants was accelerated, increasing termination costs for stock compensation expense by approximately $2.8 million.
In third quarter 2009, we announced the closing of our Gulf Coast area administrative and operations office in Houston, Texas. The properties are now operated from our Southwest area office in Fort Worth. The year ended December 31, 2009 includes $1.3 million of accrued severance, lease termination and accelerated vesting of SARs and restricted stock grants costs. Expenses related to lease termination and severance costs are included in termination costs in the accompanying consolidated statements of operations.
In fourth quarter 2009 we sold our natural gas properties in New York. We accrued $635,000 of severance costs related to this divestiture and the cost is included in termination costs in the accompanying consolidated statements of operations. The following table details our exit activities (in thousands):
| 2011 | 2010 | 2009 | ||||||||||
| Beginning balance |
$ | 1,092 | $ | 1,568 | $ | — | ||||||
| Accrued one-time termination costs |
— | 5,138 | 1,895 | |||||||||
| Office lease |
— | 514 | 252 | |||||||||
| Payments |
(1,040 | ) | (6,128 | ) | (579 | ) | ||||||
|
|
|
|
|
|
|
|||||||
| Ending balance |
$ | 52 | $ | 1,092 | $ | 1,568 | ||||||
|
|
|
|
|
|
|
|||||||
F-39
Table of Contents
(19) SELECTED QUARTERLY FINANCIAL DATA (UNAUDITED)
The following tables set forth unaudited financial information on a quarterly basis for each of the last two years. We have revised prior period natural gas, NGLs and oil sales and costs and total expenses as discussed in Note 2. Natural gas, NGLs and oil sales were increased by $25.1 million in the first quarter of 2011, $28.7 million in the second quarter of 2011 and $32.4 million in the third quarter of 2011. Natural gas, NGLs and oil sales were increased by $13.0 million in the first quarter of 2010, $14.4 million in the second quarter of 2010, $15.5 million in the third quarter of 2010 and $20.0 million in the fourth quarter of 2010. Income (loss) from continuing operations did not change because the offsetting amounts are included in transportation, gathering and compression expense (in thousands). Abandonment and impairment of unproved properties in the fourth quarter 2011 includes $3.0 million related to prior years. In addition, 2011 deferred tax expense in fourth quarter includes $3.1 million related to prior years.
| 2011 | ||||||||||||||||||||
| March | June | September | December | Total | ||||||||||||||||
| Revenues and other income: |
||||||||||||||||||||
| Natural gas, NGLs and oil sales |
$ | 251,963 | $ | 285,353 | $ | 304,230 | $ | 331,720 | $ | 1,173,266 | ||||||||||
| Derivative fair value (loss) income |
(40,834 | ) | 53,039 | 65,761 | (37,879 | ) | 40,087 | |||||||||||||
| Gain (loss) on the sale of assets |
139 | (1,622 | ) | 203 | 3,540 | 2,260 | ||||||||||||||
| Other |
1,390 | (1,475 | ) | 442 | 2,686 | 3,043 | ||||||||||||||
|
|
|
|
|
|
|
|
|
|
|
|||||||||||
| Total revenue and other income |
212,658 | 335,295 | 370,636 | 300,067 | 1,218,656 | |||||||||||||||
|
|
|
|
|
|
|
|
|
|
|
|||||||||||
| Costs and expenses: |
||||||||||||||||||||
| Direct operating |
28,717 | 28,509 | 29,828 | 25,918 | 112,972 | |||||||||||||||
| Transportation, gathering and compression |
25,082 | 28,666 | 32,431 | 34,576 | 120,755 | |||||||||||||||
| Production and ad valorem taxes |
6,879 | 7,550 | 7,317 | 5,920 | 27,666 | |||||||||||||||
| Exploration |
27,187 | 11,592 | 17,606 | 24,982 | 81,367 | |||||||||||||||
| Abandonment and impairment of unproved properties |
16,537 | 18,900 | 16,627 | 27,639 | 79,703 | |||||||||||||||
| General and administrative |
33,959 | 39,120 | 35,907 | 42,205 | 151,191 | |||||||||||||||
| Deferred compensation plan |
30,630 | (5,778 | ) | 8,717 | 9,640 | 43,209 | ||||||||||||||
| Interest expense |
24,779 | 31,383 | 34,181 | 34,709 | 125,052 | |||||||||||||||
| Loss on early extinguishment of debt |
— | 18,580 | (4 | ) | — | 18,576 | ||||||||||||||
| Depletion, depreciation and amortization |
72,216 | 78,294 | 93,619 | 97,092 | 341,221 | |||||||||||||||
| Impairment of proved properties |
— | — | 38,681 | — | 38,681 | |||||||||||||||
|
|
|
|
|
|
|
|
|
|
|
|||||||||||
| Total costs and expenses |
265,986 | 256,816 | 314,910 | 302,681 | 1,140,393 | |||||||||||||||
|
|
|
|
|
|
|
|
|
|
|
|||||||||||
| (Loss) income from continuing operations before income taxes |
(53,328 | ) | 78,479 | 55,726 | (2,614 | ) | 78,263 | |||||||||||||
| Income tax (benefit) expense |
||||||||||||||||||||
| Current |
— | 8 | (7 | ) | 636 | 637 | ||||||||||||||
| Deferred |
(19,897 | ) | 32,695 | 22,547 | (425 | ) | 34,920 | |||||||||||||
|
|
|
|
|
|
|
|
|
|
|
|||||||||||
| (19,897 | ) | 32,703 | 22,540 | 211 | 35,557 | |||||||||||||||
|
|
|
|
|
|
|
|
|
|
|
|||||||||||
| (Loss) income from continuing operations |
(33,431 | ) | 45,776 | 33,186 | (2,825 | ) | 42,706 | |||||||||||||
| Discontinued operations, net of taxes |
8,398 | 5,517 | 1,569 | (164 | ) | 15,320 | ||||||||||||||
|
|
|
|
|
|
|
|
|
|
|
|||||||||||
| Net (loss) income |
$ | (25,033 | ) | $ | 51,293 | $ | 34,755 | $ | (2,989 | ) | $ | 58,026 | ||||||||
|
|
|
|
|
|
|
|
|
|
|
|||||||||||
| (Loss) income per common share: |
||||||||||||||||||||
| Basic-(loss) income from continuing operations |
$ | (0.21 | ) | $ | 0.28 | $ | 0.21 | $ | (0.02 | ) | $ | 0.26 | ||||||||
| -discontinued operations |
0.05 | 0.04 | 0.01 | — | 0.10 | |||||||||||||||
|
|
|
|
|
|
|
|
|
|
|
|||||||||||
| -net (loss) income |
$ | (0.16 | ) | $ | 0.32 | $ | 0.22 | $ | (0.02 | ) | $ | 0.36 | ||||||||
|
|
|
|
|
|
|
|
|
|
|
|||||||||||
| Diluted-(loss) income from continuing operations |
$ | (0.21 | ) | $ | 0.28 | $ | 0.20 | $ | (0.02 | ) | $ | 0.26 | ||||||||
| -discontinued operations |
0.05 | 0.04 | 0.01 | — | 0.10 | |||||||||||||||
|
|
|
|
|
|
|
|
|
|
|
|||||||||||
| -net (loss) income |
$ | (0.16 | ) | $ | 0.32 | $ | 0.21 | $ | (0.02 | ) | $ | 0.36 | ||||||||
|
|
|
|
|
|
|
|
|
|
|
|||||||||||
F-40
Table of Contents
| 2010 | ||||||||||||||||||||
| March | June | September | December | Total | ||||||||||||||||
| Revenues and other income: |
||||||||||||||||||||
| Natural gas, NGLs and oil sales |
$ | 200,633 | $ | 187,523 | $ | 203,255 | $ | 231,879 | $ | 823,290 | ||||||||||
| Derivative fair value income (loss) |
42,333 | 6,546 | 9,981 | (7,226 | ) | 51,634 | ||||||||||||||
| Gain (loss) on the sale of assets |
67,913 | 10,176 | 67 | (1,514 | ) | 76,642 | ||||||||||||||
| Other |
506 | 1,300 | (2,650 | ) | 914 | 70 | ||||||||||||||
|
|
|
|
|
|
|
|
|
|
|
|||||||||||
| Total revenue and other income |
311,385 | 205,545 | 210,653 | 224,053 | 951,636 | |||||||||||||||
|
|
|
|
|
|
|
|
|
|
|
|||||||||||
| Costs and expenses: |
||||||||||||||||||||
| Direct operating |
21,836 | 21,171 | 25,535 | 27,732 | 96,274 | |||||||||||||||
| Transportation, gathering and compression |
12,960 | 14,370 | 15,498 | 20,009 | 62,837 | |||||||||||||||
| Production and ad valorem taxes |
6,542 | 5,663 | 6,903 | 6,999 | 26,107 | |||||||||||||||
| Exploration |
14,139 | 14,420 | 15,225 | 16,722 | 60,506 | |||||||||||||||
| Abandonment and impairment of unproved properties |
6,551 | 9,727 | 14,435 | 19,025 | 49,738 | |||||||||||||||
| General and administrative |
28,170 | 35,836 | 36,523 | 40,042 | 140,571 | |||||||||||||||
| Termination costs |
7,938 | — | — | 514 | 8,452 | |||||||||||||||
| Deferred compensation plan |
(5,712 | ) | (14,135 | ) | (5,347 | ) | 14,978 | (10,216 | ) | |||||||||||
| Interest expense |
20,931 | 21,271 | 23,363 | 25,100 | 90,665 | |||||||||||||||
| Loss on early extinguishment of debt |
— | — | 5,351 | — | 5,351 | |||||||||||||||
| Depletion, depreciation and amortization |
64,807 | 67,813 | 69,730 | 72,888 | 275,238 | |||||||||||||||
| Impairment of proved properties |
6,505 | — | — | — | 6,505 | |||||||||||||||
|
|
|
|
|
|
|
|
|
|
|
|||||||||||
| Total costs and expenses |
184,667 | 176,136 | 207,216 | 244,009 | 812,028 | |||||||||||||||
|
|
|
|
|
|
|
|
|
|
|
|||||||||||
| Income (loss) from continuing operations before income taxes |
126,718 | 29,409 | 3,437 | (19,956 | ) | 139,608 | ||||||||||||||
| Income tax expense (benefit) |
||||||||||||||||||||
| Current |
— | — | (10 | ) | (826 | ) | (836 | ) | ||||||||||||
| Deferred |
49,012 | 11,763 | 794 | (9,823 | ) | 51,746 | ||||||||||||||
|
|
|
|
|
|
|
|
|
|
|
|||||||||||
| 49,012 | 11,763 | 784 | (10,649 | ) | 50,910 | |||||||||||||||
|
|
|
|
|
|
|
|
|
|
|
|||||||||||
| Income (loss) from continuing operations |
77,706 | 17,646 | 2,653 | (9,307 | ) | 88,698 | ||||||||||||||
| Discontinued operations, net of taxes |
(127 | ) | (8,594 | ) | (10,821 | ) | (308,412 | ) | (327,954 | ) | ||||||||||
|
|
|
|
|
|
|
|
|
|
|
|||||||||||
| Net income (loss) |
$ | 77,579 | $ | 9,052 | $ | (8,168 | ) | $ | (317,719 | ) | $ | (239,256 | ) | |||||||
|
|
|
|
|
|
|
|
|
|
|
|||||||||||
| Income (loss) per common share: |
||||||||||||||||||||
| Basic-income (loss) from continuing operations |
$ | 0.49 | $ | 0.11 | $ | 0.02 | $ | (0.06 | ) | $ | 0.56 | |||||||||
| -discontinued operations |
— | (0.05 | ) | (0.07 | ) | (1.96 | ) | (2.09 | ) | |||||||||||
|
|
|
|
|
|
|
|
|
|
|
|||||||||||
| -net income (loss) |
$ | 0.49 | $ | 0.06 | $ | (0.05 | ) | $ | (2.02 | ) | $ | (1.53 | ) | |||||||
|
|
|
|
|
|
|
|
|
|
|
|||||||||||
| Diluted-income (loss) from continuing operations |
$ | 0.48 | $ | 0.11 | $ | 0.02 | $ | (0.06 | ) | $ | 0.55 | |||||||||
| -discontinued operations |
— | (0.05 | ) | (0.07 | ) | (1.96 | ) | (2.07 | ) | |||||||||||
|
|
|
|
|
|
|
|
|
|
|
|||||||||||
| -net income (loss) |
$ | 0.48 | $ | 0.06 | $ | (0.05 | ) | $ | (2.02 | ) | $ | (1.52 | ) | |||||||
|
|
|
|
|
|
|
|
|
|
|
|||||||||||
F-41
Table of Contents
Principal Unconsolidated Investees (unaudited)
| Company |
December 31, 2011 Ownership | Activity | ||
| Whipstock Natural Gas Services, LLC |
50% | Drilling services | ||
| Nora Gathering, LLC |
50% | Gas gathering and transportation |
(20) SUPPLEMENTAL INFORMATION ON NATURAL GAS AND OIL EXPLORATION, DEVELOPMENT AND PRODUCTION ACTIVITIES (UNAUDITED)
Our gas natural and oil producing activities are conducted onshore within the continental United States and all of our proved reserves are located within the United States.
Capitalized Costs and Accumulated Depreciation, Depletion and Amortization (a)
| December 31, | ||||||||||||
| 2011 | 2010 | 2009 | ||||||||||
| (in thousands) | ||||||||||||
| Natural gas and oil properties: |
||||||||||||
| Properties subject to depletion |
$ | 6,035,429 | $ | 4,742,248 | $ | 4,144,007 | ||||||
| Unproved properties |
748,598 | 648,143 | 572,471 | |||||||||
|
|
|
|
|
|
|
|||||||
| Total |
6,784,027 | 5,390,391 | 4,716,478 | |||||||||
| Accumulated depreciation, depletion and amortization |
(1,626,461 | ) | (1,306,378 | ) | (1,164,843 | ) | ||||||
|
|
|
|
|
|
|
|||||||
| Net capitalized costs |
$ | 5,157,566 | $ | 4,084,013 | $ | 3,551,635 | ||||||
|
|
|
|
|
|
|
|||||||
| (a) | Includes capitalized asset retirement costs and the associated accumulated amortization. |
Costs Incurred for Property Acquisition, Exploration and Development (a)
| Year Ended December 31, | ||||||||||||
| 2011 | 2010 | 2009 | ||||||||||
| (in thousands) | ||||||||||||
| Acquisitions: |
||||||||||||
| Unproved leasehold |
$ | — | $ | 3,697 | $ | — | ||||||
| Proved oil and gas properties |
— | 130,767 | — | |||||||||
| Asset retirement obligations |
— | 556 | — | |||||||||
| Acreage purchases (b) |
220,576 | 151,572 | 162,172 | |||||||||
| Development |
1,007,049 | 727,720 | 374,970 | |||||||||
| Exploration: |
||||||||||||
| Drilling |
226,920 | 50,433 | 49,029 | |||||||||
| Expense |
77,259 | 56,298 | 39,873 | |||||||||
| Stock-based compensation expense |
4,108 | 4,209 | 4,817 | |||||||||
| Gas gathering facilities: |
||||||||||||
| Development |
53,387 | 19,627 | 27,937 | |||||||||
|
|
|
|
|
|
|
|||||||
| Subtotal |
1,589,299 | 1,144,879 | 658,798 | |||||||||
| Asset retirement obligations |
24,061 | (6,370 | ) | 4,985 | ||||||||
|
|
|
|
|
|
|
|||||||
| Total – continuing operations |
1,613,360 | 1,138,509 | 663,783 | |||||||||
| Discontinued operations |
3,241 | 73,369 | 150,461 | |||||||||
|
|
|
|
|
|
|
|||||||
| Total costs incurred |
$ | 1,616,601 | $ | 1,211,878 | $ | 814,244 | ||||||
|
|
|
|
|
|
|
|||||||
| (a) | Includes cost incurred whether capitalized or expensed. |
| (b) | 2009 includes $20.0 million accrued for acreage purchases for which 380,229 shares were issued in January 2010. |
F-42
Table of Contents
Estimated Quantities of Proved Oil and Gas Reserves (Unaudited)
Reserves of natural gas, natural gas liquids, crude oil and condensate are estimated by our petroleum engineering staff and are adjusted to reflect contractual arrangements and royalty rates in effect at the end of each year. Many assumptions and judgmental decisions are required to estimate reserves. Reported quantities are subject to future revisions, some of which may be substantial, as additional information becomes available from reservoir performance, new geological and geophysical data, additional drilling, technological advancements, price changes and other economic factors.
Recent SEC and FASB Rule-Making Activity
In December 2008, the SEC announced that it had approved revisions designed to modernize the natural gas and oil company reserves reporting requirements. We adopted the rules effective December 31, 2009 and the rule changes, including those related to pricing and technology, are included in our reserves estimates for 2011, 2010 and 2009.
Reserve Audit
All reserve information in this report is based on estimates prepared by our petroleum engineering staff. At year-end 2011, the following independent petroleum consultants conducted an audit of our reserves: DeGolyer and MacNaughton (Southwest) and Wright and Company, Inc. (Appalachia). These engineers were selected for their geographic expertise and their historical experience in engineering certain properties. At December 31, 2011, these consultants collectively audited approximately 89% of our proved reserves. Copies of the summary reserve reports prepared by each of these independent petroleum consultants are included as an exhibit to this Annual Report on Form 10-K. The technical person at each independent petroleum consulting firm responsible for reviewing the reserve estimates presented herein meet the requirements regarding qualifications, independence, objectivity and confidentiality set forth in the Standards Pertaining to the Estimating and Auditing of Oil and Gas Reserves Information promulgated by the Society of Petroleum Engineers. We maintain an internal staff of petroleum engineers and geoscience professionals who work closely with our independent petroleum consultants to ensure the integrity, accuracy and timeliness of data furnished to independent petroleum consultants for their reserves audit process. Throughout the year, our technical team meets regularly with representatives of each of our independent petroleum consultants to review properties and discuss methods and assumptions. While we have no formal committee specifically designated to review reserves reporting and the reserves estimation process, our senior management reviews and approves any internally estimated significant changes to our proved reserves. We provide historical information to our consultants for our largest producing properties such as ownership interest; natural gas and oil production; well test data; commodity prices and operating and development costs. The consultants perform an independent analysis and differences are reviewed with our Senior Vice President of Reservoir Engineering and Economics. In some cases, additional meetings are held to review additional reserve work performed by the technical teams related to any identified reserve differences.
Historical variances between our reserve estimates and the aggregate estimates of our consultants have been less than 5%. All of our reserve estimates are reviewed and approved by our Senior Vice President of Reservoir Engineering and Economics, who reports directly to our President and Chief Executive Officer. Mr. Alan Farquharson, our Senior Vice President of Reservoir Engineering and Economics, holds a Bachelor of Science degree in Electrical Engineering from the Pennsylvania State University. Before joining Range, he held various technical and managerial positions with Amoco, Hunt Oil and Union Pacific Resources. During the year, our reserves group may also perform separate, detailed technical reviews of reserve estimates for significant acquisitions or for properties with problematic indicators such as excessively long lives, sudden changes in performance or changes in economic or operating conditions.
The SEC defines proved reserves as those volumes of natural gas, natural gas liquids, crude oil and condensate that geological and engineering data demonstrate with reasonable certainty are recoverable in future years from known reservoirs under existing economic and operating conditions. Proved developed reserves are those proved reserves, which can be expected to be recovered from existing wells with existing equipment and operating methods. Proved undeveloped reserves are volumes expected to be recovered from new wells on undrilled acreage or from existing wells where a relatively major expenditure is required for recompletion. Reserves on undrilled acreage shall be limited to those drilling units offsetting productive units that are reasonably certain of production when drilled. Proved reserves for other undrilled units can be claimed only where it can be demonstrated with certainty that there is continuity of production from the existing productive formation. Proved undeveloped reserves can only be assigned to acreage for which improved recovery technology is contemplated when such techniques have been proven effective by actual tests in the area and in the same reservoir. Undrilled locations can be classified as having undeveloped reserves only if a development plan has been adopted indicating they are scheduled to be drilled within five years, unless specific circumstances, justify a longer time.
The reported value of proved reserves is not necessarily indicative of either fair market value or present value of future net cash flows because prices, costs and governmental policies do not remain static, appropriate discount rates may vary, and extensive judgment is required to estimate the timing of production. Other logical assumptions would likely have resulted in significantly different amounts.
F-43
Table of Contents
The average realized prices used at December 31, 2011 to estimate reserve information were $85.59 per barrel of oil, $49.24 per barrel for natural gas liquids and $3.55 per mcf for gas, using benchmark (NYMEX) of $95.61 per barrel and $4.12 per Mmbtu. The average realized prices used at December 31, 2010 to estimate reserve information were $72.51 per barrel of oil, $39.14 per barrel for natural gas liquids and $3.70 per mcf for gas, using benchmark prices (NYMEX) of $79.81 per barrel and $4.38 per Mmbtu. The average realized prices used at December 31, 2009 to estimate reserve information were $54.65 per barrel of oil, $34.05 per barrel for natural gas liquids and $3.19 per mcf for gas, using benchmark prices (NYMEX) of $60.85 per barrel and $3.87 per Mmbtu. The average realized prices used to estimate reserves is net of third party transportation, gathering and compression expense.
| Natural Gas | NGLs | Crude Oil | Natural Gas Equivalents (a) |
|||||||||||||
| (Mmcf) | (Mbbls) | (Mbbls) | (Mmcfe) | |||||||||||||
| Proved developed and undeveloped reserves: |
||||||||||||||||
| Balance, December 31, 2008 |
2,213,546 | 23,849 | 49,487 | 2,653,565 | ||||||||||||
| Revisions |
(37,497 | ) | 8,434 | (1,536 | ) | 3,890 | ||||||||||
| Extensions, discoveries and additions |
620,114 | 21,492 | 3,479 | 769,939 | ||||||||||||
| Purchases |
— | — | — | — | ||||||||||||
| Property sales |
(50,797 | ) | — | (14,791 | ) | (139,543 | ) | |||||||||
| Production |
(130,649 | ) | (2,187 | ) | (2,557 | ) | (159,112 | ) | ||||||||
|
|
|
|
|
|
|
|
|
|||||||||
| Balance, December 31, 2009 |
2,614,717 | 51,588 | 34,082 | 3,128,739 | ||||||||||||
| Revisions |
3,599 | 26,832 | (2,672 | ) | 148,558 | |||||||||||
| Extensions, discoveries and additions |
1,089,632 | 48,792 | 4,663 | 1,410,359 | ||||||||||||
| Purchases |
124,981 | — | — | 124,981 | ||||||||||||
| Property sales |
(124,369 | ) | — | (10,865 | ) | (189,558 | ) | |||||||||
| Production |
(142,034 | ) | (4,490 | ) | (1,969 | ) | (180,789 | ) | ||||||||
|
|
|
|
|
|
|
|
|
|||||||||
| Balance, December 31, 2010 (b) |
3,566,526 | 122,722 | 23,239 | 4,442,290 | ||||||||||||
| Revisions |
73,643 | 18,627 | 6,522 | 224,542 | ||||||||||||
| Extensions, discoveries and additions |
1,304,324 | 26,591 | 4,915 | 1,493,357 | ||||||||||||
| Purchases |
— | — | — | — | ||||||||||||
| Property sales |
(777,816 | ) | (19,852 | ) | (1,176 | ) | (903,983 | ) | ||||||||
| Production |
(157,001 | ) | (5,573 | ) | (1,968 | ) | (202,245 | ) | ||||||||
|
|
|
|
|
|
|
|
|
|||||||||
| Balance, December 31, 2011 |
4,009,676 | 142,515 | 31,532 | 5,053,961 | ||||||||||||
|
|
|
|
|
|
|
|
|
|||||||||
| Proved developed reserves: |
||||||||||||||||
| December 31, 2009 |
1,445,705 | 26,205 | 20,626 | 1,726,696 | ||||||||||||
|
|
|
|
|
|
|
|
|
|||||||||
| December 31, 2010 |
1,762,766 | 53,071 | 17,050 | 2,183,488 | ||||||||||||
|
|
|
|
|
|
|
|
|
|||||||||
| December 31, 2011 |
1,907,209 | 64,472 | 17,872 | 2,401,274 | ||||||||||||
|
|
|
|
|
|
|
|
|
|||||||||
| Proved undeveloped reserves: |
||||||||||||||||
| December 31, 2009 |
1,169,012 | 25,382 | 13,457 | 1,402,043 | ||||||||||||
|
|
|
|
|
|
|
|
|
|||||||||
| December 31, 2010 |
1,803,760 | 69,651 | 6,189 | 2,258,802 | ||||||||||||
|
|
|
|
|
|
|
|
|
|||||||||
| December 31, 2011 |
2,102,467 | 78,043 | 13,660 | 2,652,687 | ||||||||||||
|
|
|
|
|
|
|
|
|
|||||||||
| (a) | Oil and NGLs are converted to mcfe at the rate of one barrel equals six mcf based upon the approximate relative energy content of oil to natural gas, which is not necessarily indicative of the relationship of oil and natural gas prices. |
| (b) | Total proved reserves at December 31, 2010 includes 906,371 Mmcfe related to discontinued operations of which 408,710 Mmcfe is proved undeveloped. |
F-44
Table of Contents
During 2011, we added approximately 1.5 Tcfe of proved reserves from drilling activities and evaluations of proved areas, primarily in the Marcellus Shale. Approximately 87% of the 2011 reserve additions were attributable to natural gas. Revisions of previous estimates of 225 Bcfe were primarily positive performance revisions for natural gas properties, primarily in the Marcellus Shale.
During 2010, we added approximately 1.4 Tcfe of proved reserves from drilling activities and evaluations of proved areas primarily in the Marcellus Shale and the Barnett Shale. Approximately 77% of 2010 reserve additions were attributable to natural gas. Revisions of previous estimates of 148.6 Bcfe for the year ended December 31, 2010 included a positive revision of 40.5 Bcfe due to an increase in the average natural gas price used for the December 31, 2010 reserve estimation as compared to the price used in the previous year estimate. Revisions of previous estimates in 2010 also include positive performance revisions for natural gas properties primarily in the Barnett Shale.
During 2009, we added approximately 770 Bcfe of proved reserves from drilling activities and evaluations of proved areas primarily in the Barnett Shale and the Marcellus Shale. Approximately 81% of 2009 reserve additions were attributable to natural gas. Positive performance revisions of 89.9 Bcfe, primarily in the Marcellus Shale, were mostly offset by a negative price revision of 86.0 Bcfe due to a decrease in the natural gas price used for the December 31, 2009 reserve estimation as compared to the price used in the previous year estimate, resulting in a net positive revision of previous estimates of 3.9 Bcfe.
The following details the changes in proved undeveloped reserves for 2011 (Mmcfe):
| Beginning proved undeveloped reserves at December 31, 2010 |
2,258,802 | |||
| Undeveloped reserves transferred to developed |
(364,150 | ) | ||
| Revisions |
(15,098 | ) | ||
| Purchases/sales |
(408,740 | ) | ||
| Extension and discoveries |
1,181,873 | |||
|
|
|
|||
| Ending proved undeveloped reserves at December 31, 2011 |
2,652,687 | |||
|
|
|
Approximately $374.2 million was spent during 2011 related to undeveloped reserves that were transferred to developed reserves. Estimated future development costs relating to the development of proved undeveloped reserves are projected to be approximately $550.8 million in 2012, $805.3 million in 2013 and $829.2 million in 2014. Included in proved undeveloped reserves at December 31, 2011 are approximately 4,946 Mmcfe of reserves (less than 1% of total proved undeveloped reserves) that have been reported for five or more years. All proved undeveloped drilling locations are scheduled to be drilled prior to the end of 2016.
Standardized Measure of Discounted Future Net Cash Flows Relating to Proved Oil and Gas Reserves (Unaudited)
The following summarizes the policies we used in the preparation of the accompanying natural gas, NGLs and oil reserve disclosures, standardized measures of discounted future net cash flows from proved natural gas, NGLs and oil reserves and the reconciliations of standardized measures from year to year. The information disclosed is an attempt to present the information in a manner comparable with industry peers.
The information is based on estimates of proved reserves attributable to our interest in natural gas and oil properties as of December 31 of the years presented. These estimates were prepared by our petroleum engineering staff. Proved reserves are estimated quantities of natural gas, NGLs and crude oil, which geological and engineering data demonstrate with reasonable certainty to be recoverable in future years from known reservoirs under existing economic and operating conditions.
The standardized measure of discounted future net cash flows from production of proved reserves was developed as follows:
| 1. | Estimates are made of quantities of proved reserves and future amounts expected to be produced based on current year-end economic conditions. |
| 2. | Prior to 2009, estimated future cash inflows were calculated by applying current year-end prices of natural gas and oil relating to our proved reserves to the quantities of those reserves produced in each future year. For the year ended 2011, 2010 and 2009, estimated future cash inflows are calculated by applying a twelve-month average price of natural gas, NGLs and oil relating to our proved reserves to the quantities of those reserves produced in each future year. |
| 3. | Future cash flows are reduced by estimated production costs, administrative costs, costs to develop and produce the proved reserves and abandonment costs, all based on current year-end economic conditions. Future income tax expenses are based on current year-end statutory tax rates giving effect to the remaining tax basis in the natural gas, NGLs and oil properties, other deductions, credits and allowances relating to our proved natural gas and oil reserves. |
| 4. | The resulting future net cash flows are discounted to present value by applying a discount rate of 10%. |
F-45
Table of Contents
The standardized measure of discounted future net cash flows does not purport, nor should it be interpreted, to present the fair value of our natural gas, NGLs and oil reserves. An estimate of fair value would also take into account, among other things, the recovery of reserves not presently classified as proved, anticipated future changes in prices and costs and a discount factor more representative of the time value of money and the risks inherent in reserve estimates.
The standardized measure of discounted future net cash flows relating to proved natural gas, NGL and oil reserves, which includes reserves associated with discontinued operations in 2010, is as follows and excludes cash flows associated with hedges outstanding at each of the respective reporting dates. Future cash inflows are net of third party transportation, gathering and compression expense.
| As of December 31, | ||||||||
| 2011 | 2010 | |||||||
| (in thousands) | ||||||||
| Future cash inflows |
$ | 23,954,048 | $ | 19,676,630 | ||||
| Future costs: |
||||||||
| Production |
(5,113,902 | ) | (4,305,292 | ) | ||||
| Development |
(3,230,577 | ) | (2,855,407 | ) | ||||
|
|
|
|
|
|||||
| Future net cash flows before income taxes |
15,609,569 | 12,515,931 | ||||||
| Future income tax expense |
(5,040,104 | ) | (3,923,264 | ) | ||||
|
|
|
|
|
|||||
| Total future net cash flows before 10% discount |
10,569,465 | 8,592,667 | ||||||
| 10% annual discount |
(6,054,568 | ) | (5,113,541 | ) | ||||
|
|
|
|
|
|||||
| Standardized measure of discounted future net cash flows |
$ | 4,514,897 | $ | 3,479,126 | ||||
|
|
|
|
|
|||||
The following table summarizes changes in the standardized measure of discounted future net cash flows.
| As of December 31, | ||||||||||||
| 2011 | 2010 | 2009 | ||||||||||
| (in thousands) | ||||||||||||
| Revisions of previous estimates: |
||||||||||||
| Changes in prices |
$ | 422,080 | $ | 957,994 | $ | (992,809 | ) | |||||
| Revisions in quantities |
326,240 | 190,874 | 4,124 | |||||||||
| Changes in future development costs |
(346,378 | ) | (474,058 | ) | (375,344 | ) | ||||||
| Accretion of discount |
464,735 | 259,280 | 340,025 | |||||||||
| Net change in income taxes |
(400,690 | ) | (666,517 | ) | 317,158 | |||||||
| Purchases of reserves in place |
— | 160,580 | — | |||||||||
| Additions to proved reserves from extensions, discoveries and improved recovery |
2,169,706 | 1,812,077 | 816,278 | |||||||||
| Production |
(911,873 | ) | (744,354 | ) | (673,907 | ) | ||||||
| Development costs incurred during the period |
513,551 | 298,624 | 316,523 | |||||||||
| Sales of natural gas and oil |
(1,313,401 | ) | (243,551 | ) | (147,942 | ) | ||||||
| Timing and other |
111,801 | (162,912 | ) | (94,397 | ) | |||||||
|
|
|
|
|
|
|
|||||||
| Net change for the year |
1,035,771 | 1,388,037 | (490,291 | ) | ||||||||
| Beginning of year |
3,479,126 | 2,091,089 | 2,581,380 | |||||||||
|
|
|
|
|
|
|
|||||||
| End of year |
$ | 4,514,897 | $ | 3,479,126 | $ | 2,091,089 | ||||||
|
|
|
|
|
|
|
|||||||
F-46
Table of Contents
RANGE RESOURCES CORPORATION
INDEX TO EXHIBITS
| Exhibit Number |
Exhibit Description | |
| 3.1 | Restated Certificate of Incorporation of Range Resources Corporation (incorporated by reference to Exhibit 3.1.1 to our Form 10-Q (File No. 001-12209) as filed with the SEC on May 5, 2004) as amended by the Certificate of First Amendment to Restated Certificate of Incorporation of Range Resources Corporation (incorporated by reference to Exhibit 3.1 to our Form 10-Q (File No. 001-12209) as filed with the SEC on July 28, 2005 and the Certificate of Second Amendment to the Restated Certificate of Incorporation of Range Resources Corporation (incorporated by reference to Exhibit 3.1 to our Form 10Q (File No. 001-1209) as filed with the SEC on July 24, 2008) | |
| 3.2 | Amended and Restated By-laws of Range (incorporated by reference to Exhibit 3.1 to our Form 8-K (File No. 001-12209) as filed with the SEC on May 20, 2010) | |
| 4.1 | Form of 7.5% Senior Subordinated Notes due 2017 (incorporated by reference to Exhibit A to Exhibit 4.2 (File No. 001-12209) as filed with the SEC on October 1, 2007) | |
| 4.2 | Indenture dated September 28, 2007 by and among Range, as issuer, the subsidiary Guarantors (as defined therein), as guarantors and J.P.Morgan Trust Company, National Association as trustee (incorporated by reference to Exhibit 4.1 on our Form 8-K (File No. 001-12209) as filed with the SEC on October 1, 2007) | |
| 4.3 | Form of 7.25% Senior Subordinated Notes due 2018 (incorporated by reference to Exhibit A to Exhibit 4.2 on our Form 8-K (File No. 001-12209) as filed with the SEC on May 6, 2008) | |
| 4.4 | Indenture dated May 6, 2008 by and among Range, as issuer, the subsidiary Guarantors (as defined therein), as guarantors and J.P. Morgan Trust Company, National Association as trustee (incorporated by reference to Exhibit 4.1 on our Form 8-K (File No. 001-12209) as filed with the SEC on May 6, 2008) | |
| 4.5 | Form of 8.0% Senior Subordinated Notes due 2019 (incorporated by reference to Exhibit A to Exhibit 4.2 on our Form 8-K (File No. 001-12209) as filed with the SEC on May 14, 2009) | |
| 4.6 | Indenture dated May 14, 2009 by and among Range, as issuer, the Subsidiary Guarantors (as defined therein), as guarantors and J.P. Morgan Trust Company, National Association as trustee (incorporated by reference to Exhibit 4.1 on Form 8-K (File No. 001-12209) as filed with the SEC on May 14, 2009) | |
| 4.7 | Form of 6.75% Senior Subordinated Notes due 2020 (incorporated by reference to Exhibit A to Exhibit 4.2 on Form 8-K (File No. 001-12209) as filed with the SEC on August 12, 2010) | |
| 4.8 | Indenture dated August 12, 2010 by and among Range, as issuer, the Subsidiary Guarantors (as defined therein), as guarantors and J.P.Morgan Trust Company, National Association as trustee (incorporated by reference to Exhibit on Form 8-K (File No. 001-12209) as filed with the SEC on August 12, 2010) | |
| 4.9 | Form of 5.75% Senior Subordinated Notes due 2021 (incorporated by reference to Exhibit A to Exhibit 4.10 on (File No. 001-12009) as filed with the SEC on May 25, 2011) | |
| 4.10 | Indenture dated May 25, 2011 by and among Range, as issuer, the Subsidiary Guarantors (as defined therein), as guarantors and The Bank of New York Mellon Trust Company, N.A., as trustee (incorporated by reference to Exhibit 4.1 on our Form 8-K (File No. 001-12209) as filed with the SEC on May 25, 2011) | |
| 4.11 | First Supplemental Indenture, dated May 25, 2011, among Range Resources Corporation, the subsidiary guarantors named therein and The Bank of New York Mellon Trust Company, N.A., as trustee, including the form of 5.75% Senior Subordinated Notes due 2021 (incorporated by reference to Exhibit 4.2 on Form 8-K (File No. 001-12209) as filed with the SEC on May 25, 2011) | |
| 4.12 | Tenth Supplemental Indenture, dated as of May 25, 2011, by and among Range Resources Corporation, the subsidiary guarantors named therein and The Bank of New York Mellon Trust Company, N.A., as trustee (incorporated by reference to Exhibit 4.3 on Form 8-K (File No. 001-12209) as filed with the SEC on May 25, 2011) | |
67
Table of Contents
| Exhibit Number |
Exhibit Description | |
| 4.13 | Tenth Supplemental Indenture, dated as of May 25, 2011, by and among Range Resources Corporation, the subsidiary guarantors named therein and The Bank of New York Mellon Trust Company, N.A., as trustee (incorporated by reference to Exhibit 4.4 on Form 8-K (File No. 001-12209) as filed with the SEC on May 25, 2011) | |
| 10.01 | Fourth Amended and Restated Credit Agreement as of February 18, 2011 among Range (as borrowers) and J.P.Morgan Chase Bank, N.A. and the institutions named (therein) as lenders, J.P.Morgan Chase as Administrative Agent (incorporated by reference to Exhibit 10.1 to our Form 8-K (File No. 001-12209) as filed with the SEC February 22, 2011) | |
| 10.02 | Amended and Restated Range Resources Corporation 2004 Deferred Compensation Plan for Directors and Select Employees effective December 31, 2008 (incorporated by reference to Exhibit 10.2 to our Form 8-K (File No. 001-12209) as filed with the SEC on December 5, 2008) | |
| 10.03 | Form of Indemnity Agreement (incorporated by reference to Exhibit 10.5 to our Form 8-K (File No. 001-12209) as filed with the SEC on May 18, 2005) | |
| 10.04 | Range Resources Corporation Amended and Restated 2005 Equity Based Compensation Plan (incorporated by reference to Exhibit 10.1 to our Form 8-K (File No. 001-12209) as filed with the SEC on June 4, 2009) | |
| 10.05 | First Amendment to the Range Resources Corporation Amended and Restated 2005 Equity Based Compensation Plan (incorporated by reference to Exhibit 10.1 to our Form 8-K (File No. 001-12209) as filed with the SEC on May 20, 2010) | |
| 10.06 | Second Amendment the Range Resources Corporation Amended and Restated 2005 Equity Based Compensation Plan (incorporated by reference to Exhibit 10.1 to our Form 8-K (File No. 001-12209) as filed with the SEC on May 19, 2011) | |
| 10.07 | 2004 Non-Employee Director Stock Option Plan dated May 19, 2004 (incorporated by reference to Exhibit 4.2 to our Form S-8 (File No. 333-116320) as filed with the SEC on June 9, 2004) | |
| 10.08 | Amended and Restated 1999 Stock Option Plan (as amended May 21, 2003) (incorporated by reference to Exhibit 4.1 to our Form S-8 (File No. 333-105895) as filed with the SEC on June 6, 2003) | |
| 10.09 | Fourth Amendment to the Amended and Restated 1999 Stock Option Plan dated May 19, 2004 (incorporated by reference to Exhibit 4.1 to our Form S-8 (File No. 333-116320) as filed with the SEC on June 9, 2004) | |
| 10.10 | Range Resources Corporation 401(k) Plan (incorporated by reference to Exhibit 10.14 to our Form S-4 (File No. 333-108516) as filed with the SEC on September 4, 2003) | |
| 10.11 | Amended and Restated Range Resources Corporation Executive Change in Control Severance Benefit Plan dated December 31, 2008 (incorporated by reference to Exhibit 10.1 to our Form 8-K (File No. 001-12209) as filed with the SEC on December 5, 2008) | |
| 10.12 | Form of Indemnification Agreement (incorporated by reference to Exhibit 10.6 to our Form 8-K (File No. 001-12209) as filed with the SEC on February 17, 2009) | |
| 10.13 | Purchase and Sale Agreement between Range Texas Production LLC, Energy Assets Company, LLC and Range Corporation as Seller and Legend Natural Gas IV, LP as Buyer dated February 28, 2011 (incorporated by reference to Exhibit 10.1 to our Form 10-Q (File No. 001-12209) as filed with the SEC on April 27, 2011) | |
| 21.1* | Subsidiaries of Registrant | |
| 23.1* | Consent of Independent Registered Public Accounting Firm | |
| 23.2* | Consent of DeGoyler and MacNaughton, independent consulting engineers | |
68
Table of Contents
| Exhibit Number |
Exhibit Description | |
| 23.3* | Consent of Wright and Company, independent consulting engineers | |
| 31.1* | Certification by the Chairman and Chief Executive Officer of Range Pursuant to Section 302 of the Sarbanes-Oxley Act of 2002 | |
| 31.2* | Certification by the Chief Financial Officer of Range Pursuant to Section 302 of the Sarbanes-Oxley Act of 2002 | |
| 32.1** | Certification by the Chairman and Chief Executive Officer of Range Pursuant to 18 U.S.C. Section 1350, as adopted Pursuant to Section 906 of the Sarbanes-Oxley Act of 2002 | |
| 32.2** | Certification by the Chief Financial Officer of Range Pursuant to 18 U.S.C. Section 1350, as adopted Pursuant to Section 906 of the Sarbanes-Oxley Act of 2002 | |
| 99.1* | Report of DeGoyler and MacNaughton, independent consulting engineers | |
| 99.2* | Report of Wright and Company, independent consulting engineers | |
| 101.INS | XBRL Instance Document | |
| 101.SCH | XBRL Taxonomy Extension Schema | |
| 101.CAL | XBRL Taxonomy Extension Calculation Linkbase Document | |
| 101.DEF | XBRL Taxonomy Extension Definition Linkbase Document | |
| 101.LAB | XBRL Taxonomy Extension Label Linkbase Document | |
| 101.PRE | XBRL Taxonomy Extension Presentation Linkbase Document | |
| * | Filed herewith. |
| ** | Furnished herewith. |
69