Attached files
| file | filename |
|---|---|
| 8-K - FORM 8-K - Simplicity Bancorp, Inc. | t72594_8k.htm |
Exhibit 99.1
 |
Kaiser Federal Financial Group (KFFG)
February 2012
|
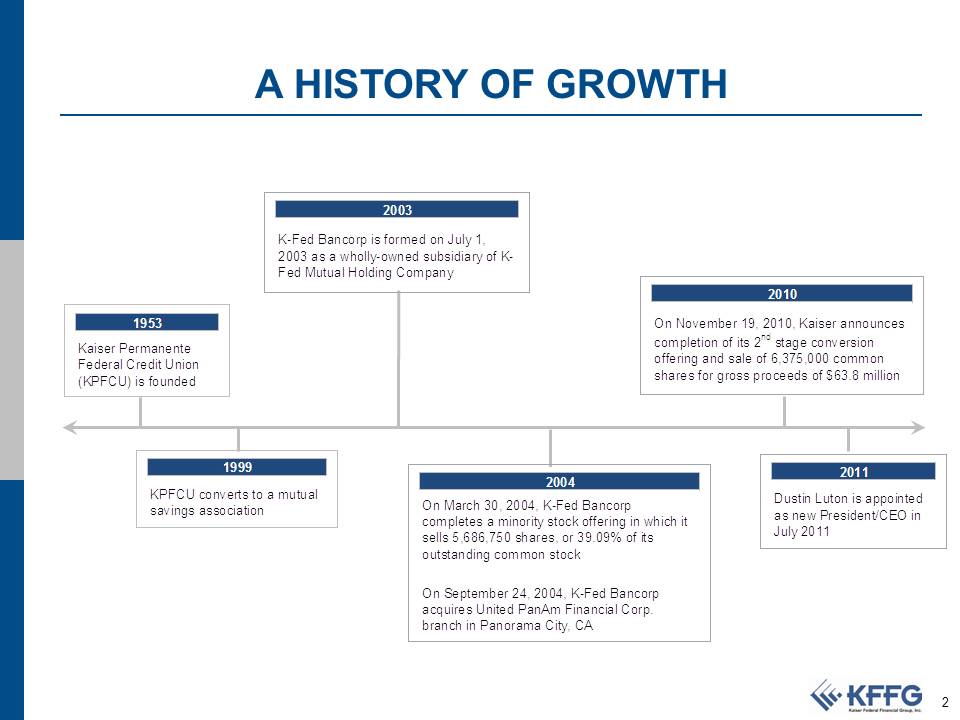 |
A HISTORY OF GROWTH
1953
Kaiser Permanente
Federal Credit Union
(KPFCU) is founded
1999
KPFCU converts to a mutual
savings association
2011
Dustin Luton is appointed
as new President/CEO in
July 2011
2010
On November 19, 2010, Kaiser announces
completion of its 2nd stage conversion
offering and sale of 6,375,000 common
shares for gross proceeds of $63.8 million
2004
On March 30, 2004, K-Fed Bancorp
completes a minority stock offering in which it
sells 5,686,750 shares, or 39.09% of its
outstanding common stock
On September 24, 2004, K-Fed Bancorp
acquires United PanAm Financial Corp.
branch in Panorama City, CA
2003
K-Fed Bancorp is formed on July 1,
2003 as a wholly-owned subsidiary of K-
Fed Mutual Holding Company
|
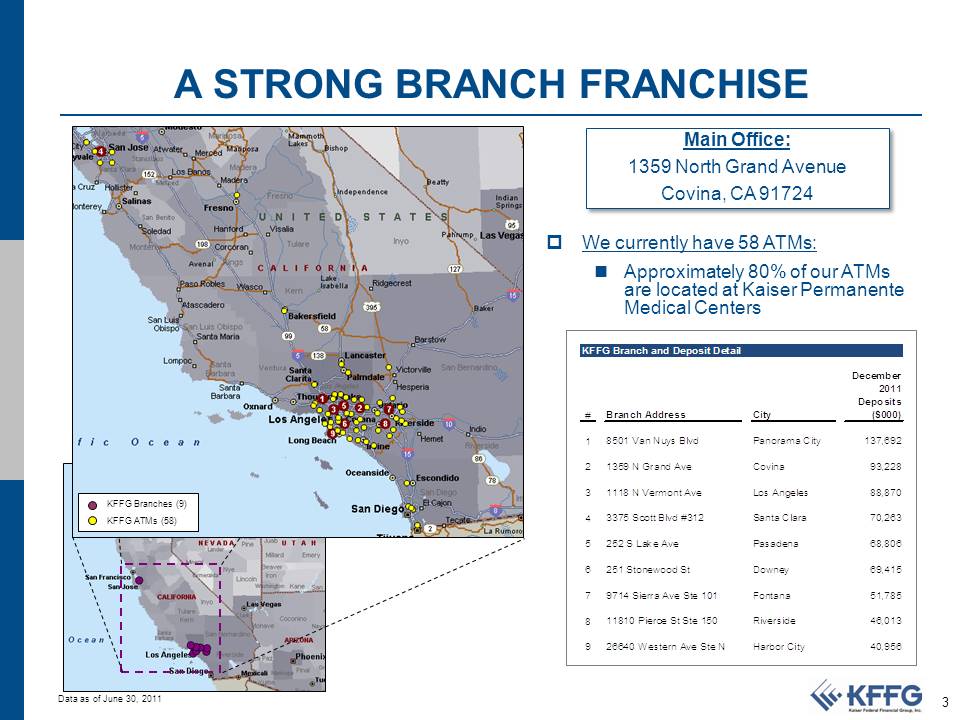 |
A STRONG BRANCH FRANCHISE
KFFG Branches (9)
KFFG ATMs (58)
Main Office:
1359 North Grand Avenue
Covina, CA 91724
. We currently have 58 ATMs:
. Approximately 80% of our ATMs
are located at Kaiser Permanente
Medical Centers
KFFG Branch and Deposit Detail
December
2011
Deposits
# Branch Address City ($000)
1 8501 Van Nuys Blvd Panorama City 137,692
2 1359 N Grand Ave Covina 93,228
3 1118 N Vermont Ave Los Angeles 88,870
4 3375 Scott Blvd #312 Santa Clara 70,263
5 252 S Lake Ave Pasadena 68,806
6 251 Stonewood St Downey 69,415
7 9714 Sierra Ave Ste 101 Fontana 51,785
8 11810 Pierce St Ste 150 Riverside 46,013
9 26640 Western Ave Ste N Harbor City 40,956
Data as of June 30, 2011
|
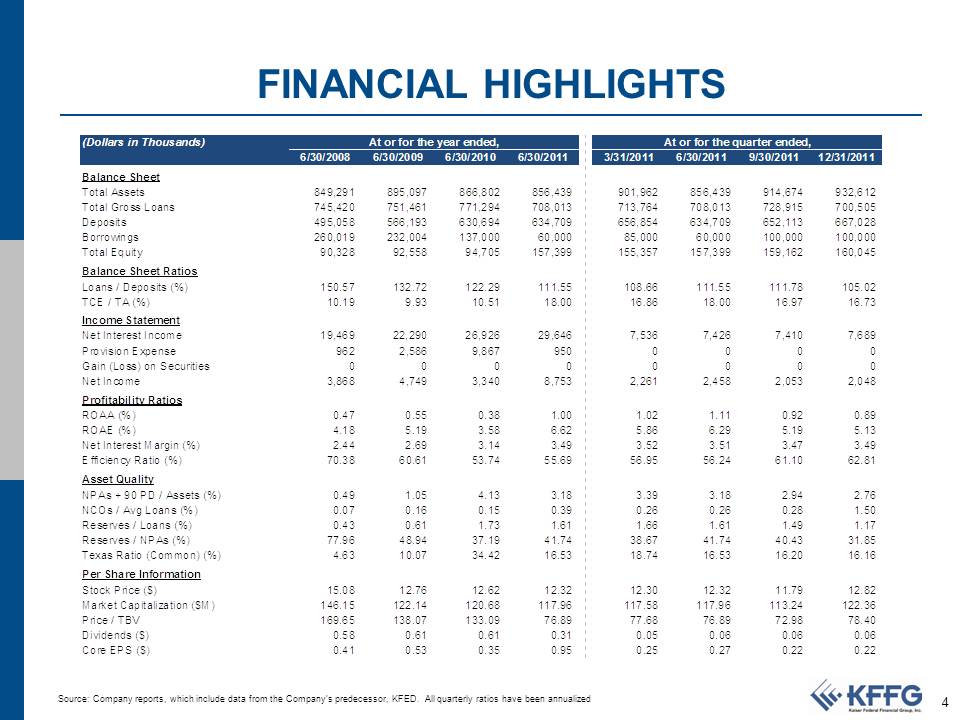 |
FINANCIAL HIGHLIGHTS
(Dollars in Thousands) At or for the year ended, 6/30/2008 6/30/2009 6/30/2010 6/30/2011 Balance Sheet Total Assets 849,291 895,097 866,802 856,439 Total Gross Loans 745,420 751,461 771,294 708,013 Deposits 495,058 566,193 630,694 634,709 Borrowings 260,019 232,004 137,000 60,000 Total Equity 90,328 92,558 94,705 157,399 Balance Sheet Ratios Loans / Deposits (%) 150.57 132.72 122.29 111.55 TCE / TA (%) 10.19 9.93 10.51 18.00 Income Statement Net Interest Income 19,469 22,290 26,926 29,646 Provision Expense 962 2,586 9,867 950 Gain (Loss) on Securities 0 0 0 0 Net Income 3,868 4,749 3,340 8,753 Profitability Ratios ROAA (%) 0.47 0.55 0.38 1.00 ROAE (%) 4.18 5.19 3.58 6.62 Net Interest Margin (%) 2.44 2.69 3.14 3.49 Efficiency Ratio (%) 70.38 60.61 53.74 55.69 Asset Quality NPAs + 90 PD / Assets (%) 0.49 1.05 4.13 3.18 NCOs / Avg Loans (%) 0.07 0.16 0.15 0.39 Reserves / Loans (%) 0.43 0.61 1.73 1.61 Reserves / NPAs (%) 77.96 48.94 37.19 41.74 Texas Ratio (Common) (%) 4.63 10.07 34.42 16.53 Per Share Information Stock Price ($) 15.08 12.76 12.62 12.32 Market Capitalization ($M) 146.15 122.14 120.68 117.96 Price / TBV 169.65 138.07 133.09 76.89 Dividends ($) 0.58 0.61 0.61 0.31 Core EPS ($) 0.41 0.53 0.35 0.95 At or for the quarter ended, 3/31/2011 6/30/2011 9/30/2011 12/31/2011 901,962 713,764 656,854 85,000 155,357 856,439 708,013 634,709 60,000 157,399 914,674 728,915 652,113 100,000 159,162 932,612 700,505 667,028 100,000 160,045 108.66 16.86 111.55 18.00 111.78 16.97 105.02 16.73 7,536 0 0 2,261 7,426 0 0 2,458 7,410 0 0 2,053 7,689 0 0 2,048 1.02 5.86 3.52 56.95 1.11 6.29 3.51 56.24 0.92 5.19 3.47 61.10 0.89 5.13 3.49 62.81 3.39 0.26 1.66 38.67 18.74 3.18 0.26 1.61 41.74 16.53 2.94 0.28 1.49 40.43 16.20 2.76 1.50 1.17 31.85 16.16 12.30 117.58 77.68 0.05 0.25 12.32 117.96 76.89 0.06 0.27 11.79 113.24 72.98 0.06 0.22 12.82 122.36 78.40 0.06 0.22 Source: Company reports, which include data from the Company’s predecessor, KFED. All quarterly ratios have been annualized
|
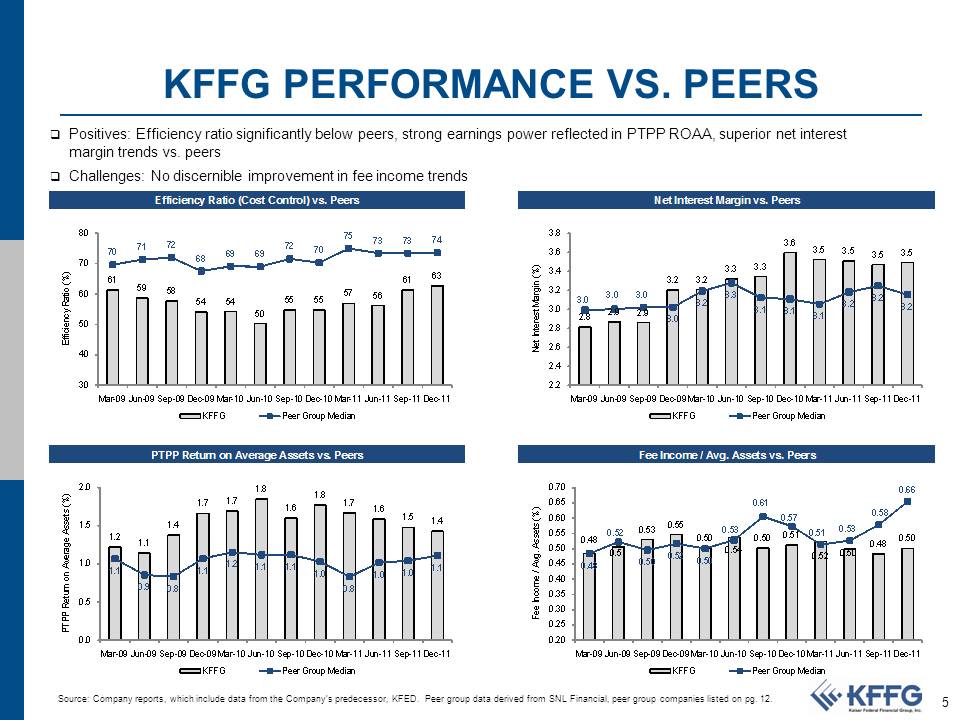 |
KFFG PERFORMANCE VS. PEERS
. Positives: Efficiency ratio significantly below peers, strong earnings power reflected in PTPP ROAA, superior net interest margin trends vs. peers . Challenges: No discernible improvement in fee income trends Efficiency Ratio (Cost Control) vs. Peers Net Interest Margin vs. Peers 80 75 3.8 7172 72 737374 70 69 69 70 68 3.6 3.5 3.6 63 2.8 2.9 2.9 3.0 3.1 3.1 3.1 3.2 3.2 3.2 3.2 3.3 3.3 3.5 3.5 3.5 3.0 3.0 3.0 3.2 3.3 3.2 Mar-09 Jun-09 Sep-09 Dec-09 Mar-10 Jun-10 Sep-10 Dec-10 Mar-11 Jun-11 Sep-11 Dec-11 70 Fee Income / Avg. Assets (%) Fee Income / Avg. Assets vs. Peers Net Interest Margin (%) 3.4 PTPP Return on Average Assets (%) PTPP Return on Average Assets vs. Peers Efficiency Ratio (%) 61 61 59 58 2.4 30 2.2 Mar-09 Jun-09 Sep-09 Dec-09 Mar-10 Jun-10 Sep-10 Dec-10 Mar-11 Jun-11 Sep-11 Dec-11 KFFG Peer Group Median KFFG Peer Group Median 3.2 50 50 60 57 56 5454 5555 3.0 2.8 2.6 40 2.0 1.8 0.70 1.8 1.2 1.1 1.4 1.7 1.7 1.6 1.7 1.6 1.5 1.4 1.1 0.9 0.8 1.1 1.2 1.1 1.1 1.0 0.8 1.0 1.0 1.1 0.0 0.5 1.0 1.5 0.48 0.51 0.53 0.55 0.50 0.54 0.50 0.51 0.52 0.50 0.48 0.50 0.48 0.52 0.50 0.52 0.50 0.53 0.61 0.57 0.51 0.53 0.58 0.20 0.25 0.30 0.35 0.40 0.45 0.50 0.55 0.60 0.65 Mar-09 Jun-09 Sep-09 Dec-09 Mar-10 Jun-10 Sep-10 ec-10 Mar-11 Jun-11 Sep-11 Dec-11 Mar-09 Jun-09 Sep-09 Dec-09 Mar-10 Jun-10 Sep-10 Dec-10 Mar-11 un-11 Sep-11 Dec-11 KFFG Peer Group Median KFFG Peer Group Median Source: Company reports, which include data from the Company’s predecessor, KFED. Peer group data derived from SNL Financial, peer group companies listed on pg. 12.
|
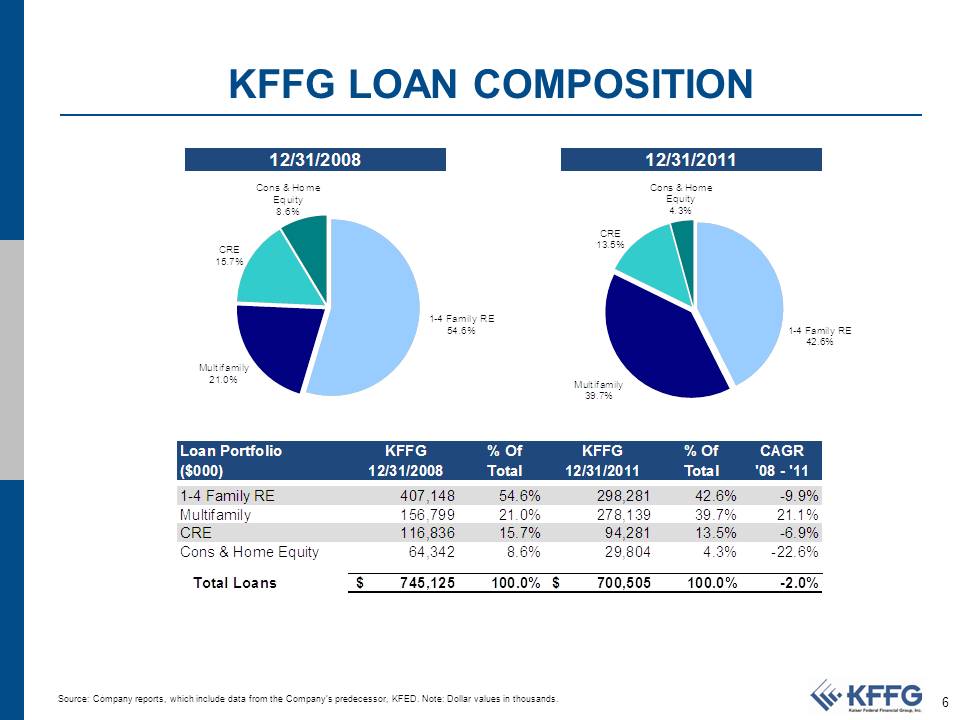 |
KFFG LOAN COMPOSITION
12/31/2008 12/31/2011 Cons & Home Cons & Home Equity Equity 8.6% 4.3% 1-4 Family RE 54.6% CRE 13.5% CRE 15.7% 1-4 Family RE 42.6% Multifamily 21.0% Multifamily 39.7% Loan Portfolio KFFG % Of KFFG % Of CAGR ($000) 12/31/2008 Total 12/31/2011 Total '08 - '11 1-4 Family RE Multifamily CRE Cons & Home Equity 407,148 156,799 116,836 64,342 54.6% 21.0% 15.7% 8.6% 298,281 278,139 94,281 29,804 42.6% 39.7% 13.5% 4.3% -9.9% 21.1% -6.9% -22.6% Total Loans $ 745,125 100.0% $ 700,505 100.0% -2.0%
Source: Company reports, which include data from the Company’s predecessor, KFED. Note: Dollar values in thousands.
|
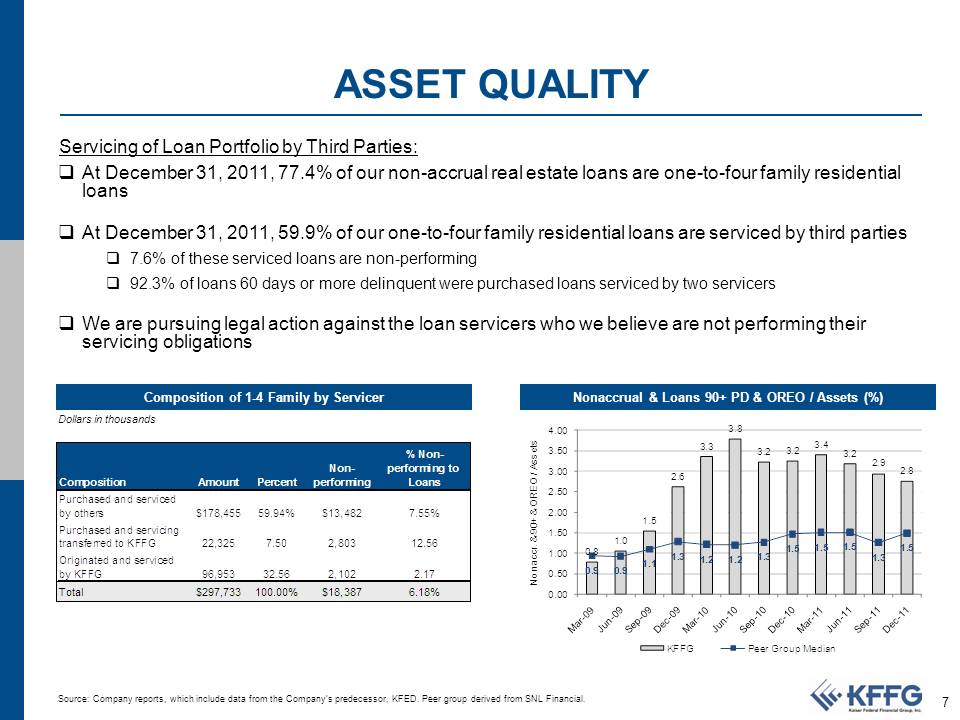 |
ASSET QUALITY
Servicing of Loan Portfolio by Third Parties:
. At December 31, 2011, 77.4% of our non-accrual real estate loans are one-to-four family residential
loans
. At December 31, 2011, 59.9% of our one-to-four family residential loans are serviced by third parties
. 7.6% of these serviced loans are non-performing
. 92.3% of loans 60 days or more delinquent were purchased loans serviced by two servicers
. We are pursuing legal action against the loan servicers who we believe are not performing their
servicing obligations
Composition of 1-4 Family by Servicer Nonaccrual & Loans 90+ PD & OREO / Assets (%)
Dollars in thousands
3.8 4.00 3.3 3.2 3.2 3.4 3.2 3.50 2.9 2.8 3.00 2.6 2.50 2.00 1.5 1.50 1.00 0.9 0.50 0.00 0.8 1.0 0.9 1.1 1.3 .2 1.2 1.3 1.5 1.5 1.5 1.3 1.5 % Non Non-performing to Composition Amount Percent performing Loans Purchased and serviced by others $178,455 59.94% $13,482 7.55% Purchased and servicing transferred to KFFG 22,325 7.50 2,803 12.56 Originated and serviced by KFFG 96,953 32.56 2,102 2.17 Total 297,733 100.00% $18,387 6.18%
Nonaccr. & 90+ &OREO / Assets
KFFG Peer Group Median
Source: Company reports, which include data from the Company’s predecessor, KFED. Peer group derived from SNL Financial.
|
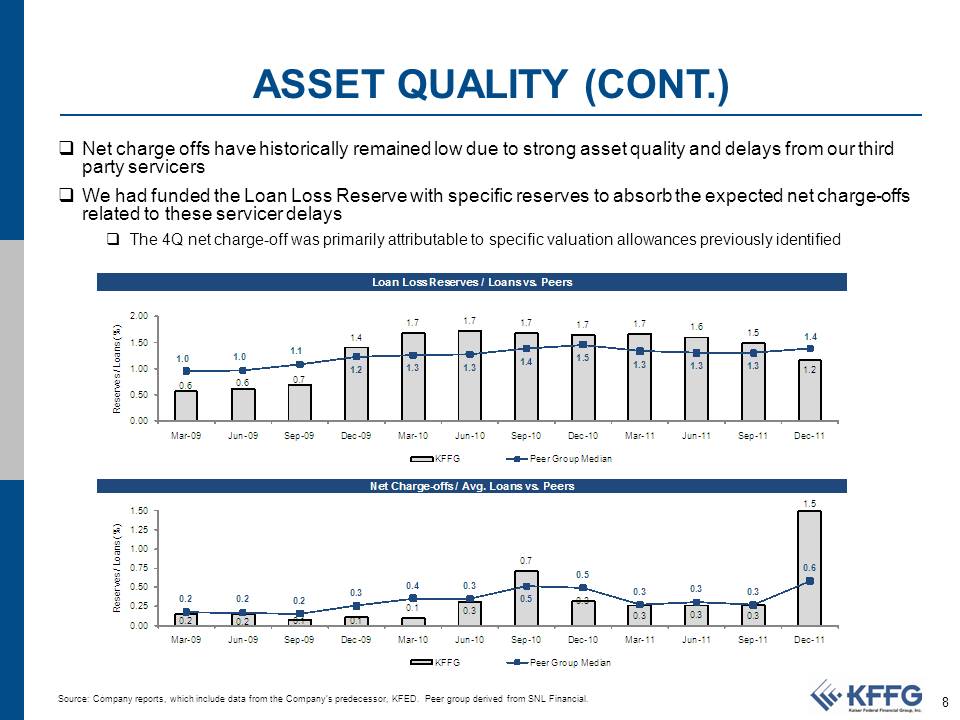 |
ASSET QUALITY (CONT.)
. Net charge offs have historically remained low due to strong asset quality and delays from our third
party servicers
. We had funded the Loan Loss Reserve with specific reserves to absorb the expected net charge-offs
related to these servicer delays
. The 4Q net charge-off was primarily attributable to specific valuation allowances previously identified
Loan Loss Reserves / Loans vs. Peers
Reserves / Loans (%)
2.00 1.50 1.00 0.50 0.00 1.0 1.0 1.1 1.2 1.3 1.3 1.4 1.5 1.3 1.3 1.3 1.4 1.5 1.2 1.4 0.6 0.6 0.7 1.7 1.7 1.7 .7 1.7 1.6
Mar-09 Jun-09 Sep-09 Dec-09 Mar-10 Jun-10 Sep-10 Dec-10 Mar-11 Jun-11 Sep-11 Dec-11
KFFG
Peer Group Median
Net Charge offs / Avg. Loans vs. Peers
Source: Company reports, which include data from the Company’s predecessor, KFED. Peer group derived from SNL Financial.
0.2 0.2 0.1 0.1 0.1 0.3 0.7 0.3 0.3 0.3 0.3 1.5 0.2 0.2 0.2 0.3 0.4 0.3 0.5 0.5 0.3 0.3 0.3 0.6 0.00 0.25 0.50 0.75 1.00 1.25 1.50 Mar-09 Jun-09 Sep-09 Dec-09 Mar-10 Jun-10 Sep-10 Dec-10 Mar-11 Jun-11 Sep-11 Dec-11
Reserves / Loans (%)
KFFG Peer Group Median
|
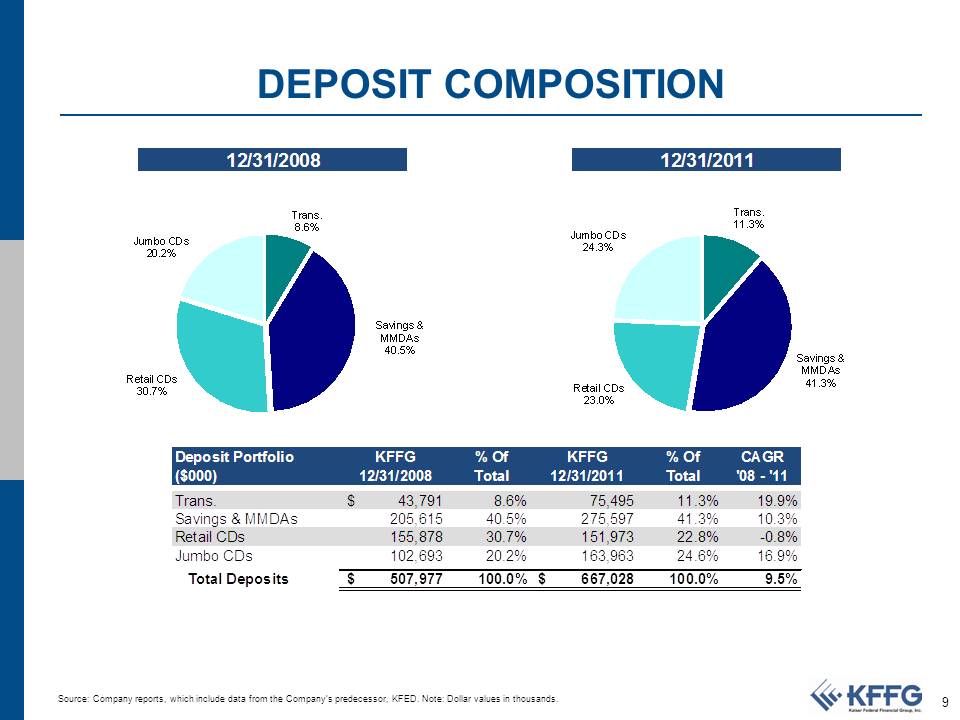 |
DEPOSIT COMPOSITION
12/31/2008 12/31/2011 Trans. Trans. 8.6% 11.3% Jumbo CDs Jumbo CDs 24.3% 20.2% Savings & MMDAs 40.5% Savings & MMDAs Retail CDs 41.3% Retail CDs 30.7% 23.0% Deposit Portfolio KFFG % Of KFFG % Of CAGR ($000) 12/31/2008 Total 12/31/2011 Total '08 - '11 Trans. Savings & MMDAs Retail CDs Jumbo CDs $ 43,791 205,615 155,878 102,693 8.6% 40.5% 30.7% 20.2% 75,495 275,597 151,973 163,963 11.3% 41.3% 22.8% 24.6% 19.9% 10.3% -0.8% 16.9% Total Deposits $ 507,977 100.0% $ 667,028 100.0% 9.5%
Source: Company reports, which include data from the Company’s predecessor, KFED. Note: Dollar values in thousands.
|
 |
CAPITAL MANAGEMENT STRATEGIES
. KFFG adopted a stock buyback program for repurchase of up to 5% of issued and
outstanding shares in November 2011 (Purchase Activity through February 16, 2012)
. Completed repurchase of 132,033 common shares at a weighted average price of
$12.69 per share
. 480,257 shares were authorized; 348,224 shares remain eligible for repurchase
. 30 straight quarters of shareholder dividends, with stable or increasing payments each
quarter
. Current dividend payout ratio is 31.8%
. Latest dividend announcement of $0.07 per share equates to a 2.12% dividend
yield(1)
Source: KFFG Company Management, SNL Financial
(1) Calculated using the stock price of $13.23 as of close business on February 21, 2012
|
 |
STRATEGIC OUTLOOK
To Become a Leading, Innovative and Top Performing Retail Bank in our Primary Markets
by Continuing:
. To build our infrastructure to support future top line growth and future cost efficiencies
. To build eCommerce delivery channels to enhance the customer experience
. To focus on deepening account relationships in order to generate core deposit and loan growth
. To originate multifamily and one-to-four family mortgage and consumer loans while evaluating
diversification opportunities and maintaining our traditional credit standards
. To utilize excess capital deployment options when timely
. 5% stock repurchase program in process
. Consistent shareholder dividends
. To cautiously evaluate expansion opportunities
|
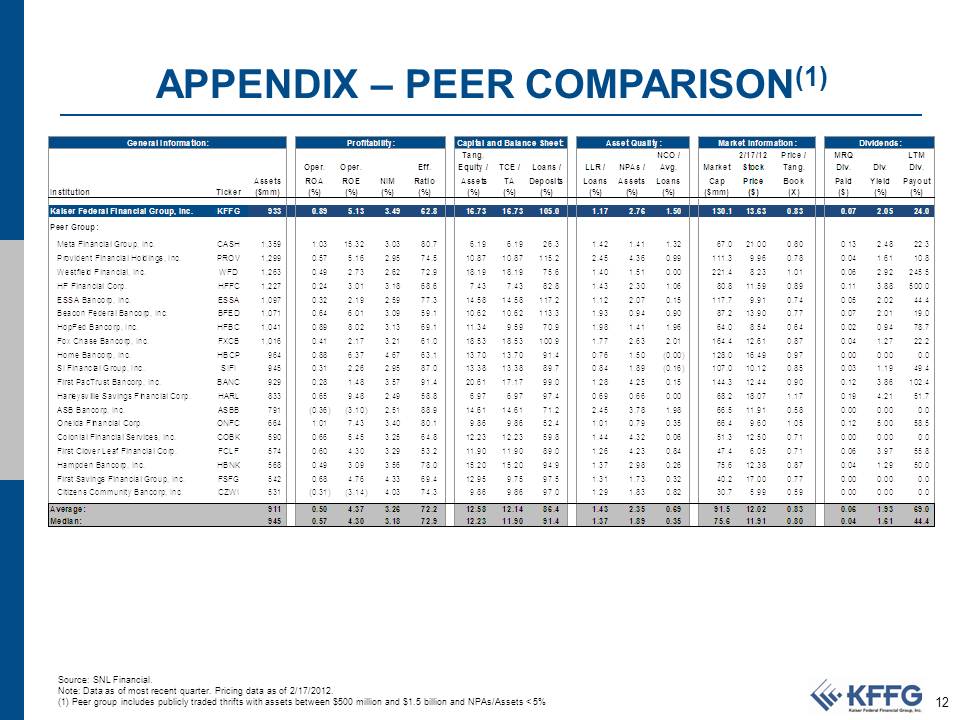 |
APPENDIX – PEER COMPARISON(1)
General Information: Profitability: Capital and Balance Sheet: Asset Quality: Market Information: Dividends:
Tang. NCO / 2/17/12 Price / MRQ LTM Oper. Oper. Eff. Equity / TCE / Loans / LLR / NPAs / Avg. Market Stock Tang. Div. Div. Div. Assets ROA ROE NIM Ratio Assets TA Deposits Loans Assets Loans Cap Price Book Paid Yield Payout Institution Ticker ($mm) (%) (%) (%) (%) (%) (%) (%) (%) (%) (%) ($mm) ($) (X) ($) (%) (%) Kaiser Federal Financial Group, Inc. KFFG 933 0.89 5.13 3.49 62.8 16.73 16.73 105.0 1.17 2.76 1.50 130.1 13.63 0.83 0.07 2.05 24.0 Peer Group: Meta Financial Group, Inc. CASH 1,359 1.03 15.32 3.03 80.7 6.19 6.19 26.3 1.42 1.41 1.32 67.0 21.00 0.80 0.13 2.48 22.3 Provident Financial Holdings, Inc. PROV 1,299 0.57 5.16 2.95 74.5 10.87 10.87 115.2 2.45 4.36 0.99 111.3 9.96 0.78 0.04 1.61 10.8 Westfield Financial, Inc. WFD 1,263 0.49 2.73 2.62 72.9 18.19 18.19 75.6 1.40 1.51 0.00 221.4 8.23 1.01 0.06 2.92 245.5 HF Financial Corp. HFFC 1,227 0.24 3.01 3.18 68.6 7.43 7.43 82.8 1.43 2.30 1.06 80.8 11.59 0.89 0.11 3.88 500.0 ESSA Bancorp, Inc. ESSA 1,097 0.32 2.19 2.59 77.3 14.58 14.58 117.2 1.12 2.07 0.15 117.7 9.91 0.74 0.05 2.02 44.4 Beacon Federal Bancorp, Inc. BFED 1,071 0.64 6.01 3.09 59.1 10.62 10.62 113.3 1.93 0.94 0.90 87.2 13.90 0.77 0.07 2.01 19.0 HopFed Bancorp, Inc. HFBC 1,041 0.89 8.02 3.13 69.1 11.34 9.59 70.9 1.98 1.41 1.96 64.0 8.54 0.64 0.02 0.94 78.7 Fox Chase Bancorp, Inc. FXCB 1,016 0.41 2.17 3.21 61.0 18.53 18.53 100.9 1.77 2.63 2.01 164.4 12.61 0.87 0.04 1.27 22.2 Home Bancorp, Inc. HBCP 964 0.88 6.37 4.67 63.1 13.70 13.70 91.4 0.76 1.50 (0.00) 128.0 16.49 0.97 0.00 0.00 0.0 SI Financial Group, Inc. SIFI 945 0.31 2.26 2.95 87.0 13.38 13.38 89.7 0.84 1.89 (0.16) 107.0 10.12 0.85 0.03 1.19 49.4 First PacTrust Bancorp, Inc. BANC 929 0.28 1.48 3.57 91.4 20.61 17.17 99.0 1.28 4.25 0.15 144.3 12.44 0.90 0.12 3.86 102.4 Harleysville Savings Financial Corp. HARL 833 0.65 9.48 2.49 58.8 6.97 6.97 97.4 0.69 0.66 0.00 68.2 18.07 1.17 0.19 4.21 51.7 ASB Bancorp, Inc. ASBB 791 (0.36) (3.10) 2.51 88.9 14.61 14.61 71.2 2.45 3.78 1.98 66.5 11.91 0.58 0.00 0.00 0.0 Oneida Financial Corp. ONFC 664 1.01 7.43 3.40 80.1 9.86 9.86 52.4 1.01 0.79 0.35 66.4 9.60 1.05 0.12 5.00 58.5 Colonial Financial Services, Inc. COBK 590 0.66 5.45 3.25 64.8 12.23 12.23 59.8 1.44 4.32 0.06 51.3 12.50 0.71 0.00 0.00 0.0 First Clover Leaf Financial Corp. FCLF 574 0.60 4.30 3.29 53.2 11.90 11.90 89.0 1.26 4.23 0.84 47.4 6.05 0.71 0.06 3.97 55.8 Hampden Bancorp, Inc. HBNK 568 0.49 3.09 3.56 78.0 15.20 15.20 94.9 1.37 2.98 0.26 75.6 12.38 0.87 0.04 1.29 50.0 First Savings Financial Group, Inc. FSFG 542 0.68 4.76 4.33 69.4 12.95 9.75 97.5 1.31 1.73 0.32 40.2 17.00 0.77 0.00 0.00 0.0 Citizens Community Bancorp, Inc. CZWI 531 (0.31) (3.14) 4.03 74.3 9.86 9.86 97.0 1.29 1.83 0.82 30.7 5.99 0.59 0.00 0.00 0.0 Average: 911 0.50 4.37 3.26 72.2 12.58 12.14 86.4 1.43 2.35 0.69 91.5 12.02 0.83 0.06 1.93 69.0 Median: 945 0.57 4.30 3.18 72.9 12.23 11.90 91.4 1.37 1.89 0.35 75.6 11.91 0.80 0.04 1.61 44.4 Source: SNL Financial. Note: Data as of most recent quarter. Pricing data as of 2/17/2012. (1) Peer group includes publicly traded thrifts with assets between $500 million and $1.5 billion and NPAs/Assets < 5%
|