Attached files
| file | filename |
|---|---|
| EX-99.1 - EX-99.1 - Forestar Group Inc. | a12-5549_1ex99d1.htm |
| 8-K - CURRENT REPORT OF MATERIAL EVENTS OR CORPORATE CHANGES - Forestar Group Inc. | a12-5549_18k.htm |
Exhibit 99.2
|
|
Fourth Quarter and Full Year 2011 Financial Results February 22, 2012 Building Momentum By Increasing Oil Production, Proven Reserves and Residential Lot Sales |
|
|
Notice to Investors This presentation contains “forward-looking statements” within the meaning of the federal securities laws. These statements reflect management’s current views with respect to future events and are subject to risk and uncertainties. We note that a variety of factors and uncertainties could cause our actual results to differ significantly from the results discussed in the forward-looking statements. Factors and uncertainties that might cause such differences include but are not limited to general economic, market, or business conditions; the opportunities (or lack thereof) that may be presented to us and that we may pursue; fluctuations in commodity prices, particularly oil and gas, and in costs and expenses including development costs; demand for new housing, including impacts from mortgage credit availability; lengthy and uncertain entitlement processes; cyclicality of our businesses; accuracy of accounting assumptions; competitive actions by other companies; changes in laws or regulations; and other factors, many of which are beyond our control. Except as required by law, we expressly disclaim any obligation to publicly revise any forward-looking statements contained in this presentation to reflect the occurrence of events after the date of this presentation. This presentation includes Non-GAAP financial measures. The required reconciliation to GAAP financial measures can be found as an exhibit to this presentation and on our website at www.forestargroup.com. 2 |
|
|
Delivering Future Value Through Triple In FOR Focus on Accelerating Value Realization Optimize Transparency & Disclosure Raise NAV Through Strategic and Disciplined Investments 3 Forestar is committed to maximizing long-term shareholder value through the execution of these strategic initiatives |

|
|
Accelerating Value Realization - Proving It Up Significant increase in proven reserves Higher oil production volumes and royalties Residential lot sales - growing market share despite depressed housing Promoting water interests to provide long-term solutions Investments expected to provide near-term cash flow and earnings Building Momentum By Increasing Oil Production, Proven Reserves and Residential Lot Sales 4 |

|
|
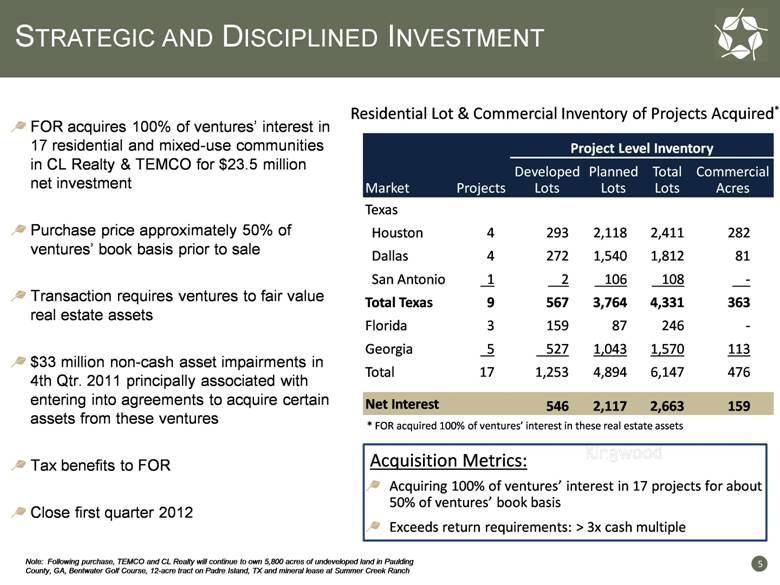
STRATEGIC AND DISCIPLINED INVESTMENT Kingwood Note: Following purchase, TEMCO and CL Realty will continue to own 5,800 acres of undeveloped land in Paulding County, GA, Bentwater Golf Course, 12-acre tract on Padre Island, TX and mineral lease at Summer Creek Ranch Acquisition Metrics: Acquiring 100% of ventures’ interest in 17 projects for about 50% of ventures’ book basis Exceeds return requirements: > 3x cash multiple Residential Lot & Commercial Inventory of Projects Acquired* * FOR acquired 100% of ventures’ interest in these real estate assets 5 FOR acquires 100% of ventures’ interest in 17 residential and mixed-use communities in CL Realty & TEMCO for $23.5 million net investment Purchase price approximately 50% of ventures’ book basis prior to sale Transaction requires ventures to fair value real estate assets $33 million non-cash asset impairments in 4th Qtr. 2011 principally associated with entering into agreements to acquire certain assets from these ventures Tax benefits to FOR Close first quarter 2012 Project Level Inventory Market Projects Developed Lots Planned Lots Total Lots Commercial Acres Texas Houston 4 293 2,118 2,411 282 Dallas 4 272 1,540 1,812 81 San Antonio 1 2 106 108 - Total Texas 9 567 3,764 4,331 363 Florida 3 159 87 246 - Georgia 5 527 1,043 1,570 113 Total 17 1,253 4,894 6,147 476 Net Interest 546 2,117 2,663 159 |
|
|
Fourth Quarter & Full Year 2011 Financial Results 6 Building Momentum By Increasing Oil Production, Proven Reserves and Residential Lot Sales |
|
|
Fourth Quarter & Full Year 2011 Financial Results ($ in Millions, except per share data) 4th Qtr 2011 4th Qtr 2010 Full Year 2011 Full Year 2010 Net Income (Loss) ($22.9) $2.4 $7.2 $ 5.1 Earnings (Loss) Per Share ($0.65) $0.07 $0.20 $0.14 Non-cash asset impairment charges (after-tax) ($0.82) ($0.19) ($0.82) ($0.20) Gain on sale of timberland (after-tax) - $0.24 $1.12 $0.51 7 4th Qtr. and FY 2011 include non-cash asset impairment charges associated with entering into agreements to acquire certain real estate assets from CL Realty and TEMCO ventures. 4th Qtr. and FY 2010 non-cash impairment charges primarily associated with residential development projects located near Atlanta, Georgia and Fort Worth, Texas and a commercial real estate tract held in a venture near the Texas gulf coast. FY 2011 results include sale of 57,000 acres of timberland FY 2010 results include sale of 24,000 acres of timberland |

|
|
4th Qtr. and Full Year 2011 Segment Earnings (Loss) ($ in Millions) 4th Qtr 2011 4th Qtr 2010 Full Year 2011 Full Year 2010 Mineral Resources $3.7 $6.1 $16.0 $22.8 Fiber Resources 0.1 1.2 1.9 5.0 Real Estate (25.0) (5.5) (25.7) (4.6) Total Segment Earnings (Loss) ($21.2) $1.8 ($7.8) $23.2 Real estate non-cash asset impairment charges ($44.5) ($10.4) ($45.2) ($11.3) 8 4th Qtr. and FY 2011 include non-cash asset impairment charges associated with entering into agreements to acquire certain real estate assets from CL Realty and TEMCO ventures. 4th Qtr. and FY 2010 include non-cash impairment charges primarily associated with residential development projects located near Atlanta, Georgia and Fort Worth, Texas and a commercial real estate tract held in a venture near the Texas gulf coast. |

|
|
Historical Single-Family Impairments Concentrated Outside Texas Almost 60% of Impairments of Single-Family Assets Located Outside of Texas 9 * Includes only single-family projects with development, excludes timberland, land in entitlement, raw entitled land and income producing projects **Total impairments at single-family developments from 2007 – 2011; excludes impairments associated with golf club operation near Fort Worth, condo project in Austin, and disposition of corporate aircraft Single-Family Projects Market YE 2011 Investment* Impairments** % Impaired Texas $302.2 $27.1 8% Georgia 18.2 26.8 60% Colorado 31.0 5.5 15% Florida 2.5 2.8 53% Utah 0.5 0.9 64% Total $354.4 $63.1 Note: Includes our share of ventures |

|
|
Fourth Quarter & Full Year 2011 Operating Highlights 10 Building Momentum By Increasing Oil Production, Proven Reserves and Residential Lot Sales |

|
|
Building Momentum - FY 2011 Highlights Investments Expected to Exceed Return Criteria and Deliver Near-Term Cash Flow and Earnings PV-10* proven reserves up 81% or $36.7 million vs. YE 2010 Oil production up 32% vs. 2010; 36 additional wells completed 68,000 net mineral acres put in play in during 2011 Received $8.7 million from Cibolo Canyons District Initiated construction of 289-unit multifamily community in Austin, TX Invested $63 million in real estate segment Sold 1,117 residential lots - up 39% vs. 2010 Sold 112 acres of raw entitled land for $3.9 million ($35,000/acre) Over 1,350 lots under option contracts vs. 1,100 at YE 2010 Sold >17,100 acres from retail program for $40.5 million ($2,400/acre) MINERALS MIXED-USE SINGLE-FAMILY STRATEGIC INITIATIVES TIMBERLAND Sold 57,000 acres of timberland for $87 million Repurchased almost 1.0 million shares of our common stock 11 *These are Non-GAAP financial measures. The reconciliation between GAAP and Non-GAAP financial measures is provided in the Appendix to this presentation, and on the investor relations section of the company’s website at www.forestargroup.com. |

|
|
Building Momentum - Fourth Quarter Highlights Oil production up almost 80% vs. Q4 2010 20 additional wells completed – 530 total producing wells Received $6.6 million from Cibolo Canyons District Acquired multifamily development site in Denver, CO Sold 309 residential lots - up 65% vs. Q4 2010 Over 1,350 lots under option contracts; up over 20% vs. 2010 Sold 13,200 acres of timberland for approximately $30.4 million MINERALS SINGLE-FAMILY FORESTAR TIMBERLAND Repurchased over 730,000 shares of our common stock MIXED-USE 12 |

|
|
Fourth Quarter & Full Year 2011 Mineral Resources Highlights 13 Building Momentum By Driving Leasing and Exploration to Increase Production and Reserves 13 |

|
|
Strong Oil Markets Driving Exploration & Production Oil prices remain firm due to demand growth from emerging markets and geopolitical risk Natural gas prices pressured by record inventory levels and mild temperatures Minimal lease activity related to natural gas; E&P companies principally focused on liquids Forestar well positioned to capitalize on strong oil market conditions Crude Oil Spot Prices* Natural Gas Spot Prices* * Source: U.S. Energy Information Administration Actual EIA Forecast Actual EIA Forecast 95% NYMEX Futures Price Upper Confidence Interval 95% NYMEX Futures Price Lower Confidence Interval 14 |

|
|
Target Formations 2011 Well Completions East Texas & Louisiana* * Map excludes six wells located in Barnett Shale in North Texas and ten wells in Colorado completed in 2011 15 Acres Leased Available for Lease Held by Production Acres with Option New Oil Wells New Gas Wells |

|
|
Increased Oil Production Driving Higher Royalties Segment Earnings Reconciliation Q4 2010 vs. Q4 2011 Q4 2011 Highlights vs. Q4 2010: Oil production up almost 80% Royalties up 60% or $2.4 million 20 additional wells completed; 530 producing wells ** Costs associated with the development of our water initiatives include $1.0 million in Q4 2011 and $3.9 million in FY 2011, principally related to groundwater leases in central TX FY 2011 Highlights vs. FY 2010: Oil production up 32% Proven reserves of 17.9 Bcfe, up 26% PV-10* proven reserves up 81% or $36.7 million 36 additional wells completed Exercised working interest options in 3 wells 68,000 net mineral acres put in play Segment Earnings Reconciliation FY 2010 vs. FY 2011 16 ($ in millions) ($ in millions) Note: Wells owned by third-party lessee / operator *These are Non-GAAP financial measures. The reconciliation between GAAP and Non-GAAP financial measures is provided in the Appendix to this presentation, and on the investor relations section of the company’s website at www.forestargroup.com. |

|
|
Drilling & Production Growth Accelerating 17 Note: Includes Forestar’s share of equity method ventures Growth in Drilling Activity & Well Count* Q4 2010 – Q4 2011 * Wells owned by third-party lessee / operator |

|
|
Note: Wells owned by third-party lessee / operator Seismic Agreements: 41,500 acres Over 26,000 acres of 3-D seismic data received to generate prospects Leasing: 8,100 acres - $279 / acre Exploration Agreements: 18,000 net mineral acres 2011 Activity Acres Leased Available for Lease Held by Production Seismic Agreements Exploration Agreements 68,000 net mineral acres “put in play” during 2011 in Louisiana & Texas * Significant Operators - Louisiana * Includes leases, seismic and exploration agreements West Gordon Field 18 Leverage Seismic Data to Generate Prospects, Leases and Exploration Activity |

|
|
WEST GORDON FIELD – WILCOX FORMATION SOUTHERN LOUISIANA 1 Average EUR based on internal estimates; EUR represents estimated ultimate recovery which is an approximation of the quantity of oil or gas that is potentially recoverable or has already been recovered from a well. 2 Forestar elected to take working interest in three wells West Gordon Field Feb. 2012 Estimated Avg. EUR per Well 1 200 MBo Potential Well Locations 16 FOR Royalty Interest – 25.00% 16 FOR Working Net Interest – 18.75% 2 3 Wells Included in 2011 Reserves 8 PV-103 Proven Reserves $20.5 million FOR investment in working interests = $4.0 million at YE 2011 Current Well Status (Feb. 2012) 8 wells producing 1 well being completed 1 well drilling 2 wells permitted 3 wells planned Note: Wells owned and operated by third party lessees / operators 19 Acres Leased Completing Well Available for Lease Drilling Historical Production Permitted Producing Well FOR Working Interest** Beauregard Parish 3*These are Non-GAAP financial measures. The reconciliation between GAAP and Non-GAAP financial measures is provided in the Appendix to this presentation, and on the investor relations section of the company’s website at www.forestargroup.com. Working Interest Investments Provide Additional Value Realization Opportunity |

|
|
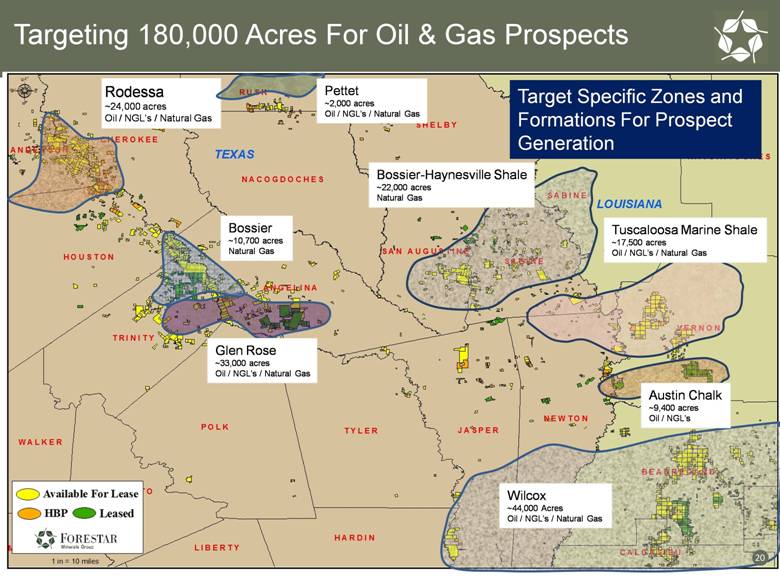
Targeting 180,000 Acres For Oil & Gas Prospects Rodessa ~24,000 acres Oil / NGL’s / Natural Gas Target Specific Zones and Formations For Prospect Generation Pettet ~2,000 acres Oil / NGL’s / Natural Gas Glen Rose ~33,000 acres Oil / NGL’s / Natural Gas Bossier ~10,700 acres Natural Gas Tuscaloosa Marine Shale ~17,500 acres Oil / NGL’s / Natural Gas Bossier-Haynesville Shale ~22,000 acres Natural Gas Wilcox ~44,000 Acres Oil / NGL’s / Natural Gas Austin Chalk ~9,400 acres Oil / NGL’s 20 |
|
|
Accelerating Realization of Minerals Through Proven Reserve Growth Note: Includes ventures ($ in millions) ($ in millions) Future Net Cash Flows * 21 Up 238% or $47MM since 2009 Up 233% or $76MM since 2009 *PV-10 represents present value of estimated future oil and gas revenues, net of estimated direct expenses, discounted at an annual discount rate of 10%. Future Net Cash flows represents an undiscounted value based upon estimate of future net cash flows from proved developed reserves after deducting estimated severance and ad valorem taxes, but before deducting estimates of future income taxes These are Non-GAAP financial measures. The reconciliation between GAAP and Non-GAAP financial measures is provided in the tables following this presentation, and on the company’s investor relations website. $133 $57 74% Oil Significant Oil Exploration and Development Drives 246% Reserve Replacement in 2011 Proven Reserves (Before Income Taxes) |

|
|
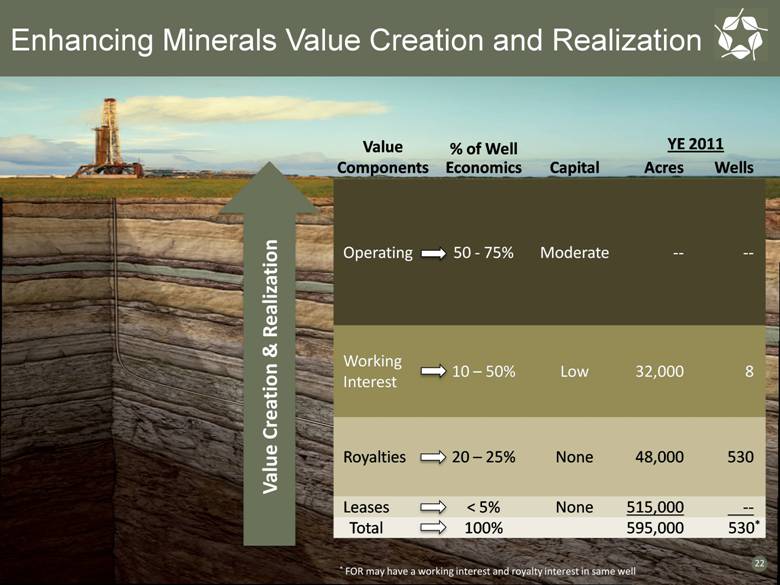
Enhancing Minerals Value Creation and Realization 22 Value Components % of Well Economics Capital Acres Wells Operating 50 - 75% Moderate -- -- Working Interest 10 – 50% Low 32,000 8 Royalties 20 – 25% None 48,000 530 Leases < 5% None 515,000 -- Total 100% 595,000 530* Value Creation & Realization YE 2011 * FOR may have a working interest and royalty interest in same well |
|
|
Fourth Quarter & Full Year 2011 Fiber Resources Highlights Building Momentum Through Sustainable Harvests and Maximizing Recreational Lease Activity 23 |

|
|
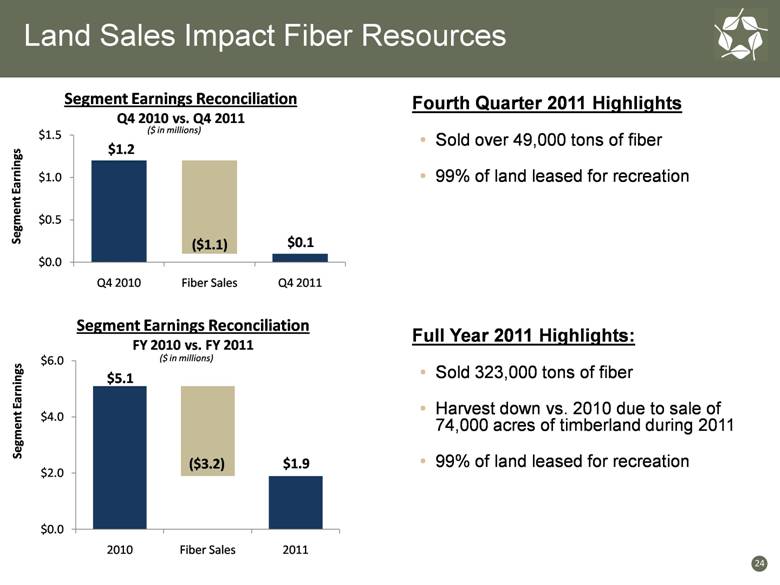
Land Sales Impact Fiber Resources Segment Earnings Reconciliation Q4 2010 vs. Q4 2011 Fourth Quarter 2011 Highlights Sold over 49,000 tons of fiber 99% of land leased for recreation Segment Earnings Reconciliation FY 2010 vs. FY 2011 Full Year 2011 Highlights: Sold 323,000 tons of fiber Harvest down vs. 2010 due to sale of 74,000 acres of timberland during 2011 99% of land leased for recreation 24 ($ in millions) ($ in millions) |
|
|
Fourth Quarter & Full Year 2011 Real Estate Highlights 25 Building Momentum By Increasing Residential Lot Sales |

|
|
Texas Markets To Lead Housing Recovery Texas U.S. Avg. Job Growth (2011 vs. 2010) + 2.0% +1.3% Unemployment 7.8% 8.5% Negative Equity (% of Homes) 9.6% 22.5% Delinquency 4.7% 7.4% Real Estate Investment in Texas Markets $452 million*; 55 projects 74% of total real estate investment** Dallas Houston San Antonio Austin Sources: CoreLogic, Bureau of Labor Statistics, Census Bureau, Metrostudy, RealtyTrac and Brookings Institute Market Projects Investment* Austin 17 $129 Houston* 12 107 Dallas 17 92 San Antonio 4 87 Gulf Coast 5 37 ($ in millions) * Includes investment in loan secured by real estate ** Includes investment in undeveloped land 26 Gulf Coast |

|
|
Low Inventory Driving Demand For “A” Lots 27 Forestar Residential Lot Inventory* Residential Lot Inventory Texas real estate markets low on quality residential lot inventory Minimal residential lot development since 2007 Low levels of new home inventory in major markets of Texas Development constrained by credit availability National and Selected Markets Finished Vacant New Home Inventory Months of Supply Note: Includes ventures Months of Supply 27 * Includes ventures |

|
|
Real Estate – Improving Underlying Results Fourth Quarter 2011 Highlights Sold 309 residential lots, up 65% vs. Q4 2010 Sold 13,200 acres of undeveloped land for $30.4 million Acquired multifamily development site in Denver Segment Earnings (Loss) Reconciliation Q4 2010 vs. Q4 2011 Full Year 2011 Highlights Sold 1,117 residential lots, up 39% vs. 2010 Sold 112 acres of raw entitled land for $3.9 million Sold over 17,100 acres of undeveloped land for $40.5 million Acquired 180 fully developed lots for $9 million including $4 million in reimbursement rights Sold 6 residential lots 52 residential lots under contract Acquired three multifamily development sites for $16 million – located in Austin, Dallas & Denver Segment Earnings (Loss) Reconciliation FY 2010 vs. FY 2011 28 ($ in millions) ($ in millions) |

|
|
RESIDENTIAL LOT SALES BUILDING MOMENTUM 29 Note: Includes ventures Annual Lot Sales 1,117 642 1,060 2006 Peak Sales = 3,600 lots Residential Lots Under Option Contracts YE 2010 – YE 2011 Annual Lot Sales & Avg. Lot Margin |

|
|
Cash Flows Stabilizing From Resort To Cibolo Canyons Special Improvement District Cibolo Canyons Special Improvement District Payments to Forestar Total Receipts ($ in millions) 2010 $1.5 2011* 8.7 $10.2 Note: Forestar Investment in Resort = $35.4 million at YE 2011 (excluding interest) * 2011 Proceeds from district represent a mix of 2010 and 2011 HOT & Sales Taxes and ad-valorem receipts 30 CCSID Quarterly Hotel Occupancy Tax & Sales Tax Collections Q3 11 Q4 11 JW Marriott Hill Country Resort & Spa Estimated Cumulative District Payments to Forestar** 2011 2034 **Actual results may vary. ($ in millions) |

|
|
Fourth Quarter & Full Year 2011 Triple in FOR Initiatives 31 Accelerating Value Realization, Optimizing Transparency and Raising NAV Through Disciplined Investments |

|
|
Our Focus: Triple In FOR Initiatives Historical Avg. (2008-2011) Target Focus on Accelerating Value Realization Triple Residential Lot Sales 850 lots 2,500 lots Triple Oil & Gas Production (Mcfe) 2.3 Bcfe 6.7 Bcfe Triple Total Segment Earnings $33 million > $100 million Optimize Transparency & Disclosure Expand Reported Oil and Gas Resource Potential PDP’s Additional Reserve / Resource Categories Additional Transparency on Water Interests Acres Sustainable Production Potential Report Corporate Sustainability Results - Responsibly integrating economic, social, and environmental resources Raise NAV Through Strategic and Disciplined Investments Growth Opportunities which Prove Up Net Asset Value and Exceed Return Requirements - Target 35% ROC (20-25% IRR) Maintain Financial Flexibility Accelerate Participation in Oil & Gas Working Interests - Lower Risk – Proven Formations Target > 20% Return on Capital Develop Low-Capital, High-Return Multifamily Business - Minimal Capital Investment (10-20% of project equity) 32 |

|
|
ACCELERATING VALUE REALIZATION FROM SALE OF OWNERSHIP INTEREST IN PALISADES WEST Sale of Palisades West Ownership Office venture: Cousins Properties - 50% Dimensional Fund Advisors - 25% Forestar - 25% 375k sq. ft. office project in Austin, TX 99% Leased at YE 2011 Accelerating Value Realization of Stabilized Income Producing Assets Note: DFA had right to purchase remaining ownership of project in fourth quarter 2012 under existing venture agreement Palisades West – Austin, TX FOR Project and Sale Economics: Cash Proceeds = $32 million Basis YE 2011 = (20) million Gain on Sale = $12 million Operating Cash Flow = $4 million Total Cash Flow = $16 million 33 |

|
|
Accelerating Value Realization Building momentum by increasing oil production and proven reserves Growing lot sales and increasing market share Investing to provide near-term cash flow and earnings Building Momentum By Increasing Oil Production, Proven Reserves and Residential Lot Sales 34 |

|
|
Anna Torma SVP Corporate Affairs Forestar Group Inc. 6300 Bee Cave Road Building Two, Suite 500 Austin, TX 78746 512-433-5312 annatorma@forestargroup.com 35 |

|
|
Fourth Quarter & Full Year 2011 Appendix - Segment KPI’s - Proven Reserves - Non-GAAP Reconciliation 36 |

|
|
37 MINERAL RESOURCES SEGMENT KPI'S 4th Qtr 2011 4th Qtr 2010 Full Year 2011 Full Year 2010 Leasing Activity Net Acres Leased 320 5,200 8,100 16,900 Avg. Bonus / Acre $57 $371 $279 $457 Royalties* Natural Gas Produced (MMCF) 373.6 504.8 1,622.0 1,796.4 Average Price / MCF $3.93 $3.94 $3.95 $4.26 Oil Produced (Barrels) 49,700 27,800 151,900 115,400 Average Price / Barrel $102.19 $74.84 $96.84 $73.09 Total MMcfe 671.8 671.8 2,533.4 2,489.1 Average Price / Mcfe $9.75 $6.06 $8.34 $6.46 Segment Revenues ($ in Millions) $6.8 $6.4 $24.6 $24.8 Segment Earnings ($ in Millions) $3.7 $6.1 $16.0** $22.8 Producing Wells* (end of period) 530 494 530 494 * Includes our share of venture production: 4th Qtr. 2011 = 95 MMCf; 4th Qtr 2010 = 227 MMcf; FY 2011 = 493 MMcf; FY 2010 = 573 MMcf 37 ** Includes $3.9 million in costs associated with the development of our water initiatives |

|
|
38 FIBER RESOURCES SEGMENT KPI'S 4th Qtr 2011 4th Qtr 2010 Full Year 2011 Full Year 2010 Fiber Sales Pulpwood Tons Sold 44,100 97,300 266,200 392,900 Average Pulpwood Price / Ton $9.31 $8.77 $8.69 $9.93 Sawtimber Tons Sold 5,600 53,400 56,800 144,300 Average Sawtimber Price / Ton $22.17 $15.75 $16.13 $17.94 Total Tons Sold 49,700 150,700 323,000 537,200 Average Price / Ton $10.76 $11.24 $10.00 $12.08 Recreational Leases Average Acres Leased 139,300 201,800 174,500 208,100 Average Lease Rate / Acre $8.83 $8.31 $8.80 $8.32 Segment Revenues ($ in Millions) $0.9 $2.1 $4.8 $8.3 Segment Earnings ($ in Millions) $0.1 $1.2 $1.9* $5.1 *Fiber resources segment earnings negatively impacted by sale of 74,000 acres of timberland during 2011 |

|
|
39 REAL ESTATE SEGMENT KPI'S 4th Qtr 2011 4th Qtr 2010** Full Year 2011 Full Year 2010 Residential Lot Sales * Lots Sold 309 187 1,117 804 Average Price / Lot $43,300 $49,100 $47,400 $49,500 Gross Profit / Lot $15,200 $19,700 $17,500 $16,600 Commercial Tract Sales * Acres Sold 2.4 1.1 26.4 17.8 Average Price / Acre $547,200 $174,100 $193,700 $90,100 Land Sales * Acres Sold 13,200 1,100 17,120 5,800 Average Price / Acre $2,300 $2,600 $2,400 $3,500 Segment Revenues ($ in Millions) $46.4 $14.3 $106.2 $68.3 Segment Earnings (Loss) ($ in Millions) ($25.0)*** ($5.5) ($25.7)*** ($4.6) Note: 4th Qtr. and full year 2010 real estate segment earnings include non-cash impairment charges of $10.4 million and $11.3 million respectively. 4th Qtr. and full year 2009 real estate segment earnings include non-cash impairment charges of approximately $2.7 million and $10.6 million respectively. ** KPI’s include venture activity, but exclude Q4 2010 sale of 625 acres for about $20 million at Summer Creek venture located near Fort Worth, TX * Includes ventures *** Note: Fourth quarter and full year 2011 real estate segment earnings include pre-tax non-cash asset impairment charges of $44.5 million and $45.2 million respectively |

|
|
YE 2011 Proven Reserves ($ in millions) 2011 2010 % Change Proved Developed Reserves 1 Oil Reserves MBBL 1,053.7 608.7 73% Gas Reserves BCF 11.4 10.5 9% Future Net Revenues* $132.7 $77.5 71% PV-10 3* $81.0 $45.3 79% Proved Developed Non-Producing1 Oil Reserves MBBL 10.7 - nm Gas Reserves BCF 0.1 - nm Future Net Revenues* $1.0 - nm PV-10 3* $0.9 - nm Total Proven Reserves1 Oil Reserves MBBL 1,064.4 608.7 75% Gas Reserves BCF 11.5 10.5 10% Reserves Bcfe2 17.9 14.2 26% Future Net Revenues* $133.7 $77.5 73% PV-10 3* $81.9 $45.3 81% Note: PV-10 analysis based on 2011 average benchmark prices of $92.71 for oil and $4.12 for natural gas; compared with 2010 average benchmark prices of $75.96 for oil and $4.38 for natural gas for 2010. 1 Includes Forestar’s share of equity method ventures 2 Bcfe – Billion Cubic Feet Equivalent (converting oil to natural gas at 6 Mcf / Bbl) 3 PV-10 – Present Value at 10% (before income taxes) 40 *These are Non-GAAP financial measures. The reconciliation between GAAP and Non-GAAP financial measures is provided in the tables following this presentation, and on the company’s investor relations website. |

|
|
41 RECONCILIATION OF NON-GAAP FINANCIAL MEASURES (UNAUDITED) In our full year and fourth quarter 2011 earnings release and conference call presentation materials furnished to the Securities and Exchange Commission on Form 8-K on February 22, 2012, we used certain non-GAAP financial measures. The non-GAAP financial measures should not be relied upon to the exclusion of GAAP financial measures. These non-GAAP financial measures reflect an additional way of viewing aspects of our operations that, when viewed with our GAAP financial statements and the accompanying reconciliations to corresponding GAAP financial measures, may provide a more complete understanding of our business. We strongly encourage investors to review our consolidated financial statements and publicly filed reports in their entirety. Reconciliation of Non-GAAP Financial Measures (Unaudited) The following table shows a reconciliation of PV-10 (discounted future net cash flows before income taxes) to the standardized measure of discounted future net cash flows (the most directly comparable measure calculated and presented in accordance with generally accepted accounting principles, or GAAP). PV-10 is an estimate of the present value of future net cash flows from proved developed reserves after deducting estimated severance and ad valorem taxes, but before deducting any estimates of future income taxes. The estimated future net cash flows are discounted at an annual rate of 10%. A reconciliation of PV-10 to the standardized measure of discounted future net cash flows as computed under GAAP is illustrated below: ($ in 000’s) Year-End 2011* Year-End 2010* PV – 10 (discounted future net cash flows before income taxes) $81,919 $45,267 Less: discounted future income taxes (effective tax rate of 38%) (25,713) (14,130) Standardized measure of discounted future net cash flows $56,206 $31,137 The undiscounted value represents an estimate of future net cash flows from proved developed reserves after deducting estimated severance and ad valorem taxes, but before deducting estimates of future income taxes. A reconciliation of undiscounted future net cash flows before income taxes to the undiscounted future net cash flows after income taxes is illustrated below: ($ in 000’s) Year-End 2011* Year-End 2010* Undiscounted future net cash flows before income taxes $133,729 $77,464 Less: undiscounted future income taxes (effective tax rate of 38%) (41,835) (24,112) Undiscounted future net cash flows after income taxes $91,894 $53,352 We believe both PV-10 and undiscounted values are important for evaluating the relative significance of our oil and gas interests and that the presentation of the non-GAAP financial measures provides useful information to investors because they are widely used by professional analysts and sophisticated investors in evaluating oil and gas companies. Because there are many unique factors that can impact an individual company when estimating the amount of future income taxes to be paid, we believe the use of a pre-tax measure is valuable for evaluating our mineral assets. * Includes our share of proved developed reserves in equity-method ventures |

|
|
Anna Torma SVP Corporate Affairs Forestar Group Inc. 6300 Bee Cave Road Building Two, Suite 500 Austin, TX 78746 512-433-5312 annatorma@forestargroup.com 42 |
