Attached files
| file | filename |
|---|---|
| EX-99.1 - EX-99.1 - Rockwood Holdings, Inc. | a12-5500_1ex99d1.htm |
| 8-K - 8-K - Rockwood Holdings, Inc. | a12-5500_18k.htm |
Exhibit 99.2
|
|
February 21, 2012 Fourth Quarter Results |
|
|
Forward Looking Statements This conference call may contain certain "forward-looking statements" within the meaning of the Private Securities Litigation Reform Act of 1995 concerning the business, operations and financial condition of Rockwood Holdings, Inc. and its subsidiaries (“Rockwood”). Although Rockwood believes the expectations reflected in such forward-looking statements are based upon reasonable assumptions, there can be no assurance that its expectations will be realized. "Forward-looking statements" consist of all non-historical information, including the statements referring to the prospects and future performance of Rockwood. Actual results could differ materially from those projected in Rockwood’s forward-looking statements due to numerous known and unknown risks and uncertainties, including, among other things, the "Risk Factors" described in Rockwood’s periodic reports filed with the Securities and Exchange Commission. Rockwood does not undertake any obligation to publicly update any forward-looking statement to reflect events or circumstances after the date on which any such statement is made or to reflect the occurrence of unanticipated events. |
|
|
Where to Find Materials/Archives A replay of the conference call will be available through March 6th, 2012 at (800) 475-6701 in the U.S., access code: 229199, and internationally at (320) 365-3844, access code: 229199. The webcast and the materials will also be archived on our website at www.rocksp.com and are accessible by clicking on “Company News.” |
|
|
Agenda Fourth Quarter and Full Year Highlights Financial Summary Summary Appendices Note: All ’11 and ’10 data, other than as noted, are for continuing operations only. |
|
|
Fourth Quarter and Full Year Highlights |
|
|
Fourth Quarter Highlights Net sales of $814.4 mm - Up 2.0% versus prior year and up 3.0% on a constant currency basis - Higher selling prices, partially offset by lower volumes - Continued volume growth in Surface Treatment and Clay-based Additives Adjusted EBITDA(a) of $195.7 mm - Up 27.3% versus prior year and up 28.7% on a constant currency basis Adjusted EBITDA(a) margin of 24.0% - Price increases more than offset lower volumes as well as raw material cost increases - Rockwood achieved again a high quarterly margin Adjusted EPS(a) of $0.91 - Increase versus prior year driven primarily by higher Adj. EBITDA, as well as lower interest expense from debt repayments and refinancing Net Debt/LTM Adj. EBITDA at 1.58 x - Reduced leverage ratio (a) Non-GAAP measure; see reconciliation in the appendix. |
|
|
Full Year Highlights Net sales of $3,669.3 mm - Up 15.0% versus prior year and up 10.7% on a constant currency basis - Higher selling prices, as well as higher volumes in Advanced Ceramics, Fine Chemicals, Surface Treatment and Clay-based Additives Adjusted EBITDA(a) of $862.8 mm - Up 36.0% versus prior year and up 30.6% on a constant currency basis Adjusted EBITDA(a) margin of 23.5% - Price increases more than offset raw material and other manufacturing cost increases - Rockwood achieved all-time high full year margin of 23.5%, up from 19.9% in 2010 Adjusted EPS(a) of $4.02 - More than doubled compared to prior year - Increase driven primarily by improved Adj. EBITDA, as well as lower interest expense from debt repayments and refinancing (a) Non-GAAP measure; see reconciliation in the appendix. |
|
|
Fourth Quarter and Full Year Summary Fourth Quarter Full Year % Change % Change ($M) , except EPS Yr 2011 Yr 2010 Total Constant Currency (b) Yr 2011 Yr 2010 Total Constant Currency (b) Continuing Operations: Net Sales 814.4 798.3 2.0% 3.0% 3,669.3 3,191.6 15.0% 10.7% Adjusted EBITDA (a) 195.7 153.7 27.3% 28.7% 862.8 634.4 36.0% 30.6% Adj. EBITDA Margin 24.0% 19.3% 4.7 ppt 23.5% 19.9% 3.6 ppt Net Income - as reported 63.0 103.8 (39.3%) 291.1 220.0 32.3% EPS (Diluted) - as reported (c) 0.79 1.32 (40.2%) 3.64 2.82 29.1% Net Income - as adjusted (d) 72.7 33.3 118.3% 321.2 143.8 123.4% EPS (Diluted) - as adjusted (d) 0.91 0.42 116.7% 4.02 1.84 118.5% (a) A reconciliation of Net Income to Adjusted EBITDA is provided. See Appendices. (b) Based on constant currencies. See Appendices. (c) (d) A reconciliation of Net Income / EPS as reported to Net Income / EPS as adjusted is provided. See Appendices. For the fourth quarter, Yr 2011 based on share count of 79,857; Yr 2010 based on share count of 78,494. For the full year, Yr 2011 based on share count of 79,865; Yr 2010 based on share count of 78,093. |
|
|
Net Sales Growth Fourth Quarter Full Year ($M) Net Sales % Change ($M) Net Sales % Change Yr 2011 Qtr 4 814.4 Yr 2011 YTD 3,669.3 Yr 2010 Qtr 4 798.3 Yr 2010 YTD 3,191.6 Change 16.1 2.0% Change 477.7 15.0% Due to (Approx.): Due to (Approx.): Pricing 74.5 9.3% Pricing 303.3 9.5% Currency (8.0) (1.0%) Currency 136.2 4.3% Volume/Mix (50.4) (6.3%) Volume/Mix 38.2 1.2% |
|
|
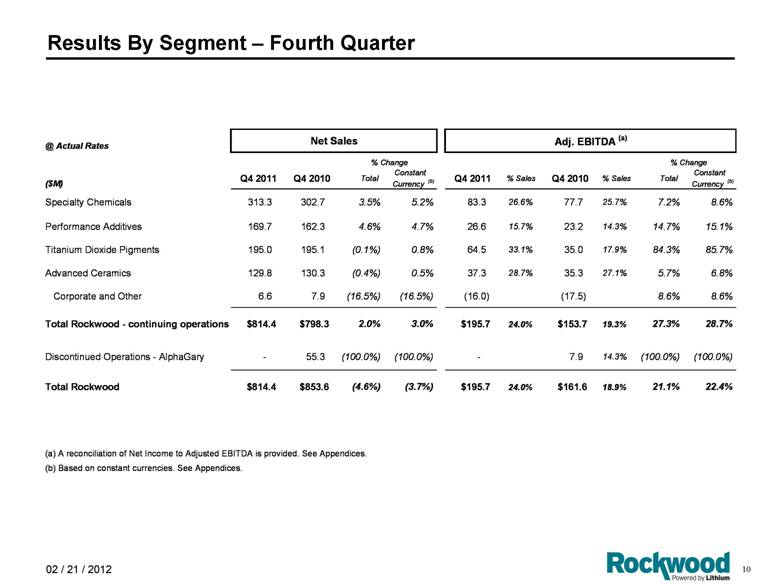
Results By Segment – Fourth Quarter @ Actual Rates Net Sales Adj. EBITDA (a) % Change % Change ($M) Q4 2011 Q4 2010 Total Constant Currency (b) Q4 2011 % Sales Q4 2010 % Sales Total Constant Currency (b) Specialty Chemicals 313.3 302.7 3.5% 5.2% 83.3 26.6% 77.7 25.7% 7.2% 8.6% Performance Additives 169.7 162.3 4.6% 4.7% 26.6 15.7% 23.2 14.3% 14.7% 15.1% Titanium Dioxide Pigments 195.0 195.1 (0.1%) 0.8% 64.5 33.1% 35.0 17.9% 84.3% 85.7% Advanced Ceramics 129.8 130.3 (0.4%) 0.5% 37.3 28.7% 35.3 27.1% 5.7% 6.8% Corporate and Other 6.6 7.9 (16.5%) (16.5%) (16.0) (17.5) 8.6% 8.6% Total Rockwood - continuing operations $814.4 $798.3 2.0% 3.0% $195.7 24.0% $153.7 19.3% 27.3% 28.7% Discontinued Operations - AlphaGary - 55.3 (100.0%) (100.0%) - 7.9 14.3% (100.0%) (100.0%) Total Rockwood $814.4 $853.6 (4.6%) (3.7%) $195.7 24.0% $161.6 18.9% 21.1% 22.4% (a) A reconciliation of Net Income to Adjusted EBITDA is provided. See Appendices. (b) Based on constant currencies. See Appendices. |
|
|
Results By Segment – Full Year @ Actual Rates Net Sales Adj. EBITDA (a) % Change % Change ($M) FY 2011 FY 2010 Total Constant Currency (b) FY 2011 % Sales FY 2010 % Sales Total Constant Currency (b) Specialty Chemicals 1,338.3 1,163.2 15.1% 11.2% 349.1 26.1% 295.7 25.4% 18.1% 14.8% Performance Additives 784.4 726.7 7.9% 5.6% 144.0 18.4% 123.8 17.0% 16.3% 13.4% Titanium Dioxide Pigments 930.4 759.2 22.6% 16.3% 257.6 27.7% 129.5 17.1% 98.9% 89.0% Advanced Ceramics 585.1 515.6 13.5% 8.5% 183.7 31.4% 153.2 29.7% 19.9% 14.2% Corporate and Other 31.1 26.9 15.6% 9.3% (71.6) (67.8) (5.6%) (5.0%) Total Rockwood - continuing operations $3,669.3 $3,191.6 15.0% 10.7% $862.8 23.5% $634.4 19.9% 36.0% 30.6% Discontinued Operations - AlphaGary 3.9 231.3 (98.3%) (98.3%) 0.2 5.1% 33.5 14.5% (99.4%) (99.4%) Total Rockwood $3,673.2 $3,422.9 7.3% 3.3% $863.0 23.5% $667.9 19.5% 29.2% 24.1% (a) A reconciliation of Net Income to Adjusted EBITDA is provided. See Appendices. (b) Based on constant currencies. See Appendices. |
|
|
Specialty Chemicals In the Fine Chemicals business, higher selling prices were partially offset by higher raw material costs. In the Surface Treatment business, increased selling prices, as well as higher volumes in most markets, particularly in automotive and general industrial, were partially offset by higher raw material costs. A reconciliation of Net Income to Adjusted EBITDA is provided. See Appendices. Based on constant currencies. See Appendices. @ Actual Rates Net Sales Adj. EBITDA (a) % Change % Change ($M) Yr 2011 Yr 2010 Total Constant Currency (b) Yr 2011 Yr 2010 Total Constant Currency (b) Fourth Quarter 313.3 302.7 3.5% 5.2% 83.3 77.7 7.2% 8.6% Adj. EBITDA Margin 26.6% 25.7% 0.9 ppt Full Year 1,338.3 1,163.2 15.1% 11.2% 349.1 295.7 18.1% 14.8% Adj. EBITDA Margin 26.1% 25.4% 0.7 ppt |
|
|
Performance Additives Net sales were up from increased selling prices, as well as higher volumes of oilfield applications in the Clay-based Additives business. This was partially offset by lower volumes in the Color Pigments and Services and Timber Treatment Chemicals businesses. Adjusted EBITDA was up from higher selling prices, partially offset by higher raw material costs and lower volumes. A reconciliation of Net Income to Adjusted EBITDA is provided. See Appendices. Based on constant currencies. See Appendices. @ Actual Rates Net Sales Adj. EBITDA (a) % Change % Change ($M) Yr 2011 Yr 2010 Total Constant Currency (b) Yr 2011 Yr 2010 Total Constant Currency (b) Fourth Quarter 169.7 162.3 4.6% 4.7% 26.6 23.2 14.7% 15.1% Adj. EBITDA Margin 15.7% 14.3% 1.4 ppt Full Year 784.4 726.7 7.9% 5.6% 144.0 123.8 16.3% 13.4% Adj. EBITDA Margin 18.4% 17.0% 1.4 ppt |
|
|
Titanium Dioxide Pigments Net sales were down slightly on lower volumes from customer destocking, partially offset by higher selling prices. Adjusted EBITDA was up on higher selling prices, partially offset by lower volumes and higher raw material costs, particularly slag and ilmenite, and higher energy costs. A reconciliation of Net Income to Adjusted EBITDA is provided. See Appendices. Based on constant currencies. See Appendices. @ Actual Rates Net Sales Adj. EBITDA (a) % Change % Change ($M) Yr 2011 Yr 2010 Total Constant Currency (b) Yr 2011 Yr 2010 Total Constant Currency (b) Fourth Quarter 195.0 195.1 (0.1%) 0.8% 64.5 35.0 84.3% 85.7% Adj. EBITDA Margin 33.1% 17.9% 15.2 ppt Full Year 930.4 759.2 22.6% 16.3% 257.6 129.5 98.9% 89.0% Adj. EBITDA Margin 27.7% 17.1% 10.6 ppt (a) (b) |
|
|
Advanced Ceramics Net sales were down slightly as lower volumes of electronic and mechanical systems applications and the negative impact of currency changes were partially offset by higher volumes of medical applications. Adjusted EBITDA was up on improved productivity and lower maintenance costs. A reconciliation of Net Income to Adjusted EBITDA is provided. See Appendices. Based on constant currencies. See Appendices. @ Actual Rates Net Sales Adj. EBITDA (a) % Change % Change ($M) Yr 2011 Yr 2010 Total Constant Currency (b) Yr 2011 Yr 2010 Total Constant Currency (b) Fourth Quarter 129.8 130.3 (0.4%) 0.5% 37.3 35.3 5.7% 6.8% Adj. EBITDA Margin 28.7% 27.1% 1.6 ppt Full Year 585.1 515.6 13.5% 8.5% 183.7 153.2 19.9% 14.2% Adj. EBITDA Margin 31.4% 29.7% 1.7 ppt |
|
|
Financial Summary |
|
|
Income Statement - Reported ($M) Fourth Quarter Full Year Yr 2011 Yr 2010 Yr 2011 Yr 2010 Net sales 814.4 798.3 3,669.3 3,191.6 Gross profit 291.1 250.0 1,289.3 1,041.8 Gross Profit % 35.7% 31.3% 35.1% 32.6% Operating Income 116.7 72.9 567.3 357.7 Operating income % 14.3% 9.1% 15.5% 11.2% Interest expense, net (a) (22.1) (34.4) (96.1) (151.1) Loss on early extinguishment/modification of debt - - (16.6) (1.6) Foreign exchange (loss) gain on financing activities, net (0.5) (1.8) 1.3 (1.0) Other, net 0.3 - 0.2 0.5 Income from continuing operations before taxes $94.4 $36.7 $456.1 $204.5 Income tax provision (benefit) (including reversal of $76.5 valuation allowance from sale of plastic compounding business for the fourth quarter and full year 2010) 23.4 (71.0) 124.4 (24.6) Income from continuing operations $71.0 $107.7 $331.7 $229.1 Income from discontinued operations, net of tax - 5.8 0.9 19.4 (Loss) gain on sale of discontinued operations, net of tax (0.1) - 119.3 - Net income $70.9 $113.5 $451.9 $248.5 Net income attributable to noncontrolling interest (8.0) (3.9) (40.6) (9.1) Net income attributable to Rockwood Holdings, Inc. $62.9 $109.6 $411.3 $239.4 Amounts attributable to Rockwood Holdings, Inc.: Income from continuing operations 63.0 103.8 291.1 220.0 (Loss) income from discontinued operations (0.1) 5.8 120.2 19.4 Net income $62.9 $109.6 $411.3 $239.4 (a) Interest expense, net includes: Interest expense on debt, net (20.5) (37.5) (91.8) (158.6) Mark-to-market (losses) gains on interest rate swaps (0.5) 4.5 0.5 13.4 Deferred financing costs (1.1) (1.4) (4.8) (5.9) Total $(22.1) $(34.4) $(96.1) $(151.1) |
|
|
Reconciliation of Net Income to Adjusted EBITDA ($M) Yr 2011 Yr 2010 Yr 2011 Yr 2010 Net income attributable to Rockwood Holdings, Inc. $62.9 $109.6 $411.3 $239.4 Net income attributable to noncontrolling interest 8.0 3.9 40.6 9.1 Net income 70.9 113.5 451.9 248.5 Income tax provision (benefit) (including reversal of $76.5 valuation allowance from sale of plastic compounding business for the fourth quarter and full year 2010) 23.4 (71.0) 124.4 (24.6) Income from discontinued operations, net of tax - (5.8) (0.9) (19.4) Loss (gain) on sale of discontinued operations, net of tax 0.1 - (119.3) - Income from continuing operations before taxes 94.4 36.7 456.1 204.5 Interest expense, net 22.1 34.4 96.1 151.1 Depreciation and amortization 67.0 67.5 267.2 255.9 Sub-Total 183.5 138.6 819.4 611.5 Restructuring and other severance costs 5.0 2.2 14.5 5.0 Systems/organization establishment expenses 5.2 0.6 6.5 2.1 Acquisition and disposal costs - 0.3 0.4 1.3 Loss on early extinguishment/modification of debt - - 16.6 1.6 Asset write-downs and other 1.3 9.2 1.6 11.5 Foreign exchange loss (gain) on financing activities, net 0.5 1.8 (1.3) 1.0 Other 0.2 1.0 5.1 0.4 Adjusted EBITDA from continuing operations 195.7 153.7 862.8 634.4 Discontinued Operations - AlphaGary - 7.9 0.2 33.5 Total Adjusted EBITDA $195.7 $161.6 $863.0 $667.9 Full Year Fourth Quarter |
|
|
Reconciliation of Net Income/EPS as Reported to Net Income/EPS as Adjusted Net Income ($M) Diluted EPS Net Income ($M) Diluted EPS Net income from continuing operations $63.0 $0.79 $291.1 $3.64 Adjustments to expenses from continuing operations: Restructuring and other severance costs 5.0 0.06 12.5 0.16 Systems/organization establishment expenses 2.5 0.03 3.4 0.04 Asset write-downs and other 1.1 0.01 1.3 0.02 Foreign exchange loss on financing activities, net 0.3 0.01 - - Mark-to-market swap loss 0.2 - - - Loss on early extinguishment/modification of debt - - 13.5 0.17 Other 0.6 0.01 3.5 0.04 Subtotal 9.7 0.12 34.2 0.43 Adjustments to income from continuing operations: Foreign exchange gain on financing activities, net - - (2.7) (0.03) Mark-to-market swap gain - - (1.4) (0.02) Subtotal - - (4.1) (0.05) Total adjustments 9.7 0.12 30.1 0.38 As adjusted $72.7 $0.91 $321.2 $4.02 Weighted average number of diluted shares outstanding 79,857 79,865 (a) The tax effects of the adjustments are benefits of $1.7 million for the fourth quarter 2011 and $9.6 million for the full year 2011, based on the statutory tax rate in the various tax jurisdictions in which the adjustments occurred, adjusted for the impact of certain valuation allowances. Full Year 2011 Fourth Quarter 2011 (a) |
|
|
Tax Provision Reconciliation – Fourth Quarter 2011 ($M) Income from cont. ops. before taxes and noncontrolling interest Income tax provision Net (income) attributable to noncontrolling interest Income from continuing operations As reported $94.4 $23.4 $(8.0) $63.0 Adjustments to expenses from continuing operations: Restructuring and other severance costs 6.0 1.0 5.0 Systems/organization establishment expenses 5.2 1.4 (1.3) 2.5 Asset write-downs and other 1.3 0.2 1.1 Foreign exchange loss on financing activities, net (b) 0.5 0.2 0.3 Mark-to-market swap loss 0.5 0.2 (0.1) 0.2 Other 0.2 (0.9) (0.5) 0.6 As adjusted $108.1 $25.5 $(9.9) $72.7 (a) The tax effects of the adjustments are based on the statutory tax rate in the various tax jurisdictions in which the adjustments occurred, adjusted for the impact of certain valuation allowances. (b) Foreign exchange gains / losses in the US have no tax associated with them due to the valuation allowance. Foreign exchange gains / losses outside the US have a tax provision / benefit recorded which is added back for normalization purposes. Fourth Quarter 2011 (a) |
|
|
Consolidated Net Debt March 31, 2011 June 30, 2011 September 30, 2011 December 31, 2011 ($M) as reported as reported Covenant as reported Covenant as reported Covenant as reported Covenant Balance Sheet FX-Rate 1.34 1.42 1.32 1.45 1.37 1.34 1.40 1.30 1.39 LTM Adj EBITDA $667.9 $684.0 $692.0 $754.4 $761.5 $820.7 $828.0 $862.8 $875.2 Net Debt Rockwood Term Loans 1,259.9 850.0 850.0 850.0 850.0 845.8 845.8 845.8 845.8 TiO2 Venture Term Loan 294.4 311.5 291.1 304.5 286.7 281.1 293.0 252.7 271.5 Assumed Debt 71.9 72.6 64.4 73.3 65.1 67.5 65.7 65.1 64.8 Sr. Sub. Notes 2014 534.7 554.1 562.7 534.8 524.1 Total Debt $2,161.0 $1,788.2 $1,205.5 $1,790.5 $1,201.8 $1,729.2 $1,204.5 $1,687.7 $1,182.1 Cash (340.7) (199.1) (199.1) (235.2) (200.0) (357.9) (200.0) (321.5) (200.0) Net Debt $1,820.3 $1,589.1 $1,006.4 $1,555.3 $1,001.8 $1,371.3 $1,004.5 $1,366.2 $982.1 Net Debt / LTM Adj. EBITDA 2.73 x 2.32 x 2.06 x 1.67 x 1.58 x Covenant - as calculated 1.45 x 1.32 x 1.21 x 1.12 x - with full cash 1.45 x 1.27 x 1.02 x 0.98 x Covenant per Credit Agreement 2.75 x 2.75 x 2.75 x 2.75 x December 31, 2010 (b) Excludes Adjusted EBITDA from certain subsidiaries and joint ventures and stock-based compensation expenses. (a) Covenant leverage ratio calculation under senior credit agreement for Rockwood Specialties Group, Inc specifies maximum level of cash at $200 million and converts Euro denominated debt at average Euro-rate during LTM period. (c) We intend to issue $350 million in new term loans and use the proceeds and cash-on-hand to redeem all outstanding 2014 Notes and pay applicable premiums and accrued and unpaid interest. (b) (a) (b) (a) (b) (a) (b) (a) (c) |
|
|
Net Debt / LTM Adjusted EBITDA Note: Net Debt / LTM Adjusted EBITDA as per definition for covenant leverage ratio calculation under senior credit agreement for Rockwood Specialties Group, Inc., but using total Cash. Covenant Calculation based on Senior Debt only not to exceed 2.75 x Rockwood at 0.98 x at Dec. 31 (using total Cash) 0,5 1,0 1,5 2,0 2,5 3,0 3,5 4,0 4,5 5,0 5,5 6,0 6,5 7,0 31-Dec-03 31-Mar-04 30-Jun-04 30-Sep-04 31-Dec-04 31-Mar-05 30-Jun-05 30-Sep-05 31-Dec-05 31-Mar-06 30-Jun-06 30-Sep-06 31-Dec-06 31-Mar-07 30-Jun-07 30-Sep-07 31-Dec-07 31-Mar-08 30-Jun-08 30-Sep-08 31-Dec-08 31-Mar-09 30-Jun-09 30-Sep-09 31-Dec-09 31-Mar-10 30-Jun-10 30-Sep-10 31-Dec-10 31-Mar-11 30-Jun-11 30-Sep-11 31-Dec-11 Total Net Debt (using total Cash) to LTM Adj. EBITDA Covenant Net Debt (using total Cash) to LTM Adj. EBITDA |
|
|
Free Cash Flow ($M) Fourth Quarter 2011 Full Year 2011 Adjusted EBITDA $195.7 $862.8 WC Change (a) (60.0) (187.1) Cash Taxes (b) (18.4) (98.1) Cash Interest (c) (20.5) (91.8) Cash From Operating Activities (d) $96.8 $485.8 CAPEX (e) (97.7) (278.6) Free Cash Flow $(0.9) $207.2 (a) (b) Represents current portion of income tax provision. (c) Interest expense, net minus deferred financing costs and MTM of swaps. (d) Excludes $10.4 million for the fourth quarter 2011 and $35.0 million for the full year 2011 of special items and other, net. (e) CAPEX net of proceeds on sale of property, plant and equipment and government grants received. Includes changes in accounts receivable, inventories, prepaid expenses, accounts payable, income taxes payable and accrued expenses. All figures net of the effect of foreign currency translation and impact of acquisitions and divestitures. |
|
|
Appendices |
|
|
Reconciliation of Net Income to Adjusted EBITDA ($M) Yr 2011 Yr 2010 Yr 2011 Yr 2010 Net income attributable to Rockwood Holdings, Inc. $62.9 $109.6 $411.3 $239.4 Net income attributable to noncontrolling interest 8.0 3.9 40.6 9.1 Net income 70.9 113.5 451.9 248.5 Income tax provision (benefit) (including reversal of $76.5 valuation allowance from sale of plastic compounding business for the fourth quarter and full year 2010) 23.4 (71.0) 124.4 (24.6) Income from discontinued operations, net of tax - (5.8) (0.9) (19.4) Loss (gain) on sale of discontinued operations, net of tax 0.1 - (119.3) - Income from continuing operations before taxes 94.4 36.7 456.1 204.5 Interest expense, net 22.1 34.4 96.1 151.1 Depreciation and amortization 67.0 67.5 267.2 255.9 Restructuring and other severance costs 5.0 2.2 14.5 5.0 Systems/organization establishment expenses 5.2 0.6 6.5 2.1 Acquisition and disposal costs - 0.3 0.4 1.3 Loss on early extinguishment/modification of debt - - 16.6 1.6 Asset write-downs and other 1.3 9.2 1.6 11.5 Foreign exchange loss (gain) on financing activities, net 0.5 1.8 (1.3) 1.0 Other 0.2 1.0 5.1 0.4 Adjusted EBITDA from continuing operations 195.7 153.7 862.8 634.4 Discontinued Operations - AlphaGary - 7.9 0.2 33.5 Total Adjusted EBITDA $195.7 $161.6 $863.0 $667.9 Full Year Fourth Quarter |
|
|
Reconciliation of Pre-Tax Income to Adjusted EBITDA - Fourth Quarter ($M) Titanium Discontinued Specialty Performance Dioxide Advanced Operations - Corporate Fourth Quarter 2011 Chemicals Additives Pigments Ceramics AlphaGary and other Consolidated Income (loss) - cont. ops. before taxes 52.4 7.9 37.1 18.6 - (21.6) 94.4 Interest expense, net 7.0 2.2 3.5 4.8 - 4.6 22.1 Depreciation and amortization 18.9 15.1 18.3 13.3 - 1.4 67.0 Restructuring and other severance costs 4.2 0.4 - 0.2 - 0.2 5.0 Systems/organization establishment expenses 0.4 0.1 4.7 - - - 5.2 Asset write-downs and other 0.1 0.8 - 0.4 - - 1.3 Foreign exchange loss (gain) on financing activities, net 0.7 (0.1) - - - (0.1) 0.5 Other (0.4) 0.2 0.9 - - (0.5) 0.2 Adjusted EBITDA - continuing operations $83.3 $26.6 $64.5 $37.3 - $(16.0) $195.7 Discontinued Operations - AlphaGary - - - - - - - Total Adjusted EBITDA $83.3 $26.6 $64.5 $37.3 - $(16.0) $195.7 Fourth Quarter 2010 Income (loss) - cont. ops. before taxes 42.3 3.4 12.2 14.0 - (35.2) 36.7 Interest expense, net 10.6 2.9 2.9 6.9 - 11.1 34.4 Depreciation and amortization 19.4 13.9 19.6 13.1 - 1.5 67.5 Restructuring and other severance costs 1.3 0.7 - 0.3 - (0.1) 2.2 Systems/organization establishment expenses 0.2 - 0.2 0.1 - 0.1 0.6 Acquisition and disposal costs 0.1 0.1 - - - 0.1 0.3 Asset write-downs and other 1.6 2.0 0.1 0.8 - 4.7 9.2 Foreign exchange loss (gain) on financing activities, net 1.9 0.1 - 0.1 - (0.3) 1.8 Other 0.3 0.1 - - - 0.6 1.0 Adjusted EBITDA - continuing operations $77.7 $23.2 $35.0 $35.3 - $(17.5) $153.7 Discontinued Operations - AlphaGary - - - - 7.9 - 7.9 Total Adjusted EBITDA $77.7 $23.2 $35.0 $35.3 $7.9 $(17.5) $161.6 |
|
|
Reconciliation of Pre-Tax Income to Adjusted EBITDA – Full Year ($M) Titanium Discontinued Specialty Performance Dioxide Advanced Operations - Corporate Full Year 2011 Chemicals Additives Pigments Ceramics AlphaGary and other Consolidated Income (loss) - cont. ops. before taxes 217.4 69.7 163.7 102.2 - (96.9) 456.1 Interest expense, net 33.5 9.1 12.7 21.6 - 19.2 96.1 Depreciation and amortization 77.7 58.4 71.9 53.7 - 5.5 267.2 Restructuring and other severance costs 11.2 2.3 - 0.7 - 0.3 14.5 Systems/organization establishment expenses 0.8 0.7 5.0 - - - 6.5 Acquisition and disposal costs 0.1 - - 0.1 - 0.2 0.4 Loss on early extinguishment/modification of debt 7.8 1.7 - 4.0 - 3.1 16.6 Asset write-downs and other 0.2 0.8 - 0.6 - - 1.6 Foreign exchange loss (gain) on financing activities, net 0.2 1.1 - 0.8 - (3.4) (1.3) Other 0.2 0.2 4.3 - - 0.4 5.1 Adjusted EBITDA - continuing operations $349.1 $144.0 $257.6 $183.7 - $(71.6) $862.8 Discontinued Operations - AlphaGary - - - - 0.2 - 0.2 Total Adjusted EBITDA $349.1 $144.0 $257.6 $183.7 $0.2 $(71.6) $863.0 Full Year 2010 Income (loss) - cont. ops. before taxes 158.1 34.0 44.5 72.4 - (104.5) 204.5 Interest expense, net 57.0 25.8 15.0 29.1 - 24.2 151.1 Depreciation and amortization 74.3 56.8 69.6 49.6 - 5.6 255.9 Restructuring and other severance costs 2.0 1.5 - 1.1 - 0.4 5.0 Systems/organization establishment expenses 1.0 0.3 0.5 0.2 - 0.1 2.1 Acquisition and disposal costs 0.5 0.2 - - 0.6 1.3 Loss on early extinguishment/modifications of debt 0.7 0.3 - 0.4 - 0.2 1.6 Asset write-downs and other 1.8 4.1 0.1 0.8 - 4.7 11.5 Foreign exchange loss (gain) on financing activities, net 0.6 0.1 - (0.4) - 0.7 1.0 Other (0.3) 0.7 (0.2) - - 0.2 0.4 Adjusted EBITDA - continuing operations $295.7 $123.8 $129.5 $153.2 - $(67.8) $634.4 Discontinued Operations - AlphaGary - - - - 33.5 - 33.5 Total Adjusted EBITDA $295.7 $123.8 $129.5 $153.2 $33.5 $(67.8) $667.9 |
|
|
Constant Currency Effect on Results – Fourth Quarter ($M) Constant Currency basis Net Change in $ Net Change in % Net Sales Specialty Chemicals 10.6 3.5 (5.0) 15.6 5.2 Performance Additives 7.4 4.6 (0.3) 7.7 4.7 Titanium Dioxide Pigments (0.1) (0.1) (1.6) 1.5 0.8 Advanced Ceramics (0.5) (0.4) (1.1) 0.6 0.5 Corporate and Other (1.3) (16.5) - (1.3) (16.5) Net Sales - cont. ops. $16.1 2.0 % $(8.0) $24.1 3.0 % Discontinued Operations - AlphaGary (55.3) (100.0) - (55.3) (100.0) Total Net Sales $(39.2) (4.6) % $(8.0) $(31.2) (3.7) % Adjusted EBITDA Specialty Chemicals 5.6 7.2 (1.1) 6.7 8.6 Performance Additives 3.4 14.7 (0.1) 3.5 15.1 Titanium Dioxide Pigments 29.5 84.3 (0.5) 30.0 85.7 Advanced Ceramics 2.0 5.7 (0.4) 2.4 6.8 Corporate and Other 1.5 8.6 - 1.5 8.6 Adjusted EBITDA - cont. ops. $42.0 27.3 % $(2.1) $44.1 28.7 % Discontinued Operations - AlphaGary (7.9) (100.0) - (7.9) (100.0) Total Adjusted EBITDA $34.1 21.1 % (2.1) $36.2 22.4 % Change: Fourth Quarter 2011 versus 2010 (a) The constant currency effect is the translation impact of the change in the average rate of exchange of another currency to the U.S. dollar for the applicable period as compared to the preceding period. The impact primarily relates to the conversion of the Euro to the U.S. dollar. Constant Currency Effect in $ Total Change in % Total Change in $ (a) (a) |
|
|
Constant Currency Effect on Results – Full Year ($M) Constant Currency basis Net Change in $ Net Change in % Net Sales Specialty Chemicals 175.1 15.1 44.5 130.6 11.2 Performance Additives 57.7 7.9 17.1 40.6 5.6 Titanium Dioxide Pigments 171.2 22.6 47.3 123.9 16.3 Advanced Ceramics 69.5 13.5 25.6 43.9 8.5 Corporate and Other 4.2 15.6 1.7 2.5 9.3 Net Sales - cont. ops. $477.7 15.0 % $136.2 $341.5 10.7 % Discontinued Operations - AlphaGary (227.4) (98.3) - (227.4) (98.3) Total Net Sales $250.3 7.3 % $136.2 $114.1 3.3 % Adjusted EBITDA Specialty Chemicals 53.4 18.1 9.5 43.9 14.8 Performance Additives 20.2 16.3 3.6 16.6 13.4 Titanium Dioxide Pigments 128.1 98.9 12.8 115.3 89.0 Advanced Ceramics 30.5 19.9 8.7 21.8 14.2 Corporate and Other (3.8) (5.6) (0.4) (3.4) (5.0) Adjusted EBITDA - cont. ops. $228.4 36.0 % $34.2 $194.2 30.6 % Discontinued Operations - AlphaGary (33.3) (99.4) - (33.3) (99.4) Total Adjusted EBITDA $195.1 29.2 % $34.2 $160.9 24.1 % Change: Full Year 2011 versus 2010 (a) The constant currency effect is the translation impact of the change in the average rate of exchange of another currency to the U.S. dollar for the applicable period as compared to the preceding period. The impact primarily relates to the conversion of the Euro to the U.S. dollar. Total Change in $ Total Change in % Constant Currency Effect in $ (a) (a) (a) |
|
|
Reconciliation of Net Income/EPS – Fourth Quarter and Full Year 2010 Net Income ($M) Diluted EPS Net Income ($M) Diluted EPS Net income from continuing operations $103.8 $1.32 $220.0 $2.82 Adjustments to expenses from continuing operations: Restructuring and other severance costs 1.9 0.02 3.1 0.04 Systems/organization establishment expenses 0.3 - 1.4 0.02 Asset write-downs and other 7.5 0.10 9.8 0.13 Foreign exchange loss on financing activities, net 0.8 0.01 - - Loss on early extinguishment/modification of debt - - 1.4 0.02 Other 1.1 0.01 1.7 0.01 Subtotal 11.6 0.14 17.4 0.22 Adjustments to income from continuing operations: Mark-to-market swap gain (3.6) (0.04) (10.3) (0.13) Valuation allowance reversal from sale of AlphaGary (76.5) (0.97) (76.5) (0.98) Impact of tax related items (2.0) (0.03) (6.8) (0.09) Subtotal (82.1) (1.04) (93.6) (1.20) Total adjustments (70.5) (0.90) (76.2) (0.98) As adjusted $33.3 $0.42 $143.8 $1.84 Weighted average number of diluted shares outstanding 78,494 78,093 Fourth Quarter 2010 Full Year 2010 (a) The tax effects of the adjustments are benefits provision of $81.3 million for the fourth quarter 2010 and $86.2 million for the full year 2010, based on the statutory tax rate in the various tax jurisdictions in which the adjustments occurred, adjusted for the impact of certain valuation allowances. (a) |
|
|
Tax Provision Reconciliation – Full Year 2011 ($M) Income from cont. ops. before taxes and noncontrolling interest Income tax provision Net (income) attributable to noncontrolling interest Income from continuing operations As reported $456.1 $124.4 $(40.6) $291.1 Adjustments to expenses from continuing operations: Restructuring and other severance costs 15.5 3.0 12.5 Systems/organization establishment expenses 6.5 1.7 (1.4) 3.4 Asset write-downs and other 1.6 0.3 1.3 Loss on early extinguishment/modification of debt 16.6 3.1 13.5 Other 5.5 0.6 (1.4) 3.5 Adjustments to income from continuing operations: Foreign exchange on financing activities (b) (1.3) 1.4 (2.7) Mark-to-market swap gain (c) (0.5) 0.5 (0.4) (1.4) As adjusted $500.0 $135.0 $(43.8) $321.2 (c) MTM gains / losses in the US have no tax associated with them due to the valuation allowance. MTM gains / losses outside the US have a tax provision / benefit recorded which is added back for normalization purposes. Full Year 2011 (a) The tax effects of the adjustments are based on the statutory tax rate in the various tax jurisdictions in which the adjustments occurred, adjusted for the impact of certain valuation allowances. (b) Foreign exchange gains / losses in the US have no tax associated with them due to the valuation allowance. Foreign exchange gains / losses outside the US have a tax provision / benefit recorded which is added back for normalization purposes. (a) |
|
|
Tax Provision Reconciliation 2010 ($M) Income from cont. ops. before taxes and noncontrolling interest Income tax provision Net (income) attributable to non- controlling interest Income from continuing operations Income from cont. ops. before taxes and noncontrolling interest Income tax provision Net (income) attributable to non- controlling interest Income from continuing operations As reported $36.7 $(71.0) $(3.9) $103.8 $204.5 $(24.6) $(9.1) $220.0 Adjustments to expenses from continuing operations: Restructuring and other severance costs 2.2 0.3 1.9 5.0 1.0 (0.9) 3.1 Systems/organization establishment expenses 0.6 0.2 (0.1) 0.3 2.1 0.6 (0.1) 1.4 Asset write-downs and other 9.2 1.7 7.5 11.5 1.7 9.8 Foreign exchange loss on financing activities, net (b) 1.8 1.0 0.8 Loss on early extinguishment/modification of debt 1.6 0.2 1.4 Other 1.3 0.2 1.1 2.7 1.0 - 1.7 Adjustments to income from continuing operations: Mark-to-market swap gain (c) (4.5) (0.5) 0.4 (3.6) (13.4) (1.9) 1.2 (10.3) Valuation allowance reversal from sale of AlphaGary - 76.5 (76.5) - 76.5 (76.5) Impact of tax related items (d) - 2.0 (2.0) - 6.8 (6.8) As adjusted $47.3 $10.4 $(3.6) $33.3 $214.0 $61.3 $(8.9) $143.8 (d) Represents the impact of tax rate changes, settlement of certain tax positions related to acquisition accounting, deferred tax reversals related to AlphaGary, a benefit related to a functional currency change and an allocation from OCI. (c) MTM gains / losses in the US have no tax associated with them due to the valuation allowance. MTM gains / losses outside the US have a tax provision / benefit recorded which is added back for normalization purposes. Fourth Quarter 2010 (a) The tax effects of the adjustments are based on the statutory tax rate in the various tax jurisdictions in which the adjustments occurred, adjusted for the impact of certain valuation allowances. Full Year 2010 (b) Foreign exchange gains / losses in the US have no tax associated with them due to the valuation allowance. Foreign exchange gains / losses outside the US have a tax provision / benefit recorded which is added back for normalization purposes. (a) (a) |
|
|
Reconciliation of Net Cash to Adjusted EBITDA Full Year ($M) Yr 2011 Yr 2010 Net cash provided by operating activities - continuing operations $450.8 $478.0 Changes in assets and liabilities, net of the effect of foreign currency translation and acquisitions 191.4 (48.5) Current portion of income tax provision 98.1 36.3 Interest expense, net, excluding amortization of deferred financing costs and unrealized losses/gains on derivatives 91.8 158.6 Restructuring and other severance costs 14.5 5.0 Systems/organization establishment expenses 6.5 2.1 Acquisition and disposal costs 0.4 1.3 Bad debt provision 0.2 1.2 Other 9.1 0.4 Adjusted EBITDA - continuing operations $862.8 $634.4 Discontinued Operations - AlphaGary 0.2 33.5 Total Adjusted EBITDA $863.0 $667.9 |
|
|
Reconciliation of Net Cash to Free Cash Flow 2011 ($M) Fourth Quarter Full Year Net cash provided by operating activities - continuing operations $86.4 $450.8 Capital expenditures (104.3) (295.7) Government grants received 6.2 16.0 Restructuring charges 4.9 10.5 Interest rate swap temination payment - 14.3 Excess tax benefits from stock-based payment arrangements 1.7 4.0 Other (a) 4.2 7.3 Free Cash Flow $(0.9) $207.2 (a) Represents the cash impact of adjustments made to EBITDA under the senior secured credit agreement. |