Attached files
| file | filename |
|---|---|
| 8-K - 8-K - MESA LABORATORIES INC /CO/ | a12-5393_18k.htm |
Exhibit 99.1
|
|
Mesa Laboratories, Inc. “MLAB” John Sullivan, President and CEO Steve Peterson, VP Finance and CFO |
|
|
Safe Harbor Statement Certain statements in this communication may be “forward-looking” statements within the meaning of Section 27A of the Securities Act of 1933, as amended, and Section 21E of the Securities Exchange Act of 1934, as amended. Statements regarding future prospects and developments are based upon current expectations and involve certain risks and uncertainties that could cause actual results and developments to differ materially from the forward-looking statement, including those detailed in the company's filings with the Securities and Exchange Commission. |
|
|
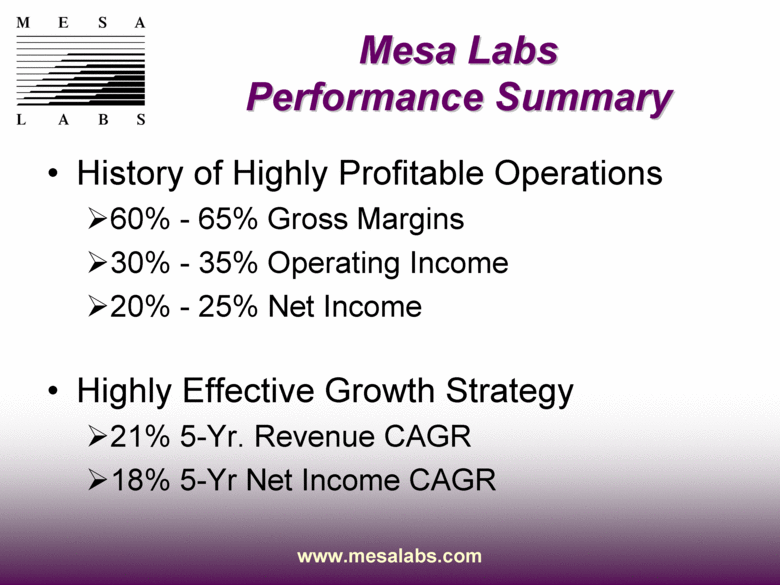
Mesa Labs Performance Summary History of Highly Profitable Operations 60% - 65% Gross Margins 30% - 35% Operating Income 20% - 25% Net Income Highly Effective Growth Strategy 21% 5-Yr. Revenue CAGR 18% 5-Yr Net Income CAGR |
|
|
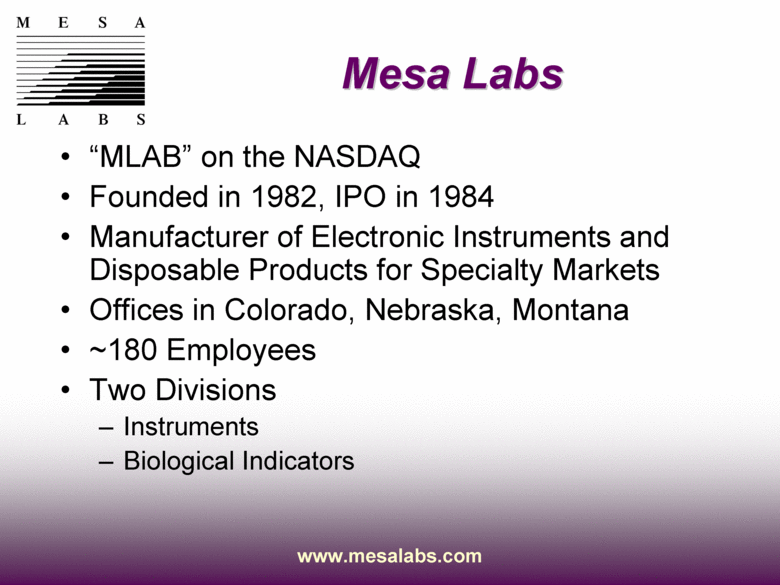
Mesa Labs “MLAB” on the NASDAQ Founded in 1982, IPO in 1984 Manufacturer of Electronic Instruments and Disposable Products for Specialty Markets Offices in Colorado, Nebraska, Montana ~180 Employees Two Divisions Instruments Biological Indicators |
|
|
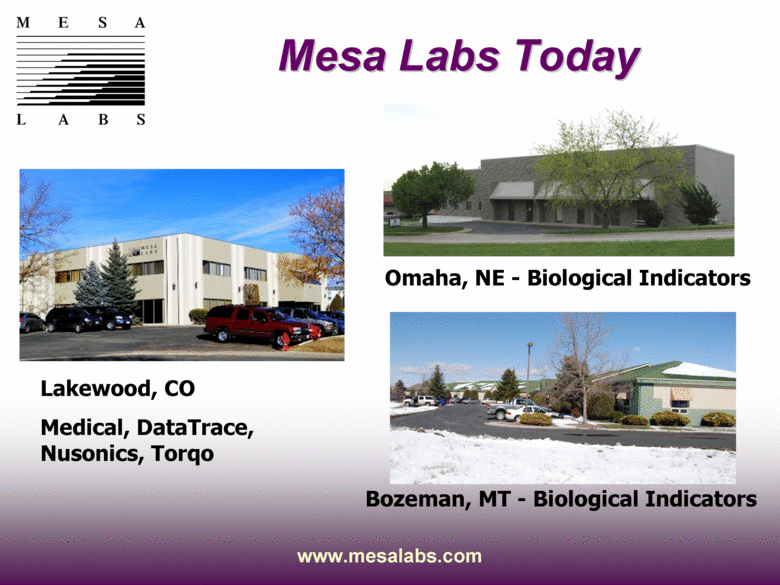
Mesa Labs Today Lakewood, CO Medical, DataTrace, Nusonics, Torqo Omaha, NE - Biological Indicators Bozeman, MT - Biological Indicators |
|
|
Mesa’s Products Focus on Products for Quality Control Regulated Industries and Applications High Value, High Technology Limited Competition Niche Markets and Applications |
|
|
Mesa’s Markets Instruments Quality Control Dialysis Clinics Food and Beverage Pharma MFG Medical Device MFG Biological Indicators Sterility Quality Control Dental Offices Hospitals Pharma MFG Medical Device MFG Biotechnology |
|
|
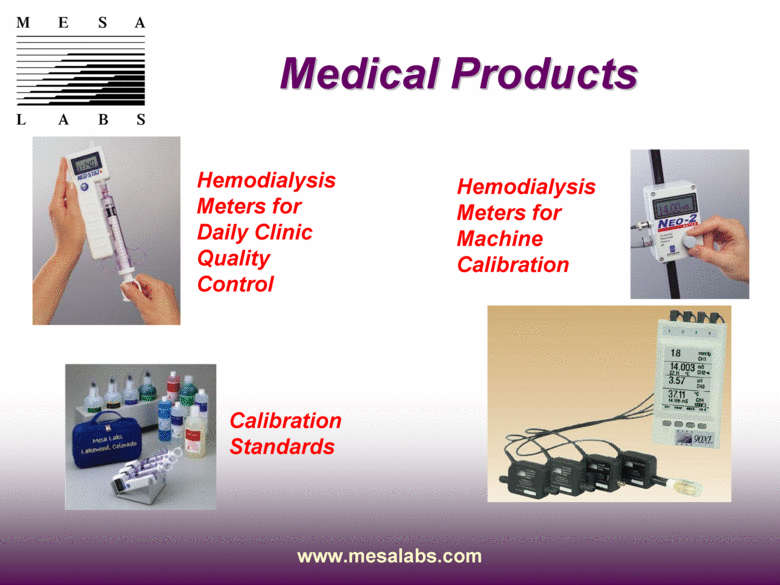
Medical Products Hemodialysis Meters for Machine Calibration Calibration Standards Hemodialysis Meters for Daily Clinic Quality Control |
|
|
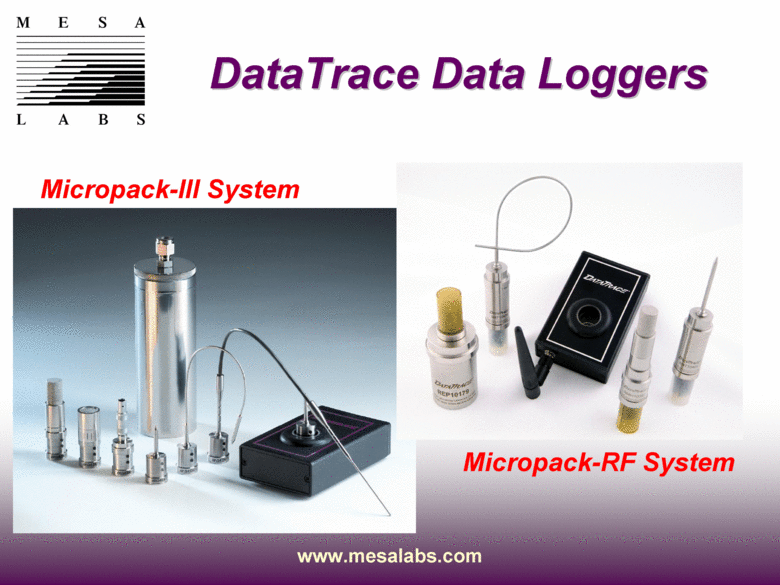
DataTrace Data Loggers Micropack-III System Micropack-RF System |
|
|
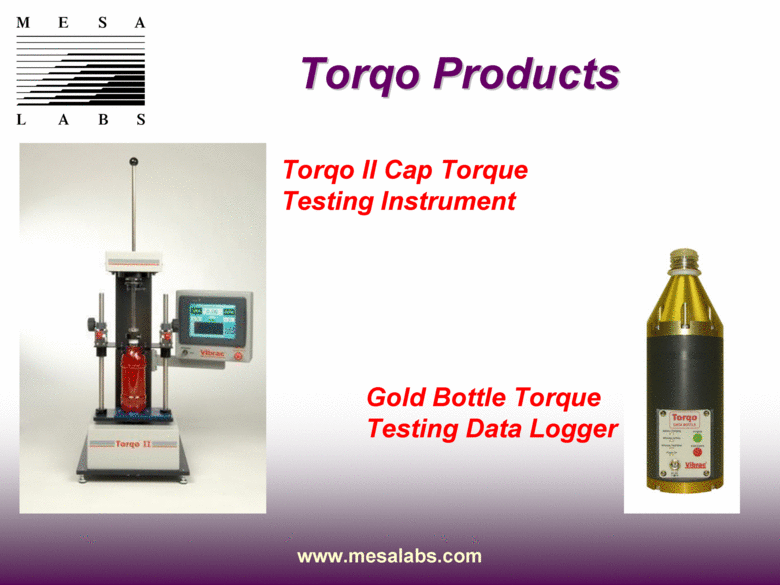
Torqo Products Torqo II Cap Torque Testing Instrument Gold Bottle Torque Testing Data Logger |
|
|
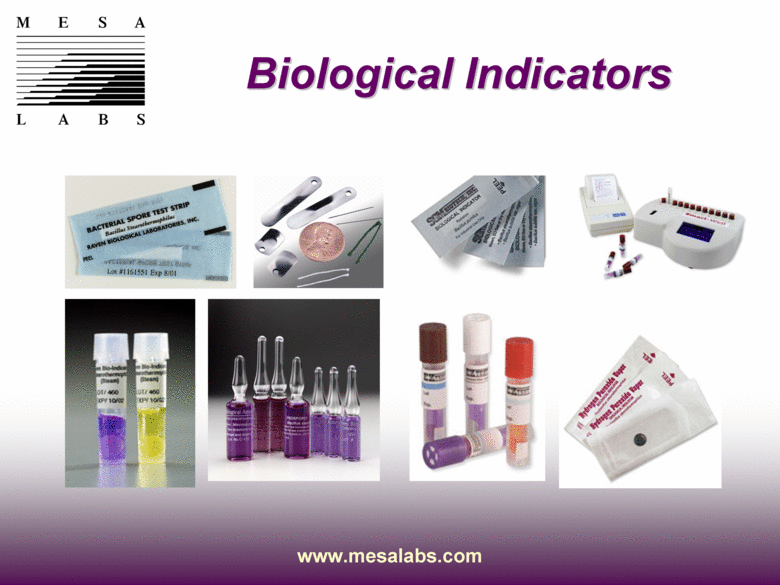
Biological Indicators |
|
|
Financial Information |

|
|
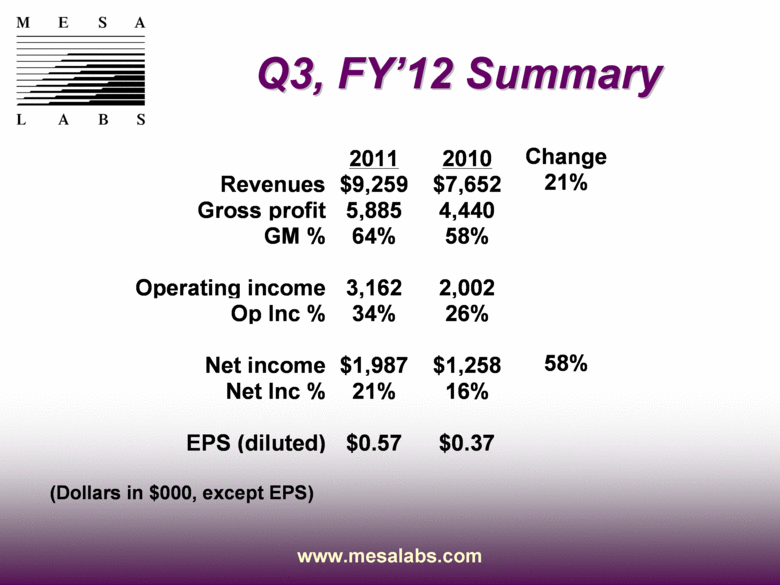
Q3, FY’12 Summary 2011 2010 Change Revenues $9,259 $7,652 21% Gross profit 5,885 4,440 GM % 64% 58% Operating income 3,162 2,002 Op Inc % 34% 26% Net income $1,987 $1,258 58% Net Inc % 21% 16% EPS (diluted) $0.57 $0.37 (Dollars in $000, except EPS) |
|
|
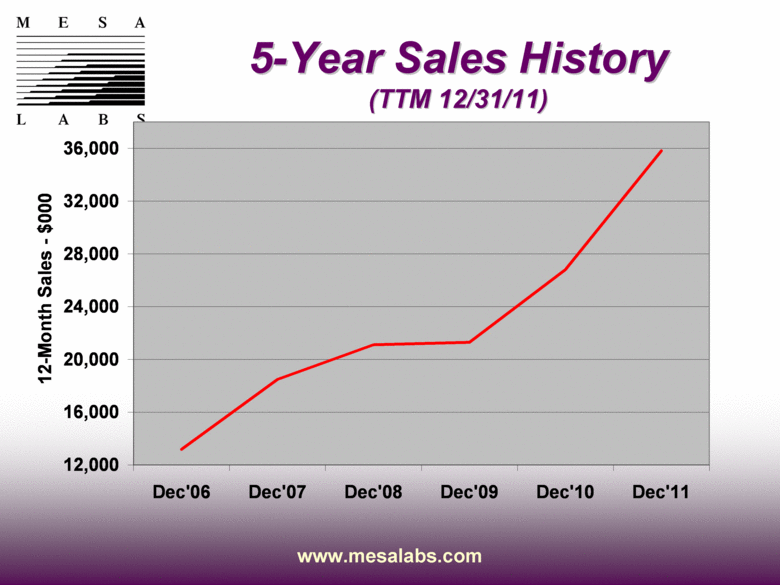
5-Year Sales History (TTM 12/31/11) 21% CAGR 12,000 16,000 20,000 24,000 28,000 32,000 36,000 Dec'06 Dec'07 Dec'08 Dec'09 Dec'10 Dec'11 12-Month Sales - $000 |
|
|
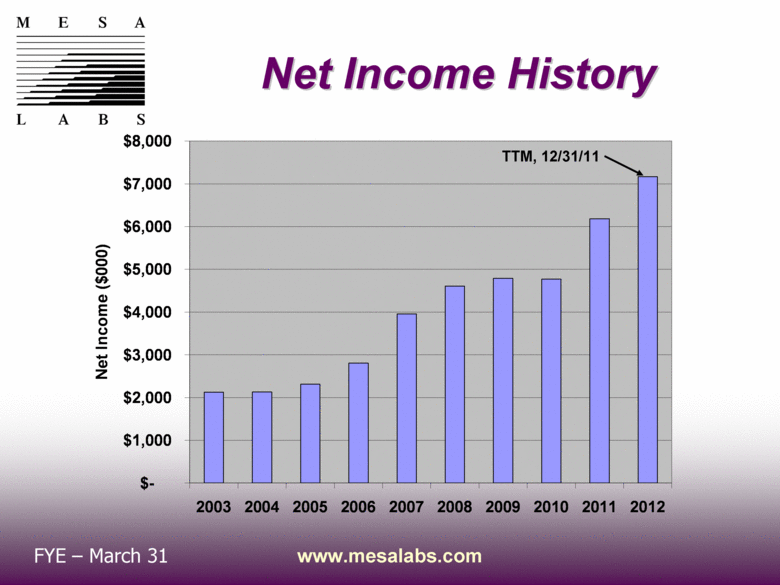
Net Income History FYE – March 31 TTM, 12/31/11 $- $1,000 $2,000 $3,000 $4,000 $5,000 $6,000 $7,000 $8,000 2003 2004 2005 2006 2007 2008 2009 2010 2011 2012 Net Income ($000) |
|
|
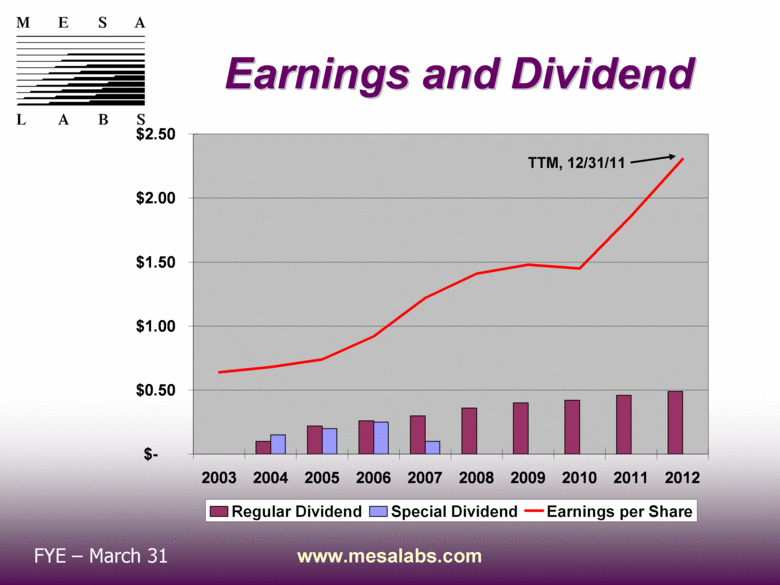
Earnings and Dividend FYE – March 31 TTM, 12/31/11 $- $0.50 $1.00 $1.50 $2.00 $2.50 2003 2004 2005 2006 2007 2008 2009 2010 2011 2012 Regular Dividend Special Dividend Earnings per Share |
|
|
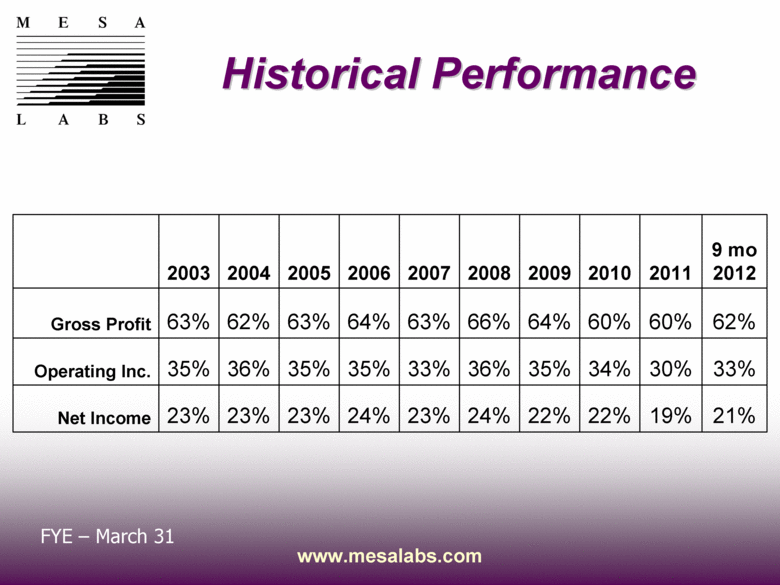
Historical Performance FYE – March 31 23% 35% 63% 2003 23% 36% 62% 2004 23% 35% 63% 2005 24% 35% 64% 2006 23% 33% 63% 2007 21% 19% 22% 22% 24% Net Income 33% 30% 34% 35% 36% Operating Inc. 62% 60% 60% 64% 66% Gross Profit 9 mo 2012 2011 2010 2009 2008 |
|
|
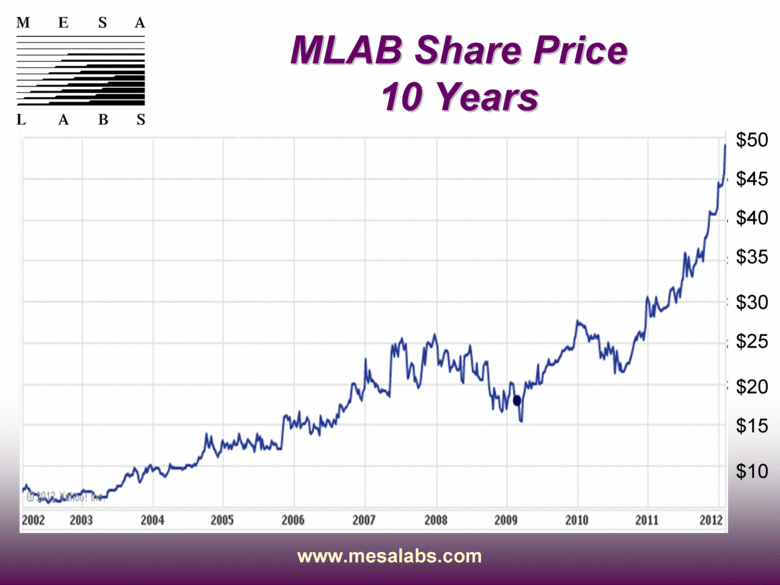
MLAB Share Price 10 Years $10 $15 $20 $25 $30 $35 $40 $45 $50 |
|
|
Going Forward |

|
|
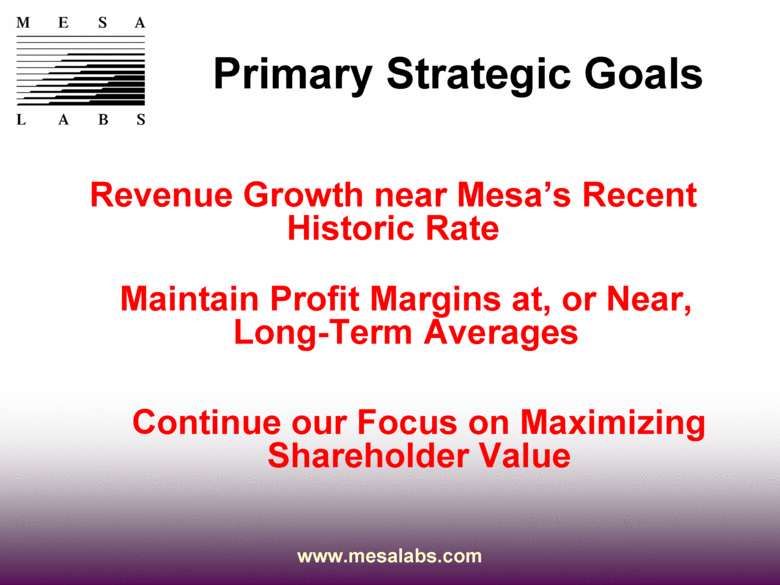
Primary Strategic Goals Revenue Growth near Mesa’s Recent Historic Rate Maintain Profit Margins at, or Near, Long-Term Averages Continue our Focus on Maximizing Shareholder Value |
|
|
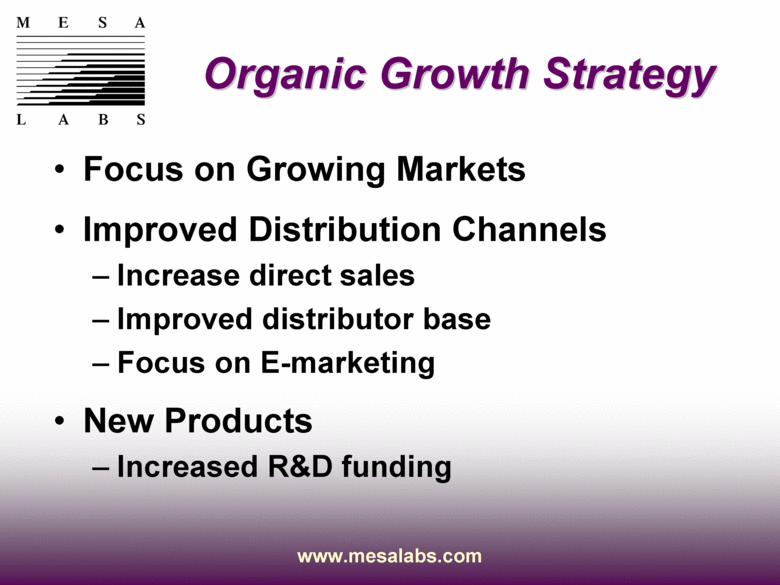
Organic Growth Strategy Focus on Growing Markets Improved Distribution Channels Increase direct sales Improved distributor base Focus on E-marketing New Products Increased R&D funding |
|
|
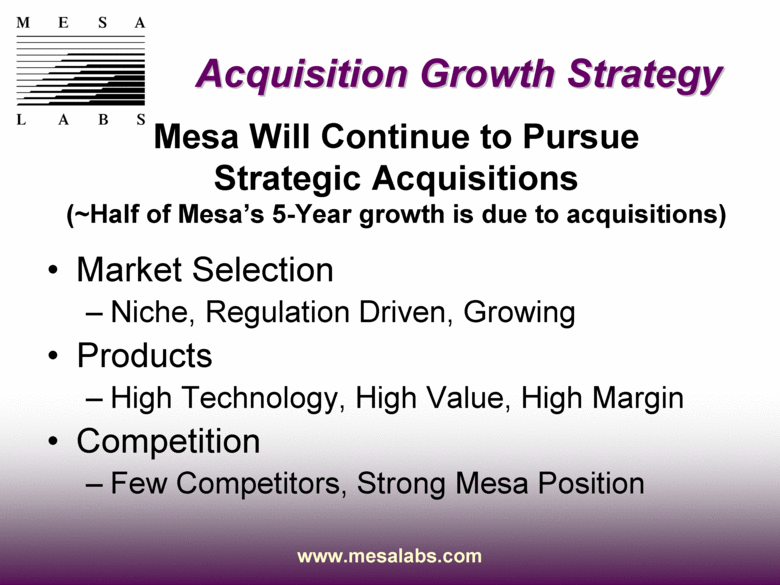
Acquisition Growth Strategy Market Selection Niche, Regulation Driven, Growing Products High Technology, High Value, High Margin Competition Few Competitors, Strong Mesa Position Mesa Will Continue to Pursue Strategic Acquisitions (~Half of Mesa’s 5-Year growth is due to acquisitions) |
|
|
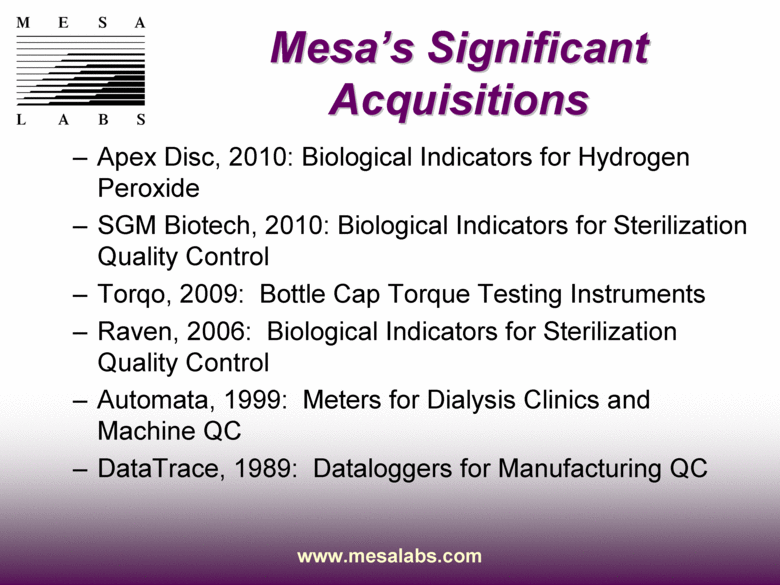
Mesa’s Significant Acquisitions Apex Disc, 2010: Biological Indicators for Hydrogen Peroxide SGM Biotech, 2010: Biological Indicators for Sterilization Quality Control Torqo, 2009: Bottle Cap Torque Testing Instruments Raven, 2006: Biological Indicators for Sterilization Quality Control Automata, 1999: Meters for Dialysis Clinics and Machine QC DataTrace, 1989: Dataloggers for Manufacturing QC |
|
|
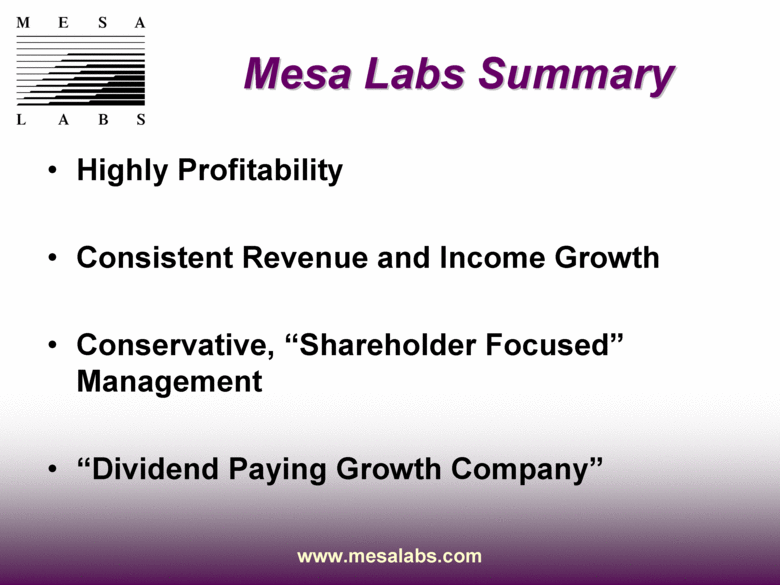
Mesa Labs Summary Highly Profitability Consistent Revenue and Income Growth Conservative, “Shareholder Focused” Management “Dividend Paying Growth Company” |
|
|
Thank You! John Sullivan jsullivan@mesalabs.com Steve Peterson steve@mesalabs.com NASDAQ: MLAB Phone 303-987-8000 |