Attached files
| file | filename |
|---|---|
| 8-K - FORM 8-K - STERLING FINANCIAL CORP /WA/ | d303108d8k.htm |
 Management Update
For the Year Ended December 31, 2011
Ticker: STSA
Spokane, Washington
www.sterlingfinancialcorporation-spokane.com
February 17, 2012
Exhibit 99.1 |
 Safe Harbor
(1) The Reform Act defines the term "forward-looking statements"
to include: statements of management plans and objectives, statements regarding the future economic performance, and projections of revenues and
other financial data, among others. The Reform Act precludes liability for
oral or written forward-looking statements if the statement is identified as such and accompanied by "meaningful cautionary statements
identifying important factors that could cause actual results to
differ materially from those made in the forward-looking
statements." 2
In the course of our presentation, we may discuss matters that are
deemed to be forward-looking statements, which are intended to be
covered by the safe harbor for “forward-looking statements”
provided by the Private Securities Litigation Reform Act of 1995 (the
“Reform Act”) (1)
.
Forward-looking statements involve substantial risks and uncertainties,
many of which are difficult to predict and are generally beyond our
control. Actual results may differ materially and adversely from
projected results. We assume no obligation to update any
forward-looking statements (including any projections) to reflect
any changes or events occurring after the date hereof. Additional
information about risks of achieving results suggested by any
forward-looking statements may be found in Sterling’s
10-K, 10-Q and other SEC filings, including under the
headings “Risk Factors” and “Management’s Discussion and
Analysis of Financial Condition and Results of Operations.” |
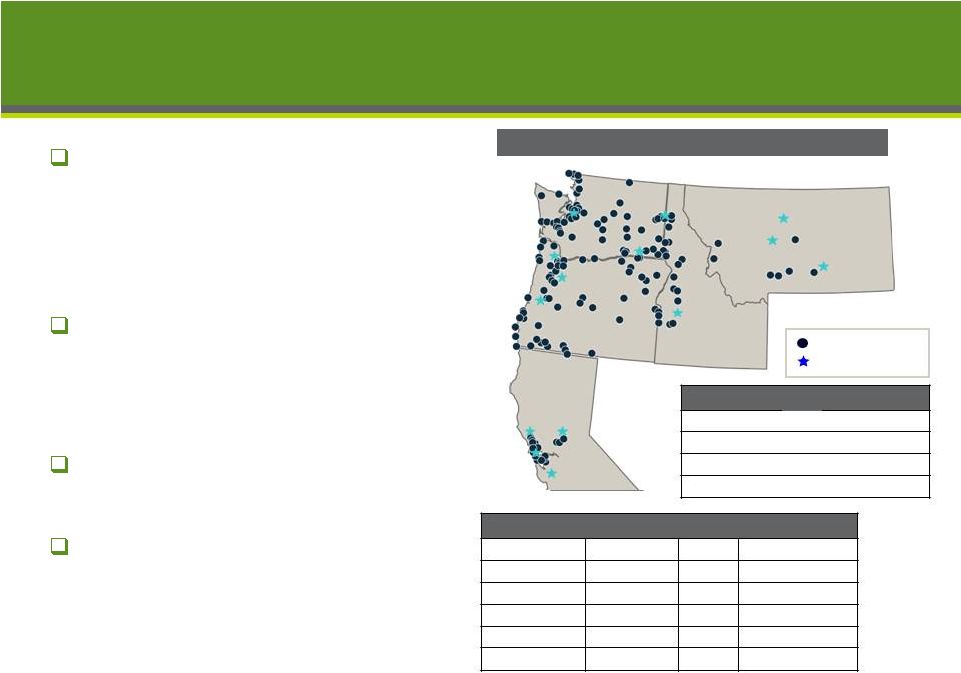 Franchise at a Glance
3
Based in Spokane, Wash.,
Sterling is one of the largest
commercial banks
headquartered in the Pacific
Northwest
(1)
More than 45,000
commercial transaction
accounts and 255,000 retail
transaction accounts
$6.5 billion of deposits with
an average cost of 0.80%
(2)
$730 million recapitalization
completed in August 2010
175 branches in 5 states
Source: SNL Financial, Company filings
Note: Financial data as of December 31, 2011.
MONTANA
IDAHO
OREGON
WASHINGTON
San Jose
San
Francisco
Sacramento
Santa
Rosa
Eugene
Salem
Portland
Seattle
Spokane
Great Falls
Helena
Billings
Boise
Major cities
Sterling branches
Key Statistics as of 12/31/2011
(billions)
Total assets:
$9.2
Total deposits
$6.5
Net loans
$5.3
Deposit Market Share
(3)
State
Branches
Rank
Market Share
Washington
71
8
2.93%
Oregon
67
7
3.16%
California
13
54
0.11%
Idaho
18
11
2.55%
Montana
7
16
1.09%
(1)
Pacific Northwest defined as Idaho, Oregon and Washington.
(2)
For the quarter ended December 31, 2011.
(3)
Deposit market share data as of June 30, 2011. |
 Q4 2011 Performance Highlights
Improving quarterly results
Reported Q4 net income of $14.8 million
Four consecutive quarters of earnings growth
Net interest margin (FTE) of 3.26%, up 46 bps from Q4 2010
Average cost of deposits declined by 33 bps from Q4 2010
Reduced credit provisioning
Provision for Q4 credit losses of $4.0 million
Compares to $30.0 million provision for Q4 2010
Declining levels of non-performing assets (NPAs)
NPAs of $369.1 million at 12/31/11, reflecting a 55% decline
compared to $816.3 million of NPAs at 12/31/10
Focus on liquidating OREO, note sales, short sales and other workouts
Robust loan originations
Portfolio originations (excluding HFS) were $332.0 million, up 84%
over Q4 2010
4 |
 Formula
for
Success
–
“Back
to
Basics”
Banking
Focus on customers
Delivering value proposition to customers
o
Fair pricing
o
Competitive products and services
Resolving credit challenges
Improving credit metrics throughout the loan portfolio
Reducing non-performing loans and OREO
Strategic expansion in key markets and lines of business
Increased emphasis on sales and business development
Intelligent market segmentation
Expense control and emphasis on organizational efficiency
Managing through emerging regulatory changes
Cost-
effective
Funding
Improved
Asset
Quality
High Quality,
Relationship
Based Asset
Generation
Expense
Control
Profitable
Growth
5 |
 Rank
Institution
Deposits
Deposit
Market
Share
1
Bank of America
$8,552
23.2
%
2
U.S. Bancorp
7,589
20.6
3
Wells Fargo
6,241
16.9
4
JPMorgan Chase
3,105
8.4
5
KeyCorp
2,488
6.7
6
Umpqua
1,617
4.4
PF 7
Sterling Pro Forma
1,102
3.0
7
BNP Paribas / BancWest
912
2.5
8
West Coast Bancorp
842
2.3
9
First Independent Bank
695
1.9
10
Riverview Bancorp
619
1.7
11
Washington Federal
441
1.2
12
Sterling
407
1.1
13
HomeStreet
300
0.8
14
First Federal S&LA of McMinnville
285
0.8
15
Banner
266
0.7
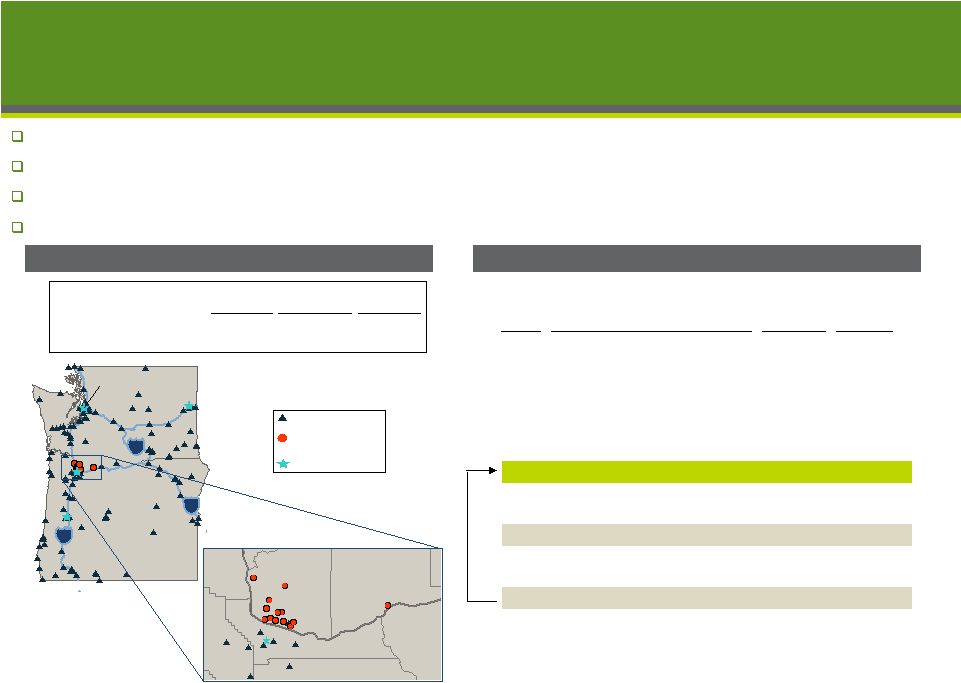
Recently Announced Acquisition of
First Independent Bank
6
Improves Sterling’s deposit market share in the Portland-Vancouver
MSA to #7 from #12 (largest market in Oregon) Enhances
Sterling’s
business
mix
–
addition
of
low
cost
core
deposit
base
Expands Wealth Management platform and adds Trust Services to product
offering ($452 million AUM at 12/31/11) All Regulatory approvals
received in January; Expected close February 29, 2012 6
Source: SNL Financial. Deposit market share data as of June 30, 2011.
Deposit Market Share: Portland-Vancouver MSA
Pro Forma Branch Map
Portland
Eugene
Spokane
Seattle
WA
84
90
5
OR
Washington
Columbia
Multnomah
Clackamas
Hood River
Clark
Skamania
Sterling
First Independent
Bank
Major Cities
Portland
($ in millions)
($ in millions)
Sterling
First
Independent
Sterling
Pro Forma
Branches
176
14
190
Total Deposits per Branch
$37.1
$49.6
$38.0 |
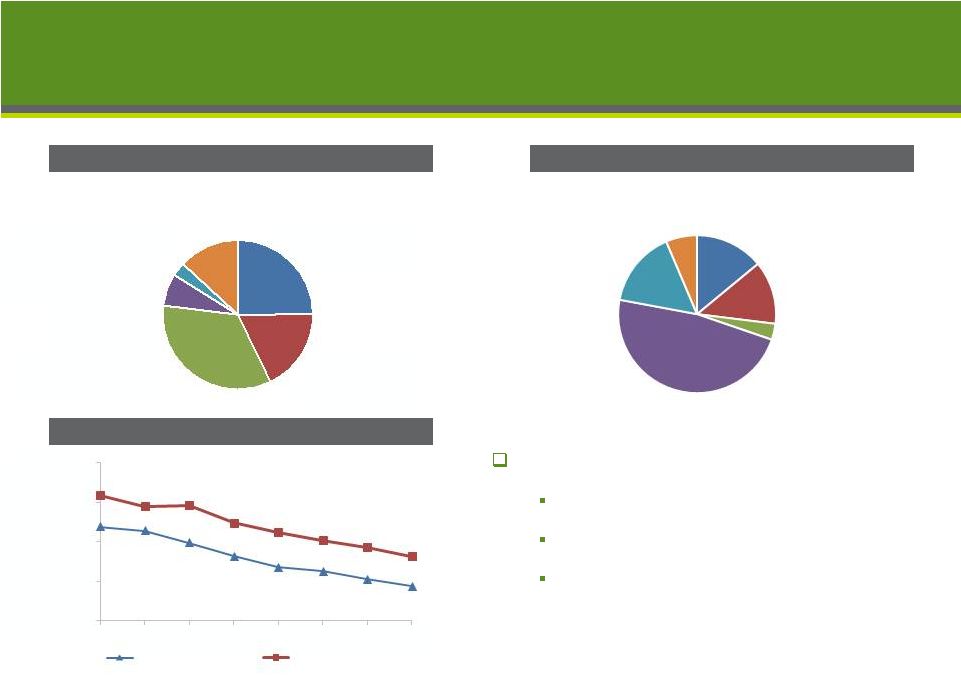 First Independent Deposit and Loan Composition
7
7
Loan Portfolio Composition
Cost of Interest-Bearing Deposits
Source: SNL Financial.
(1)
Peers defined as banks in Washington and Oregon with asset size greater than
$500 million and less than $5 billion. (1)
Deposit Composition
Balance of $680mm as of Dec. 31, 2011
Gross Balance of $453mm as of Dec. 31, 2011
Seller retaining $49mm of loans
Impaired and other loans
Overlapping and related credit exposure
Estimated gross credit mark of 9.5% or
$40mm on remaining $425mm of gross loans
o
Net credit mark of 6.1%, or $26mm
0.95%
0.91%
0.79%
0.65%
0.54%
0.50%
0.42%
0.35%
1.27%
1.16%
1.17%
0.99%
0.89%
0.81%
0.74%
0.65%
0.00%
0.40%
0.80%
1.20%
1.60%
Q1'10
Q2'10
Q3'10
Q4'10
Q1'11
Q2'11
Q3'11
Q4'11
First Independent
Peer Median
IRA
Accounts
3%
CD
Accounts
13%
Non-
Interest
Bearing DDA
25%
Savings
Accounts
7%
Money
Market
Demand
Accounts
34%
Interest
Bearing DDA
18%
C&D
14%
1-4 Family
13%
Multifamily
3%
CRE
48%
C&I
16%
Consumer &
Other
6% |
 Improving Trends Summary (Q4 2011 vs. Q4 2010)
8
Increased margins and improved expense management
Net interest margin
Funding costs
Non-interest expense
46
bps
32 bps
20%
61%
55%
Provision for loan losses
Non-performing assets
Classified assets
87%
Improved asset quality and reduced credit provisioning
|
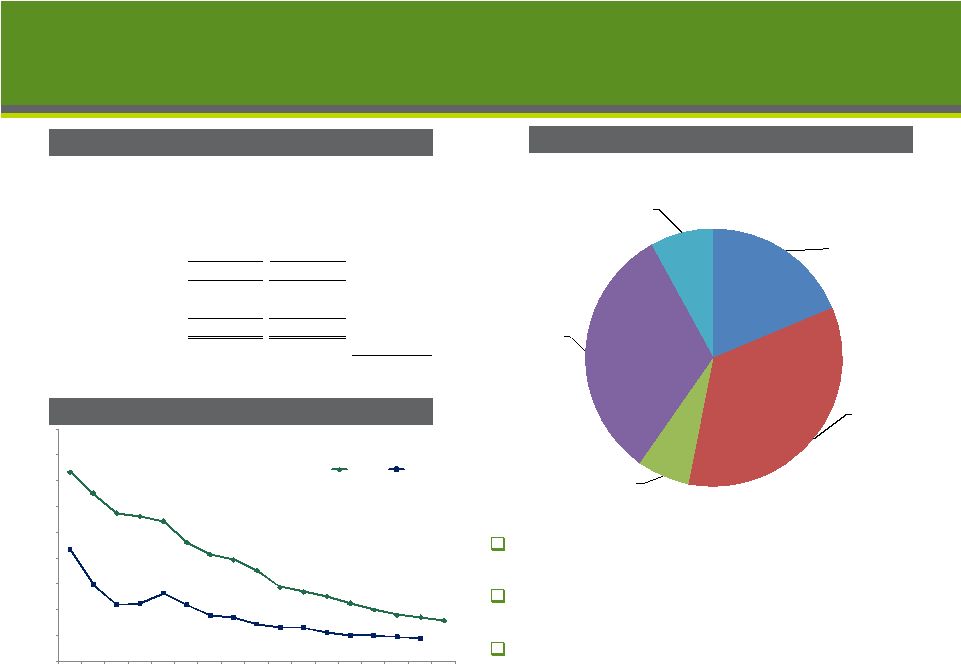 Deposit Composition
Source: SNL Financial and company filings.
Peers include: BANR, CATY, CYN, CVBF, GBCI, PACW, SIVB, UMPQ, and WABC.
Figures based on median of peers. Overall improvement in deposit mix
leading to lower cost of deposits
Decreased brokered deposits by
$651mm since year end 2009, to $429mm
$1.2 billion of CDs re-pricing during 2012
with a current average rate of 1.31%
Deposit composition
Deposit balances
Reducing
avg.
cost
of
deposits
(%)
(1)
9
Non-interest
bearing transaction:
$1,212 / 19%
Time deposits-retail
& public:
$2,232 / 34%
Time deposits-
brokered:
$429 / 7%
Savings and money
market demand:
$2,092 / 32%
Interest-bearing
transaction:
$521 / 8%
Balance of $6,486 million as of December 31, 2011
(in millions)
(in millions)
12/31/2010
12/31/2011
Annual
% change
Retail deposits:
Transaction
$1,490
$1,733
16%
Savings and MMDA
1,567
1,902
21%
Time deposits
2,809
1,993
-29%
Total retail
5,866
5,628
-4%
Public:
796
429
-46%
Brokered:
249
429
72%
Total deposits
$6,911
$6,486
-6%
BPs Change
Depost funding costs
1.13%
0.80%
-33
Gross loans to deposit
81%
85%
3.68%
3.26%
2.88%
2.82%
2.72%
2.31%
2.08%
1.98%
1.77%
1.45%
1.36%
1.27%
1.13%
1.01%
0.91%
0.86%
0.80%
2.18%
1.50%
1.10%
1.13%
1.33%
1.10%
0.90%
0.85%
0.73%
0.67%
0.66%
0.56%
0.50%
0.51%
0.48%
0.45%
0.00%
0.50%
1.00%
1.50%
2.00%
2.50%
3.00%
3.50%
4.00%
4.50%
Q4
07
Q1
08
Q2
08
Q3
08
Q4
08
Q1
09
Q2
09
Q3
09
Q4
09
Q1
10
Q2
10
Q3
10
Q4
10
Q1
11
Q2
11
Q3
11
Q4
11
4Q 2011 Y-o-Y Improvement (33 bps)
STSA
Peer
(1) |
 10
$-
$200
$400
$600
$800
$1,000
$1,200
$1,400
$1,600
$1,800
Q1 08
Q2 08
Q3 08
Q4 08
Q1 09
Q2 09
Q3 09
Q4 09
Q1 10
Q2 10
Q3 10
Q4 10
Q1 11
Q2 11
Q3 11
Q4 11
Classified Assets
Non
-perfoming Assets
Non
-performing Loans
$426
12/31/09: $1,648
Improving Trend in Classified & Non-Performing Assets |
 (in millions)
12/31/2010
3/31/2011
6/30/2011
9/30/2011
12/31/2011
NPLs beginning-of-period
$809.0
$654.6
$477.1
$396.1
$323.1
Additions/increases
62.5
47.0
65.1
66.6
33.0
Return to accruing status
(11.1)
(77.3)
(13.7)
(6.8)
-
Charge-offs
(31.4)
(24.1)
(33.4)
(29.9)
(10.7)
Transfer to OREO
(58.6)
(67.3)
(33.5)
(58.7)
(18.5)
Payments/sales
(115.8)
(55.8)
(65.5)
(44.2)
(39.7)
NPLs end of period
$654.6
$477.1
$396.1
$323.1
$287.2
NPLs/Loans
11.6%
8.6%
7.1%
5.8%
5.2%
% decline ($) since Q4 2010:
56%
For the quarter ended
Non-performing Loan (NPL) Flow Analysis
11 |
 OREO Flow Analysis
12
(dollars in millions)
Amount
Properties
Amount
Properties
OREO:
Beginning balance
$83
203
$162
439
Additions
265
821
178
463
Valuation adjustments
(37)
-
(22)
-
Sales
(155)
(584)
(241)
(758)
Other changes
6
(1)
5
(1)
Ending balance
$162
439
$82
143
2010
2011
For the year ended December 31, |
 Washington:
$2,073 / 37%
Oregon:
$1,254 / 23%
N. California:
$1,148 / 21%
Idaho:
$318 / 6%
S. California:
$340 / 6%
Arizona: $191 / 3%
Montana:
$101 / 2%
Other: $95 / 2%
Outstanding balance of $5.5 billion as of Dec. 31, 2011
(2)
(in millions)
Loan Portfolio Summary
Reducing Construction Loan Exposure and Focusing on Relationship-Based
Lending Gross loans were $5.5 billion at December 31, 2011
2011
portfolio
loan
originations
increased
by
$897
million,
or
189%
over
2010
(1)
Source: Company filings.
(1)
Excluding residential mortgage loans held for sale.
(2)
Net of $124.1 million in FAS 114 writedowns.
Loan mix by geography
Loan mix by category
13
Residential RE:
$688 / 13%
Multi-family RE:
$1,001 / 18%
CRE, NOO:
$1,276 / 23%
CRE, OO:
$1,272 / 23%
C&I: $432 / 8%
Construction:
$175 / 3%
Consumer:
$675 / 12%
Outstanding balance of $5.5 billion as of Dec. 31, 2011
(2)
(in millions) |
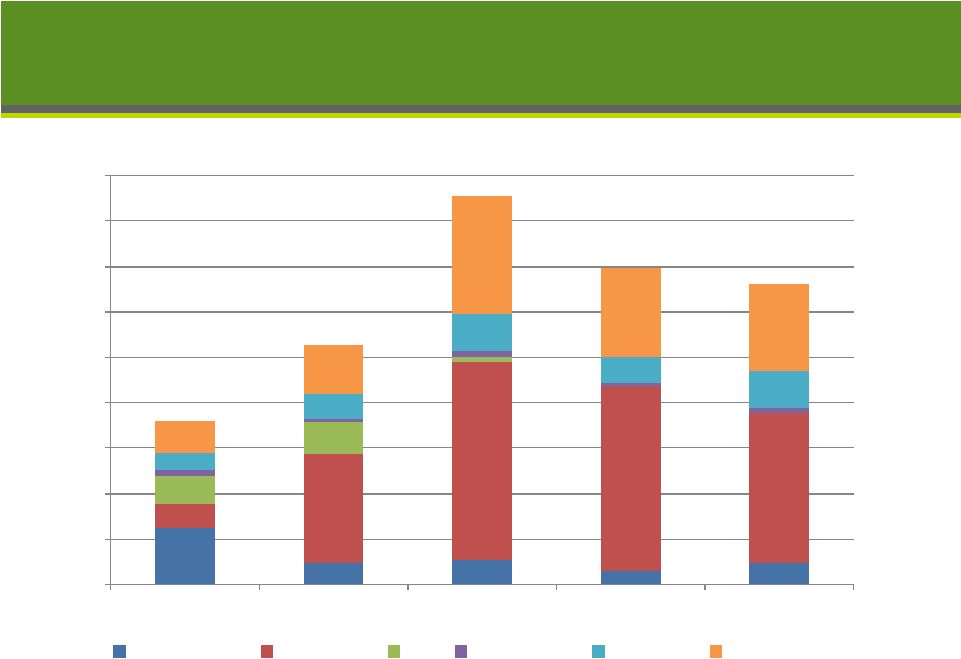 0
50
100
150
200
250
300
350
400
450
Q4 10
Q1 11
Q2 11
Q3 11
Q4 11
Residential RE
Multifamily
CRE
Construction
Consumer
Commercial
Loan
Portfolio
New
Originations
by
Quarter
(1)
($ in millions)
14
$265
$180
$332
$348
$426
Source: Company filings.
(1)
Excluding residential mortgage loans held for sale.
|
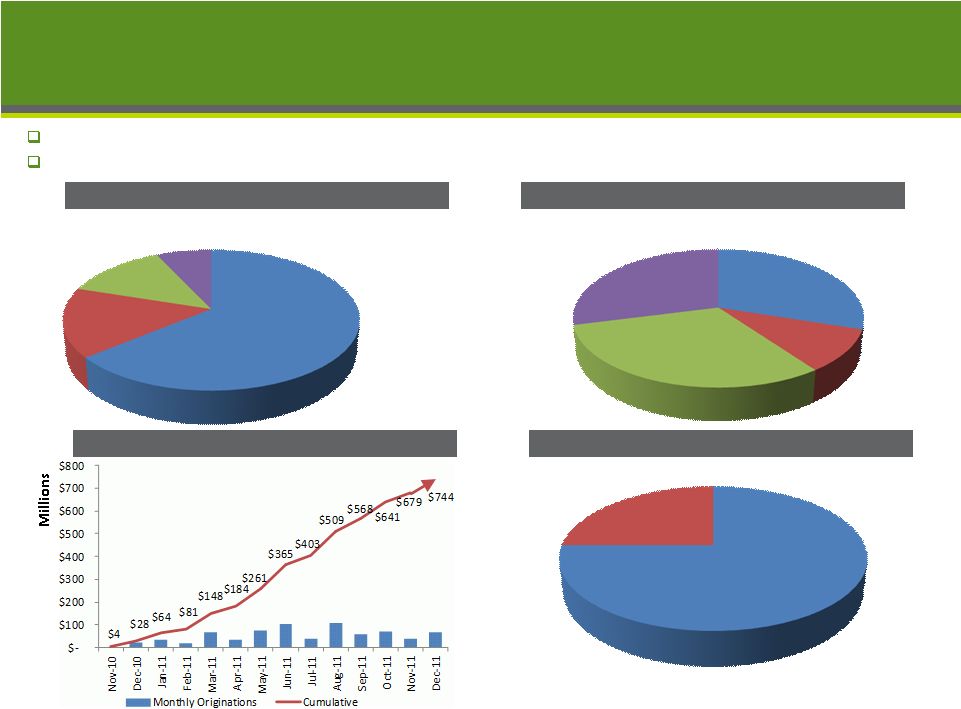 WA
30%
OR
10%
N Cal
31%
S Cal
29%
5 Yr Fixed
Hybrid
ARM
64%
3 Yr Fxd
H-ARM
19%
7 Yr Fxd
H-ARM
6%
Other
7%
Refi
75%
Purchase
25%
15
MF loan programs
MF geography
MF loan purpose
MF originations since program inception
Wtd Avg LTV: 67.0%; Wtd Avg DSC: 1.31:1; Wtd Avg Yield: 4.7%
$49 million sale completed in Q4 2011 for net gain of $1.3 million; expect
additional sales in 2012 Multifamily – Program to Date as of Q4
2011 |
 Sterling Rebranding
16
Sterling Savings Bank to be rebranded to Sterling Bank
Initial launch in Q1 2012
First significant branding initiative since bank was founded over 30 years
ago Completes process of evolving from thrift roots to a
full-service commercial bank initiated in 2005 with charter
conversion CA will continue to operate as Sonoma Bank due to trademark
restrictions New website launch March 2012:
www.bankwithsterling.com Signage will be replaced over a two year
period with initial roll out in Spokane, Portland, Vancouver and
Seattle Expected financial impact of $3.5 million for 2012
At Sterling Bank, we improve lives and strengthen
communities. We are a bridge to the possible.
www.bankwithsterling.com |
 Expense Control and Operating Efficiency Drivers
17
Comprehensive staff review completed which identified $15 million
in annualized staff savings
Substantially all staffing reductions will be achieved during Q1
‘12, with full year
2012 compensation impact of $12 million excluding severance
Reductions represent approximately 6% of FTEs and 8% of related compensation
expense (relative to 2011)
Severance related charge of approximately $3 million to be recognized in Q1
‘12 OREO Expense –
Expected decline with lower levels of OREO
Q4 2011 OREO Expense was only 12% of full year amount
Working to improve efficiency and effectiveness of operations
Additional reductions in FDIC insurance
Ongoing vendor assessment and procurement strategies
Review of branches and facilities
Management target: Efficiency ratio less than 60% by 2013
“Given the challenging interest rate environment and the uncertain
economic outlook, Sterling must position itself for continued
success, including lowering its operating expenses. Sterling has fewer assets today than it did just a few years
ago and, although this has been a difficult decision, the bank needs to
appropriately reflect that reality.”
-Greg Seibly, CEO
|
 Summary
Executing on our strategic plan
Valuable, core-deposit franchise drives earnings power
Continued improvement in asset quality metrics
High-quality, relationship-driven asset generation
Ongoing expense management
Emphasizing increased earnings power
Focused on increasing pre-tax, pre-provision earnings
Fully
Reserved
Net
Deferred
Tax
Asset
of
$327
million
($5.27
per
share)
as of 12/31/11
Expect a portion of the DTA reserve may be released during the first half
of 2012 if performance trends continue
Regardless of reserve release amount, effective tax rate of 0% expected for
2012 Amount
of
DTA
that
can
be
included
in
regulatory
capital
will
be
subject
to
limitations
Capitalization
Significantly
exceeds
regulatory
levels
required
for
“well-capitalized”
status
Additional capital in place to support opportunistic growth
Will evaluate other capital management alternatives, including cash
dividends, with expected release of regulatory restrictions
Capital ratios have improved since recapitalization in August 2010:
o
Tier 1 leverage ratio:
11.4%
o
Tier 1 risk-based capital ratio:
17.8%
o
Total risk-based capital ratio:
19.1%
18 |
 Ticker: STSA
Spokane, Washington
www.sterlingfinancialcorporation-spokane.com
19
Investor Contacts
Media Contact
Patrick Rusnak
Cara Coon
Chief Financial Officer
VP/Communications and Public Affairs Director
(509) 227-0961
(509) 626-5348
patrick.rusnak@sterlingsavings.com
cara.coon@sterlingsavings.com
Daniel Byrne
EVP/Corporate Development Director
(509) 458-3711
dan.byrne@sterlingsavings.com |
 Appendix
20 |
 12/31/2011
Peer median
(1)
TCE/TA
9.4%
8.8%
Tier 1 leverage
11.4%
9.5%
Tier 1 risk-based capital
17.8%
13.7%
Total risk-based capital
19.1%
15.5%
NPA/Tangible Capital + ALLL
35.4%
19.3%
Capital Compared to Peers
Source: SNL Financial and company filings. Sterling Financial data as of
December 31, 2011. Peer group data as of most recent quarter available.
(1) Peers include all public U.S. banking companies with between
$7 billion and $25 billion in assets.
21 |
 Last Five Quarters Financial / Operating Highlights
22
(in millions)
12/31/2010
3/31/2011
6/30/2011
9/30/2011
12/31/2011
Asset Quality
NPAs
(1)
$816
$629
$498
$435
$369
Classified assets
$1,100
$812
$604
$500
$426
NPAs / assets
8.6%
6.7%
5.4%
4.7%
4.0%
ALLLs / NPLs
37.7%
48.8%
53.5%
57.6%
61.8%
ALLL / loans
4.4%
4.2%
3.8%
3.3%
3.2%
Net charge-offs (NCOs)
$31
$24
$33
$30
$11
NCOs / avg. loans
2.0%
1.6%
2.2%
2.0%
0.7%
Balance Sheet
Total assets
$9,493
$9,352
$9,242
$9,176
$9,193
Net loans
$5,379
$5,321
$5,388
$5,428
$5,341
Total construction loans
$526
$396
$308
$222
$175
Securities
$2,838
$2,821
$2,496
$2,448
$2,550
Core deposits
(2)
$6,662
$6,393
$6,124
$6,108
$6,057
Gross loans/total deposits
81%
83%
85%
87%
85%
Capital
$771
$774
$808
$859
$879
TCE/TA
8.0%
8.1%
8.6%
9.2%
9.4%
Tier 1 leverage
10.1%
10.6%
10.9%
11.1%
11.4%
Operating Highlights
Operating income (loss) before taxes
($38.1)
$5.4
$7.6
$11.3
$14.8
Provision for credit losses
$30.0
$10.0
$10.0
$6.0
$4.0
FTE net interest margin
2.80%
3.22%
3.31%
3.34%
3.26%
Adj. FTE net interest margin
3.43%
3.75%
3.73%
3.60%
3.53%
For the quarters ended
(3)
(1)
Net of cumulative confirmed losses on loans and OREO of $207.3 million for
Dec. 31, 2011, $299.7 million for Sept. 30, 2011, $375.7 million for June 30, 2011, $423.8 million for March 31, 2011, and
$516.3 million for Dec. 31, 2010.
(2)
Core deposits defined as total deposits less brokered CDs.
(3)
Adjusted FTE NIM includes interest reversal on non-performing
loans. |
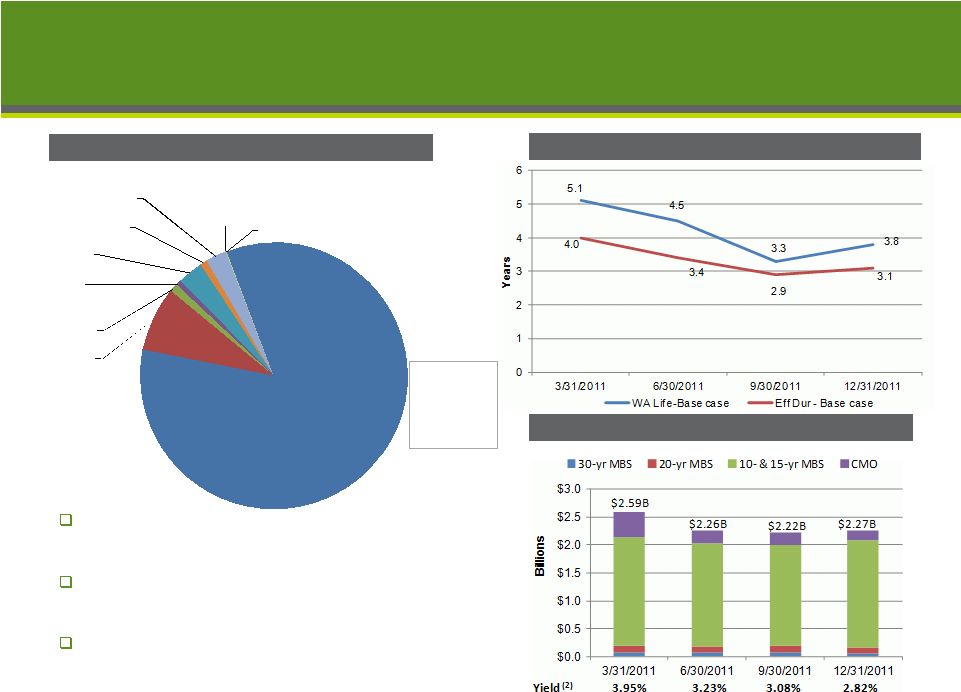 MBS:
$2,089 / 84%
Muni bonds:
$194 / 8%
Corp: $25 /1%
Non-agency:
$17 / 1%
Ginnie Mae:
$76 / 3%
Freddie Mac:
$23 / 1%
Fannie Mae:
$60 / 2%
Tax credit:
$2 / 0%
Other: $1 / 0%
$2.5 billion total portfolio
(in millions)
High Quality, Low Credit Risk Investment Portfolio
Three considerations in shaping investment
portfolio composition are safety, liquidity and
return
Strategy remains to reduce exposure to 30-yr
MBS and replace with 10-
and 15-year MBS
with good cash flows to fund loan growth
84% Agency MBS pass-throughs
Source: Company filings.
(1)
Durations and average life measures are base case, under current
market rates.
(2)
Yield at quarter end.
Investment portfolio
Weighted avg life and effective duration
MBS composition
23
2.95%
overall
portfolio
yield
(2) |
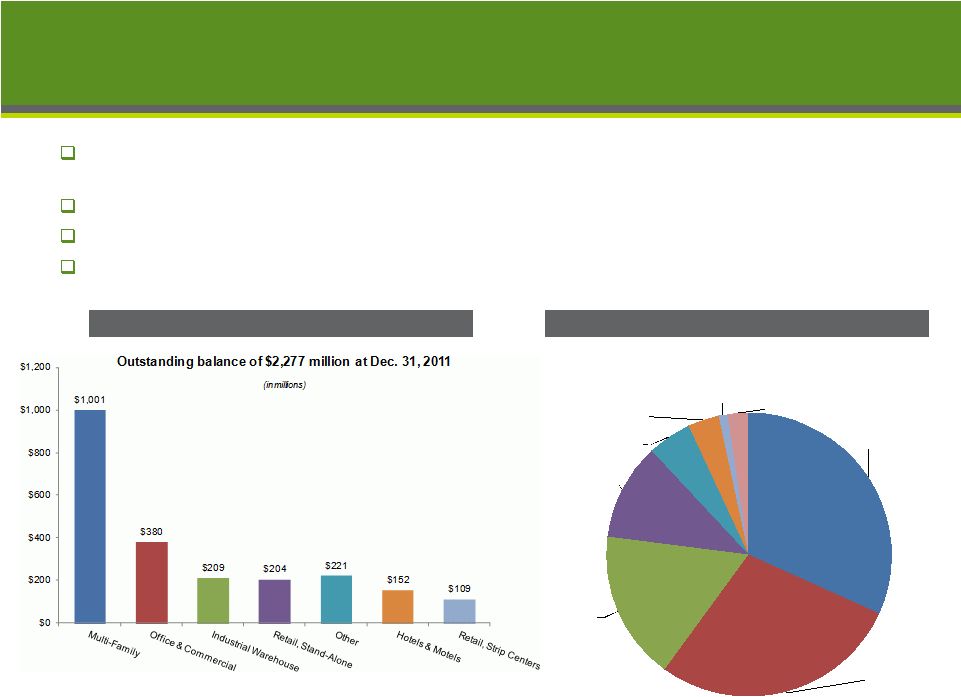 Includes Multifamily
Non-owner-occupied commercial real estate loans (including
multifamily) totaled $2.3 billion as of 12/31/2011
Increased by $445 million, or 24% since 12/31/2010
Represented 41% of gross loans as of 12/31/2011, up from 33% at
12/31/2010 3% of non-owner-occupied CRE loans were
non-performing as of 12/31/2011 Source: Company filings.
CRE NOO loan mix by geography
CRE NOO loan mix by property type
24
Washington:
$723 / 32%
N. California:
$644 / 28%
Oregon:
$387 / 17%
S. California:
$253 / 11%
Arizona: $111 / 5%
Idaho: $80 / 4%
Montana: $25 / 1%
Other: $54 / 2%
Outstanding balance of $2,277 million at Dec. 31, 2011
(in millions)
Loan Portfolio – CRE Non-Owner-Occupied |
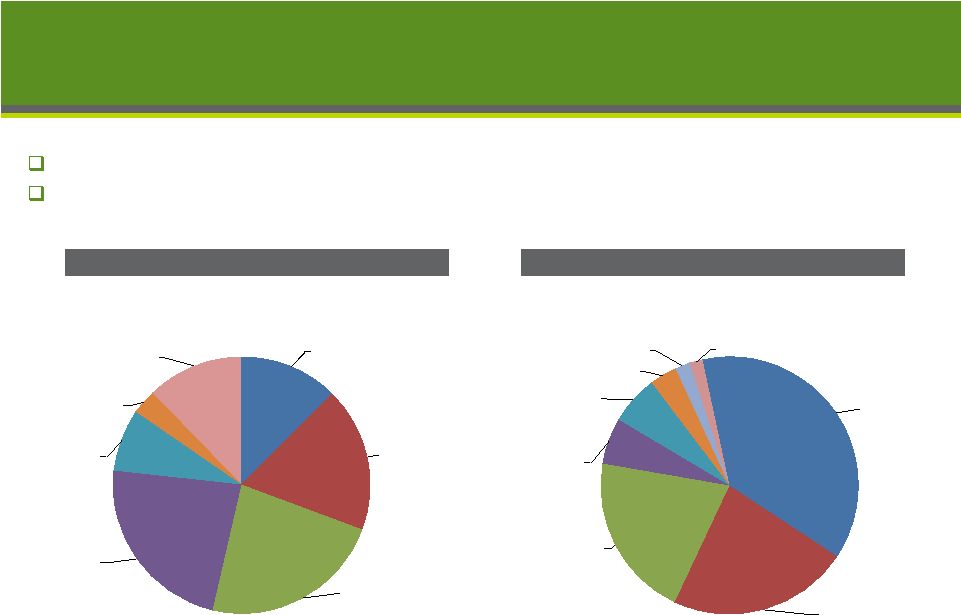
 Includes SBA
Owner-occupied commercial real estate loans totaled $1.27 billion as of
12/31/2011 Represented 23% of gross loans at 12/31/2011
6% of owner-occupied CRE loans were non-performing at
12/31/2011 SBA loans were $98 million, or 8% of total
owner-occupied CRE loans at 12/31/2011 Source: Company
filings. CRE OO loan mix by geography
CRE OO loan mix by property type
25
Washington:
$411 / 32%
N. California:
$351 / 28%
Oregon:
$306 / 24%
Idaho: $74 / 6%
Arizona: $67 / 5%
S. California:
$36 / 3%
Montana:
$14 / 1%
Other: $12 / 1%
Outstanding balance of $1,272 million at Dec. 31, 2011
(in millions)
$332
$242
$224
$134
$129
$76
$49
$49
$38
$0
$50
$100
$150
$200
$250
$300
$350
Outstanding balance of $1,272 million at Dec. 31, 2011
(in millions)
Loan Portfolio – CRE Owner-Occupied |
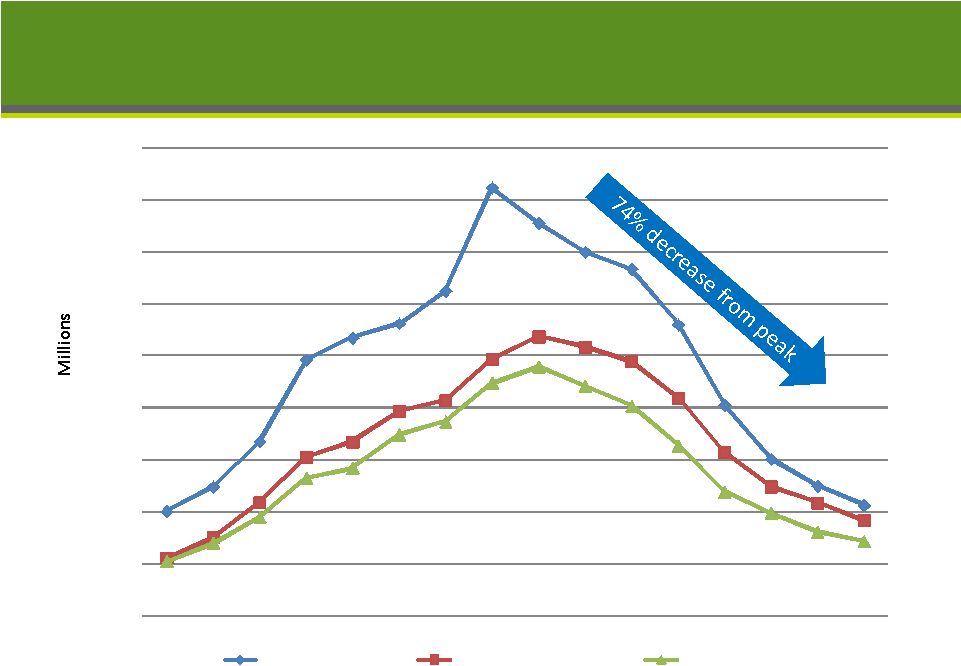
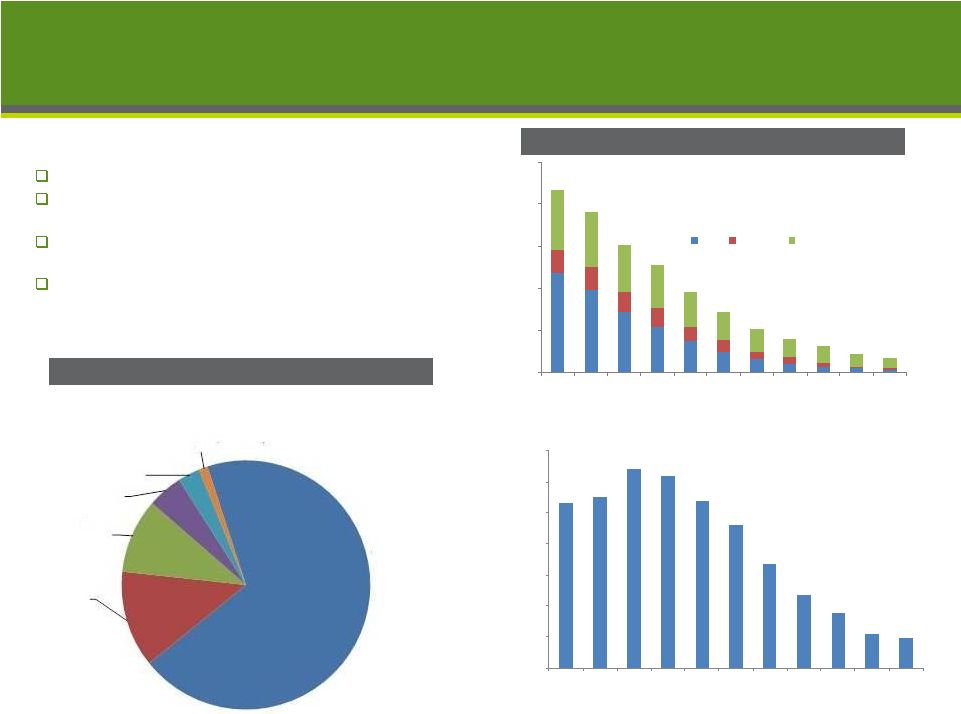 Construction Loan Reductions
Aggressively shrinking construction portfolio
Construction balances have decreased $2.8
billion, or 94% since 2007
At 12/31/2011, construction loans had declined to
3% of total loans vs. 32% at 12/31/2007 (peak)
Construction non-performing loans totaled $95
million (33% of total NPLs) as of 12/31/2011
Total construction loans
Construction loan balances
26
$-
$500
$1,000
$1,500
$2,000
$2,500
2Q09
3Q09
4Q09
1Q10
2Q10
3Q10
4Q10
1Q11
2Q11
3Q11
4Q11
(in millions)
Res
Multifam
Comm'l
$534
$552
$640
$619
$540
$459
$336
$238
$176
$109
$95
$-
$100
$200
$300
$400
$500
$600
$700
2Q09
3Q09
4Q09
1Q10
2Q10
3Q10
4Q10
1Q11
2Q11
3Q11
4Q11
Non-performing construction loans
(in millions)
Commercial:
$121 / 69%
Multi-family:
$22 / 12%
Residential -
vertical: $17 / 10%
Lots: $8 / 5%
Raw land: $5 / 3%
A&D: $2 / 1%
Outstanding balance of $175 million as of Dec. 31, 2011
(in millions) |
 Ticker: STSA
Spokane, Washington
www.sterlingfinancialcorporation-spokane.com
27
Investor Contacts
Media Contact
Patrick Rusnak
Cara Coon
Chief Financial Officer
VP/Communications and Public Affairs Director
(509) 227-0961
(509) 626-5348
patrick.rusnak@sterlingsavings.com
cara.coon@sterlingsavings.com
Daniel Byrne
EVP/Corporate Development Director
(509) 458-3711
dan.byrne@sterlingsavings.com |