Attached files
| file | filename |
|---|---|
| EX-4.2 - REGISTRATION RIGHTS AGREEMENT - E2open Inc | d45301dex42.htm |
| EX-3.3 - BYLAWS OF THE REGISTRANT - E2open Inc | d45301dex33.htm |
| EX-4.3 - SECOND AMENDED AND RESTATED STOCKHOLDERS AGREEMENT - E2open Inc | d45301dex43.htm |
| EX-10.2 - 2003 STOCK PLAN - E2open Inc | d45301dex102.htm |
| EX-23.1 - CONSENT OF KPMG, LLP - E2open Inc | d45301dex231.htm |
| EX-21.1 - LIST OF SUBSIDIARIES - E2open Inc | d45301dex211.htm |
| EX-3.1 - AMENDED AND RESTATED CERTIFICATE OF INCORPORATION - E2open Inc | d45301dex31.htm |
Table of Contents
As filed with the Securities and Exchange Commission on February 17, 2012
Registration No. 333-
UNITED STATES
SECURITIES AND EXCHANGE COMMISSION
WASHINGTON, D.C. 20549
FORM S-1
REGISTRATION STATEMENT
UNDER
THE SECURITIES ACT OF 1933
E2open, Inc.
(Exact name of registrant as specified in its charter)
| Delaware | 7372 | 94-3366487 | ||
| (State or other jurisdiction of incorporation or organization) |
(Primary Standard Industrial Classification Code Number) |
(IRS Employer Identification No.) |
4100 East Third Avenue, Suite 400
Foster City, California 94404
(650) 645-6500
(Address, including zip code, and telephone number, including area code, of registrant’s principal executive offices)
Mark E. Woodward
President and Chief Executive Officer
4100 East Third Avenue, Suite 400
Foster City, California 94404
(650) 645-6500
(Name, address, including zip code, and telephone number, including area code, of agent for service)
Copies to:
| Larry W. Sonsini Aaron J. Alter Wilson Sonsini Goodrich & Rosati, P.C. 650 Page Mill Road Palo Alto, California 94304 (650) 493-9300 |
Peter J. Maloney Chief Financial Officer 4100 East Third Avenue, Suite 400 Foster City, California 94404 (650) 645-6500 |
Richard A. Kline Christopher J. Austin Goodwin Procter LLP 135 Commonwealth Drive Menlo Park, California 94025 (650) 752-3100 |
Approximate date of commencement of proposed sale to the public: As soon as practicable after this registration statement becomes effective.
If any of the securities being registered on this Form are to be offered on a delayed or continuous basis pursuant to Rule 415 under the Securities Act of 1933, check the following box: ¨
If this Form is filed to register additional securities for an offering pursuant to Rule 462(b) under the Securities Act, check the following box and list the Securities Act registration statement number of the earlier effective registration statement for the same offering. ¨
If this Form is a post effective amendment filed pursuant to Rule 462(c) under the Securities Act, check the following box and list the Securities Act registration statement number of the earlier effective registration statement for the same offering. ¨
If this Form is a post effective amendment filed pursuant to Rule 462(d) under the Securities Act, check the following box and list the Securities Act registration statement number of the earlier effective registration statement for the same offering. ¨
Indicate by check mark whether the registrant is a large accelerated filer, an accelerated filer, a non-accelerated filer, or a smaller reporting company. See the definitions of “large accelerated filer,” “accelerated filer” and “smaller reporting company” in Rule 12b-2 of the Exchange Act.. (Check one):
| Large accelerated filer ¨ |
Accelerated filer ¨ | Non-accelerated filer x | Smaller reporting company ¨ | |||
| (Do not check if a smaller reporting company) |
CALCULATION OF REGISTRATION FEE
|
| ||||
| Title of Each Class of Securities to be Registered |
Proposed Maximum Aggregate Offering Price (1) |
Amount of Registration Fee (2) | ||
| Common Stock, par value $0.001 per share |
$86,250,000 |
$9,884.25 | ||
|
| ||||
| (1) | Estimated solely for the purpose of calculating the registration fee in accordance with Rule 457(o) under the Securities Act of 1933, as amended. Includes offering price of shares that the underwriters have the option to purchase to cover over-allotments, if any. |
| (2) | Calculated pursuant to Rule 457(o) under the Securities Act based on an estimate of the proposed maximum offering price. |
The registrant hereby amends this registration statement on such date or dates as may be necessary to delay its effective date until the registrant shall file a further amendment which specifically states that this registration statement shall thereafter become effective in accordance with Section 8(a) of the Securities Act of 1933 or until the registration statement shall become effective on such date as the Securities and Exchange Commission, acting pursuant to said Section 8(a), may determine.
Table of Contents
The information in this prospectus is not complete and may be changed. Neither we nor the selling stockholders may sell these securities until the registration statement filed with the Securities and Exchange Commission is effective. This prospectus is not an offer to sell these securities and it is not soliciting an offer to buy these securities in any state where the offer or sale is not permitted.
Subject to Completion
Preliminary Prospectus dated February 17, 2012
PROSPECTUS
Shares

Common Stock
This is E2open, Inc.’s initial public offering. We are selling shares of our common stock and the selling stockholders are selling shares of our common stock. We will not receive any proceeds from the sale of shares to be offered by the selling stockholders.
We expect the public offering price to be between $ and $ per share. Currently, no public market exists for the shares. After pricing of the offering, we expect that the shares will trade on the under the symbol “ .”
Investing in the common stock involves risks that are described in the “Risk Factors” section beginning on page 13 of this prospectus.
| Per Share |
Total |
|||||||
| Public offering price |
$ | $ | ||||||
| Underwriting discount |
$ | $ | ||||||
| Proceeds, before expenses, to us |
$ | $ | ||||||
| Proceeds, before expenses, to the selling stockholders |
$ | $ | ||||||
The underwriters may also exercise their option to purchase up to an additional shares from us, and up to an additional shares from the selling stockholders, at the public offering price, less the underwriting discount, for 30 days after the date of this prospectus.
Neither the Securities and Exchange Commission nor any state securities commission has approved or disapproved of these securities or determined if this prospectus is truthful or complete. Any representation to the contrary is a criminal offense.
The shares will be ready for delivery on or about , 2012.
| BofA Merrill Lynch | ||||||
| William Blair & Company | Pacific Crest Securities | Canaccord Genuity | Needham & Company | |||
The date of this prospectus is , 2012.
Table of Contents
| Page | ||||
| 1 | ||||
| 13 | ||||
| Special Note Regarding Forward-Looking Statements and Industry Data |
33 | |||
| 35 | ||||
| 35 | ||||
| 36 | ||||
| 38 | ||||
| 40 | ||||
| Management’s Discussion and Analysis of Financial Condition and Results of Operations |
45 | |||
| 77 | ||||
| 96 | ||||
| 104 | ||||
| 128 | ||||
| 132 | ||||
| 136 | ||||
| 141 | ||||
| Material U.S. Federal Income and Estate Tax Consequences to Non-U.S. Holders |
143 | |||
| 147 | ||||
| 153 | ||||
| 153 | ||||
| 153 | ||||
| F-1 | ||||
You should rely only on the information contained in this prospectus and in any free writing prospectus prepared by or on behalf of us and delivered or made available to you. We have not, the selling stockholders have not and the underwriters have not, authorized anyone to provide you with information different from, or in addition to, that contained in this prospectus or any related free writing prospectus. Neither we nor the selling stockholders take responsibility for, and can provide no assurance as to the reliability of, any other information that others may give you. This prospectus is an offer to sell only the shares offered hereby but only under circumstances and in jurisdictions where it is lawful to do so. The information contained in this prospectus is current only as of its date.
Through and including, , 2012 (the 25th day after the date of this prospectus), all dealers effecting transactions in these securities, whether or not participating in this offering, may be required to deliver a prospectus. This is in addition to a dealer’s obligation to deliver a prospectus when acting as an underwriter and with respect to an unsold allotment or subscription.
No action is being taken in any jurisdiction outside the United States to permit a public offering of our common stock or possession or distribution of this prospectus in that jurisdiction. Persons who come into possession of this prospectus in a jurisdiction outside the United States are required to inform themselves about, and to observe any restrictions as to, this offering and the distribution of this prospectus applicable to that jurisdiction.
i
Table of Contents
This summary highlights information contained elsewhere in this prospectus and does not contain all of the information that you should consider in making your investment decision. Before investing in our common stock, you should carefully read this entire prospectus, including our consolidated financial statements and the related notes included in this prospectus and the information set forth under “Risk Factors” and “Management’s Discussion and Analysis of Financial Condition and Results of Operations.”
Company Overview
We are a leading provider of cloud-based, on-demand software solutions delivered on an integrated platform that enables companies to collaborate with their trading partners to procure, manufacture, sell and distribute products more efficiently. Our customers depend on outsourced manufacturing strategies and complex trading networks to compete in today’s global economy. They use our solutions to gain visibility into and control over their trading networks through the real-time information, integrated business processes and advanced analytics that we provide. Our solutions enable our customers and their trading partners to overcome problems arising from communications across disparate systems by offering a reliable source of data, processes and analytics, which our customers rely on as the single version of the truth. Our solutions empower our customers to manage demand they cannot predict and supply they do not control.
We refer to the combination of our software applications delivered on our cloud-based platform, the content contributed by our network participants and our enabling services as the E2open Business Network. The E2open Business Network has grown to over 29,000 unique registered trading partners. It allows our network participants to access and share data and execute business processes in a secure, real-time manner, while providing them with collaboration tools and analytics so that our customers can make more informed and efficient decisions. Our customer base includes companies that represent five of the top eight supply chains in the world, according to Gartner, Inc., and spans several industries including many large multinational companies such as Boeing, Cisco, Dell, the Gap, GE, Flextronics, IBM, Lab126 (part of the Amazon.com, Inc. group of companies), Motorola and Vodafone. To date, our target markets have been Technology, Telecommunications, Aerospace and Defense, and Consumer Products.
E2open transcends traditional supply chain software categories, which include business-to-business, or B2B, integration, procurement, forecasting, planning and execution, by enabling coordination and collaboration among enterprises, which we call “collaborative execution.” By providing our solutions in an integrated cloud-based environment, our customers and their trading partners can easily share detailed and relevant content and data to gain the visibility they need for collaborative execution across their extended trading network.
Our customers benefit from the following key differentiating features of the E2open Business Network:
| • | Cross-network analytics. We provide cross-network analytics for real-time monitoring and control of large volumes of data to sense and respond quickly and collaboratively to changes, opportunities or disruptions in the supply chain. |
| • | Multi-enterprise, multi-tier supply and demand process management. We support key operational processes, such as forecast, order and inventory management, for our customers and their multi-tiered supply and demand trading networks. |
| • | Scalable, secure cloud-based connectivity platform. Our solutions combine B2B connectivity and integration capabilities that allow our customers to securely connect, share and act on information across their trading networks that can include thousands of partners. |
1
Table of Contents
| • | Integration with existing systems. Our highly-configurable solutions integrate with many leading Enterprise Resource Planning, or ERP, systems to efficiently manage complex networks and facilitate the interchange of transactions. |
We believe that the E2open Business Network is strategic to our customers in that it enables them to increase revenue and productivity, and to reduce operating expenditures, working capital and cost of goods sold. Our solutions seamlessly integrate with and enhance our customers’ mission critical business systems and processes across their trading networks.
We have achieved strong growth as our network has scaled and as we have expanded our solutions. Our platform originated as a solution to help our customers connect with their manufacturing and distribution partners in their trading network. Next, we introduced solutions for multi-enterprise supply management, and then we introduced solutions to help our customers coordinate multi-enterprise demand management. Our revenue has grown from $37.7 million in fiscal 2009 to $44.4 million in fiscal 2010 to $55.5 million in fiscal 2011, representing a compound annual growth rate of 21.3% over this period. We generated $42.7 million of revenue for the nine months ended November 30, 2011. Additionally, from March 1, 2008 through November 30, 2011, we increased backlog from $24.4 million to $82.6 million, representing a 238.4% increase.
Our Opportunity
The accelerating trends of supply chain globalization and outsourced manufacturing and distribution have combined to increase complexity and risk for brand owners while decreasing visibility into their expanding and evolving supply chains and distribution networks. These trends have created a fundamental shift in the way companies source and distribute goods and services. They have led to an ever more complex product and service delivery paradigm which increasingly relies on specialized, globally distributed trading partners to reduce costs.
As trading networks become more complex, companies are increasingly demanding integrated solutions that facilitate not only collaborative inventory management, but also the demand and supply forecasts, procurement systems, order management and analytics required to efficiently coordinate a company’s entire business ecosystem. We believe a significant opportunity exists to help companies improve their competitive advantage by delivering the visibility and control once characteristic of vertically integrated companies while retaining the advantages of outsourcing. The ability to navigate modern supply chain complexities and to resolve problems in a timely and collaborative manner, combined with enhanced knowledge of end customer demand, is critical to enabling businesses to better match supply and demand.
Our collaborative execution solutions address an opportunity comprised of three markets that include integration brokerage software, supply chain execution software and supply chain planning software. These three markets are forecasted by Gartner, Inc. to grow collectively at an 11.3% compound annual growth rate from $5.5 billion in 2010 to $9.4 billion in 2015.
Our Solutions
We develop, operate and market an integrated cloud-based platform that addresses supply chain management challenges by providing cross-network analytics, multi-enterprise business process management and B2B integration solutions for companies seeking visibility across and control over their trading networks. We deliver our solutions in a highly secure, cloud-based computing environment. Our customers subscribe to our on-demand software-as-a-service solutions with multi-year contract terms that are typically three years in length.
2
Table of Contents
The E2open Business Network enables integrated planning and execution across trading partner networks. Our cloud-based technology stack is purpose-built for managing trading partner networks and enables our customers and their partners to increase their revenues while reducing costs by minimizing errors and maximizing efficiency. The key characteristics of the E2open Business Network that drive customer adoption include:
| • | Large global business network. Our solutions have been designed for companies that either manage or participate in distributed supply chains and whose business processes require collaboration among numerous entities performing multiple interdependent activities to source, produce and fulfill demand for their products across disparate geographies. |
| • | Demand-driven model. Our solutions enable our customers to transform their trading networks from a forecast-driven production model, where products are manufactured in anticipation of future demand, to a demand-driven fulfillment model, which is responsive to changes in actual current end-user demand or constraints in supply. |
| • | Multi-tier functionality. Our solutions allow trading network participants to better manage processes and information, relating to raw materials, products, finished goods and related services across multiple tiers—from the extended supply base, to their outsourced manufacturing partners, then on to their distribution channels and ultimately to the end customer. |
| • | Cloud-based platform. Unlike many companies operating legacy on-premise solutions that are difficult and costly to configure and support, our customers and their trading partners using the E2open Business Network are able to share, analyze and act on information in real time on a common platform. Our cloud-based platform enables process management and information exchange among our customers and their trading partners. |
Enterprises can leverage our enabling expertise and services when they need to change or deploy a new process capability or add a trading partner. By creating a single, unified source of information within the trading network, we enable enterprises to operate and make decisions based on reliable and trustworthy information in real time, allowing our customers and their trading partners to improve communication, multi-enterprise process performance, and tactical and strategic decision making. Our customers use our solutions to:
| • | Increase sales by optimizing inventory levels; |
| • | Achieve greater revenue assurance and customer satisfaction through timely order fulfillment; |
| • | Reduce costs and working capital requirements through automation of operations, inventory reduction and enhanced procurement efficiency; |
| • | Achieve faster and easier on-boarding of trading partners to our platform by utilizing each partner’s existing technological infrastructure; and |
| • | Reduce deployment risk, streamline operations and lower maintenance costs, without a significant upfront investment in on-premise software or ongoing investments in software maintenance. |
3
Table of Contents
Our Strategy for Growth
Our objective is to be the leading provider of multi-enterprise, cloud-based, on-demand software enabling enterprises to more efficiently and profitably procure, manufacture, sell and distribute products through collaborative execution. The key elements of our strategy include:
| • | Leverage our existing network to add customers. The E2open Business Network creates a network effect by attracting the largest suppliers and customers in a particular industry vertical to establish and grow our presence. We intend to leverage our customers’ expanding ecosystems to attract new customers and convert trading partners from within our network into direct customers. |
| • | Up-sell additional solutions to our existing customers. Once our customers begin to rely on the real-time data and visibility provided by our platform and solutions, they typically purchase additional solutions from us. We intend to continue to leverage our knowledge of and familiarity with our existing customers to deliver additional solutions to them. |
| • | Expand into new verticals. We believe our experience with our customers in our initial target markets provides a successful model for future growth. We have found that the challenges presented by managing inventory, orders and planning are similar across many industries which makes our solutions applicable to a wide array of industry verticals. We intend to leverage our experience, expertise and proven customer success within our current key verticals to accelerate entry into and delivery of our solutions to these new vertical markets. |
| • | Introduce new products. We will continue to expand our portfolio of solutions by leveraging our familiarity with advanced supply chains and over 29,000 of our partners in our trading network to develop new applications and introduce new products that are strategic to our customers and their trading networks. |
| • | Expand our international presence. In 2010, we grew our sales team in Europe and we intend to hire additional sales personnel in Germany, France and the Nordic countries. In 2011, we opened an office and established a direct sales force and a sales, hosting and distribution alliance with a local partner in China. We intend to make additional investments outside of the United States in order to expand our geographic reach. |
| • | Expand our target market to include mid-market customers. Historically, we have focused our sales and marketing efforts on the largest companies within specific vertical markets. By leveraging our established trading network and cloud-based subscription model, we can now offer cost-effective, pre-packaged solutions to expand our target market to include mid-market customers. |
| • | Make targeted, strategic acquisitions. We intend to complement our organic growth with strategic acquisitions of technologies, solutions and businesses that enhance and expand our existing offerings. |
4
Table of Contents
Risk Factors
Investing in our common stock involves risks and uncertainties. You should carefully read “Risk Factors” for an explanation of these risks before investing in our common stock. In particular, the following considerations, among others, may offset our competitive strengths or have a negative effect on our growth strategy, which could cause a decline in the price of our common stock and result in a loss of all or a portion of your investment:
| • | We have incurred operating losses in the past and may incur operating losses in the future; |
| • | If we are unable to attract new customers or sell additional products to our existing customers, our revenue growth and profitability will be adversely affected; |
| • | We derive a significant portion of our revenue from a relatively small number of customers, and our growth depends on our ability to retain existing customers and add new customers; |
| • | We encounter long sales cycles, particularly with our larger customers, and seasonality in sales, which could have an adverse effect on the amount, timing and predictability of our revenue; |
| • | Our quarterly results of operations may fluctuate. As a result, we may fail to meet or exceed the expectations of investors or securities analysts which could cause our stock price to decline; |
| • | We operate in an emerging and evolving market, which may make it difficult to evaluate our business and future prospects. If this market does not develop or develops more slowly than we expect, our revenue may decline or fail to grow, and we may incur additional operating losses; |
| • | Downturns in general economic and market conditions and reductions in information technology spending may reduce demand for our solutions, which could negatively affect our revenue, results of operations and cash flows; and |
| • | If we are unable to develop new products and services, sell our solutions into new markets or further penetrate our existing markets, our revenue will not grow as expected. |
Corporate Information
E2open, LLC commenced operations in 2000 as a venture between a number of strategic corporate investors, financial investors and advisors. In 2003, E2open, Inc. was incorporated in Delaware, and merged with E2open, LLC, with E2open, Inc. becoming the surviving entity in the merger. Our principal executive offices are located at 4100 East Third Avenue, Suite 400, Foster City, California 94404, and our telephone number is (650) 645-6500. Our website address is www.e2open.com. Information contained on our website is not a part of this prospectus and the inclusion of our website address in this prospectus is an inactive textual reference only. Unless the context requires otherwise, the words “E2open,” “we,” “company,” “us” and “our” refer to E2open, Inc. and our wholly owned subsidiaries.
E2open, the E2open logo and other trademarks of E2open appearing in this prospectus are the property of E2open. Trade names and trademarks of other companies appearing in this prospectus are the property of the respective holders.
5
Table of Contents
THE OFFERING
| Common stock offered by E2open, Inc |
shares |
| The selling stockholders |
shares |
| Shares outstanding after the offering |
shares |
| Overallotment option offered by E2open, Inc. |
shares |
| Use of proceeds |
The net proceeds to us from this offering, after expenses, will be approximately $ million after deducting underwriting discounts and commissions and estimated offering expenses payable by us. We will not receive any of the proceeds from the shares sold by selling stockholders. We intend to use the net proceeds from this offering for general corporate purposes, including working capital, sales and marketing activities, general and administrative matters and capital expenditures. We may also use a portion of the net proceeds for acquisitions of complementary technologies, solutions or businesses and repayment of up to $ million of our existing indebtedness. |
| Risk factors |
See “Risk Factors” and the other information included in this prospectus for a discussion of factors you should carefully consider before deciding to invest in our common stock. |
| Proposed symbol |
“ ” |
The number of shares of our common stock to be outstanding after the completion of this offering is based on 733,124,343 shares outstanding as of November 30, 2011, and excludes:
| • | 98,566,958 shares of common stock issuable upon the exercise of options outstanding as of November 30, 2011 at a weighted average exercise price of $0.06 per share; |
| • | 6,620,369 shares of common stock issuable upon the conversion of convertible Series BB preferred stock issuable upon the exercise of warrants outstanding as of November 30, 2011 at an exercise price of $0.32 per share; and |
| • | shares reserved for future issuance under our 2012 Equity Compensation Plan, as well as shares originally reserved for issuance under our 2003 Stock Plan, but which may become available for awards under our 2012 Equity Compensation Plan, which plan will become effective in connection with this offering and contains provisions that will automatically increase its share reserve each year, as more fully described in “Executive Compensation—Employee Benefit Plans.” |
Except for historical financial statements or as otherwise indicated, information in this prospectus reflects or assumes the following:
| • | a one-for- reverse stock split of our common stock effected on , 2012; |
| • | the filing of our amended and restated certificate of incorporation immediately prior to the closing of this offering; |
6
Table of Contents
| • | the conversion of all of our outstanding convertible preferred stock into an aggregate of 517,002,101 shares of common stock immediately prior to the closing of this offering; |
| • | the automatic conversion of all of our outstanding warrants to purchase convertible preferred stock into warrants to purchase an aggregate of 6,620,369 shares of common stock immediately prior to the closing of this offering; |
| • | no exercise after November 30, 2011 of outstanding options or warrants; and |
| • | no exercise of the underwriters’ overallotment option. |
7
Table of Contents
SUMMARY CONSOLIDATED FINANCIAL INFORMATION
We have derived the summary consolidated financial data for the fiscal years ended February 28, 2009, 2010 and 2011 from our audited consolidated financial statements included elsewhere in this prospectus. We have derived the summary consolidated financial data for the nine months ended November 30, 2010 and 2011 and as of November 30, 2011 from our unaudited consolidated financial statements included elsewhere in this prospectus. Our historical results are not necessarily indicative of our future results. The following summary consolidated financial data should be read in conjunction with “Management’s Discussion and Analysis of Financial Condition and Results of Operations” and our consolidated financial statements and related notes included elsewhere in this prospectus.
| Year Ended February 28, | Nine Months Ended November 30, |
|||||||||||||||||||
| 2009 | 2010 | 2011 | 2010 | 2011 | ||||||||||||||||
| (In thousands, except per share data) | ||||||||||||||||||||
| Consolidated Statements of Operations Data: |
||||||||||||||||||||
| Revenue |
||||||||||||||||||||
| Subscription and support |
$ | 21,107 | $ | 29,976 | $ | 39,419 | $ | 26,973 | $ | 26,563 | ||||||||||
| Professional services |
16,627 | 14,401 | 16,104 | 10,380 | 16,099 | |||||||||||||||
|
|
|
|
|
|
|
|
|
|
|
|||||||||||
| Total revenue |
37,734 | 44,377 | 55,523 | 37,353 | 42,662 | |||||||||||||||
| Cost of revenue |
||||||||||||||||||||
| Subscription and support |
8,885 | 9,269 | 7,531 | 5,774 | 5,599 | |||||||||||||||
| Professional services |
14,685 | 11,493 | 11,774 | 8,764 | 10,224 | |||||||||||||||
|
|
|
|
|
|
|
|
|
|
|
|||||||||||
| Total cost of revenue |
23,570 | 20,762 | 19,305 | 14,538 | 15,823 | |||||||||||||||
|
|
|
|
|
|
|
|
|
|
|
|||||||||||
| Gross profit |
||||||||||||||||||||
| Subscription and support |
12,222 | 20,707 | 31,888 | 21,199 | 20,964 | |||||||||||||||
| Professional services |
1,942 | 2,908 | 4,330 | 1,616 | 5,875 | |||||||||||||||
|
|
|
|
|
|
|
|
|
|
|
|||||||||||
| Total gross profit |
14,164 | 23,615 | 36,218 | 22,815 | 26,839 | |||||||||||||||
|
|
|
|
|
|
|
|
|
|
|
|||||||||||
| Operating expenses: |
||||||||||||||||||||
| Research and development |
12,943 | 13,077 | 11,463 | 8,474 | 9,880 | |||||||||||||||
| Sales and marketing |
11,792 | 11,421 | 12,756 | 9,027 | 13,161 | |||||||||||||||
| General and administrative |
6,448 | 4,884 | 5,064 | 3,745 | 4,305 | |||||||||||||||
| Restructuring costs |
1,146 | — | — | — | — | |||||||||||||||
|
|
|
|
|
|
|
|
|
|
|
|||||||||||
| Total operating expenses |
32,329 | 29,382 | 29,283 | 21,246 | 27,346 | |||||||||||||||
|
|
|
|
|
|
|
|
|
|
|
|||||||||||
| Income (loss) from operations |
(18,165 | ) | (5,767 | ) | 6,935 | 1,569 | (507 | ) | ||||||||||||
| Interest and other expense, net |
(1,618 | ) | (532 | ) | (259 | ) | (219 | ) | (457 | ) | ||||||||||
|
|
|
|
|
|
|
|
|
|
|
|||||||||||
| Income (loss) before income taxes |
(19,783 | ) | (6,299 | ) | 6,676 | 1,350 | (964 | ) | ||||||||||||
| Provision for income taxes |
(60 | ) | (349 | ) | (33 | ) | — | (122 | ) | |||||||||||
|
|
|
|
|
|
|
|
|
|
|
|||||||||||
| Net income (loss) |
(19,843 | ) | (6,648 | ) | 6,643 | 1,350 | (1,086 | ) | ||||||||||||
| Undistributed earnings allocated to preferred stockholders |
(6,643 | ) | (1,350 | ) | ||||||||||||||||
|
|
|
|
|
|
|
|
|
|
|
|||||||||||
| Net income (loss) attributable to common stockholders |
$ | (19,843 | ) | $ | (6,648 | ) | $ | — | $ | — | $ | (1,086 | ) | |||||||
|
|
|
|
|
|
|
|
|
|
|
|||||||||||
| Net income (loss) per share attributable to common stockholders: |
||||||||||||||||||||
| Basic |
$ | (0.17 | ) | $ | (0.05 | ) | $ | — | $ | — | $ | (0.01 | ) | |||||||
|
|
|
|
|
|
|
|
|
|
|
|||||||||||
| Diluted |
$ | (0.17 | ) | $ | (0.05 | ) | $ | — | $ | — | $ | (0.01 | ) | |||||||
|
|
|
|
|
|
|
|
|
|
|
|||||||||||
| Weighted average shares used to compute income (loss) per share attributable to common stockholders: |
||||||||||||||||||||
| Basic |
115,390 | 147,342 | 202,569 | 199,486 | 205,796 | |||||||||||||||
|
|
|
|
|
|
|
|
|
|
|
|||||||||||
| Diluted |
115,390 | 147,342 | 202,569 | 199,486 | 205,796 | |||||||||||||||
|
|
|
|
|
|
|
|
|
|
|
|||||||||||
| Pro forma net income (loss) per share attributable to common stockholders (unaudited) (1) |
||||||||||||||||||||
| Basic |
$ | 0.01 | $ | — | ||||||||||||||||
|
|
|
|
|
|||||||||||||||||
| Diluted |
$ | 0.01 | $ | — | ||||||||||||||||
|
|
|
|
|
|||||||||||||||||
| Pro forma weighted average shares used to compute pro forma net income (loss) per share attributable to common stockholders (unaudited): |
||||||||||||||||||||
| Basic |
726,191 | 729,368 | ||||||||||||||||||
|
|
|
|
|
|||||||||||||||||
| Diluted |
759,769 | 729,368 | ||||||||||||||||||
|
|
|
|
|
|||||||||||||||||
8
Table of Contents
| Year Ended February 28, | Nine Months Ended November 30, |
|||||||||||||||||||
| 2009 | 2010 | 2011 | 2010 | 2011 | ||||||||||||||||
| (Dollars in thousands) | ||||||||||||||||||||
| Other Financial and Operational Data: |
||||||||||||||||||||
| Adjusted EBITDA (2) |
$ | (15,163 | ) | $ | (2,999 | ) | $ | 9,371 | $ | 3,320 | $ | 1,053 | ||||||||
|
|
|
|
|
|
|
|
|
|
|
|||||||||||
| Free cash flow (3) |
$ | (16,453 | ) | $ | (5,325 | ) | $ | (697 | ) | $ | (1,950 | ) | $ | (2,621 | ) | |||||
|
|
|
|
|
|
|
|
|
|
|
|||||||||||
| Number of unique registered trading partners (at period end) (4) |
18,117 | 22,529 | 26,440 | 25,554 | 29,599 | |||||||||||||||
| Number of unique registered users (at period end) (4) |
48,918 | 62,528 | 73,377 | 70,847 | 84,461 | |||||||||||||||
| (1) | Pro forma net income (loss) per share has been calculated assuming the conversion of all outstanding shares of our preferred stock as of November 30, 2011 into 517,002,101 shares of common stock and issuance of 6,620,369 shares of common stock upon the conversion of convertible Series BB preferred stock issuable upon the exercise of warrants outstanding as of November 30, 2011 prior to completion of this offering. |
| (2) | We define Adjusted EBITDA as net income (loss) adjusted for interest and other expense, net, provision for income taxes, depreciation and amortization, and stock-based compensation expense. Please see “Adjusted EBITDA” below for more information and for a reconciliation of Adjusted EBITDA to net income (loss), the most directly comparable financial measure calculated and presented in accordance with U.S. generally accepted accounting principles, or GAAP. |
| (3) | We define free cash flow as net cash provided by (used in) operating activities less capital expenditures. Please see “Free Cash Flow” below for more information and for a reconciliation of free cash flow to net cash provided by (used in) operating activities, the most directly comparable financial measure calculated and presented in accordance with GAAP. |
| (4) | We define unique registered trading partners and unique registered users as entities and individuals, respectively, that have used our network as of the balance sheet date. We view the number of unique registered trading partners and unique registered users as key indicators of the reach of our network and the value our enterprise customers are deriving from our solutions. |
Stock-based compensation included in the consolidated statements of operations data above was as follows:
| Year Ended February 28, | Nine Months Ended November 30, |
|||||||||||||||||||
| 2009 | 2010 | 2011 | 2010 | 2011 | ||||||||||||||||
| (In thousands) | ||||||||||||||||||||
| Cost of revenue |
$ | 85 | $ | 106 | $ | 223 | $ | 111 | $ | 122 | ||||||||||
| Research and development |
58 | 82 | 108 | 61 | 53 | |||||||||||||||
| Sales and marketing |
107 | 155 | 154 | 80 | 135 | |||||||||||||||
| General and administrative |
92 | 102 | 92 | 59 | 100 | |||||||||||||||
|
|
|
|
|
|
|
|
|
|
|
|||||||||||
| Total stock-based compensation |
$ | 342 | $ | 445 | $ | 577 | $ | 311 | $ | 410 | ||||||||||
|
|
|
|
|
|
|
|
|
|
|
|||||||||||
The following table sets forth our summary consolidated balance sheet data as of November 30, 2011:
| • | on an actual basis; |
| • | on a pro forma basis to reflect the conversion of all outstanding shares of our convertible preferred stock into 517,002,101 shares of our common stock, which will occur immediately prior to the closing of this offering, and the conversion of warrants to purchase convertible preferred stock into warrants to purchase 6,620,369 shares of common stock, which will occur immediately prior to the closing of this offering, and the filing of our post-offering amended and restated certificate of incorporation, which will occur immediately prior to the closing of this offering; and |
| • | on a pro forma as adjusted basis to reflect the pro forma adjustments described above and our receipt of the net proceeds from our sale of shares of common stock in this offering at an assumed initial public offering price of $ per share, the midpoint of the price range set forth on the cover page of this prospectus, after deducting estimated underwriting discounts and commissions and estimated offering expenses payable by us. |
9
Table of Contents
| As of November 30, 2011 | ||||||||
| Actual | Pro forma (1) | Pro forma as adjusted | ||||||
| (In thousands) | ||||||||
| Consolidated Balance Sheet Data: |
||||||||
| Cash and cash equivalents |
$ | 10,043 | ||||||
| Property and equipment, net |
1,444 | |||||||
| Working capital, excluding deferred revenue |
8,320 | |||||||
| Total assets |
28,549 | |||||||
| Convertible preferred stock |
83,491 | |||||||
| Total stockholders’ deficit |
$ | (34,595 | ) | |||||
| (1) | A $1.00 increase (decrease) in the assumed initial public offering price of $ per share, the midpoint of the range set forth on the cover page of this prospectus, would increase (decrease) cash and cash equivalents and each of working capital, excluding deferred revenue, total assets and total stockholders’ deficit by $ million, assuming that the number of shares offered by us, as set forth on the cover page of this prospectus, remains the same, and after deducting estimated underwriting discounts and commissions and estimated offering expenses payable by us. Each increase of 1.0 million shares in the number of shares offered by us would increase cash and cash equivalents and each of working capital, excluding deferred revenue, total assets and total stockholders’ deficit by $ million. Similarly, each decrease of 1.0 million shares in the number of shares offered by us would decrease cash and cash equivalents and each of working capital, excluding deferred revenue, total assets and total stockholders’ deficit by $ million. The pro forma as adjusted information discussed above is illustrative only and will be adjusted based on the actual public offering price and other terms of this offering determined at pricing. |
Key Financial Performance Metrics
We monitor the key financial metrics set forth below as well as revenue, gross profit, gross margin, cash and cash equivalents, and available debt capacity, which are discussed in “Management’s Discussion and Analysis of Financial Condition and Results of Operations,” to help us evaluate trends, establish budgets, measure the effectiveness of our sales and marketing efforts and assess operational effectiveness and efficiencies.
Adjusted EBITDA
We have included Adjusted EBITDA in this prospectus because it is a key measure used by our management and board of directors to understand and evaluate our core operating performance and trends, to prepare and approve our annual budget and to develop short- and long-term operational plans.
Adjusted EBITDA is defined as net income (loss) adjusted for interest and other expense, net, provision for income taxes, depreciation and amortization, and stock-based compensation expense. Management believes that the use of Adjusted EBITDA provides consistency and comparability with our past financial performance, facilitates period to period comparisons of results of operations, and also facilitates comparisons with other peer companies, many of which use similar non-GAAP financial measures to supplement their GAAP results.
Management believes that it is useful to exclude certain non-cash charges, such as depreciation, amortization and stock-based compensation, and non-core operational charges, such as interest and other expense, net from Adjusted EBITDA because (1) the amount of such expenses in any specific period may not directly correlate to the underlying performance of our business operations and (2) such expenses can vary significantly between periods as a result of the timing of new stock-based awards, acquisitions or restructurings, as the case may be.
10
Table of Contents
Our use of Adjusted EBITDA has limitations as an analytical tool, and you should not consider it in isolation or as a substitute for analysis of our results as reported under GAAP. Some of these limitations are:
| • | Adjusted EBITDA does not reflect changes in, or cash requirements for, our working capital needs; |
| • | Adjusted EBITDA does not reflect the potentially dilutive impact of equity-based compensation; |
| • | Adjusted EBITDA does not reflect tax payments that may represent a reduction in cash available to us; |
| • | Although depreciation and amortization are non-cash charges, the assets being depreciated and amortized may have to be replaced in the future, and Adjusted EBITDA does not reflect the future need to augment or replace such assets; and |
| • | Other companies, including companies in our industry, may calculate Adjusted EBITDA differently, which reduces its usefulness as a comparative measure. |
Because of these limitations, you should consider Adjusted EBITDA alongside other financial performance measures, including various cash flow metrics, net income (loss) and our other GAAP results. The following table presents a reconciliation of Adjusted EBITDA to net income (loss) for each of the periods indicated:
| Year Ended February 28, | Nine Months Ended November 30, |
|||||||||||||||||||
| 2009 | 2010 | 2011 | 2010 | 2011 | ||||||||||||||||
| (In thousands) | ||||||||||||||||||||
| Reconciliation of Adjusted EBITDA: |
||||||||||||||||||||
| Net income (loss) |
$ | (19,843 | ) | $ | (6,648 | ) | $ | 6,643 | $ | 1,350 | $ | (1,086 | ) | |||||||
| Interest and other expense, net |
1,618 | 532 | 259 | 219 | 457 | |||||||||||||||
| Provision for income taxes |
60 | 349 | 33 | — | 122 | |||||||||||||||
| Depreciation and amortization |
2,660 | 2,323 | 1,859 | 1,440 | 1,150 | |||||||||||||||
| Stock-based compensation |
342 | 445 | 577 | 311 | 410 | |||||||||||||||
|
|
|
|
|
|
|
|
|
|
|
|||||||||||
| Adjusted EBITDA |
$ | (15,163 | ) | $ | (2,999 | ) | $ | 9,371 | $ | 3,320 | $ | 1,053 | ||||||||
|
|
|
|
|
|
|
|
|
|
|
|||||||||||
Free Cash Flow
Free cash flow is a key measure used in our internal operating reports and allows us to manage the cash available to fund our debt obligations and potential strategic initiatives. Management believes that free cash flow is useful to investors as a supplemental measure to evaluate our business over time.
Free cash flow is defined as net cash provided by (used in) operating activities less capital expenditures. Capital expenditures consist of purchases of property, equipment and software. Management believes that the use of free cash flow provides consistency and comparability with our past financial performance, facilitates period-to-period comparisons of operating performance and also facilitates comparisons with other peer companies, many of which use similar non-GAAP financial measures to supplement their GAAP results.
11
Table of Contents
Free cash flow should not be considered a substitute for other measures of financial performance reported in accordance with GAAP. There are limitations to using non-GAAP financial measures, including that other companies may calculate these measures differently than we do. Management compensates for the inherent limitations associated with measuring free cash flow through disclosure of such limitations, presentation of our financial statements in accordance with GAAP and reconciliation of free cash flow to the most directly comparable GAAP measure, net cash provided by (used in) operating activities. A reconciliation of net cash provided by (used in) operating activities to free cash flow is presented below:
| Year Ended February 28, | Nine Months Ended November 30, |
|||||||||||||||||||
| 2009 | 2010 | 2011 | 2010 | 2011 | ||||||||||||||||
| (In thousands) | ||||||||||||||||||||
| Free Cash Flow Data: |
||||||||||||||||||||
| Net cash provided by (used in) operating activities |
$ | (14,607 | ) | $ | (4,401 | ) | $ | 88 | $ | (1,287 | ) | $ | (2,126 | ) | ||||||
| Capital expenditures |
(1,846 | ) | (924 | ) | (785 | ) | (663 | ) | (495 | ) | ||||||||||
|
|
|
|
|
|
|
|
|
|
|
|||||||||||
| Free cash flow |
$ | (16,453 | ) | $ | (5,325 | ) | $ | (697 | ) | $ | (1,950 | ) | $ | (2,621 | ) | |||||
|
|
|
|
|
|
|
|
|
|
|
|||||||||||
12
Table of Contents
Investing in our common stock involves a high degree of risk. You should consider carefully the risks and uncertainties described below, together with all of the other information in this prospectus, including our financial statements and related notes, before deciding whether to purchase shares of our common stock. If any of the following risks is realized, our business, financial condition, results of operations and prospects could be materially and adversely affected. In that event, the price of our common stock could decline, and you could lose part or all of your investment.
Risks Related to Our Business and Industry
We have incurred operating losses in the past and may incur operating losses in the future.
We began our operations in 2000. Throughout most of our history, we have experienced net losses and negative cash flows from operations. As of November 30, 2011, we had an accumulated deficit of $341.5 million. We expect our operating expenses to increase in the future as we expand our operations. Furthermore, as a public company, we will incur legal, accounting and other expenses that we did not incur as a private company. If our revenue does not grow to offset these increased expenses, we will not be profitable. We cannot assure you that we will be able to achieve or maintain profitability. You should not consider recent revenue growth as indicative of our future performance.
If we are unable to attract new customers or sell additional products to our existing customers, our revenue growth and profitability will be adversely affected.
To increase our revenue and achieve and maintain profitability, we must regularly add new customers or sell additional solutions to our existing customers, which we plan to do. Numerous factors, however, may impede our ability to add new customers and sell additional solutions to our existing customers, including our inability to convert companies that have been referred to us by our existing network into paying customers, failure to attract and effectively train new sales and marketing personnel, failure to retain and motivate our current sales and marketing personnel, failure to develop relationships with resellers or failure to ensure the effectiveness of our marketing programs. In addition, if prospective customers do not perceive our solutions to be of sufficiently high value and quality, we will not be able to attract the number and types of new customers that we are seeking.
We derive a significant portion of our revenue from a relatively small number of customers, and our growth depends on our ability to retain existing customers and add new customers.
We derive a significant percentage of our revenue from a relatively small number of customers, and the loss of any one or more of those customers could decrease our revenue and harm our current and future results of operations. For the nine months ended November 30, 2011, our top ten customers accounted for 72.6% of our revenue, and two customers each accounted for at least 10% of our revenues. Although our largest customers may vary from period to period, we anticipate that we will continue to depend on revenue from a relatively small number of customers.
We encounter long sales cycles, particularly with our larger customers, and seasonality in sales, which could have an adverse effect on the amount, timing and predictability of our revenue.
Our products have lengthy sales cycles, which typically extend from four to 12 months and may in some instances take longer than one year. Potential and existing customers, particularly larger enterprises, often commit significant resources to an evaluation of available solutions and services and require us to expend substantial time and resources in connection with our sales efforts. The length of our sales cycles also varies depending on the type of customer to which we are selling, the product being sold and customer requirements. We may incur substantial sales and marketing expenses and expend significant management effort during this time, regardless of whether we make a sale. Many of the risks relating to sales processes are beyond our control, including:
| • | Our customers’ budgetary and scheduling constraints; |
13
Table of Contents
| • | The timing of our customers’ budget cycles and approval processes; |
| • | Our customers’ willingness to augment or replace their currently deployed software products; and |
| • | General economic conditions. |
As a result of the lengthy and uncertain sales cycles of our products and services, it is difficult for us to predict when customers may purchase products or services from us, thereby affecting when we can recognize the associated revenue, and our results of operations may vary significantly and may be adversely affected. The length of our sales cycle makes us susceptible to having pending transactions delayed or terminated by our customers if they decide to delay or withdraw funding for information technology, or IT, projects. Our customers may decide to delay or withdraw funding for IT projects for various reasons, including global economic cycles and capital market fluctuations.
In addition, we may experience seasonality in the sales of our solutions. For instance, historically, the agreements we have signed in our fiscal first quarter have had an aggregate value less than that of the agreements signed in our preceding fiscal fourth quarter. Seasonal variations in our sales may lead to significant fluctuations in our cash flows and deferred revenue on a quarterly basis. If we experience a delay in signing or a failure to sign a significant customer agreement in any particular quarter, then our results of operations for such quarter and for subsequent quarters may be below the expectations of securities analysts or investors, which may result in a decline in our stock price.
Our quarterly results of operations may fluctuate. As a result, we may fail to meet or exceed the expectations of investors or securities analysts which could cause our stock price to decline.
Our quarterly revenue and results of operations may fluctuate as a result of a variety of factors, many of which are outside of our control. If our quarterly revenue or results of operations fall below the expectations of investors or securities analysts, the price of our common stock could decline substantially. Fluctuations in our results of operations may be due to a number of factors, including, but not limited to, those listed below:
| • | Demand for and market acceptance of our products; |
| • | Our ability to retain and increase sales to customers and attract new customers; |
| • | The timing of product deployment which determines when we can recognize the associated revenue; |
| • | The timing and success of introductions of new solutions or upgrades by us or our competitors; |
| • | The strength of the economy; |
| • | Changes in our pricing policies or those of our competitors; |
| • | Competition, including entry into the industry by new competitors and new offerings by existing competitors; |
| • | The impact of seasonality on our business; |
| • | The amount and timing of expenditures related to expanding our operations, research and development or introducing new solutions; and |
| • | Changes in the payment terms for our solutions. |
Due to the foregoing factors, and the other risks discussed in this prospectus, you should not rely on quarter-to-quarter comparisons of our results of operations as an indication of our future performance.
14
Table of Contents
We operate in an emerging and evolving market, which may make it difficult to evaluate our business and future prospects. If this market does not develop or develops more slowly than we expect, our revenue may decline or fail to grow, and we may incur additional operating losses.
The market for trading network solutions, including our integrated platform, is in an early stage of development, and it is uncertain how rapidly this market will develop, and even if it does develop, whether our software and solutions will achieve and sustain high levels of demand and market acceptance. In addition, we sell our solutions as an on-demand, software-as-a-service, or SaaS, solution, which is an alternative to the traditional licensed hardware and software solutions, and solutions developed in-house to which many of our customers or potential customers are accustomed. Our software relies on the acceptance and proliferation of cloud computing, which may not be widespread or happen in a timely fashion.
Some companies may be reluctant or unwilling to use our solutions for a number of reasons, including existing investments in demand and supply network management technology. For example, supply chain management functions traditionally have been performed using purchased or licensed hardware and software implemented by each company in the supply chain. Because this traditional approach often requires significant initial investments to purchase the necessary technology and to establish systems that comply with customers’ unique requirements, suppliers may be unwilling to abandon their current options for our integrated, multi-enterprise solution.
Other factors that may limit market acceptance of our solutions include:
| • | Our ability to maintain high levels of customer satisfaction; |
| • | Our ability to maintain availability of service across all users of our products; |
| • | The price, performance and availability of competing products; |
| • | Our ability to address confidentiality concerns about information stored outside of our customers’ controlled computing environments; and |
| • | Concerns about data protection and confidentiality of data stored in the United States, for customers with headquarters outside of the United States. |
If companies do not perceive or value the benefits of our solutions, or if companies are unwilling to accept our platform as an alternative to the traditional approach, the market for our products might not continue to develop or might develop more slowly than we expect, either of which would significantly adversely affect our revenue and growth prospects.
Downturns in general economic and market conditions and reductions in IT spending may reduce demand for our solutions, which could negatively affect our revenue, results of operations and cash flows.
Our revenue, results of operations and cash flows depend on the overall demand for our solutions. Concerns about the systemic impact of a potential widespread recession, energy costs, geopolitical issues, the availability and cost of credit and the global housing and mortgage markets have contributed to increased market volatility, decreased consumer confidence and diminished growth expectations in the U.S. economy and abroad. This in turn has resulted in reductions in IT spending by some of our customers.
Further worsening, broadening or protracted extension of the economic downturn could have a significant negative impact on our business, revenue, results of operations and cash flows. Prolonged economic slowdowns may result in customers requiring us to renegotiate existing contracts on less advantageous terms to us than those currently in place or defaulting on payments due on existing contracts.
15
Table of Contents
Furthermore, during weak economic times, there is an increased risk that one or more of our customers will file for bankruptcy protection, which may adversely affect our revenue, profitability and results of operations. If a customer files for bankruptcy, we may be required to forego collection of pre-petition amounts owed and to repay amounts remitted to us during the 90-day preference period preceding the filing, which may be significant due to extended payment terms for software contract fees, and significant billings for professional services on large projects. We also face risk from international customers that file for bankruptcy protection in foreign jurisdictions, in that the outcome of the application of foreign bankruptcy laws may be more difficult to predict. In addition, we may determine that the cost of pursuing any claim may outweigh the recovery potential of such claim.
If we are unable to develop new products and services, sell our solutions into new markets or further penetrate our existing markets, our revenue will not grow as expected.
Our ability to attract new customers and increase revenue from existing customers will depend in large part on our ability to enhance and improve our solutions, to introduce new products and services in a timely manner, to sell into new markets and to further penetrate our existing markets. The success of any enhancement or new product or service depends on several factors, including the timely completion, introduction and market acceptance of the enhancement or new product or service. Any new product or service we develop or acquire may not be introduced in a timely or cost-effective manner and may not achieve the broad market acceptance necessary to generate significant revenue. Any new markets into which we attempt to sell our solutions, including new vertical markets and new countries or regions, may not be receptive. If we are unable to successfully develop or acquire new products or services, enhance our existing products or services to meet customer requirements, sell products and services into new markets or sell our products and services to additional customers in our existing markets, our revenue will not grow as expected. Moreover, we are frequently required to enhance and update our products and services as a result of changing standards and technological developments, which makes it difficult to recover the cost of development and forces us to continually qualify new products with our customers.
If we do not maintain the compatibility of our solutions with third-party applications that our customers use in their business processes, demand for our solutions could decline.
Our solutions can be used alongside a wide range of other systems, such as enterprise software systems and business software applications used by our customers in their businesses. If we do not support the continued integration of our solutions with third-party applications, including through the provision of application programming interfaces that enable data to be transferred readily between our solutions and third-party applications, demand for our solutions could decline, and we could lose sales. We will also be required to make our solutions compatible with new or additional third-party applications that are introduced into the markets that we serve. We may not be successful in making our solutions compatible with these third-party applications, which could reduce demand for our solutions. In addition, prospective customers, especially large enterprise customers, may require heavily customized features and functions unique to their business processes. If prospective customers require customized features or functions that we do not offer, then the market for our solutions will be adversely affected.
Our inability to adapt to rapid technological change could impair our ability to remain competitive.
The industry in which we compete is characterized by rapid technological change, frequent introductions of new products and evolving industry standards. Our ability to attract new customers and increase revenue from customers will depend in significant part on our ability to anticipate industry standards and to continue to enhance existing solutions or introduce or acquire new solutions on a timely basis to keep pace with technological developments. The success of any enhancement or new solution depends on several factors, including the timely completion and market acceptance of the enhancement or new solution. Any new solution we develop or acquire might not be introduced in a timely or cost-effective manner and might not achieve the broad market acceptance necessary to generate significant revenue. If any of our competitors implements new technologies before we are able to implement them, those competitors may be able to provide more effective
16
Table of Contents
solutions than ours at lower prices. Any delay or failure in the introduction of new or enhanced solutions could adversely affect our business, results of operations and financial condition.
Our solutions are complex and customers may experience difficulty in implementing or upgrading our products successfully or otherwise achieving the benefits attributable to our products.
Due to the scope and complexity of the solutions that we provide, our implementation cycle can be lengthy and unpredictable. Our products may require modification or customization and must integrate with many existing computer systems and software programs of our customers and their trading partners. This can be time-consuming and expensive for our customers and can result in delays in the implementation and deployment of our products. As a result, some customers have had, and may in the future have, difficulty implementing our products successfully or otherwise achieving the expected benefits of our products. Delayed or ineffective implementation or upgrades of our software may limit our future sales opportunities, impact revenue, result in customer dissatisfaction and harm our reputation.
The markets in which we participate are highly competitive, and our failure to compete successfully would make it difficult for us to add and retain customers and would reduce or impede the growth of our business.
The markets for supply chain management solutions are increasingly competitive and global. We expect competition to increase in the future both from existing competitors and new companies that may enter our markets. Increased competition could result in pricing pressure, reduced sales, lower margins or the failure of our solutions to achieve or maintain broad market acceptance. We currently face, or may face in the future, competition from:
| • | SaaS providers that deliver business-to-business information systems; |
| • | Traditional on-premise software providers; and |
| • | Managed service providers that combine traditional on-premise software with professional information technology services. |
To remain competitive, we will need to invest continuously in software development, marketing, customer service and support and product delivery infrastructure. However, we cannot assure you that new or established competitors will not offer solutions that are superior to or lower in price than ours. We may not have sufficient resources to continue the investments in all areas of software development and marketing needed to maintain our competitive position. In addition, some of our competitors have longer operating histories, greater name recognition, larger customer bases and significantly greater financial, technical, sales, marketing and other resources than us, which may provide them with an advantage in developing, marketing or servicing new solutions. Increased competition could reduce our market share, revenue and operating margins, increase our operating costs and otherwise adversely affect our business.
If we are unable to manage our diverse and complex operations, our reputation in the market and our ability to generate revenue from new or existing customers may be adversely affected.
Because our operations are geographically diverse and complex, our personnel resources and infrastructure could become strained and our reputation in the market and our ability to successfully implement our business plan may be adversely affected. We have experienced a period of rapid growth in our headcount and operations. From November 30, 2010 to November 30, 2011, our employee headcount grew from 273 to 320. The growth in the size, complexity and diverse nature of our business and the expansion of our product lines and customer base have placed increased demands on our management and operations, and further growth, if any, may place additional strains on our resources in the future. Our ability to effectively compete and to manage our planned future growth will depend on, among other things, the following:
| • | Maintaining continuity in our senior management and key personnel; |
17
Table of Contents
| • | Increasing the productivity of our existing employees; |
| • | Attracting, retaining, training and motivating our employees, particularly our technical and management personnel; |
| • | Deploying our solutions using third-party systems integrators, which will require changes to our applications, documentation and operational processes; |
| • | Improving our operational, financial and management controls; and |
| • | Improving our information reporting systems and procedures. |
If we do not manage the size, complexity and diverse nature of our business effectively, we could experience delayed software releases and longer response times for assisting our customers with implementation of our products and services, and could lack adequate resources to support our customers on an ongoing basis, any of which could adversely affect our reputation in the market, our ability to successfully implement our business plan and our ability to generate revenue from new or existing customers.
If we fail to retain our key employees, our business would be harmed and we might not be able to implement our business plan successfully.
Given the complex nature of the technology on which our business is based and the speed with which such technology advances, our future success is dependent, in large part, upon our ability to attract and retain highly qualified managerial, technical and sales personnel. In particular, Mark E. Woodward, our Chief Executive Officer, is critical to the management of our business and operations. Competition for talented personnel is intense, and we cannot be certain that we can retain our managerial, technical and sales personnel or that we can attract, assimilate or retain such personnel in the future. Our inability to attract and retain such personnel could have an adverse effect on our business, results of operations and financial condition.
Our growth is dependent upon the continued development of our direct sales force.
We believe that our future growth will depend on the continued development of our direct sales force and their ability to obtain new customers, particularly large enterprise customers, and to manage our existing customer base. Our ability to achieve significant growth in revenue in the future will depend, in large part, on our success in recruiting, training and retaining a sufficient number of direct sales personnel. New sales personnel require significant training and may, in some cases, take more than a year before becoming productive, if at all. If we are unable to hire and develop sufficient numbers of productive direct sales personnel, sales of our software and services will suffer and our growth will be impeded.
If we experience significant fluctuations in our rate of anticipated growth and fail to balance our expenses with our revenue forecasts, our results could be harmed.
Due to our evolving business model and the unpredictability of future general economic and financial market conditions, we may not be able to accurately forecast our rate of growth. We plan our expense levels and investment on estimates of future revenue and future anticipated rate of growth. We may not be able to adjust our spending quickly enough if the addition of new subscriptions or the renewal rate for existing subscriptions falls short of our expectations. As a result, we expect that our revenues, operating results and cash flows may fluctuate significantly on a quarterly basis. We believe that period to period comparisons of our revenues, operating results and cash flows may not be meaningful and should not be relied upon as an indication of future performance.
Interruptions or delays in the services provided by third-party data centers and/or internet service providers could impair the delivery of our solutions and our business could suffer.
We host our solutions in Equinix co-location facilities in Sunnyvale and San Jose, California and a suburb of Chicago, Illinois. Exostar hosts our solutions for the aerospace and defense industry in third party data
18
Table of Contents
centers and with third-party internet service providers outside of Washington, D.C. All of our solutions reside on hardware owned or leased and operated by us and Exostar in these locations. Our operations depend on the protection of the equipment and information we store in these third-party data centers and which third-party internet service providers transmit against damage or service interruptions that may be caused by fire, flood, severe storm, earthquake, power loss, telecommunications failures, unauthorized intrusion, computer viruses and disabling devices, natural disasters, war, criminal act, military action, terrorist attack and other similar events beyond our control. A prolonged service disruption affecting our solutions for any of the foregoing reasons could damage our reputation with current and potential customers, expose us to liability, cause us to lose customers from whom we receive recurring revenue or otherwise adversely affect our business. We may also incur significant costs for using alternative equipment or taking other actions in preparation for, or in reaction to, events that damage the data centers we use.
Our solutions are accessed by a large number of customers often at the same time. As we continue to expand the number of our customers and solutions available to our customers, we may not be able to scale our technology to accommodate the increased capacity requirements, which may result in interruptions or delays in service. In addition, the failure of our third-party data centers or third-party internet service providers to meet our capacity requirements could result in interruptions or delays in access to our solutions or impede our ability to scale our operations. In the event that our data center or third-party internet service provider arrangements are terminated, or there is a lapse of service, interruption of internet service provider connectivity, or damage to such facilities, we could experience interruptions in access to our solutions as well as delays and additional expense in arranging new facilities and services.
We may experience service failures or interruptions due to defects in the software, infrastructure, third-party components or processes that comprise our existing or new solutions, any of which could adversely affect our business.
Our products may contain undetected defects in the software, infrastructure, third-party components or processes that are part of the solutions we provide. If these defects lead to service failures after introduction of a solution or an upgrade to the solution, we could experience delays or lost revenue during the period required to correct the cause of the defects. We cannot be certain that defects will not be found in new solutions or upgraded solutions, resulting in loss of, or delay in, market acceptance, which could have an adverse effect on our business, results of operations and financial condition.
Because customers use our solutions for critical business processes, any defect in our solutions, any disruption to our solutions or any error in execution could cause recurring revenue customers to cancel their contracts with us, prevent potential customers from purchasing our solutions and harm our reputation. Although our contracts with our customers limit our liability to our customers for these defects, disruptions or errors, we nonetheless could be subject to litigation for actual or alleged losses to our customers’ businesses, which may require us to spend significant time and money in litigation or arbitration or to pay significant settlements or damages. We do not currently maintain any warranty reserves. Defending a lawsuit, regardless of its merit, could be costly and divert management’s attention and could cause our business to suffer.
The insurers under our existing liability insurance policy could deny coverage of a future claim that results from an error or defect in our technology or a resulting disruption in our solutions, or our existing liability insurance might not be adequate to cover all of the damages and other costs of such a claim. Moreover, we cannot assure you that our current liability insurance coverage will continue to be available to us on acceptable terms or at all. The successful assertion against us of one or more large claims that exceeds our insurance coverage, or the occurrence of changes in our liability insurance policy, including an increase in premiums or imposition of large deductible or co-insurance requirements, could have an adverse effect on our business, financial condition and results of operations. Even if we succeed in litigation with respect to a claim, we are likely to incur substantial costs and our management’s attention will be diverted from our operations.
19
Table of Contents
We may be required to defer recognition of some of our revenue, which may adversely affect our financial results in any given period.
We may be required to defer recognition of revenue for a significant period of time after entering into an agreement due to a variety of factors, including whether:
| • | The transaction involves both current on-demand software solutions and on-demand software solutions that are under development; |
| • | The customer requires significant modifications, configurations or complex interfaces that could delay delivery or acceptance of our solutions; |
| • | The transaction involves extended payment terms; |
| • | The transaction involves acceptance criteria or other terms that may delay revenue recognition; or |
| • | The transaction involves performance milestones or payment terms that depend upon contingencies. |
Because of these factors and other specific revenue recognition requirements under generally accepted accounting principles in the United States, or GAAP, we must have very precise terms in our contracts in order to recognize revenue when we initially provide access to our software solutions or perform services. Although we strive to enter into agreements that meet the criteria under GAAP for current revenue recognition on delivered elements, our agreements are often subject to negotiation and revision based on the demands of our customers. The final terms of our agreements sometimes result in deferred revenue recognition well after the time of delivery, which may adversely affect our financial results in any given period. In addition, because of prevailing economic conditions, more customers may require extended payment terms, shorter term contracts or alternative licensing arrangements that could reduce the amount of revenue we recognize upon delivery of our solutions and could adversely affect our short-term profitability.
Furthermore, the presentation of our financial results requires us to make estimates and assumptions that may affect revenue recognition. In some instances, we could reasonably use different estimates and assumptions, and changes in estimates are likely to occur from period to period. Accordingly, actual results could differ significantly from our estimates.
If we are unable to substantially utilize our net operating loss carryforward, our financial results will be adversely affected.
As of February 28, 2011, our net operating loss, or NOL, carryforward amounts for U.S. federal income and state tax purposes were approximately $306.7 million and $158.5 million, respectively. Under Section 382 of the Internal Revenue Code, a corporation that undergoes an “ownership change” may be subject to limitations on its ability to utilize its pre-change NOLs to offset future taxable income. In general, an ownership change occurs if the aggregate stock ownership of certain stockholders (generally 5% stockholders, applying certain look-through and aggregation rules) increases by more than 50% over such stockholders’ lowest percentage ownership during the testing period (generally three years). We believe that there was an ownership change in a prior year, which resulted in an annual NOL limitation. In addition, purchases of our common stock in amounts greater than specified levels, which will be beyond our control, could create an additional limitation on our ability to utilize our NOLs for tax purposes in the future. Limitations imposed on our ability to utilize NOLs could cause U.S. federal and state income taxes to be paid earlier than would be paid if such limitations were not in effect and could cause such NOLs to expire unused, in each case reducing or eliminating the benefit of such NOLs. Furthermore, we may not be able to generate sufficient taxable income to utilize our NOLs before they expire. If any of these events occur, we may not derive some or all of the expected benefits from our NOLs. In addition, at the state level there may be periods during which the use of NOLs is suspended or otherwise limited, which would accelerate or may permanently increase state taxes owed.
20
Table of Contents
A failure to protect the integrity and security of our customers’ information could expose us to litigation, materially damage our reputation and harm our business. Furthermore, the unanticipated costs of protecting against such a failure could adversely affect our results of operations.
Our business involves the collection and use of confidential information of our customers and their trading partners. We cannot assure you that our efforts to protect this confidential information will be successful. If any compromise of this information security were to occur, we could be subject to legal claims and government action, experience an adverse effect on our reputation and need to incur significant additional costs to protect against similar information security breaches in the future, each of which could adversely affect our financial condition, results of operations and growth prospects. In addition, because of the critical nature of data security, any perceived breach of our security measures could cause existing or potential customers not to use our solutions and could harm our reputation.
Evolving regulation of the Internet may increase our expenditures related to compliance efforts, which may adversely affect our financial condition.
As Internet commerce continues to evolve, increasing regulation by federal, state or foreign agencies becomes more likely. We are particularly sensitive to these risks because the Internet and cloud computing are critical components of our business model. For example, we believe that increased regulation is likely in the area of data privacy on the Internet, and laws and regulations applying to the solicitation, collection, processing or use of personal or consumer information could affect our customers’ ability to use and share data, potentially reducing demand for solutions accessed via the Internet and restricting our ability to store, process and share data with our clients via the Internet. In addition, taxation of services provided over the Internet or other charges imposed by government agencies or by private organizations for accessing the Internet may be imposed. Any regulation imposing greater fees for Internet use or restricting information exchange over the Internet could result in a decline in the use of the Internet and the viability of Internet-based services, which could harm our business.
If we fail to protect our intellectual property and proprietary rights adequately, our business could be adversely affected.
We believe that proprietary technology is essential to establishing and maintaining our leadership position. We seek to protect our intellectual property through trade secrets, copyrights, confidentiality, non-compete and nondisclosure agreements, patents, trademarks, domain names and other measures, some of which afford only limited protection. We also rely on patent, trademark, trade secret and copyright laws to protect our intellectual property. Despite our efforts to protect our proprietary rights, unauthorized parties may attempt to copy aspects of our technology or to obtain and use information that we regard as proprietary. We cannot assure you that our means of protecting our proprietary rights will be adequate or that our competitors will not independently develop similar or superior technology or design around our intellectual property. In addition, the laws of some foreign countries do not protect our proprietary rights to as great an extent as the laws of the United States. Intellectual property protections may also be unavailable, limited or difficult to enforce in some countries, which could make it easier for competitors to capture market share. Our failure to adequately protect our intellectual property and proprietary rights could adversely affect our business, financial condition and results of operations.
An assertion by a third party that we are infringing its intellectual property could subject us to costly and time-consuming litigation or expensive licenses which could harm our business.
The industries in which we compete are characterized by the existence of a large number of patents, copyrights, trademarks and trade secrets and by frequent litigation based on allegations of infringement or other violations of intellectual property rights. As we seek to extend our solutions, we could be constrained by the intellectual property rights of others. In addition, our customer contracts require us to indemnify our customers against certain liabilities they may incur as a result of our infringement of any third-party intellectual property.
21
Table of Contents
We might not prevail in any intellectual property infringement litigation given the complex technical issues and inherent uncertainties in such litigation. Defending such claims, regardless of their merit, could be time-consuming and distracting to management, result in costly litigation or settlement, cause development delays or require us to enter into royalty or licensing agreements. Furthermore, if our solutions exceed the scope of in-bound licenses or violate any third-party proprietary rights, we could be required to withdraw those solutions from the market, re-develop those solutions or seek to obtain licenses from third parties, which might not be available on reasonable terms or at all. Any efforts to re-develop our solutions, obtain licenses from third parties on favorable terms or license a substitute technology might not be successful and, in any case, might substantially increase our costs and harm our business, financial condition and results of operations. If we were compelled to withdraw any of our solutions from the market, our business, financial condition and results of operations could be harmed.
The use of open source software in our products may expose us to additional risks and harm our intellectual property.
We incorporate open source software into our platform. Given the nature of open source software, third parties might assert copyright and other intellectual property infringement claims against us based on our use of certain open source software programs. The terms of many open source licenses to which we are subject have not been interpreted by U.S. or foreign courts, and there is a risk that those licenses could be construed in a manner that imposes unanticipated conditions or restrictions on our ability to commercialize our solutions. In that event, we could be required to seek licenses from third parties in order to continue offering our solutions, to re-develop our solutions, to discontinue sales of our solutions or to release our proprietary software code under the terms of an open source license, any of which could adversely affect our business.
Some of our products use or incorporate software that is subject to one or more open source licenses. Open source software is typically freely accessible, usable and modifiable. Certain open source software licenses require a user who intends to distribute the open source software as a component of the user’s software to disclose publicly part or all of the source code to the user’s software. In addition, certain open source software licenses require the user of such software to make any derivative works of the open source code available to others on unfavorable terms or at no cost. This can subject previously proprietary software to open source license terms.
While we monitor the use of all open source software in our products, processes and technology and try to ensure that no open source software is used in such a way as to require us to disclose the source code to the related product or solution when we do not wish to do so, such use may have inadvertently occurred in deploying our proprietary solutions. Additionally, if a third-party software provider has incorporated certain types of open source software into software we license from such third party for our products and solutions, we could, under certain circumstances, be required to disclose the source code to our products and solutions. This could harm our intellectual property position and have a material adverse effect on our business, results of operations and financial condition.
Our strategy includes pursuing acquisitions and our potential inability to successfully integrate newly-acquired companies or businesses may adversely affect our financial results.
We believe part of our growth will be driven by acquisitions of other companies or their businesses. Any acquisitions we complete will give rise to risks, including:
| • | Incurring significantly higher than anticipated capital expenditures and operating expenses; |
| • | Failing to assimilate the operations and personnel or failing to retain the key personnel of the acquired company or business; |
| • | Failing to integrate the acquired technologies, or incurring significant expense to integrate acquired technologies into our solutions; |
22
Table of Contents
| • | Disrupting our ongoing business; |
| • | Incurring significant accounting charges; |
| • | Dissipating our management resources; |
| • | Failing to maintain uniform standards, controls and policies; |
| • | Impairing relationships with employees and customers as a result of changes in management; |
| • | Finding that the acquired company, asset or technology does not further our business strategy, that we overpaid for the company, asset or technology or that we may be required to write off acquired assets or investments partially or entirely; |
| • | Not realizing the expected synergies of the transaction; |
| • | Facing delays in customer purchases due to difficulty in retaining customers of acquired businesses; |
| • | Exposure to unforeseen liabilities and contingencies that were not identified prior to acquiring the company; and |
| • | An inability to generate sufficient revenue from acquisitions to offset the associated acquisition costs. |
Fully integrating an acquired company or business into our operations may take a significant amount of time. We cannot assure you that we will be successful in overcoming these risks or any other problems encountered with acquisitions. To the extent we do not successfully avoid or overcome the risks or problems related to any acquisitions, our results of operations and financial condition could be adversely affected. Acquisitions also could impact our financial position and capital needs, and could cause substantial fluctuations in our quarterly and annual results of operations. Acquisitions could include significant goodwill and intangible assets, which may result in future impairment charges that would reduce our stated earnings. We may incur significant costs in our efforts to engage in strategic transactions and these expenditures may not result in successful acquisitions.
Future acquisitions of technologies or companies, which are paid for partially or entirely through the issuance of stock or stock rights, could dilute the ownership of our existing stockholders.
We expect that the consideration we might pay for any future acquisitions of companies or technologies could include stock, rights to purchase stock, cash or some combination of the foregoing. If we issue stock or rights to purchase stock in connection with future acquisitions, net income (loss) per share and then-existing holders of our common stock may experience dilution.
Mergers or other strategic transactions involving our competitors could weaken our competitive position, which could harm our results of operations.
Our industry is highly fragmented, and we believe it is likely that some of our existing competitors will consolidate or will be acquired. In addition, some of our competitors may enter into new alliances with each other or may establish or strengthen cooperative relationships with systems integrators, third-party consulting firms or other parties. Any such consolidation, acquisition, alliance or cooperative relationship could lead to pricing pressure and our loss of market share and could result in a competitor with greater financial, technical, marketing, service and other resources, all of which could have a material adverse effect on our business, results of operations and financial condition.
23
Table of Contents
We may not receive significant revenue as a result of our current research and development efforts.
We have made and expect to continue to make significant investments in research and development and related product opportunities. In the year ended February 28, 2011 and the nine months ended November 30, 2011, we spent $11.5 million and $9.9 million on research and development expenses, respectively. High levels of expenditures for research and development could adversely affect our results of operations if not offset by corresponding future revenue increases. We believe that we must continue to dedicate a significant amount of resources to our research and development efforts to maintain our competitive position. However, it is difficult to estimate when, if ever, we will receive significant revenue as a result of these investments.
We will incur increased costs and demands upon management as a result of complying with the laws and regulations affecting public companies, which could adversely affect our results of operations and our ability to attract and retain qualified executives and board members.
As a public company, we will incur legal, accounting and other expenses that we did not incur as a private company, including costs associated with public company reporting and corporate governance requirements. These requirements include compliance with Section 404 and other provisions of the Sarbanes-Oxley Act of 2002, the Dodd-Frank Wall Street Reform and Consumer Protection Act, or the Dodd-Frank Act, as well as rules implemented by the Securities and Exchange Commission, or SEC, and other applicable securities or exchange-related rules and regulations. In addition, our management team will also have to adapt to the requirements of being a public company. We expect complying with these rules and regulations will substantially increase our legal and financial compliance costs and to make some activities more time-consuming and costly.
The increased costs associated with operating as a public company will decrease our net income or increase our net loss, and may require us to reduce costs in other areas of our business or increase the prices of our products or services. Additionally, if these requirements divert our management’s attention from other business concerns, our results of operations could be adversely effected.
As a public company, we also expect that it may be more difficult and more expensive for us to obtain director and officer liability insurance, and we may be required to accept reduced policy limits and coverage or incur substantially higher costs to obtain the same or similar coverage. As a result, it may be more difficult for us to attract and retain qualified individuals to serve on our board of directors or as our executive officers.
We rely significantly on recurring revenue, which may decline or fail to be renewed, and our future results of operations could be harmed.
Our revenue from subscriptions to our software and software-related support services accounted for approximately 71.0% of our total revenue for the year ended February 28, 2011. Revenue from our subscriptions is recognized over the contractual term of the license, which is typically three years, and is generally recurring in nature. Sales of new or recurring subscriptions and software-related support service contracts and renewals after expiration of the initial term may decline or fluctuate as a result of a number of factors, including end customers’ level of satisfaction with our software solutions, the prices of our software solutions, the prices of products and services offered by our competitors or reductions in our customers’ spending levels. A software industry-wide movement towards shorter contractual license terms led by other SaaS providers, which competitive pressures may compel us to follow, could lead to increased volatility and diminished visibility into future recurring revenue. If our sales of new or recurring subscriptions and software related support service contracts decline, our revenue and revenue growth may decline, and our business will suffer.
Because we recognize revenue from subscriptions and support services over the term of the relevant service period, downturns or upturns in sales are not immediately fully reflected in our results of operations.
We recognize recurring subscriptions and software-related support services revenue monthly over the term of the relevant service period, which is typically three years. As a result, much of the revenue we report
24
Table of Contents
each quarter is the recognition of deferred revenue from recurring subscriptions and software-related support service contracts entered into during previous quarters. Consequently, a decline in new or renewed recurring subscriptions and software-related support service contracts in any one quarter will not be fully reflected in revenue in that quarter, but will negatively affect our revenue in future quarters. Accordingly, the effect of significant downturns in new or renewed sales of our recurring subscriptions and software-related support services are not reflected in full in our results of operations until future periods. Revenue from our recurring subscriptions and software-related support services also makes it difficult for us to rapidly increase our revenue through additional service sales in any period, as revenue from new and renewal software-related service contracts must be recognized over the applicable service period.
Our failure to raise additional capital or generate cash flows necessary to expand our operations and invest in new technologies in the future could reduce our ability to compete successfully and adversely affect our results of operations.
We may need to raise additional funds, and we may not be able to obtain additional debt or equity financing on favorable terms, if at all. If we raise additional equity financing, our security holders may experience significant dilution of their ownership interests and the value of shares of our common stock could decline. If we engage in debt financing, we may be required to accept terms that restrict our ability to incur additional indebtedness, force us to maintain specified liquidity or other ratios or restrict our ability to pay dividends or make acquisitions. If we need additional capital and cannot raise it on acceptable terms, if at all, we may not be able to, among other things:
| • | Develop and enhance our solutions; |
| • | Continue to expand our technology development, sales and marketing organizations; |
| • | Hire, train and retain employees; |
| • | Respond to competitive pressures or unanticipated working capital requirements; or |
| • | Pursue acquisition opportunities. |
Our inability to do any of the foregoing could reduce our ability to compete successfully and adversely affect our results of operations.
Because our long-term success depends, in part, on our ability to expand the sales of our solutions to customers located outside of the United States, our business will be susceptible to risks associated with international operations.
We have limited experience operating in foreign jurisdictions. Conducting and launching operations on an international scale requires close coordination of activities across multiple jurisdictions and time zones and consumes significant management resources. Customers in countries outside of the United States accounted for 36.9% of our revenue for the fiscal year ended February 28, 2011. Our limited experience in operating our business outside of the United States increases the risk that our current and any future international expansion efforts will not be successful. Conducting international operations subjects us to new risks that, generally, we have not faced in the United States, including:
| • | Fluctuations in currency exchange rates; |
| • | Unexpected changes in foreign regulatory requirements; |
| • | Longer accounts receivable payment cycles and difficulties in collecting accounts receivable; |
| • | Difficulties in managing and staffing international operations, including differences in labor laws; |
25
Table of Contents
| • | Potentially adverse tax consequences, including the complexities of foreign value added tax systems and restrictions on the repatriation of earnings; |
| • | Localization of our solutions, including translation into foreign languages and associated expenses; |
| • | The burdens of complying with a wide variety of foreign laws and different legal standards, including laws and regulations related to privacy and data security; |
| • | Requirements for regional hosting of customer solutions and data, which may require additional capital expenditures necessary to set up new data centers; |
| • | Increased financial accounting and reporting burdens and complexities; |
| • | Political, social and economic instability abroad, terrorist attacks and security concerns in general; and |
| • | Reduced or varied protection for intellectual property rights in some countries. |
The occurrence of any one of these risks could negatively affect our international business and, consequently, our results of operations generally. Additionally, operating in international markets also requires significant management attention and financial resources. We cannot be certain that the investment and additional resources required in establishing, acquiring or integrating operations in other countries will produce desired levels of revenue or profitability.
From time to time, we may become defendants in legal proceedings as to which we are unable to assess our exposure and which could become significant liabilities in the event of an adverse judgment.
We may become defendants in legal proceedings from time to time. Companies in our industry have been subject to claims related to patent infringement and product liability, as well as contract and employment-related claims. We may not be able to accurately assess the risk related to these suits, and we may be unable to accurately assess our level of exposure.
We are required to comply with U.S. export control laws and regulations. Noncompliance with those laws and regulations could have a material adverse effect on our business.
Our solutions are subject to U.S. export controls and we incorporate encryption technology into certain of our solutions. These encrypted solutions and the underlying technology may be exported outside the United States only with the required export authorizations, including by license, a license exception or other appropriate government authorizations, including the filing of an encryption registration. U.S. export control laws and economic sanctions prohibit the shipment of certain solutions and services to U.S. embargoed or sanctioned countries, governments and persons and complying with export control and sanctions regulations for a particular sale may be time-consuming and may result in the delay or loss of sales opportunities. Penalties for violations of the U.S. export control laws include fines of up to $250,000 or twice the value of the transaction, whichever is greater, per violation, the possible loss of export or import privileges and criminal action for knowing or willful violations.
Further, if our operating partners fail to obtain appropriate import, export or re-export licenses or permits, we may also be adversely affected, become the subject of government investigations or penalties, and incur reputational harm.
In addition, various countries regulate the import of certain encryption technology, including import permitting and licensing requirements, and have enacted laws that could limit our ability to sell our solutions or could limit our customers’ ability to implement our solutions in those countries. Changes in our solutions or changes in export and import regulations may create delays in the introduction of our solutions in international markets, prevent our customers with international operations from deploying our solutions globally or, in some
26
Table of Contents
cases, prevent the export or import of our solutions to certain countries, governments or persons altogether. Any change in export or import regulations, economic sanctions or related legislation, shift in the enforcement or scope of existing regulations, or change in the countries, governments, persons or technologies targeted by such regulations, could result in decreased use of our solutions by, or in our decreased ability to export or sell our solutions to, existing or potential customers with international operations. Any decreased use of our solutions or limitation on our ability to export or sell our solutions would likely adversely affect our business, financial condition and results of operations.
Our facilities in California are located near known earthquake faults, and the occurrence of an earthquake or other catastrophic disaster could cause damage to our facilities and equipment, which could negatively impact our operations.
Our facilities in the San Francisco Bay Area are located near known earthquake fault zones and are vulnerable to damage from earthquakes. We are also vulnerable to damage from other types of disasters, including fire, floods, power loss, communications failures and similar events. If any disaster were to occur, our ability to operate our business at our facilities would be seriously, or potentially completely, impaired. The insurance we maintain may not be adequate to cover our losses resulting from disasters or other business interruptions. Accordingly, an earthquake or other disaster could materially and adversely harm our ability to conduct business.
We may be subject to additional tax liabilities.
We are subject to income, sales, use, value added and other taxes in the United States and other countries in which we conduct business, which such laws and rates vary greatly by jurisdiction. Certain jurisdictions in which we do not collect sales, use, value added or other taxes on our sales may assert that such taxes are applicable, which could result in tax assessments, penalties and interest, and we may be required to collect such taxes in the future. Significant judgment is required in determining our worldwide provision for income taxes. These determinations are highly complex and require detailed analysis of the available information and applicable statutes and regulatory materials. In the ordinary course of our business, there are many transactions and calculations where the ultimate tax determination is uncertain. Although we believe our tax estimates are reasonable, the final determination of tax audits and any related litigation could be materially different from our historical tax practices, provisions and accruals. If we receive an adverse ruling as a result of an audit, or we unilaterally determine that we have misinterpreted provisions of the tax regulations to which we are subject, there could be a material effect on our tax provision, net income or cash flows in the period or periods for which that determination is made. In addition, liabilities associated with taxes are often subject to an extended or indefinite statute of limitations period. Therefore, we may be subject to additional tax liability (including penalties and interest) for a particular year for extended periods of time.
Changes in existing financial accounting standards or practices, or taxation rules or practices, may adversely affect our results of operations.
Changes in existing accounting or taxation rules or practices, new accounting pronouncements or taxation rules, or varying interpretations of current accounting pronouncements or taxation practice could have a significant adverse effect on our results of operations or the manner in which we conduct our business. Further, such changes could potentially affect our reporting of transactions completed before such changes are effective.
Risks Relating to Owning Our Common Stock and this Offering
Our share price may be volatile and you may be unable to sell your shares at or above the offering price.
The initial public offering price for our shares was determined by negotiations between us and representatives of the underwriters and may not be indicative of prices that will prevail in the trading market. The market price of our common stock could be subject to wide fluctuations in response to many risk factors listed in this section, and others beyond our control, including:
| • | Actual or anticipated fluctuations in our financial condition and results of operations; |
27
Table of Contents
| • | Overall conditions in our industry and market; |
| • | Addition or loss of significant customers; |
| • | Changes in laws or regulations applicable to our products; |
| • | Actual or anticipated changes in our growth rate relative to our competitors; |
| • | Announcements by us or our competitors of significant acquisitions, strategic partnerships, joint ventures or capital commitments; |
| • | Additions or departures of key personnel; |
| • | Competition from existing products or new products that may emerge; |
| • | Issuance of new or updated research or reports by securities analysts; |
| • | Fluctuations in the valuation of companies perceived by investors to be comparable to us; |
| • | Disputes or other developments related to proprietary rights, including patents, litigation matters and our ability to obtain intellectual property protection for our technologies; |
| • | Sales of our common stock by us or our stockholders; |
| • | Share price and volume fluctuations attributable to inconsistent trading volume levels of our shares; |
| • | The expiration of contractual lock-up agreements with our executive officers, directors and stockholders; and |
| • | General economic and market conditions. |
Furthermore, the stock markets have experienced extreme price and volume fluctuations that have affected and continue to affect the market prices of equity securities of many companies. These fluctuations often have been unrelated or disproportionate to the operating performance of those companies. These broad market and industry fluctuations, as well as general economic, political and market conditions such as recessions, interest rate changes or international currency fluctuations, may negatively impact the market price of our common stock. If the market price of our common stock after this offering does not exceed the initial public offering price, you may not realize any return on your investment in us and may lose some or all of your investment. In the past, companies that have experienced volatility in the market price of their stock have been subject to securities class action litigation. We may be the target of this type of litigation in the future. Securities litigation against us could result in substantial costs and divert our management’s attention from other business concerns, which could seriously harm our business.
No public market for our common stock currently exists and an active trading market may not develop or be sustained following this offering.
Prior to this offering, there has been no public market for our common stock. An active trading market may not develop following the completion of this offering or, if developed, may not be sustained. The lack of an active market may impair your ability to sell your shares at the time you wish to sell them or at a price that you consider reasonable. The lack of an active market may also reduce the fair market value of your shares. An inactive market may also impair our ability to raise capital to continue to fund operations by selling shares and may impair our ability to acquire other companies or technologies by using our shares as consideration.
28
Table of Contents
If securities or industry analysts do not publish research or reports about our business, or publish negative reports about our business, our share price and trading volume could decline.
The trading market for our common stock will depend on the research and reports that securities or industry analysts publish about us or our business. We do not have any control over these analysts. If one or more of the analysts who cover us downgrade our shares or change their opinion of our shares, our share price would likely decline. If one or more of these analysts cease coverage of our company or fail to regularly publish reports on us, we could lose visibility in the financial markets, which could cause our share price or trading volume to decline.
Future sales of our common stock in the public market could cause our share price to fall.
Sales of a substantial number of shares of our common stock in the public market after this offering, or the perception that these sales might occur, could depress the market price of our common stock and could impair our ability to raise capital through the sale of additional equity securities. Based on the number of shares of common stock outstanding as of , 2012, upon the closing of this offering, we will have shares of common stock outstanding, assuming no exercise of outstanding options or the underwriters’ over-allotment option.
All of the common stock sold in this offering will be freely tradable without restrictions or further registration under the Securities Act of 1933, as amended, or the Securities Act, except for any shares held by our affiliates as defined in Rule 144 under the Securities Act. The remaining shares of common stock outstanding after this offering, based on shares outstanding as of , 2012, will be restricted as a result of securities laws, lock-up agreements or other contractual restrictions that restrict transfers for at least 180 days after the date of this prospectus, subject to certain extensions.
The underwriters may, in their sole discretion, release all or some portion of the shares subject to lock-up agreements with the underwriters prior to expiration of the lock-up period. See the section titled “Shares Eligible for Future Sale.”
The holders of 320,932,465 shares of common stock, or 43.7% based on shares outstanding as of November 30, 2011, will be entitled to rights with respect to registration of such shares under the Securities Act pursuant to a registration rights agreement between such holders and us. See the section titled “Description of Capital Stock—Registration Rights.” If such holders, by exercising their registration rights, sell a large number of shares, the market price for our common stock could be adversely affected. If we file a registration statement for the purpose of selling additional shares to raise capital and are required to include shares held by these holders pursuant to the exercise of their registration rights, our ability to raise capital may be impaired. We intend to file a registration statement on Form S-8 under the Securities Act to register shares for issuance under our 2003 Stock Plan and 2012 Equity Compensation Plan. Our 2012 Equity Compensation Plan provides for automatic increases in the shares reserved for issuance under the plan which could result in additional dilution to our stockholders. Once we register these shares, they can be freely sold in the public market upon issuance and vesting, subject to a lock-up period of at least 180 days and other restrictions provided under the terms of the applicable plan and/or the option agreements entered into with option holders.
As a result of becoming a public company, we will be obligated to develop and maintain a system of effective internal controls over financial reporting. We may not complete our analysis of our internal control over financial reporting in a timely manner, or these internal controls may not be determined to be effective, which may adversely affect investor confidence in our company and, as a result, the value of our common stock.
We will be required, pursuant to Section 404 of the Sarbanes-Oxley Act of 2002, to furnish a report by management on, among other things, the effectiveness of our internal control over financial reporting for the first
29
Table of Contents
fiscal year beginning after the effective date of this offering. This assessment will need to include disclosure of any material weaknesses identified by our management in our internal control over financial reporting, as well as a statement that our auditors have issued an attestation report on effectiveness of our internal controls.
We are in the very early stages of the costly and challenging process of compiling the system and processing documentation necessary to perform the evaluation needed to comply with Section 404. We may not be able to remediate future material weaknesses, or to complete our evaluation, testing and any required remediation in a timely fashion. During the evaluation and testing process, if we identify one or more material weaknesses in our internal control over financial reporting, we will be unable to assert that our internal controls are effective. If we are unable to assert that our internal control over financial reporting is effective, or if our auditors are unable to express an opinion on the effectiveness of our internal controls, we could lose investor confidence in the accuracy and completeness of our financial reports, which would have a material adverse effect on the price of our common stock.
Our management team may invest or spend the proceeds of this offering in ways with which you may not agree or in ways which may not yield a return.
The net proceeds from this offering may be used for working capital purposes and for other general corporate purposes, including the research and development of new products, sales and marketing activities, to finance acquisition opportunities and other capital expenditures. Although we may also use a portion of the net proceeds to acquire complementary products, services, technologies or businesses, we have no current understandings, agreements or commitments to do so at this time.
Our management will have considerable discretion in the application of the net proceeds, and you will not have the opportunity, as part of your investment decision, to assess whether the proceeds are being used appropriately. The net proceeds may be used for corporate purposes that do not improve our results of operations or increase our market value.
Purchasers in this offering will experience immediate and substantial dilution in the book value of their investment.
The anticipated initial public offering price of our common stock is substantially higher than the net tangible book value per share of our outstanding common stock immediately after this offering. Therefore, if you purchase our common stock in this offering, you will incur immediate dilution of $ in net tangible book value per share from the price you paid. In addition, following this offering, purchasers in this offering will have contributed % of the total consideration paid by our stockholders to purchase shares of common stock, in exchange for acquiring approximately % of our total outstanding shares as of after giving effect to this offering. In addition, if outstanding options or warrants to purchase our common stock are exercised, you will experience additional dilution.
Our directors, executive officers and principal stockholders will continue to have substantial control over us after this offering and could delay or prevent a change in corporate control.
After this offering, our directors, executive officers and holders of more than 5% of our common stock, together with their affiliates, will beneficially own, in the aggregate, approximately % of our outstanding common stock, assuming no exercise of the underwriters’ option to purchase additional shares of our common stock in this offering. As a result, these stockholders, acting together, would have the ability to control the outcome of matters submitted to our stockholders for approval, including the election of directors and any merger, consolidation or sale of all or substantially all of our assets. In addition, these stockholders, acting together, would have the ability to control the management and affairs of our company. Accordingly, this concentration of ownership might harm the market price of our common stock by:
| • | Delaying, deferring or preventing a change in corporate control; |
| • | Impeding a merger, consolidation, takeover or other business combination involving us; or |
30
Table of Contents
| • | Discouraging a potential acquirer from making a tender offer or otherwise attempting to obtain control of us. |
Anti-takeover provisions in our charter documents and under Delaware law could make an acquisition of us, which may be beneficial to our stockholders, more difficult and may prevent attempts by our stockholders to replace or remove our current management and limit the market price of our common stock.
Provisions in our certificate of incorporation and bylaws, as amended and restated upon the closing of this offering, may have the effect of delaying or preventing a change of control or changes in our management. Our amended and restated certificate of incorporation and amended and restated bylaws, which will become effective upon the closing of this offering, include provisions that:
| • | Authorize our board of directors to issue, without further action by the stockholders up to shares of undesignated preferred stock; |
| • | Require that any action to be taken by our stockholders be effected at a duly called annual or special meeting and not by written consent; |
| • | Specify that special meetings of our stockholders can be called only by our board of directors, the Chairman of the Board, the Chief Executive Officer or the President; |
| • | Establish an advance notice procedure for stockholder approvals to be brought before an annual meeting of our stockholders, including proposed nominations of persons for election to our board of directors; |
| • | Provide that directors may be removed only for cause; |
| • | Provide that vacancies on our board of directors may be filled only by a majority of directors then in office, even though less than a quorum; |
| • | Establish that our board of directors is divided into three classes — Class I, Class II and Class III — with each class serving staggered terms; and |
| • | Require a super-majority of votes to amend certain of the above-mentioned provisions. |
These provisions, alone or together, could delay or prevent hostile takeovers and changes in control. These provisions may also frustrate or prevent any attempts by our stockholders to replace or remove our current management by making it more difficult for stockholders to replace members of our board of directors, which is responsible for appointing the members of our management.
As a Delaware corporation, we are also subject to provisions of Delaware law, including Section 203 of the Delaware General Corporation law, which prevents some stockholders holding more than 15% of our outstanding common stock from engaging in certain business combinations without approval of the holders of substantially all of our outstanding common stock.
Any provision of our certificate of incorporation or bylaws or Delaware law that has the effect of delaying or deterring a change of control could limit the opportunity for our stockholders to receive a premium for their shares of our common stock, and could also affect the price that some investors are willing to pay for our common stock.
We do not intend to pay dividends for the foreseeable future.
We have never declared or paid any cash dividends on our common stock and do not intend to pay any cash dividends in the foreseeable future. We anticipate that we will retain all of our future earnings for use in the
31
Table of Contents
operation of our business and for general corporate purposes. Any determination to pay dividends in the future will be at the discretion of our board of directors. Accordingly, investors must rely on sales of their common stock after price appreciation, which may never occur, as the only way to realize any future gains on their investments.
32
Table of Contents
SPECIAL NOTE REGARDING FORWARD-LOOKING STATEMENTS AND INDUSTRY DATA
This prospectus contains forward-looking statements that are based on our management’s beliefs and assumptions and on information currently available to our management. The forward-looking statements are contained principally in, but not limited to, the “Prospectus Summary,” “Risk Factors,” “Management’s Discussion and Analysis of Financial Condition and Results of Operations,” “Business” and “Executive Compensation.” Forward-looking statements include all statements that are not historical facts and can be identified by terms such as “anticipates,” “believes,” “could,” “seeks,” “estimates,” “expects,” “intends,” “may,” “plans,” “potential,” “predicts, “projects,” “should,” “will,” “would” or similar expressions and the negatives of those terms. Forward-looking statements include, but are not limited to, statements about:
| • | Our growth strategy; |
| • | Our plans for future products; |
| • | Our operating results; |
| • | Our ability to anticipate future market demands and future needs of our customers; |
| • | Our customer concentration; |
| • | Our ability to effectively manage our growth; |
| • | Our expectations regarding the use of proceeds; |
| • | Our expectations regarding our expenses, sales and operations; |
| • | Our anticipated trends and challenges in the markets in which we operate; |
| • | Our ability to successfully enter new markets and manage our international expansion; and |
| • | Our intellectual property. |
Forward-looking statements involve known and unknown risks, uncertainties and other factors that may cause our actual results, performance or achievements to be materially different from any future results, performance or achievements expressed or implied by the forward-looking statements. We discuss these risks in greater detail in “Risk Factors” and elsewhere in this prospectus. Given these uncertainties, you should not place undue reliance on these forward-looking statements. Also, forward-looking statements represent our management’s beliefs and assumptions only as of the date of this prospectus. You should read this prospectus and the documents that we have filed as exhibits to the registration statement, of which this prospectus is a part, completely and with the understanding that our actual future results may be materially different from what we expect.
Except as required by law, we assume no obligation to update these forward-looking statements publicly, or to update the reasons actual results could differ materially from those anticipated in these forward-looking statements, even if new information becomes available in the future.
This prospectus also contains estimates and other information concerning our industry, including market size and growth rates, that are based on industry publications, surveys and forecasts, including those generated by Gartner, Inc., or Gartner. This information involves a number of assumptions and limitations, and you are cautioned not to give undue weight to these estimates. These industry publications, surveys and forecasts generally indicate that their information has been obtained from sources believed to be reliable. The industry in which we operate is subject to a high degree of uncertainty and risk due to variety of factors, including those described in “Risk Factors.”
33
Table of Contents
Each of the Gartner publications referenced herein, Forecast: Enterprise Software Markets, Worldwide, 2008-2015, 4Q11 Update by Colleen Graham, Joanne M. Correia, Fabrizio Biscotti, Matthew Cheung, Ruggero Contu, Alan Dayley, Yanna Dharmasthira, Tom Eid, Chad Eschinger, Bianca Granetto, Hai Hong Swinehart, Sharon Mertz, Chris Pang, Asheesh Raina, Dan Sommer, Bhavish Sood and Laurie Wurster, December 2011, Market Trends: Multienterprise/B2B Infrastructure Market, Worldwide, 2010-2015, 1Q11 Update by Fabrizio Biscotti, Thomas Skybakmoen, Benoit J. Lheureux and Paulo Malinverno, February 2011 and The Gartner Supply Chain Top 25 for 2011 by Debra Hofman, Kevin O’Marah and Carla Elvy, June 2011, speaks as of its original publication date (and not as of the date of this prospectus). The opinions expressed in Gartner publications are not representations of fact, and are subject to change without notice. All statements in this prospectus attributable to Gartner represent our interpretation of data, research opinion or viewpoints published as part of a syndicated subscription service provided by Gartner, and the statements attributable to The Gartner Supply Chain Top 25 for 2011 have not been reviewed by Gartner.
34
Table of Contents
We estimate that the net proceeds from our sale of shares of common stock in this offering at an assumed initial public offering price of $ per share, the midpoint of the price range set forth on the cover page of this prospectus, after deducting estimated underwriting discounts and commissions and estimated offering expenses payable by us, will be approximately $ million, or $ million if the underwriters’ option to purchase additional shares is exercised in full. A $1.00 increase (decrease) in the assumed initial public offering price would increase (decrease) the net proceeds to us from this offering by $ million, assuming the number of shares offered by us, as set forth on the cover page of this prospectus, remains the same and after deducting the estimated underwriting discounts and commissions.
We will not receive any proceeds from the sale of shares of common stock by the selling stockholders although we will bear the costs, other than underwriting discounts and commissions, associated with the sale of these shares.
We intend to use the net proceeds of this offering primarily for general corporate purposes and other operating expenses, including: capital expenditures, expenditures relating to the expansion of our operations; sales and marketing expenses; and general and administrative expenses.
In addition, if appropriate opportunities arise to acquire or invest in complementary businesses, product lines, products or technologies, we may use a portion of the net proceeds for such acquisition or investment. However, we are not currently discussing any such potential acquisition or investment with any third party. We may also use a portion of the net proceeds for repayment of up to $ million of our existing indebtedness as more fully described in “Management’s Discussion and Analysis of Financial Condition and Results—Liquidity and Capital Resources.” The amount and timing of these expenditures will vary depending on a number of factors, including competitive and technological developments and the rate of growth, if any, of our business.
Pending their use, we plan to invest our net proceeds from this offering in short-term, interest-bearing obligations, investment-grade instruments, certificates of deposit or direct or guaranteed obligations of the U.S. government.
We have never declared or paid cash dividends on our common stock. We currently intend to retain all available funds and any future earnings for use in the operation of our business and do not anticipate paying any dividends on our common stock in the foreseeable future. Any future determination to declare dividends will be made at the discretion of our board of directors and will depend on our financial condition, operating results, capital requirements, general business conditions and other factors that our board of directors may deem relevant. In addition, our credit facility prohibits us from declaring or paying cash dividends on our capital stock.
35
Table of Contents
The following table sets forth our cash and cash equivalents and capitalization as of November 30, 2011:
| • | on an actual basis; |
| • | on a pro forma basis to reflect the conversion of all outstanding shares of our convertible preferred stock into 517,002,101 shares of our common stock, which will occur immediately prior to the closing of this offering, and the conversion of warrants to purchase convertible preferred stock into warrants to purchase 6,620,369 shares of common stock, which will occur immediately prior to the closing of this offering, and the filing of our post-offering amended and restated certificate of incorporation, which will occur immediately prior to the closing of this offering; and |
| • | on a pro forma as adjusted basis to reflect the pro forma adjustments described above and our receipt of the net proceeds from our sale of shares of common stock in this offering at an assumed initial public offering price of $ per share, the midpoint of the price range set forth on the cover page of this prospectus, after deducting estimated underwriting discounts and commissions and estimated offering expenses payable by us. |
The information below is illustrative only and our capitalization following the completion of this offering will be adjusted based on the actual initial public offering price and other terms of this offering determined at pricing. You should read this table together with “Management’s Discussion and Analysis of Financial Condition and Results of Operations” and our financial statements and the related notes appearing elsewhere in this prospectus.
| November 30, 2011 | ||||||||
| Actual | Pro Forma | Pro Forma As Adjusted | ||||||
| (Unaudited) (In thousands) | ||||||||
| Cash and cash equivalents |
$ | 10,043 | ||||||
| Current liabilities |
53,812 | |||||||
| Long-term liabilities |
9,332 | |||||||
| Stockholders’ deficit |
||||||||
| Preferred stock, $0.001 par value, Authorized, 612,500,000 shares, issued and outstanding, 483,232,209, shares outstanding, aggregate liquidation preference of $126,913 |
83,491 | |||||||
| Common stock, $0.001 par value. Authorized, 877,000,000 shares issued and outstanding, 209,795,137 shares, 735,526,456 shares issued and outstanding proforma |
210 | |||||||
| Additional paid-in capital |
223,178 | |||||||
| Accumulated other comprehensive income |
3 | |||||||
| Accumulated deficit |
(341,477 | ) | ||||||
|
|
|
|
| |||||
| Total stockholders’ deficit |
(34,595 | ) | ||||||
|
|
|
|
| |||||
| Total capitalization |
$ | 28,549 | ||||||
|
|
|
|
| |||||
36
Table of Contents
The number of shares of our common stock outstanding after the completion of this offering is based on 733,124,343 shares outstanding as of November 30, 2011, and excludes:
| • | 98,566,958 shares of common stock issuable upon the exercise of options outstanding as of November 30, 2011 at a weighted average exercise price of $0.06 per share; |
| • | 6,620,369 shares of common stock issuable upon the conversion of convertible Series BB preferred stock issuable upon the exercise of warrants outstanding as of November 30, 2011 at an exercise price of $0.32 per share; and |
| • | shares reserved for future issuance under our 2012 Equity Compensation Plan, as well as shares originally reserved for issuance under our 2003 Stock Plan, but which may become available for awards under our 2012 Equity Compensation Plan, which plan will become effective in connection with this offering and contains provisions that will automatically increase its share reserve each year, as more fully described in “Executive Compensation-Employee Benefit Plans.” |
A $1.00 increase (decrease) in the assumed initial public offering price of $ per share, the midpoint of the range set forth on the cover page of this prospectus, would increase (decrease) cash and cash equivalents and total stockholders’ equity (deficit) and total capitalization by $ million, assuming that the number of shares offered by us, as set forth on the cover page of this prospectus, remains the same, and after deducting estimated underwriting discounts and commissions and estimated offering expenses payable by us. Each increase of 1.0 million shares in the number of shares offered by us, assuming that the assumed initial public offering price remains the same, would increase cash and cash equivalents and total stockholders’ equity (deficit) by $ million. Similarly, each decrease of 1.0 million shares in the number of shares offered by us, assuming that the assumed initial public offering price remains the same, would decrease cash and cash equivalents and total stockholders’ equity by $ million.
37
Table of Contents
If you invest in our common stock, your interest will be diluted to the extent of the difference between the amount per share paid by purchasers of shares of common stock in this initial public offering and the pro forma as adjusted net tangible book value per share of common stock immediately after this offering.
At November 30, 2011, our net tangible book value was approximately $(34.6) million, or $(0.16) per share of common stock. Net tangible book value per share represents the amount of our total tangible assets less our total liabilities, divided by the shares of common stock outstanding at November 30, 2011. After giving effect to our sale of shares of common stock in this offering at an assumed initial public offering price of $ per share, the midpoint of the price range set forth on the cover page of this prospectus, and after deducting estimated underwriting discounts and commissions and estimated offering expenses payable by us, our pro forma as adjusted net tangible book value at November 30, 2011 would have been $ , or $ per share of common stock. This represents an immediate increase in pro forma as adjusted net tangible book value of $ per share to existing stockholders and an immediate dilution of $ per share to new investors.
The following table illustrates this dilution:
| Assumed initial public offering price per share |
$ | |||||||
| Net tangible book value per share as of November 30, 2011 |
$ | (0.16 | ) | |||||
| Increase per share attributable to this offering |
||||||||
|
|
|
|||||||
| Pro forma as adjusted net tangible book value per share after giving effect to this offering |
||||||||
|
|
|
|||||||
| Net tangible book value dilution per share to investors in this offering |
$ | |||||||
|
|
|
If all our outstanding options had been exercised, the pro forma net tangible book value as of November 30, 2011 would have been $ million, or $ per share, and the pro forma net tangible book value after this offering would have been $ million, or $ per share, causing dilution to new investors of $ per share.
If the underwriters fully exercise their over-allotment option, the pro forma as adjusted net tangible book value per share after giving effect to this offering would be $ per share, and the dilution in pro forma net tangible book value per share to investors in this offering would be $ per share.
The following table summarizes, on a pro forma as adjusted basis as of November 30, 2011, the total number of shares of common stock purchased from us, the total consideration paid to us and the average price per share paid to us by existing stockholders and by new investors purchasing shares in this offering at the assumed initial public offering price of $ per share, the midpoint of the price range set forth on the cover page of this prospectus, before deducting estimated underwriting discounts and commissions and estimated offering expenses payable by us:
| Shares Purchased | Total Consideration | Average Price Per Share |
||||||||||||||||
| Number | Percent | Amount | Percent | |||||||||||||||
| Existing stockholders |
% | $ | % | $ | ||||||||||||||
| New investors |
||||||||||||||||||
|
|
|
|
|
|
|
|
||||||||||||
| Total |
100 | % | $ | 100 | % | $ | ||||||||||||
|
|
|
|
|
|
|
|
|
|
||||||||||
38
Table of Contents
The foregoing calculations are based on 733,124,343 shares of our common stock outstanding as of November 30, 2011, and excludes:
| • | 98,566,958 shares of common stock issuable upon the exercise of options outstanding as of November 30, 2011 at a weighted average exercise price of $0.06 per share; |
| • | 6,620,369 shares of common stock issuable upon the conversion of convertible Series BB preferred stock issuable upon the exercise of warrants outstanding as of November 30, 2011 at an exercise price of $0.32 per share; |
| • | shares reserved for future issuance under our 2012 Equity Compensation Plan, as well as shares originally reserved for issuance under our 2003 Stock Plan, but which may become available for awards under our 2012 Equity Compensation Plan, which plan will become effective in connection with this offering and contains provisions that will automatically increase its share reserve each year, as more fully described in “Executive Compensation-Employee Benefit Plans;” and |
| • | Sales by the selling stockholders in this offering will cause the number of shares owned by the existing stockholders to be reduced by shares or % of the total number of shares of our common stock outstanding upon the closing of the offering. |
A $1.00 increase (decrease) in the assumed initial public offering price of $ per share, the midpoint of the range set forth on the cover page of this prospectus, would increase (decrease) our pro forma as adjusted net tangible book value by $ million, or $ per share, and the pro forma dilution per share to investors in this offering by the $ per share, assuming that the number of shares offered by us, as set forth on the cover page of this prospectus, remains the same, and after deducting estimated underwriting discounts and commissions and estimated offering expenses payable by us. Each increase of 1.0 million shares in the number of shares offered by us would increase our pro forma as adjusted net tangible book value by approximately $ million, or $ per share, and the pro forma dilution to investors in this offering would be $ per share, assuming that the assumed initial public offering price remains the same, and after deducting estimated underwriting discounts and commissions and estimated offering expenses payable by us. Similarly, each decrease of 1.0 million shares in the number of shares offered by us would decrease our pro forma as adjusted net tangible book value by approximately $ million, or $ per share, and the pro forma dilution to investors in this offering would be $ per share, assuming that the assumed initial public offering price remains the same, and after deducting estimated underwriting discounts and commissions and estimated offering expenses payable by us. The pro forma information discussed above is illustrative only and will change based on the actual initial public offering price and other terms of this offering determined at pricing.
39
Table of Contents
SELECTED CONSOLIDATED FINANCIAL DATA
We have derived the selected consolidated statement of operations data for the fiscal years ended February 28, 2009, 2010 and 2011 and selected consolidated balance sheet data as of February 28, 2010 and 2011 from our audited consolidated financial statements and related notes included elsewhere in this prospectus. We have derived the summary unaudited consolidated statement of income data for the nine months ended November 30, 2010 and 2011 and the consolidated balance sheet data as of November 30, 2011 from our unaudited consolidated financial statements included elsewhere in this prospectus. We have derived the statement of income data for the fiscal years ended February 28, 2007 and February 29, 2008 and the balance sheet data as of February 28, 2007, February 29, 2008 and February 28, 2009, from our audited consolidated financial statements not included in this prospectus. Our unaudited selected consolidated financial statements have been prepared on the same basis as the annual consolidated financial statements and include all adjustments, consisting of only normal recurring adjustments, necessary for the fair presentation of these statements in all material respects. The following selected consolidated financial data should be read in conjunction with “Management’s Discussion and Analysis of Financial Condition and Results of Operations” and our consolidated financial statements and related notes included elsewhere in this prospectus. Our historical results are not necessarily indicative of the results to be expected for any future period and the results for any interim period are not necessarily indicative of the results to be expected in the full year.
40
Table of Contents
| Year Ended February 28, | Nine
Months Ended November 30, |
|||||||||||||||||||||||||||
| 2007 | 2008 | 2009 | 2010 | 2011 | 2010 | 2011 | ||||||||||||||||||||||
| (Dollars and shares in thousands, except per share data) | ||||||||||||||||||||||||||||
| Consolidated Statements of Operations Data: |
||||||||||||||||||||||||||||
| Revenue |
||||||||||||||||||||||||||||
| Subscription and support |
$ | N/A | (1) | $ | N/A | (1) | $ | 21,107 | $ | 29,976 | $ | 39,419 | $ | 26,973 | $ | 26,563 | ||||||||||||
| Professional services |
$ | N/A | (1) | $ | N/A | (1) | 16,627 | 14,401 | 16,104 | 10,380 | 16,099 | |||||||||||||||||
|
|
|
|
|
|
|
|
|
|
|
|
|
|
|
|||||||||||||||
| Total revenue |
26,647 | 32,721 | 37,734 | 44,377 | 55,523 | 37,353 | 42,662 | |||||||||||||||||||||
| Cost of revenue |
||||||||||||||||||||||||||||
| Subscription and support |
$ |
N/A |
(1) |
$ | N/A | (1) | 8,885 | 9,269 | 7,531 | 5,774 | 5,599 | |||||||||||||||||
| Professional services |
$ | N/A | (1) | $ | N/A | (1) | 14,685 | 11,493 | 11,774 | 8,764 | 10,224 | |||||||||||||||||
|
|
|
|
|
|
|
|
|
|
|
|
|
|
|
|||||||||||||||
| Total cost of revenue |
19,670 | 22,072 | 23,570 | 20,762 | 19,305 | 14,538 | 15,823 | |||||||||||||||||||||
|
|
|
|
|
|
|
|
|
|
|
|
|
|
|
|||||||||||||||
| Gross margin |
||||||||||||||||||||||||||||
| Subscription and support |
$ | N/A | (1) | $ | N/A | (1) | 12,222 | 20,707 | 31,888 | 21,199 | 20,964 | |||||||||||||||||
| Professional services |
$ | N/A | (1) | $ | N/A | (1) | 1,942 | 2,908 | 4,330 | 1,616 | 5,875 | |||||||||||||||||
|
|
|
|
|
|
|
|
|
|
|
|
|
|
|
|||||||||||||||
| Total gross margin |
6,977 | 10,649 | 14,164 | 23,615 | 36,218 | 22,815 | 26,839 | |||||||||||||||||||||
|
|
|
|
|
|
|
|
|
|
|
|
|
|
|
|||||||||||||||
| Operating expenses: |
||||||||||||||||||||||||||||
| Research and development |
9,261 | 10,412 | 12,943 | 13,077 | 11,463 | 8,474 | 9,880 | |||||||||||||||||||||
| Sales and marketing |
9,044 | 14,012 | 11,792 | 11,421 | 12,756 | 9,027 | 13,161 | |||||||||||||||||||||
| General and administrative |
9,144 | 8,193 | 6,448 | 4,884 | 5,064 | 3,745 | 4,305 | |||||||||||||||||||||
| Restructuring costs |
— | — | 1,146 | — | — | — | — | |||||||||||||||||||||
|
|
|
|
|
|
|
|
|
|
|
|
|
|
|
|||||||||||||||
| Total operating expenses |
27,449 | 32,617 | 32,329 | 29,382 | 29,283 | 21,246 | 27,346 | |||||||||||||||||||||
|
|
|
|
|
|
|
|
|
|
|
|
|
|
|
|||||||||||||||
| Income (loss) from operations |
(20,472 | ) | (21,968 | ) | (18,165 | ) | (5,767 | ) | 6,935 | 1,569 | (507 | ) | ||||||||||||||||
| Interest and other expense, net |
(790 | ) | (886 | ) | (1,618 | ) | (532 | ) | (259 | ) | (219 | ) | (457 | ) | ||||||||||||||
|
|
|
|
|
|
|
|
|
|
|
|
|
|
|
|||||||||||||||
| Income (loss) before income taxes |
(21,262 | ) | (22,854 | ) | (19,783 | ) | (6,299 | ) | 6,676 | 1,350 | (964 | ) | ||||||||||||||||
| Provision for income taxes |
(2 | ) | (190 | ) | (60 | ) | (349 | ) | (33 | ) | — | (122 | ) | |||||||||||||||
|
|
|
|
|
|
|
|
|
|
|
|
|
|
|
|||||||||||||||
| Net income (loss) |
$ | (21,264 | ) | $ | (23,044 | ) | $ | (19,843 | ) | $ | (6,648 | ) | $ | 6,643 | $ | 1,350 | $ | (1,086 | ) | |||||||||
| Undistributed earnings allocated to preferred stockholders |
— | — | — | — | (6,643 | ) | (1,350 | ) | — | |||||||||||||||||||
|
|
|
|
|
|
|
|
|
|
|
|
|
|
|
|||||||||||||||
| Net income (loss) attributable to common stockholders: |
$ | (21,264 | ) | $ | (23,044 | ) | $ | (19,843 | ) | $ | (6,648 | ) | — | — | $ | (1,086 | ) | |||||||||||
|
|
|
|
|
|
|
|
|
|
|
|
|
|
|
|||||||||||||||
| Net income (loss) per share attributable to common stockholders: |
||||||||||||||||||||||||||||
| Basic |
$ | (0.20 | ) | $ | (0.21 | ) | $ | (0.17 | ) | $ | (0.05 | ) | $ | — | $ | — | $ | (0.01 | ) | |||||||||
|
|
|
|
|
|
|
|
|
|
|
|
|
|
|
|||||||||||||||
| Diluted |
$ | (0.20 | ) | $ | (0.21 | ) | $ | (0.17 | ) | $ | (0.05 | ) | $ | — | $ | — | $ | (0.01 | ) | |||||||||
|
|
|
|
|
|
|
|
|
|
|
|
|
|
|
|||||||||||||||
| Weighted average shares used to compute net income (loss) per share attributable to common stockholders: |
||||||||||||||||||||||||||||
| Basic |
106,043 | 108,852 | 115,390 | 147,342 | 202,569 | 199,486 | 205,796 | |||||||||||||||||||||
|
|
|
|
|
|
|
|
|
|
|
|
|
|
|
|||||||||||||||
| Diluted |
106,043 | 108,852 | 115,390 | 147,342 | 202,569 | 199,486 | 205,796 | |||||||||||||||||||||
|
|
|
|
|
|
|
|
|
|
|
|
|
|
|
|||||||||||||||
| Pro forma net income (loss) per share attributable to common stockholders (unaudited) (2): |
||||||||||||||||||||||||||||
| Basic |
$ | 0.01 | $ | — | ||||||||||||||||||||||||
|
|
|
|
|
|||||||||||||||||||||||||
| Diluted |
$ | 0.01 | $ | — | ||||||||||||||||||||||||
|
|
|
|
|
|||||||||||||||||||||||||
| Pro forma weighted average shares used to compute pro forma net income (loss) per share attributable to common stockholders (unaudited): |
||||||||||||||||||||||||||||
| Basic |
726,191 | 729,368 | ||||||||||||||||||||||||||
|
|
|
|
|
|||||||||||||||||||||||||
| Diluted |
759,769 | 729,368 | ||||||||||||||||||||||||||
|
|
|
|
|
|||||||||||||||||||||||||
| Other Financial and Operational Data: |
||||||||||||||||||||||||||||
| Adjusted EBITDA (3) |
$ | (18,271 | ) | $ | (20,316 | ) | $ | (15,163 | ) | $ | (2,999 | ) | $ | 9,371 | $ | 3,320 | $ | 1,053 | ||||||||||
|
|
|
|
|
|
|
|
|
|
|
|
|
|
|
|||||||||||||||
| Free cash flow (4) |
$ | (8,489 | ) | $ | (17,799 | ) | $ | (16,453 | ) | $ | (5,325 | ) | $ | (697 | ) | $ | (1,950 | ) | $ | (2,621 | ) | |||||||
|
|
|
|
|
|
|
|
|
|
|
|
|
|
|
|||||||||||||||
| Number of unique registered trading partners (5) |
$ | N/A | (6) | $ | N/A | (6) | 18,117 | 22,529 | 26,440 | 25,554 | 29,599 | |||||||||||||||||
| Number of unique registered users (5) |
$ | N/A | (6) | $ | N/A | (6) | 48,918 | 62,528 | 73,377 | 70,847 | 84,461 | |||||||||||||||||
41
Table of Contents
| (1) | Historically, we presented our revenue as one line item in the statement of operations. Prior to fiscal 2009, we did not for accounting purposes differentiate between subscription and support and professional services revenue. |
| (2) | Pro forma net income (loss) per share has been calculated assuming the conversion of all outstanding shares of our preferred stock as of November 30, 2011 into 517,002,101 shares of common stock and issuance of 6,620,369 shares of common stock upon the conversion of convertible Series BB preferred stock issuable upon the exercise of warrants outstanding as of November 30, 2011 prior to completion of this offering. |
| (3) | We define Adjusted EBITDA as net income (loss) adjusted for interest and other expense, net, provision for income taxes, depreciation and amortization, and stock-based compensation expense. Please see “Adjusted EBITDA” below for more information and for a reconciliation of Adjusted EBITDA to net income (loss), the most directly comparable financial measure calculated and presented in accordance with U.S. generally accepted accounting principles, or GAAP. |
| (4) | We define free cash flow as net cash provided by (used in) operating activities less capital expenditures. Please see “Free Cash Flow” below for more information and for a reconciliation of free cash flow to net cash provided by (used in) operating activities, the most directly comparable financial measure calculated and presented in accordance with GAAP. |
| (5) | We define unique registered trading partners and unique registered users as entities and individuals, respectively, that have used our network as of the balance sheet dates. We view the number of unique registered trading partners and unique registered users as key indicators of the reach of our network and the value our enterprise customers are deriving from out solutions. |
| (6) | The information of unique registered trading partners and unique registered users prior to fiscal 2009 is not available. |
Stock-based compensation included in the consolidated statements of operations data above was as follows:
| Year Ended February 28, | Nine Months Ended November 30, |
|||||||||||||||||||||||||||
| 2007 | 2008 | 2009 | 2010 | 2011 | 2010 | 2011 | ||||||||||||||||||||||
| (In thousands) | ||||||||||||||||||||||||||||
| Cost of revenue |
$ | 33 | $ | 9 | $ | 85 | $ | 106 | $ | 223 | $ | 111 | $ | 122 | ||||||||||||||
| Research and development |
36 | 20 | 58 | 82 | 108 | 61 | 53 | |||||||||||||||||||||
| Sales and marketing |
15 | 16 | 107 | 155 | 154 | 80 | 135 | |||||||||||||||||||||
| General and administrative |
10 | 9 | 92 | 102 | 92 | 59 | 100 | |||||||||||||||||||||
|
|
|
|
|
|
|
|
|
|
|
|
|
|
|
|||||||||||||||
| Total stock-based compensation |
$ | 94 | $ | 54 | $ | 342 | $ | 445 | $ | 577 | $ | 311 | $ | 410 | ||||||||||||||
|
|
|
|
|
|
|
|
|
|
|
|
|
|
|
|||||||||||||||
The following table sets forth our selected consolidated balance sheet data as of the dates presented:
| Year Ended February 28, | As of November 30, 2011 |
|||||||||||||||||||||||
| 2007 | 2008 | 2009 | 2010 | 2011 | ||||||||||||||||||||
| (In thousands) | ||||||||||||||||||||||||
| Consolidated Balance Sheet Data: |
||||||||||||||||||||||||
| Cash and cash equivalents |
$ | 6,190 | $ | 12,727 | $ | 15,645 | $ | 9,530 | $ | 10,060 | $ | 10,043 | ||||||||||||
| Property and equipment, net |
1,995 | 2,864 | 3,149 | 2,720 | 1,889 | 1,444 | ||||||||||||||||||
| Working capital, excluding deferred revenue |
(1,776 | ) | (5,098 | ) | (2,835 | ) | 7,678 | 10,287 | 8,320 | |||||||||||||||
| Total assets |
14,008 | 26,603 | 30,834 | 24,474 | 26,418 | 28,549 | ||||||||||||||||||
| Convertible preferred stock |
44,342 | 54,342 | 73,212 | 83,346 | 83,346 | 83,491 | ||||||||||||||||||
| Total stockholders’ deficit |
$ | (39,221 | ) | $ | (52,069 | ) | $ | (52,134 | ) | $ | (41,827 | ) | $ | (34,157 | ) | $ | (34,595 | ) | ||||||
42
Table of Contents
Key Financial Performance Metrics
We monitor the key financial metrics set forth below as well as revenue, gross profit, gross margin, cash and cash equivalents and available debt capacity, which are discussed in “Management’s Discussion and Analysis of Financial Condition and Results of Operations” to help us evaluate trends, establish budgets, measure the effectiveness of our sales and marketing efforts and assess operational effectiveness and efficiencies.
Adjusted EBITDA
We have included Adjusted EBITDA in this prospectus because it is a key measure used by our management and board of directors to understand and evaluate our core operating performance and trends, to prepare and approve our annual budget and to develop short- and long-term operational plans.
Adjusted EBITDA is defined as net income (loss) adjusted for interest and other expense, net, provision for income taxes, depreciation and amortization, and stock-based compensation expense. Management believes that the use of Adjusted EBITDA provides consistency and comparability with our past financial performance, facilitates period to period comparisons of results of operations, and also facilitates comparisons with other peer companies, many of which use similar non-GAAP financial measures to supplement their GAAP results.
Management believes that it is useful to exclude certain non-cash charges, such as depreciation and amortization, and stock-based compensation, and non-core operational charges, such as interest and other expense, net from Adjusted EBITDA because (1) the amount of such expenses in any specific period may not directly correlate to the underlying performance of our business operations and (2) such expenses can vary significantly between periods as a result of the timing of new stock-based awards, acquisitions or restructurings, as the case may be.
Our use of Adjusted EBITDA has limitations as an analytical tool, and you should not consider it in isolation or as a substitute for analysis of our results as reported under GAAP. Some of these limitations are:
| • | Adjusted EBITDA does not reflect changes in, or cash requirements for, our working capital needs; |
| • | Adjusted EBITDA does not reflect the potentially dilutive impact of equity-based compensation; |
| • | Adjusted EBITDA does not reflect tax payments that may represent a reduction in cash available to us; |
| • | Although depreciation and amortization are non-cash charges, the assets being depreciated and amortized may have to be replaced in the future, and Adjusted EBITDA does not reflect the future need to augment or replace such assets; and |
| • | Other companies, including companies in our industry, may calculate Adjusted EBITDA differently, which reduces its usefulness as a comparative measure. |
43
Table of Contents
Because of these limitations, you should consider Adjusted EBITDA alongside other financial performance measures, including various cash flow metrics, net income (loss) and our other GAAP results. The following table presents a reconciliation of Adjusted EBITDA for each of the periods indicated:
| Year Ended February 28, | Nine Months Ended November 30, |
|||||||||||||||||||||||||||
| 2007 | 2008 | 2009 | 2010 | 2011 | 2010 | 2011 | ||||||||||||||||||||||
| (In thousands) | ||||||||||||||||||||||||||||
| Reconciliation of Adjusted EBITDA: |
||||||||||||||||||||||||||||
| Net income (loss) |
$ | (21,264 | ) | $ | (23,044 | ) | $ | (19,843 | ) | $ | (6,648 | ) | $ | 6,643 | $ | 1,350 | $ | (1,086 | ) | |||||||||
| Interest and other expense, net |
790 | 886 | 1,618 | 532 | 259 | 219 | 457 | |||||||||||||||||||||
| Provision for income taxes |
2 | 190 | 60 | 349 | 33 | — | 122 | |||||||||||||||||||||
| Depreciation and amortization |
2,107 | 1,598 | 2,660 | 2,323 | 1,859 | 1,440 | 1,150 | |||||||||||||||||||||
| Stock-based compensation |
94 | 54 | 342 | 445 | 577 | 311 | 410 | |||||||||||||||||||||
|
|
|
|
|
|
|
|
|
|
|
|
|
|
|
|||||||||||||||
| Adjusted EBITDA |
$ | (18,271 | ) | $ | (20,316 | ) | $ | (15,163 | ) | $ | (2,999 | ) | $ | 9,371 | $ | 3,320 | $ | 1,053 | ||||||||||
|
|
|
|
|
|
|
|
|
|
|
|
|
|
|
|||||||||||||||
Free Cash Flow
Free cash flow is a key measure used in our internal operating reports and allows us to manage the cash available to fund our debt obligations and potential strategic initiatives. Management believes that free cash flow is useful to investors as a supplemental measure to evaluate our business over time.
Free cash flow is defined as net cash provided by (used in) operating activities less capital expenditures. Capital expenditures consist of purchases of property, equipment and software. Management believes that the use of free cash flow provides consistency and comparability with our past financial performance, facilitates period to period comparisons of operating performance and also facilitates comparisons with other peer companies, many of which use similar non-GAAP financial measures to supplement their GAAP results.
Free cash flow should not be considered a substitute for other measures of financial performance reported in accordance with GAAP. There are limitations to using non-GAAP financial measures, including that other companies may calculate these measures differently than we do. Management compensates for the inherent limitations associated with measuring free cash flow through disclosure of such limitations, presentation of our financial statements in accordance with GAAP and reconciliation of free cash flow to the most directly comparable GAAP measure, net cash provided by (used in) operating activities. A reconciliation of net cash provided by (used in) operating activities to free cash flow is presented below:
| Year Ended February 28, | Nine Months Ended November 30, |
|||||||||||||||||||||||||||
| 2007 | 2008 | 2009 | 2010 | 2011 | 2010 | 2011 | ||||||||||||||||||||||
| (In thousands) | ||||||||||||||||||||||||||||
| Free Cash Flow Data: |
||||||||||||||||||||||||||||
| Net cash provided by (used in) operating activities |
$ | (6,583 | ) | $ | (15,331 | ) | $ | (14,607 | ) | $ | (4,401 | ) | $ | 88 | $ | (1,287 | ) | $ | (2,126 | ) | ||||||||
| Capital expenditures |
(1,906 | ) | (2,468 | ) | (1,846 | ) | (924 | ) | (785 | ) | (663 | ) | (495 | ) | ||||||||||||||
|
|
|
|
|
|
|
|
|
|
|
|
|
|
|
|||||||||||||||
| Free Cash Flow |
$ | (8,489 | ) | $ | (17,799 | ) | $ | (16,453 | ) | $ | (5,325 | ) | $ | (697 | ) | $ | (1,950 | ) | $ | (2,621 | ) | |||||||
|
|
|
|
|
|
|
|
|
|
|
|
|
|
|
|||||||||||||||
44
Table of Contents
MANAGEMENT’S DISCUSSION AND ANALYSIS OF FINANCIAL CONDITION
AND RESULTS OF OPERATIONS
You should read the following discussion and analysis of our financial condition and results of operations together with the “Selected Consolidated Financial Data” and the consolidated financial statements and related notes that are included elsewhere in this prospectus. This discussion contains forward-looking statements based upon current expectations that involve risks and uncertainties. Our actual results may differ materially from those anticipated in these forward-looking statements as a result of various factors, including those set forth under “Risk Factors” or in other parts of this prospectus. Our fiscal year end is the last day of February and our fiscal quarters end on May 31, August 31, November 30 and February 28. We refer to our fiscal years ended February 28, 2009, 2010 and 2011 as fiscal 2009, fiscal 2010 and fiscal 2011.
Overview
We are a leading provider of cloud-based, on-demand software solutions delivered on an integrated platform that enables companies to collaborate with their trading partners to procure, manufacture, sell and distribute products more efficiently. Our software applications allow network participants to input, access and share data and execute business processes across internal operating units and external entities in a secure, real-time and cost-effective manner. We refer to the combination of our software applications delivered on our cloud-based platform, the content contributed by our network participants and our enabling services as the E2open Business Network. The E2open Business Network supports key operational business processes of our customers and their trading partners, including supply chain management, procurement, sales and finance functions. These functions enable our customers to share product information, forecasts, inventory positions, sales orders, purchase orders, manufacturing work orders, quality and environmental data, shipments, invoices and payments with their trading partners.
Our agreements with customers are typically three years in length with annual billings in advance. The annual contract value for each customer agreement is largely related to the size of the customer, the number of solutions the customer has purchased, the number of the customer’s unique registered users, and the maturity of our relationship with the customer. Average annual contract value can therefore fluctuate period to period depending upon the size of new customers and the pace at which we up-sell additional solutions and services to existing customers. Additionally, these new and up-sell customer agreements can create significant variability in the aggregate annual contract value of agreements signed in any given fiscal quarter.
We have 239 customers, of which 55 are what we refer to as Enterprise Customers who purchase both on-demand software solutions and network connectivity solutions. The remaining 184 customers purchase our network connectivity solutions directly. For fiscal 2011, Enterprise Customers represented 99.1% of our total revenue. During fiscal 2011, the average annual billing for Enterprise Customers was $1.3 million. Our customers represent a wide range of industries and include many of the leading brand owners in the Fortune 500, among them five of the top eight as designated in the Gartner Supply Chain Top 25. The E2open Business Network is a community comprised of our customers, over 29,000 unique registered trading partners and over 84,000 unique registered users.
During the nine months ended November 30, 2011, we retained 97.7% of our Enterprise Customers and the total dollars billed to these customers was over 100% of the dollars billed to the same customers for the comparable period in the prior year. This reflects our ability to both retain and increase the revenue generated by our existing customers. We believe we have yet to significantly penetrate our customer base and have a significant opportunity to up-sell additional solutions to our existing customers.
We are headquartered in Foster City, California. We continue to expand our operations internationally. We currently generate a portion of our revenue outside the United States, including through our offices in the United Kingdom, Germany, China, Malaysia and Taiwan. For fiscal 2009, 2010 and 2011 and the nine months ended November 30, 2011, the percentage of our revenue generated from customers in the United States was
45
Table of Contents
70.9%, 77.1%, 63.1% and 63.4%, respectively. As part of our growth strategy, we expect the percentage of our revenue generated outside of the United States to continue to increase as we invest in and enter new and emerging markets.
We have achieved strong growth as our network has scaled and as we have expanded our solutions. Our platform originated as a solution to help our customers connect with their manufacturing and distribution partners in their trading network. Next, we introduced solutions for multi-enterprise supply management, and then we introduced solutions to help our customers coordinate multi-enterprise demand management. Our revenue has grown from $37.7 million in fiscal 2009 to $44.4 million in fiscal 2010 to $55.5 million in fiscal 2011, representing a compound annual growth rate of 21.3% over this period. We generated $42.7 million of revenue for the nine months ended November 30, 2011. Additionally, from March 1, 2008 through November 30, 2011, we increased backlog from $24.4 million to $82.6 million, representing a 238.4% increase.
During the period from March 1, 2008 through February 28, 2011, we focused on cost management and increased investments in research and development and operating infrastructure. This resulted in improving gross profits and gross margins from $14.2 million, or 37.5%, for fiscal 2009 to $36.2 million, or 65.2%, for fiscal 2011 and increasing Adjusted EBITDA from $(15.2) million, or (40.2%), of revenue, for fiscal 2009 to $9.4 million, or 16.9%, of revenue for fiscal 2011. As we have improved our business model, we have made additional investments in sales and marketing, research and development, and operating infrastructure. Starting in fiscal 2011 we have increased our investment in sales and marketing including hiring additional quota carrying sales people, and increased the number of Enterprise Customers by 61.8% from 34 to 55 between February 28, 2010 and November 30, 2011. During fiscal 2012, we began to increase our investment in research and development to introduce new solutions, including enhanced analytics and business intelligence, in order to enable our customers to derive greater value from our platform.
Our financial objective is to create sustainable revenue, earnings and cash flow growth over the long term. Consistent with this objective, we intend to continue to invest in the development of our solutions and network. We expect to continue the aggressive expansion of our field sales organization and alliances to market our solutions both in the United States and internationally. We intend to continue making focused investments to upgrade our network infrastructure in order to improve our ability to profitably scale the business.
Sources of Revenue
We generate our revenue primarily from selling access to our cloud-based platform of on-demand software solutions, which we refer to as subscription and support revenue, through our field sales organization and alliance partners. We also generate revenue from professional services by helping our customers deploy, manage and support our software applications. Our customer contracts typically have a term of three years in length and we invoice our customers for subscription and support in advance for annual use of our software solutions.
| Year Ended February 28, | Nine Months Ended November 30, |
|||||||||||||||||||
| 2009 | 2010 | 2011 | 2010 | 2011 | ||||||||||||||||
| (In thousands) | ||||||||||||||||||||
| Revenue by type: |
||||||||||||||||||||
| Subscription and support |
$ | 21,107 | $ | 29,976 | $ | 39,419 | $ | 26,973 | $ | 26,563 | ||||||||||
| Professional services |
16,627 | 14,401 | 16,104 | 10,380 | 16,099 | |||||||||||||||
|
|
|
|
|
|
|
|
|
|
|
|||||||||||
| Total |
$ | 37,734 | $ | 44,377 | $ | 55,523 | $ | 37,353 | $ | 42,662 | ||||||||||
|
|
|
|
|
|
|
|
|
|
|
|||||||||||
| Percentage of revenue by type: |
||||||||||||||||||||
| Subscription and support |
55.9 | % | 67.5 | % | 71.0 | % | 72.2 | % | 62.3 | % | ||||||||||
| Professional services |
44.1 | 32.5 | 29.0 | 27.8 | 37.7 | |||||||||||||||
|
|
|
|
|
|
|
|
|
|
|
|||||||||||
| Total |
100.0 | % | 100.0 | % | 100.0 | % | 100.0 | % | 100.0 | % | ||||||||||
|
|
|
|
|
|
|
|
|
|
|
|||||||||||
46
Table of Contents
Subscription and Support. We offer on-demand software solutions, which enable our customers to have constant access to our solutions without the need to manage and support the software and associated hardware themselves. We house the hardware and software in third-party facilities, and provide our customers with access to the software applications, along with data security and storage, backup, and recovery services. We invoice our customers for subscription and support in advance for annual use of our software solutions.
Professional Services. Professional services revenue is primarily derived from fees for enabling services, such as solution consulting, solution deployment, B2B on-boarding and solution support, that help our customers deploy, manage and support our solutions. These services are sold in conjunction with the sale of our on-demand software solutions or on a standalone basis. We provide professional services both on a fixed fee and a time and materials basis, and invoice our customers in advance, monthly, or upon reaching project milestones.
Our future revenue growth will depend on our ability to increase sales of our existing and new on-demand software solutions and services to new and existing customers. Our revenue generally fluctuates, and we expect it to continue to fluctuate, between periods primarily due to inconsistent timing of sales of our software solutions, revenue recognition requirements and seasonality, among other factors. As a result, transactions that were expected to be recognized in one period may be recognized in a subsequent period, which may materially affect our financial performance in a reporting period.
Key Operating Performance Measures
We regularly review a number of metrics, including the following key metrics, to evaluate our business, measure our performance, identify trends affecting our business, formulate financial projections and make strategic decisions.
Bookings, Billings and Backlog. We generally recognize subscription and support revenue from our customer agreements ratably over the terms of those agreements. For this reason, a significant portion of our revenue in any period will be from customer agreements signed in prior periods rather than new business activity signed during such period. In order to assess our business performance with metrics that more fully reflect current period business activity, we track bookings, billings and backlog. Bookings represent the full value of customer orders or contracts signed during a reporting period. The value of our bookings is impacted by new contracts, renewals, amendments and terminations. Billings represent invoices issued to customers during the period. Backlog represents the cumulative value of bookings existing at the end of the period less the cumulative amount billed to customers. Due to the seasonality of our sales, bookings and backlog fluctuate from quarter to quarter throughout the fiscal year.
Number of Unique Registered Trading Partners. We define the number of unique registered trading partners as the number of distinct trading partner entities connected to the E2open Business Network that use our solutions. We believe the number of unique registered trading partners is a key indicator of the growth of our network and both our and our customers’ ability to receive the benefits of the network effects resulting from such growth. Growth in the number of unique registered trading partners depends, in part, on our ability to successfully develop and market our solutions to our existing customers and companies that have not yet become part of our network. In addition to the growth in number of these entities, we view a large, existing network as providing greater incentive and ease for new customers seeking to join if they share existing trading partners already operating on our system.
47
Table of Contents
From February 28, 2009 to November 30, 2011, the number of unique registered trading partners in the E2open Business Network increased from 18,117 to 29,599, or by over 63.4%. While growth in the number of unique registered trading partners is an important indicator of expected revenue growth, it also informs our management of areas of our business that will require further investment to support such growth.
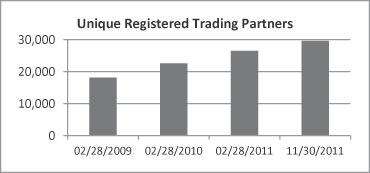
Number of Unique Registered Users. We define the number of unique registered users as individuals within our customers’ organizations and their trading partners who are authorized to use and access our software applications. We view unique registered users as a key indicator of growth and whether we are providing our customers with useful tools and applications, thereby increasing user engagement. Growth in unique registered users will be driven by our business expansion, growth in the number of unique registered trading partners and improvements to features and products available to our customers. From February 28, 2009 to November 30, 2011, the number of unique registered users increased from 48,918 to 84,461, or by 72.7%.
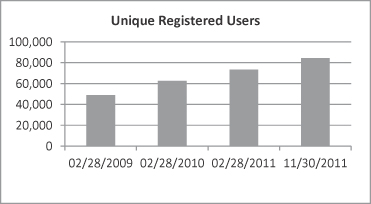
Key Financial Performance Measures
We monitor the key financial metrics set forth below as well as cash and cash equivalents and available debt capacity, which are discussed in “—Liquidity and Capital Resources,” to help us evaluate trends, establish budgets, measure the effectiveness of our sales and marketing efforts and assess operational effectiveness and efficiencies.
| Year Ended February 28, | Nine Months Ended November 30, |
|||||||||||||||||||
| 2009 | 2010 | 2011 | 2010 | 2011 | ||||||||||||||||
| (Dollars in thousands) | ||||||||||||||||||||
| Revenue |
$ | 37,734 | $ | 44,377 | $ | 55,523 | $ | 37,353 | $ | 42,662 | ||||||||||
| Gross profit |
$ | 14,164 | $ | 23,615 | $ | 36,218 | $ | 22,815 | $ | 26,839 | ||||||||||
| Gross margin |
37.5 | % | 53.2 | % | 65.2 | % | 61.1 | % | 62.9 | % | ||||||||||
| Adjusted EBITDA (1) |
$ | (15,163 | ) | $ | (2,999 | ) | $ | 9,371 | $ | 3,320 | $ | 1,053 | ||||||||
| Free cash flow (2) |
$ | (16,453 | ) | $ | (5,325 | ) | $ | (697 | ) | $ | (1,950 | ) | $ | (2,621 | ) | |||||
48
Table of Contents
| (1) | We define Adjusted EBITDA as net income (loss) adjusted for interest and other expense, net, provision for income taxes, depreciation and amortization, and stock-based compensation expense. Please see “Adjusted EBITDA” below for more information and for a reconciliation of Adjusted EBITDA to net income (loss), the most directly comparable financial measure calculated and presented in accordance with U.S. generally accepted accounting principles, or GAAP. |
| (2) | Free cash flow is defined as net cash provided by (used in) operating activities less capital expenditures. Please see “Free Cash Flow” below for more information and for a reconciliation of Free Cash Flow to net cash provided by (used in) operating activities, the most directly comparable financial measure calculated and presented in accordance with GAAP. |
Gross Profit and Gross Margin. Gross profit and gross margin have been and will continue to be affected by a variety of factors, including the average sales price of our products, the mix of solutions sold, the mix of revenue between subscription and support and professional services, and our level of investment in operating infrastructure. Our gross profit and gross margin have improved in each of the last three fiscal years, from $14.2 million, or 37.5%, in fiscal 2009 to $23.6 million, or 53.2%, in fiscal 2010 to $36.2 million, or 65.2%, in fiscal 2011, and we expect them to continue improving year-on-year though at a slower rate. For the nine months ended November 30, 2010, our gross profit and gross margin was $22.8 million, or 61.1%, compared to $26.8 million, or 62.9%, for the nine months ended November 30, 2011. Gross margin on subscription and support revenue was 78.9% and gross margin on professional services revenue was 36.5% for the nine months ended November 30, 2011.
An increase in the proportion of our total revenue generated by sales of subscription and support for our on-demand software applications would increase our overall margins, due to the higher margins on subscription and support revenue compared to professional services. Our gross margin may also fluctuate due to the timing of revenue recognition for our on-demand solutions and services, since our cost of revenue is recognized as incurred whereas revenue on certain arrangements with customers is recognized ratably over the contract term.
Adjusted EBITDA. Adjusted EBITDA is defined as net income (loss) adjusted for interest and other expense, net, provision for income taxes, depreciation and amortization, and stock-based compensation expense. Management believes that the use of Adjusted EBITDA provides consistency and comparability with our past financial performance, facilitates period to period comparisons of operations, and also facilitates comparisons with other peer companies, many of which use similar non-GAAP financial measures to supplement their reported GAAP results.
Management believes that it is useful to exclude certain non-cash charges, such as depreciation and amortization and stock-based compensation, and non-core operational charges, such as other expense, net from Adjusted EBITDA because (1) the amount of such expenses in any specific period may not directly correlate to the underlying performance of our business operations and (2) such expenses can vary significantly between periods as a result of the timing of new stock-based awards, acquisitions or restructurings, as the case may be.
Our Adjusted EBITDA improved from $(15.2) million in fiscal 2009 to $(3.0) million in fiscal 2010 to $9.4 million in fiscal 2011. This growth was a result of the combination of an increase in revenue and a decrease in operating expenses as we improved our business model.
During the nine months ended November 30, 2011, Adjusted EBITDA was $1.1 million compared to $3.3 million over the same period in the prior fiscal year as we increased our investment in research and development and sales and marketing, to drive future revenue growth, which increased expenses and decreased Adjusted EBITDA.
49
Table of Contents
The following table presents a reconciliation of Adjusted EBITDA to net income (loss) for each of the periods indicated:
| Year Ended February 28, | Nine Months Ended November 30, |
|||||||||||||||||||
| 2009 | 2010 | 2011 | 2010 | 2011 | ||||||||||||||||
| (In thousands) | ||||||||||||||||||||
| Reconciliation of Adjusted EBITDA |
||||||||||||||||||||
| Net income (loss) |
$ | (19,843 | ) | $ | (6,648 | ) | $ | 6,643 | $ | 1,350 | $ | (1,086 | ) | |||||||
| Interest and other expense, net |
1,618 | 532 | 259 | 219 | 457 | |||||||||||||||
| Provision for income taxes |
60 | 349 | 33 | — | 122 | |||||||||||||||
| Depreciation and amortization |
2,660 | 2,323 | 1,859 | 1,440 | 1,150 | |||||||||||||||
| Stock-based compensation |
342 | 445 | 577 | 311 | 410 | |||||||||||||||
|
|
|
|
|
|
|
|
|
|
|
|||||||||||
| Adjusted EBITDA |
$ | (15,163 | ) | $ | (2,999 | ) | $ | 9,371 | $ | 3,320 | $ | 1,053 | ||||||||
|
|
|
|
|
|
|
|
|
|
|
|||||||||||
Free Cash Flow. Free cash flow is defined as net cash provided by (used in) operating activities less capital expenditures. Capital expenditures consist of purchases of property, equipment and software. The following table details our calculation (and reconciliation to net cash provided by (used in) operating activities) of free cash flow. Free cash flow is a key measure used in our internal operating reports and allows us to manage the cash available to fund our debt obligations and potential strategic initiatives. Management believes that free cash flow is useful to investors as a supplemental measure to evaluate our business over time. Further, the use of free cash flow provides consistency and comparability with our past financial performance, facilitates period to period comparisons of operations, and also facilitates comparisons with other peer companies, many of which use similar non-GAAP financial measures to supplement their GAAP results.
We have historically made significant investments in product development and in marketing our solutions, resulting in net use of cash in operating activities since inception. However, we significantly improved free cash flow, from $(16.5) million in fiscal 2009 to $(5.3) million in fiscal 2010 to $(0.7) million in fiscal 2011 through increased sales, improved management of our spending and focus on profitability and working capital management.
In the nine months ended November 30, 2011, our free cash flow was $(2.6) million compared to $(2.0) million in the nine months ended November 30, 2010. The change was due to our increased investment in research and development, sales and marketing and deployment capacity. This is consistent with our strategy for fiscal 2012 to expand our product offerings and customer base to help drive future revenue growth.
| Year Ended February 28, | Nine Months Ended November 30, |
|||||||||||||||||||
| 2009 | 2010 | 2011 | 2010 | 2011 | ||||||||||||||||
| (In thousands) | ||||||||||||||||||||
| Free Cash Flow Data: |
||||||||||||||||||||
| Net cash (used in) provided by operating activities |
$ | (14,607 | ) | $ | (4,401 | ) | $ | 88 | $ | (1,287 | ) | $ | (2,126 | ) | ||||||
| Capital expenditures |
(1,846 | ) | (924 | ) | (785 | ) | (663 | ) | (495 | ) | ||||||||||
|
|
|
|
|
|
|
|
|
|
|
|||||||||||
| Free cash flow |
$ | (16,453 | ) | $ | (5,325 | ) | $ | (697 | ) | $ | (1,950 | ) | $ | (2,621 | ) | |||||
|
|
|
|
|
|
|
|
|
|
|
|||||||||||
We expect to continue to incur negative free cash flow for fiscal 2012 as we continue to invest in the development and implementation of new solutions and software applications, and expand our sales and marketing resources in order to further penetrate our market both in the United States and internationally.
Costs and Expenses
Cost of Revenue
Total cost of revenue consists of costs related to third party hosting of our equipment and delivery of our software solutions, software license fees, salaries, and benefits and personnel-related expenses included in our
50
Table of Contents
operations, professional services, and support departments, as well as allocated facilities, information technology and supporting overhead costs. The cost associated with providing professional services is significantly higher as a percentage of revenue than the cost associated with delivering our on-demand software applications due to the labor intensive nature of providing professional services.
Our total cost of revenue has declined in the last three fiscal years as a percentage of revenue, and while we expect absolute cost of revenue to increase as we continue to invest in our business, we expect cost of revenue to increase at a slower rate than that of our total revenue on an annual basis.
Operating Expenses
Operating expenses consist of research and development, sales and marketing, and general and administrative expenses.
Research and Development
Research and development expense consists of salaries, benefits and personnel-related expenses, software development tools, as well as allocated facilities, information technology and supporting overhead costs. We expect to continue to invest in research and development to enhance and expand our existing solutions and develop new solutions and tools for improved deployment and customer support and, consequently, we expect research and development expense to increase in absolute dollars in future periods.
Sales and Marketing
Sales and marketing expense consists of salaries, benefits and personnel-related expenses, including sales commissions, advertising and marketing materials, trade shows and other marketing events, travel and entertainment expenses, as well as an allocation of facilities, information technology and supporting overhead expenses. We intend to continue to invest in sales and marketing to pursue new customers and expand relationships with existing customers. Accordingly, we expect sales and marketing expense to increase in absolute dollars in future periods.
General and Administrative
General and administrative expense consists of salaries, benefits and personnel-related expenses for our finance, accounting, legal, human resources, facilities and information technology employees; third-party professional fees; communication expenses; allocated facilities expenses; and other administrative expenses. We expect that the costs of being a public company, including the costs of compliance with the Sarbanes-Oxley Act of 2002 and other regulations governing public companies, increased directors and officers insurance, and professional and other services, will increase our general and administrative expense in absolute dollars in future periods.
Interest and Other Expense, Net
Interest and other expense, net, consists primarily of interest income on our cash and cash equivalents, interest expense on our credit facilities, notes payable and capital leases, amortization of deferred financing fees, and foreign exchange currency transaction and translation gains and losses.
Provision for Income Taxes
We are subject to tax in the United States as well as other jurisdictions or countries in which we conduct business. Earnings from our non-U.S. activities are subject to local country income tax. Our effective tax rates differ from the statutory rate primarily due to valuation allowances on our deferred taxes, state taxes, foreign taxes, research and development tax credits and tax contingencies.
51
Table of Contents
Results of Operations
The following tables summarize key components of our results of operations for the periods indicated, both in dollars and as a percentage of revenue:
| Year Ended February 28, | Nine Months Ended November 30, |
|||||||||||||||||||
| 2009 | 2010 | 2011 | 2010 | 2011 | ||||||||||||||||
| (In thousands) | ||||||||||||||||||||
| Consolidated Statements of Operations Data: |
||||||||||||||||||||
| Revenue |
||||||||||||||||||||
| Subscription and support |
$ | 21,107 | $ | 29,976 | $ | 39,419 | $ | 26,973 | $ | 26,563 | ||||||||||
| Professional services |
16,627 | 14,401 | 16,104 | 10,380 | 16,099 | |||||||||||||||
|
|
|
|
|
|
|
|
|
|
|
|||||||||||
| Total Revenue |
37,734 | 44,377 | 55,523 | 37,353 | 42,662 | |||||||||||||||
| Cost of revenue |
||||||||||||||||||||
| Subscription and support |
8,885 | 9,269 | 7,531 | 5,774 | 5,599 | |||||||||||||||
| Professional services |
14,685 | 11,493 | 11,774 | 8,764 | 10,224 | |||||||||||||||
|
|
|
|
|
|
|
|
|
|
|
|||||||||||
| Total Cost of revenue |
23,570 | 20,762 | 19,305 | $ | 14,538 | 15,823 | ||||||||||||||
|
|
|
|
|
|
|
|
|
|
|
|||||||||||
| Gross profit |
||||||||||||||||||||
| Subscription and support |
12,222 | 20,707 | 31,888 | 21,199 | 20,964 | |||||||||||||||
| Professional services |
1,942 | 2,908 | 4,330 | 1,616 | 5,875 | |||||||||||||||
|
|
|
|
|
|
|
|
|
|
|
|||||||||||
| Total Gross profit |
14,164 | 23,615 | 36,218 | 22,815 | 26,839 | |||||||||||||||
|
|
|
|
|
|
|
|
|
|
|
|||||||||||
| Operating Expenses: |
||||||||||||||||||||
| Research and development |
12,943 | 13,077 | 11,463 | 8,474 | 9,880 | |||||||||||||||
| Sales and marketing |
11,792 | 11,421 | 12,756 | 9,027 | 13,161 | |||||||||||||||
| General and administrative |
6,448 | 4,884 | 5,064 | 3,745 | 4,305 | |||||||||||||||
| Restructuring costs |
1,146 | — | — | — | — | |||||||||||||||
|
|
|
|
|
|
|
|
|
|
|
|||||||||||
| Total operating expenses |
32,329 | 29,382 | 29,283 | 21,246 | 27,346 | |||||||||||||||
|
|
|
|
|
|
|
|
|
|
|
|||||||||||
| Income (loss) from operations |
(18,165 | ) | (5,767 | ) | 6,935 | 1,569 | (507 | ) | ||||||||||||
| Interest and other expense, net |
(1,618 | ) | (532 | ) | (259 | ) | (219 | ) | (457 | ) | ||||||||||
|
|
|
|
|
|
|
|
|
|
|
|||||||||||
| Income (loss) before income taxes |
(19,783 | ) | (6,299 | ) | 6,676 | 1,350 | (964 | ) | ||||||||||||
| Provision for income taxes |
(60 | ) | (349 | ) | (33 | ) | — | (122 | ) | |||||||||||
|
|
|
|
|
|
|
|
|
|
|
|||||||||||
| Net income (loss) |
$ | (19,843 | ) | $ | (6,648 | ) | $ | 6,643 | $ | 1,350 | $ | (1,086 | ) | |||||||
|
|
|
|
|
|
|
|
|
|
|
|||||||||||
52
Table of Contents
| Year Ended February 28, | Nine Months Ended November 30, |
|||||||||||||||||||
| 2009 | 2010 | 2011 | 2010 | 2011 | ||||||||||||||||
| Consolidated Statements of Operations Data: |
||||||||||||||||||||
| Revenue |
||||||||||||||||||||
| Subscription and support |
55.9 | % | 67.5 | % | 71.0 | % | 72.2 | % | 62.3 | % | ||||||||||
| Professional services |
44.1 | 32.5 | 29.0 | 27.8 | 37.7 | |||||||||||||||
|
|
|
|
|
|
|
|
|
|
|
|||||||||||
| Total revenue |
100.0 | 100.0 | 100.0 | 100.0 | 100.0 | |||||||||||||||
| Cost of revenue |
||||||||||||||||||||
| Subscription and support |
23.6 | 20.9 | 13.6 | 15.5 | 13.1 | |||||||||||||||
| Professional services |
38.9 | 25.9 | 21.2 | 23.4 | 24.0 | |||||||||||||||
|
|
|
|
|
|
|
|
|
|
|
|||||||||||
| Total cost of revenue |
62.5 | 46.8 | 34.8 | 38.9 | 37.1 | |||||||||||||||
|
|
|
|
|
|
|
|
|
|
|
|||||||||||
| Gross margin (1) |
||||||||||||||||||||
| Subscription and support |
57.9 | 69.1 | 80.9 | 78.6 | 78.9 | |||||||||||||||
| Professional services |
11.7 | 20.2 | 26.9 | 15.6 | 36.5 | |||||||||||||||
|
|
|
|
|
|
|
|
|
|
|
|||||||||||
| Total gross margin |
37.5 | 53.2 | 65.2 | 61.1 | 62.9 | |||||||||||||||
|
|
|
|
|
|
|
|
|
|
|
|||||||||||
| Operating expenses: |
||||||||||||||||||||
| Research and development |
34.3 | 29.5 | 20.6 | 22.7 | 23.2 | |||||||||||||||
| Sales and marketing |
31.3 | 25.7 | 23.0 | 24.2 | 30.8 | |||||||||||||||
| General and administrative |
17.1 | 11.0 | 9.1 | 10.0 | 10.1 | |||||||||||||||
| Restructuring costs |
3.0 | — | — | — | — | |||||||||||||||
|
|
|
|
|
|
|
|
|
|
|
|||||||||||
| Total operating expenses |
85.7 | 66.2 | 52.7 | 56.9 | 64.1 | |||||||||||||||
|
|
|
|
|
|
|
|
|
|
|
|||||||||||
| Income (loss) from operations |
(48.2 | ) | (13.0 | ) | 12.5 | 4.2 | (1.2 | ) | ||||||||||||
| Interest and other expense, net |
(4.2 | ) | (1.2 | ) | (0.5 | ) | (0.6 | ) | (1.1 | ) | ||||||||||
|
|
|
|
|
|
|
|
|
|
|
|||||||||||
| Income (loss) before income taxes |
(52.4 | ) | (14.2 | ) | 12.0 | 3.6 | (2.3 | ) | ||||||||||||
| Provision for income taxes |
(0.2 | ) | (0.8 | ) | (0.1 | ) | 0.0 | (0.3 | ) | |||||||||||
|
|
|
|
|
|
|
|
|
|
|
|||||||||||
| Net income (loss) |
(52.6 | )% | (15.0 | )% | 12.0 | % | 3.6 | % | (2.6 | )% | ||||||||||
|
|
|
|
|
|
|
|
|
|
|
|||||||||||
| (1) | The table shows gross margin as a percentage of each component of revenue. |
Nine Months Ended November 30, 2010 and 2011
Revenue
| Nine Months Ended November 30, | Change | |||||||||||||||
| 2010 | 2011 | $ | % | |||||||||||||
| (Dollars in thousands) | ||||||||||||||||
| Revenue |
||||||||||||||||
| Subscription and support |
$ | 26,973 | $ | 26,563 | $ | (410 | ) | (1.5 | )% | |||||||
| Professional services |
10,380 | 16,099 | 5,719 | 55.1 | ||||||||||||
|
|
|
|
|
|
|
|
|
|||||||||
| Total revenue |
$ | 37,353 | $ | 42,662 | $ | 5,309 | 14.2 | % | ||||||||
|
|
|
|
|
|
|
|
|
|||||||||
| Bookings |
$ | 27,629 | $ | 58,121 | $ | 30,492 | 110.4 | % | ||||||||
|
|
|
|
|
|
|
|
|
|||||||||
Total revenue increased by $5.3 million, or 14.2%, in the nine months ended November 30, 2011, compared to the nine months ended November 30, 2010. The increase was primarily due to a $5.7 million, or 55.1%, increase in professional services revenue from the 2010 period to 2011 period.
Effective March 1, 2011, we adopted the new accounting guidance relating to multiple-element arrangements, which had the effect of increasing subscription and support revenue by $0.9 million, and professional services revenue by $6.3 million, or a total of $7.2 million, for the nine months ended November 30, 2011 more than would have been recognized in the nine-month period had such accounting guidance not been adopted.
53
Table of Contents
Excluding the effect of the adoption of the new accounting guidance on multiple-element arrangements in the nine months ended November 30, 2011, total revenue decreased by $1.9 million, or 5.0%, in the nine months ended November 30, 2011 over the same period in the prior year primarily due to $1.3 million lower subscription and support fees and $0.6 million lower professional service fees.
Bookings increased by $30.5 million, or 110.4%, from the nine months ended November 30, 2010 to the nine months ended November 30, 2011 due to the addition of new customers and sales of additional software solutions and professional services to existing customers. The growth rates for revenue and bookings are not necessarily directly correlated with each other in a given year due to the seasonality of our customer agreements, the recognition in most cases of subscription revenue on a straight-line basis over the term of each customer agreement, and the recognition of professional services revenue over the period the services are performed or upon project completion.
In the nine months ended November 30, 2010 and November 30, 2011, we had two customers that each accounted for more than 10% of revenue. Revenue generated from customers headquartered within the United States accounted for 63.4% of total revenue in the nine months ended November 30, 2011.
Cost of Revenue, Gross Profit and Gross Margin
| Nine Months Ended November 30, | Change | |||||||||||||||
| 2010 | 2011 | $ | % | |||||||||||||
| (Dollars in thousands) | ||||||||||||||||
| Cost of revenue |
||||||||||||||||
| Subscriptions and support |
$ | 5,774 | $ | 5,599 | $ | (175 | ) | (3.03 | )% | |||||||
| Professional services |
8,764 | 10,224 | 1,460 | 16.7 | ||||||||||||
|
|
|
|
|
|
|
|
|
|||||||||
| Total cost of revenue |
$ | 14,538 | $ | 15,823 | $ | 1,285 | 8.8 | % | ||||||||
|
|
|
|
|
|
|
|
|
|||||||||
| Gross profit |
||||||||||||||||
| Subscriptions and support |
$ | 21,199 | $ | 20,964 | $ | (235 | ) | (1.1 | )% | |||||||
| Professional services |
1,616 | 5,875 | 4,259 | 263.6 | ||||||||||||
|
|
|
|
|
|
|
|
|
|||||||||
| Total gross profit |
$ | 22,815 | $ | 26,839 | $ | 4,024 | 17.6 | % | ||||||||
|
|
|
|
|
|
|
|
|
|||||||||
| Gross margin |
||||||||||||||||
| Subscriptions and support |
78.6 | % | 78.9 | % | 0.3 | % | ||||||||||
| Professional services |
15.6 | 36.5 | 20.9 | |||||||||||||
|
|
|
|
|
|
|
|||||||||||
| Total gross margin |
61.1 | % | 62.9 | % | 1.8 | % | ||||||||||
|
|
|
|
|
|
|
|||||||||||
Total cost of revenue increased $1.3 million, or 8.8%, for the nine months ended November 30, 2011 compared to the nine months ended November 30, 2010. The increase in total cost of revenue is primarily driven by increased headcount resulting in a $1.3 million increase in employee-related expense and an increase of $0.6 million in fees paid for externally-sourced professional services. These increases were partially offset by a decrease of $0.3 million in hosting costs and $0.3 million in software and hardware maintenance costs. Total cost of revenue fluctuates period-to-period depending on the growth of our professional services business and any associated increased costs relating to the delivery of our on-demand software solutions and professional services, as well as the timing of significant expenditures.
The increase in revenue associated with the adoption of the new revenue accounting guidance in the nine months ended November 30, 2011 impacted our margins positively as our revenue increased without a corresponding increase in our cost of revenue since our cost of revenue is recognized as incurred and would have been the same without the increase in revenue. The adoption of the new revenue accounting guidance also had the effect of increasing gross margin on professional services by 41.1% from (4.6)% to 36.5%. Overall, the adoption of the new revenue accounting guidance had the effect of increasing gross margin by 7.5% from 55.4% to 62.9%.
54
Table of Contents
Gross margin is impacted by the timing of when we record our revenue and costs related to arrangements with customers. We recognize revenue on certain arrangements ratably over the contract term or only upon completion of work performed, whereas we recognize costs as incurred. As such, this may cause our gross margins to fluctuate between periods.
Operating Expenses
| Nine Months Ended November 30, | Change | |||||||||||||||
| 2010 | 2011 | $ | % | |||||||||||||
| (Dollars in thousands) | ||||||||||||||||
| Operating Expenses: |
||||||||||||||||
| Research and development |
$ | 8,474 | $ | 9,880 | $ | 1,406 | 16.6 | % | ||||||||
| Sales and marketing |
9,027 | 13,161 | 4,134 | 45.8 | ||||||||||||
| General and administrative |
3,745 | 4,305 | 560 | 15.0 | ||||||||||||
|
|
|
|
|
|
|
|
|
|||||||||
| Total operating expenses |
$ | 21,246 | $ | 27,346 | $ | 6,100 | 28.7 | % | ||||||||
|
|
|
|
|
|
|
|
|
|||||||||
Research and Development
In the nine months ended November 30, 2011, research and development expense increased $1.4 million, or 16.6%, over the nine months ended November 30, 2010. The increase was primarily attributable to $0.7 million of higher employee-related costs and $0.5 million in fees paid for third-party contract developers attributed to increased software development activities.
Sales and Marketing
In the nine months ended November 30, 2011, sales and marketing expense increased by $4.1 million, or 45.8%, over the nine months ended November 30, 2010. The increase was primarily attributable to a $3.5 million increase in employee-related costs as we expanded our field sales organization globally. Average headcount in sales and marketing increased from 36 in the nine months ended November 30, 2010 to 48 in the nine months ended November 30, 2011. Total sales and marketing headcount increased by 70.6% from 34 as of March 1, 2010 to 58 as of November 30, 2011. We also incurred $0.3 million of additional fees paid to sales representatives in China and Europe in order to expand our customer base in those geographic locations. Additionally, our marketing expenses increased by $0.2 million as a result of additional marketing and branding programs in the nine months ended November 30, 2011 compared to the prior period.
General and Administrative
In the nine months ended November 30, 2011, general and administrative expense increased $0.6 million, or 15.0%, over the nine months ended November 30, 2010. The increase was primarily attributable to higher employee-related costs of $0.3 million, $0.2 million higher legal and accounting fees, and $0.1 million increase in communication costs. These increases were offset by a $0.1 million decrease in fees paid to contractors for administrative services.
Interest and Other Expense, Net
| Nine Months Ended November 30, | Change | |||||||||||||||
| 2010 | 2011 | $ | % | |||||||||||||
| (Dollars in thousands) | ||||||||||||||||
| Interest income |
$ | 4 | $ | 3 | $ | (1 | ) | (25.0 | )% | |||||||
| Interest expense |
(84 | ) | (138 | ) | (54 | ) | 64.3 | |||||||||
| Other expense, net |
(139 | ) | (322 | ) | (183 | ) | 131.7 | |||||||||
|
|
|
|
|
|
|
|
|
|||||||||
| Total interest and other expense, net |
$ | (219 | ) | $ | (457 | ) | $ | (238 | ) | 108.7 | % | |||||
|
|
|
|
|
|
|
|
|
|||||||||
55
Table of Contents
In the nine months ended November 30, 2011, interest and other expense increased $0.2 million, or 108.7%, over the nine months ended November 30, 2010. The increase was largely driven by net transaction and translation losses on foreign exchange.
Fiscal Years Ended February 28, 2009, 2010 and 2011
Revenue
| Year Ended February 28, | 2009 to 2010 change | 2010 to 2011 change | ||||||||||||||||||||||||||
| 2009 | 2010 | 2011 | $ | % | $ | % | ||||||||||||||||||||||
| (Dollars in thousands) | ||||||||||||||||||||||||||||
| Subscriptions and support |
$ | 21,107 | $ | 29,976 | $ | 39,419 | $ | 8,869 | 42.0 | % | $ | 9,443 | 31.5 | % | ||||||||||||||
| Professional services |
16,627 | 14,401 | 16,104 | (2,226 | ) | (13.4 | ) | 1,703 | 11.8 | |||||||||||||||||||
|
|
|
|
|
|
|
|
|
|
|
|
|
|
|
|||||||||||||||
| Total revenue |
$ | 37,734 | $ | 44,377 | $ | 55,523 | $ | 6,643 | 17.6 | % | $ | 11,146 | 25.1 | % | ||||||||||||||
|
|
|
|
|
|
|
|
|
|
|
|
|
|
|
|||||||||||||||
| Bookings |
$ | 59,443 | $ | 57,517 | $ | 56,916 | $ | (1,926 | ) | (3.2 | )% | $ | (601 | ) | (1.0 | )% | ||||||||||||
|
|
|
|
|
|
|
|
|
|
|
|
|
|
|
|||||||||||||||
We experienced growth in our revenue for the last three fiscal years, largely due to the addition of new customers, renewals and sales of additional solutions and services to our existing customer base. During this time, we have leveraged our customer network to add new customers while expanding further into adjacent verticals to create new markets for our products both domestically and abroad. Due to our past successes with our customers, we have been able to sell additional solutions to them and we continue to develop new products and services to introduce to them.
2011 compared to 2010. Total revenue increased $11.1 million, or 25.1%, from fiscal 2010 to fiscal 2011. The increase was primarily due to a $9.4 million, or 31.5%, growth in subscription and support revenue. Subscription and support revenue, and professional services revenue comprised 71.0% and 29.0% of total revenue in fiscal 2011, respectively.
Prior to our adoption of the new revenue accounting guidance at the beginning of fiscal 2012, the timing of when we recognized revenue on customer arrangements depended in large part upon customer acceptance of our deployment of on-demand solutions, and as such, resulted in fluctuations in revenue between periods. For fiscal 2011, our revenue included $6.4 million of subscriptions and support revenue and $4.8 million of professional services revenue, or a total of $11.2 million in revenue, related to multiple-element arrangements with a single customer which were executed between fiscal 2008 and fiscal 2011 and treated as a single unit of accounting for revenue recognition purposes. All revenue related to these arrangements was recognized from the acceptance of the final deliverable in November 2010 ratably through February 2011, the remaining term of the on-demand subscription and support. Typically, our first arrangement with a customer is for the initial deployment of our software solutions, and prior to adoption of the new accounting guidance, we commence revenue recognition once we complete such deployment and recognize the fees ratably over the contractual term. Subsequent arrangements are then generally treated as separate units of accounting for revenue recognition purposes. Had the revenue on this arrangement been recognized in a pattern similar to our typical customer arrangements, we would have recognized that $11.2 million in revenue over three years, with $4.2 million of subscription and support revenue and $2.3 million of professional services revenue in years prior to fiscal 2011, and $2.2 million of subscription and support revenue and $2.5 million of professional services revenue in fiscal 2011. Our deferred revenue as of February 28, 2011 did not include a similar arrangement. Additionally, with the adoption of the new revenue accounting guidance in fiscal 2012, relating to multiple-element arrangements, we recognize revenue for the estimated selling price of each element that is delivered to our customers. As such, it is unlikely that we will experience a similar fluctuation in our revenue resulting from such type of arrangement in the future.
For fiscal 2010, we had an increase in revenue of $5.1 million due, in part, to the mutual termination of a certain customer contract that resulted in recognition of the total arrangement fees during the fiscal year rather than ratably over the contract term.
56
Table of Contents
Excluding the revenue from these arrangements, revenue increased by $5.7 million, or 13.2%, from fiscal 2010 to fiscal 2011. The increase resulted from the growth in our customer base, up-sell to existing customers and commencement of revenue recognition on customer arrangements upon implementation of our on-demand solutions and delivery of professional services.
In fiscal 2011, we had two customers that each accounted for more than 10% of revenue. In fiscal 2010, we had three customers that each accounted for more than 10% of revenue. For the fiscal years ended 2010 and 2011, revenue generated within the United States accounted for 77.1% and 63.1% of total revenue, respectively.
2010 compared to 2009. Total revenue increased $6.6 million, or 17.6%, from fiscal 2009 to fiscal 2010. The increase was primarily due to an $8.9 million, or 42.0%, increase in subscription and support revenue, slightly offset by a decrease in professional services revenue of $2.2 million, or 13.4%. The increase in revenue from fiscal 2009 to fiscal 2010 was primarily attributable to growth in our customer base, and the implementation of on-demand solutions provided to our existing customers during fiscal 2010. We also experienced an increase in revenue of $5.1 million in fiscal 2010 due, in part, to the mutual termination of certain customer contracts that resulted in recognition of the total arrangement fees during the fiscal year rather than ratably over the contract term.
In both fiscal 2009 and fiscal 2010, we had three customers that each accounted for more than 10% of revenue. For fiscal 2009 and fiscal 2010, revenue generated within the United States accounted for 70.9% and 77.1% of total revenue, respectively.
Cost of Revenue, Gross Profit and Gross Margin
| Year Ended February 28, | 2009 to 2010 change | 2010 to 2011 change | ||||||||||||||||||||||||||
| 2009 | 2010 | 2011 | $ | % | $ | % | ||||||||||||||||||||||
| (Dollars in thousands) | ||||||||||||||||||||||||||||
| Cost of Revenue |
||||||||||||||||||||||||||||
| Subscriptions and support |
$ | 8,885 | $ | 9,269 | $ | 7,531 | $ | 384 | 4.3 | % | $ | (1,738 | ) | (18.8 | )% | |||||||||||||
| Professional services |
14,685 | 11,493 | 11,774 | (3,192 | ) | (21.7 | ) | 281 | 2.5 | |||||||||||||||||||
|
|
|
|
|
|
|
|
|
|
|
|
|
|
|
|||||||||||||||
| Total cost of revenue |
$ | 23,570 | $ | 20,762 | $ | 19,305 | $ | (2,808 | ) | (11.9 | )% | $ | (1,457 | ) | (7.0 | )% | ||||||||||||
|
|
|
|
|
|
|
|
|
|
|
|
|
|
|
|||||||||||||||
| Gross profit |
| |||||||||||||||||||||||||||
| Subscriptions and support |
$ | 12,222 | $ | 20,707 | $ | 31,888 | $ | 8,485 | 69.4 | % | $ | 11,181 | 54.0 | % | ||||||||||||||
| Professional services |
1,942 | 2,908 | 4,330 | 966 | 49.7 | 1,422 | 48.9 | |||||||||||||||||||||
|
|
|
|
|
|
|
|
|
|
|
|
|
|
|
|||||||||||||||
| Total gross profit |
$ | 14,164 | $ | 23,615 | $ | 36,218 | $ | 9,451 | 66.7 | % | $ | 12,603 | 53.4 | % | ||||||||||||||
|
|
|
|
|
|
|
|
|
|
|
|
|
|
|
|||||||||||||||
| Gross margin |
||||||||||||||||||||||||||||
| Subscriptions and support |
57.9 | % | 69.1 | % | 80.9 | % | 11.2 | % | 11.8 | % | ||||||||||||||||||
| Professional services |
11.7 | 20.2 | 26.9 | 8.5 | 6.7 | |||||||||||||||||||||||
|
|
|
|
|
|
|
|
|
|
|
|||||||||||||||||||
| Total gross margin |
37.5 | % | 53.2 | % | 65.2 | % | 15.7 | % | 12.0 | % | ||||||||||||||||||
|
|
|
|
|
|
|
|
|
|
|
|||||||||||||||||||
2011 compared to 2010. Total cost of revenue decreased by $1.5 million, or 7.0%, from fiscal 2010 to fiscal 2011. The decrease in total cost of revenue was primarily due to a $1.2 million decrease in hosting fees attributable to process efficiencies implemented in our data centers, a $0.4 million decrease in fees paid for externally-sourced professional services, a $0.3 million decrease in facilities and internal information technology costs, and a $0.3 million decrease in depreciation and amortization expense. These decreases were partially offset by a $0.7 million increase in employee related costs resulting from changes in staffing levels.
Gross margin was 53.2% in fiscal 2010 and 65.2% in fiscal 2011. For fiscal 2011, our revenue included $4.2 million of subscriptions and support revenue and $2.3 million of professional services revenue, or a total of $6.5 million in revenue, related to multiple arrangements with a single customer executed between fiscal 2008
57
Table of Contents
and fiscal 2011 and treated as a single unit of accounting for revenue recognition purposes, which would have been recorded in prior years had the revenue on this arrangement been recognized in a pattern similar to our typical customer arrangements. With no corresponding cost recorded for this arrangement in fiscal 2011, gross margin on subscriptions and support was positively affected by 2.3%, from 78.6% to 80.9%, and professional services by 12.1%, from 14.8% to 26.9%, resulting in an overall increase in gross margin of 4.6%. Excluding the revenue from these arrangements, fiscal 2011 gross margin would have been 78.6% on subscriptions and support and 14.8% on professional services, or a total gross margin of 60.6%, or 7.4% higher compared to 53.2% in fiscal 2010.
2010 compared to 2009. Total cost of revenue decreased $2.8 million, or 11.9%, from fiscal 2009 to fiscal 2010. The decrease was primarily driven by a decrease of $1.3 million in employee-related costs attributable to a decrease in staffing levels and a redeployment of certain professional services personnel to research and development projects and sales activities, a $0.3 million decrease in facilities and information technology costs, a $0.3 million decrease in travel costs and a $0.2 million decrease in telephone and internet costs. We also paid $0.8 million less in fees for externally-sourced professional services.
Gross margin increased from 37.5% in fiscal 2009 to 53.2% in fiscal 2010. The increase in gross margin resulted from growth in revenue of 17.6% and a decrease in total cost of revenue of 11.9%.
Operating Expenses
| Year Ended February 28, | 2009 to 2010 change | 2010 to 2011 change | ||||||||||||||||||||||||||
| 2009 | 2010 | 2011 | $ | % | $ | % | ||||||||||||||||||||||
| (Dollars in thousands) | ||||||||||||||||||||||||||||
| Research and development |
$ | 12,943 | $ | 13,077 | $ | 11,463 | $ | 134 | 1.0 | % | $ | (1,614 | ) | (12.3 | )% | |||||||||||||
| Sales and marketing |
11,792 | 11,421 | 12,756 | (371 | ) | (3.1 | ) | 1,335 | 11.7 | |||||||||||||||||||
| General and administrative |
6,448 | 4,884 | 5,064 | (1,564 | ) | (24.3 | ) | 180 | 3.7 | |||||||||||||||||||
| Restructuring costs |
1,146 | — | — | (1,146 | ) | (100.0 | ) | — | — | |||||||||||||||||||
|
|
|
|
|
|
|
|
|
|
|
|
|
|
|
|||||||||||||||
| Total operating expenses |
$ | 32,329 | $ | 29,382 | $ | 29,283 | $ | (2,947 | ) | (9.1 | )% | $ | (99 | ) | (0.3 | )% | ||||||||||||
|
|
|
|
|
|
|
|
|
|
|
|
|
|
|
|||||||||||||||
Research and Development
2011 compared to 2010. Research and development expense decreased by $1.6 million, or 12.3%, from fiscal 2010 to fiscal 2011. The $1.6 million decrease was primarily due to a decrease of $2.0 million in employee-related costs and a $0.3 million decrease in facilities costs. These decreases were partially offset by a $0.5 million increase in data center costs and a $0.1 million increase in fees paid to external contractors for product development projects. As a percentage of revenue, research and development expense decreased from 29.5% in fiscal 2010 to 20.6% in fiscal 2011 primarily due to growth in revenue and a decrease in overall research and development expense.
2010 compared to 2009. Research and development expense increased $0.1 million, or 1.0%, from fiscal 2009 to fiscal 2010. The increase was primarily due to a $0.4 million increase in employee-related costs attributable to an increase in the number of research and development projects undertaken. This increase was partially offset by a $0.1 million decrease in travel expenses, $0.1 million in lower fees paid to external contractors, and a $0.1 million decrease in software amortization. As a percentage of revenue, research and development expense decreased from 34.3% in fiscal 2009 to 29.5% in fiscal 2010 primarily due to growth in revenue.
Sales and Marketing
2011 compared to 2010. Sales and marketing expense increased $1.3 million, or 11.7%, from fiscal 2010 to fiscal 2011. The increase was primarily driven by increased headcount as we expanded our sales organization which resulted in a $0.7 million increase in payroll and related expenses and a $0.4 million increase
58
Table of Contents
in travel expenses. We also incurred $0.1 million in increased recruiting expenses to hire additional sales personnel, and a $0.1 million increase in fees paid for outside services to support the expansion of our presence in the European market. These increases were partially offset by a $0.1 million decrease in marketing expenses resulting from fewer marketing and branding programs and more direct sales activities in fiscal 2011. As a percentage of revenue, sales and marketing expense decreased from 25.7% in fiscal 2010 to 23.0% in fiscal 2011.
2010 compared to 2009. Sales and marketing decreased $0.4 million, or 3.1%, from fiscal 2009 to fiscal 2010. As a percentage of revenue, sales and marketing expense decreased from 31.3% in fiscal 2009 to 25.7% in fiscal 2010. The decrease was primarily driven by a decrease in staffing levels and closure of our Japan sales office in fiscal 2009 in line with our objective of achieving operational efficiencies. This resulted in decreases of $0.3 million in payroll and benefits and $0.2 million in travel expenses. Additionally, a reduction in the number of marketing programs resulted in a $0.3 million decrease in marketing expense. These decreases were partially offset by an increase of $0.5 million in employee incentives.
General and Administrative
2011 compared to 2010. General and administrative expense increased $0.2 million, or 3.7%, from fiscal 2010 to fiscal 2011. The increase was primarily driven by $0.1 million higher employee-related salaries, a $0.1 million increase in fees paid to contractors for administrative services and a $0.1 million increase in legal and accounting fees. These increases were partially offset by $0.1 million lower depreciation expenses. As a percentage of revenue, general and administrative expense decreased from 11.0% in fiscal 2010 to 9.1% in fiscal 2011.
2010 compared to 2009. General and administrative expense decreased $1.6 million, or 24.3%, from fiscal 2009 to fiscal 2010. In fiscal 2009, we closed our Japan sales office which resulted in a $0.6 million decrease in general and administrative expense from fiscal 2009 to fiscal 2010. We also incurred $0.2 million lower outside services fees and $0.3 million lower tax-related expenses. Additionally, recruiting costs incurred in fiscal 2009 were higher by $0.8 million in connection with filling certain executive management positions. As a percentage of revenue, general and administrative expense decreased from 17.1% in fiscal 2009 to 11.0% in fiscal 2010.
Restructuring Costs
In fiscal 2009, we closed our sales office in Japan in an effort to reduce operating costs and recorded $1.1 million of restructuring charges, primarily consisting of costs associated with workforce reduction and facility closings. There were no restructuring charges recorded in fiscal 2010 or fiscal 2011.
Interest and Other Expense, Net
| Year Ended February 28, | 2009 to 2010 change | 2010 to 2011 change | ||||||||||||||||||||||||||
| 2009 | 2010 | 2011 | $ | % | $ | % | ||||||||||||||||||||||
| (Dollars in thousands) | ||||||||||||||||||||||||||||
| Interest income |
$ | 208 | $ | 25 | $ | 5 | $ | (183 | ) | (88.0 | )% | $ | (20 | ) | (80.0 | )% | ||||||||||||
| Interest expense |
(1,301 | ) | (393 | ) | (115 | ) | 908 | (69.8 | ) | 278 | (70.7 | ) | ||||||||||||||||
| Other expense, net |
(525 | ) | (164 | ) | (149 | ) | 361 | (68.8 | ) | 15 | (9.1 | ) | ||||||||||||||||
|
|
|
|
|
|
|
|
|
|
|
|
|
|
|
|||||||||||||||
| Total interest and other expense, net |
$ | (1,618 | ) | $ | (532 | ) | $ | (259 | ) | $ | 1,086 | (67.1 | )% | $ | 273 | (51.3 | )% | |||||||||||
|
|
|
|
|
|
|
|
|
|
|
|
|
|
|
|||||||||||||||
2011 compared to 2010. In fiscal 2011, interest and other expense, net, decreased by $0.3 million, or 51.3%, compared to fiscal 2010. The decrease was primarily due to a decrease in interest expense as a result of reduced equipment finance borrowing.
2010 compared to 2009. In fiscal 2010, interest and other expense, net, decreased by $1.1 million, or 67.1%, as compared to fiscal 2009. The decrease was largely driven by a decrease in interest expense resulting from reduced bank borrowings.
59
Table of Contents
Quarterly Results of Operations
The following tables present our unaudited consolidated quarterly results of operations data in dollars and as a percentage of revenue for each of the seven most recent quarters commencing with the quarter ended May 31, 2010 and ending with the quarter ended November 30, 2011. We have prepared this information on a basis consistent with our audited consolidated financial statements and have included all adjustments, consisting of normal recurring adjustments, which, in the opinion of management, are necessary to fairly present our operating results for the quarters presented. You should read the following tables in conjunction with our audited and unaudited consolidated financial statements and related notes appearing elsewhere in this prospectus. Our quarterly results of operations have varied in the past and are likely to do so again in the future. As such, we believe that comparisons of our quarterly results of operations should not be relied upon as an indication of our future performance. The items discussed below highlight unusual events and circumstances that make comparability between quarters difficult.
| For the Three Months Ended | ||||||||||||||||||||||||||||
| May 31, 2010 |
Aug 31, 2010 |
Nov 30, 2010 |
Feb 28, 2011 |
May 31, 2011 |
Aug 31, 2011 |
Nov 30, 2011 |
||||||||||||||||||||||
| (In thousands, except per share data) | ||||||||||||||||||||||||||||
| Revenue |
||||||||||||||||||||||||||||
| Subscription and support |
$ | 8,420 | $ | 8,657 | $ | 9,896 | $ | 12,446 | $ | 8,053 | $ | 9,195 | $ | 9,315 | ||||||||||||||
| Professional services |
3,137 | 3,405 | 3,838 | 5,724 | 3,194 | 7,411 | 5,494 | |||||||||||||||||||||
|
|
|
|
|
|
|
|
|
|
|
|
|
|
|
|||||||||||||||
| Total revenue |
11,557 | 12,062 | 13,734 | 18,170 | 11,247 | 16,606 | 14,809 | |||||||||||||||||||||
| Cost of revenue |
||||||||||||||||||||||||||||
| Subscription and support |
1,993 | 1,920 | 1,861 | 1,757 | 1,787 | 1,884 | 1,928 | |||||||||||||||||||||
| Professional services |
2,603 | 2,937 | 3,223 | 3,011 | 3,333 | 3,362 | 3,529 | |||||||||||||||||||||
|
|
|
|
|
|
|
|
|
|
|
|
|
|
|
|||||||||||||||
| Total cost of revenue |
4,596 | 4,857 | 5,084 | 4,768 | 5,120 | 5,246 | 5,457 | |||||||||||||||||||||
|
|
|
|
|
|
|
|
|
|
|
|
|
|
|
|||||||||||||||
| Gross profit |
||||||||||||||||||||||||||||
| Subscription and support |
6,427 | 6,737 | 8,035 | 10,689 | 6,266 | 7,311 | 7,387 | |||||||||||||||||||||
| Professional services |
534 | 468 | 615 | 2,713 | (139 | ) | 4,049 | 1,965 | ||||||||||||||||||||
|
|
|
|
|
|
|
|
|
|
|
|
|
|
|
|||||||||||||||
| Total gross profit |
6,961 | 7,205 | 8,650 | 13,402 | 6,127 | 11,360 | 9,352 | |||||||||||||||||||||
|
|
|
|
|
|
|
|
|
|
|
|
|
|
|
|||||||||||||||
| Operating expenses: |
||||||||||||||||||||||||||||
| Research and development |
2,924 | 2,806 | 2,744 | 2,989 | 3,110 | 3,369 | 3,401 | |||||||||||||||||||||
| Sales and marketing |
2,956 | 3,048 | 3,023 | 3,729 | 3,730 | 4,318 | 5,113 | |||||||||||||||||||||
| General and administrative |
1,124 | 1,219 | 1,403 | 1,318 | 1,307 | 1,337 | 1,661 | |||||||||||||||||||||
|
|
|
|
|
|
|
|
|
|
|
|
|
|
|
|||||||||||||||
| Total operating expenses |
7,004 | 7,073 | 7,170 | 8,036 | 8,147 | 9,024 | 10,175 | |||||||||||||||||||||
|
|
|
|
|
|
|
|
|
|
|
|
|
|
|
|||||||||||||||
| Income/(loss) from operations |
(43 | ) | 132 | 1,480 | 5,366 | (2,020 | ) | 2,336 | (823 | ) | ||||||||||||||||||
| Interest and other expense, net |
(109 | ) | (70 | ) | (40 | ) | (40 | ) | (86 | ) | (129 | ) | (242 | ) | ||||||||||||||
|
|
|
|
|
|
|
|
|
|
|
|
|
|
|
|||||||||||||||
| Income/(loss) before income taxes |
(152 | ) | 62 | 1,440 | 5,326 | (2,106 | ) | 2,207 | (1,065 | ) | ||||||||||||||||||
| Provision for (benefit from) income taxes |
(3 | ) | (4 | ) | 7 | 33 | 31 | 43 | 48 | |||||||||||||||||||
|
|
|
|
|
|
|
|
|
|
|
|
|
|
|
|||||||||||||||
| Net income (loss) |
(149 | ) | 66 | 1,433 | 5,293 | (2,137 | ) | 2,164 | (1,113 | ) | ||||||||||||||||||
| Undistributed earnings allocated to preferred stockholders |
— | (66 | ) | (1,433 | ) | (4,410 | ) | — | (2,164 | ) | — | |||||||||||||||||
|
|
|
|
|
|
|
|
|
|
|
|
|
|
|
|||||||||||||||
| Net income (loss) attributable to common stockholders |
$ | (149 | ) | $ | — | $ | — | $ | 883 | $ | (2,137 | ) | $ | — | $ | (1,113 | ) | |||||||||||
|
|
|
|
|
|
|
|
|
|
|
|
|
|
|
|||||||||||||||
| Net income (loss) per share attributable to common stockholders: |
||||||||||||||||||||||||||||
| Basic |
$ | — | $ | — | $ | — | $ | — | $ | (0.01 | ) | $ | — | $ | (0.01 | ) | ||||||||||||
|
|
|
|
|
|
|
|
|
|
|
|
|
|
|
|||||||||||||||
| Diluted |
$ | — | $ | — | $ | — | $ | — | $ | (0.01 | ) | $ | — | $ | (0.01 | ) | ||||||||||||
|
|
|
|
|
|
|
|
|
|
|
|
|
|
|
|||||||||||||||
| Weighted average shares used to compute earnings per share attributable to common stockholders: |
||||||||||||||||||||||||||||
| Basic |
157,528 | 209,104 | 210,606 | 211,987 | 202,915 | 215,390 | 209,473 | |||||||||||||||||||||
|
|
|
|
|
|
|
|
|
|
|
|
|
|
|
|||||||||||||||
| Diluted |
157,528 | 209,104 | 210,606 | 759,543 | 202,915 | 215,390 | 209,473 | |||||||||||||||||||||
|
|
|
|
|
|
|
|
|
|
|
|
|
|
|
|||||||||||||||
60
Table of Contents
| For the Three Months Ended | ||||||||||||||||||||||||||||
| May 31, 2010 |
Aug 31, 2010 |
Nov 30, 2010 |
Feb 28, 2011 |
May 31, 2011 |
Aug 31, 2011 |
Nov 30, 2011 |
||||||||||||||||||||||
| Revenue |
||||||||||||||||||||||||||||
| Subscription and Support |
72.9 | % | 71.8 | % | 72.1 | % | 68.5 | % | 71.6 | % | 55.4 | % | 62.9 | % | ||||||||||||||
| Professional Services |
27.1 | 28.2 | 27.9 | 31.5 | 28.4 | 44.6 | 37.1 | |||||||||||||||||||||
|
|
|
|
|
|
|
|
|
|
|
|
|
|
|
|||||||||||||||
| Total Revenue |
100.0 | 100.0 | 100.0 | 100.0 | 100.0 | 100.0 | 100.0 | |||||||||||||||||||||
| Cost of revenue |
||||||||||||||||||||||||||||
| Subscription and Support |
17.2 | 15.9 | 13.6 | 9.7 | 15.9 | 11.3 | 13.0 | |||||||||||||||||||||
| Professional Services |
22.5 | 24.4 | 23.5 | 16.6 | 29.6 | 20.2 | 23.8 | |||||||||||||||||||||
|
|
|
|
|
|
|
|
|
|
|
|
|
|
|
|||||||||||||||
| Total cost of revenue |
39.8 | 40.3 | 37.0 | 26.2 | 45.5 | 31.6 | 36.8 | |||||||||||||||||||||
|
|
|
|
|
|
|
|
|
|
|
|
|
|
|
|||||||||||||||
| Gross margin (1) |
||||||||||||||||||||||||||||
| Subscription and Support |
76.3 | 77.8 | 81.2 | 85.9 | 77.8 | 79.5 | 79.3 | |||||||||||||||||||||
| Professional Services |
17.0 | 13.7 | 16.0 | 47.4 | (4.4 | ) | 54.6 | 35.8 | ||||||||||||||||||||
|
|
|
|
|
|
|
|
|
|
|
|
|
|
|
|||||||||||||||
| Total gross margin |
60.2 | 59.7 | 63.0 | 73.8 | 54.5 | 68.4 | 63.2 | |||||||||||||||||||||
|
|
|
|
|
|
|
|
|
|
|
|
|
|
|
|||||||||||||||
| Operating expenses: |
||||||||||||||||||||||||||||
| Research and development |
25.3 | 23.3 | 20.0 | 16.4 | 27.7 | 20.3 | 23.0 | |||||||||||||||||||||
| Sales and marketing |
25.6 | 25.3 | 22.0 | 20.5 | 33.2 | 26.0 | 34.5 | |||||||||||||||||||||
| General and administrative |
9.7 | 10.1 | 10.2 | 7.3 | 11.6 | 8.1 | 11.2 | |||||||||||||||||||||
|
|
|
|
|
|
|
|
|
|
|
|
|
|
|
|||||||||||||||
| Total operating expenses |
60.6 | 58.6 | 52.2 | 44.2 | 72.4 | 54.3 | 68.7 | |||||||||||||||||||||
|
|
|
|
|
|
|
|
|
|
|
|
|
|
|
|||||||||||||||
| Income (loss) from operations |
(0.4 | ) | (1.1 | ) | 10.8 | 29.5 | (18.0 | ) | 14.1 | (5.6 | ) | |||||||||||||||||
| Interest and other expense, net |
(0.9 | ) | (0.6 | ) | (0.3 | ) | (0.2 | ) | (0.8 | ) | (0.8 | ) | (1.6 | ) | ||||||||||||||
|
|
|
|
|
|
|
|
|
|
|
|
|
|
|
|||||||||||||||
| Income (loss) before income taxes |
(1.3 | ) | 0.5 | 10.5 | 29.3 | (18.7 | ) | 13.3 | (7.2 | ) | ||||||||||||||||||
| Provision for income taxes |
0.0 | 0.0 | (0.1 | ) | (0.2 | ) | (0.3 | ) | (0.3 | ) | (0.3 | ) | ||||||||||||||||
|
|
|
|
|
|
|
|
|
|
|
|
|
|
|
|||||||||||||||
| Net income (loss) |
(1.3 | )% | 0.5 | % | 10.4 | % | 29.1 | % | (19.0 | )% | 13.0 | % | (7.5 | )% | ||||||||||||||
|
|
|
|
|
|
|
|
|
|
|
|
|
|
|
|||||||||||||||
| (1) | The table shows gross margin as a percentage of each component of revenue. |
| For the Three Months Ended | ||||||||||||||||||||||||||||
| May 31, 2010 |
Aug 31, 2010 |
Nov 30, 2010 |
Feb 28, 2011 |
May 31, 2011 |
Aug 31, 2011 |
Nov 30, 2011 |
||||||||||||||||||||||
| (Dollars in thousands) | ||||||||||||||||||||||||||||
| Other Financial and Operational Data: |
||||||||||||||||||||||||||||
| Adjusted EBITDA (1) |
$ | 580 | $ | 731 | $ | 2,009 | $ | 6,051 | $ | (1,490 | ) | $ | 2,830 | $ | (287 | ) | ||||||||||||
|
|
|
|
|
|
|
|
|
|
|
|
|
|
|
|||||||||||||||
| Free cash flow (2) |
$ | (455 | ) | $ | (1,121 | ) | $ | (374 | ) | $ | 1,253 | $ | (366 | ) | $ | (2,926 | ) | $ | 671 | |||||||||
|
|
|
|
|
|
|
|
|
|
|
|
|
|
|
|||||||||||||||
| Number of unique registered trading partner (3) |
23,654 | 24,662 | 25,554 | 26,440 | 27,364 | 28,003 | 29,599 | |||||||||||||||||||||
| Number of unique registered users (3) |
65,645 | 67,909 | 70,847 | 73,377 | 77,311 | 79,772 | 84,461 | |||||||||||||||||||||
| (1) | We define Adjusted EBITDA as net income (loss) adjusted for interest and other expense, net, provision for income taxes, depreciation and amortization, and stock-based compensation expense. Please see “Adjusted EBITDA” in the “Key Financial Performance Measures” of this section for more information and for a reconciliation of Adjusted EBITDA to net income (loss), the most directly comparable financial measure calculated and presented in accordance with GAAP. |
| (2) | We define free cash flow as net cash provided by (used in) operating activities less capital expenditures. Please see “Free Cash Flow” in in the “Key Financial Performance Measures” of this section for more information and for a reconciliation of free cash flow to net cash provided by (used in) operating activities, the most directly comparable financial measure calculated and presented in accordance with GAAP. |
| (3) | We define unique registered trading partners and unique registered users as entities and individuals, respectively, that have used our network as of the balance sheet date. We view the number of unique |
61
Table of Contents
| registered trading partners and unique registered users as key indicators of the reach of our network and the value our enterprise customers are deriving from our solutions. |
Stock-based compensation included in the consolidated statements of operations data above was as follows:
| For the Three Months Ended | ||||||||||||||||||||||||||||
| May 31, 2010 |
Aug 31, 2010 |
Nov 30, 2010 |
Feb 28, 2011 |
May 31, 2011 |
Aug 31, 2011 |
Nov 30, 2011 |
||||||||||||||||||||||
| (In thousands) | ||||||||||||||||||||||||||||
| Cost of revenue |
$ | 37 | $ | 38 | $ | 36 | $ | 112 | $ | 51 | $ | 25 | $ | 46 | ||||||||||||||
| Research and development |
20 | 21 | 20 | 47 | 23 | 10 | 20 | |||||||||||||||||||||
| Sales and marketing |
28 | 28 | 24 | 74 | 43 | 39 | 53 | |||||||||||||||||||||
| General and administrative |
20 | 21 | 18 | 33 | 27 | 27 | 46 | |||||||||||||||||||||
|
|
|
|
|
|
|
|
|
|
|
|
|
|
|
|||||||||||||||
| Total stock-based compensation |
$ | 105 | $ | 108 | $ | 98 | $ | 266 | $ | 144 | $ | 101 | $ | 165 | ||||||||||||||
|
|
|
|
|
|
|
|
|
|
|
|
|
|
|
|||||||||||||||
Adjusted EBITDA
The following table presents a reconciliation of Adjusted EBITDA for each of the periods indicated:
| For the Three Months Ended | ||||||||||||||||||||||||||||
| May 31, 2010 |
Aug 31, 2010 |
Nov 30, 2010 |
Feb 28, 2011 |
May 31, 2011 |
Aug 31, 2011 |
Nov 30, 2011 |
||||||||||||||||||||||
| (In thousands) | ||||||||||||||||||||||||||||
| Reconciliation of Adjusted EBITDA |
||||||||||||||||||||||||||||
| Net income (loss) |
$ | (149 | ) | $ | 66 | $ | 1,433 | $ | 5,293 | $ | (2,137 | ) | $ | 2,164 | $ | (1,113 | ) | |||||||||||
| Interest and other expense, net |
109 | 70 | 40 | 40 | 86 | 129 | 242 | |||||||||||||||||||||
| Provision for income taxes |
(3 | ) | (4 | ) | 7 | 33 | 31 | 43 | 48 | |||||||||||||||||||
| Depreciation and amortization |
518 | 491 | 431 | 419 | 386 | 393 | 371 | |||||||||||||||||||||
| Stock-based compensation |
105 | 108 | 98 | 266 | 144 | 101 | 165 | |||||||||||||||||||||
|
|
|
|
|
|
|
|
|
|
|
|
|
|
|
|||||||||||||||
| Adjusted EBITDA |
$ | 580 | $ | 731 | $ | 2,009 | $ | 6,051 | $ | (1,490 | ) | $ | 2,830 | $ | (287 | ) | ||||||||||||
|
|
|
|
|
|
|
|
|
|
|
|
|
|
|
|||||||||||||||
Free Cash Flow
A reconciliation of net cash provided by (used in) operating activities to free cash flow is presented below:
| For the Three Months Ended | ||||||||||||||||||||||||||||
| May 31, 2010 |
Aug 31, 2010 |
Nov 30, 2010 |
Feb 28, 2011 |
May 31, 2011 |
Aug 31, 2011 |
Nov 30, 2011 |
||||||||||||||||||||||
| (In thousands) | ||||||||||||||||||||||||||||
| Free Cash Flow Data: |
||||||||||||||||||||||||||||
| Net cash (used in) provided by operating activities |
$ | (171 | ) | $ | (961 | ) | $ | (155 | ) | $ | 1,375 | $ | (178 | ) | $ | (2,757 | ) | $ | 809 | |||||||||
| Capital expenditures |
(284 | ) | (160 | ) | (219 | ) | (122 | ) | (188 | ) | (169 | ) | (138 | ) | ||||||||||||||
|
|
|
|
|
|
|
|
|
|
|
|
|
|
|
|||||||||||||||
| Free cash flow |
$ | (455 | ) | $ | (1,121 | ) | $ | (374 | ) | $ | 1,253 | $ | (366 | ) | $ | (2,926 | ) | $ | 671 | |||||||||
|
|
|
|
|
|
|
|
|
|
|
|
|
|
|
|||||||||||||||
Revenue and Gross Margin
Our quarterly revenue fluctuates, primarily due to the timing of revenue recognition, which depends primarily on revenue recognition requirements and seasonality. We believe that this seasonality is due to customer buying patterns typical in this industry and is likely to continue in the future. In the future, we expect our revenue to also reflect such seasonality as a result of our adoption of the new revenue accounting guidance.
62
Table of Contents
Over the past seven quarters, our gross margins have ranged from 54.5% to 73.8%. As reflected in the table above, we have experienced quarter to quarter volatility in gross margin. We believe that this volatility was largely the result of our revenue mix in a particular period and the timing of revenue recognition. The amount of subscription and support in a period is a significant driver of our overall gross margin because of the high margins our software solutions generally produce. Gross margins in professional services may be affected by the nature and scope of work required in our contracts with customers.
We recognized $1.4 million of subscription and support revenue and $1.1 million of professional services revenue in the quarter ended November 30, 2010 and $5.0 million of subscription and support revenue and $3.6 million of professional services revenue in the quarter ended February 28, 2011 related to arrangements which were executed between fiscal 2008 and fiscal 2011 and treated as a single unit of accounting for revenue recognition purposes. All revenue related to these arrangements was recognized from the acceptance of the final deliverable in November 2010 ratably through February 2011, the remaining term of the on-demand subscription and support arrangements, whereas the costs related to these arrangements were substantially recognized in the prior periods as they were incurred. As a result of the timing of the revenue recognition and costs associated with these arrangements, our gross margins decreased by 2.3% for the quarter ended November 30, 2010 and increased by 17.9% for the quarter ended February 28, 2011. Excluding the revenue from these arrangements, gross margins for the quarters ended November 30, 2010 and February 28, 2011 would have been 65.3% and 55.9%, respectively.
Effective March 1, 2011, we adopted the new accounting guidance on multiple-element arrangements, which had the effect of increasing revenue and gross profit by $0.8 million, $4.0 million and $2.4 million for the quarters ended May 31, August 31 and November 30, 2011, respectively. This also increased gross margin by 3.5%, 10.0% and 7.1% during the quarters ended May 31, August 31 and November 30, 2011, respectively.
Liquidity and Capital Resources
| Year Ended February 28, | Nine Months Ended November 30, |
|||||||||||||||||||
| 2009 | 2010 | 2011 | 2010 | 2011 | ||||||||||||||||
| (In thousands) | ||||||||||||||||||||
| Cash and cash equivalents at the end of the period |
$ | 15,645 | $ | 9,530 | $ | 10,060 | $ | 10,011 | $ | 10,043 | ||||||||||
| Net cash provided by (used in) operating activities |
(14,607 | ) | (4,401 | ) | 88 | (1,287 | ) | (2,126 | ) | |||||||||||
| Net cash used in investing activities |
(1,670 | ) | (958 | ) | (768 | ) | (724 | ) | (584 | ) | ||||||||||
| Net cash provided by (used in) financing activities |
19,195 | (756 | ) | 1,210 | 2,492 | 2,695 | ||||||||||||||
As of November 30, 2011, we had cash and cash equivalents of $10.0 million consisting of cash and money market accounts. We did not have any short-term or long-term investments. Since inception, we have financed our operations primarily through the sale of preferred stock, borrowings under credit facilities and issuances of notes payable to stockholders. Our principal uses of cash are to fund operations, working capital requirements and capital expenditures. We believe that our existing cash and cash equivalents, together with cash generated from operations and the net proceeds we receive from this offering, will be sufficient to meet our working capital requirements for at least the next 12 months.
Operating Cash Flow
Our cash flow from operating activities is significantly influenced by the amount and timing of customer payments and the amount of cash we invest in personnel and infrastructure to support the anticipated future growth of our business. Net cash used in operating activities has historically resulted from losses from operations and changes in working capital.
Net cash used in operating activities for the nine months ended November 30, 2011 was $2.1 million compared to $1.3 million in the nine months ended November 30, 2010. The net cash used in operating activities
63
Table of Contents
for the nine months ended November 30, 2011 resulted from a $1.1 million net loss as adjusted by non-cash depreciation and amortization of $1.1 million and stock compensation of $0.4 million, and a decrease in net operating assets and liabilities of $2.6 million. The change in net operating assets and liabilities reflects an increase in accounts receivable and a decrease in deferred revenue, partially offset by an increase in accounts payable and accrued liabilities.
Net cash used in operating activities improved from $(4.4) million during fiscal 2010 to $0.1 million for fiscal 2011. We benefited from the $6.6 million net income generated in fiscal 2011 compared to a net loss of $6.6 million incurred in the prior year, adjusted for non-cash expenses. Net income in fiscal year 2011 included non-cash depreciation and amortization of $1.9 million and stock-based compensation of $0.6 million. Net loss in fiscal 2010 included non-cash depreciation and amortization of $2.3 million and stock-based compensation of $0.4 million.
Net cash used in operating activities improved from $(14.6) million during fiscal 2009 to $(4.4) million for fiscal 2010 primarily as a result of a $13.2 million decrease in net loss from $(19.8) million in fiscal 2009 to $(6.6) million in fiscal 2010. Net loss in fiscal 2009 included non-cash depreciation and amortization of $2.7 million and stock-based compensation of $0.3 million.
Investing Cash Flow
Historically, our primary investing activities have consisted of capital expenditures associated with expanding our cloud-based, on-demand software solutions infrastructure and growing our workforce.
Net cash used in investing activities for the nine months ended November 30, 2011 was $0.6 million. Cash used in investing activities primarily reflected purchases of property and equipment.
Net cash used in investing activities for fiscal 2011 was $0.8 million, which was primarily comprised of capital expenditures.
Net cash used in investing activities for fiscal 2010 was $1.0 million, which was primarily comprised of capital expenditures.
Net cash used in investing activities for fiscal 2009 was $1.7 million. This included $1.8 million for the purchase of computer equipment and software, and $0.3 million paid in connection with the acquisition of the net assets of a business. Restricted cash and long-term deposits decreased by $0.4 million as a result of a new lease agreement for our Austin office.
Financing Cash Flow
Since inception, we have financed our operations primarily through the sale of preferred stock and borrowings under credit facilities and from our stockholders.
Net cash provided by financing activities for the nine months ended November 30, 2011 was $2.7 million. During the nine months ended November 30, 2011, we received $0.1 million from the issuance of Series CC preferred stock upon the exercise of warrants. We maintain a credit facility consisting of a line of credit and growth capital term loan. For the nine months ended November 30, 2011, our net borrowings under our credit facility amounted to $3.4 million. We also made payments of $0.8 million on notes payable for fixed asset purchases.
Net cash provided by financing activities for fiscal 2011 was $1.2 million. During fiscal 2011, we received $0.6 million from exercises of stock options. For fiscal 2011, our net borrowings from our credit facility amounted to $1.6 million. We also made payments of $0.3 million on our capital lease obligation and $0.7 million on notes payable for fixed asset purchases.
64
Table of Contents
Net cash used in financing activities for fiscal 2010 was $0.8 million. We received $0.1 million in proceeds from exercises of stock options. During fiscal 2010, we received $6.1 million in proceeds from the issuance of Series D preferred stock. For fiscal 2010, our net borrowings under our credit facility amounted to $6.0 million. We also made payments of $0.5 million on notes payable and $0.4 million on our capital lease obligation.
Net cash provided by financing activities for fiscal 2009 was $19.2 million, which primarily consisted of $9.9 million borrowed from our stockholders and employees, $0.3 million borrowed under our credit facility and $8.7 million of proceeds from the issuance of Series CC preferred stock. Additionally, we received $0.6 million from exercises of stock options.
Adequacy of Capital Resources
Our future capital requirements may vary materially from those now planned and will depend on many factors. These may include the costs to develop and implement new solutions and applications, the sales and marketing resources needed to further penetrate our target markets, the expansion of our operations in the United States and internationally and the response of competitors to our solutions and applications.
We believe our cash and cash equivalents, the proceeds from this offering, funds available under our credit facility and cash flows from our operations will be sufficient to meet our working capital and capital expenditure requirements for at least the next 12 months.
From time to time, we may consider additional financing sources and means to lower our cost of capital, which could include the sale of equity, equity-linked and debt financing, and the application of the proceeds therefrom to the repayment of bank debt or other indebtedness. In addition, in connection with any future acquisitions, we may require additional funding which may be provided in the form of additional debt, equity or equity-linked financing or a combination thereof. There can be no assurance that any additional financing will be available to us on acceptable terms or at all.
Our Indebtedness
We maintain a credit facility having a total borrowing limit of $20.0 million as of February 28, 2011 with a commercial bank. Of the total facility, $17.5 million consists of formula-based lines of credit secured by our accounts receivable, and $2.5 million is a term loan. Amounts outstanding under the credit facility bear interest at a rate equal to the Wall Street Journal “prime rate” plus additional interest ranging from 1.25% to 4.00%, with a floor for the prime rate of 3.25%.
The bank lines of credit and term loan are secured by our tangible and intangible assets, as well as a negative pledge whereby we agree not to give any creditor a security interest in our intellectual property. In connection with this credit facility, warrants were issued to the lender to purchase 2,460,937 shares of Series BB preferred stock in March 2005. Amounts outstanding under the lines of credit were $6.3 million and $5.5 million as of February 28, 2010 and February 28, 2011, respectively.
We borrowed $2.5 million against the term loan on February 10, 2011. We were obligated to make interest-only payments on amounts drawn through April 10, 2011. On April 30, 2011, the principal balance outstanding was converted to a term loan payable in 30 monthly installments of principal plus accrued interest. The amount outstanding under the term loan was $2.5 million as of February 28, 2011 and is recorded in notes payable on the balance sheet.
In August 2011, we amended our credit facility to increase the total borrowing limit to $22.3 million and to extend the term of the lines of credit through February 2012, and the term loan through February 2015. As of November 30, 2011, the amounts outstanding under the lines of credit were $8.9 million, and under the term loan was $1.9 million, with $7.0 million of borrowing capacity available under the lines of credit. In February 2012,
65
Table of Contents
we further amended our credit facility to increase the total borrowing limit to $26.8 million and to extend the term of the lines of credit through August 2012 and the term loan through August 2015.
We were in compliance with all debt covenants as of February 28, 2011 and November 30, 2011. Any inability to meet our significant debt service obligations could have a materially adverse effect on us.
Contractual Obligations, Commitments and Contingencies
We generally do not enter into long-term minimum purchase commitments. Our principal commitments, in addition to those related to our line of credit discussed above, consist of obligations under capital leases for equipment and furniture and operating leases for computer equipment and office space. The following table summarizes our outstanding contractual obligations as of February 28, 2011:
| Payments Due by Period | ||||||||||||||||||||
| Total | Less Than 1 Year |
1-3 Years |
3-5 Years |
More Than 5 Years |
||||||||||||||||
| (In thousands) | ||||||||||||||||||||
| Notes payable (1) |
$ | 2,757 | $ | 1,090 | $ | 1,667 | $ | — | $ | — | ||||||||||
| Capital lease obligations |
35 | 35 | — | — | — | |||||||||||||||
| Operating lease obligations (2) |
3,203 | 1,218 | 1,985 | — | — | |||||||||||||||
| Purchase obligations |
— | — | — | — | — | |||||||||||||||
|
|
|
|
|
|
|
|
|
|
|
|||||||||||
| Total contractual obligations |
$ | 5,995 | $ | 2,343 | $ | 3,652 | $ | — | $ | — | ||||||||||
|
|
|
|
|
|
|
|
|
|
|
|||||||||||
| (1) | In fiscal 2011 and fiscal 2010, we financed the purchase of certain software licenses and related support and maintenance with notes payable. In fiscal 2011, we borrowed $2.5 million against our growth capital term loan, which converted to a term loan payable in 30 monthly installments. As of February 28, 2011, the total principal payments remaining under the equipment notes and the growth capital term loan was $2.8 million. |
| (2) | We lease our primary office space under noncancelable operating leases with various expiration dates through 2013. |
Off-Balance Sheet Arrangements
During the fiscal years ended February 28, 2009, 2010 and 2011 and the nine months ended November 30, 2011, we did not have any relationships with unconsolidated entities or financial partnerships, such as entities often referred to as structured finance or special purpose entities, which would have been established for the purpose of facilitating off-balance sheet arrangements or other contractually limited purposes.
Critical Accounting Policies and Estimates
Our consolidated financial statements are prepared in accordance with generally accepted accounting principles in the United States, or GAAP. The preparation of these financial statements requires us to make estimates and judgments that affect the reported amounts of assets and liabilities, disclosure of contingent assets and liabilities at the date of the financial statements, and the reported amounts of revenue and expenses during the reported period. Generally, we base our estimates on historical experience and on various other assumptions in accordance with GAAP that we believe to be reasonable under the circumstances. Accordingly, actual results may differ from these estimates under other assumptions or conditions.
Critical accounting policies and estimates are those that we consider the most important to the portrayal of our financial condition and results of operations because they require our most difficult, subjective or complex judgments, often as a result of the need to make estimates about the effect of matters that are inherently uncertain. Our critical accounting policies and estimates include those related to:
| • | revenue recognition; |
66
Table of Contents
| • | income taxes; and |
| • | stock-based compensation. |
Please refer to the notes to the consolidated financial statements for further discussion of our accounting policies.
Revenue Recognition
Our revenue consists of subscription and support fees for access to our on-demand software solutions and fees for the provision of professional services associated with consultation and deployment services. Our sales agreements have contract terms typically three years in length. Arrangements with customers do not provide the customer with the right to take possession of the software. Therefore, these arrangements are treated as service agreements. We invoice our customers for subscription and support in advance for annual use of our software solutions. We invoice our customers for professional services either in advance, monthly, or upon achievement of project milestones. Generally, all payments are non-refundable. In most instances, our on-demand solutions are sold as part of multiple element arrangements which typically includes subscription and support fees and professional services.
Typically, we commence revenue recognition when all of the following criteria are met: persuasive evidence of an arrangement exists, access has been granted to our on-demand software solutions or services have been rendered, the price to the buyer is fixed or determinable, and collectability of the fees is reasonably assured. Additionally, if an agreement contains non-standard acceptance terms or requires non-standard performance criteria to be met, we defer revenue until the satisfaction of such conditions.
In fiscal 2012, we adopted a new accounting guidance for arrangements with multiple deliverables which:
| • | provides updated guidance on whether multiple deliverables exist, how the deliverables in an arrangement should be separated, and how the consideration should be allocated; |
| • | requires an entity to allocate revenue in an arrangement using estimated selling prices, or ESP, of each deliverable if a vendor does not have vendor-specific objective evidence of selling price, or VSOE, or third-party evidence of selling price, or TPE; and |
| • | eliminates the use of the residual method and requires a vendor to allocate revenue using the relative selling price method. |
We adopted this accounting guidance on March 1, 2011 (the beginning of our fiscal year) on a prospective basis for applicable transactions originating or materially modified after February 28, 2011.
Prior to the adoption of this guidance, we determined that we did not have objective and reliable evidence of fair value for each deliverable of our arrangements. As a result, we accounted for subscription and professional services revenue as a single unit of accounting and recognized the total arrangement fee ratably over the contractual term of the subscription agreement.
Upon adoption of this guidance, we account for subscription fees and professional services revenue as separate units of accounting and allocate revenue to each deliverable in an arrangement based on a selling price hierarchy. As we have been unable to establish VSOE or TPE for the elements of its arrangements, we determine the ESP for each element primarily by considering prices we charge for similar offerings, size of the order and historical pricing practices. Revenue allocated to subscription and support is recognized over the contractual term. Revenue allocated to professional services is recognized as services are delivered.
67
Table of Contents
During the nine months ended November 30, 2011, total revenue as reported and total revenue that would have been reported, if the transactions entered into or materially modified after February 28, 2011 were subject to previous accounting guidance, are shown in the following table (unaudited):
| As reported | Pro forma Basis as if Previous Accounting Guidance Were in Effect |
Impact of adoption of the new accounting guidance |
||||||||||
| (In thousands) | ||||||||||||
| Revenue |
||||||||||||
| Subscription and support |
$ | 26,563 | $ | 25,706 | $ | 857 | ||||||
| Professional services |
16,099 | 9,772 | 6,327 | |||||||||
|
|
|
|
|
|
|
|||||||
| Total |
$ | 42,662 | $ | 35,478 | $ | 7,184 | ||||||
|
|
|
|
|
|
|
|||||||
The $7.2 million impact to total net revenue during the nine months ended November 30, 2011 resulted from the adoption of the new accounting guidance pursuant to which we recorded revenue on certain transactions for which the previous accounting guidance would have required deferral until the final delivery of the on-demand solutions occurred, after which revenue would be ratably recognized over the term of the arrangement. With the adoption of the new accounting guidance, we recognize revenue for subscription and support services or professional services when all of the following criteria are met: persuasive evidence of an arrangement exists, access has been granted to our customers to the on-demand software solutions or services have been rendered.
The accounting related to revenue recognition in the software-as-a service industry is complex and is affected by interpretations of the rules which are subject to change. We evaluate revenue recognition on a contract-by-contract basis as the terms of each arrangement vary. The evaluation of our contractual arrangements often requires judgments and estimates that affect the timing of revenue recognized in our statements of operations.
Income Taxes
As of February 28, 2011, we had net operating loss, or NOL, carryforwards for federal income tax purposes of $306.7 million, which begin to expire in fiscal 2023, and have NOL carryforwards for state income tax purposes of $158.5 million, which have begun to expire in fiscal 2012. In order to utilize the NOLs, we must generate consolidated taxable income which can offset such carryforwards.
Section 382 of the Internal Revenue Code, or the Code, imposes limitations on a corporation’s ability to utilize its NOLs if the corporation experiences an ownership change, as defined in the Code. Based upon currently available information, we believe there was an ownership change in a prior year. As a result, utilization of our U.S. federal NOLs in future periods will likely be subject to an annual limitation under Code Section 382. As of February 28, 2011, federal and state net operating loss carryforwards for income tax purposes, before any Section 382 limitation, were $306.7 million and $158.5 million, respectively. Accordingly, we have reduced our deferred tax assets based upon the anticipated federal and state net operating losses that are expected to expire unutilized due to the annual limitation. The deferred tax asset associated with the NOLs is $96.3 million.
Consistent with GAAP requirements, we assessed, as of February 28, 2011, that it is not more likely than not that we will ultimately realize the benefit of our NOLs and have, therefore, recorded a full valuation allowance to reduce the carrying value of our NOLs to zero.
As of February 28, 2011, we had research and development tax credits of $4.9 million and $5.7 million available to reduce future federal and California income taxes, respectively. Federal research and development credit carryforwards will begin to expire in fiscal 2023. California research and development credits carry forward indefinitely.
68
Table of Contents
Stock-Based Compensation
Determining the fair value of stock-based awards at the grant date requires judgment. We use the Black-Scholes option-pricing model to determine the fair value of stock options. The determination of the fair value of stock-based payment awards on the date of grant using a pricing model is affected by our common stock fair value as well as by assumptions including our expected stock price volatility over the term of the awards, actual and projected employee stock option exercise behaviors, risk-free interest rates, and expected dividends, which are estimated as follows:
| • | Fair Value of Our Common Stock. Because our stock is not currently publicly traded, we must estimate the fair value of common stock, as discussed in “Common Stock Valuation” below. |
| • | Expected Term. The expected term was estimated using the simplified method allowed under SEC guidance giving consideration to the contractual terms of the stock-based awards, vesting schedules, and expectations of future employee behavior as influenced by changes to the terms of our stock-based awards. |
| • | Volatility. As a non-public entity, historic volatility is not available for our shares. As a result, we estimated volatility based on a peer group of companies, which collectively provide a reasonable basis for estimating volatility. We intend to continue to consistently use the same group of publicly traded peer companies to determine volatility in the future until sufficient information regarding volatility of our share price becomes available or the selected companies are no longer similar to us, in which case, more suitable companies whose share prices are publicly available would be utilized in the calculation. |
| • | Risk-free Rate. The risk-free interest rate is based on the yields of U.S. Treasury securities with maturities similar to the expected term of the options for each option group. |
| • | Dividend Yield. We have never declared or paid any cash dividends and do not presently plan to pay cash dividends in the foreseeable future. Consequently, we used an expected dividend yield of zero. |
We are required to estimate forfeitures at the time of grant and revise those estimates in the subsequent periods if actual forfeitures differ from those estimates. If we use different assumptions for estimating stock-based compensation expense in future periods or if actual forfeitures differ materially from our estimated forfeitures, future stock-based compensation expense may differ significantly from what we have recorded in the current period and could materially affect our operating income, net income (loss) and net income (loss) per share.
The fair value of employee stock options granted since March 1, 2008 was estimated at the grant date using the Black-Scholes option pricing model by applying the following assumptions:
| Year Ended February 28, | Nine Months Ended November 30, |
|||||||||||||||||||
| 2009 | 2010 | 2011 | 2010 | 2011 | ||||||||||||||||
| Expected term (in years) |
5.73 | 6.08 | 6.08 | 6.08 | 6.08 | |||||||||||||||
| Volatility |
51.0% - 61.0% | 50.8% - 57.7% | 45.9% - 51.9% | 45.9% - 51.9% | 44.0% - 48.0% | |||||||||||||||
| Risk-free interest rates |
1.8% - 3.6% | 2.4% - 3.0% | 1.8% - 2.8% | 1.8% - 2.8% | 1.4% - 2.5% | |||||||||||||||
| Dividend yield |
— | — | — | — | — | |||||||||||||||
Changes to the underlying assumptions, including increased forfeiture rates, may have a significant impact on the underlying value of the stock options, which could have a material impact on our consolidated financial statements.
As of February 28, 2011 and November 30, 2011, we had $716,000 and $788,000 of unrecognized compensation costs, excluding estimated forfeitures, related to unvested stock option awards, which are expected to be recognized over a weighted average period of 2.19 years and 2.85 years, respectively.
69
Table of Contents
Common Stock Valuation
Given the absence of any active market for our common stock, the fair value of the common stock underlying stock options granted was determined by our board of directors, with input from our management, and based in part on third-party valuations. The valuations were made with the intent to grant options at a price per share not less than the per share fair value of our common stock underlying those options on the date of grant.
We considered numerous objective and subjective factors in valuing our common stock at each valuation date in accordance with the guidance outlined in the American Institute of Certified Public Accountants Practice Aid, Valuation of Privately-Held-Company Equity Securities Issued as Compensation. These objective and subjective factors included, but were not limited to:
| • | our financial position and historical operating and financial performance as well as progress to date against planned budgets; |
| • | our financial projections and future prospects; |
| • | business conditions at the time; |
| • | the fact that option grants involved illiquid securities of a private company; |
| • | the likelihood of achieving a liquidity event for the shares of common stock underlying the options, such as an initial public offering or sale of our company, given prevailing market conditions and our relative financial condition at the time of grant; |
| • | the stock price performance of selected publicly held companies identified as being comparable to us; |
| • | the consideration received in connection with the issuance of shares to outside investors in arm’s-length transactions; and |
| • | the related rights and preferences associated with our common and preferred stock. |
We believe the valuation methodology employed for each date of determination provided a reasonable basis for estimating the fair value of our common stock.
The following table sets forth all stock option grants since March 1, 2010 through the date of this prospectus:
| Option Grant Dates |
Number
of Options Granted |
Exercise Price ($) | Common Stock Market Value ($) |
|||||||||
| 3/18/2010 |
3,253,000 | 0.01 | 0.01 | |||||||||
| 6/15/2010 |
1,490,000 | 0.07 | 0.07 | |||||||||
| 9/16/2010 |
237,000 | 0.07 | 0.07 | |||||||||
| 12/14/2010 |
1,234,000 | 0.08 | 0.08 | |||||||||
| 3/28/2011 |
6,698,000 | 0.09 | 0.09 | |||||||||
| 7/18/2011 |
42,718,750 | 0.09 | 0.09 | |||||||||
| 7/19/2011 |
853,500 | 0.09 | 0.09 | |||||||||
| 7/20/2011 |
4,000,000 | 0.09 | 0.09 | |||||||||
| 10/14/2011 |
2,632,000 | 0.11 | 0.11 | |||||||||
| 1/11/2012 |
1,426,000 | 0.23 | 0.23 | |||||||||
| 1/12/2012 |
1,900,000 | 0.23 | 0.23 | |||||||||
In order to determine the fair value of our common stock underlying option grants, we first determined our business enterprise value, and then allocated the business enterprise value to each element of our capital
70
Table of Contents
structure (preferred stock, common stock, warrants and options). Our business enterprise value was estimated using the market-based approach comparable company method. The market-based approach references actual transactions in the equity of the company being valued or transactions involving the equity of similar companies. This valuation method considers multiples of financial metrics based on both acquisitions and trading multiples of a selected peer group of companies. These multiples are then applied to our financial metrics to derive a range of indicated values. We also considered appropriate adjustments to recognize lack of marketability.
In allocating the total equity value between preferred and common stock, we assumed that the preferred stock would convert to common stock. Our indicated business enterprise value at each valuation date was allocated to the shares of preferred stock, common stock, warrants and options, using an option pricing method, or a combination of an option pricing method and a probability weighted method, or PWERM. Under an option pricing method, the common stock value is viewed as a claim on the enterprise’s liquidation or proceeds from an initial public offering after debt holders and preferred stockholders have been paid their principal and interest or liquidation preferences. This approach considers that the value associated with the common shares is based on our performance relative to the liquidation preferences of our share classes. Under PWERM, the value of the common stock was estimated based upon the analysis of values for us assuming various outcomes, through an initial public offering, sale of the company or remaining private and the estimated probability of each outcome assuming that all preferred stock is converted into common stock and any applicable dividends were paid. The recent valuations utilized PWERM as the principal valuation model, but the option pricing method was also considered to evaluate the reasonableness of the PWERM results.
There is inherent uncertainty in the estimates used in our valuations. If different discount rates, assumptions or weightings had been used, the valuations would have been different.
Specifics related to grants from March 1, 2010 to November 30, 2011 are as follows:
First Quarter—Fiscal 2011
During the first quarter of fiscal 2011, we granted 3,253,000 stock options with a per share exercise price of $0.01. In estimating the fair value of the common stock to set the exercise price of such options as of the March 18, 2010 grant date, our board of directors reviewed and considered an independent valuation report for our common stock as of April 24, 2009. Our board of directors determined that there were no significant factors affecting the value of our common stock that occurred between April 24, 2009 and March 18, 2010. The primary valuation considerations were:
| • | A business enterprise equity value of $58.0 million as of the independent valuation report date, which was determined based on the market-based approach. The valuation was lower compared to the $93.1 million equity value on the prior valuation report as of September 30, 2008. Our board of directors concluded that the lower valuation was reasonable considering the macro-economic climate and the Company’s financial position during the first quarter of fiscal 2011. |
| • | A lack of marketability discount of 25%. |
| • | Liquidity event scenario probabilities of 5% for an initial public offering, 50% for a near-term acquisition, 30% for a dissolution and 15% for a long-term acquisition. We determined that stock market conditions in general, and the market for initial public offerings in particular, were such that it was unlikely that we would be able to undertake an offering in 2010 and that there was only a 5% probability that we would be able to successfully complete an offering in 2011. |
Second Quarter—Fiscal 2011
During the second quarter of fiscal 2011, we granted 1,490,000 stock options with a per share exercise price of $0.07. In estimating the fair value of the common stock to set the exercise price of such options as of
71
Table of Contents
June 15, 2010, our board of directors reviewed and considered an independent valuation report for our common stock as of April 30, 2010. Our board of directors determined that there were no significant factors affecting the value of our common stock that occurred between April 30, 2010 and June 15, 2010. The primary valuation considerations were:
| • | A business enterprise equity value of $145.9 million as of the independent valuation report date, which was determined based on the market-based approach. The increase from the prior valuation was primarily driven by higher revenue multiples reflected in the market prices of our specific benchmarked companies. |
| • | A change in the specific comparable companies included in our benchmarked companies to a more focused group of companies. During the second quarter of fiscal 2011, our management team began receiving informal marketing materials and presentations from investment banks regarding a potential engagement in connection with capital raising activities. Our management considered all comparables listed by various investment banks in marketing presentations and selected what they believed to be the most comparable companies based on industry served. |
| • | A lack of marketability discount of 20%. The discount was determined based on benchmarking our size, historical revenue growth and operational results against the comparable companies. |
| • | Liquidity event scenario probabilities of 20% for an initial public offering, 40% for a premium strategic sale, 30% for a strategic sale and 10% for dissolution. The probability of an initial public offering was more likely than previously estimated based on improved industry and financial market conditions. |
Third Quarter—Fiscal 2011
During the third quarter of fiscal 2011, we granted 237,000 stock options with a per share exercise price of $0.07. In estimating the fair value of the common stock to set the exercise price of such options as of September 16, 2010, our board of directors reviewed and considered an independent valuation report for our common stock as of July 31, 2010. Our board of directors determined that there were no significant factors affecting the value of our common stock that occurred between July 31, 2010 and September 16, 2010. The primary valuation considerations were:
| • | A business enterprise equity value of $138.0 million as of the independent valuation report date, which was determined based on the market-based approach. The decrease from the prior valuation was primarily driven by a slight decrease in revenue multiples for the entire market. Notwithstanding the decrease in enterprise equity value, the board of directors elected not to change the per share value allocated to common stock based on an option pricing method. |
| • | A lack of marketability discount of 20%. |
| • | Liquidity event scenario probabilities of 20% for an initial public offering, 40% for a premium strategic sale, 30% for a strategic sale and 10% for dissolution. There was no change in the probability assessments from the prior valuation. |
Fourth Quarter—Fiscal 2011
During the fourth quarter of fiscal 2011, we granted 1,234,000 stock options with a per share exercise price of $0.08. In estimating the fair value of the common stock to set the exercise price of such options as of December 14, 2010, our board of directors reviewed and considered an independent valuation report for our common stock as of October 31, 2010. Our board of directors determined that there were no significant factors
72
Table of Contents
affecting the value of our common stock that occurred between October 31, 2010 and December 14, 2010. The primary valuation considerations were:
| • | A business enterprise equity value of $152.0 million as of the independent valuation report date, which was determined based on the market-based approach. The increase from the prior valuation was primarily driven by an increase in market values for companies in general, and thus an increase in revenue multiples for the entire market. Additionally, management also concluded that the use of the trailing 12 months revenue from the valuation date and next 12 months revenue in calculating the enterprise equity value were better value indicators, compared to the latest historical annual and forward revenue used in the prior valuation. This change increased the equity value reflecting our higher revenues in fiscal 2011 compared to fiscal 2010. |
| • | A lack of marketability discount of 20%. |
| • | Liquidity event scenario probabilities of 20% for an initial public offering, 40% for a premium strategic sale, 30% for a strategic sale and 10% for dissolution. There was no change in the probability assessment from the prior valuation. |
First Quarter—Fiscal 2012
On March 28, 2011, we granted 6,698,000 stock options with an exercise price of $0.09 per share. In estimating the fair value of the common stock to set the exercise price of such options as of March 28, 2011, our board of directors reviewed and considered an independent valuation report for our common stock as of January 31, 2011. The independent valuation report reflected a fair value for our common stock of $0.09. Our board of directors determined that there were no significant factors affecting the value of our common stock that occurred between January 31, 2011 and March 28, 2011. The primary valuation considerations were:
| • | A business enterprise equity value of $160.0 million as of the independent valuation report date, which was determined based on the market-based approach. The slight increase in our enterprise value from $152.0 million to $160.0 million was primarily driven by the higher revenue multiples of our specific benchmarked companies. |
| • | A lack of marketability discount of 20%. The discount rate remained unchanged from our prior valuation. |
| • | Liquidity event scenario probabilities of 20% for an initial public offering, 45% for a premium sale and 25% for a sale or merger and a 10% probability for dissolution. Our board of directors determined that stock market conditions in general, and the market for initial public offerings in particular, were such that there was only a 20% probability that we would be able to successfully complete an offering in 2011 or 2012. |
| • | An increase in market values for companies in general, and thus an increase in revenue multiples for the entire market. |
Second Quarter—Fiscal 2012
In July 2011, we granted 47,572,250 stock options with a per share exercise price of $0.09 per share. In estimating the fair value of our common stock, the board of directors reviewed and considered an independent valuation report of our common stock as of May 13, 2011. The independent valuation report reflected a valuation of $0.08 per share. Our board of directors also considered the valuation report as of January 31, 2011, which reflected a valuation of $0.09 per share. Our board of directors, based on several factors, determined that the fair value of the common stock as of the grant dates in July 2011 was $0.09. The primary valuation considerations were:
| • | A business enterprise equity value of $150.0 million as of the independent valuation report date, which was determined based on the market-based approach. |
73
Table of Contents
| • | Between the valuation date of May 13, 2011 and the grant dates in July 2011, our board of directors also considered several factors in determining the market value of the common stock to be $0.09. These included consideration of our financial condition, revenue outlook, status of product development, book value, the current market and venture capital financing environment, conditions and risk factors relevant to our business, the value of our tangible and intangible assets, the present value of our future cash flows, and the market value of companies that were engaged in substantially similar businesses and whose equity securities were traded on an established market. |
Third Quarter—Fiscal 2012
During the third quarter of fiscal 2012, we granted 2,632,000 stock options with a per share exercise price of $0.11. In estimating the fair value of the common stock to set the exercise price of such options as of October 14, 2011, the board of directors reviewed and considered an independent valuation report for our common stock as of September 15, 2011. The independent valuation report reflected a fair value for our common stock of $0.11. Our board of directors determined that there were no significant factors affecting the value of our common stock that occurred between September 15, 2011 and October 14, 2011. The primary valuation considerations were:
| • | A business enterprise equity value of $158.6 million as of the independent valuation report date, which was determined based on the market-based approach. |
| • | A lack of marketability discount of 20%. |
| • | Liquidity event scenario probabilities of 40% for an initial public offering, 40% for a premium sale and 15% for a sale or merger. A dissolution scenario was deemed unlikely and was thus assigned only a 5% probability. The probability of an initial public offering in 2011 was deemed by our board of directors to be more likely than previously estimated. In determining the probabilities, our board of directors determined that the initial public market offering market appeared to be improving during the second half of 2011, and management commenced discussions on the timing of an initial public offering with investment banks. The higher probability of an initial public offering resulted in higher estimated common stock per share value of $0.14 per share compared to the prior valuation of $0.09 under PWERM. |
| • | We placed equal weight on the option pricing method, which yielded a $0.09 price per share, and PWERM, which yielded a $0.14 price per share, to arrive at the $0.11 fair market value of our common stock. |
Fourth Quarter—Fiscal 2012
During the fourth quarter of fiscal 2012, we granted 3,326,000 stock options with a per share exercise price of $0.23. In estimating the fair value of the common stock to set the exercise price of such options as of January 11, 2012 and January 12, 2012, our board of directors reviewed and considered an independent valuation report for our common stock as of December 15, 2011. The independent valuation report reflected a fair value for our common stock of $0.23. Our board of directors determined that there were no significant factors affecting the value of our common stock that occurred between December 15, 2011 and January 11, 2012 or January 12, 2012. The primary valuation considerations were:
| • | A business enterprise equity value of $224.1 million as of the independent valuation report date, which was determined using the probability-weighted expected return method and represented an increase in value of $65.5 million since the September 15, 2011 independent valuation report. |
| • | A lack of marketability discount of 10%. The decline in the lack of marketability discount from our prior independent valuation report was attributed to the growth of our business and a reduction in time to the expected initial public offering. |
74
Table of Contents
| • | Liquidity event scenario probabilities of 50% for an initial public offering, 35% for a premium sale and 10% for a sale or merger. A dissolution scenario was deemed unlikely and was thus assigned only a 5% probability. The probability of an initial public offering was more likely than previously estimated reflecting management’s expectations regarding the Company’s ability to execute an initial public offering based on our operational results for the nine months ended November 30, 2011 and current industry and financial market conditions. |
Quantitative and Qualitative Disclosures about Market Risk
Market risk represents the risk of loss that may impact our financial position due to adverse changes in financial market prices and rates. Our market risk exposure is primarily a result of fluctuations in interest rates and foreign currency exchange rates. We do not hold or issue financial instruments for trading purposes.
Interest Rate Risk
We had cash and cash equivalents of $15.6 million at February 28, 2009, $9.5 million at February 28, 2010 and $10.1 million at February 28, 2011. These amounts were held primarily in cash or money market funds. Cash and cash equivalents are held for working capital purposes, and restricted cash amounts are held as security against various lease obligations. Due to the short-term nature of these investments, we believe that we do not have any material exposure to changes in the fair value of our investment portfolio as a result of changes in interest rates. We believe that we do not have any material exposure to changes in the fair value as a result of changes in interest rates. Declines in interest rates, however, would reduce future investment income.
At February 28, 2009, February 28, 2010, February 28, 2011 and November 30, 2011, we had bank borrowings of $12.3 million, $6.3 million, $8.0 million, and $10.8 million. The interest rate on our line of credit is variable and adjusts periodically based on the prime rate.
Foreign Currency Exchange Risk
Our results of operations and cash flows are subject to fluctuations due to changes in foreign currency exchange rates, particularly the exchange rates for the Euro and the Malaysian Ringgit. In the nine months ended November 30, 2011, we sought to hedge the risks associated with exchange rate fluctuations through entry into forward exchange contracts. The tables below present the notional amounts (at the contract exchange rates), the weighted-average contractual foreign currency exchange rates, and the estimated fair value of our contracts outstanding as of November 30, 2011.
| Notional Sell (Buy) |
Average Contract Rate |
Estimated Fair Value |
||||||||||
| (Dollars in thousands) | ||||||||||||
| Foreign currency forward exchange contracts: |
||||||||||||
| Euro |
$ | 3,433.8 | 1.37 | $ | 71.1 | |||||||
| Malaysian Ringgit |
(3,199.8 | ) | 3.10 | (72.8 | ) | |||||||
|
|
|
|
|
|||||||||
| Total |
$ | 234.0 | $ | (1.7 | ) | |||||||
|
|
|
|
|
|||||||||
We entered into all of the foreign exchange contracts with a single counterparty. Typically, we have the right of offset for gains earned and losses incurred under these contracts.
75
Table of Contents
The following table presents a sensitivity analysis of our foreign forward exchange contract portfolio using a statistical model to estimate the potential gain or loss in fair value that could arise from hypothetical appreciation or depreciation of foreign currency.
| Foreign Forward Exchange Contracts |
Value of Contracts Given X% Appreciation of Foreign Currency |
Notional Amount Sell (Buy) |
Value of Contracts Given X% Depreciation of Foreign Currency |
|||||||||||||||||
| 10% | 5% | -5% | -10% | |||||||||||||||||
| (Dollars in thousands) | ||||||||||||||||||||
| Euro |
$ | 3,090.4 | $ | 3,262.1 | $ | 3,433.8 | $ | 3,605.5 | $ | 3,777.2 | ||||||||||
| Malaysian Ringgit |
(2,908.9 | ) | (3,047.4 | ) | (3,199.8 | ) | (3,368.2 | ) | (3,553.3 | ) | ||||||||||
As our international operations continue to grow, we may choose to utilize more foreign currency forward and option contracts to manage currency exposures. We did not have similar contracts in place during fiscal years 2009, 2010 or 2011.
Fair Value of Financial Instruments
We do not have material exposure to market risk with respect to investments, as our investments primarily consist of highly liquid investments purchased with a remaining maturity of three months or less. We do not use derivative financial instruments for speculative or trading purposes; however, this does not mean that we may not adopt specific hedging strategies in the future.
Recently Issued and Adopted Accounting Guidance
Effective March 1, 2011, we adopted new authoritative guidance for revenue recognition which revised existing guidance for arrangements with multiple deliverables, as more fully described in “Critical Accounting Policies and Estimates.” The revised guidance establishes a selling price hierarchy for determining the selling price of a deliverable, which includes: (i) vendor-specific objective evidence, or VSOE, if available; (ii) third-party evidence, or TPE, if VSOE is not available; and (iii) estimated selling price, or ESP, if neither VSOE nor TPE is available. The revised guidance also eliminates the residual method of allocation and requires that arrangement consideration be allocated at the inception of the arrangement to all deliverables using the relative selling price method. We elected to adopt this accounting guidance on a prospective basis for all periods.
Under the previous accounting guidance, we treated our multiple element arrangements as a single unit of accounting as we generally did not have VSOE for our undelivered elements. Under the new guidance, we are required to use ESP when neither VSOE nor TPE is available. As a result, we recognize the estimated selling price of the elements as they are delivered, assuming all other revenue recognition criteria are met.
On May 12, 2011, the FASB issued new guidance about fair value measurement and disclosure requirements. The new standards do not extend the use of fair value but, rather, provide guidance about how fair value should be applied where it already is required or permitted under International Financial Reporting Standards or GAAP. A public entity is required to apply the guidance prospectively for interim and annual periods beginning after December 15, 2011, and early adoption is not permitted. We do not expect the adoption of the new accounting guidance will have a material impact on our consolidated financial statements.
On June 16, 2011, the FASB issued new guidance on the presentation of other comprehensive income (loss) in financial statements. Under this new accounting guidance, an entity will have the option to present the components of net income and comprehensive income in either one or two consecutive financial statements. The new accounting guidance eliminates the option in U.S. GAAP to present other comprehensive income in the statement of changes in equity. An entity should apply the new accounting guidance retrospectively. For a public entity, the new accounting guidance is effective for fiscal years, and interim periods within those years, beginning after December 15, 2011. Early adoption is permitted. We plan to adopt the provisions of the new accounting guidance in the year ending February 28, 2013. The adoption of this accounting update will have no impact on our financial position, results of operations, or cash flows.
76
Table of Contents
Company Overview
We are a leading provider of cloud-based, on-demand software solutions delivered on an integrated platform that enables companies to collaborate with their trading partners to procure, manufacture, sell and distribute products more efficiently. Our customers depend on outsourced manufacturing strategies and complex trading networks to compete in today’s global economy. They use our solutions to gain visibility into and control over their trading networks through the real-time information, integrated business processes and advanced analytics that we provide. Our solutions enable our customers and their trading partners to overcome problems arising from communications across disparate systems by offering a reliable source of data, processes and analytics, which our customers rely on as the single version of the truth. Our solutions empower our customers to manage demand they cannot predict and supply they do not control.
We refer to the combination of our software applications delivered on our cloud-based platform, the content contributed by our network participants and our enabling services as the E2open Business Network. The E2open Business Network has grown to over 29,000 unique registered trading partners. It allows our network participants to access and share data and execute business processes in a secure, real-time manner, while providing them with collaboration tools and analytics so that our customers can make more informed and efficient decisions. This enables our customers to make more informed and efficient decisions.
E2open transcends traditional supply chain software categories, which include B2B integration, procurement, forecasting, planning and execution, by also enabling coordination and collaboration between enterprises, which we call “collaborative execution.” By providing our solutions in an integrated cloud-based environment, our customers and their trading partners can easily share detailed and relevant content and data to gain the visibility they need for collaborative execution across their extended trading network. We enable collaborative execution for multi-enterprise and multi-tier process coordination, real-time analytics to identify risks and opportunities, and collaborative decision support for managing exceptions and executing decisions.
Our customers benefit from the following key differentiating features of the E2open Business Network:
| • | Cross-network analytics. We provide cross-network analytics for real-time monitoring and control of large volumes of data to sense and respond quickly and collaboratively to changes, opportunities or disruptions in the supply chain. |
| • | Multi-enterprise, multi-tier supply and demand process management. We support key operational processes, such as forecast, order and inventory management, for our customers and their multi-tiered supply and demand trading networks. |
| • | Scalable, secure cloud-based connectivity platform. Our solutions combine B2B connectivity and integration capabilities that allow our customers to securely connect, share and act on information across their trading networks can include thousands of partners. |
| • | Integration with existing systems. Our highly-configurable solutions integrate with many leading ERP systems to efficiently manage complex networks and facilitate the interchange of transactions. |
We believe that the E2open Business Network is strategic to our customers in that it enables them to increase revenue and productivity, and to reduce operating expenditures, working capital and cost of goods sold. Our solutions seamlessly integrate with and enhance our customers’ mission critical business systems and processes across their trading network.
77
Table of Contents
Our customers are primarily multi-national corporations with complex product and services portfolios. To date, our target markets have been Technology, Telecommunications, Aerospace and Defense, and Consumer Products. Our customers represent a wide range of industries and include many of the leading brand owners in the Fortune 500, among them five of the top eight as designated in the Gartner Supply Chain Top 25. As we continue to scale our business, our platform will allow us to better serve middle market companies in a cost-effective manner.
Our revenue has grown from $37.7 million for the fiscal year ended February 28, 2009 to $44.3 million in fiscal 2010 to $55.5 million in fiscal 2011. For the nine months ended November 30, 2011, we had revenue of $42.7 million. For the fiscal years ended February 28, 2009, February 28, 2010 and February 28, 2011, and the nine months ended November 30, 2011, the percentage of our revenue generated outside of the United States was 29%, 23%, 37% and 36%, respectively.
Industry Overview
The accelerating trends of supply chain globalization and outsourced manufacturing and distribution have combined to increase complexity and risk for brand owners while decreasing visibility into their expanding and evolving supply chains and distribution networks. These trends have created a fundamental shift in the way companies source and distribute goods and services. They have led to an ever more complex product and service delivery paradigm which increasingly relies on specialized, globally distributed trading partners to reduce costs.
Driving these trends are increasing global competition and mounting pressure to reduce costs, which have led companies to focus on their core activities in which they have a competitive advantage while outsourcing business functions such as manufacturing, distribution and transportation. Brand owners historically manufactured, distributed and sold their own products; today, those functions are often handled by distinct entities dispersed around the world. As a result, goods and services are frequently sourced from, produced by and distributed through various external parties. The process of bringing products to market now requires increased coordination across multiple tiers of a supply chain, creating a need for better communication, connectivity and collaboration across supply chain participants, which to date has been addressed principally by inefficient, labor-intensive methods such as phone, faxes, e-mails and spreadsheets.
Today, supply chains are complicated by the increasingly global nature of the supply and demand of products and services. Diverse local customer preferences and evolving international markets require that companies respond more effectively to diverse consumer demands. Different time zones, languages, laws and regulations, levels of technological sophistication and cultural differences increase the challenges involved in managing a global supply chain. As economies become more interdependent and as business cycles require more timely responsiveness, companies need to be able to operate with increased flexibility, improved orchestration of complex processes and faster execution.
The systems currently in place at most companies to address these business complexities, namely ERP systems, were developed within a legacy environment through which companies generally managed their supply chains in a compartmentalized, linear fashion, relying upon sequential planning and step-by-step execution. While ERP systems are capable of providing an effective data and transaction repository inside the four walls of a company, brand owners struggle with fragmented planning and execution outside the four walls of their enterprise. These traditional, on-premise enterprise systems can be difficult and costly to connect externally and scale across the expanding network of trading partners.
Adding to these complications are the challenges commonly associated with “Big Data.” Large, multi-national corporations are producing and accessing large and growing volumes of data. The volume of such information often requires continuous sharing among the various partners in the supply chain. Existing infrastructure typically lacks the ability to coordinate and process these interactions effectively, and inaccuracies and delays can cause costly mistakes or render data obsolete. Even if data is quickly and seamlessly transmitted, most current systems are not designed to allow managers to interpret the information they are receiving or make
78
Table of Contents
the real-time decisions that are often required when responding to changes in production or delivery. Because managers using such systems lack the end-to-end visibility across trading networks that extends from the brand owner to the components provider in the supply channel, they are prone to build products that are not of the quantity or fit required to satisfy their customers’ demands. In addition, brand owners are generally sourcing from providers over which they do not have visibility or control. As a result, companies are hindered from executing efficiently and struggle to provide the superior customer service, return on assets and profitability their stakeholders require.
Without an integrated, real-time solution, companies are forced to continue relying on inefficient manual methods, such as phone, faxes, e-mails and spreadsheets, causing them to hedge against under- or misdelivery. This often results in inventory buffering to avoid shortages, or in cases of shortages, emergency shipping, both of which are inefficient and costly uses of working capital. Further, demand volatility, accelerating product lifecycles and supply disruptions (e.g. tsunamis, floods, political unrest and economic uncertainty) have and will continue to stress traditional supply chain management systems and practices. Today’s brand owners require a collaborative platform to bridge these disparate ERP and point solutions which goes beyond connecting data and enables companies to act on real-time information.
As trading networks become more complex, companies are increasingly demanding integrated solutions that facilitate not only collaborative inventory management, but also the demand and supply forecasts, procurement systems, order management and analytics required to efficiently coordinate a company’s entire business ecosystem. We believe a significant opportunity exists to help companies improve their competitive advantage by delivering the visibility and control once characteristic of vertically integrated companies while retaining the advantages of outsourcing. The ability to navigate modern supply chain complexities and to resolve problems in a timely and collaborative manner, combined with enhanced knowledge of end customer demand, is critical to enabling businesses to better match supply and demand.
Our collaborative execution solutions address an opportunity comprised of three markets that include, integration brokerage software, supply chain execution software and supply chain planning software. These three markets are forecasted by Gartner, Inc. to grow collectively at an 11.3% compound annual growth rate from an aggregate of approximately $5.5 billion in 2010 to $9.4 billion in 2015.
Our Solutions
We develop, operate and market an integrated platform that addresses supply chain management challenges by providing cross-network analytics, multi-enterprise, business process management and B2B integration solutions for companies seeking visibility across and control over their trading networks. We deliver our solutions in a highly secure, cloud-based computing environment. Our customers subscribe to our on-demand software-as-a-service solutions with multi-year contract terms that are typically three years in length. Our offerings include not only robust and highly scalable software, but also the benefits of having over 29,000 unique registered trading partners participating in a broad range of multi-tier supply chains. We also provide enabling services to our customers, ranging from consulting services to ongoing support services, which ultimately result in improved business processes for our customers and their trading partners.
79
Table of Contents
The E2open Business Network
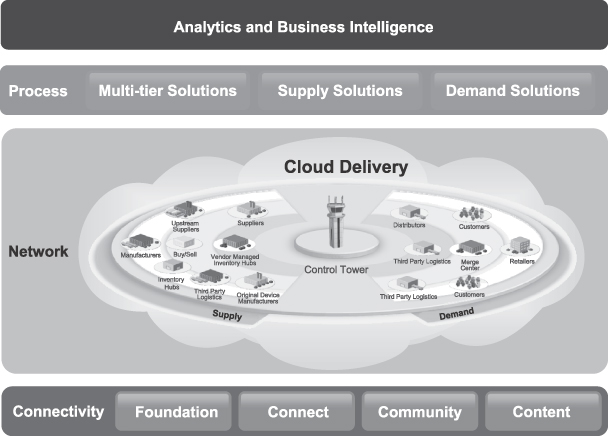
The E2open Business Network enables integrated planning and execution across trading partner networks. Our cloud-based technology stack is purpose-built for managing trading partner networks and enables our customers and their partners to increase their revenues while reducing costs by minimizing errors and maximizing efficiency. The key characteristics of the E2open Business Network that drive customer adoption include:
Large global business network. Our solutions have been designed for companies that either manage or participate in distributed supply chains and whose business processes require collaboration among numerous entities performing multiple interdependent activities to source, produce and fulfill demand for their products across disparate geographies. We serve more than 230 customers in 62 countries who use our solutions in 9 languages and trade in 26 different currencies. At its core, the E2open Business Network allows network participants to securely provide and access information and execute business processes with external parties in real time to coordinate their key supply chain related functions.
Demand-driven model. Our solutions enable our customers to transform their trading networks from a forecast-driven production model, where products are manufactured in anticipation of future demand, to a demand-driven fulfillment model, which is responsive to changes in actual current end-user demand or constraints in supply. Our platform allows trading partners to collaborate in real time, execute carefully-managed business processes across trading partners and sense and respond to information in a timely manner, allowing them to more effectively react to changes in demand. These real-time capabilities enable enterprises to interact with their global trading partners essentially as if they were internal operating units.
80
Table of Contents
Multi-tier functionality. Our solutions allow trading network participants to better manage processes and information, relating to raw materials, products, finished goods and related services, across multiple tiers—from the extended supply base, to their outsourced manufacturing partners, then on to their distribution channels and ultimately to the end customer. Our solutions were designed to overcome the challenges arising from expanded trading networks, including siloed processes, limited connectivity and data integrity issues. These solutions not only extend an enterprise’s existing systems and processes to its immediate trading partners, but also support visibility into and management of the extended tiers of its manufacturing, production and distribution network.
Cloud-based platform. Unlike many companies operating legacy on-premise solutions that are difficult and costly to configure and support, our customers and their trading partners using the E2open Business Network are able to share, analyze and act on information in real time on a common platform. Our cloud-based platform enables process management and information exchange among our customers and their trading partners.
Enterprises can leverage our enabling expertise and services when they need to deploy a new or changed process capability or add a trading partner. By creating a single, unified source of information within the trading network, we enable enterprises to operate and make decisions based on reliable and trustworthy information in real time. By implementing the E2open Business Network and adopting collaborative execution, our customers and their trading partners improve communication, multi-enterprise process performance, and tactical and strategic decision making. Our customers use our solutions to:
| • | Increase sales by optimizing inventory levels; |
| • | Achieve greater revenue assurance and customer satisfaction through timely order fulfillment; |
| • | Reduce costs and working capital requirements through automation of operations, inventory reduction and enhanced procurement efficiency; |
| • | Achieve faster and easier on-boarding of trading partners to our platform by utilizing each partner’s existing technological infrastructure; and |
| • | Reduce deployment risk, streamline operations and lower maintenance costs, without a significant upfront investment in on-premise software or ongoing investments in software maintenance. |
Our Strategy for Growth
Our objective is to be the leading provider of multi-enterprise, cloud-based, on-demand software enabling enterprises to more efficiently and profitably procure, manufacture, sell and distribute products through collaborative execution. The key elements of our strategy include:
Leverage our existing network to add customers. The E2open Business Network creates a network effect by attracting the largest suppliers and customers in a particular industry vertical to establish and grow our presence. Once a number of prominent enterprises purchase our solutions and develop separate ecosystems comprised of their trading partners, their trading partners then add data onto our platform that ultimately drives growth in the use of our applications. As our network of trading partners grows in an industry, the value we deliver to our customers, and potential customers, increases. We intend to leverage our customers’ expanding ecosystems to attract new customers and convert trading partners from within our network into direct customers.
Up-sell additional solutions to our existing customers. Once our customers begin to rely on the real-time data and visibility provided by our platform and solutions, they typically purchase additional solutions from us. We intend to continue to leverage our knowledge of and familiarity with our existing customers to deliver additional solutions to them. Through our existing customer network and growing product portfolio, we have a
81
Table of Contents
significant opportunity to up-sell additional applications as our customers seek to add greater functionality to their respective networks. With each of our major customers, we nurture this up-sell strategy by developing a multi-year business plan or roadmap for the customer which provides continuous improvement to their operations and results in further growth for both our customer and our company.
Expand into new verticals. We believe our experience with our customers in our initial target markets provides a successful model for future growth. We have found that the challenges presented by managing inventory, orders, and planning are similar across many industries which makes our solutions applicable to a wide array of industry verticals. We intend to leverage our experience, expertise and proven customer success within our current key verticals to accelerate entry into and delivery of our solutions to these new vertical markets. Our expansion into the consumer products industry demonstrates our ability to transfer our capabilities to leading companies in new verticals that face challenges common to our existing customers.
Introduce new products. We will continue to expand our portfolio of solutions by leveraging our familiarity with advanced supply chains and over 29,000 of our partners in our trading network to develop new applications and introduce new products that are strategic to our customers and their trading networks. Our analytics solution enables cross-network collaborative decision making and problem or exception resolution, all of which provides users with a real-time system for faster and more effective decision making.
Expand our international presence. For the nine months ended November 30, 2011, we generated 36% of our revenue from sales to customers outside of the United States. In 2010, we grew our sales team in Europe, and we intend to hire additional sales personnel in Germany, France and the Nordic countries. In 2011, we opened an office and established a direct sales force and a sales, hosting and distribution alliance with a local partner in China. We intend to make additional investments outside of the United States in order to expand our geographic reach.
Expand our target market to include mid-market customers. Historically, we have focused our sales and marketing efforts on the largest companies within specific vertical markets. Once these key relationships are developed, they have historically yielded very low churn rates, allowing us to focus on driving adoption of our solutions by smaller, mid-market companies in the same industry. By leveraging our established trading network and cloud-based subscription model, we can offer cost-effective, pre-packaged solutions to expand our target market to include mid-market customers. By packaging, designing and pricing our solutions for the mid-market, we are able to expand our addressable market, accelerate our sales cycles and further expand our E2open Business Network.
Make targeted, strategic acquisitions. We intend to complement our organic growth with strategic acquisitions of technologies, solutions and businesses that enhance and expand our existing offerings.
Our Products and Services
We believe that our solutions transcend the limitations of traditional supply chain technology barriers by utilizing cloud-based strategic collaboration to connect companies within their trading networks. Our solutions help enterprises more efficiently manage and interact with their trading partners to procure, manufacture, sell and distribute their products to end customers, with the goal of efficiently and profitably fulfilling end customer demand.
Our software offers multi-enterprise analytics; flexible demand, supply and multi-tier processes; and B2B integration functionality configurable to the customer’s specific needs. In addition to our software offerings, we provide network content and enabling services to our customers.
82
Table of Contents
E2open Business Network:
Multi-Enterprise Software Platform and Network Content Supported by Enabling Services
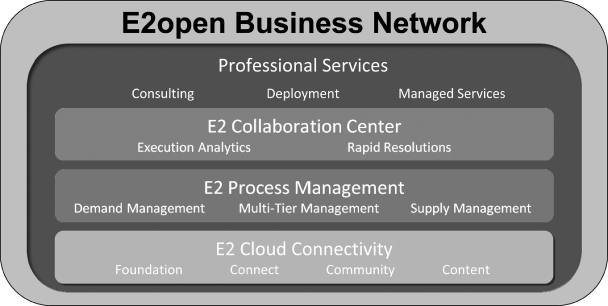
E2open Collaboration Center: Execution Analytics and Rapid Resolutions
The increasingly complex and distributed flow of goods and information across the entire network of demand, supply, logistics and warehousing partners has presented companies with significant challenges in collectively sensing and responding to changes in demand and supply. The E2open Collaboration Center provides real-time dashboard visibility for multiple partners on the network into demand and supply changes as well as access to cutting edge analytics to assess the operational and financial impact of changes, and “what-if” decision support to preempt issues or resolve problems rapidly.
The following are examples of capabilities offered through our E2open Collaboration Center:
Execution Analytics provide predictive intelligence, based on multi-enterprise data and process input, including key performance indicators, trends, scorecards and event notifications for supply and demand. This solution provides real-time data related to transformation, aggregation and loading of standard business intelligence processes. Our execution analytics solutions reside on two dashboards:
Demand Analytics Dashboard
| • | Provides real-time visibility to demand side metrics and critical actionable events |
| • | Features a dashboard that presents critical financial metrics such as revenue trends, inventory turns and gross margin |
Supply Analytics Dashboard
| • | Provides real-time visibility to procurement, inbound logistics and inventory related metrics and critical actionable events related to parts shortages, cost and liability exposure |
| • | Features a dashboard that presents critical financial metrics such as total cost to serve, component inventory liability and gross margin |
83
Table of Contents
Rapid Resolutions provide decision support intelligence assessing both unit and financial views of opportunities and tradeoffs thereby providing the opportunity to select alternate resolutions with the ability to collaboratively execute those chosen paths with partners across the network. Third party services, content and applications, including advanced planning, can also be integrated and shared via the Collaboration Center.
Part Shortage Workbench
| • | Run-time simulation tool that allows companies to identify projected part shortages at suppliers |
| • | Enables companies to determine finished good impact, provides severity based prioritization alternatives and global shortage visibility |
| • | Enables chosen-scenario inventory transfers via workflow management |
Fulfillment Workbench
| • | Run-time simulation tool that allows companies to evaluate, validate, change and confirm order promises using a wide criteria set including customer priority, gross margins, revenue impact and other priority criteria in a discrete order-based or vendor managed inventory, or VMI,-based environment |
| • | Enables companies to use financial metrics to fine tune the customer fulfillment workflow |
Replenishment Workbench
| • | Run-time simulation tool that allows companies to rebalance inventories and redirect shipments to ensure continuity of supply based on end customer priority |
| • | Features workbench “what-if” capability that allows scenario comparisons based on a wide range of metrics enabling planners to select the execution signals that best resolve their issues |
E2 Process Management: Demand
Our multi-enterprise software for demand processes allows enterprises, in their role as suppliers, to reduce the cost and complexity of order fulfillment for their products. Examples of demand processes enabled by our multi-enterprise, business process management applications include:
Collaborative Demand Planning
| • | Communication and collaboration between a company and its customers on forward-looking forecasts to synchronize mid to long term plans |
Sales Order Collaboration
| • | Customer collaboration on sales orders including order acceptance, order change, order promise, order fulfillment, invoices and payments |
Inventory Visibility
| • | Visibility into inventory positions at customers’ sites or in their distribution channels |
Inventory Replenishment (vendor/supplier managed inventory, or VMI/SMI)
| • | Customer collaboration on inventory positions and automated management of inventory replenishment in distribution channels |
84
Table of Contents
Logistics Visibility
| • | Track products as they move through a transportation and logistics network while proactively assessing and managing impact of delays |
Channel Master Data
| • | Collection of data from distribution channels by facilitating connection, transfer, and transformation of data to and from external systems |
E2 Process Management: Multi-tier
Our multi-enterprise software for multi-tier processes allows enterprises to better manage the demand for materials, products and finished goods. Improved control and visibility is extended not only to first tier trading partners, but also to a customer’s outsourced manufacturing partners and throughout its various distribution channels.
These solutions also support visibility and management into the extended tier two and three supply base as well as tier two and three customer fulfillment network. Examples of multi-tier processes enabled by our multi-enterprise, business process applications include:
Order Execution
| • | Capability to couple and de-couple orders across multiple internal and/or external parties masking specific data elements such as price. Management of collaboration of these multi-party orders including order acceptance, order change, order promise, order fulfillment, invoices and payments |
Customer Fulfillment
| • | Provides complete coordination of customer demand fulfillment, from order capture to identifying the optimal source for fulfillment, rapid order promise and fulfillment of the orders using a network of finished goods, semi-finished goods and manufacturing partner capacity |
| • | Provides logistics visibility of goods flow to the customer and supports key financial transactions such as invoices and payments to provide end-to-end workflow visibility |
Central Procurement
| • | Enables companies to consolidate spending and coordinate supply assurance for key components with their external outsourced manufacturing partners |
| • | Enables customers to support procurement through purchase orders and take control of component shortages by strategically allocating material to contract manufacturers |
| • | Allows companies to centralize, whether for tax optimization or otherwise, while supporting fully distributed fulfillment and logistics |
Inventory Execution
| • | Enables companies to coordinate supply assurance for key components with their external outsourced manufacturing partners using a VMI based process |
| • | Enables customers to use a blanket purchase order process and take control of component shortages by strategically allocating material to contract manufacturers |
| • | Allows companies to centralize, whether for tax optimization or otherwise, while supporting fully distributed fulfillment and logistics |
85
Table of Contents
Demand Driven Replenishment
| • | Provides a platform for companies that support their customers using a replenishment model |
| • | Allows companies to strategically position finished goods and semi-finished goods at customer or regional hubs and ensure continuous availability of products to customers |
Multi-tier Cost Management
| • | Allows customers to collect and manage the total landed cost by aggregating component costs across the full bill of materials and by incorporating other cost elements such as logistics and holding costs |
| • | Allows customers to factor in rebates and volume discounts for components for accurate cost accounting as well as for strategic buy decisions |
| • | Allows customers to quickly compare negotiated and actual costs and identify reasons for deviation |
Multi-Tier Logistics Visibility
| • | Ability to track material as it moves through a transportation and logistics network across multiple tiers of the supply chain proactively assessing and managing impact of delays |
E2 Process Management: Supply
Our multi-enterprise software for supply processes allows enterprises, in their role as customers, to better fulfill their demand for material and products into their own manufacturing and distribution facilities. Examples of supply processes enabled by our multi-enterprise, business process management applications include:
Collaborative Supply Planning
| • | Communication and collaboration between a company and its suppliers on forward-looking forecasts to synchronize mid to long term plans |
Purchase Order Collaboration
| • | Supplier collaboration on purchase orders including order acceptance, order change, order promise, order fulfillment, invoices and payments |
Inventory Visibility
| • | Visibility into inventory positions at suppliers across finished goods, work-in-process and raw components |
Inventory Replenishment
| • | Supplier collaboration on inventory positions and automated management of inventory replenishment at supplier owned or third-party managed inventory locations for inbound materials |
Logistics Visibility
| • | Track material as it moves through a transportation and logistics network from suppliers to consumption sites while proactively assessing and managing impact of delays |
86
Table of Contents
E2 Cloud Connectivity
Our multi-enterprise software for B2B integration allows enterprises to integrate their internal applications and the applications of their trading partners through our E2open Business Network. We offer multiple connectivity options by supporting an extensive set of industry standard B2B protocols for application-to-application connectivity.
In addition, we provide a platform to support the development and leveraging of customer and trading partner communities, including the accumulation and re-use of user-generated information content.
Among the examples of functionality provided by our B2B integration solutions are:
Foundation
| • | Our Cloud Connectivity Foundation is the shared physical and software infrastructure, including servers, routers, firewalls and operating system database, for all E2open solutions, which delivers key capabilities for multi-enterprise integration, multi-enterprise business process management, exception management, multi-enterprise business intelligence, and operations management. It delivers the cloud infrastructure, which enables scalable collaboration, visibility, and control across the multi-enterprise demand-supply network. Our multi-enterprise foundation includes a comprehensive Wide Area Backup/Recovery package, a standard service level agreement, which provides customers with production safeguards for high availability within a single data center, with off-site storage of data backups and a proven disaster recovery methodology to ensure rapid recovery in the event of a production outage. |
Connect
| • | Support leading B2B protocols and message formats with our software |
| • | Support a wide variety of standard as well as custom transaction formats |
| • | Support customers who do not have existing B2B capabilities by providing a complementary B2B software product, which we call the E2open B2B Client, which can be configured by our customers and is remotely managed and supported by our engineers for the convenience of our customers and their trading partners |
| • | Use of electronic trading partner profiles to manage complex, synchronous and asynchronous processes between parties |
| • | Field-by-field validation utilizing standard validation frameworks |
| • | Translation and transformation engine capable of mapping varied message types enabling customers and their trading partners to send and receive information in their preferred formats and protocols without implementing costly and maintenance-intensive B2B/electronic data interchange gateways |
| • | Network security for transaction integrity and guaranteed messaging |
| • | Network visibility for transaction monitoring, policy setting and troubleshooting |
| • | Application connectors connect with enterprise applications reducing the time, cost and risk associated with projects |
87
Table of Contents
Enterprise Community Management
| • | Facilitate the on-boarding of a community of trading partners |
| • | Connectivity profiles of trading partners already participating in the E2open Business Network indicating their multi-enterprise process capabilities and technical integration preferences |
| • | Grouping of trading partners in business communities that share common process characteristics such as transportation carriers, telecom operators and consumer products retailers |
| • | Network-to-network integration with complementary business networks that exist in areas such as indirect procurement and logistics services |
Business Network Content
Business Network Content is reusable information about trading partners’ content, communications and processes, including:
| • | Connections which integrate disparate systems; |
| • | Message specifications, including required format for transmission and receipt of content; |
| • | Transformation maps, which convert data into forms that are comprehensible to other systems and ensures that both the data elements and the business process logic underlying the data are accurately communicated from one system to another; |
| • | Business process configurations; and |
| • | Business process best practices that are generated by the users of the E2open Business Network. |
Business Network Content originates from the individual users of the E2open Business Network shared among its over 29,000 unique registered trading partners. The value of this information increases as the size of the network grows, providing both increased benefit to our customers and acting as a barrier to entry to our competitors. By leveraging our existing business network content, we are able to deploy our system in a cost-effective, reliable and secure manner to our customers, thereby enabling our customers to achieve faster time-to-value from our system.
Additionally, the value of our network content continues to increase as more trading partners and more customers use and add data to our network, bringing to life the power of the “network effect” to our users. Since we were founded over 10 years ago, network content has become a significant competitive advantage over traditional approaches to supporting external business processes and acts as a significant differentiator for our products in the market. Network content includes:
Integration Library
| • | E2open common data model for multi-enterprise processes |
| • | Message specifications for all the relevant transactions occurring between trading partners |
| • | Transformation maps that translate industry standard formats and payload types, such as EDI, into a common data model |
| • | Packaged integration into leading enterprise applications such as ERP, transportation management system and supply chain management |
88
Table of Contents
Leading-Practice Processes
| • | Configuration of multi-enterprise processes that incorporate leading practices for processes specific to industries and supply chain models |
| • | Packaged reports and analytics to measure key performance indicators related to leading practice processes |
Professional Services
We offer enabling services directly and through our channel partners that include solution consulting services, solution deployment and B2B on-boarding services, and solution support services that help our customers deploy, manage and support our solutions. Our services are comprised of the necessary methodology, tools and experienced resources to configure and deploy our process management and integration solutions to support customers’ unique business network requirements.
Our Customers
We have 239 customers located in 62 countries, who use our solutions in 9 languages and trade in 26 different currencies. Our customers include 55 Enterprise Customers who purchase both on-demand software solutions and network connectivity solutions. The remaining 184 customers purchase our network connectivity solutions. For fiscal 2011, Enterprise Customers represented 99.1% of our total revenue. Our customers represent a wide range of industries and include many of the leading brand owners in the Fortune 500, among them five of the top eight as designated in the Gartner Supply Chain Top 25.
Our customer base includes companies that have purchased our solutions directly from us as well as through our resellers and integrators. Revenue attributable to sales to customers by us directly was 92.8% and 91.2% of total revenue for the year ended February 28, 2011 and for the nine months ended November 30, 2011, respectively. The E2open Business Network is a community comprised of our customers, over 29,000 unique registered trading partners and over 84,000 unique registered users.
For the year ended February 28, 2011, our two largest customers accounted for 22.5% and 11.7% of total revenues, respectively. For the nine months ended November 30, 2011, our two largest customers accounted for 17.7% and 12.1% of total revenues, respectively.
89
Table of Contents
The following table illustrates the diversity of our customer base across various industries.
| Industry |
Representative Customers | |
| Computers & Peripherals, Electronics |
Dell, IBM, Hitachi, Lab126 (part of the Amazon.com, Inc. group of companies), Lenovo, NetApp, Seagate, Xerox | |
| Contract Manufacturers |
Celestica, Flextronics, Sonic | |
| Semiconductors |
Freescale, LSI, Spansion | |
| Telecom/Network |
Alcatel-Lucent, Cisco, Motorola, Nokia Siemens Networks, RIM, Vodafone | |
| Aerospace and Defense |
Embraer, Exostar (1) (Customers of Exostar include BAE Systems, Boeing, Huntington Ingalls Industries, Raytheon, Rolls-Royce, UK Ministry of Defense) | |
| Industrial Manufacturing |
Diebold, GE Energy, Omron, SPX | |
| Consumer Goods |
Avon, Clorox, Coca-Cola, The GAP, GE Lighting, HAVI Global Solutions (servicing McDonalds), Levi Strauss | |
| Medical Equipment |
Bio-Rad, GE Healthcare | |
| Logistics/Wholesale Distribution |
AJC International, Averitt, MavenWire, Tieto Finland | |
| (1) | Exostar is a reseller and operating partner of ours that delivers services to companies in the United States and United Kingdom Aerospace and Defense market. |
The following case studies demonstrate the breadth and depth of our ability to help companies in multiple industries transform their trading networks into strategic business functions and achieve a significant return on investment.
Telecommunications. One of the world’s largest telecommunications companies was faced with problems assimilating over 20 acquired operating companies into a more highly functioning, integrated enterprise. The company sought a common platform for business management and support in its efforts to create a more centralized procurement organization capable of better managing the pricing and inventories for mobile phones. Using E2open, the company was able to achieve the aggregation and visibility it desired and did so by implementing a global consolidated forecast coupled with a process for tracking procurement and global spend management, together responsible for better price negotiation and global price compliance. Simultaneously, the company was also able to more consistently assure supply by implementing an automated replenishment process capable of refreshing inventory on hand when it reaches predetermined levels. Using our solution, the company realized reductions in inventories, lowered purchasing costs through demand and forecast aggregation and improved its negotiating position with suppliers by achieving greater visibility and connectedness among its business units. In turn, the company also improved overall customer satisfaction through fewer product shortages and more timely deliveries.
Aerospace and Defense. A leading global aircraft manufacturer was encumbered by a globally complex supply chain involving hundreds of suppliers, thousands of components, and multiple manufacturing and assembly sites. The company required a common solution to manage the processes, visibility, and decision making among diverse partners that was flexible and fast enough to be deployed efficiently to its expanding network. Using E2open’s multi-tier supply side solution, the company was able to quickly automate the
90
Table of Contents
communication and sharing of critical, timely correspondences, such as new delivery schedules and order changes. The solution provided for a managed inventory program which improved cash flow for trading partners and improved on-time delivery with lower logistics costs. As a result, the company achieved real-time visibility and a scalable solution for all trading partners irrespective of their technological sophistication.
Consumer Electronics. A leading global computer manufacturer had experienced a series of delays and additional costs from late shipments, and in attempting to address these issues, added expensive inventory to lower the risk of shortages. To alleviate these ongoing problems, the company sought added visibility into both its supply and demand channels in order to assure the optimal amount of product was on hand to be delivered at the lowest practicable cost. E2open was able to provide a control tower solution capable of providing cross network visibility and control. The company was able to improve collaboration among partners in the channel, more effectively plan and decrease transportation costs, rapidly improve on-board time for new partners and, as a result, reduce inventory levels and costs. With the help of our applications, the customer gained visibility into supply and demand, and was able to achieve automated customer fulfillment and management by exception while improving partner visibility and collaboration.
Research and Development
We have over 10 years of experience defining, designing and implementing high value and robust multi-enterprise software that operates in a cloud-computing model. We also have extensive practical experience designing multi-enterprise, business process management and B2B integration systems for the industries on which we have focused to date, in particular the Technology, Telecommunications, Aerospace and Defense, and Consumer Products industries. We draw from our extensive experience and our ability to work closely with key customers to define new products and services that provide business solutions that are simple to use and understand.
In the year ended February 28, 2011 and for the nine months ended November 30, 2011, we spent $11.5 million and $9.9 million, respectively, on research and development expenses.
Sales and Marketing
Our products and services are sold to businesses through our worldwide sales force and channel partners.
Direct Sales. Our senior sales executives seek to establish and maintain executive-level relationships with Fortune 2,000 companies. The focus of our sales team is identifying business network-related challenges and initiatives and then engaging with these customers to develop a solution roadmap and business case. Within our direct sales channel, we use a highly interactive sales approach to grow our enterprise-level, high-revenue client base. We have two distinct sales teams, one focused on new customer acquisition and the other focused on up-sell and cross-sell to our current customers.
Joint-Marketing and Selling Alliances. We have developed strategic alliances with information technology, or IT, and business services vendors that serve our targeted end markets. Our alliance strategy is three pronged:
| • | Resellers. We establish reselling relationships with select partners who are prominent in our target markets, such as Exostar, MavenWire and Tieto. |
| • | Consulting and Systems Integrators. We work with leading consulting and systems integrator partners such as Barkawi, Camelot and Oracle to collaboratively design and implement customer solutions. |
| • | Independent Software Vendors, or ISVs. We leverage leading solutions providers with expertise in certain verticals or industries to deliver comprehensive solutions for customers. Oracle is an ISV partner. |
91
Table of Contents
Our sales process is consultative in nature. Prior to engagement, prospective customers work with us to identify ways to overcome their complex business problems by utilizing our solutions. While each customer is unique, the marketing and sales teams use a systematic, repeatable process for lead qualification, nurturing and conversion. We believe that our sales process is a unique differentiator, as customers receive valuable insights and actionable ideas tailored to their unique requirements throughout the process. Our solutions and the systems they integrate with are usually “mission critical” and address complex business challenges typically requiring longer sales cycles than deployment of point solutions. A company’s dependence on E2open solutions results in higher retention rates and greater opportunity to up-sell additional solutions.
Our marketing activities facilitate the sales process by branding E2open as an industry expert and thought leader while generating qualified leads. We market our products and services to current and potential customers through various marketing programs. Our marketing programs include our corporate website, online and in-person conferences, trade shows, seminars, telemarketing and specialty marketing campaigns.
Our global headquarters is located in Foster City, California. We have six sales offices located across the United States, Europe and Asia, including Foster City, California, Austin and Dallas, Texas, Reading, United Kingdom, Shanghai, China and Taipei City, Taiwan.
Operations
Certified Operators. We work with partner operators to deliver our solutions in certain vertical markets and geographies. Exostar is a certified operator and has provided E2open solutions to the Aerospace and Defense industry since 2005. We have initiated a partnership with Camelot Information Systems Inc. to augment our delivery capabilities in China.
Data Centers. We host our development, quality assurance, configuration and staging environments at an Equinix co-location facility in Sunnyvale, California. Production environments are hosted in Equinix co-location facilities in San Jose, California and a suburb of Chicago, Illinois. To proactively identify and respond to potential problems, our global support and IT operations teams continually monitor customer solutions, using a systems management infrastructure that combines network and systems management tools, automated external scripts and synthetic transactions. Our production environment is designed in a high availability configuration. We use redundant storage systems, arrays, and other technologies to ensure the integrity of customer data stored on production systems. In the event of equipment failure, we maintain service contracts and on-site production spares for rapid equipment replacement. We began SAS70 compliance efforts in 2006 and have successfully completed annual Type II SAS70 audits since 2007. Beginning in 2011, we began using the SSAE 16 audit standard that superseded SAS70. The SSAE 16 audit for the period July 1, 2010 through June 30, 2011 was completed by independent auditors, and covers controls over technology, security and related processes as they relate the E2open Business Network. We have strong uptime performance and virtually no payments for service level deficiency.
Competition
While we do not believe that any specific competitor offers the breadth of business network solutions and collaborative capabilities that we do, the distinct markets that make up the business network space are each rapidly evolving and highly competitive. We face competition from the following types of companies:
| • | ERP vendors: Companies such as Infor, Oracle and SAP offer ERP extension solutions that provide features similar to a limited subset of our offerings in the area of trading partner portals. These companies may include those solutions as part of their larger ERP or business application offerings. As each trading partner is likely to have some form of existing ERP system, we are able to provide |
92
Table of Contents
| a common platform tying these disparate systems together as a business network. Our solutions generally do not replace the current functionality of existing ERP systems and therefore tend not to undermine our customers’ investments in their existing business applications. Our customers have found that our solutions extend and enhance the value of their existing ERP systems by adding integration, multi-enterprise processes, and real-time collaboration capabilities. Therefore, we do not believe traditional ERP vendors view our solutions as a competitive alternative to their own offerings. |
| • | Multi-enterprise B2B infrastructure vendors: Companies like GXS Corporation, IBM/Sterling Commerce and SPS Commerce provide point solutions in the B2B integration space. We do not view these offerings as competitive with our solutions. While our strategy is to provide a broader solution which can include B2B integration functionality, we believe integration platforms as standalone solutions lack the business processes and analytics that E2open provides. |
| • | Niche applications vendors: Companies like JDA Software Group, Inc. have specialized functionality for specific process areas such as transportation management, demand planning or network design. Niche applications may provide important functionality for enterprises, but they typically are not built for multi-enterprise process management or a multi-tier environment. |
| • | Internally developed solutions: Potential customers with large in-house IT departments are capable of developing applications customized for their businesses and many have. Typically, these applications lack complete functionality required to run complex, multi-tier trading networks. |
Technology
Our technology platform is based on a service oriented architecture and uses J2EE technologies designed to run in a cloud-computing environment. Our technology platform addresses the requirements for multi-enterprise, business process management, management-by-exception, B2B integration and tactical and strategic decision support, while the cloud-based model provides flexibility and scalability to our customers without large up front hardware and software deployment costs.
Our platform provides a reliable, extensible, real-time foundation for multi-enterprise, business process management applications. Our platform has been designed to be deployed as a scalable web application, enabling users to view and interact with business objects using standard web browsers, spreadsheet applications and other portable user interface technologies including mobile devices. Underlying our technology platform, a built-in workflow engine leads users through a logical progression of steps to enable collaboration among business partners.
Our software is unique in that a single platform provides the capability to handle various supply and demand chain business processes through configuration. When configured, our software can assimilate business data from a large variety of disparate systems, present such data to the user and allow users to modify it in real time.
In addition to business process applications, our Business Intelligence software provides web-based reporting and data mining capabilities. This software maintains the context of the execution process and is capable of collecting data from multi-enterprise, business process management applications and external systems, providing our users the ability to mine critical business intelligence. With its flexible mechanisms for acquiring, storing and presenting historical information, as well as an extremely secure infrastructure, our Business Intelligence software enables rapid deployment of business reporting solutions.
Our software provides B2B integration capabilities that support leading B2B protocols and message formats including RosettaNet, EDI-VAN, AS2, cXML, xCBL and Web Services. It provides extensible message validation and transformation services that allow any-to-any message and protocol transaction. Our software
93
Table of Contents
includes pre-defined application connectors to leading ERP applications, such as Oracle and SAP. Our software also includes security and naming services that provide authentication, authorization, data privacy and non-repudiation. For easy integration with existing user management systems, our software supports protocols for authentication and authorization.
We also provide an extensive set of self-service software tools, such as tools to enable customers to quickly integrate their business partners, and a tool for creating and managing maps and integrating metadata that enable customers to quickly configure our standard maps to meet their business and technical needs. Additional self-service software tools are available to allow customers to manage their security attributes, user accounts and message processing parameters to ensure that customers have control over the operation of their business processes.
Our software is engineered to run on multiple parallel servers to enable access by a large number of concurrent users and external systems. The distributed nature of our software enhances data security and transactional integrity for each business operation.
Intellectual Property
Our success and ability to compete depends, in part, upon our ability to establish and adequately protect our core technology and intellectual property. To accomplish this, we rely on a combination of intellectual property rights, including, patents, copyrights and trademarks, as well as customary contractual protections such as non-disclosure agreements and additional contractual restrictions on disclosure and use. We also protect our intellectual property through the terms of our license agreements with customers and by confidentiality agreements and intellectual property assignment agreements with our employees, consultants, business partners and advisors where appropriate.
As of November 30, 2011, we had eight U.S. and one foreign issued patents and we had one U.S. patent application pending. We do not know whether our current or future pending patent applications will result in the issuance of patents or whether the examination process will require us to narrow our claims. Even if granted, there can be no assurance that these pending patent applications will provide us with protection. The issued and allowed patents begin expiring in 2021 through 2024. The name E2open and the E2open logo are registered trademarks in the United States and several foreign countries.
Employees
As of November 30, 2011, we employed 320 people, including 58 in sales and marketing, 175 in operations and professional services, 52 in product development and 35 in general and administrative functions. We also engage a number of temporary employees and consultants to support our operations.
None of our employees are represented by a labor union. We have not experienced any work stoppages and we consider our relations with our employees to be good. Our continued success will depend upon our ability to attract and retain qualified personnel. Currently, there are no existing vacancies within our management team. All members of the current management team have been employed by us for approximately two years or more. We maintain a succession plan for key management positions to proactively manage the impact of the loss of key personnel on the operations of the business.
Facilities
Our corporate headquarters are located in Foster City, California and consist of approximately 24,070 square feet of office space under a lease that expires in February 2013. Our headquarters accommodates our principal sales, marketing professional services and administrative activities. We occupy space in Austin, Texas, consisting of 14,796 square feet under a lease that expires in December 2014 and space in Dallas, Texas,
94
Table of Contents
consisting of 12,211 square feet under a lease that expires in August 31, 2014. We also occupy space in Kuala Lumpur, Malaysia consisting of 10,269 square feet under a lease that expires in November 2013 and space in Berkshire, United Kingdom, consisting of 3,300 square feet under a lease that expires in April 25, 2013. We use all of these facilities primarily for sales, professional services, customer support and software engineering. We also maintain sales offices in San Jose, California, Taipei, Taiwan, Dusseldorf, Germany and Shanghai, China. We do not own any real property.
We believe that our current facilities are suitable and adequate to meet our current needs and that suitable additional or substitute space will be available as needed in the future to accommodate our operations.
Legal Proceedings
We may be subject from time to time to various legal proceedings and claims which arise in the ordinary course of our business. Although the outcome of these and other claims cannot be predicted with certainty, we do not believe that the ultimate resolution of these matters will have a material adverse effect on our financial condition, cash flows or results of operations.
95
Table of Contents
Executive Officers and Directors
The following table sets forth the names, ages and positions of our executive officers and directors as of January 31, 2012:
| Name |
Age | Position | ||||
| Mark E. Woodward |
53 | President, Chief Executive Officer and Director | ||||
| Peter J. Maloney |
49 | Chief Financial Officer | ||||
| David P. Hale |
47 | Chief Information Officer | ||||
| Lorenzo Martinelli |
47 | Senior Vice President, Corporate Strategy | ||||
| David W. Packer |
46 | Senior Vice President, Worldwide Field Operations | ||||
| Michael A. Schmitt |
54 | Senior Vice President, Marketing | ||||
| Robert Schoenthaler |
41 | Senior Vice President, Deployment | ||||
| John B. Mumford |
68 | Chairman of the Board of Directors | ||||
| Carl Bass (1) (2) (3) |
54 | Director | ||||
| Johnston L. Evans (2) (3) |
63 | Director | ||||
| Bernard F. Mathaisel (1) |
67 | Director | ||||
| Nicholas G. Moore (1) |
69 | Director | ||||
| Patrick J. O’Malley, III |
49 | Director | ||||
| Stephen M. Ward, Jr. (1) (2) (3) |
56 | Director | ||||
| (1) | Member of the Audit Committee |
| (2) | Member of the Compensation Committee |
| (3) | Member of the Corporate Governance and Nominating Committee |
Mark E. Woodward has served as our President and Chief Executive Officer and a member of our board of directors since June 2008. Prior to joining E2open, Mr. Woodward was a Senior Advisor with The Blackstone Group, an investment and advisory firm from June 2007 to June 2008. Prior to joining The Blackstone Group, Mr. Woodward consulted for several private equity firms from January to June 2007. Mr. Woodward served as President and Chief Executive Officer of Serena Software, an application lifecycle management vendor, from November 1998 to December 2006. He joined Serena in November 1998 as the Vice President of Americas Sales, was promoted to Vice President Worldwide Operations in February 2000, and then promoted to President and Chief Executive Officer in May 2000. He served on Serena’s board of directors from June 2000 to December 2006. He also served on the board of directors of Clear Technology, Inc. from June 2005 to June 2007. Mr. Woodward attended the University of California, Los Angeles. We believe that Mr. Woodward possesses specific attributes that qualify him to serve as a member of our board of directors, including the perspective and experience he brings as our Chief Executive Officer and his experience as a seasoned executive with over 30 years of technology industry experience focused on sales and marketing and general management.
Peter J. Maloney has served as our Chief Financial Officer since January 2008. Mr. Maloney served as the Chief Financial Officer at SNOCAP, Inc., a digital licensing and copyright management service for online music distribution, from January 2006 to April 2008. Prior to SNOCAP, Mr. Maloney was employed by Keynote Systems, Inc., a mobile and internet performance management company, from October 2001 to January 2006 where he held senior management positions including Chief Financial Officer and Vice President of Finance. Mr. Maloney holds a Master of Business Administration degree in Corporate Finance from University of Southern California’s Marshall School of Business and a Bachelor of Business Administration degree in Economics from Temple University’s Fox School of Business. Mr. Maloney is an inactive Certified Public Accountant.
David P. Hale has been employed by us since December 2000, and has served as our Chief Information Officer since January 2011. From 2005 until January 2011, Mr. Hale served as our Senior Vice President, IT Operations, managing our Software-as-a-Service, or SaaS, operations, IT operations and global support
96
Table of Contents
functions. From January 2008 to December 2009, he concurrently served as General Manager, Asia Pacific and headed our Kuala Lumpur, Malaysia office. Mr. Hale was interim General Manager of our Tokyo office in 2002, and has served in various other executive positions for us. Mr. Hale holds a Bachelor of Science degree in Industrial Engineering, a Master of Arts degree in Education Policy Analysis and a Master of Business Administration degree, each from Stanford University.
Lorenzo Martinelli has been employed by us since October 2001 and has served as our Senior Vice President, Corporate Strategy since May 2007. Prior to that, he served as our Senior Vice President, Marketing from January 2006 to May 2007, our Executive Vice President, Sales Marketing & Account Management from July 2002 to January 2006 and our Vice President, Strategy & Marketing from October 2001 to July 2002. Mr. Martinelli earned a Bachelor of Applied Science degree in Mechanical Engineering from the University of Waterloo, Canada with a specialization in Operations Research and Organizational Behavior.
David W. Packer has served as our Senior Vice President, Worldwide Field Operations since September 2008. From March 2005 to September 2008, Mr. Packer was employed by Borland Software, an open application lifecycle management solutions company, where he served as Senior Vice President, Worldwide Field Operations from January 2007 to August 2008 and as Vice President, Americas from March 2005 to January 2007. Mr. Packer earned his Bachelor of Arts degree in Economics & Political Science from Claremont McKenna College and his Master of Science degree from the Massachusetts Institute of Technology.
Michael A. Schmitt has served as our Senior Vice President, Marketing since January 2011. Prior to joining E2open, he served as Senior Vice President of Western Area Sales for Mitratech Holdings, an enterprise supplier of legal operations and e-billings solutions, from June 2009 to December 2011. Prior to Mitratech, he served as President and CEO of Siderean Software, an enterprise search company, from September 2006 to September 2008. Mr. Schmitt holds a Bachelor of Science degree in Business Administration from California Polytechnic State University.
Robert Schoenthaler has served as our Senior Vice President, Deployment since July 2007. From June 2006 to July 2007, Mr. Schoenthaler was the Managing Vice President of the High Tech industry segment at Hitachi Consulting, a business and consulting company. From January 1995 to February 2006, Mr. Schoenthaler worked at BearingPoint (formerly KPMG Consulting Inc.), a professional services firm offering management and consulting capabilities, where he helped lead their Consumer, Industrial and Technology practice. Mr. Schoenthaler earned his Bachelor of Science degree in Mechanical Engineering from Northwestern University.
John B. Mumford was a co-founder of E2open and has been a member and the Chairman of our Board of Directors since our inception in July 2000. Mr. Mumford also served as our interim Chief Executive Officer from May 2008 to June 2008. Mr. Mumford is the Founding Partner of Crosspoint Venture Partners, a venture capital firm, which was founded in 1982. Mr. Mumford was a co-founder and member of the board of directors of four public companies: Hello Direct, Inmac, Office Club (Office Depot) and Ariba. Mr. Mumford received a Bachelor of Science degree in Accounting from Arizona State University and a Masters of Business Administration from the Stanford Graduate School of Business. We believe that Mr. Mumford possesses specific attributes that qualify him to serve as a member of our board of directors, including his experience as a successful venture capital investor for over 30 years.
Carl Bass has been a member of our board of directors since July 2011. Mr. Bass has been the President and Chief Executive Officer of Autodesk, Inc., a software design company, since May 2006. From June 2004 to April 2006, he was Autodesk’s Chief Operating Officer responsible for worldwide sales, marketing and product development. His earlier roles at Autodesk included Chief Technology Officer and Executive Vice President of product development. Mr. Bass served on the board of directors of McAfee, Inc. from January 2008 until its acquisition in February 2011. Mr. Bass serves on the board of directors of Autodesk. He is also a member of the Executive Advisory Boards of the Cornell Computing and Information Science and the UC Berkeley School of
97
Table of Contents
Information. He holds a Bachelor of Science degree in Mathematics from Cornell University. We believe that Mr. Bass possesses specific attributes that qualify him to serve as a member of our board of directors, including his experience as Chief Executive Officer of a public software company.
Johnston L. Evans has been a member of our board of directors since June 2005. Mr. Evans has served as General Partner at Invesco Private Capital, Inc. and its predecessor, a venture capital firm since 1995. Mr. Evans received a Bachelor of Arts degree in Political Science from Boston University. We believe that Mr. Evans possesses specific attributes that qualify him to serve as a member of our board of directors, including his financial experience with both public and private companies.
Bernard F. Mathaisel has been a member of our board of directors since April 2003. Since January 2011 Mr. Mathaisel has served as Executive Advisor for Achievo Corporation, a global software development and information technology outsourcing provider, from December 2009 to January 2011 he served as Achievo’s Chief Operations Officer, North America and from April 2007 to December 2009 as their Chief Information Officer. He previously served on the board of directors of Packeteer, Inc., from 2004 until it was acquired by Blue Coat Systems, Inc. in June 2008. He also served on the Boards of AcXess, Inc. and QD Technologies, Inc. Mr. Mathaisel holds a Bachelor of Science degree in Engineering and a Master of Science degree in Engineering, both from the Massachusetts Institute of Technology. We believe that Mr. Mathaisel possesses specific attributes that qualify him to serve as a member of our board of directors, including his executive experience with public companies over the past 25 years and his experience in information technology applications and information technology management.
Nicholas G. Moore has been a member of our board of directors since November 2004. Mr. Moore was elected Chairman and Chief Executive Officer of Coopers & Lybrand (U.S.) in 1994 and Coopers & Lybrand International in 1997. Following the merger with Price Waterhouse in July 1998, Mr. Moore served as Chief Executive Officer of the U.S. firm of PricewaterhouseCoopers for two years and served for three years as global Chairman of PricewaterhouseCoopers. Mr. Moore serves on the board of directors of Bechtel Group, Inc., NetApp, Inc., Gilead Sciences, Inc. and Wells Fargo & Company. Mr. Moore received a Bachelor of Science degree in Accounting from St. Mary’s College and a Juris Doctorate degree from Hastings College of Law, University of California at Berkeley. We believe that Mr. Moore possesses specific attributes that qualify him to serve as a member of our board of directors, including his financial and accounting experience with both public and private companies.
Patrick J. O’Malley, III has served as a member of our board of directors since January 2012. Mr. O’Malley has been the Executive Vice President and Chief Financial Officer of Seagate Technology, a manufacturer of hard drives, since August 2008. Previously, he served as Seagate’s Senior Vice President, Finance from 2005 to August 2008, and assumed the additional roles of Principal Accounting Officer and Treasurer in 2006. Prior to that, he was Senior Vice President, Consumer Electronics from 2004 to 2005; Senior Vice President, Finance, Manufacturing from 1999 to 2004; Vice President, Finance-Recording Media from 1997 to 1999; Senior Director Finance, Desktop Design, from 1996 to 1997; Senior Director, Finance, Oklahoma City Operations from 1994 to 1996; Director and Manager, Corporate Financial Planning & Analysis from 1991 to 1994; Manager, Consolidations & Cost Accounting from 1990 to 1991; Manager, Consolidations from 1988 to 1990; and Senior Financial Analyst in 1988 all at Seagate. Mr. O’Malley holds a Bachelor of Business Administration degree from the University of Notre Dame. We believe that Mr. O’Malley possesses specific attributes that qualify him to serve as a member of our board of directors, including his financial experience and longstanding leadership at a public company.
Stephen M. Ward, Jr. has been a member of our board of directors since July 2006, and he was also a member of our board of directors from August 2000 to November 2004. Mr. Ward served as Chief Executive Officer and President of Lenovo, the international computer company formed by the merger of Lenovo of China and IBM’s personal computing business, from April 2005 to January 2006. He served as a Management Consultant to the Chairman of Lenovo from January 2006 to March 2006. Mr. Ward also serves on the board of
98
Table of Contents
directors, chairs the corporate governance committee, is a member and was former chair of the human resources and compensation committee, is a member of the operations committee and was a member of the audit committee of Carpenter Technology, a specialty metals company, since 2001. Mr. Ward is a member of the founding team, member of the board of directors and member of the executive committee and has been the chair of the compensation committee at C3, a cloud software company which helps enterprises monitor, mitigate and monetize carbon. Mr. Ward was also on the board of directors and the compensation committee of E-Ink, a materials company providing electronic paper screens to e-book companies and other customers, from January 2007 to December 2009. Prior to joining Lenovo, Mr. Ward was the Senior Vice President and General Manager of IBM’s Personal Systems Group, responsible for IBM’s Retail Store Solutions Division, IBM’s Printing Systems Division and IBM’s Personal Computing Division. Mr. Ward also held positions as the leader of IBM’s worldwide sales for all industrial, electronics, chemical and aerospace companies, and was Chief Information Officer and Vice President of Transformation of IBM from March 1998 to April 2000. Mr. Ward holds a Bachelor of Science degree in Mechanical Engineering from California Polytechnic at San Luis Obispo. We believe that Mr. Ward possesses specific attributes that qualify him to serve as a member of our board of directors, including his experience growing multiple technology companies.
There are no family relationships among any of our directors and/or executive officers.
Board Composition
Our board of directors is currently composed of eight members. Our amended and restated certificate of incorporation and bylaws provide that the number of our directors shall be fixed from time to time by a resolution of the majority of our board of directors. Upon completion of this offering, our board of directors will be divided into three staggered classes of directors. At each annual meeting of stockholders, a class of directors will be elected for a three-year term to succeed the same class of directors whose terms are then expiring. The terms of the directors will expire upon the election and qualification of successor directors at the annual meeting of stockholders to be held during 2013 for the Class I directors, 2014 for the Class II directors and 2015 for the Class III directors.
| • | Our Class I directors will be Messrs. Evans and Mathaisel. |
| • | Our Class II directors will be Messrs. Bass, Moore and Ward. |
| • | Our Class III directors will be Messrs. Mumford, O’Malley and Woodward. |
The division of our board of directors into three classes with staggered three-year terms may delay or prevent a change of our management or a change of control. See “Description of Capital Stock—Anti-Takeover Effects of Delaware Law and Our Certificate of Incorporation and Bylaws” for a discussion of other anti-takeover provisions found in our amended and restated certificate of incorporation and bylaws.
Director Independence
Under the rules of , independent directors must comprise a majority of a listed company’s board of directors within a specified period of the completion of its offering. In addition, the rules of require that, subject to specified exceptions, each member of a listed company’s audit, compensation and nominating and corporate governance committees be independent. Audit committee members must also satisfy the independence criteria set forth in Rule 10A-3 under the Securities Exchange Act of 1934, as amended. Under the rules of , a director will only qualify as an “independent director” if, in the opinion of that company’s board of directors, that person does not have a relationship that would interfere with the exercise of independent judgment in carrying out the responsibilities of a director.
In order to be considered independent for purposes of Rule 10A-3, a member of an audit committee of a listed company may not, other than in his or her capacity as a member of the audit committee, the board of
99
Table of Contents
directors or any other board committee: (1) accept, directly or indirectly, any consulting, advisory or other compensatory fee from the listed company or any of its subsidiaries or (2) be an affiliated person of the listed company or any of its subsidiaries.
On February 14, 2012, our board of directors undertook a review of its composition, the composition of its committees and the independence of each director. Based upon information requested from and provided by each director concerning his background, employment and affiliations, our board of directors has determined that none of Messrs. Bass, Evans, Mathaisel, Moore, Mumford or Ward, representing six of our eight directors, has a relationship that would interfere with the exercise of independent judgment in carrying out the responsibilities of a director and that each of these directors is “independent” as that term is defined under the rules of . Our board of directors also determined that Messrs. Ward, Bass, Mathaisel and Moore, who comprise our audit committee, Messrs. Ward, Bass and Evans, who comprise our compensation committee, and Messrs. Bass, Evans and Ward, who comprise our corporate governance and nominating committee, satisfy the independence standards for those committees established by applicable SEC rules and the rules of . In making this determination, our board of directors considered the relationships that each non-employee director has with our company and all other facts and circumstances our board of directors deemed relevant in determining their independence, including the beneficial ownership of our capital stock by each non-employee director.
Role of the Board in Risk Oversight
One of the key functions of our board of directors is informed oversight of our risk management process. Our board of directors does not have a standing risk management committee, but rather administers this oversight function directly through the board of directors as a whole, as well as through its standing committees that address risks inherent in their respective areas of oversight. In particular, our board of directors is responsible for monitoring and assessing strategic risk exposure. Our audit committee is responsible for reviewing and discussing our major financial risk exposures and the steps our management has taken to monitor and control these exposures, including guidelines and policies with respect to risk assessment and risk management. Our audit committee also monitors compliance with legal and regulatory requirements, in addition to oversight of the performance of our external audit function. Our corporate governance and nominating committee monitors the effectiveness of our corporate governance guidelines. Our compensation committee reviews and discusses the risks arising from our compensation philosophy and practices applicable to all employees that are reasonably likely to have a materially adverse effect on us.
Board Committees
Our board of directors has an audit committee, a compensation committee and a corporate governance and nominating committee, each of which has the composition and responsibilities described below. The audit committee, compensation committee and corporate governance and nominating committee all operate under charters approved by our board of directors, which will be available on our website upon the closing of this offering.
Audit Committee. Our audit committee oversees our corporate accounting and financial reporting process and assists the board of directors in monitoring our financial systems and our legal and regulatory compliance. Our audit committee will also:
| • | oversee the work of our independent auditors; |
| • | approve the hiring, discharging and compensation of our independent auditors; |
| • | approve engagements of the independent auditors to render any audit or permissible non-audit services; |
100
Table of Contents
| • | review the qualifications and independence of the independent auditors; |
| • | monitor the rotation of partners of the independent auditors on our engagement team as required by law; |
| • | review our financial statements and review our critical accounting policies and estimates; |
| • | review the adequacy and effectiveness of our internal controls; and |
| • | review and discuss with management and the independent auditors the results of our annual audit and our quarterly financial statements. |
The members of our audit committee are Messrs. Ward, Bass, Mathaisel and Moore. Mr. Ward is our audit committee chairman. Our board of directors has concluded that the composition of our audit committee meets the requirements for independence under, and the functioning of our audit committee complies with, the current requirements of and SEC rules and regulations, and Messrs. Ward, Bass and Moore are our audit committee financial experts as defined under SEC rules and regulations.
Compensation Committee. Our compensation committee oversees our corporate compensation programs. The compensation committee will also:
| • | review and approve corporate goals and objectives relevant to compensation of our Chief Executive Officer and other executive officers; |
| • | evaluate the performance of our executive officers in light of established goals and objectives; |
| • | review and recommend compensation of our executive officers based on its evaluations; |
| • | review and recommend compensation of our directors; and |
| • | administer the issuance of stock options and other awards under our stock plans. |
The members of our compensation committee are Messrs. Ward, Bass and Evans. Mr. Ward is the chairman of our compensation committee. Our board of directors has determined that each member of our compensation committee is independent under the applicable rules of .
Corporate Governance and Nominating Committee. Our corporate governance and nominating committee oversees and assists our board of directors in reviewing and recommending corporate governance policies and nominees for election to our board of directors. The corporate governance and nominating committee will also:
| • | evaluate and make recommendations regarding the organization and governance of the board of directors and its committees; |
| • | assess the performance of members of the board of directors and make recommendations regarding committee and chair assignments; |
| • | recommend desired qualifications for board of directors membership and conduct searches for potential members of the board of directors; and |
| • | review and make recommendations with regard to our corporate governance guidelines. |
101
Table of Contents
The members of our corporate governance and nominating committee are Messrs. Bass, Evans and Ward. Mr. Bass is the chairman of our corporate governance and nominating committee. Our board of directors has determined that each member of our corporate governance and nominating committee is independent under the applicable rules of .
Our board of directors may from time to time establish other committees.
Director Compensation
The following table sets forth information concerning compensation paid or accrued for services rendered to us by members of our board of directors for the fiscal year ended February 28, 2011. The table excludes Mr. Woodward, who is a named executive officer and did not receive any compensation from us in his role as a director in the fiscal year ended February 28, 2011. No option awards or stock awards were granted to our directors during our fiscal year ended February 28, 2011.
| Name |
Fees Earned or Paid in Cash ($) |
Total ($) | ||||||
| John B. Mumford |
0 | 0 | ||||||
| Carl Bass |
0 | 0 | ||||||
| Johnston L. Evans |
0 | 0 | ||||||
| Bernard F. Mathaisel |
8,000 | 8,000 | ||||||
| Nicholas G. Moore |
8,000 | 8,000 | ||||||
| Patrick J. O’Malley, III |
0 | 0 | ||||||
| Stephen M. Ward, Jr. |
8,000 | 8,000 | ||||||
Historically, outside directors received compensation for participation in board meetings equal to $1,000 per meeting and participation in audit committee meetings equal to $1,000 per meeting, but this practice was discontinued in August 2011. Following the completion of this offering, we expect to implement an annual cash and equity compensation program for our non-employee directors.
Our policy has been and will continue to be to reimburse our non-employee directors for their travel, lodging and other reasonable expenses incurred in attending meetings of our board of directors and committees of the board of directors.
Directors who are employees do not receive any compensation for their service on our board of directors.
As of February 28, 2011, our non-employee directors held outstanding stock options as follows:
| Option Awards | ||||||||||||||||||
| Number of Securities Underlying Unexercised Options (#) |
Option Exercise Price ($) |
Option Expiration Date |
||||||||||||||||
| Name |
Exercisable | Unexercisable | ||||||||||||||||
| John B. Mumford. |
200,000 | (1)(2) | — | 0.01 | 9/4/2014 | |||||||||||||
| Carl Bass |
— | (3) | — | — | — | |||||||||||||
| Johnston L. Evans |
131,400 | (1)(4) | — | 0.01 | 9/4/2015 | |||||||||||||
| Bernard F. Mathaisel |
237,500 | (1) | — | 0.01 | 2/18/2017 | |||||||||||||
| 500,000 | (5) | — | 0.01 | 6/25/2019 | ||||||||||||||
| Nicholas G. Moore |
250,000 | (6) | — | 0.01 | 11/8/2017 | |||||||||||||
| 375,000 | (7) | — | 0.01 | 6/25/2019 | ||||||||||||||
| Patrick J. O’Malley, III |
— | (8) | — | — | — | |||||||||||||
| Steven M. Ward, Jr. |
— | (9) | — | — | — | |||||||||||||
102
Table of Contents
| (1) | The option is fully vested and immediately exercisable. |
| (2) | Includes (i) 179,466 options held directly by Crosspoint Venture Partners 2000(Q), L.P.; and (ii) 20,534 options held directly by Crosspoint Venture Partners 2000, L.P. Mr. Mumford serves is a Managing General Partner of Crosspoint Associates 2000, L.L.C., the general partner of Crosspoint Venture Partners 2000(Q), L.P. and Crosspoint Venture Partners 2000, L.P. |
| (3) | Mr. Bass was elected to serve as a member of our board of directors in July 2011. |
| (4) | Includes (i) 78,600 options held directly by Chancellor V, L.P.; (ii) 40,520 options held directly by Chancellor V-A, L.P.; and (iii) 12,280 options held directly by Citiventure 2000, L.P. (collectively referred to as the “Invesco Capital Entities”). Mr. Evans is the Head of Invesco Private Capital, Inc. and a member of the investment committee of IPC Direct Associates V, LLC. IPC Direct Associates V, LLC is the general partner of each of the Invesco Capital Entities and its managing member is Invesco Private Capital, Inc. |
| (5) | The option is subject to an early exercise provision and is immediately exercisable. The option vests annually over four years beginning on June 25, 2010. As of February 28, 2011, 125,000 shares were vested and 375,000 shares vest over the remainder of the vesting period. |
| (6) | The option is subject to an early exercise provision and is immediately exercisable. The option vests annually over four years beginning on January 8, 2009 and was exercised in part. As of February 28, 2011, 125,000 shares were vested and 125,000 shares vest over the remainder of the vesting period. |
| (7) | The option is subject to an early exercise provision and is immediately exercisable. The option vests annually over four years beginning on June 25, 2010 and was exercised in part. As of February 28, 2011, no shares were vested and 375,000 shares vest over the remainder of the vesting period. |
| (8) | Mr. O’Malley was elected to serve as a member of our board of directors in January 2012. |
| (9) | Mr. Ward acquired 520,834 shares of common stock pursuant to early exercise which are subject to a repurchase option we hold as of February 28, 2011. |
Code of Business Conduct and Ethics
Prior to the completion of this offering, we expect to adopt a code of business conduct and ethics that is applicable to all of our employees, officers and directors including our chief executive officer and senior financial officers, which will be available on our website upon the closing of this offering.
Compensation Committee Interlocks and Insider Participation
Messrs. Evans and Mumford served as the members of the compensation committee in fiscal 2011. In July 2011, Mr. Ward was also appointed to the compensation committee. None of the members of our compensation committee is an officer or employee of our company. In February 2012, Carl Bass was appointed to the compensation committee, replacing Mr. Mumford. Mr. Mumford served as our interim Chief Executive Officer from May 2008 to June 2008. None of our executive officers currently serves, or in the past year has served, as a member of the board of directors or compensation committee of any entity that has one or more executive officers serving on our board of directors or compensation committee.
103
Table of Contents
Compensation Discussion and Analysis
Overview
The following is a discussion and analysis of the compensation arrangements of our named executive officers for fiscal 2011 and should be read together with the compensation tables and related disclosures set forth below. This discussion contains forward-looking statements that are based on our current considerations, expectations and determinations regarding future compensation programs. The actual amount and form of compensation and the compensation programs that we adopt may differ materially from current or planned programs as summarized in this discussion. Our named executive officers, defined as the Chief Executive Officer, the Chief Financial Officer and the other top three most highly compensated executive officers, are Mark E. Woodward, President and Chief Executive Officer; Peter J. Maloney, Chief Financial Officer; David W. Packer, Senior Vice President, Worldwide Field Operations; David P. Hale, Chief Information Officer; and Robert Schoenthaler, Senior Vice President, Deployment.
Objectives and Principles of Our Executive Compensation
We have designed the compensation arrangements for our named executive officers to provide compensation in amounts and in forms that attract and retain talented and experienced individuals. Our aim is to motivate executives through a pay-for-performance model to achieve the goals that are important to our growth and align the financial interests of our senior management with those of our stockholders.
During fiscal 2011, our compensation primarily consisted of base salary and annual cash incentive awards. In prior years, we also have granted our named executive officers stock awards as part of our annual incentive program and stock options as new hires and from time to time as part of our overall compensation package to align incentives with the interests of our stockholders. We did not make any stock option grants to our named executive officers in fiscal 2011 for the reasons discussed below.
We have created a compensation program that contains a mix of short-term and long-term components, cash and equity elements and fixed and contingent payments in proportions that we believe will provide appropriate incentives to reward our senior executives. Within this program, the executive’s total compensation should increase with his or her responsibilities and level and provide:
| • | an offering of base pay, short-term variable cash and long-term equity incentives which is aligned with achieving our company goals and increasing stockholder value; |
| • | base salaries which are market competitive and which will attract and retain talent; and |
| • | cash and equity incentive awards which are competitive in the market, drive performance and align with the creation of long-term value for stockholders. |
Another goal of our compensation program is to be competitive with other companies with whom we compete for employees. Historically, our compensation program has been characterized by a median-based cash compensation and equity compensation program, when compared with other privately and publicly held technology companies of a similar size as further discussed below. The compensation committee reviews the principles and practices of the compensation program on an annual basis.
Historical Compensation Decision Making
Historically, our compensation committee has established the equity and incentive compensation components, excluding base salary, for all of our named executive officers with the exception of our chief
104
Table of Contents
executive officer for whom they determine all elements of compensation. Additionally, the board of directors provides review and approval of the certain equity and incentive compensation programs. Specifically, the board of directors provided approval for fiscal 2011 and fiscal 2012 Executive Incentive Plans, which are our cash bonus incentive programs, and fiscal 2012 and fiscal 2013 Executive Equity Incentive Plans, which are incentive programs providing guidelines for the granting of equity awards to our named executives under our stockholder approved equity compensation plan(s). The compensation committee and the board of directors receives input and recommendations from our human resources department and management team, as described further under “Participation of Management in Compensation Decisions” below. The base salaries for our named executive officers, with the exception of the chief executive officer, were determined based on recommendations by our human resources department with the final review and determination made by our chief executive officer.
The compensation of the executives is evaluated at least annually by the compensation committee, including with respect to cash compensation, incentive programs and equity ownership percentage. In making executive compensation decisions, and as described further below, the compensation committee has historically taken into consideration a variety of factors, including the information presented by and recommendations of management, its general observations on company and individual performance, and data points from the Radford and Option Impact compensation surveys, as well as the compensation committee’s collective knowledge and experience. Following the completion of this offering, we anticipate that our compensation committee will determine executive compensation by taking into consideration the compensation information for the executives of a peer group of comparable companies, as well as by reference to the goals of E2open and the considerations described below. To control expenditures and effectively allocate our limited resources, the compensation committee has not historically engaged compensation consultants, but the compensation committee does have the authority to hire a compensation consultant if it desires to do so.
Compensation Committee
At the beginning of fiscal 2011, the members of our compensation committee were John B. Mumford (chairman) and Johnston L. Evans. In July 2011, Mr. Ward was appointed as a member of the compensation committee and replaced Mr. Mumford, who remained a member of the committee, as its chairman. In February 2012, Carl Bass replaced Mr. Mumford on the compensation committee. Each current member has been determined to be an “outside director” for purposes of Section 162(m) of the Internal Revenue Code, or the Code, and a “non-employee director” for purposes of Rule 16b-3 under the Exchange Act as well as an “independent director” under the requirements of .
In accordance with its charter, the compensation committee’s purpose is to provide guidance and periodic monitoring as to all corporate compensation, benefit, perquisite and employee equity programs. The compensation committee meets quarterly at regularly scheduled meetings and holds additional meetings as necessary. The compensation committee is responsible for the overall administration of our compensation plans, while our management is responsible for the day to day administration of our compensation plans.
Participation of Management in Compensation Decisions
The board of directors and compensation committee have in the past directed, and the compensation committee will in the future direct, management, including the chief executive officer and our human resources team, to prepare reports and recommendations for the review, discussion, modification and final approval by the board of directors or the compensation committee with respect to various aspects of our named executive officers’ total compensation. The board of directors and compensation committee believe that the human resources team and the named executive officers have greater day-to-day insight into the key metrics on which our performance should be evaluated and the individual day-to-day performance of each named executive officer. Consequently, the board of directors and compensation committee have in the past, and likely will continue in the future, to ask the human resources team and named executive officers to prepare recommendations with respect to appropriate qualitative and quantitative criteria on which our named executive officers’ performance
105
Table of Contents
might be based. Similarly, our chief executive officer is in a unique position to be aware of and to comment upon the individual performance of the other named executive officers. Consequently, the board of directors and compensation committee receive reports and recommendations from the chief executive officer and the chief financial officer with respect to individual performance and related compensation decisions both for themselves and for other named executive officers.
Typically, the senior vice president, human resources undertakes an annual review and makes proposals to the chief executive officer regarding the target compensation of the named executive officers. After discussion, consideration and any appropriate modifications of these proposals, the chief executive officer and other members of management typically make executive compensation recommendations to the compensation committee and/or the board of directors. In making its recommendations as to compensation, and in determining base salaries, management relies on a number of factors, including: the relative compensation levels within E2open, then-current market conditions, market information obtained from surveys such as Radford and Option Impact, its general observations regarding company and individual performance, scope of responsibility and other information it deems relevant. To date, as discussed further below, although we review the above-mentioned surveys annually for information on median compensation in the relevant market, we do not benchmark our compensation program against any survey group or group of peer companies.
Finally, our chief executive officer or other named executive officers may actively participate in the negotiations of the terms of employment for individuals who may in the future become named executive officers, subject to the approval of the compensation committee or board of directors. For the fiscal 2011 and fiscal 2012 Executive Incentive Plan as well as the fiscal 2012 and fiscal 2013 Executive Equity Incentive Plan, management played a key role in recommending the performance targets and plan structure for review and approval by the compensation committee.
The reports and recommendations provided by the named executive officers, including the chief executive officer, and our human resources team, at the request of the board of directors or compensation committee, are among the resources that the board of directors and compensation committee may use in discharging their duties with respect to reviewing and setting named executive officer compensation. Other resources that the board of directors and compensation committee may rely upon include their respective experience and knowledge, the deliberative process of the board of directors and compensation committee, and any other resources that the board of directors or compensation committee may determine are relevant. The board of directors and compensation committee take into account any factors and information they deem relevant, such as its observations on company and individual performance, market conditions, retention and incentive needs for the company, and internal equity considerations. Once the board of directors or compensation committee believes that it has the information necessary to conduct its deliberations, they have in the past and will in the future, conduct these deliberations without further input of the named executive officers when discussing the chief executive officer’s compensation, and may include the chief executive officer and chief financial officer in deliberations regarding the remaining named executive officers’ compensation. The chief executive officer and chief financial officer regularly attend the compensation committee meetings; however, they do not participate in and are not present for those portions of the meetings when their individual compensation is being discussed.
Competitive Market
We compete with many other technology companies in seeking to attract and retain a skilled workforce and aim to attract and retain the most highly qualified executives to manage each of our business functions. In doing so, we compete for a pool of talent that is highly sought after by both large and established technology companies and earlier stage companies, including software-as-a-service, or SaaS, and enterprise software companies and other companies seeking similar skill sets in our geographic area, and in some cases nationally and internationally. Established organizations in our industry seek to recruit top talent from emerging companies in the sector just as smaller organizations look to attract and retain the best talent from the industry as a whole. The competition for finance and administration, technical, sales, marketing and deployment personnel is intense across the technology sector, and we expect it to remain so for the foreseeable future.
106
Table of Contents
We believe that we have competitive advantages in our ability to offer significant upside potential through stock options and other equity instruments. Nonetheless, we must offer competitive cash compensation levels that satisfy the day-to-day financial requirements of our employees through competitive base salaries and target cash bonuses aligned with objectives to help build long term value for our stockholders. We also compete for key personnel on the basis of our vision of future success, the excellence of our technical and management personnel, our culture and values, and the cohesiveness and productivity of our teams. To succeed in attracting top executives, we draw upon and access nationally recognized surveys such as Radford and Option Impact to ensure we remain current on compensation trends. Our management and compensation committee review data that analyzes various cross-sections of our industry, including SaaS companies and information technology companies generally. As discussed further below, this survey information is used as a reference tool and one among many considerations, but we have not historically benchmarked our compensation levels against the companies contained in these surveys nor have we historically used this information to set the compensation of our executives at specific levels or within specified percentile ranges.
Total Compensation Review
Management conducts an analysis of the executive compensation program on an annual basis to assess alignment with our compensation goals and retention needs, as well as the general competitiveness of our compensation packages. In doing so, management reviews data regarding similarly situated executives at other technology industry companies as reported in public and private company surveys. This information is shared with the compensation committee at the beginning of each fiscal year in conjunction with the establishment of the annual incentive plan for named executive officers. We review data regarding the total target compensation levels at the 50th percentile of the Radford data and the median compensation level for the Option Impact data for similarly situated executives at technology companies with similar revenue levels ($50,000,000—$100,000,000 in annual revenue). We review compensation data from these surveys based on the 50th percentile and the median target compensation levels because we believe this is consistent with its philosophy of generally providing market competitive compensation packages. To date, although our management and the compensation committee review and discuss the above-mentioned survey information in light of our named executive officers’ target compensation, the survey only serves as a reference point. In making its recommendations as to compensation, and in determining base salaries, management also relies on a number of other factors, such as the relative compensation levels within E2open, then-current market conditions, its general observations regarding company and individual performance, scope of responsibility and other information it deems relevant. The compensation committee reviews these recommendations in detail and has not historically made any changes to the compensation levels recommended by management. Ultimately, management, the compensation committee and the board of directors apply their own experience and business judgment to determine the compensation elements and amounts for each of our named executive officers.
Components of Our Compensation Program
Our executive officer compensation consists of the following principal components:
| • | base salary; |
| • | annual cash incentives that are linked to corporate performance; and |
| • | long-term incentive awards in the form of equity-based compensation. Current equity-based compensation is in the form of stock options although E2open has made restricted stock grants in the past. |
Further discussion of the policies, current compensation and basis for awarding compensation to our executive officers for each of the components is presented below. The various components are presented separately but are viewed by the compensation committee both individually and as part of the total compensation package appropriate for the relevant position.
107
Table of Contents
Base Salary
The base salary levels for our named executive officers represent a key compensation component used in establishing relative compensation parity externally. Base salary is the central component of our cash compensation program. On a prospective basis, we will continue to evaluate the mix of fixed cash, variable cash and long-term equity compensation to appropriately align the interests of our named executive officers with our stockholders. This evaluation will be made based on a number of factors including the market compensation data for each named executive officer for each of the relevant components of their compensation package as well as their relative contribution to our success.
We also consider several other factors in determining the base pay of our named executive officers. These include their experience and pay history, current responsibilities, competitive market data, competitive labor market conditions and other factors viewed as relevant by the compensation committee. We believe that providing base salaries that are competitive with technology companies of a similar size is important in order to attract and retain the most qualified executives.
Adjustments to base salary are typically considered as a result of one or more of the following:
| • | an increase in responsibilities of the executive; |
| • | market data indicating a need to adjust salaries in order to remain competitive; and |
| • | individual contributions of the executive to our success. |
After examining the factors above, the fiscal 2011 base salaries of our named executive officers did not increase from fiscal 2010 levels, since we felt the named executive officer’s current base salaries accomplished the company’s goals of recruiting and retaining top executive talent. The following table provides the base salaries for our named executive officers for fiscal years 2010 and 2011.
| Name and Position |
Base Salary ($) | |||
| Mark E. Woodward—President and Chief Executive Officer |
350,000 | |||
| Peter J. Maloney—Chief Financial Officer |
300,000 | |||
| David P. Hale—Chief Information Officer |
275,000 | |||
| David W. Packer—Senior Vice President, Worldwide Field Operations |
300,000 | |||
| Robert Schoenthaler—Senior Vice President, Deployment |
300,000 | |||
In connection with his efforts on behalf of the company outside of the United States in fiscal 2011, Mr. Hale received typical expatriate assignment benefits, which resulted in an additional compensation to him of $129,125.
Bonuses
We provide our named executive officers an opportunity to receive a year-end, formula-based bonus, which is used to motivate our executives to achieve specific financial goals that reflect the growth and success of our business. The bonus is based on a target incentive amount for each named executive officer, which is recommended by management and approved by the board of directors at the beginning of each fiscal year. In fiscal 2011, the plan components and target incentive amounts were recommended by management, and then reviewed and approved by the compensation committee and board of directors. The target bonus is based on an amount that we believe is necessary to provide a competitive overall compensation package in light of each named executive officer’s base salary and to motivate our executives to achieve pre-established company financial goals. Specifically, for fiscal 2011, the board of directors approved the payouts under the fiscal 2011 Executive Incentive Plan.
108
Table of Contents
In fiscal 2011, the target incentive amount and year-end payments for our named executive officers under the fiscal 2011 Executive Incentive Plan were the following:
| Name and Position |
Target Incentive ($) |
Actual Paid ($) |
||||||
| Mark E. Woodward—President and Chief Executive Officer |
350,000 | 356,650 | ||||||
| Peter J. Maloney—Chief Financial Officer |
150,000 | 152,850 | ||||||
| David P. Hale —Chief Information Officer |
50,000 | 50,950 | ||||||
| David W. Packer—Senior Vice President, Worldwide Field Operations |
150,000 | 152,850 | ||||||
| Robert Schoenthaler—Senior Vice President, Deployment |
50,000 | 50,950 | ||||||
The amount of the formula-based bonus paid to executives was determined based on the percentage of achievement of two equally weighted goals: the achievement of fiscal 2011 revenue of $55,000,000 and fiscal 2011 earnings before interest, taxes, depreciation and amortization, or EBITDA, of 13%, expressed as a percentage of revenue, in each case to be calculated based on generally accepted accounting principles. The fiscal 2011 EBITDA target was 13%. These performance goals were selected because we felt they were the most appropriate indicators of performance. Furthermore, these performance metrics are commonly used by public companies and therefore were appropriate as our strategy and goals began to contemplate becoming a publicly traded company. Upon achievement of both performance goals at these levels, each named executive officer would be eligible to earn 100% of his target amount. If we had failed to achieve either of these goals at these levels, our named executive officers would not have received any bonus for the year. For achievement above the performance threshold, incentive payouts were prorated based on the achievement percentage between determined payout levels. The percentage of the target bonus earned between the minimum (0%) and the maximum (150%) bonus to be awarded was varied in increments based on revenue achieved above the plan objective of $55 million. For example, at revenue of $57,750,000 (and achievement of the EBITDA target), 110% of the target incentive would have been earned under the plan. At revenue of $60,500,000 (and achievement of the EBITDA-target), 150% of the target amount would have been earned under the plan. Based on actual achievement of revenue of $55,523,136 and EBITDA of 17% for fiscal 2011, each of our named executive officers earned 101.9% of the target bonus amount for fiscal 2011 under the 2011 Executive Incentive Plan. The achievement level was calculated by management and subsequently reviewed and approved for payment by the compensation committee.
In addition to their participation in the 2011 Executive Incentive Plan, Mr. Packer also participated in a sales incentive plan and Mr. Schoenthaler participated in an individual incentive plan consisting of specific department based financial objectives.
Mr. Packer’s participation in the sales incentive plan is intended to reward Mr. Packer for the efforts of the sales team, which he manages, in reaching our annual billings, bookings and new customer targets throughout the fiscal year. Mr. Packer’s annual target incentive under the sales incentive plan for fiscal 2011 was $150,000 and the actual fiscal 2011 bonus paid under the sales incentive plan was $54,731. Mr. Packer’s bonus under the sales incentive plan was calculated based on the actual percentage achievement of the company’s fiscal 2011 billings, bookings, and new customer attainment goals as compared to established fiscal year targets with an actual percentage achievement equal to 87% of the incentive plan billings target, 83% of the incentive plan bookings target, and 48% of the incentive plan target for new customers. Pursuant to the terms of Mr. Packer’s sales incentive plan, Mr. Packer was eligible to receive a pro-rated portion of his bonus upon the achievement of minimum thresholds for the goals set forth above (with a minimum threshold of 80% for billings, 75% for bookings and a minimum of 10 or more new customers). In setting Mr. Packer’s performance targets, the chief executive officer selected target levels that would be difficult to attain based on the company’s historic performance and growth levels and would be attained only if the company’s 2011 performance and growth levels exceeded the company’s historic performance levels. For fiscal 2012, Mr. Packer will again participate in a sales incentive plan at an annual target incentive of $150,000.
109
Table of Contents
Mr. Schoenthaler participated in an individual incentive plan in fiscal 2011 to motivate performance against specific financial targets determined for the professional services organization relating to professional services billings and professional services gross margins. In setting Mr. Schoenthaler’s performance targets, the compensation committee selected target levels that would be difficult to attain based on the company’s historic performance and growth levels and would be attained only if the Company’s 2011 performance and growth levels exceeded the Company’s historic performance levels. Mr. Schoenthaler’s annual target incentive under this individual plan for fiscal 2011 was $25,000; however no bonus was paid because the specific financial targets were not achieved. Mr. Schoenthaler’s individual incentive plan had no minimum threshold amounts and he was entitled to receive a payout under his individual incentive plan only if the target incentives were met or exceeded. In fiscal 2012, Mr. Schoenthaler will not participate in this individual incentive plan and his incentives are now aligned with the financial objectives established as part of the 2012 Executive Incentive Plan. Thus, Mr. Schoenthaler’s bonus target under the 2012 Executive Incentive Plan was increased by $25,000 to $75,000 from his fiscal 2011 target of $50,000 to retain the same overall target incentive compensation levels for him.
In fiscal 2012, the target incentive amounts for our named executive officers are the following:
| Name and Position |
Target Incentive ($) |
Maximum Incentive ($) |
||||||
| Mark E. Woodward—President and Chief Executive Officer |
350,000 | 525,000 | ||||||
| Peter J. Maloney—Chief Financial Officer |
150,000 | 225,000 | ||||||
| David P. Hale—Chief Information Officer |
50,000 | 75,000 | ||||||
| David W. Packer—Senior Vice President, Worldwide Field Operations |
150,000 | 225,000 | ||||||
| Robert Schoenthaler—Senior Vice President, Deployment |
75,000 | 112,500 | ||||||
For fiscal 2012, the amount of the formula-based bonus paid to our executives will be determined based upon the achievement of goals relating to bookings, billings, free cash flow and receivables performance against the established fiscal 2012 financial plan targets. These goals were chosen by the compensation committee after consultation with management regarding the Company’s strategic and performance expectations and goals for the upcoming fiscal year. Upon achievement of the performance goals at target levels, each named executive officer would be eligible to earn 100% of his target incentive amount. For achievement below the minimum performance threshold, no bonus will be awarded. For achievement at or above the minimum threshold for performance, bonuses will be awarded between the minimum payout (100% of target incentive amount) and the maximum payout (150% of target incentive amount) based on the achievement level of the various goals. The achievement level and incentive payouts will be calculated by management and subsequently reviewed and approved for payment by the compensation committee.
Long-Term Incentives
We view equity-based compensation as a critical component of the total executive compensation program for aligning the interests of our key executives with those of our stockholders. We award equity-based compensation in the form of stock option grants in order to tie compensation directly to sustained increases in stockholder value. We have also made awards of restricted stock to our named executive officers and select members of the management team in the past, but did not make any awards of restricted stock in fiscal 2011. We consider several factors in determining the equity based compensation of our named executive officers. These include their experience and compensation history, current responsibilities, market data, competitive labor market conditions and other factors viewed as relevant by the compensation committee.
We have not historically granted stock options to named executive officers on a regular basis and did not grant stock options in fiscal 2011; however, named executive officers have received option grants in connection with joining E2open as well as additional option grants on a periodic basis based on performance or to ensure market competitiveness. All option grants to named executive officers are recommended by management and approved by the compensation committee. The amount of the new hire grant or subsequent
110
Table of Contents
merit grants varies by position, reflecting the level of responsibility and overall experience of the individual, perceived value of the position within our company, market competitive level for each executive position and performance of the individual in the case of subsequent merit grants. Additional grants are typically made at the time of promotion, increased responsibilities or related to a notable contribution to our company. No stock options or restricted stock awards were granted to named executive officers in fiscal 2011 because the compensation committee believed each named executive officer’s then-current equity holdings were sufficient to align his interests with those of our stockholders.
As a privately-held company, our stock options have historically been granted with an exercise price per share equal to or greater than the price established as the fair market value per share as of the most recent valuation of our common stock by an independent external valuation company. Valuations were typically completed twice per year or more frequently when deemed necessary.
To encourage retention and sustained commitment to our company, new hire stock option grants generally vest over a period of four years, with 25% of the shares subject to a grant vesting after 12 months of service by the employee and with 1/48th of the shares vesting each month thereafter. Merit and promotional stock option grants generally vest over a period of four years on a monthly basis. Our 2003 Stock Plan, or the 2003 Plan, permits but does not require accelerated vesting upon a change of control of the company (however awards cannot be terminated unless they are cashed out or first accelerated) and our 2012 Equity Compensation Plan, or the 2012 Plan, will provide that awards will be accelerated to the extent not assumed or substituted. Contractually, for the same reasons discussed below under “Potential Payments upon Termination or Change of Control,” we have committed to certain named executive officers in their employment agreements that the vesting of their grants would accelerate under certain circumstances in connection with a change of control of the company.
In May 2011, the board of directors approved the fiscal 2012 and fiscal 2013 Executive Equity Incentive Plan which provides a multi-year equity incentive program to reward the named executive officers for their ability to increase stockholder value through the achievement of key financial performance metrics and consists of a combination of time-based grants and performance-based stock option grants.
In December 2009, our compensation committee approved amendments to certain previously granted restricted stock awards, including those held by our named executive officers. These amendments removed the requirement that, in order for the stock to vest, a liquidity event must occur within five years from the date of grant, which left the awards to vest in full one year from the date of grant, subject to continued service. The compensation committee considered that taxes would be due immediately upon vesting, which could result in an unfair burden to the award holders since the shares could not be sold at that time. The compensation committee therefore, at the same time, also provided that the Company would pay the withholding taxes due for such payments. The values of these payments to the named executive officers are listed below in the “2011 Summary Compensation Table.” The restricted stock awards vested in full in March 2010.
Benefits
We provide the following benefits to our U.S. based named executive officers, generally on the same basis provided to all of our employees:
| • | medical, dental and vision insurance; |
| • | 401(k) plan; |
| • | employee assistance program; |
| • | short-and long-term disability, life insurance, accidental death and dismemberment insurance; and |
| • | health and dependent care flexible spending accounts. |
111
Table of Contents
We believe these benefits are consistent with those offered by companies with which we compete for employees.
In addition, prior to December 31, 2010, we provided Mr. Hale with certain benefits related to his overseas secondment to the company’s Malaysian subsidiary. We believe such benefits were reasonable expatriate benefits for an individual who is relocated outside of his home country for purposes of an overseas work assignment. These benefits included, among others, a stipend to assist with additional costs, payments to account for exchange rate variations and tax equalization payments. Additionally, we guaranteed Mr. Hale’s position with us for six months after the expiration or termination of the assignment (excluding a termination for Cause) (or in lieu of a guaranteed position, we could have immediately terminated Mr. Hale without Cause by paying him six months of his salary). Mr. Hale’s secondment has ended and he no longer has severance rights pursuant to his secondment agreement.
Accounting and Tax Considerations
In our review and establishment of compensation programs and payments for fiscal 2011, we considered, but did not place great emphasis on, the anticipated accounting and tax treatment of our compensation programs and payments by us to our named executive officers. While we may place greater weight on the accounting and tax effects of our compensatory arrangements in the future, we have historically focused on other factors such as the effectiveness of our compensation programs in meeting our goals and retaining executive talent, the net costs of our compensation goals to us, and our ability to effectively administer executive compensation in the short- and long-term interests of our stockholders.
Section 162(m) of the Code limits the amount that any publicly-held corporation may deduct for compensation paid to the chief executive officer and to certain other highly compensated officers to $1,000,000 per person, unless certain exemption requirements are met. Exemptions to this deductibility limit may be made for various forms of “performance-based” compensation and/or for a period of time after our stock first becomes publicly traded. As we have been a privately-held corporation, we have not previously taken the deductibility limit imposed by Section 162(m) into consideration in setting compensation for our named executive officers. Although the compensation committee has not adopted a formal policy regarding tax deductibility of compensation paid to our chief executive officer and such other highly compensated officers to whom this deductibility limit applies, the compensation committee intends to consider tax deductibility under Rule 162(m) as a factor in future compensation decisions. Our compensation committee may, in its judgment, authorize compensation payments that do not comply with an exemption from the deductibility limit when it believes that such payments are appropriate and in the best interests of our stockholders.
Compensation Recovery Policy
We have not implemented a policy regarding retroactive adjustments to any cash or equity-based incentive compensation paid to our named executive officers and our other employees where the payments were predicated upon the achievement of financial results that were subsequently the subject of a financial restatement. We intend to adopt a general compensation recovery, or clawback, policy covering our annual and long-term incentive award plans and arrangements once we are a publicly-traded company and after the SEC adopts final rules implementing the requirement of Section 954 of the Dodd-Frank Wall Street Reform and Consumer Protection Act.
Equity Award Grant Practices
Equity awards are granted to our named executive officers and our other employees under our 2003 Plan, and following this offering, we expect to grant equity awards under our 2012 Plan. All equity awards are approved by our compensation committee on the grant date. The compensation committee has not delegated authority to grant equity awards under the 2003 Plan or the 2012 Plan. The compensation committee does not
112
Table of Contents
intend to establish any program, plan or practice of timing the grant of equity awards to its named executive officers in coordination with the release of material non-public information that is likely to result in any increase or decrease in the value of our common stock.
Stock Ownership Guideline
At this time, the board of directors has not adopted stock ownership guidelines with respect to the named executive officers or otherwise, although it may consider doing so in the future. We expect to adopt an insider trading policy that will effective upon the completion of this offering that prohibits, among other things, short sales, hedging of stock ownership positions and transactions involving derivative securities relating to our common stock.
Change of Control and Severance Benefits
The board of directors and compensation committee consider maintaining a stable and effective management team to be important to protecting and enhancing the best interests of the company and its stockholders. To that end, they recognize that the possibility of a change of control may exist from time to time, and that this possibility, and the uncertainty and questions it may raise among management, may result in the departure or distraction of management to the detriment of E2open and our stockholders. Accordingly, we have taken appropriate steps to encourage the attention, dedication and continuity of members of our management to their assigned duties without the distraction that may arise from the possibility or occurrence of a change of control. As a result, we have entered into change of control arrangements with certain of our key employees including Messrs. Woodward, Maloney, Packer and Schoenthaler. Generally, such arrangement was entered into with each such named executive officer at the time of hire and is set forth in an offer letter, as amended from time to time (including in a change of control letter agreement, with respect to Messrs. Schoenthaler and Maloney). The benefit includes accelerated vesting of certain equity awards upon a termination without “Cause” or resignation for “Good Reason” (or an “Involuntary Termination,” as such terms are defined in the applicable agreements) that occurs within 12 months following a “Change of Control” (as defined in the applicable agreement).
There are currently no other severance agreements in place for Messrs. Woodward, Maloney, Packer, Schoenthaler or Hale. As described above, Mr. Hale was entitled to receive certain severance benefits pursuant to a secondment agreement with the Company, but such severance arrangement has expired.
113
Table of Contents
2011 Summary Compensation Table
The following table provides information regarding the compensation of our principal executive officer, principal financial officer and each of the named officers during our fiscal year ended February 28, 2011. No option awards or stock awards were granted to our principal executive officer, principal financial officer and each of the named officers during our fiscal year ended February 28, 2011.
| Name and Principal Position |
Year | Salary ($) | Non-Equity Incentive Plan Compensation ($) (1) |
All Other Compensation ($) |
Total ($) | |||||||||||||||
| Mark E. Woodward |
2011 | 350,000 | 356,650 | 17,251 | (2) | 723,901 | ||||||||||||||
| President and Chief Executive Officer |
||||||||||||||||||||
| Peter J. Maloney |
2011 | 300,000 | 152,850 | 6,248 | (3) | 459,098 | ||||||||||||||
| Chief Financial Officer |
||||||||||||||||||||
| David P. Hale |
2011 | 275,000 | 50,950 | 132,203 | (4) | 458,153 | ||||||||||||||
| Chief Information Officer |
||||||||||||||||||||
| David W. Packer |
2011 | 300,000 | 207,581 | (5) | 3,332 | (6) | 510,913 | |||||||||||||
| Senior Vice President, Field Operations |
||||||||||||||||||||
| Robert Schoenthaler |
2011 | 300,000 | 50,950 | 3,500 | (7) | 354,450 | ||||||||||||||
| Senior Vice President, Deployment |
||||||||||||||||||||
| (1) | The amounts included in the “Non-Equity Incentive Plan Compensation” column represent the amounts earned and payable under the 2011 Executive Incentive Plan, which were paid in April 2011. |
| (2) | Includes (i) a payment of withholding taxes paid by the company on behalf of the individual associated with the vesting of a restricted stock award in the amount of $16,831; (ii) life insurance premiums in the amount of $336; and (iii) accidental death insurance premiums in the amount of $84. |
| (3) | Includes (i) a payment of withholding taxes paid by the company on behalf of the individual associated with the vesting of a restricted stock award in the amount of $5,888; (ii) life insurance premiums in the amount of $288; and (iii) accidental death insurance premiums in the amount of $72. |
| (4) | Includes (i) benefits relating to Mr. Hale’s secondment to Malaysia including (a) a stipend to assist with additional costs in the amount of $20,833, (b) payments to account for exchange rate variations between Malaysian Ringgit and U.S. dollars in the amount of $10,822, (c) tax equalization payments in the amount of $19,315 and (d) payment of other expenses related to Mr. Hale’s secondment in the amount of $78,155; (ii) a payment of withholding taxes paid by the company on behalf of the individual associated with the vesting of a restricted stock award in the amount of $2,748; (iii) life insurance premiums in the amount of $264; and (iv) accidental death insurance premiums in the amount of $66. |
| (5) | Includes (i) $152,850 paid under the 2011 Executive Incentive Plan and (ii) $54,731 paid under our annual sales management incentive plan. |
| (6) | Includes (i) a payment of withholding taxes paid by the company on behalf of the individual associated with the vesting of a restricted stock award in the amount of $2,972; (ii) life insurance premiums in the amount of $288; and (iii) accidental death insurance premiums in the amount of $72. |
| (7) | Includes (i) a payment of withholding taxes paid by the company on behalf of the individual associated with the vesting of a restricted stock award in the amount of $3,140; (ii) life insurance premiums in the amount of $288; and (iii) accidental death insurance premiums in the amount of $72. |
114
Table of Contents
Grants of Plan-Based Awards in 2011
The following table provides information regarding grants of non-equity incentive plan-based awards made to each of our named executive officers during fiscal 2011.
| Estimated Future Payouts Under Non-Equity Incentive Plan Awards ($) (1) |
||||||||||||
| Name |
Threshold | Target | Maximum | |||||||||
| Mark E. Woodward |
— | 350,000 | 525,000 | |||||||||
| Peter J. Maloney |
— | 150,000 | 225,000 | |||||||||
| David P. Hale |
— | 50,000 | 75,000 | |||||||||
| David W. Packer (2) |
65,625 | 300,000 | 427,500 | |||||||||
| Robert Schoenthaler (3) |
— | 75,000 | 100,000 | |||||||||
| (1) | Amounts in the “Estimated Future Payouts Under Non-Equity Incentive Plan Awards” columns relate to amounts payable under our 2011 Executive Incentive Plan and with respect to Mr. Packer, a sales incentive plan, and with respect to Mr. Schoenthaler, an individual incentive plan. There were no minimum threshold amounts for the 2011 Executive Incentive Plan or Mr. Schoenthaler’s individual incentive plan. |
| (2) | Mr. Packer’s target under the 2011 Executive Incentive Plan was $150,000 and the maximum amount was $225,000. In addition to his participation in the 2011 Executive Incentive Plan, Mr. Packer participated in a sales incentive plan. The sales incentive plan is comprised of three components: quarterly billings, annual bookings and new customers. The minimum achievement amount under the sales incentive plan was $65,625 and consisted of (i) a minimum threshold amount of $26,250 under the billings component (which represented 50% of his target amount for this performance goal) upon achievement of 80% of the quarterly billings target for all four quarters, (ii) a minimum amount of $39,375 under the bookings component (which represented 75% of his target amount for this performance goal) upon achievement of 75% of the bookings performance target, and (iii) a minimum threshold of $0 under the new customers component, if Mr. Packer did not bring in 10 or more new customers. The target award amount under the sales incentive plan was $150,000 and consisted of (i) a target amount of $52,500 under the billings component, (ii) a target amount of $52,500 under the bookings component and (iii) a target amount $45,000 under the new customers component for bringing in 25 new customers. The maximum payable amount under the sales incentive plan was estimated at $202,500. Under the billings component, the target amount of $52,500 is included for purposes of calculating the maximum payable amount, although an additional bonus could have been paid in excess of the target amount, with no maximum, based on the percentage of achievement of the annual billings target multiplied by Mr. Packer’s annual target bonus under the billings component. Under the bookings component, the maximum payable amount was $105,000. Under the new customers component, the target amount of $45,000 for bringing in 10 or more new customers is included for purposes of calculating the maximum payable amount, although the actual amount that could be earned under this component contained no maximum and is calculated based upon the direct correlation to the percentage achievement target of 25 new customers. |
| (3) | Mr. Schoenthaler’s target under the 2011 Executive Incentive Plan is $50,000 and the maximum amount payable is $75,000. In addition to his participation in the 2011 Executive Incentive Plan, Mr. Schoenthaler participated in an individual incentive plan. The target amount under the individual plan is $25,000. There were no minimum or maximum amounts in the individual plan, as the target bonus became payable if the applicable target objectives were achieved or exceeded. For purposes of calculating the maximum amount payable under Mr. Schoenthaler’s individual incentive plan, the target amount was included as the maximum. |
For more information on bonus payments to our named executive officers please see “—Bonuses.”
115
Table of Contents
Outstanding Equity Awards at Fiscal Year-End
The following table presents certain information concerning equity awards held by our named executive officers at the end of fiscal 2011.
| Option Awards | Stock Awards | |||||||||||||||||||||||
| Number of Securities Underlying Unexercised Options (#) |
Option Exercise Price ($) |
Option Expiration Date |
Number of Shares or Units of Stock That Have Not Vested (#) |
Market Value of Shares or Units of Stock That Have Not Vested ($) |
||||||||||||||||||||
| Name |
Exercisable | Unexercisable | ||||||||||||||||||||||
| Mark E. Woodward. |
— | — | — | — | 8,000,000 | (1) | 720,000 | |||||||||||||||||
| — | — | — | — | 3,721,084 | (2) | 334,898 | ||||||||||||||||||
| Peter J. Maloney |
1,721,625 | (3) | — | 0.01 | 12/16/2017 | — | — | |||||||||||||||||
| 123,125 | (4) | 246,250 | 0.01 | 8/9/2018 | — | — | ||||||||||||||||||
| 1,900,000 | (5) | — | 0.01 | 4/25/2019 | — | — | ||||||||||||||||||
| David P. Hale |
393,890 | (6) | — | 0.01 | 12/23/2014 | — | — | |||||||||||||||||
| 83,333 | (7) | 16,667 | 0.01 | 8/2/2017 | — | — | ||||||||||||||||||
| 708,333 | (8) | 291,667 | 0.01 | 2/16/2018 | — | — | ||||||||||||||||||
| 208,333 | (9) | 291,667 | 0.01 | 4/25/2019 | — | — | ||||||||||||||||||
| David W. Packer |
4,341,000 | (10) | — | 0.01 | 6/9/2018 | — | — | |||||||||||||||||
| 681,250 | (11) | 953,750 | 0.01 | 4/25/2019 | — | — | ||||||||||||||||||
| Robert Schoenthaler |
312,500 | (12) | — | 0.01 | 6/2/2017 | — | — | |||||||||||||||||
| 593,750 | (13) | — | 0.01 | 4/25/2019 | — | — | ||||||||||||||||||
| (1) | Shares acquired pursuant to early exercise provision and are subject to a right of repurchase we hold as of February 28, 2011. The shares vest ratably on a monthly basis through June 26, 2012. |
| (2) | Shares acquired pursuant to early exercise provision and are subject to a right of repurchase we hold as of February 28, 2011. The shares vest ratably on a monthly basis through June 25, 2013. |
| (3) | The option is subject to an early exercise provision and is immediately exercisable. One-fourth of the shares vested on January 30, 2009 and one thirty-sixth of the shares vest monthly thereafter. As of February 28, 2011, 575,791 shares were vested and 1,145,834 shares vest over the remainder of the vesting period. |
| (4) | One-fourth of the shares subject to the option vested on October 9, 2009 and one thirty-sixth of the shares vest monthly thereafter. |
| (5) | The option is subject to an early exercise provision and is immediately exercisable. The option vests monthly over four years beginning on June 25, 2009. As of February 28, 2011, 500,000 shares were vested and 1,400,000 shares vest over the remainder of the vesting period. |
| (6) | The option is fully vested and immediately exercisable. |
| (7) | The option vests monthly over four years beginning on October 2, 2007. |
| (8) | The option vests monthly over four years beginning on April 16, 2008. |
| (9) | The option vests monthly over four years beginning on June 25, 2009. |
| (10) | The option is subject to an early exercise provision and is immediately exercisable. One-fourth of the shares vested on September 10, 2009 and one thirty-sixth of the shares vest monthly thereafter. As of February 28, 2011, 2,028,937 shares were vested and 2,312,063 shares vest over the remainder of the vesting period. |
| (11) | One-fourth of the shares subject to the option vested on June 25, 2010 and one thirty-sixth of the shares vest monthly thereafter. |
| (12) | The option is subject to an early exercise provision and is immediately exercisable. One-fourth of the shares vested on July 16, 2008 and one thirty-sixth of the shares vest monthly thereafter. As of February 28, 2011, 208,333 shares were vested and 104,167 shares vest over the remainder of the vesting period. |
| (13) | The option is subject to an early exercise provision and is immediately exercisable. The option vests monthly over four years beginning on June 25, 2009. As of February 28, 2011, 156,250 shares were vested and 437,500 shares vest over the remainder of the vesting period. |
116
Table of Contents
Option Exercises and Stock Vested at Fiscal Year-End
The following table presents certain information concerning the exercise of options by each of the named executive officers during the fiscal year ended February 28, 2011, as well as information regarding stock awards that vested during such fiscal year.
| Option Awards | Stock Awards | |||||||||||||||
| Name of Executive Officer |
Number of Shares Acquired on Exercise (#) |
Value Realized on Exercise ($) |
Number of Shares Acquired on Vesting (#) |
Value Realized on Vesting ($) |
||||||||||||
| Mark E. Woodward |
— | — | 9,807,916 | (1) | 589,199 | |||||||||||
| Peter J. Maloney |
3,429,958 | 0 | 1,320,042 | (1) | 47,403 | |||||||||||
| David P. Hale |
1,000,000 | 0 | 350,000 | 3,500 | ||||||||||||
| David W. Packer |
1,500,000 | 0 | 500,000 | 5,000 | ||||||||||||
| Robert Schoenthaler |
843,750 | 0 | 400,000 | 4,000 | ||||||||||||
| (1) | Includes (i) shares acquired pursuant to an early exercise provision and are no longer subject to a right of repurchase and (ii) shares vested pursuant to a restricted stock award. |
Pension Benefits
We do not offer pension benefits to our named executive officers.
Nonqualified Deferred Compensation
We do not offer non-qualified deferred compensation to our named executive officers.
Employment Agreements and Change of Control Arrangements
We have executed employment agreements with each of our named executive officers. Summaries of such employment agreements follow.
Mr. Woodward
We entered into an offer letter with Mr. Woodward on June 20, 2008. Currently, Mr. Woodward is entitled to receive $350,000 in annual base salary and is eligible for an incentive bonus of $350,000 payable upon the achievement of certain performance goals as determined by our board of directors under the fiscal 2012 Executive Incentive Plan. Mr. Woodward is also eligible to participate in all employee benefit plans and vacation programs. For information relating to potential payments upon termination under Mr. Woodward’s offer letter, see the section captioned “Potential Payments upon Termination or Change of Control.”
Mr. Maloney
We entered into an offer letter with Mr. Maloney on December 26, 2007. Currently, Mr. Maloney is entitled to receive $300,000 in annual base salary and is eligible for an incentive bonus of $150,000 payable upon the achievement of certain performance goals as determined by our board of directors under the fiscal 2012 Executive Incentive Plan. Mr. Maloney is also eligible to participate in all company employee benefit plans and vacation programs. For information relating to potential payments upon termination under Mr. Maloney’s offer letter, see the section captioned “Potential Payments upon Termination or Change of Control.”
117
Table of Contents
Mr. Hale
We entered into an offer letter with Mr. Hale on December 9, 2000. Currently, Mr. Hale is entitled to receive $275,000 in annual base salary and is eligible for an incentive bonus of $50,000 payable upon the achievement of certain performance goals as determined by our board of directors under the fiscal 2012 Executive Incentive Plan. Mr. Hale is also eligible to participate in all company employee benefit plans and vacation programs. Additionally, Mr. Hale remains eligible for certain tax equalization and benefits pursuant to the terms of the secondment agreement governing the terms of his employment with our Malaysian subsidiary, but the remaining provisions of the secondment agreement have expired.
Mr. Packer
We entered into an offer letter with Mr. Packer on August 18, 2008. Currently, Mr. Packer is entitled to receive $300,000 in annual base salary and is eligible for an incentive bonus of $150,000 payable upon the achievement of certain performance goals as determined by our board of directors under the fiscal 2012 Executive Incentive Plan and a bonus of $150,000 payable upon achievement of certain performance goals as determined by the chief executive officer under our annual sales management incentive plan. Mr. Packer is also eligible to participate in all company employee benefit plans and vacation programs. For information relating to potential payments upon termination under Mr. Packer’s offer letter, see the section captioned “Potential Payments upon Termination or Change of Control.”
Mr. Schoenthaler
We entered into an offer letter with Mr. Schoenthaler on June 18, 2007. Currently, Mr. Schoenthaler is entitled to receive $300,000 in annual base salary and is eligible for an incentive bonus of $75,000 payable upon the achievement of certain performance goals as determined by our board of directors under the fiscal 2012 Executive Incentive Plan. Mr. Schoenthaler is also eligible to participate in all company employee benefit plans and vacation programs. For information relating to potential payments upon termination under Mr. Schoenthaler’s offer letter, see the section captioned “Potential Payments upon Termination or Change of Control.”
Potential Payments upon Termination or Change of Control
We have entered into change of control agreements and/or arrangements with Messrs. Woodward, Maloney, Packer and Schoenthaler whereby one hundred percent (100%) of the then-unvested, unexpired portion of their new hire option and any future option grants (see tables above regarding current outstanding options) and, with respect to Mr. Schoenthaler, restricted stock and other forms of long-term compensation and, with respect to Mr. Maloney, all equity grants, accelerate and our right to repurchase such restricted stock lapse upon the termination of their employment by E2open without “Cause” or for Messrs. Woodward and Packer for “Good Reason” and for Messrs. Maloney and Schoenthaler, for “Involuntary Termination,” in each case if such termination occurs within 12 months following a “Change of Control Transaction.” “Cause” means (i) any act of personal dishonesty taken in connection with the person’s responsibilities as an employee; (ii) being convicted of, or accepting a plea of “guilty” or “no contest” to, a felony under the laws of the U.S. or any state thereof; (iii) a willful act by the employee which constitutes gross misconduct and which is materially injurious to E2open; or (iv) a willful act by the employee that constitutes (A) a material breach of a material provision of any agreement between the employee and us or (B) a material failure to comply with our written policies or rules, in each case under this clause (iv) if such breach or failure has not been cured by the employee within 30 days after written notification by us to the employee of such breach or failure. For Messrs. Maloney and Schoenthaler, termination without “Cause” will include termination due to his death or “Disability” (defined as Mr. Maloney or Mr. Schoenthaler suffering from a physical or mental disability to an extent that renders it impracticable for him to continue performing his duties under the agreement). “Good Reason” means the employee provides written voluntary resignation within sixty (60) days following (i) a material reduction in the level of responsibility to
118
Table of Contents
which the employee did not consent, including a change in position or status to a position that is not at their current level or above with the successor; (ii) a reduction of greater than ten percent (10%) of the employee’s then current salary unless a commensurate reduction is made for all executive officers of E2open; (iii) an order to report financial results illegally or not consistent with generally accepted accounting principles or with the Sarbanes-Oxley Act of 2002; or (iv) relocation of the employee’s principal place of employment by more than 50 miles. For Mr. Maloney, “Involuntary Termination” means without Mr. Maloney’s consent, (i) a material reduction in his level of responsibility to which he has not consented, including a change in his position or status to a position that is not at the executive officer level of Chief Financial Officer or above with the successor entity to E2open; (ii) a reduction by E2open in his compensation (including base salary, fringe benefits and participation in bonus or incentive programs based on E2open’s performance) as in effect immediately prior to such reduction; (iii) an order to report financial results illegally or not consistent with generally accepted accounting principles or with the Sarbanes-Oxley Act of 2002; (iv) any purported termination of him by us that is not effected for “Cause”; (v) relocation of his principal place of employment by more than 25 miles; (vi) the failure of any successor entity to the company to assume Mr. Maloney’s agreement or other written agreements between him and us (including his offer letter or stock option agreement(s)); (vii) any act or set of circumstances that would constitute constructive termination of his employment under California case law or statute; and (viii) any material breach by us of any material provision of the agreement with us which has not been cured within 30 days of written notice to us by Mr. Maloney of such breach. For Mr. Schoenthaler, “Involuntary Termination” means without Mr. Schoenthaler’s consent, (i) a material change in or reduction of his duties or responsibilities, either of which is inconsistent with his duties or responsibilities in effect immediately prior to such assignment, or his removal from such position and responsibility, or a reduction in his title (provided that a change in his title because E2open is a subsidiary or division of the acquirer or subsidiary thereof will not constitute a reduction in his title); (ii) a reduction in his compensation (including base salary, fringe benefits and participation in bonus or incentive programs based on E2open’s performance) as in effect immediately prior to such reduction; (iii) any purported termination of him by E2open that is not for “Cause;” (iv) relocation of his principal place of employment by more than 25 miles; (v) the failure of any successor entity to the company to assume Mr. Schoenthaler’s offer letter or other written agreements between him and E2open (including stock option agreement(s)); (vi) any act or set of circumstances that would constitute constructive termination of his employment under California case law or statute; and (vii) any material breach by the company of any material provision of Mr. Schoenthaler’s offer letter with us which has not been cured within 30 days of written notice to us by Mr. Schoenthaler of such breach.
As defined in the agreements, “Change of Control Transaction” means the occurrence of any of the following events: (i) any “person” (as such term is used in Sections 13(d) and 14(d) of the Securities Exchange Act of 1934, as amended) is or becomes the “beneficial owner” (as defined in Section 13d-3 of said Act), directly or indirectly, of our securities representing 50% or more of the total voting power of the then outstanding voting securities; (ii) our stockholders approve a merger or consolidation of E2open with any other corporation, other than a merger or consolidation which would result in our voting securities outstanding immediately prior thereto continuing to represent (either by remaining outstanding or by being converted into voting securities of the surviving entity) at least 50% of the total voting power represented by our or such surviving entity’s voting securities outstanding immediately after such merger or consolidation; or (iii) our stockholders approve a plan of complete liquidation of E2open or an agreement for the sale, exclusive license or disposition by us of all, or substantially all, of our assets; provided, however, that a “Change of Control” shall not include a transaction that only changes the state of E2open’s incorporation.
Except as described above, there are currently no severance agreements in place for Messrs. Woodward, Maloney, Hale, Packer and Schoenthaler.
The following table provides information concerning the estimated payments and benefits that would be provided in the circumstances described above for each of the named executive officers. For purposes of the table, a qualifying termination of employment is considered “in connection with a change of control” if such termination occurs within the period 12 months following a “change of control transaction” (as defined in each
119
Table of Contents
arrangement). Payments and benefits are estimated assuming that the triggering event took place on February 28, 2011. There can be no assurance that a triggering event would produce the same or similar results as those estimated below if such event occurs on any other date or at any other price, of if any other assumption used to estimate potential payments and benefits is not correct. Due to the number of factors that affect the nature and amount of any potential payments or benefits, any actual payments and benefits may be different.
Potential Payments Upon Termination Following a Change of Control
The following table sets forth quantitative estimates of the benefits that would have accrued to our named executive officers pursuant to each of their offer letter and/or change of control agreements described above under “—Employment Agreements and Change of Control Arrangements” if their employment had been terminated by us, each within 12 months following a change in control consummating on February 28, 2011.
| Name |
Value of Accelerated Options (1) |
|||
| Mark E. Woodward (2) |
$ | 937,687 | ||
| Peter J. Maloney (3) |
$ | 223,367 | ||
| David P. Hale (4) |
— | |||
| David W. Packer (5) |
$ | 261,265 | ||
| Robert Schoenthaler (6) |
$ | 43,333 | ||
| (1) | Amounts indicated in the table are calculated as the difference between the fair value of a share of common stock underlying the options subject to accelerated vesting on February 28, 2011 and the exercise price of these options, multiplied by the number of unvested shares. The fair value of a share of common stock on February 28, 2011 was $0.09. |
| (2) | As of February 28, 2011, Mr. Woodward had exercised all of his options. If Mr. Woodward was terminated for “Good Reason” within 12 months following a “Change of Control Transaction,” our right to repurchase 11,721,084 shares of restricted stock held by Mr. Woodward would lapse upon the termination of his employment. Assuming the fair value per share was $ , which is the midpoint of the range reflected on the cover page of this prospectus, the value of accelerated equity awards would be $ . |
| (3) | As of February 28, 2011, 2,792,084 shares of common stock subject to Mr. Maloney’s options would accelerate if he were either terminated without “Cause” or by “Involuntary Termination,” each within 12 months following a “Change of Control,” which is 100% of the shares subject to the options granted to Mr. Maloney that were unvested as of February 28, 2011. Assuming the fair value per share was $ , which is the midpoint of the range reflected on the cover page of this prospectus, the value of accelerated equity awards would be $ . |
| (4) | Mr. Hale does not currently have an offer letter agreement with the company and is currently not entitled to change of control benefits. |
| (5) | As of February 28, 2011, 3,265,813 shares of common stock subject to Mr. Packer’s options would accelerate if he were either terminated without “Cause” or “Good Reason,” each within 12 months following a “Change of Control Transaction,” which is 100% of the shares subject to the options granted to Mr. Packer that were unvested as of February 28, 2011. Assuming the fair value per share was $ , which is the midpoint of the range reflected on the cover page of this prospectus, the value of accelerated equity awards would be $ . |
| (6) | As of February 28, 2011, 541,667 shares of common stock subject to Mr. Schoenthaler’s options would accelerate if he were either terminated without “Cause” or by “Involuntarily Termination,” each within 12 months following a “Change of Control Transaction,” which is 100% of the shares subject to the options granted to Mr. Schoenthaler that were unvested as of February 28, 2011. Assuming the fair value per share was $ , which is the midpoint of the range reflected on the cover page of this prospectus, the value of accelerated equity awards would be $ . |
120
Table of Contents
Employee Benefit Plans
2012 Equity Compensation Plan
We expect that our board of directors and our stockholders will adopt and approve our 2012 Plan, prior to the completion of this offering. Subject to stockholder approval, the 2012 Plan will be effective upon its adoption by our board of directors, but we do not expect to utilize our 2012 Plan until after the completion of this offering. Our 2012 Plan permits the grant of incentive stock options, within the meaning of Section 422 of the Code, to our employees and any of our parent and subsidiary corporations’ employees, and the grant of nonstatutory stock options, stock appreciation rights, restricted stock, restricted stock units, performance units and performance shares to our employees, directors and consultants and our parent and subsidiary corporations’ employees and consultants.
Authorized Shares
The maximum aggregate number of shares issuable under the 2012 Plan is shares of our common stock, plus (i) any shares that as of the completion of this offering, have been reserved but not issued pursuant to any awards granted under our 2003 Plan and are not subject to any awards granted thereunder, and (ii) any shares subject to stock options or similar awards granted under the 2003 Plan that expire or terminate without having been exercised in full and shares issued pursuant to awards granted under the 2003 Plan that are forfeited to or repurchased by us, with the maximum number of shares to be added to the 2012 Plan from the 2003 Plan equal to shares. In addition, the number of shares available for issuance under the 2012 Plan will be annually increased on the first day of each of our fiscal years beginning with fiscal 2014, provided, that our board of directors specifically approves the increase, by an amount equal to the least of:
| • | shares; |
| • | % of the outstanding shares of our common stock as of the last day of our immediately preceding fiscal year; or |
| • | such other amount as our board of directors may determine. |
Shares issued pursuant to awards under the 2012 Plan that we repurchase or that expire, become unexercisable or are forfeited, shares that are surrendered pursuant to an exchange program, as well as shares used to pay the exercise price of an award or to satisfy the tax withholding obligations related to an award, will become available for future grant under the 2012 Plan. In addition, to the extent that an award is paid out in cash rather than shares, such cash payment will not reduce the number of shares available for issuance under the 2012 Plan. With respect to stock appreciation rights, only shares actually issued pursuant to the award cease to be available under the 2012 Plan.
Plan Administration
Our board of directors or one or more committees appointed by our board of directors will administer the 2012 Plan. It is anticipated that the compensation committee of the board of directors will administer the 2012 Plan. In the case of awards intended to qualify as “performance-based compensation” within the meaning of Code Section 162(m), the committee will consist of two or more “outside directors” within the meaning of Code Section 162(m).
Subject to the provisions of our 2012 Plan, the administrator has the power to determine the terms of awards, including the recipients, the exercise price, if any, the number of shares covering each award, the fair market value of a share of our common stock, the vesting schedule applicable to the awards, together with any vesting acceleration, the form of consideration, if any, payable upon exercise of the award, and the terms of the
121
Table of Contents
award agreement for use under the 2012 Plan. The administrator also has the authority, subject to the terms of the 2012 Plan, to amend existing awards to reduce or increase their exercise price, to allow participants the opportunity to transfer outstanding awards to a financial institution or other person or entity selected by the administrator, to institute an exchange program by which outstanding awards may be surrendered in exchange for awards that may have different exercise prices and terms, to prescribe rules and to construe and interpret the 2012 Plan and awards granted under the 2012 Plan.
Stock Options
The administrator may grant incentive and/or nonstatutory stock options under our 2012 Plan, provided that incentive stock options are only granted to employees. The exercise price of such options must equal at least the fair market value of our common stock on the date of grant. The term of an incentive stock option may not exceed 10 years; provided, however, that an incentive stock option held by a participant who owns more than 10% of the total combined voting power of all classes of our stock, or of certain of our parent or subsidiary corporations, may not have a term in excess of five years and must have an exercise price of at least 110% of the fair market value of our common stock on the grant date. The administrator will determine the methods of payment of the exercise price of an option, which may include cash, shares or other property acceptable to the administrator, as well as other types of consideration permitted by applicable law. Subject to the provisions of our 2012 Plan, the administrator determines the remaining terms of the options (e.g., vesting). After the termination of service of an employee, director or consultant, the participant may exercise his or her option, to the extent vested as of such date of termination, for the period of time stated in his or her option agreement. However, in no event may an option be exercised later than the expiration of its term.
Stock Appreciation Rights
Stock appreciation rights may be granted under our 2012 Plan. Stock appreciation rights allow the recipient to receive the appreciation in the fair market value of our common stock between the exercise date and the date of grant. Subject to the provisions of our 2012 Plan, the administrator determines the terms of stock appreciation rights, including when such rights vest and become exercisable and whether to settle such awards in cash or with shares of our common stock, or a combination thereof, except that the per share exercise price for the shares to be issued pursuant to the exercise of a stock appreciation right will be no less than 100% of the fair market value per share on the date of grant. The specific terms of any grant of stock appreciation rights will be set forth in an award agreement between us and the recipient.
Restricted Stock
Restricted stock may be granted under our 2012 Plan. Restricted stock awards are grants of shares of our common stock that are subject to various restrictions, including restrictions on transferability and forfeiture provisions. Shares of restricted stock will vest and the restrictions on such shares will lapse, in accordance with terms and conditions established by the administrator. Such terms may include, among other things, vesting upon the achievement of specific performance goals determined by the administrator and/or continued service to us. The administrator, in its sole discretion, may accelerate the time at which any restrictions will lapse or be removed. Recipients of restricted stock awards generally will have voting and dividend rights with respect to such shares upon grant without regard to vesting, unless the administrator provides otherwise. Shares of restricted stock that do not vest for any reason will be forfeited by the recipient and will revert to us. The specific terms of any grant of restricted stock will be set forth in an award agreement between us and the recipient.
Restricted Stock Units
Restricted stock units may be granted under our 2012 Plan. Each restricted stock unit granted is a bookkeeping entry representing an amount equal to the fair market value of one share of our common stock. The administrator determines the terms and conditions of restricted stock units including the vesting criteria, which
122
Table of Contents
may include achievement of specified performance criteria or continued service to us, and the form and timing of payment. The administrator, in its sole discretion, may accelerate the time at which any restrictions will lapse or be removed. The administrator determines in its sole discretion whether an award will be settled in stock, cash or a combination of both. The specific terms of any grant of restricted stock units will be set forth in an award agreement between us and the recipient.
Performance Units/Performance Shares
Performance units and performance shares may be granted under our 2012 Plan. Performance units and performance shares are awards that will result in a payment to a participant only if performance goals established by the administrator are achieved or the awards otherwise vest. The administrator will establish organizational or individual performance goals in its discretion, which, depending on the extent to which they are met, will determine the number and/or the value of performance units and performance shares to be paid out to participants. After the grant of a performance unit or performance share, the administrator, in its sole discretion, may reduce or waive any performance objectives or other vesting provisions for such performance units or performance shares. Performance units shall have an initial dollar value established by the administrator prior to the grant date. Performance shares will have an initial value equal to the fair market value of our common stock on the grant date. The administrator, in its sole discretion, may pay earned performance units or performance shares in the form of cash, in shares or in some combination thereof. The specific terms of any grant of performance units and performance shares will be set forth in an award agreement between us and the recipient.
Transferability of Awards
Unless the administrator provides otherwise, our 2012 Plan generally does not allow for the transfer of awards and only the recipient of an award may exercise such an award during his or her lifetime.
Certain Adjustments
In the event of certain changes in our capitalization, to prevent diminution or enlargement of the benefits or potential benefits available under the 2012 Plan, the administrator will make adjustments to one or more of the number and class of shares that may be delivered under the plan and/or the number, class and price of shares covered by each outstanding award and the numerical share limits contained in the 2012 Plan. In the event of our proposed liquidation or dissolution, the administrator will notify participants as soon as practicable and all awards will terminate immediately prior to the consummation of such proposed transaction.
Merger or Change of Control
Our 2012 Plan provides that in the event of a merger or change of control, as defined under the 2012 Plan, each outstanding award will be treated as the administrator determines, except that if a successor corporation or its parent or subsidiary does not assume or substitute an equivalent award for any outstanding award, then such award will fully vest, all restrictions on such award will lapse, all performance goals or other vesting criteria applicable to such award will be deemed achieved at 100% of target levels and such award will become fully exercisable, if applicable, for a specified period prior to the transaction. The award will then terminate upon the expiration of the specified period of time. If the service of an outside director is terminated on or following a change of control, other than pursuant to a voluntary resignation, his or her awards will become fully vested and exercisable, and all performance goals or other vesting requirements will be deemed achieved at 100% of target levels.
Plan Amendment, Termination
Our board of directors has the authority to amend, suspend or terminate the 2012 Plan provided such action does not impair the existing rights of any participant. Our 2012 Plan will automatically terminate in 2022, unless we terminate it sooner.
123
Table of Contents
2003 Stock Plan, as amended
Our board of directors and stockholders approved our 2003 Plan, as amended through February 14, 2012. The following is a discussion of the 2003 Plan as so amended, and is qualified in its entirety by the text of the 2003 Plan. The 2003 Plan provides for the grant of incentive stock options, within the meaning of Section 422 of the Code, to our employees and any of our parent or subsidiary’s employees, and for the grant of nonstatutory stock options and restricted stock awards to our employees, directors and consultants and any of our parent or subsidiary’s employees and consultants. As of the effective date of this offering, the 2003 Plan will be terminated and we will not grant any additional awards under the 2003 Plan. However, the 2003 Plan will continue to govern the terms and conditions of outstanding awards granted thereunder.
Authorized Shares
We have reserved a total of shares of our common stock for issuance pursuant to the 2003 Plan. As of , 2012, there were options to purchase shares of common stock outstanding, shares of restricted stock outstanding and shares were available for future grant under the 2003 Plan. Shares subject to options or restricted stock that expire or are cancelled will become available for future grant under the 2003 Plan, or, following this offering, under the 2012 Plan. Shares under the 2003 Plan are authorized but unissued shares or treasury shares.
Administration
The 2003 Plan is administered by one or more committees. Each committee shall consist of one or more members of the board of directors who have been appointed by the board of directors. Each committee shall have such authority and be responsible for such functions as the board of directors has assigned to it. If no committee has been appointed, the board of directors shall administer the 2003 Plan. Subject to the provisions of the 2003 Plan, the board of directors shall have full authority and discretion to take any actions it deems necessary or advisable for the administration of the 2003 Plan, including, subject to the terms of the 2003 Plan, to institute a program (with the terms and conditions of such program to be determined in the sole discretion of the board of directors (or a committee of the board of directors, as applicable)) under which (i) outstanding options and/or restricted stock are surrendered or cancelled in exchange for awards of the same type (which may have higher or lower exercise prices and different terms), different type, and/or cash, (ii) participants would have the opportunity to transfer outstanding options and restricted stock to a financial institution or other person or entity selected by the board of directors (or a committee of the board of directors, as applicable), and/or (iii) the exercise price of an outstanding award is increased or reduced. All decisions, interpretations and other actions of the board of directors shall be final and binding on all participants and all persons deriving their rights from a participant.
Eligibility
Only employees, outside directors and consultants shall be eligible for the grant of nonstatutory options or the direct award or sale of shares. Only employees shall be eligible for the grant of incentive stock options, or ISOs.
Stock Options
The 2003 Plan permits the grant of incentive and/or nonstatutory stock options. Each grant of an option under the 2003 Plan shall be evidenced by a stock option agreement between the optionee and E2open. The option shall be subject to all applicable terms and conditions of the 2003 Plan and may be subject to any other terms and conditions which are not inconsistent with the 2003 Plan and which the board of directors deems appropriate for inclusion in a stock option agreement. The provisions of the various stock option agreements entered into under the 2003 Plan need not be identical.
124
Table of Contents
Each stock option agreement shall specify the number of shares that are subject to the option and shall provide for the adjustment of such number in accordance with Section 8 of the 2003 Plan. The stock option agreement shall also specify whether the option is an ISO or a nonstatutory option.
Each stock option agreement shall specify the exercise price. The exercise price of an ISO shall not be less than 100% of the fair market value of a share on the date of grant (and not less than 110% of the fair market value of a share on the date of grant for any incentive stock option granted to a person who at the time of grant owns stock possessing more than 10% of the total combined voting power of all classes of stock of the company or any parent or subsidiary of the company). The exercise price of a nonstatutory option shall not be less than 100% of the fair market value of a share on the date of grant. Subject to the preceding two sentences, the exercise price under any option shall be determined by the board of directors at its sole discretion.
Each stock option agreement shall specify the date when all or any installment of the option is to become exercisable. The stock option agreement shall specify the term of the option. The term shall not exceed 10 years from the date of grant.
Effects of Termination of Service with E2open
If an optionee’s service terminates for any reason other than the optionee’s death, then the optionee’s options shall expire on the earliest of the following: (i) the expiration date determined pursuant to the 2003 Plan; (ii) the date three months after the termination of the optionee’s service for any reason other than disability, or such later date as the board of directors may determine; or (iii) the date six months after the termination of the optionee’s service by reason of disability, or such later date as the board of directors may determine.
The optionee may exercise all or part of the optionee’s options at any time before the expiration of such options under the preceding sentence, but only to the extent that such options had become exercisable before the optionee’s service terminated (or became exercisable as a result of the termination) and the underlying shares had vested before the optionee’s service terminated (or vested as a result of the termination). The balance of such options shall lapse when the optionee’s service terminates.
If an optionee dies while the optionee is providing services to E2open, then the optionee’s options shall expire on the earlier of the following: (i) the expiration date determined pursuant to the 2003 Plan or (ii) the date 12 months after the optionee’s death, or such later date as the board of directors may determine.
Any shares issued upon exercise of an option may be subject to special forfeiture conditions, rights of repurchase, rights of first refusal and other transfer restrictions as the board of directors may determine. Such restrictions shall be set forth in the applicable stock option agreement and shall apply in addition to any restrictions that may apply to holders of our shares generally.
Payment for Shares
The entire purchase price or exercise price of shares issued under the 2003 Plan shall be payable in cash or cash equivalents at the time when such shares are purchased.
Restricted Stock
Restricted stock awards are grants of rights to purchase our common stock that are subject to various restrictions, including restrictions on transferability and forfeiture provisions. Restricted stock awards are evidenced by a restricted stock agreement, which will include the terms, conditions and restrictions related to the offer of restricted stock, including the number of shares that the participant may purchase, the price to be paid, and a provision stating that the offer will expire automatically if not exercised within 30 days after the grant is communicated to the participant.
125
Table of Contents
Transferability of Awards
Our 2003 Plan generally does not allow for the transfer of options or restricted stock other than by beneficiary designation or by will or the laws of descent and distribution, unless the plan administrator determines.
Certain Adjustments
In the event of certain changes in our capitalization, the number of shares and exercise or purchase price of shares subject to outstanding awards, as well as the number of shares reserved under the 2003 Plan will be adjusted in order to prevent the dilution or enlargement of any benefits or potential benefits to be granted under the 2003 Plan.
Merger or Consolidation
In the event that we become party to a merger or consolidation, outstanding options will be subject to the agreement of merger or consolidation, which will provide for one or more of the following: (i) continuation of outstanding options if E2open is the surviving corporation; (ii) assumption or substitution for a new option by the surviving corporation or its parent; (iii) full acceleration with respect to any unvested shares subject to outstanding options, followed by cancellation of such options; or (iv) cancellation and payment with respect to each cancelled option (regardless of whether such shares are vested or unvested) in an amount equal to the excess of the fair market value of the shares as of the completion of the merger or consolidation, over the option’s exercise price. Such payments may be subject to continued vesting at a rate not less favorable than the original terms of the option.
Duration and Amendments
The 2003 Plan shall terminate automatically 10 years after the later of (i) its adoption by the board of directors or (ii) the most recent increase in the number of shares reserved that was approved by the Company’s stockholders. The 2003 Plan may be terminated on any earlier date pursuant to the terms below.
The board of directors may amend, suspend or terminate the 2003 Plan at any time and for any reason; provided, however, that any amendment of the 2003 Plan shall be subject to the approval of the Company’s stockholders if it (i) increases the number of shares available for issuance under the 2003 Plan or (ii) materially changes the class of persons who are eligible for the grant of ISOs. Stockholder approval shall not be required for any other amendment of the 2003 Plan.
Retirement Plans
We maintain a 401(k) retirement plan which is intended to be a tax qualified defined contribution plan under Section 401(k) of the Code. All of our U.S. employees are eligible to participate on the first day of the month following their date of hire. The 401(k) plan includes a salary deferral arrangement pursuant to which participants may elect to reduce their current compensation up to the statutorily prescribed limit, equal to $16,500 in 2011 (catch up contribution for employees over 50 allow for an additional $5,500), and have the amount of their compensation reduction contributed to the 401(k) plan.
126
Table of Contents
Limitation on Liability and Indemnification Matters
Our amended and restated certificate of incorporation and bylaws that will become effective upon the completion of this offering contain provisions that limit the personal liability of our directors for monetary damages to the fullest extent permitted by Delaware law. Consequently, our directors will not be personally liable to us or our stockholders for monetary damages for any breach of fiduciary duties as directors, except liability for:
| • | any breach of the director’s duty of loyalty to us or our stockholders; |
| • | any act or omission not in good faith or that involves intentional misconduct or a knowing violation of law; |
| • | unlawful payments of dividends or unlawful stock repurchases or redemptions as provided in Section 174 of the Delaware General Corporation Law; or |
| • | any transaction from which the director derived an improper personal benefit. |
Our amended and restated certificate of incorporation and bylaws, each of which will become effective upon the completion of this offering, provide that we indemnify our directors and officers to the fullest extent permitted by Delaware law. Our amended and restated bylaws, that will become effective upon the completion of this offering, also provide that we shall advance expenses incurred by a director or officer in advance of the final disposition of any action or proceeding, and permit us to secure insurance on behalf of any officer, director, employee or other agent for any liability arising out of his or her actions in that capacity, regardless of whether we would otherwise be permitted to indemnify him or her under the provisions of Delaware law. We have entered and expect to continue to enter into agreements to indemnify our directors, executive officers and other employees as determined by the board of directors. With certain exceptions, these agreements provide for indemnification for related expenses including, among others, attorneys’ fees, judgments, fines and settlement amounts incurred by any of these individuals in any action or proceeding. We believe that these bylaw provisions and indemnification agreements are necessary to attract and retain qualified persons as directors and officers. We also maintain directors’ and officers’ liability insurance.
The limitation of liability and indemnification provisions in our amended and restated certificate of incorporation and bylaws, that will become effective upon the completion of this offering, may discourage stockholders from bringing a lawsuit against our directors for breach of their fiduciary duty of care. They may also reduce the likelihood of derivative litigation against our directors and officers, even though an action, if successful, might benefit us and other stockholders. Further, a stockholder’s investment may be adversely affected to the extent that we pay the costs of settlement and damage awards against directors and officers. At present, there is no pending litigation or proceeding involving any of our directors, officers or employees for which indemnification is sought, and we are not aware of any threatened litigation that may result in claims for indemnification.
127
Table of Contents
CERTAIN RELATIONSHIPS AND RELATED PARTY TRANSACTIONS
In addition to the director and executive compensation arrangements discussed above in “Management” and “Executive Compensation,” we have been a party to the following transactions since March 1, 2008, in which the amount involved exceeded or will exceed $120,000, and in which any director, executive officer or holder of more than 5% of any class of our voting stock, or any member of the immediate family of or entities affiliated with any of them, had or will have a material interest. We also describe below certain transactions and series of similar transactions since March 1, 2008 with our directors, executive officers, holders of more than 5% of any class of our voting securities, or any member of the immediate family of or any entities affiliated with any of the foregoing persons to which we are party.
Sales of Series D Preferred Stock
In May 2009, we issued and sold an aggregate of 163,474,270 shares of our Series D preferred stock at a per share price of $0.10, for an aggregate consideration of approximately $16.3 million, including the conversion of convertible promissory notes (as discussed below). We believe that the terms obtained and consideration received in connection with the Series D financing are comparable to terms available and the amounts we would have received in an arm’s length transaction.
The table below summarizes purchases of shares of our Series D preferred stock by our directors, executive officers, holders of more than 5% of any class of our voting securities, or any member of the immediate family of or any entities affiliated with any of the foregoing persons. Each outstanding share of our Series D preferred stock will be converted into one share of our common stock upon the completion of this offering.
| Purchasers |
Shares of Series D Preferred Stock |
Aggregate Purchase Price |
Aggregate Amount of Promissory Notes Converted |
|||||||||
| Seagate Technology LLC (1) |
25,170,227 | $ | 2,517,023 | $ | 1,648,519 | |||||||
| Entities affiliated with Crosspoint Venture Partners (2) |
9,965,973 | 996,597 | 596,597 | |||||||||
| Entities affiliated with Invesco Private Capital (3) |
15,285,430 | 1,528,543 | 778,543 | |||||||||
| Entities affiliated with JK&B Capital Group (4) |
14,298,044 | 1,429,805 | 936,448 | |||||||||
| B&M Ventures, LLC (5) |
42,196,317 | 4,219,632 | 2,773,831 | |||||||||
| JBM 2009 Irrevocable Trust dtd 09/30/09 (6) |
40,000,000 | 4,000,000 | 2,629,453 | |||||||||
|
|
|
|
|
|
|
|||||||
| Total |
146,915,991 | $ | 14,691,600 | $ | 9,363,391 | |||||||
|
|
|
|
|
|
|
|||||||
| (1) | Consists of 25,170,227 shares held by Seagate Technology LLC, a wholly owned subsidiary of Seagate Technology Public Company Limited. |
| (2) | Consists of 8,937,851 shares held by Crosspoint Venture Partners 2000 (Q), L.P. and 1,028,122 shares held by Crosspoint Venture Partners 2000, L.P. John B. Mumford, a member of our board of directors, is a Managing General Partner at Crosspoint Associates, L.L.C., which is the general partner of Crosspoint Venture Partners 2000 (Q) and Crosspoint Venture Partners 2000, L.P. |
| (3) | Consists of 9,143,344 shares held by Chancellor V, L.P., 4,713,588 shares held by Chancellor V-A, L.P. and 1,428,498 shares held by Citiventure 2000, L.P., (collectively referred to as the “Invesco Capital Entities”). Johnston L. Evans, a member of our board of directors, is the Head of Invesco Capital, Inc. and a member of the investment committee of IPC Direct Associates V, LLC. IPC Direct Associates V, LLC is the general partner of each of the Invesco Capital Entities and its managing member is Invesco Private Capital, Inc. |
| (4) | Consists of 13,154,829 shares held by JK&B Capital IV, L.P. and 1,143,215 shares held by JK&B Capital IV QIP, L.P. |
| (5) | Consists of 42,196,317 shares held by B&M Ventures, LLC. John Mumford, a member of our board of directors, is the sole Managing Member of B&M Ventures, LLC. |
| (6) | Consists of 40,000,000 shares held by JBM 2009 Irrevocable Trust dtd 09/30/09. John Mumford, an affiliate of JBM 2009 Irrevocable Trust dtd 09/30/09, is a member of our board of directors. |
128
Table of Contents
Convertible Notes
On February 29, 2008, we issued a subordinated unsecured convertible note to an existing stockholder in the principal amount of $10,000,000. The note accrued interest at a rate of 6% per annum. In June 2008, we issued 31,866,438 shares of Series CC preferred stock upon conversion of the note. The table below sets forth the aggregate principal amount of, and accrued interest on, the note held by our directors, executive officers, holders of more than 5% of any class of our voting securities, or any member of the immediate family of or any entities affiliated with any of the foregoing persons at the time of conversion into shares of Series CC preferred stock:
| Purchaser |
Aggregate Principal Amount |
Accrued Interest |
||||||
| B&M Ventures, LLC (1) |
$ | 10,000,000 | $ | 197,261 | ||||
|
|
|
|
|
|||||
| (1) | Consists of a subordinated unsecured convertible note in the aggregate principal amount of $10,000,000 held by B&M Ventures, LLC. John Mumford, a member of our board of directors, is the sole Managing Member of B&M Ventures, LLC. |
In September and December 2008, and January 2009, we issued subordinated unsecured convertible promissory notes to existing stockholders and employees in an aggregate principal amount of $9,914,590. The notes accrued interest at a rate of 6% per annum. On May 29, 2009, we issued an aggregate of 163,474,270 shares of Series D preferred stock and the proceeds were a combination of cash and conversion of the notes (as discussed above). The table below sets forth the aggregate principal amount of, and accrued interest on, the notes held by our directors, executive officers, holders of more than 5% of any class of our voting securities, or any member of the immediate family of or any entities affiliated with any of the foregoing persons at the time of conversion into shares of Series D preferred stock:
| Purchasers |
Aggregate Principal Amount |
Accrued Interest |
||||||
| Seagate Technology LLC (1) |
$ | 1,602,422 | $ | 46,097 | ||||
| B&M Ventures, LLC (2) |
2,667,557 | 106,274 | ||||||
| JBM 2009 Irrevocable Trust dtd 09/30/09 (3) |
2,528,711 | 100,742 | ||||||
| Entities affiliated with Invesco Private Capital (4) |
756,773 | 21,770 | ||||||
| Entities affiliated with JK&B Capital Group (5) |
910,262 | 26,186 | ||||||
| Entities affiliated with Crosspoint Venture Partners 2000 (6) |
584,868 | 11,729 | ||||||
|
|
|
|
|
|||||
| Total |
$ | 9,050,593 | $ | 312,798 | ||||
|
|
|
|
|
|||||
| (1) | Consists of a promissory note in the aggregate principal amount of $1,602,422 held by Seagate Technology LLC, a wholly owned subsidiary of Seagate Technology Public Company Limited. |
| (2) | Consists of a promissory note in the aggregate principal amount of $2,667,557 held by B&M Ventures, LLC. John Mumford, a member of our board of directors, is the sole Managing Member of B&M Ventures, LLC. |
| (3) | Consists of a promissory note in the aggregate principal amount of $2,528,711 held by JBM 2009 Irrevocable Trust dtd 09/30/09 and $100,000 held by John Mumford. John Mumford, an affiliate of JBM 2009 Irrevocable Trust dtd 09/30/09, is a member of our board of directors. |
| (4) | Consists of a promissory note in the aggregate principal amount of $452,682 held by Chancellor V, L.P., $233,237 held by Chancellor V-A, L.P. and $70,724 held by Citiventure 2000, L.P. Johnston L. Evans, a member of our board of directors, is the Head of Invesco Capital, Inc. and a member of the investment committee of IPC Direct Associates V, LLC. IPC Direct Associates V, LLC is the general partner of each of the Invesco Capital Entities and its managing member is Invesco Private Capital, Inc. |
| (5) | Consists of promissory notes in the aggregate principal amounts of $837,481 held by JK&B Capital IV, L.P. and $72,781 held by JK&B Capital IV QIP, L.P. |
129
Table of Contents
| (6) | Consists of a promissory notes in the aggregate principal amounts of $524,338 held by Crosspoint Venture Partners 2000 (Q), L.P. and $ 60,530 held by Crosspoint Venture Partners 2000, L.P. John B. Mumford, a member of our board of directors, is a Managing General Partner at Crosspoint Associates, L.L.C., which is the general partner of Crosspoint Venture Partners 2000 (Q) and Crosspoint Venture Partners 2000, L.P. |
Transactions with Our Executive Officers and Directors and Entities Affiliated with Our Executive Officers and Directors
One of our directors, Patrick J. O’Malley, III, is the Chief Financial Officer of Seagate Technology Public Company Limited, or Seagate PLC. Seagate PLC is one of our customers and we have received payments in excess of $120,000 from Seagate PLC relating to subscriptions to our solutions. We have received payments of $1,904,573, $1,760,568 and $1,359,235 for fiscal 2009, 2010 and 2011, respectively, and $2,308,645 for the nine months ended November 30, 2011 from Seagate PLC.
Registration Rights Agreement
Certain holders of our capital stock are entitled to registration rights with respect to the common stock issued or issuable upon conversion of the preferred stock other than with respect to the Series D preferred stock. See “Description of Capital Stock—Registration Rights” for more information.
Second Amended and Restated Stockholders Agreement
We have entered into a Second Amended and Restated Stockholders Agreement, or the Stockholders Agreement, with certain of our stockholders, including entities with which certain of our directors are affiliated, and certain other stockholders. The parties to the Stockholders Agreement have agreed, subject to certain conditions, to vote their shares so as to elect as directors the nominees designated by certain of our investors, including one nominee designated by Invesco Private Capital, Inc. and its affiliated funds, or Invesco, and three nominees designated by stockholders holding Series AA Preferred Stock, including one nominee designated by Crosspoint Venture Partners 2000, L.P. and Crosspoint Venture Partners 2000 (Q), L.P., or together Crosspoint, so long as Crosspoint owns the most shares of any holder of the Series AA preferred stock, Series BB preferred stock and Series CC preferred stock, in the aggregate. Invesco has designated Mr. Evans for election to our board of directors and stockholders holding Series AA preferred stock have designated Messrs. Mumford (Crosspoint’s designee), Bass and O’Malley for election to our board of directors. In addition, the parties to the Stockholders Agreement have agreed to vote their shares so as to elect our then current chief executive officer to our board of directors, who presently is Mr. Woodward. The Stockholders Agreement also provides certain holders of our capital stock a right of purchase and of co-sale in respect of the sale of securities by certain holders of our capital stock, as well as certain rights of purchase in respect of certain issuances of our securities. Upon the closing of this offering, the Stockholders Agreement will terminate in its entirety and all rights and obligations under the Stockholders Agreement will terminate.
Employment Agreements
We have entered into agreements containing compensation, termination and change of control provisions, among others, with certain of our executive officers as described under the caption “Executive Compensation—Employment Agreements and Change of Control Arrangements” above.
Indemnification of Officers and Directors
We have also entered into indemnification agreements with each of our directors and executive officers. The indemnification agreements and our certificate of incorporation and bylaws require us to indemnify our directors and executive officers to the fullest extent permitted by Delaware law. See “Executive Compensation—Limitations on Liability and Indemnification Matters” above.
130
Table of Contents
Policies and Procedures for Related Party Transactions
We have adopted a written policy, effective upon the completion of this offering, which provides that our executive officers, directors, holders of more than 5% of any class of our voting securities, and any member of the immediate family of and any entity affiliated with any of the foregoing persons, are not permitted to enter into a related party transaction with us without the prior consent of our audit committee, or other independent members of our board of directors in the case it is inappropriate for our audit committee to review such transaction due to a conflict of interest. Pursuant to such policy, any request for us to enter into a transaction with an executive officer, director, principal stockholder, or any of their immediate family members or affiliates, in which the amount involved exceeds $120,000 must first be presented to our audit committee for review, consideration and approval. In approving or rejecting any such proposal, our audit committee is to consider the relevant facts and circumstances available and deemed relevant to the audit committee, including, but not limited to, whether the transaction is on terms no less favorable than terms generally available to an unaffiliated third party under the same or similar circumstances and the extent of the related party’s interest in the transaction. All of the transactions described above were entered into prior to the adoption of this policy.
131
Table of Contents
PRINCIPAL AND SELLING STOCKHOLDERS
The following table sets forth information regarding beneficial ownership of our common stock as of November 30, 2011 and as adjusted to reflect the shares of common stock to be issued and sold in the offering assuming no exercise of the underwriters’ over-allotment option, by:
| • | each person or group of affiliated persons known by us to be the beneficial owner of more than 5% of our common stock; |
| • | each of our named executive officers; |
| • | each of our directors; |
| • | all executive officers and directors as a group; and |
| • | all selling stockholders. |
We have determined beneficial ownership in accordance with SEC rules. The information does not necessarily indicate beneficial ownership for any other purpose. Under these rules, the number of shares of common stock deemed outstanding includes shares issuable upon exercise of options and warrants held by the respective person or group which may be exercised or converted within 60 days after November 30, 2011. For purposes of calculating each person’s or group’s percentage ownership, stock options and warrants exercisable within 60 days after November 30, 2011 are included for that person or group but not the stock options or warrants of any other person or group. Certain options to purchase shares of our common stock included in the table below are early exercisable, and to the extent such shares are unvested as of a given date, such shares will remain subject to a right of repurchase held by us.
Applicable percentage ownership is based on 733,124,343 shares of common stock outstanding as of November 30, 2011, assuming the conversion of all outstanding shares of our preferred stock on a one-for-one basis into shares of our common stock, except that outstanding shares of Series BB preferred stock and Series CC preferred stock will convert into shares of our common stock at a conversion rate equal to 1:1.185. Our total outstanding preferred stock will convert into 517,002,101 shares of our common stock. For purposes of the table below, we have assumed that shares of common stock will be outstanding upon completion of this offering, based upon an assumed initial public offering price of $ per share.
132
Table of Contents
Unless otherwise indicated and subject to applicable community property laws, to our knowledge, each stockholder named in the following table possesses sole voting and investment power over the shares listed. Unless otherwise noted below, the address of each person listed on the table is c/o E2open, Inc., 4100 East Third Avenue, Suite 400, Foster City, CA 94404.
| Shares Beneficially Owned Prior to the Offering |
Number
of Shares Offered |
Shares Beneficially Owned After the Offering | ||||||||||||
| Name and Address of Beneficial Owner |
Shares | Percentage | Shares | Percentage | ||||||||||
| 5% Stockholders: |
||||||||||||||
| Entities affiliated with Crosspoint Venture Partners (1) |
146,880,081 | 20.0 | ||||||||||||
| JBM 2009 Irrevocable Trust dtd 09/30/09 (2) |
134,206,430 | 18.3 | ||||||||||||
| Seagate Technology LLC (3) |
91,546,179 | 12.5 | ||||||||||||
| Entities affiliated with JK&B Capital Group (4) |
51,638,819 | 7.0 | ||||||||||||
| Entities affiliated with Invesco Private Capital, Inc. (5) |
46,881,180 | 6.4 | ||||||||||||
| B&M Ventures, LLC (6) |
42,196,317 | 5.8 | ||||||||||||
| Named Executive Officers and Directors: |
||||||||||||||
| Mark E. Woodward (7) |
34,508,166 | 4.7 | ||||||||||||
| Peter J. Maloney (8) |
8,957,832 | 1.2 | ||||||||||||
| David Hale (9) |
3,239,722 | * | ||||||||||||
| David Packer (10) |
7,709,437 | 1.0 | ||||||||||||
| Robert Schoenthaler (11) |
2,358,333 | * | ||||||||||||
| John B. Mumford (12) |
189,076,398 | 25.7 | ||||||||||||
| Carl Bass (13) |
1,690,000 | * | ||||||||||||
| Johnston L. Evans (14) |
46,881,180 | 6.4 | ||||||||||||
| Bernard F. Mathaisel (15) |
1,657,000 | * | ||||||||||||
| Nicholas G. Moore (16) |
2,420,000 | * | ||||||||||||
| Patrick J. O’Malley, III (17) |
1,690,000 | * | ||||||||||||
| Steven M. Ward, Jr. (18) |
3,840,000 | * | ||||||||||||
| All executive officers and directors as a group (14) persons) (19) |
311,257,602 | 40.9 | ||||||||||||
| Other Selling Stockholders: |
||||||||||||||
| (*) | Represents beneficial ownership of less than 1%. |
| (1) | Consists of (i) 128,884,538 shares held of record by Crosspoint Venture Partners 2000 (Q), L.P. (“CVP 2000 (Q)”); (ii) 14,782,951 shares held of record by Crosspoint Venture Partners 2000, L.P. (“CVP 2000”); (iii) warrants to purchase 2,326,408 shares exercisable within 60 days of November 30, 2011 held of record by CVP 2000 (Q); (iv) warrants to purchase 266,184 shares exercisable within 60 days of November 30, 2011 held of record by CVP 2000; (v) options to purchase 557,466 shares exercisable within 60 days of November 30, 2011 held of record by CVP 2000 (Q), of which 368,466 are vested; and (vi) options to purchase 62,534 shares exercisable within 60 days of November 30, 2011 held of record by CVP 2000, of which 41,534 are vested. Crosspoint Associates 2000, L.L.C. (“Crosspoint Associates”) is the general partner of CVP 2000 (Q) and CVP 2000. John B. Mumford, one of our directors, is a Managing General Partner of Crosspoint Associates and has sole voting and dispositive power of the shares held by CVP 2000 (Q) and CVP 2000. The address for these entities is 2925 Woodside Road, Woodside, California 94062. |
| (2) | All shares are held of record by The JBM 2009 Irrevocable Trust dtd 09/30/09 (the “JBM Trust”). Roy A. Brizio serves as the trustee of the JBM Trust and has sole voting and dispositive power of the shares held the JBM Trust. The address for the JBM Trust is 130 Ramoso Road, Portola Valley, California 94028. |
133
Table of Contents
| (3) | All shares are held of record by Seagate Technology LLC, a wholly owned subsidiary of Seagate Technology Public Company Limited. The address for Seagate Technology LLC is 10200 South DeAnza Boulevard, Cupertino, California 95014. |
| (4) | Consists of (i) 47,509,982 shares held of record by JK&B Capital IV, L.P. (“JK&B”); and (ii) 4,128,837 shares held of record by JK&B Capital IV QIP, L.P. (“JK&B QIP”). JK&B Management IV, L.P., (“JK&B Management”), the general partner of JK&B and JK&B QIP, may be deemed to have sole voting and dispositive power with respect to the shares held of record by JK&B and JK&B QIP. JK&B Capital IV, L.L.C. (“JK&B Capital”) is the general partner of JK&B Management. David Kronfeld, as the managing member of JK&B Capital, may be deemed to have sole voting and dispositive power with respect to the shares held by these entities. The address for these entities is c/o JK&B Capital, Two Prudential Plaza, 180 N. Stetson Avenue, Suite 4500, Chicago, Illinois 60601. |
| (5) | Consists of (i) 27,713,252 shares held of record by Chancellor V, L.P. (“Chancellor V”); (ii) 14,286,778 shares held of record by Chancellor V-A, L.P. (“Chancellor V-A”); (iii) 4,329,750 shares held of record by Citiventure 2000, L.P. (“Citiventure”); (iv) options to purchase 329,833 shares exercisable within 60 days of November 30, 2011 held of record by Chancellor V, of which 204,216 are vested; (v) options to purchase 170,036 shares exercisable within 60 days of November 30, 2011 held of record by Chancellor V-A, of which 105,278 are vested; and (vi) options to purchase 51,531 shares exercisable within 60 days of November 30, 2011 held of record by Citiventure, of which 31,905 are vested. Invesco Private Capital, Inc. is the managing member of IPC Direct Associates V, LLC, which is the general partner of each of the Invesco Capital Entities. Johnston L. Evans, one of our directors, is the Head of Invesco Private Capital, Inc. and a member of the investment committee of IPC Direct Associates V, LLC. Accordingly, Mr. Evans may be deemed to share voting and dispositive power of the shares held by the Invesco Capital Entities. The address for these entities is c/o Invesco Private Capital, Inc., 1166 Avenue of the Americas, 25th Floor, New York, New York 10036. |
| (6) | All shares are held of record by B&M Ventures, LLC (“B&M”). John B. Mumford, one of our directors, is the sole Managing Member of B&M and has sole voting and dispositive power o the shares held by B&M. The address for this entity is 505 Railroad Avenue, South San Francisco, California 94080. |
| (7) | Consists of (i) 2,150,000 shares held of record by Mr. Woodward, all of which are subject to a repurchase option we hold as of November 30, 2011; (ii) 22,579,000 shares held by the Mark E. Woodward and Laurie S. Woodward Family Trust dtd July 17, 1999 for which Mr. Woodward serves as a trustee, 2,609,230 of which are subject to a repurchase option we hold as of November 30, 2011; (iii) 2,600,000 shares held by the Alec Woodward 2010 Irrevocable Trust under Agreement dtd May 22, 2010 for which Mr. Woodward serves as the trustee; (iv) 2,600,000 shares held by the Hayley Woodward 2010 Irrevocable Trust under Agreement dtd May 22, 2010 for which Mr. Woodward serves as the trustee; (v) 2,600,000 shares held by the Ryan Woodward 2010 Irrevocable Trust under Agreement dtd May 22, 2010, which Mr. Woodward serves as the trustee; and (iv) options to purchase 1,979,166 shares exercisable within 60 days of November 30, 2011, all of which are vested. |
| (8) | Consists of (i) 4,959,312 shares held of record by Mr. Maloney and (ii) options to purchase 3,998,520 shares exercisable within 60 days of November 30, 2011, of which 3,044,353 are vested. |
| (9) | Consists of (i) 350,000 shares held of record by Mr. Hale; (ii) 1,000,000 shares held of record by The David P. Hale and Laura A. Torres Trust U/A/D 4/1/1999 for which Mr. Hale serves as a trustee; and (iii) options to purchase 1,889,722 shares exercisable within 60 days of November 30, 2011, all of which are vested. |
| (10) | Consists of (i) 2,000,000 shares held of record by Mr. Packer and (ii) options to purchase 5,709,437 shares exercisable within 60 days of November 30, 2011, of which 4,735,937 are vested. |
| (11) | Consists of (i) 400,000 shares held of record by Mr. Schoenthaler; (ii) 848,958 shares held of record by the Trust of Robert and Lauren Schoenthaler dtd August 15, 2011 for which Mr. Schoenthaler serves as a trustee; and (ii) options to purchase 1,114,583 shares exercisable within 60 days of November 30, 2011, of which 848,958 are vested. |
| (12) | Consists of (i) 146,880,081 shares, warrants to purchase shares exercisable within 60 days of November 30, 2011 and options to purchase shares exercisable within 60 days of November 30, 2011 held of record by CVP 2000 (Q) and CVP 2000 as disclosed in footnote (1) above; and (ii) 42,196,317 shares held of record |
134
Table of Contents
| by B&M as disclosed in footnote (6) above. Mr. Mumford has sole voting and dispositive power of the shares held by CVP 2000 (Q), CVP 2000 and B&M. |
| (13) | Consists of options to purchase 1,690,000 shares exercisable within 60 days of November 30, 2011, none of which are vested. |
| (14) | Consists of the shares held of record by Chancellor V, Chancellor V-A and Citiventure as disclosed in footnote (5) above. Mr. Evans is the Head of Invesco Private Capital, Inc. and a member of the investment committee of IPC Direct Associates V, LLC. Accordingly, Mr. Evans may be deemed to share voting and dispositive power of the shares held by the Invesco Capital Entities. |
| (15) | Consists of options to purchase 1,657,500 shares exercisable within 60 days of November 30, 2011, of which 697,500 are vested. |
| (16) | Consists of (i) 1,000,000 shares held of record by Moore Family Ventures, L.P. for which Mr. Moore serves as a general partner; and (ii) options to purchase 1,420,000 shares exercisable within 60 days of November 30, 2011, of which 460,000 are vested. |
| (17) | Consists of options to purchase 1,690,000 shares exercisable within 60 days of November 30, 2011, none of which are vested. |
| (18) | Consists of (i) 2,500,000 shares held of record by Mr. Ward, of which 281,250 are subject to a repurchase option we hold as of November 30, 2011; and (ii) options to purchase 1,340,000 shares exercisable within 60 days of November 30, 2011, of which 420,000 are vested. |
| (19) | Consists of (i) 283,919,766 shares beneficially owned by our current executive officers and directors, of which 5,040,480 are subject to a repurchase right we hold as of November 30, 2011; (ii) warrants to purchase 2,592,592 shares exercisable within 60 days of November 30, 2011; and (iii) options to purchase 24,745,244 shares exercisable within 60 days of November 30, 2011, of which 14,022,729 are vested. |
135
Table of Contents
General
The following is a summary of the rights of our common stock and preferred stock and of certain provisions of our amended and restated certificate of incorporation and bylaws, as they will be in effect upon the completion of this offering. For more detailed information, please see our amended and restated certificate of incorporation and bylaws, which are filed as exhibits to the registration statement of which this prospectus is part.
| • | Immediately following the completion of this offering, our authorized capital stock will consist of shares, all with a par value of $0.001 per share, of which: |
| • | shares are designated as common stock; and |
| • | shares are designated as preferred stock. |
As of November 30, 2011, we had outstanding 733,124,343 shares of common stock held of record by 338 stockholders, assuming the conversion of all outstanding shares of our preferred stock on a one-for-one basis into 517,002,101 shares of common stock, except that the outstanding shares of Series BB Preferred Stock and Series CC Preferred Stock will convert into shares of our common stock at a conversion rate equal to 1.185. Pursuant to the terms of our amended and restated certificate of incorporation, our preferred stock will automatically convert into common stock effective upon the closing of this offering. In addition, as of November 30, 2011, 98,566,958 shares of our common stock were subject to outstanding options and 6,620,369 shares of our common stock were issuable upon the exercise of outstanding warrants to purchase Series BB preferred stock.
Common Stock
The holders of our common stock are entitled to one vote per share on all matters to be voted on by our stockholders. Subject to preferences that may be applicable to any outstanding shares of preferred stock, holders of common stock are entitled to receive ratably such dividends as may be declared by our board of directors out of funds legally available for that purpose. In the event of our liquidation, dissolution or winding up, the holders of common stock are entitled to share ratably in all assets remaining after the payment of liabilities, subject to the prior distribution rights of preferred stock then outstanding. Holders of common stock have no preemptive, conversion or subscription rights. There are no redemption or sinking fund provisions applicable to the common stock.
Preferred Stock
Upon the closing of this offering, all currently outstanding shares of preferred stock will convert into shares of our common stock on a one-for-one basis, except that the outstanding shares of Series BB preferred stock and Series CC preferred stock will convert into shares of our common stock at a conversion rate equal to 1.185, and there will be no shares of preferred stock outstanding.
Though we currently have no plans to issue any shares of preferred stock, upon the closing of this offering and the filing of our amended and restated certificate of incorporation, our board of directors will have the authority, without further action by our stockholders, to designate and issue up to shares of preferred stock in one or more series. Our board of directors may also designate the rights, preferences and privileges of the holders of each such series of preferred stock, any or all of which may be greater than or senior to those granted to the holders of common stock. Though the actual effect of any such issuance on the rights of the holders of common stock will not be known until such time as our board of directors determines the specific rights of the holders of preferred stock, the potential effects of such an issuance include:
| • | diluting the voting power of the holders of common stock; |
136
Table of Contents
| • | reducing the likelihood that holders of common stock will receive dividend payments; |
| • | reducing the likelihood that holders of common stock will receive payments in the event of our liquidation, dissolution, or winding up; and |
| • | delaying, deterring or preventing a change-in-control or other corporate takeover. |
Warrants
The following table sets forth information about outstanding warrants to purchase shares of Series BB preferred stock as of November 30, 2011. Upon the completion of this offering, the warrants to purchase shares of our Series BB preferred stock will convert into warrants to purchase our common stock if not earlier exercised or terminated.
| Class of Stock |
Number of Series BB Preferred Shares |
Exercise Price per Share |
Expiration Date | |||||||||
| Series BB |
6,620,369 | $ | 0.32 | April 27, 2012 | ||||||||
Registration Rights
As of November 30, 2011, the holders of an aggregate of 320,932,465 shares of our common stock issued or issuable upon conversion of preferred stock other than the Series D preferred stock are entitled to the following rights with respect to the registration of such shares for public resale under the Securities Act of 1933, as amended, or the Securities Act, pursuant to a registration rights agreement by and among us and certain of our stockholders. We refer to these shares collectively as “registrable securities.”
The registration of shares of common stock as a result of the following rights being exercised would enable the holders to trade these shares without restriction under the Securities Act when the applicable registration statement is declared effective. Ordinarily, we will be required to pay all expenses, other than underwriting discounts and commissions, related to any registration effected pursuant to the exercise of these registration rights.
The registration rights terminate five years after completion of this offering, upon a Liquidation Event (as defined in our certificate of incorporation) or, with respect to the registration rights of an individual holder, when such holder’s registrable securities represent 1% or less of our outstanding common stock and can be sold pursuant to Rule 144 of the Securities Act.
Demand Registration Rights
If at any time after this offering the holders of at least 40% of the registrable securities then outstanding request in writing that we effect a registration that has a reasonably anticipated aggregate price to the public of at least $5,000,000, we may be required to register their shares. At most, we are obligated to effect two registrations for the holders of registrable securities in response to these demand registration rights. Depending on certain conditions, however, we may defer such registration for up to 90 days. If the holders requesting registration intend to distribute their shares by means of an underwriting, the managing underwriter of such offering will have the right to limit the number of shares to be underwritten for reasons related to the marketing of the shares.
Piggyback Registration Rights
If at any time after this offering we propose to register any shares of our securities under the Securities Act, the holders of registrable securities will be entitled to notice of the registration and to include their shares of registrable securities in the registration, subject to certain exceptions relating to employee benefit plans and
137
Table of Contents
mergers and acquisitions. If our proposed registration involves an underwriting, the managing underwriter of such offering will have the right to limit the number of shares to be underwritten, subject to certain restrictions, for reasons related to the marketing of the shares.
Form S-3 Registration Rights
If at any time after 180 days following the effective date of a registration statement pursuant to which we registered shares of our common stock under the Securities Act we become entitled under the Securities Act to register our shares on Form S-3 and the holders of at least 15% of the registrable securities then outstanding request in writing that we register their shares for public resale on Form S-3, we will be required to use our best efforts to effect such registration; provided, however, that if such registration would be seriously detrimental to us or our stockholders, we may defer the registration for up to 90 days. We are only obligated to effect up to two registrations on Form S-3 in any 12 month period.
Indemnification
We are obligated to indemnify the selling stockholders and any person who might be deemed to control them in the event of material misstatements or omissions in the registration statement or related violations of law attributable to us. Each selling stockholder is severally and not jointly, obligated to indemnify us, each underwriter, if any, each person who controls us or any underwriter within the meaning of Section 15 of the Securities Act, and each other selling stockholder in the event of material misstatements or omissions in the registration statement attributable to such stockholder. The liability of such selling stockholder shall be limited to an amount equal to the net proceeds to each such selling stockholder.
Voting Rights
Under the provisions of our amended and restated certificate of incorporation to become effective upon completion of this offering, holders of our common stock are entitled to one vote for each share of common stock held by such holder on any matter submitted to a vote at a meeting of stockholders. Our post-offering amended and restated certificate of incorporation does not provide cumulative voting rights to holders of our common stock.
Anti Takeover Effects of Delaware Law and Our Certificate of Incorporation and Bylaws
Certain provisions of Delaware law and our restated certificate of incorporation and bylaws that will become effective upon completion of this offering contain provisions that could have the effect of delaying, deferring or discouraging another party from acquiring control of us. These provisions, which are summarized below, are expected to discourage certain types of coercive takeover practices and inadequate takeover bids. These provisions are also designed in part to encourage anyone seeking to acquire control of us to first negotiate with our board of directors. We believe that the advantages gained by protecting our ability to negotiate with any unsolicited and potentially unfriendly acquirer outweigh the disadvantages of discouraging such proposals, including those priced above the then-current market value of our common stock, because, among other reasons, the negotiation of such proposals could improve their terms.
Certificate of Incorporation and Bylaws
Our amended and restated certificate of incorporation and bylaws to become effective upon completion of this offering include provisions that:
| • | authorize our board of directors to issue, without further action by the stockholders, up to shares of undesignated preferred stock; |
138
Table of Contents
| • | require that any action to be taken by our stockholders be effected at a duly called annual or special meeting and not by written consent; |
| • | specify that special meetings of our stockholders can be called only by our board of directors, the Chairman of the Board, the Chief Executive Officer or the President; |
| • | establish an advance notice procedure for stockholder proposals to be brought before an annual meeting of our stockholders, including proposed nominations of persons for election to our board of directors; |
| • | provide that directors may be removed only for cause; |
| • | provide that vacancies on our board of directors may be filled only by a majority of directors then in office, even though less than a quorum; |
| • | establish that our board of directors is divided into three classes — Class I, Class II, and Class III — with each class serving staggered terms; and |
| • | require a super-majority of votes to amend certain of the above-mentioned provisions. |
Delaware Anti-Takeover Statute
We are subject to the provisions of Section 203 of the General Corporation Law of the State of Delaware regulating corporate takeovers. In general, Section 203 prohibits a publicly-held Delaware corporation from engaging, under certain circumstances, in a business combination with an interested stockholder for a period of three years following the date the person became an interested stockholder unless:
| • | prior to the date of the transaction, the board of directors of the corporation approved either the business combination or the transaction which resulted in the stockholder becoming an interested stockholder; |
| • | upon completion of the transaction that resulted in the stockholder becoming an interested stockholder, the interested stockholder owned at least 85% of the voting stock of the corporation outstanding at the time the transaction commenced, excluding for purposes of determining the voting stock outstanding, but not for determining the outstanding voting stock owned by the interested stockholder, (1) shares owned by persons who are directors and also officers, and (2) shares owned by employee stock plans in which employee participants do not have the right to determine confidentially whether shares held subject to the plan will be tendered in a tender or exchange offer; or |
| • | at or subsequent to the date of the transaction, the business combination is approved by the board of directors of the corporation and authorized at an annual or special meeting of stockholders, and not by written consent, by the affirmative vote of at least 66 2/3% of the outstanding voting stock which is not owned by the interested stockholder. |
Generally, a business combination includes a merger, asset or stock sale, or other transaction resulting in a financial benefit to the interested stockholder. An interested stockholder is a person who, together with affiliates and associates, owns or, within three years prior to the determination of interested stockholder status, did own 15% or more of a corporation’s outstanding voting stock. We expect the existence of this provision to have an anti-takeover effect with respect to transactions our board of directors does not approve in advance. We also anticipate that Section 203 may discourage business combinations or other attempts that might result in a premium over the market price for the shares of common stock held by our stockholders.
139
Table of Contents
The provisions of Delaware law and our restated certificate of incorporation and bylaws to become effective upon completion of this offering could have the effect of discouraging others from attempting hostile takeovers and, as a consequence, may also inhibit temporary fluctuations in the market price of our common stock that often result from actual or rumored hostile takeover attempts. These provisions may also have the effect of preventing changes in our management. It is possible that these provisions could make it more difficult to accomplish transactions that stockholders may otherwise deem to be in their best interests.
Transfer Agent and Registrar
Upon the completion of this offering, the transfer agent and registrar for our common stock will be .
Listing
We intend to apply to list our common stock for quotation on the under the trading symbol “ .”
140
Table of Contents
SHARES ELIGIBLE FOR FUTURE SALE
Before this offering, there has not been a public market for shares of our common stock. Future sales of substantial amounts of shares of our common stock, including shares issued upon the exercise of outstanding options, in the public market after this offering, or the possibility of these sales occurring, could cause the prevailing market price for our common stock to fall or impair our ability to raise equity capital in the future.
Upon the completion of this offering, a total of shares of common stock will be outstanding, assuming that there are no exercises of options after November 30, 2011. Of these shares, all shares of common stock sold in this offering by us and the selling stockholders, plus any shares sold upon exercise of the underwriters’ over-allotment option, will be freely tradable in the public market without restriction or further registration under the Securities Act, unless these shares are held by “affiliates,” as that term is defined in Rule 144 under the Securities Act.
The remaining shares of common stock will be “restricted securities,” as that term is defined in Rule 144 under the Securities Act. These restricted securities are eligible for public sale only if they are registered under the Securities Act or if they qualify for an exemption from registration under Rules 144 or 701 under the Securities Act, which are summarized below.
Subject to the lock up agreements described below and the provisions of Rules 144 and 701 under the Securities Act, these restricted securities will be available for sale in the public market as follows:
| Date |
Number of Shares | |
| On the date of this prospectus |
||
| Between 90 and 180 days after the date of this prospectus |
||
| At various times beginning more than 180 days after the date of this prospectus |
In addition, of the 98,566,958 shares of our common stock that were subject to stock options outstanding as of November 30, 2011, options to purchase 81,888,599 shares of common stock were vested as of November 30, 2011 and will be eligible for sale 180 days following the effective date of this offering.
Lock-Up Agreements
We and all of our directors and officers, as well as the other holders of substantially all shares of common stock outstanding immediately prior to this offering, have agreed that, without the prior written consent of Merrill Lynch, Pierce, Fenner & Smith Incorporated on behalf of the underwriters, we and they will not, during the period ending 180 days after the date of this prospectus:
| • | offer, pledge, sell, contract to sell, sell any option or contract to purchase, purchase any option or contract to sell, grant any option, right or warrant to purchase, lend or otherwise transfer or dispose of, directly or indirectly, any shares of our common stock or any securities convertible into or exercisable or exchangeable for shares of our common stock; or |
| • | enter into any swap or other arrangement that transfers to another, in whole or in part, any of the economic consequences of ownership of our common stock; |
whether any transaction described above is to be settled by delivery of shares of our common stock or such other securities, in cash or otherwise. This agreement is subject to certain exceptions, and is also subject to extension for up to 34 additional days, as set forth in “Underwriting.”
Rule 144
In general, under Rule 144 as currently in effect, once we have been subject to public company reporting requirements for at least 90 days, a person who is not deemed to have been one of our affiliates for
141
Table of Contents
purposes of the Securities Act at any time during 90 days preceding a sale and who has beneficially owned the shares proposed to be sold for at least six months, including the holding period of any prior owner other than our affiliates, is entitled to sell such shares without complying with the manner of sale, volume limitation or notice provisions of Rule 144, subject to compliance with the public information requirements of Rule 144. If such a person has beneficially owned the shares proposed to be sold for at least one year, including the holding period of any prior owner other than our affiliates, then such person is entitled to sell such shares without complying with any of the requirements of Rule 144.
In general, under Rule 144, as currently in effect, our affiliates or persons selling shares on behalf of our affiliates are entitled to sell upon expiration of the lock-up agreements described above, within any three-month period beginning 90 days after the date of this prospectus, a number of shares that does not exceed the greater of:
| • | 1% of the number of shares of common stock then outstanding, which will equal approximately shares immediately after this offering; or |
| • | the average weekly trading volume of the common stock during the four calendar weeks preceding the filing of a notice on Form 144 with respect to such sale. |
Sales under Rule 144 by our affiliates or persons selling shares on behalf of our affiliates are also subject to certain manner of sale provisions and notice requirements and to the availability of current public information about us.
Rule 701
Rule 701 generally allows a stockholder who purchased shares of our common stock pursuant to a written compensatory plan or contract and who is not deemed to have been an affiliate of our company during the immediately preceding 90 days to sell these shares in reliance upon Rule 144, but without being required to comply with the public information, holding period, volume limitation, or notice provisions of Rule 144. Rule 701 also permits affiliates of our company to sell their Rule 701 shares under Rule 144 without complying with the holding period requirements of Rule 144. All holders of Rule 701 shares, however, are required to wait until 90 days after the date of this prospectus before selling such shares pursuant to Rule 701.
As of November 30, 2011, 95,971,698 shares of our outstanding common stock had been issued in reliance on Rule 701 as a result of exercises of stock options and stock awards.
Stock Options
We intend to file a registration statement on Form S-8 under the Securities Act covering all of the shares of our common stock subject to options outstanding or reserved for issuance under our stock plans and shares of our common stock issued upon the exercise of options by employees. We expect to file this registration statement as soon as practicable after this offering. In addition, we intend to file a registration statement on Form S-8 or such other form as may be required under the Securities Act for the resale of shares of our common stock issued upon the exercise of options that were not granted under Rule 701. We expect to file this registration statement as soon as permitted under the Securities Act. However, the shares registered on Form S-8 will be subject to volume limitations, manner of sale, notice and public information requirements of Rule 144 and will not be eligible for resale until expiration of the lock up agreements to which they are subject.
Registration Rights
Upon completion of this offering, the holders of an aggregate of 320,932,465 shares of our common stock issued or issuable upon conversion of preferred stock other than the Series D preferred stock will be entitled to various rights with respect to the registration of these shares under the Securities Act. Registration of these shares under the Securities Act would result in these shares becoming fully tradable without restriction under the Securities Act immediately upon the effectiveness of the registration, except for shares purchased by affiliates. See “Description of Capital Stock—Registration Rights” for additional information.
142
Table of Contents
MATERIAL UNITED STATES FEDERAL INCOME TAX
CONSEQUENCES TO NON-U.S. HOLDERS
The following is a summary of the material U.S. federal income tax and estate tax consequences of the ownership and disposition of our common stock to non-U.S. holders. It is not intended to be a complete analysis of all the U.S. federal income tax considerations that may be relevant to a non-U.S. holder. This summary is based upon the provisions of the Internal Revenue Code of 1986, as amended, or the Code, Treasury regulations promulgated thereunder, administrative rulings and judicial decisions, all as of the date hereof. These authorities may be changed, possibly with retroactive effect, which may result in U.S. federal income tax consequences different from those set forth below. We have not sought any ruling from the Internal Revenue Service, or the IRS, with respect to the statements made and the conclusions reached in the following summary. There can be no assurance that the IRS will agree with such statements and conclusions or that any contrary position taken by the IRS would not be sustained by a court.
This summary also does not address the tax considerations arising under the laws of any foreign, state or local jurisdiction. In addition, this discussion does not address tax considerations applicable to an investor’s particular circumstances or to investors that may be subject to special tax rules, including, without limitation:
| • | banks, insurance companies or other financial institutions; |
| • | persons subject to the alternative minimum tax; |
| • | tax-exempt organizations; |
| • | an integral part or controlled entity of a foreign sovereign; |
| • | dealers in securities or currencies; |
| • | traders in securities that elect to use a mark-to-market method of accounting for their securities holdings; |
| • | persons that own, or are deemed to own, more than five percent of our capital stock (except to the extent specifically set forth below); |
| • | controlled foreign corporations or passive foreign investment companies |
| • | certain former citizens or long-term residents of the United States; |
| • | persons who hold our common stock as a position in a hedging transaction, “straddle,” “conversion transaction” or other risk reduction transaction; |
| • | persons deemed to sell our common stock under the constructive sale provisions of the Code; or |
| • | persons who hold our common stock other than as a capital asset (generally, an asset held for investment purposes). |
In addition, if a partnership, or entity classified as a partnership for U.S. federal income tax purposes, holds our common stock, the tax treatment of a partner generally will depend on the status of the partner and upon the activities of the partnership. Accordingly, partnerships that hold our common stock, and partners in such partnerships, should consult their tax advisors.
YOU ARE URGED TO CONSULT YOUR TAX ADVISOR WITH RESPECT TO THE APPLICATION OF THE UNITED STATES FEDERAL INCOME TAX LAWS TO YOUR PARTICULAR SITUATION, AS WELL AS ANY TAX CONSEQUENCES OF THE PURCHASE,
143
Table of Contents
OWNERSHIP AND DISPOSITION OF OUR COMMON STOCK ARISING UNDER THE UNITED STATES FEDERAL ESTATE OR GIFT TAX RULES OR UNDER THE LAWS OF ANY STATE, LOCAL, FOREIGN OR OTHER TAXING JURISDICTION OR UNDER ANY APPLICABLE TAX TREATY.
Non-U.S. Holder Defined
For purposes of this discussion, you are a non-U.S. holder if you are a holder that, for U.S. federal income tax purposes, is not a U.S. person or a partnership. For purposes of this discussion, you are a U.S. person if you are:
| • | an individual citizen or resident of the United States; |
| • | a corporation or other entity taxable as a corporation created or organized in the United States or under the laws of the United States or any political subdivision thereof; |
| • | an estate whose income is subject to U.S. federal income tax regardless of its source; or |
| • | a trust (x) if a court within the United States is able to exercise primary jurisdiction over the administration of the trust and one or more U.S. persons have the authority to control all substantial decisions of the trust or (y) that has made an election to be treated as a U.S. person. |
Distributions
We have not made any distributions on our common stock and do not plan to make any distributions for the foreseeable future. However, if we do make distributions on our common stock, those payments will constitute dividends for U.S. tax purposes to the extent paid from our current or accumulated earnings and profits, as determined under U.S. federal income tax principles. To the extent those distributions exceed both our current and our accumulated earnings and profits, they will constitute a return of capital and will first reduce your basis in our common stock, but not below zero, and then will be treated as gain from the sale of stock, which will be subject to tax as described in “Gain on Disposition of Common Stock,” below.
Any dividend paid to you generally will be subject to U.S. withholding tax either at a rate of 30% of the gross amount of the dividend or such lower rate as may be specified by an applicable income tax treaty. In order to receive a reduced treaty rate, you must provide us with a properly completed IRS Form W-8BEN or other appropriate version of IRS Form W-8 certifying qualification for the reduced rate.
Dividends received by you that are effectively connected with your conduct of a U.S. trade or business are exempt from such withholding tax. In order to obtain this exemption, you must provide us with a properly completed IRS Form W-8ECI certifying such exemption. Such effectively connected dividends, although not subject to withholding tax, are taxed at the same graduated rates applicable to U.S. persons, net of certain deductions and credits. In addition, if you are a corporate non-U.S. holder, dividends you receive that are effectively connected with your conduct of a U.S. trade or business may also be subject to a branch profits tax at a rate of 30% or such lower rate as may be specified by an applicable income tax treaty.
If you are eligible for a reduced rate of withholding tax pursuant to a tax treaty, you may obtain a refund from the U.S. Treasury of any excess amounts withheld if you timely file an appropriate claim for refund with the IRS.
144
Table of Contents
Gain on Disposition of Common Stock
You generally will not be required to pay U.S. federal income tax on any gain realized upon the sale or other disposition of our common stock unless:
| • | the gain is effectively connected with your conduct of a U.S. trade or business; |
| • | you are an individual non-U.S. holder who is present in the United States for a period or periods aggregating 183 days or more during the calendar year in which the sale or disposition occurs and certain other conditions are met; or |
| • | our common stock constitutes a U.S. real property interest by reason of our status as a “United States real property holding corporation” for U.S. federal income tax purposes, or a USRPHC, at any time within the shorter of the five-year period preceding the disposition or your holding period for our common stock. |
If you are a non-U.S. holder described in the first bullet above, you will be required to pay tax on the net gain derived from the sale under regular graduated U.S. federal income tax rates. Corporate non-U.S. holders described in the first bullet above may be subject to the branch profits tax at a 30% rate or such lower rate as may be specified by an applicable income tax treaty. If you are an individual non-U.S. holder described in the second bullet above, you will be required to pay a flat 30% tax on the gain derived from the sale, which may be offset by U.S.-source capital losses (even though you are not considered a resident of the United States). You should consult any applicable income tax or other treaties, which may provide for different rules.
We believe that we are not currently and will not become a USRPHC. However, because the determination of whether we are a USRPHC depends on the fair market value of our U.S. real property relative to the fair market value of our other business assets, there can be no assurance that we will not become a USRPHC in the future. Even if we become a USRPHC, however, as long as our common stock is regularly traded on an established securities market, such common stock will be treated as U.S. real property interests only if you actually or constructively hold more than five percent of such regularly traded common stock at any time during the shorter of the five-year period preceding the disposition or your holding period for our common stock. If gain on the sale or other taxable disposition of our stock is subject to tax because we are a USRPHC, you would be subject to regular U.S. federal income tax with respect to such gain, generally in the same manner as a U.S. person.
Federal Estate Tax
Common stock held or beneficially owned by an individual non-U.S. holder (as defined for U.S. federal estate tax purposes) at the time of death will be included in such holder’s gross estate for U.S. federal estate tax purposes, unless an applicable estate tax treaty provides otherwise.
Backup Withholding and Information Reporting
Generally, we must report annually to the IRS the amount of dividends paid to you, your name and address, and the amount of tax withheld, if any. A similar report will be sent to you. Pursuant to applicable income tax treaties or other agreements, the IRS may make these reports available to tax authorities in your country of residence.
Payments of dividends or of proceeds on the disposition of stock made to you may be subject to information reporting and backup withholding (currently at a rate of 28%, which such rate is scheduled to increase to 31% for payments made after December 31, 2012) unless you establish an exemption, for example by properly certifying your non-U.S. status on a Form W-8BEN or another appropriate version of IRS Form W-8. Notwithstanding the foregoing, backup withholding and information reporting may apply if either we or our paying agent has actual knowledge, or reason to know, that you are a U.S. person.
145
Table of Contents
Backup withholding is not an additional tax; rather, the U.S. income tax liability of persons subject to backup withholding will be reduced by the amount of tax withheld. If withholding results in an overpayment of taxes, a refund or credit may be obtained from the U.S. Treasury, provided that the required information is furnished to the IRS in a timely manner.
Taxation of our Common Stock Held By or Through Foreign Entities
New withholding rules in the Code may impose withholding taxes on certain types of payments made to “foreign financial institutions” (as specially defined under these rules) and certain other non-U.S. entities if certification, information reporting and other specified requirements are not met. The legislation potentially imposes a 30% withholding tax on dividends on or gross proceeds from the sale or other disposition of our common stock if they are paid to a foreign financial institution or to a foreign non-financial entity, unless (i) the foreign financial institution undertakes certain diligence and reporting obligations and other specified requirements are satisfied or (ii) the foreign non-financial entity either certifies it does not have any substantial U.S. owners or furnishes identifying information regarding each substantial U.S. owner and other specified requirements are satisfied. If the payee is a foreign financial institution, it must enter into an agreement with the U.S. Treasury requiring, among other things, that it undertake to identify accounts held by certain U.S. persons or U.S.-owned foreign entities, annually report certain information about such accounts and withhold 30% on payments to account holders whose actions prevent it from complying with these reporting and other requirements. Withholding on certain types of income, including dividends, will be required beginning January 1, 2014. Prospective investors should consult their tax advisors regarding the impact of this legislation on their investment in our common stock.
146
Table of Contents
Merrill Lynch, Pierce, Fenner & Smith Incorporated is acting as representative of each of the underwriters named below. Subject to the terms and conditions set forth in an underwriting agreement among us, the selling stockholders and the underwriters, we and the selling stockholders have agreed to sell to the underwriters, and each of the underwriters has agreed, severally and not jointly, to purchase from us and the selling stockholders, the number of shares of common stock set forth opposite its name below.
| Underwriter | Number of Shares | |
| Merrill Lynch, Pierce, Fenner & Smith Incorporated |
||
| William Blair & Company, L.L.C. |
||
| Pacific Crest Securities |
||
| Canaccord Genuity Inc. |
||
| Needham & Company, LLC |
||
|
| ||
|
Total |
||
|
|
Subject to the terms and conditions set forth in the underwriting agreement, the underwriters have agreed, severally and not jointly, to purchase all of the shares sold under the underwriting agreement if any of these shares are purchased. If an underwriter defaults, the underwriting agreement provides that the purchase commitments of the nondefaulting underwriters may be increased or the underwriting agreement may be terminated.
We and the selling stockholders have agreed to indemnify the underwriters against certain liabilities, including liabilities under the Securities Act, or to contribute to payments the underwriters may be required to make in respect of those liabilities.
The underwriters are offering the shares, subject to prior sale, when, as and if issued to and accepted by them, subject to approval of legal matters by their counsel, including the validity of the shares, and other conditions contained in the underwriting agreement, such as the receipt by the underwriters of officer’s certificates and legal opinions. The underwriters reserve the right to withdraw, cancel or modify offers to the public and to reject orders in whole or in part.
Commissions and Discounts
The representative has advised us and the selling stockholders that the underwriters propose initially to offer the shares to the public at the public offering price set forth on the cover page of this prospectus and to dealers at that price less a concession not in excess of $ per share. After the initial offering, the public offering price, concession or any other term of the offering may be changed.
The following table shows the public offering price, underwriting discount and proceeds before expenses to us and the selling stockholders. The information assumes either no exercise or full exercise by the underwriters of their option to purchase additional shares.
| Per Share | Without Option | With Option | ||||||||||
| Public offering price |
$ | $ | $ | |||||||||
| Underwriting discount |
$ | $ | $ | |||||||||
| Proceeds, before expenses, to us |
$ | $ | $ | |||||||||
| Proceeds, before expenses, to the selling stockholders |
$ | $ | $ | |||||||||
147
Table of Contents
The expenses of the offering, not including the underwriting discount, are estimated at $ and are payable by us and the selling stockholders.
Option to Purchase Additional Shares
We have granted an option to the underwriters, exercisable for 30 days after the date of this prospectus, to purchase up to additional shares at the public offering price, less the underwriting discount. If the underwriters exercise this option, each will be obligated, subject to conditions contained in the underwriting agreement, to purchase a number of additional shares proportionate to that underwriter’s initial amount reflected in the above table.
Reserved Shares
At our request, the underwriters have reserved for sale, at the initial public offering price, up to shares offered by this prospectus for sale to some of our directors, officers, employees, distributors, dealers, business associates and related persons. If these persons purchase reserved shares, this will reduce the number of shares available for sale to the general public. Any reserved shares that are not so purchased will be offered by the underwriters to the general public on the same terms as the other shares offered by this prospectus.
No Sales of Similar Securities
We and the selling stockholders, our executive officers and directors and substantially all of our other existing security holders have agreed not to sell or transfer any common stock or securities convertible into, exchangeable for, exercisable for, or repayable with common stock, for 180 days after the date of this prospectus without first obtaining the written consent of Merrill Lynch, Pierce, Fenner & Smith Incorporated. Specifically, we and these other persons have agreed, with certain limited exceptions, not to directly or indirectly
| • | offer, pledge, sell or contract to sell any common stock, |
| • | sell any option or contract to purchase any common stock, |
| • | purchase any option or contract to sell any common stock, |
| • | grant any option, right or warrant for the sale of any common stock, |
| • | lend or otherwise dispose of or transfer any common stock, |
| • | request or demand that we file a registration statement related to the common stock, or |
| • | enter into any swap or other agreement that transfers, in whole or in part, the economic consequence of ownership of any common stock whether any such swap or transaction is to be settled by delivery of shares or other securities, in cash or otherwise. |
This lock-up provision applies to common stock and to securities convertible into or exchangeable or exercisable for or repayable with common stock. It also applies to common stock owned now or acquired later by the person executing the agreement or for which the person executing the agreement later acquires the power of disposition. In the event that either (x) during the last 17 days of the lock-up period referred to above, we issue an earnings release or material news or a material event relating to us occurs or (y) prior to the expiration of the lock-up period, we announce that we will release earnings results or become aware that material news or a material event will occur during the 16-day period beginning on the last day of the lock-up period, the restrictions described above shall continue to apply until the expiration of the 18-day period beginning on the issuance of the earnings release or the occurrence of the material news or material event.
148
Table of Contents
Listing
We expect the shares to be approved for listing on the , subject to notice of issuance, under the symbol “ .” In order to meet the requirements for listing on that exchange, the underwriters have undertaken to sell a minimum number of shares to a minimum number of beneficial owners as required by that exchange.
Before this offering, there has been no public market for our common stock. The initial public offering price will be determined through negotiations among us, the selling stockholders and the representative. In addition to prevailing market conditions, the factors to be considered in determining the initial public offering price are
| • | the valuation multiples of publicly traded companies that the representative believes to be comparable to us, |
| • | our financial information, |
| • | the history of, and the prospects for, our company and the industry in which we compete, |
| • | an assessment of our management, its past and present operations, and the prospects for, and timing of, our future revenues, |
| • | the present state of our development, and |
| • | the above factors in relation to market values and various valuation measures of other companies engaged in activities similar to ours. |
An active trading market for the shares may not develop. It is also possible that after the offering the shares will not trade in the public market at or above the initial public offering price.
The underwriters do not expect to sell more than 5% of the shares in the aggregate to accounts over which they exercise discretionary authority.
Price Stabilization, Short Positions and Penalty Bids
Until the distribution of the shares is completed, SEC rules may limit underwriters and selling group members from bidding for and purchasing our common stock. However, the representative may engage in transactions that stabilize the price of the common stock, such as bids or purchases to peg, fix or maintain that price.
In connection with the offering, the underwriters may purchase and sell our common stock in the open market. These transactions may include short sales, purchases on the open market to cover positions created by short sales and stabilizing transactions. Short sales involve the sale by the underwriters of a greater number of shares than they are required to purchase in the offering. “Covered” short sales are sales made in an amount not greater than the underwriters’ option to purchase additional shares described above. The underwriters may close out any covered short position by either exercising their option to purchase additional shares or purchasing shares in the open market. In determining the source of shares to close out the covered short position, the underwriters will consider, among other things, the price of shares available for purchase in the open market as compared to the price at which they may purchase shares through the option granted to them. “Naked” short sales are sales in excess of such option. The underwriters must close out any naked short position by purchasing shares in the open market. A naked short position is more likely to be created if the underwriters are concerned that there may be downward pressure on the price of our common stock in the open market after pricing that could adversely affect investors who purchase in the offering. Stabilizing transactions consist of various bids for or purchases of shares of common stock made by the underwriters in the open market prior to the completion of the offering.
149
Table of Contents
The underwriters may also impose a penalty bid. This occurs when a particular underwriter repays to the underwriters a portion of the underwriting discount received by it because the representative has repurchased shares sold by or for the account of such underwriter in stabilizing or short covering transactions.
Similar to other purchase transactions, the underwriters’ purchases to cover the syndicate short sales may have the effect of raising or maintaining the market price of our common stock or preventing or retarding a decline in the market price of our common stock. As a result, the price of our common stock may be higher than the price that might otherwise exist in the open market. The underwriters may conduct these transactions on the , in the over-the-counter market or otherwise.
Neither we nor any of the underwriters make any representation or prediction as to the direction or magnitude of any effect that the transactions described above may have on the price of our common stock. In addition, neither we nor any of the underwriters make any representation that the representative will engage in these transactions or that these transactions, once commenced, will not be discontinued without notice.
Electronic Distribution
In connection with the offering, certain of the underwriters or securities dealers may distribute prospectuses by electronic means, such as e-mail.
Other Relationships
Some of the underwriters and their affiliates have engaged in, and may in the future engage in, investment banking and other commercial dealings in the ordinary course of business with us or our affiliates. They have received, or may in the future receive, customary fees and commissions for these transactions.
In addition, in the ordinary course of their business activities, the underwriters and their affiliates may make or hold a broad array of investments and actively trade debt and equity securities (or related derivative securities) and financial instruments (including bank loans) for their own account and for the accounts of their customers. Such investments and securities activities may involve securities and/or instruments of ours or our affiliates. The underwriters and their affiliates may also make investment recommendations and/or publish or express independent research views in respect of such securities or financial instruments and may hold, or recommend to clients that they acquire, long and/or short positions in such securities and instruments.
Notice to Prospective Investors in the European Economic Area
In relation to each Member State of the European Economic Area which has implemented the Prospectus Directive, or each, a Relevant Member State, with effect from and including the date on which the Prospectus Directive is implemented in that Relevant Member State, or the “Relevant Implementation Date, no offer of shares may be made to the public in that Relevant Member State other than:
| A. | to any legal entity which is a qualified investor as defined in the Prospectus Directive; |
| B. | to fewer than 100 or, if the Relevant Member State has implemented the relevant provision of the 2010 PD Amending Directive, 150, natural or legal persons (other than qualified investors as defined in the Prospectus Directive), as permitted under the Prospectus Directive, subject to obtaining the prior consent of the representative; or |
| C. | in any other circumstances falling within Article 3(2) of the Prospectus Directive, |
provided that no such offer of shares shall require the Company or the representative to publish a prospectus pursuant to Article 3 of the Prospectus Directive or supplement a prospectus pursuant to Article 16 of the Prospectus Directive.
150
Table of Contents
Each person in a Relevant Member State (other than a Relevant Member State where there is a Permitted Public Offer) who initially acquires any shares or to whom any offer is made will be deemed to have represented, acknowledged and agreed that (A) it is a “qualified investor” within the meaning of the law in that Relevant Member State implementing Article 2(1)(e) of the Prospectus Directive, and (B) in the case of any shares acquired by it as a financial intermediary, as that term is used in Article 3(2) of the Prospectus Directive, the shares acquired by it in the offering have not been acquired on behalf of, nor have they been acquired with a view to their offer or resale to, persons in any Relevant Member State other than “qualified investors” as defined in the Prospectus Directive, or in circumstances in which the prior consent of the representative has been given to the offer or resale. In the case of any shares being offered to a financial intermediary as that term is used in Article 3(2) of the Prospectus Directive, each such financial intermediary will be deemed to have represented, acknowledged and agreed that the shares acquired by it in the offer have not been acquired on a non-discretionary basis on behalf of, nor have they been acquired with a view to their offer or resale to, persons in circumstances which may give rise to an offer of any shares to the public other than their offer or resale in a Relevant Member State to qualified investors as so defined or in circumstances in which the prior consent of the representative has been obtained to each such proposed offer or resale.
The Company, the representative and their affiliates will rely upon the truth and accuracy of the foregoing representation, acknowledgement and agreement.
This prospectus has been prepared on the basis that any offer of shares in any Relevant Member State will be made pursuant to an exemption under the Prospectus Directive from the requirement to publish a prospectus for offers of shares. Accordingly any person making or intending to make an offer in that Relevant Member State of shares which are the subject of the offering contemplated in this prospectus may only do so in circumstances in which no obligation arises for the Company or any of the underwriters to publish a prospectus pursuant to Article 3 of the Prospectus Directive in relation to such offer. Neither the Company nor the underwriters have authorized, nor do they authorize, the making of any offer of shares in circumstances in which an obligation arises for the Company or the underwriters to publish a prospectus for such offer.
For the purpose of the above provisions, the expression “an offer to the public” in relation to any shares in any Relevant Member State means the communication in any form and by any means of sufficient information on the terms of the offer and the shares to be offered so as to enable an investor to decide to purchase or subscribe the shares, as the same may be varied in the Relevant Member State by any measure implementing the Prospectus Directive in the Relevant Member State and the expression “Prospectus Directive” means Directive 2003/71/EC (including the 2010 PD Amending Directive, to the extent implemented in the Relevant Member States) and includes any relevant implementing measure in the Relevant Member State and the expression “2010 PD Amending Directive” means Directive 2010/73/EU.
Notice to Prospective Investors in the United Kingdom
In addition, in the United Kingdom, this document is being distributed only to, and is directed only at, and any offer subsequently made may only be directed at persons who are “qualified investors” (as defined in the Prospectus Directive) (i) who have professional experience in matters relating to investments falling within Article 19 (5) of the Financial Services and Markets Act 2000 (Financial Promotion) Order 2005, as amended, or the Order, and/or (ii) who are high net worth companies (or persons to whom it may otherwise be lawfully communicated) falling within Article 49(2)(a) to (d) of the Order (all such persons together being referred to as “relevant persons”). This document must not be acted on or relied on in the United Kingdom by persons who are not relevant persons. In the United Kingdom, any investment or investment activity to which this document relates is only available to, and will be engaged in with, relevant persons.
151
Table of Contents
Notice to Prospective Investors in Switzerland
The shares may not be publicly offered in Switzerland and will not be listed on the SIX Swiss Exchange, or SIX, or on any other stock exchange or regulated trading facility in Switzerland. This document has been prepared without regard to the disclosure standards for issuance prospectuses under art. 652a or art. 1156 of the Swiss Code of Obligations or the disclosure standards for listing prospectuses under art. 27 ff. of the SIX Listing Rules or the listing rules of any other stock exchange or regulated trading facility in Switzerland. Neither this document nor any other offering or marketing material relating to the shares or the offering may be publicly distributed or otherwise made publicly available in Switzerland.
Neither this document nor any other offering or marketing material relating to the offering, the Company, the shares have been or will be filed with or approved by any Swiss regulatory authority. In particular, this document will not be filed with, and the offer of shares will not be supervised by, the Swiss Financial Market Supervisory Authority FINMA (FINMA), and the offer of shares has not been and will not be authorized under the Swiss Federal Act on Collective Investment Schemes, or CISA. The investor protection afforded to acquirers of interests in collective investment schemes under the CISA does not extend to acquirers of shares.
Notice to Prospective Investors in the Dubai International Financial Centre
This prospectus supplement relates to an Exempt Offer in accordance with the Offered Securities Rules of the Dubai Financial Services Authority, or DFSA. This prospectus supplement is intended for distribution only to persons of a type specified in the Offered Securities Rules of the DFSA. It must not be delivered to, or relied on by, any other person. The DFSA has no responsibility for reviewing or verifying any documents in connection with Exempt Offers. The DFSA has not approved this prospectus supplement nor taken steps to verify the information set forth herein and has no responsibility for the prospectus supplement. The shares to which this prospectus supplement relates may be illiquid and/or subject to restrictions on their resale. Prospective purchasers of the shares offered should conduct their own due diligence on the shares. If you do not understand the contents of this prospectus supplement you should consult an authorized financial advisor.
152
Table of Contents
The validity of the shares of common stock offered hereby will be passed upon for us by Wilson Sonsini Goodrich & Rosati, Professional Corporation, Palo Alto, California. Certain legal matters in connection with this offering will be passed upon for the underwriters by Goodwin Procter LLP, Menlo Park, California.
The consolidated financial statements of E2open, Inc. and subsidiaries as of February 28, 2010 and 2011, and for each of the years in the three-year period ended February 28, 2011, have been included herein and in the registration statement in reliance upon the report of KPMG LLP, independent registered public accounting firm, appearing elsewhere herein, and upon the authority of said firm as experts in accounting and auditing.
WHERE YOU CAN FIND MORE INFORMATION
We have filed with the SEC a registration statement on Form S-1 under the Securities Act with respect to the shares of common stock we are offering. The registration statement, including the attached exhibits and schedules, contains additional relevant information about us and our common stock. This prospectus does not contain all of the information set forth in the registration statement and the exhibits and schedules thereto. The rules and regulations of the SEC allow us to omit from this prospectus certain information included in the registration statement.
For further information about us and our common stock, you may inspect a copy of the registration statement and the exhibits and schedules to the registration statement without charge at the offices of the SEC at 100 F Street, N.E., Washington, D.C. 20549. You may obtain copies of all or any part of the registration statement from the Public Reference Section of the SEC, 100 F Street, N.E., Washington, D.C. 20549 upon the payment of the prescribed fees.
You may obtain information on the operation of the Public Reference Room by calling the SEC at 1-800-SEC-0330. The SEC maintains a website at www.sec.gov that contains reports, proxy and information statements and other information regarding registrants like us that file electronically with the SEC. You can also inspect our registration statement on this website.
Upon the closing of this offering, we will become subject to the reporting and information requirements of the Exchange Act, and we will file reports, proxy statements and other information with the SEC.
153
Table of Contents
INDEX TO CONSOLIDATED FINANCIAL STATEMENTS
| Page |
||||
| F-2 | ||||
| F-3 | ||||
| F-4 | ||||
| Consolidated Statements of Stockholders’ Deficit and Comprehensive Income (Loss) |
F-5 | |||
| F-6 | ||||
| F-7 | ||||
F-1
Table of Contents
Report of Independent Registered Public Accounting Firm
The Board of Directors and Stockholders
E2open, Inc.:
We have audited the accompanying consolidated balance sheets of E2open, Inc. and subsidiaries (the Company) as of February 28, 2011 and 2010, and the related consolidated statements of operations, stockholders’ deficit and comprehensive income (loss), and cash flows for each of the years in the three-year period ended February 28, 2011. These consolidated financial statements are the responsibility of the Company’s management. Our responsibility is to express an opinion on these consolidated financial statements based on our audits.
We conducted our audits in accordance with the standards of the Public Company Accounting Oversight Board (United States). Those standards require that we plan and perform the audit to obtain reasonable assurance about whether the financial statements are free of material misstatement. An audit includes examining, on a test basis, evidence supporting the amounts and disclosures in the financial statements. An audit also includes assessing the accounting principles used and significant estimates made by management, as well as evaluating the overall financial statement presentation. We believe that our audits provide a reasonable basis for our opinion.
In our opinion, the consolidated financial statements referred to above present fairly, in all material respects, the financial position of E2open, Inc. and subsidiaries as of February 28, 2011 and 2010, and the results of their operations and their cash flows for each of the years in the three-year period ended February 28, 2011, in conformity with U.S. generally accepted accounting principles.
\s\ KPMG LLP
Santa Clara, CA
August 3, 2011,
except as to the caption “Net Income (Loss) per
Share Attributable to Common Stockholders”
in note 2 to the consolidated financial statements,
which is as of February 16, 2012
F-2
Table of Contents
Consolidated Balance Sheets
(In thousands, except per share data)
| February 28, | November
30, 2011 (Unaudited) |
Pro forma Stockholders’ Deficit as of November 30, 2011 (Unaudited) (Note 2) |
||||||||||||||
| 2010 | 2011 | |||||||||||||||
| Assets | ||||||||||||||||
| Current assets: |
||||||||||||||||
| Cash and cash equivalents |
$ | 9,530 | $ | 10,060 | $ | 10,043 | ||||||||||
| Accounts receivable, net of allowance of $96, $28 and $71 |
10,412 | 12,288 | 14,814 | |||||||||||||
| Prepaid expenses and other current assets |
1,294 | 1,604 | 1,583 | |||||||||||||
|
|
|
|
|
|
|
|||||||||||
| Total current assets |
21,236 | 23,952 | 26,440 | |||||||||||||
| Property and equipment, net |
2,720 | 1,889 | 1,444 | |||||||||||||
| Other assets |
518 | 577 | 665 | |||||||||||||
|
|
|
|
|
|
|
|||||||||||
| Total Assets |
$ | 24,474 | $ | 26,418 | $ | 28,549 | ||||||||||
|
|
|
|
|
|
|
|||||||||||
| Liabilities and Stockholders’ Deficit | ||||||||||||||||
| Current liabilities: |
||||||||||||||||
| Accounts payable and accrued liabilities |
$ | 6,310 | $ | 7,080 | $ | 8,267 | ||||||||||
| Deferred revenue |
35,582 | 27,507 | 35,692 | |||||||||||||
| Lines of credit |
6,330 | 5,460 | 8,850 | |||||||||||||
| Current portion of notes payable |
687 | 1,090 | 1,003 | |||||||||||||
| Current portion of capital lease obligations |
231 | 35 | — | |||||||||||||
|
|
|
|
|
|
|
|||||||||||
| Total current liabilities |
49,140 | 41,172 | 53,812 | |||||||||||||
| Deferred revenue |
16,673 | 17,124 | 7,831 | |||||||||||||
| Notes payable, net of current portion |
131 | 1,667 | 918 | |||||||||||||
| Capital lease obligations, net of current portion |
35 | — | — | |||||||||||||
| Other noncurrent liabilities |
322 | 612 | 583 | |||||||||||||
|
|
|
|
|
|
|
|||||||||||
| Total liabilities |
66,301 | 60,575 | 63,144 | |||||||||||||
|
|
|
|
|
|
|
|||||||||||
| Commitments and contingencies (note 10) |
||||||||||||||||
| Stockholders’ deficit: |
||||||||||||||||
| Series AA preferred stock, $0.001 par value. Authorized, 160,000,000 shares; issued and outstanding, 137,400,469 shares, aggregate liquidation preference of $52,212 |
13,336 | 13,336 | 13,336 | — | ||||||||||||
| Series BB preferred stock, $0.001 par value. Authorized, 100,000,000 shares; issued and outstanding, 81,468,750 shares, aggregate liquidation preference of $26,070 |
26,560 | 26,560 | 26,560 | — | ||||||||||||
| Series CC preferred stock, $0.001 par value. Authorized, 152,500,000 shares issued and outstanding, 100,435,907 shares in 2010 and 2011, aggregate liquidation preference of $32,139 as of February 28, 2010 and 2011, 100,888,720 shares outstanding, aggregate liquidation preference of $32,284 as of November 30, 2011 |
27,114 | 27,114 | 27,259 | — | ||||||||||||
| Series D preferred stock, $0.001 par value. Authorized, 200,000,000 shares; issued and outstanding, 163,474,270 shares, aggregate liquidation preference of $16,347 |
16,336 | 16,336 | 16,336 | — | ||||||||||||
| Common stock, $0.001 par value. Authorized, 877,000,000 shares issued and outstanding, 150,651,539, 200,872,091, and 209,795,137 shares as of February 2010 and 2011, and November 30, 2011; 739,744,723 shares issued and outstanding pro forma |
151 | 201 | 210 | 740 | ||||||||||||
| Additional paid-in capital |
221,710 | 222,687 | 223,178 | 375,329 | ||||||||||||
| Accumulated other comprehensive income |
— | — | 3 | 3 | ||||||||||||
| Accumulated deficit |
(347,034 | ) | (340,391 | ) | (341,477 | ) | (341,477 | ) | ||||||||
|
|
|
|
|
|
|
|
|
|||||||||
| Total stockholders’ deficit |
(41,827 | ) | (34,157 | ) | (34,595 | ) | (34,595 | ) | ||||||||
|
|
|
|
|
|
|
|
|
|||||||||
| Total liabilities and stockholders’ deficit |
$ | 24,474 | $ | 26,418 | $ | 28,549 | ||||||||||
|
|
|
|
|
|
|
|||||||||||
The accompanying notes are an integral part of these consolidated financial statements.
F-3
Table of Contents
Consolidated Statements of Operations
(In thousands, except shares and per share data)
| Years Ended February 28, | Nine Months
Ended November 30, |
|||||||||||||||||||
| 2009 | 2010 | 2011 | 2010 | 2011 | ||||||||||||||||
| (Unaudited) | ||||||||||||||||||||
| Revenue |
||||||||||||||||||||
| Subscriptions and support |
$ | 21,107 | $ | 29,976 | $ | 39,419 | $ | 26,973 | $ | 26,563 | ||||||||||
| Professional services and other |
16,627 | 14,401 | 16,104 | 10,380 | 16,099 | |||||||||||||||
|
|
|
|
|
|
|
|
|
|
|
|||||||||||
| Total revenue |
37,734 | 44,377 | 55,523 | 37,353 | 42,662 | |||||||||||||||
|
|
|
|
|
|
|
|
|
|
|
|||||||||||
| Cost of revenue |
||||||||||||||||||||
| Subscriptions and support |
8,885 | 9,269 | 7,531 | 5,774 | 5,599 | |||||||||||||||
| Professional services and other |
14,685 | 11,493 | 11,774 | 8,764 | 10,224 | |||||||||||||||
|
|
|
|
|
|
|
|
|
|
|
|||||||||||
| Total cost of revenue |
23,570 | 20,762 | 19,305 | 14,538 | 15,823 | |||||||||||||||
|
|
|
|
|
|
|
|
|
|
|
|||||||||||
| Gross profit |
||||||||||||||||||||
| Subscriptions and support |
12,222 | 20,707 | 31,888 | 21,199 | 20,964 | |||||||||||||||
| Professional services and other |
1,942 | 2,908 | 4,330 | 1,616 | 5,875 | |||||||||||||||
|
|
|
|
|
|
|
|
|
|
|
|||||||||||
| Total gross profit |
14,164 | 23,615 | 36,218 | 22,815 | 26,839 | |||||||||||||||
|
|
|
|
|
|
|
|
|
|
|
|||||||||||
| Operating expenses: |
||||||||||||||||||||
| Research and development |
12,943 | 13,077 | 11,463 | 8,474 | 9,880 | |||||||||||||||
| Sales and marketing |
11,792 | 11,421 | 12,756 | 9,027 | 13,161 | |||||||||||||||
| General and administrative |
6,448 | 4,884 | 5,064 | 3,745 | 4,305 | |||||||||||||||
| Restructuring costs |
1,146 | — | — | — | — | |||||||||||||||
|
|
|
|
|
|
|
|
|
|
|
|||||||||||
| Total operating expenses |
32,329 | 29,382 | 29,283 | 21,246 | 27,346 | |||||||||||||||
|
|
|
|
|
|
|
|
|
|
|
|||||||||||
| Income (loss) from operations |
(18,165 | ) | (5,767 | ) | 6,935 | 1,569 | (507 | ) | ||||||||||||
| Interest and other expense, net |
(1,618 | ) | (532 | ) | (259 | ) | (219 | ) | (457 | ) | ||||||||||
|
|
|
|
|
|
|
|
|
|
|
|||||||||||
| Income (loss) before income taxes |
(19,783 | ) | (6,299 | ) | 6,676 | 1,350 | (964 | ) | ||||||||||||
| Provision for income taxes |
(60 | ) | (349 | ) | (33 | ) | — | (122 | ) | |||||||||||
|
|
|
|
|
|
|
|
|
|
|
|||||||||||
| Net income (loss) |
(19,843 | ) | (6,648 | ) | 6,643 | 1,350 | (1,086 | ) | ||||||||||||
| Undistributed earnings allocated to preferred stockholders |
— | — | (6,643 | ) | (1,350 | ) | — | |||||||||||||
|
|
|
|
|
|
|
|
|
|
|
|||||||||||
| Net income (loss) per share attributable to common stockholders: |
$ | (19,843 | ) | $ | (6,648 | ) | $ | — | $ | — | $ | (1,086 | ) | |||||||
|
|
|
|
|
|
|
|
|
|
|
|||||||||||
| Net income (loss) per share attributable to common stockholders: |
||||||||||||||||||||
| Basic |
$ | (0.17 | ) | $ | ($0.05 | ) | $ | — | $ | — | $ | (0.01 | ) | |||||||
|
|
|
|
|
|
|
|
|
|
|
|||||||||||
| Diluted |
$ | (0.17 | ) | $ | ($0.05 | ) | $ | — | $ | — | $ | (0.01 | ) | |||||||
|
|
|
|
|
|
|
|
|
|
|
|||||||||||
| Weighted average shares used to compute net income (loss) per share attributable to common stockholders: |
||||||||||||||||||||
| Basic |
115,390 | 147,342 | 202,569 | 199,486 | 205,796 | |||||||||||||||
|
|
|
|
|
|
|
|
|
|
|
|||||||||||
| Diluted |
|
115,390 |
|
147,342 | 202,569 | 199,486 | 205,796 | |||||||||||||
|
|
|
|
|
|
|
|
|
|
|
|||||||||||
| Pro forma net income per share attributable to common stockholders (unaudited): |
||||||||||||||||||||
| Basic |
$ | 0.01 | $ | — | ||||||||||||||||
|
|
|
|
|
|||||||||||||||||
| Diluted |
$ | 0.01 | $ | — | ||||||||||||||||
|
|
|
|
|
|||||||||||||||||
| Pro forma weighted average shares used to compute pro forma net income (loss) per share attributable to common stockholders (unaudited): |
||||||||||||||||||||
| Basic |
726,191 | 729,368 | ||||||||||||||||||
|
|
|
|
|
|||||||||||||||||
| Diluted |
759,769 | 729,368 | ||||||||||||||||||
|
|
|
|
|
|||||||||||||||||
The accompanying notes are an integral part of these consolidated financial statements.
F-4
Table of Contents
Consolidated Statements of Stockholders’ Deficit and Comprehensive Income (Loss)
Years Ended February 28, 2009, 2010 and 2011 and Nine Months Ended November 30, 2011 (Unaudited)
(In thousands, except shares data)
| Preferred stock | Common stock | Note receivable |
Additional paid-in capital |
Accumulated Other Comprehensive Income |
Accumulated deficit |
Total stockholders’ deficit |
||||||||||||||||||||||||||||||
| Shares | Amount | Shares | Amount | |||||||||||||||||||||||||||||||||
| Balances, February 29, 2008 |
287,023,437 | $ | 54,342 | 110,570,227 | $ | 111 | $ | (106 | ) | $ | 214,128 | — | $ | (320,543 | ) | $ | (52,068 | ) | ||||||||||||||||||
| Exercise of options for common stock |
— | — | 8,553,766 | 8 | — | 544 | — | — | 552 | |||||||||||||||||||||||||||
| Issuance of Series CC preferred stock, net of issuance cost of $42 |
59,099,720 | 18,870 | — | — | — | — | — | — | 18,870 | |||||||||||||||||||||||||||
| Share-based compensation expense |
— | — | — | — | — | 342 | — | — | 342 | |||||||||||||||||||||||||||
| Repayment of notes receivable |
— | — | — | — | 13 | — | — | — | 13 | |||||||||||||||||||||||||||
| Net loss and comprehensive loss |
— | — | — | — | — | — | — | (19,843 | ) | (19,843 | ) | |||||||||||||||||||||||||
|
|
|
|
|
|
|
|
|
|
|
|
|
|
|
|
|
|
|
|||||||||||||||||||
| Balances, February 28, 2009 |
346,123,157 | 73,212 | 119,123,993 | 119 | (93 | ) | 215,014 | — | (340,386 | ) | (52,134 | ) | ||||||||||||||||||||||||
| Exercise of options for common stock |
— | — | 7,329,341 | 7 | — | 99 | — | — | 106 | |||||||||||||||||||||||||||
| Issuance of Series D preferred stock, net of issuance cost of $12 |
60,960,950 | 6,085 | — | — | — | — | — | — | 6,085 | |||||||||||||||||||||||||||
| Conversion of notes to Series D preferred stock |
102,513,320 | 10,251 | — | — | — | — | — | — | 10,251 | |||||||||||||||||||||||||||
| Mandatory conversion of preferred stock to common |
(26,818,031 | ) | (6,202 | ) | 26,818,031 | 27 | — | 6,175 | — | — | — | |||||||||||||||||||||||||
| Restricted stock awards |
— | — | — | — | — | 52 | — | — | 52 | |||||||||||||||||||||||||||
| Share-based compensation expense |
— | — | — | — | — | 394 | — | — | 394 | |||||||||||||||||||||||||||
| Forfeiture of common shares upon default of note receivable |
— | — | (2,619,826 | ) | (2 | ) | 93 | (24 | ) | — | — | 67 | ||||||||||||||||||||||||
| Net loss and comprehensive loss |
— | — | — | — | — | — | — | (6,648 | ) | (6,648 | ) | |||||||||||||||||||||||||
|
|
|
|
|
|
|
|
|
|
|
|
|
|
|
|
|
|
|
|||||||||||||||||||
| Balances, February 28, 2010 |
482,779,396 | 83,346 | 150,651,539 | 151 | — | 221,710 | (347,034 | ) | (41,827 | ) | ||||||||||||||||||||||||||
| Exercise of options for common stock |
— | — | 45,020,552 | 45 | — | 405 | — | — | 450 | |||||||||||||||||||||||||||
| Restricted stock awards |
— | — | 5,200,000 | 5 | — | (5 | ) | — | — | — | ||||||||||||||||||||||||||
| Share-based compensation expense |
— | — | — | — | — | 577 | — | — | 577 | |||||||||||||||||||||||||||
| Net income and comprehensive income |
— | — | — | — | — | — | — | 6,643 | 6,643 | |||||||||||||||||||||||||||
|
|
|
|
|
|
|
|
|
|
|
|
|
|
|
|
|
|
|
|||||||||||||||||||
| Balances, February 28, 2011 |
482,779,396 | 83,346 | 200,872,091 | 201 | — | 222,687 | — | (340,391 | ) | (34,157 | ) | |||||||||||||||||||||||||
| Exercise of options for common stock (unaudited) |
— | — | 3,008,233 | 3 | — | 28 | — | — | 31 | |||||||||||||||||||||||||||
| Issuance of Series CC preferred stock upon exercise of warrants (unaudited) |
452,813 | 145 | — | — | — | — | — | — | 145 | |||||||||||||||||||||||||||
| Vesting of early exercised options (unaudited) |
— | — | 5,914,813 | 6 | — | 53 | — | — | 59 | |||||||||||||||||||||||||||
| Share-based compensation expense (unaudited) |
— | — | — | 410 | — | — | 410 | |||||||||||||||||||||||||||||
| Comprehensive loss: |
||||||||||||||||||||||||||||||||||||
| Cumulative translation adjustment (unaudited) |
— | — | — | — | — | — | 3 | — | 3 | |||||||||||||||||||||||||||
| Net loss (unaudited) |
— | — | — | — | — | — | — | (1,086 | ) | (1,086 | ) | |||||||||||||||||||||||||
|
|
|
|||||||||||||||||||||||||||||||||||
| Comprehensive loss (unaudited) |
— | — | — | — | — | — | — | (1,083 | ) | |||||||||||||||||||||||||||
|
|
|
|
|
|
|
|
|
|
|
|
|
|
|
|
|
|
|
|||||||||||||||||||
| Balances, November 30, 2011 (unaudited) |
483,232,209 | $ | 83,491 | 209,795,137 | $ | 210 | — | $ | 223,178 | $ | 3 | $ | (341,477 | ) | $ | (34,595 | ) | |||||||||||||||||||
|
|
|
|
|
|
|
|
|
|
|
|
|
|
|
|
|
|
|
|||||||||||||||||||
The accompanying notes are an integral part of these consolidated financial statements.
F-5
Table of Contents
Consolidated Statements of Cash Flows
(In thousands, except per share data)
| Years Ended February 28, 2011 and 2010 | Nine Months
Ended November 30, |
|||||||||||||||||||
| 2009 | 2010 | 2011 | 2010 | 2011 | ||||||||||||||||
| (Unaudited) | ||||||||||||||||||||
| Cash flows from operating activities: |
||||||||||||||||||||
| Net income(loss) |
$ | (19,843 | ) | $ | (6,648 | ) | $ | 6,643 | $ | 1,350 | $ | (1,086 | ) | |||||||
| Adjustments to reconcile net income (loss) to net cash used in operating activities: |
||||||||||||||||||||
| Stock-based compensation |
342 | 445 | 577 | 311 | 410 | |||||||||||||||
| Depreciation and amortization |
2,660 | 2,323 | 1,859 | 1,440 | 1,150 | |||||||||||||||
| Non-cash interest expense |
197 | — | — | — | — | |||||||||||||||
| Other |
92 | 75 | 10 | 7 | — | |||||||||||||||
| Changes in operating assets and liabilities: |
||||||||||||||||||||
| Accounts receivable, net |
(2,069 | ) | 200 | (1,876 | ) | (1,084 | ) | (2,525 | ) | |||||||||||
| Prepaid expenses and other current assets |
566 | 281 | (147 | ) | 135 | 22 | ||||||||||||||
| Accounts payable and accrued liabilities |
1,220 | (1,341 | ) | 772 | 603 | 983 | ||||||||||||||
| Income taxes payable |
21 | 184 | 12 | — | ||||||||||||||||
| Accrued interest on convertible note |
192 | 145 | — | — | — | |||||||||||||||
| Deferred revenue |
1,986 | (142 | ) | (7,623 | ) | (3,968 | ) | (1,109 | ) | |||||||||||
| Deferred rent |
50 | 240 | (118 | ) | (93 | ) | 29 | |||||||||||||
| Deferred income taxes |
— | — | (193 | ) | — | — | ||||||||||||||
|
|
|
|
|
|
|
|
|
|
|
|||||||||||
| Net cash provided by (used in) operating activities |
(14,607 | ) | (4,401 | ) | 88 | (1,287 | ) | (2,126 | ) | |||||||||||
| Cash flows from investing activities: |
||||||||||||||||||||
| Capital expenditures |
(1,846 | ) | (924 | ) | (785 | ) | (663 | ) | (495 | ) | ||||||||||
| Acquisition of net assets of a business |
(300 | ) | — | — | — | — | ||||||||||||||
| Long-term deposits and restricted cash |
476 | (34 | ) | 17 | (61 | ) | (89 | ) | ||||||||||||
|
|
|
|
|
|
|
|
|
|
|
|||||||||||
| Net cash provided by (used in) investing activities |
(1,670 | ) | (958 | ) | (768 | ) | (724 | ) | (584 | ) | ||||||||||
| Cash flows from financing activities: |
||||||||||||||||||||
| Proceeds from bank debt |
11,392 | 31,760 | 45,592 | 36,232 | 31,102 | |||||||||||||||
| Repayments of bank debt |
(11,072 | ) | (37,743 | ) | (46,462 | ) | (33,486 | ) | (27,710 | ) | ||||||||||
| Proceeds from note payable |
9,915 | — | 2,500 | — | — | |||||||||||||||
| Repayments of note payable |
— | (532 | ) | (730 | ) | (559 | ) | (838 | ) | |||||||||||
| Repayment of capital lease obligations |
(278 | ) | (432 | ) | (263 | ) | (249 | ) | (35 | ) | ||||||||||
| Proceeds from notes receivable from stockholder |
13 | — | — | — | — | |||||||||||||||
| Proceeds from exercise of common share options |
552 | 106 | 573 | 554 | 31 | |||||||||||||||
| Issuance of Series CC preferred stock, net of issuance costs |
8,673 | — | — | — | 145 | |||||||||||||||
| Issuance of Series D preferred stock, net of issuance costs |
— | 6,085 | — | — | — | |||||||||||||||
|
|
|
|
|
|
|
|
|
|
|
|||||||||||
| Net cash provided by (used in) financing activities |
19,195 | (756 | ) | 1,210 | 2,492 | 2,695 | ||||||||||||||
|
|
|
|
|
|
|
|
|
|
|
|||||||||||
| Effect of exchange rate changes on cash and cash equivalents |
— | — | — | — | (2 | ) | ||||||||||||||
|
|
|
|
|
|
|
|
|
|
|
|||||||||||
| Net increase(decrease) in cash and cash equivalents |
2,918 | (6,115 | ) | 530 | 481 | (17 | ) | |||||||||||||
| Cash and cash equivalents at beginning of period |
12,727 | 15,645 | 9,530 | 9,530 | 10,060 | |||||||||||||||
|
|
|
|
|
|
|
|
|
|
|
|||||||||||
| Cash and cash equivalents at end of period |
$ | 15,645 | $ | 9,530 | $ | 10,060 | $ | 10,011 | $ | 10,043 | ||||||||||
|
|
|
|
|
|
|
|
|
|
|
|||||||||||
| Supplemental cash flows information: |
||||||||||||||||||||
| Cash paid during the year: |
— | |||||||||||||||||||
| Interest |
$ | 950 | $ | 314 | $ | 117 | $ | 84 | $ | 137 | ||||||||||
|
|
|
|
|
|
|
|
|
|
|
|||||||||||
| Income taxes |
$ | 2 | $ | 294 | $ | 177 | $ | 177 | $ | 87 | ||||||||||
|
|
|
|
|
|
|
|
|
|
|
|||||||||||
| Property and equipment acquired under notes payable and capital leases |
$ | 813 | $ | 1,648 | $ | 156 | $ | 39 | $ | 152 | ||||||||||
|
|
|
|
|
|
|
|
|
|
|
|||||||||||
| Mandatory conversion of preferred stock to common stock |
— | $ | 6,202 | — | — | — | ||||||||||||||
|
|
|
|
|
|
|
|
|
|
|
|||||||||||
| Cancellation of note receivable from stockholder |
— | $ | 93 | — | — | — | ||||||||||||||
|
|
|
|
|
|
|
|
|
|
|
|||||||||||
| Vesting of early exercised options |
— | — | — | — | $ | 59 | ||||||||||||||
|
|
|
|
|
|
|
|
|
|
|
|||||||||||
| Conversion of notes payable and interest to preferred stock |
$ | 10,197 | $ | 10,251 | — | — | — | |||||||||||||
|
|
|
|
|
|
|
|
|
|
|
|||||||||||
The accompanying notes are an integral part of these consolidated financial statements.
F-6
Table of Contents
Notes to Consolidated Financial Statements
Years Ended February 28, 2009, 2010 and 2011
and the Nine Months Ended November 30, 2010 and 2011 (Unaudited)
(1) Organization and Business Description
E2open, Inc. and subsidiaries (the Company), a Delaware corporation, was incorporated in September 2003. The Company provides cloud-based, on-demand software solutions delivered on an integrated platform that enables companies to collaborate with their trading partners to procure, manufacture, sell and distribute products more efficiently. The Company’s customers depend on outsourced manufacturing strategies and complex trading networks to compete in today’s global economy. They use the Company’s solutions to gain visibility into and control over their trading networks. The Company’s solutions enable its customers and their trading partners to overcome problems arising from communications across disparate systems by offering a reliable source of data, processes and analytics, which its customers rely on as the single version of the truth. The Company’s solutions empower its customers to manage demand they cannot predict and supply they do not control.
The Company’s corporate headquarters are located in Foster City, California, with additional offices in Austin and Dallas, Texas, the United Kingdom, China, Malaysia, and Taiwan.
Risks and Uncertainties
The Company conducts business in a dynamic high-technology industry and believes that changes in any of the following areas could have a material adverse effect on its future financial position, results of operations, or cash flows: advances and trends in new technologies and industry standards; pressures resulting from new applications offered by competitors; changes in certain customer relationships; litigation or claims against the Company based on intellectual property, patent, product, regulatory, or other factors; changes in domestic and international economic or political conditions or regulations; the ability of the Company to finance its operations; and the Company’s ability to attract and retain employees necessary to support its growth, among other things.
(2) Summary of Significant Accounting Policies
Basis of Presentation and Principles of Consolidation
The consolidated financial statements have been prepared in accordance with accounting principles generally accepted in the United States of America (GAAP). Certain reclassifications have been made in the prior year consolidated financial statements to conform to the current year presentation.
The consolidated financial statements include the Company and its wholly owned subsidiaries. All intercompany balances and transactions have been eliminated in consolidation.
Use of Estimates
The preparation of the Company’s consolidated financial statements in conformity with GAAP requires management to make certain estimates and assumptions that affect the reported amounts of assets and liabilities and disclosure of contingent assets and liabilities at the date of the consolidated financial statements and the reported results of operations during the reporting period. Such estimates include the allowance for doubtful accounts, deferred tax asset valuation allowance, unrecognized tax benefits, accrued liabilities, stock-based compensation, and valuation of common and preferred stock. Actual results could differ from those estimates.
F-7
Table of Contents
E2OPEN, INC. AND SUBSIDIARIES
Notes to Consolidated Financial Statements
Years Ended February 28, 2009, 2010 and 2011
and the Nine Months Ended November 30, 2010 and 2011 (Unaudited)
Unaudited Interim Financial Information
The accompanying consolidated balance sheet as of November 30, 2011, the consolidated interim statements of operations and cash flows for the nine months ended November 30, 2010 and 2011 and the interim consolidated statement of stockholders’ deficit and comprehensive loss for the nine months ended November 30, 2011 are unaudited. The unaudited interim financial statements have been prepared on the same basis as the annual consolidated financial statements and, in the opinion of management, reflect all adjustments, which include only normal recurring adjustments, necessary to present fairly the Company’s financial position as of November 30, 2011 and results of operations and cash flows for the nine months ended November 30, 2010 and 2011. The financial data and the other information disclosed in these notes to the consolidated financial statements related to these nine month periods are unaudited. The results of the nine months ended November 30, 2011 are not necessarily indicative of the results to be expected for the fiscal year ending February 29, 2012 or for any other future annual or interim period.
Unaudited Pro-forma Stockholders’ Deficit
The unaudited pro forma stockholders’ deficit as of November 30, 2011 presents the equity-related components of the Company’s consolidated balance sheet assuming the automatic conversion of all outstanding shares of convertible preferred stock and preferred stock warrants into shares of common stock issuable and the proceeds expected to be received in the initial public offering are excluded from such pro forma information.
Financial Instruments and Concentration of Credit Risk
The fair value of the Company’s financial instruments, including cash and cash equivalents, accounts receivable, accounts payable and line of credit approximates their respective carrying value due to their short maturity. The Company estimates the fair value of capital lease obligations and notes payable by discounting the future cash flows of the lease payments. Financial instruments that potentially subject the Company to a concentration of credit risk consist primarily of cash and cash equivalents and accounts receivable. The Company deposits cash and cash equivalents with high quality financial institutions. Accounts receivable are typically unsecured and are derived from sales of subscriptions and services, principally to leading technology and industrial companies. Credit risk is concentrated primarily in North America, Europe, and parts of Asia. The Company performs ongoing credit evaluations of its customers’ financial condition and has historically experienced insignificant credit losses. The Company maintains allowances for estimated credit losses based on management’s assessment of the likelihood of collection.
Cash and Cash Equivalents
The Company considers all highly liquid investments with an original maturity of three months or less to be cash equivalents. As of February 28, 2010 and 2011, and November 30, 2011, the Company’s cash equivalents consisted of money market accounts.
Property and Equipment
Property and equipment are stated at cost. Depreciation is computed using the straight-line method over the estimated useful lives of the assets, generally two to three years. Leasehold improvements are amortized using the straight-line method over the remaining lease term or over the estimated lives of the assets, if shorter.
F-8
Table of Contents
E2OPEN, INC. AND SUBSIDIARIES
Notes to Consolidated Financial Statements
Years Ended February 28, 2009, 2010 and 2011
and the Nine Months Ended November 30, 2010 and 2011 (Unaudited)
Upon sale or retirement of assets, the cost and related accumulated depreciation are removed from the consolidated balance sheet, and any resulting gain or loss is reflected in the consolidated statement of operations.
Software Development and Website Development Costs
The Company capitalizes the costs of software used internally in its operations, primarily for the delivery of its on-demand subscription services. Such capitalized costs are included in property and equipment for perpetual licenses with a useful life greater than one year, and in prepaid expenses and other current assets for term licenses. Management evaluates the useful lives of these assets on an annual basis and tests for impairment whenever events or changes in circumstances occur that could impact the recoverability of these assets. There were no such indicators of impairment during the years ended February 28, 2009, 2010 and 2011. The Company capitalized $274,000, $307,000 and $473,000 of internal use software during the years ended February 28, 2009, 2010 and 2011, and $411,000 and $421,000 for the nine months ended November 30, 2010 and 2011(unaudited). Amortization expense totaled $180,000, $277,000 and $349,000 during the years ended February 28, 2009, 2010 and 2011, and $243,000 and $346,000 for the nine months ended November 30, 2010 and 2011(unaudited). The net book value of capitalized internal use software was $182,000, $299,000 and $333,000 as of February 28, 2010 and 2011, and November 30, 2011 (unaudited).
The Company occasionally externally markets its solution through licenses to customers. The Company did not capitalize the development costs of its customer applications during the years ended February 28, 2010 and 2011, as the cost incurred during the period between technological feasibility and release to customers was not significant. No web site development costs were capitalized during the years ended February 2010 or 2011, and the nine months ended November 30, 2010 and 2011, as such costs were not significant.
Indemnification
The Company includes service level commitments to its customers warranting certain levels of uptime reliability and performance and permitting those customers to receive credits in the event that the Company fails to meet those levels. To date, the Company has not incurred any material costs as a result of such commitments and has not accrued any liabilities related to such obligations in the accompanying consolidated financial statements. The Company has also agreed to indemnify its directors and executive officers for costs associated with any fees, expenses, judgments, fines and settlement amounts incurred by any of these persons in any action or proceeding to which any of those persons is, or is threatened to be, made a party by reason of the person’s service as a director or officer, including any action by the Company, arising out of that person’s services as the Company’s director or officer or that person’s services provided to any other company or enterprise at the Company’s request. The Company maintains director and officer insurance coverage that may enable the Company to recover a portion of any future amounts paid. The Company’s arrangements include provisions indemnifying customers against liabilities if our products infringe a third-party’s intellectual property rights. The Company has not incurred any costs as a result of such indemnifications and has not accrued any liabilities related to such obligations in the accompanying consolidated financial statements.
Impairment of Long-Lived Assets
The Company evaluates its long-lived assets for impairment whenever events or changes in circumstances indicate that the carrying amount of such assets may not be recoverable. Recoverability of assets is measured by a comparison of the carrying amount of an asset to future undiscounted net cash flows expected to be generated by the asset. If such assets are considered to be impaired, the impairment to be recognized is
F-9
Table of Contents
E2OPEN, INC. AND SUBSIDIARIES
Notes to Consolidated Financial Statements
Years Ended February 28, 2009, 2010 and 2011
and the Nine Months Ended November 30, 2010 and 2011 (Unaudited)
measured by the amount by which the carrying amount of the assets exceeds the fair value of the assets. No impairment loss was recorded for the years ended February 28, 2010 and 2011, and the nine months ended November 30, 2010 and 2011.
Revenue Recognition
The Company generates revenue from the sale of subscriptions and professional services, and in limited cases, the sale of perpetual licenses.
Subscription and Support. The Company offers on-demand software applications, or solutions, which enable its customers to have constant access to its solutions without the need to manage and support the software and associated hardware themselves. The Company houses the hardware and software in third-party facilities, and provides its customers with access to the software applications, along with data security and storage, backup, and recovery services. The Company’s customer contracts typically have a term of three years. The Company invoices its customers for subscription and support in advance for annual use of the software solutions. The payment terms typically require customers to pay within 30 to 60 days of the invoice date.
Professional Services. Professional services revenue is primarily derived from fees for enabling services, such as solution consulting, solution deployment, B2B on-boarding and solution support, that help the Company’s customers deploy, manage and support its solutions. These services are sold in conjunction with the sale of the Company’s on-demand software solutions. The Company provides professional services either on a fixed fee or a time and materials basis, and invoices customers either in advance, monthly, or upon reaching project milestones.
The Company enters into arrangements with multiple elements, comprising of subscription and support and professional services. Arrangements with customers typically do not provide the customer with the right to take possession of the software supporting the on-demand application service. The Company commences revenue recognition when all of the following criteria are met: persuasive evidence of an arrangement exists, delivery has occurred or services have been rendered, the seller’s price to the buyer is fixed or determinable, and collectability of the fees is reasonably assured.
The Company evaluates each of these criteria as follows:
Evidence of an Arrangement. The Company considers a noncancelable agreement signed by it and the customer to be evidence of an arrangement.
Delivery. The Company typically considers delivery to have occurred when the on-demand software solutions are made available to the customer or services have been rendered.
Fixed or Determinable Fee. The Company considers the fee to be fixed or determinable unless the fee is subject to refund or adjustment or is not payable within its standard payment terms. If the fee is not fixed or determinable, the Company recognizes the revenue as amounts become due and payable.
Collectability of the Fees Is Reasonably Assured. Collectability of the fees is reasonably assured if the Company expects that the customer will be able to pay amounts under the arrangement as payments become due. If the Company determines that collection is not reasonably assured, the Company defers the recognition of revenue until cash collection.
F-10
Table of Contents
E2OPEN, INC. AND SUBSIDIARIES
Notes to Consolidated Financial Statements
Years Ended February 28, 2009, 2010 and 2011
and the Nine Months Ended November 30, 2010 and 2011 (Unaudited)
In October 2009, the FASB amended the accounting standards for multiple deliverable revenue arrangements to:
| • | provide updated guidance on whether multiple deliverables exist, how the deliverables in an arrangement should be separated, and how the consideration should be allocated; |
| • | require an entity to allocate revenue in an arrangement using estimated selling prices, or ESP, of each deliverable if a vendor does not have vendor-specific objective evidence of selling price, or VSOE, or third-party evidence of selling price, or TPE; and |
| • | eliminate the use of the residual method and require a vendor to allocate revenue using the relative selling price method. |
The Company adopted this accounting guidance March 1, 2011 (the beginning of our fiscal 2012) on a prospective basis for applicable transactions originating or materially modified after February 28, 2011.
Prior to the adoption of this guidance, the Company determined that it did not have objective and reliable evidence of fair value for each deliverable of our arrangements. As a result, the Company accounted for subscription and professional services revenue as a single unit of accounting and recognized the total arrangement fee ratably over the contractual term of the subscription agreement.
Upon adoption of this guidance, the Company accounts for subscription fees and professional services revenue as separate units of accounting and allocates revenue to each deliverable in an arrangement based on a selling price hierarchy. As the Company has been unable to establish VSOE or TPE for the elements of its arrangements, the Company determines the ESP for each element primarily by considering prices we charge for similar offerings, size of the order and historical pricing practices. Revenue allocated to subscription and support is recognized over the contractual term. Revenue allocated to professional services is recognized as services are delivered.
During the nine months ended November 30, 2011, total revenue as reported and total revenue that would have been reported, if the transactions entered into or materially modified after February 28, 2011 were subject to previous accounting guidance, are shown in the following table (unaudited, in thousands):
| As reported | Basis as if Previous accounting guidance were in effect |
Impact of adoption of the new accounting guidance |
||||||||||
| (in thousands) | ||||||||||||
| Total revenues for the nine months ended November 30, 2011 |
||||||||||||
| Subscription and support |
$ | 26,563 | $ | 25,706 | $ | 857 | ||||||
| Professional Services |
16,099 | 9,772 | 6,327 | |||||||||
|
|
|
|
|
|
|
|||||||
| Total |
$ | 42,662 | $ | 35,478 | $ | 7,184 | ||||||
|
|
|
|
|
|
|
|||||||
The $7.2 million impact of the adoption of the new accounting guidance was due to deferral of revenue on certain arrangements until the on-demand solutions were fully implemented under the previous accounting guidance. With the adoption of the new accounting guidance, the Company recognizes revenue for subscription
F-11
Table of Contents
E2OPEN, INC. AND SUBSIDIARIES
Notes to Consolidated Financial Statements
Years Ended February 28, 2009, 2010 and 2011
and the Nine Months Ended November 30, 2010 and 2011 (Unaudited)
and support over the contractual term commencing when the on-demand software solutions are made available to the customer, and for professional services, as services are delivered.
Out-of-pocket expenses reimbursed by customers are recorded as revenue and included in professional services. The costs of professional services are expensed as incurred and included in cost of revenue.
Deferred revenue comprises amounts that have been invoiced to customers for which the related services have not been fully delivered. Amounts that will not be earned for more than 12 months were $16,673,000, $17,124,000 and $7,831,000 as of February 28, 2010 and 2011, and November 30, 2011 (unaudited), respectively, and are included in long-term deferred revenue.
The Company excludes from revenue sales and other taxes collected on behalf of customers and remitted to governmental authorities.
Cost of Revenue
Cost of revenue consists primarily of costs related to third party hosting of our equipment and software applications, software license fees, salaries and benefits of our operations, professional services, and support personnel, and allocated facilities, information technology and supporting overhead costs.
Advertising Costs
Advertising costs, which include primarily print materials and sponsorship of events, are expensed as incurred, and included in sales and marketing expense in the consolidated statements of operations. Advertising expense for the years ended February 28, 2009, 2010 and 2011 was $294,000, $547,000 and $761,000, and $666,000 and $836,000 for the nine months ended November 30, 2010 and 2011(unaudited).
Sales Commissions
Sales commissions are expensed as incurred, and included in sales and marketing expense in the consolidated statements of operations.
Stock-based Compensation
Stock-based compensation expense associated with awards to employees and directors is measured at the grant date based on the fair value of the award, and is recognized on a straight-line basis over the requisite service period of the award, which is generally four years.
Foreign Currency Translation
The functional currency of the Company’s foreign subsidiaries is the U.S. dollar, except for the subsidiary located in the United Kingdom. Accordingly, the consolidated financial statements of those subsidiaries that are maintained in the local currency are remeasured into U.S. dollars at the reporting date. Unrealized exchange losses from the remeasurement of monetary assets and liabilities that are not denominated in U.S. dollars are included as a component of other expense in the consolidated statements of operations, and totaled $139,000, $27,000 and $53,000 for the years ended February 28, 2009, 2010 and 2011, respectively, and $54,000 and $76,000 for the nine months ended November 30, 2010 and 2011(unaudited).
F-12
Table of Contents
E2OPEN, INC. AND SUBSIDIARIES
Notes to Consolidated Financial Statements
Years Ended February 28, 2009, 2010 and 2011
and the Nine Months Ended November 30, 2010 and 2011 (Unaudited)
The functional currency of the Company’s subsidiary in the United Kingdom is British pound sterling. Assets and liabilities of foreign subsidiaries, where functional currencies are the local currency, are translated into U.S. dollars at the exchange rate in effect at the balance sheet date. Operating accounts are translated at an average rate of exchange for the respective accounting periods. Translation adjustments result from the process of translating foreign currency financial statements into U.S. dollars and are reported separately as a component of accumulated other comprehensive income. Transaction gains and losses reflected in the functional currencies are charged to income at the time of the transaction.
Net transaction gains (loss) recorded in the statements of operations were $(133,000), $3,000 and $108,000 for the years ended February 28, 2009, 2010 and February 28, 2011, and $53,000 and $(115,000) for the nine months ended November 30, 2010 and 2011.
Interest and Other Expense, Net
Interest and other expense, net for the periods presented consisted of the following (in thousands):
| Years Ended February 28, | Nine Months Ended November 30, |
|||||||||||||||||||
| 2009 | 2010 | 2011 | 2010 | 2011 | ||||||||||||||||
| (Unaudited) | ||||||||||||||||||||
| Interest expense |
$ | 1,301 | $ | 393 | $ | 115 | $ | 84 | $ | 138 | ||||||||||
| Bank financing fees |
226 | 149 | 178 | 132 | 131 | |||||||||||||||
| Foreign exchange (gains) and losses—realized and unrealized, net |
272 | 24 | (55 | ) | 1 | 191 | ||||||||||||||
| Derivative loss |
78 | — | — | — | — | |||||||||||||||
| Interest income |
(208 | ) | (25 | ) | (5 | ) | (4 | ) | (3 | ) | ||||||||||
| Other, net |
(51 | ) | (9 | ) | 26 | 6 | — | |||||||||||||
|
|
|
|
|
|
|
|
|
|
|
|||||||||||
| $ | 1,618 | $ | 532 | $ | 259 | $ | 219 | $ | 457 | |||||||||||
|
|
|
|
|
|
|
|
|
|
|
|||||||||||
Income Taxes
The Company uses the asset and liability method for income taxes. Under this method, deferred tax assets and liabilities are determined based on differences between the consolidated financial statement carrying amounts and tax bases of assets and liabilities and operating loss and tax credit carryforwards, and are measured using the enacted tax rates that are expected to be in effect when the differences reverse. The effect on deferred tax assets and liabilities of a change in tax rates is recognized in income in the period that includes the enactment date. Valuation allowances are established when necessary to reduce deferred tax assets to an amount that, in the opinion of management, is more likely than not to be realized.
Net Income (Loss) Per Share Attributable to Common Stockholders
Basic and diluted net income (loss) per common share is presented in conformity with the two-class method required for participating securities. Holders of Series AA, Series BB, Series CC and Series D convertible preferred stock are each entitled to receive noncumulative dividends out of any funds legally available, when, as and if declared by the board of directors, payable prior and in preference to any dividends on any shares of the Company’s common stock. The dividend rates for Series AA, Series BB, Series CC and D are
F-13
Table of Contents
E2OPEN, INC. AND SUBSIDIARIES
Notes to Consolidated Financial Statements
Years Ended February 28, 2009, 2010 and 2011
and the Nine Months Ended November 30, 2010 and 2011 (Unaudited)
8% of the original issuance price of $0.38, $0.32, $0.32 and $0.10 per share. In the event a dividend is paid on common stock, the holders of the convertible preferred stock are entitled to a proportionate share of any such dividend as if they were holders of common stock (on an as-if converted basis).
Under the two-class method, net income (loss) attributable to common stockholders is determined by allocating undistributed earnings, calculated as net income less current period convertible preferred stock non-cumulative dividends, between common stock and preferred stock. In computing diluted net income (loss) attributable to common stockholders, undistributed earnings are re-allocated to reflect the potential impact of dilutive securities. Basic net income (loss) per common share is computed by dividing the net income (loss) attributable to common stockholders by the weighted-average number of common shares outstanding during the period. Shares of common stock subject to repurchase resulting from the early exercise of employee stock options are considered participating securities and are therefore included in the basic weighted-average common shares outstanding. Diluted net income per share attributable to common stockholders is computed by dividing the net income attributable to common stockholders by the weighted-average number of common shares outstanding, including potential dilutive common shares assuming the dilutive effect of outstanding stock options using the treasury stock method.
The presentation of basic and diluted net income (loss) per share for the year ended February 28, 2011 has been revised to apply the two-class method.
The following table sets forth the computation of basic and diluted net income (loss) per share (in thousands, except share data):
| Years Ended February 28, | Nine Months Ended November 30, |
|||||||||||||||||||
| 2009 | 2010 | 2011 | 2010 | 2011 | ||||||||||||||||
| (Unaudited) | ||||||||||||||||||||
| Net income (loss) attributable to common stockholders |
||||||||||||||||||||
| Net income (loss) |
$ | (19,843 | ) | $ | (6,648 | ) | $ | 6,643 | $ | 1,350 | $ | (1,086 | ) | |||||||
| Less: undistributed earnings allocated to preferred stockholders |
— | — | (6,643 | ) | (1,350 | ) | — | |||||||||||||
|
|
|
|
|
|
|
|
|
|
|
|||||||||||
| Net income (loss) attributable to common stockholders |
$ | (19,843 | ) | $ | (6,648 | ) | — | — | $ | (1,086 | ) | |||||||||
|
|
|
|
|
|
|
|
|
|
|
|||||||||||
| Basic shares: |
||||||||||||||||||||
| Weighted average common shares outstanding |
115,390 | 152,542 | 202,569 | 199,486 | 215,241 | |||||||||||||||
| Less: weighted average unvested common shares subject to repurchase or cancellation |
— | (5,200 | ) | — | — | (9,445 | ) | |||||||||||||
|
|
|
|
|
|
|
|
|
|
|
|||||||||||
| 115,390 | 147,342 | 202,569 | 199,486 | 205,796 | ||||||||||||||||
|
|
|
|
|
|
|
|
|
|
|
|||||||||||
| Diluted shares: |
||||||||||||||||||||
| Weighted average common shares outstanding |
|
115,390 |
|
152,542 | 202,569 | 199,486 | 215,241 | |||||||||||||
| Less: Weighted average unvested common shares subject to repurchase or cancellation |
— | (5,200 | ) | — | — | (9,445 | ) | |||||||||||||
| Add: Incremental shares under stock compensation plans |
— | — | — | — | — | |||||||||||||||
| Add: assumed conversion of preferred stock |
— | — | — | — | — | |||||||||||||||
|
|
|
|
|
|
|
|
|
|
|
|||||||||||
| 115,390 | 147,342 | 202,569 | 199,486 | 205,796 | ||||||||||||||||
|
|
|
|
|
|
|
|
|
|
|
|||||||||||
| Net income (loss) per share attributable to common stock holders: |
||||||||||||||||||||
| Basic |
$ | (0.17 | ) | $ | (0.05 | ) | $ | — | $ | — | $ | (0.01 | ) | |||||||
|
|
|
|
|
|
|
|
|
|
|
|||||||||||
| Diluted |
$ | (0.17 | ) | $ | (0.05 | ) | $ | — | $ | — | $ | (0.01 | ) | |||||||
|
|
|
|
|
|
|
|
|
|
|
|||||||||||
F-14
Table of Contents
E2OPEN, INC. AND SUBSIDIARIES
Notes to Consolidated Financial Statements
Years Ended February 28, 2009, 2010 and 2011
and the Nine Months Ended November 30, 2010 and 2011 (Unaudited)
The following outstanding options and warrants were excluded from the computation of diluted net income (loss) per share in the periods presented because including them would have had an antidilutive effect (in thousands):
| Years Ended February 28, | Nine Months Ended November 30, |
|||||||||||||||||||
| 2009 | 2010 | 2011 | 2010 | 2011 | ||||||||||||||||
| (Unaudited) | ||||||||||||||||||||
| Options to purchase common stock |
99,343 | 98,738 | 33,578 | 33,273 | 98,567 | |||||||||||||||
| Convertible preferred stock |
346,123 | 516,465 | 516,465 | 516,465 | 517,002 | |||||||||||||||
| Preferred stock warrants |
9,398 | 9,398 | 9,398 | 9,398 | 6,620 | |||||||||||||||
| Unvested common shares subject to repurchase |
— | 5,200 | — | — | 6,327 | |||||||||||||||
Unaudited Pro Forma Net Income (Loss) Per Share Attributable to Common Stockholders
Pro forma basic and diluted net income per share were computed to give effect to the conversion of the preferred stock and certain preferred stock warrants using the as-if-converted into common shares method as though the conversion had occurred as of the beginning of the period or the original date of issuance, if later (in thousands, except per share data).
| Year
Ended February 28, 2011 |
Nine
Months Ended November 30, 2011 |
|||||||
| (Unaudited) | ||||||||
| Net income (loss) attributable to common stockholders |
$ | 6,643 | $ | (1,086 | ) | |||
|
|
|
|
|
|||||
| Basic Shares: |
||||||||
| Weighted average common shares outstanding |
202,569 | 215,190 | ||||||
| Less: weighted average unvested common shares subject to repurchase or cancellation |
— | |
(9,445 |
) | ||||
| Pro forma adjustment to reflect assumed conversion of preferred stock to occur upon consummation of the Company's expected initial public offering |
517,002 | 517,002 | ||||||
| Pro forma adjustment to reflect assumed conversion of warrants to acquire preferred stock to occur upon consummation of the Company's expected initial public offering |
6,620 | 6,620 | ||||||
|
|
|
|
|
|||||
| 726,191 | 729,368 | |||||||
|
|
|
|
|
|||||
| Diluted shares: |
||||||||
| Weighted average common shares outstanding |
202,569 | 215,190 | ||||||
| Less: Weighted average unvested common shares subject to repurchase or cancellation |
— | (9,445 | ) | |||||
| Add: Incremental shares under stock compensation plans |
33,578 | — | ||||||
| Pro forma adjustment to reflect assumed conversion of preferred stock to occur upon consummation of the Company's expected initial public offering |
517,002 | 517,002 | ||||||
| Pro forma adjustment to reflect assumed conversion of warrants to acquire preferred stock to occur upon consummation of the Company's expected initial public offering |
6,620 | 6,620 | ||||||
|
|
|
|
|
|||||
| 759,769 | |
729,368 |
| |||||
|
|
|
|
|
|||||
| Net income (loss) per share attributable to common stockholders: |
||||||||
| Basic |
$ | 0.01 | $ | — | ||||
|
|
|
|
|
|||||
| Diluted |
$ | 0.01 | $ | — | ||||
|
|
|
|
|
|||||
F-15
Table of Contents
E2OPEN, INC. AND SUBSIDIARIES
Notes to Consolidated Financial Statements
Years Ended February 28, 2009, 2010 and 2011
and the Nine Months Ended November 30, 2010 and 2011 (Unaudited)
Segment Information
The Company reports information about the segments of its business based on how the information is used by the chief operating decision maker. Since inception, management has evaluated the Company’s performance and made operating decisions based on consolidated results. Accordingly, the Company operates as one reportable segment.
Recently Issued or Adopted Authoritative Accounting Guidance
Effective March 1, 2011, the Company adopted new authoritative guidance for revenue recognition which revised existing guidance for arrangements with multiple deliverables. The revised guidance establishes a selling price hierarchy for determining the selling price of a deliverable, which includes: (i) vendor-specific objective evidence, or VSOE, if available; (ii) third-party evidence, or TPE, if VSOE is not available; and (iii) estimated selling price, or ESP, if neither VSOE nor TPE is available. The revised guidance also eliminates the residual method of allocation and requires that arrangement consideration be allocated at the inception of the arrangement to all deliverables using the relative selling price method. Under the previous accounting guidance, the Company treated its multiple element arrangements as a single unit of accounting as the Company generally did not have VSOE for its undelivered elements. Under the new guidance, the Company is required to use ESP when neither VSOE nor TPE is available. As a result, the Company recognizes the estimated selling price of the elements as they are delivered, assuming all other revenue recognition criteria are met.
This new guidance applies prospectively to revenue arrangements entered into or materially modified in fiscal years beginning after June 15, 2010. The Company has adopted this standard on a prospective basis, effective on March 1, 2011.
On May 12, 2011, the FASB issued new guidance about fair value measurement and disclosure requirements. The new standards do not extend the use of fair value but, rather, provide guidance about how fair value should be applied where it already is required or permitted under International Financial Reporting Standards or U.S. GAAP. A public entity is required to apply the guidance prospectively for interim and annual periods beginning after December 15, 2011, and early adoption is not permitted. The Company does not expect the adoption of the new accounting guidance will have a material impact on the consolidated financial statements.
On June 16, 2011, the FASB issued new guidance on the presentation of other comprehensive income (loss) in financial statements. Under this new accounting guidance, an entity will have the option to present the components of net income and comprehensive income in either one or two consecutive financial statements. The accounting guidance eliminates the option in U.S. GAAP to present other comprehensive income in the statement of changes in equity. An entity should apply the new accounting guidance retrospectively. For a public entity, the new accounting guidance is effective for fiscal years, and interim periods within those years, beginning after December 15, 2011. Early adoption is permitted. The Company plans to adopt the provisions of the new accounting guidance in the year ending February 28, 2013. The adoption of this accounting update will have no impact on the Company’s financial position, results of operations, or cash flows.
F-16
Table of Contents
E2OPEN, INC. AND SUBSIDIARIES
Notes to Consolidated Financial Statements
Years Ended February 28, 2009, 2010 and 2011
and the Nine Months Ended November 30, 2010 and 2011 (Unaudited)
(3) Consolidated Balance Sheet Components
Consolidated balance sheet components as of the periods presented consisted of the following (in thousands):
| February 28, | November
30, 2011 |
|||||||||||
| 2010 | 2011 | |||||||||||
| (Unaudited) | ||||||||||||
| (a) Prepaid expenses and other current assets: |
||||||||||||
| Prepaid hardware and software maintenance |
$ | 745 | $ | 436 | $ | 309 | ||||||
| Deferred Initial Public Offering Costs |
— | 203 | 235 | |||||||||
| Prepaid employee benefits premiums |
148 | 161 | 45 | |||||||||
| Prepaid marketing |
115 | 151 | 128 | |||||||||
| Restricted cash |
— | 40 | 40 | |||||||||
| Other prepaids and other current assets |
286 | 613 | 826 | |||||||||
|
|
|
|
|
|
|
|||||||
| $ | 1,294 | $ | 1,604 | $ | 1,583 | |||||||
|
|
|
|
|
|
|
|||||||
| (b) Allowance for doubtful accounts: |
||||||||||||
| Balance, beginning of year |
$ | 134 | $ | 96 | $ | 28 | ||||||
| Add: Provision for (recovery of) doubtful accounts |
54 | (39 | ) | 43 | ||||||||
| Less write-offs |
(92 | ) | (29 | ) | — | |||||||
|
|
|
|
|
|
|
|||||||
| Balance, end of year |
$ | 96 | $ | 28 | $ | 71 | ||||||
|
|
|
|
|
|
|
|||||||
| (c) Property and equipment, net: |
||||||||||||
| Computer equipment |
$ | 13,233 | $ | 13,654 | $ | 14,206 | ||||||
| Software |
8,444 | 8,778 | 8,913 | |||||||||
| Furniture and fixtures |
61 | 61 | 68 | |||||||||
| Leasehold improvements |
515 | 422 | 430 | |||||||||
|
|
|
|
|
|
|
|||||||
| 22,253 | 22,915 | 23,617 | ||||||||||
| Less accumulated depreciation and amortization |
(19,533 | ) | (21,026 | ) | (22,173 | ) | ||||||
|
|
|
|
|
|
|
|||||||
| $ | 2,720 | $ | 1,889 | $ | 1,444 | |||||||
|
|
|
|
|
|
|
|||||||
Specific incremental costs directly associated with the Company’s initial public offering, or IPO, primarily legal, accounting and printing costs, were deferred and reflected as an asset until reclassification to stockholders’ equity (deficit) upon closing of the IPO.
Equipment and software under capital leases included above aggregated $1,503,000, $2,573,000 and $0 as of February 28, 2010 and 2011, and as of November 30, 2011 (unaudited). Accumulated amortization on these assets aggregated $560,000, $1,865,000 and $0 as of February 28, 2010 and 2011, and as of November 30, 2011(unaudited). Amortization of assets held under capital leases is included with depreciation expense.
F-17
Table of Contents
E2OPEN, INC. AND SUBSIDIARIES
Notes to Consolidated Financial Statements
Years Ended February 28, 2009, 2010 and 2011
and the Nine Months Ended November 30, 2010 and 2011 (Unaudited)
Other assets consist primarily of security deposits held by lessors of the Company’s office facilities and the noncurrent portion of prepaid expenses (in thousands).
| February 28, | November
30, 2011 |
|||||||||||
| 2010 | 2011 | |||||||||||
| (Unaudited) | ||||||||||||
| (d) Accounts payable and accrued liabilities: |
||||||||||||
| Accrued compensation costs |
$ | 2,933 | $ | 3,701 | $ | 4,916 | ||||||
| Trade accounts payable |
1,237 | 1,537 | 1,604 | |||||||||
| Accrued taxes |
1,683 | 1,509 | 1,361 | |||||||||
| Other accrued liabilities |
457 | 333 | 386 | |||||||||
|
|
|
|
|
|
|
|||||||
| $ | 6,310 | $ | 7,080 | $ | 8,267 | |||||||
|
|
|
|
|
|
|
|||||||
| (e) Other noncurrent liabilities |
||||||||||||
| Deferred rent |
$ | 322 | $ | 205 | $ | 235 | ||||||
| Accrued taxes |
— | 285 | 285 | |||||||||
| Unvested stock options subject to repurchase |
— | 122 | 63 | |||||||||
|
|
|
|
|
|
|
|||||||
| $ | 322 | $ | 612 | $ | 583 | |||||||
|
|
|
|
|
|
|
|||||||
(4) Restricted Cash
Restricted cash is classified as current or long-term based on when the restrictions expire, and consists of a certificate of deposit, which secures a standby letter of credit in connection with an operating lease. Restricted cash is included in prepaid expenses and other current assets, and other assets in the balance sheet.
(5) Acquisition of Net Assets of a Business
In April 2008, the Company acquired certain assets and liabilities of SigmaTrak, Inc. (SigmaTrak) for cash consideration of $300,000. All acquired tangible and intangible assets and assumed liabilities were recorded at their estimated fair value at the date of the asset purchase and the results of operations of SigmaTrak have been included in the consolidated statement of operations of the Company since the acquisition date. Net tangible assets acquired included accounts receivable, property and equipment, and accrued liabilities.
(6) Credit Facility
The Company maintains a credit facility having a total borrowing limit of $20,000,000 as of February 28, 2011 with a commercial bank. Of the total facility, $17,500,000 consists of formula-based lines of credit secured by the Company’s accounts receivable, and $2,500,000 is a term loan. Amounts outstanding under the credit facility bear interest at a rate equal to the Wall Street Journal “prime rate” plus additional interest ranging from 1.25% to 4.00%, with a floor for the prime rate of 3.25%.
The bank lines of credit and term loan are secured by the Company’s tangible and intangible assets, as well as a negative pledge whereby the Company agrees not to give any creditor a security interest in the Company’s intellectual property. In connection with this credit facility, warrants were issued to Bridge Bank to purchase 2,460,937 shares of Series BB preferred stock in March 2005 (note 14). Amounts outstanding under the lines of credit were $6,330,000 and $5,460,000 as of February 28, 2010 and February 28, 2011.
F-18
Table of Contents
E2OPEN, INC. AND SUBSIDIARIES
Notes to Consolidated Financial Statements
Years Ended February 28, 2009, 2010 and 2011
and the Nine Months Ended November 30, 2010 and 2011 (Unaudited)
The Company borrowed $2,500,000 against the term loan on February 10, 2011. The Company was obligated to make interest-only payments on amounts drawn through April 10, 2011. On April 30, 2011, the principal balance outstanding was converted to a term loan payable in 30 monthly installments of principal plus accrued interest. The amount outstanding under the term loan was $2,500,000 as of February 28, 2011 and is recorded in notes payable on the balance sheet.
In August 2011, the Company amended its credit facility to increase the total borrowing limit to $22,250,000 and to extend the term of the lines of credit through February 2012 and the term loan through February 2015. As of November 30, 2011 (unaudited), the amounts outstanding under the lines of credit were $8,850,000, and under the term loan were $1,917,000, with $6,979,000 of borrowing capacity available under the lines of credit. In February 2012, the Company further amended its credit facility to increase the total borrowing limit to $26,750,000 and to extend the term of the lines of credit through August 2012 and the term loan through August 2015.
The Company was in compliance with all debt covenants as of February 28, 2011 and as of November 30, 2011.
(7) Notes Payable
In fiscal 2010 and fiscal 2011, the Company financed the purchase of certain software licenses and related support and maintenance with notes payable. The total amount financed was $1,251,000 and $169,000 in fiscal 2010 and fiscal 2011. The terms of the notes are for 12 and 24 months, and the notes bear interest at rates ranging from 2.36% to 3.28% per annum. In fiscal 2011, the Company borrowed $2,500,000 against its growth capital term loan, which converted to a term loan payable in 30 monthly installments. As of February 28, 2011 and November 30, 2011(unaudited), the total principal payments remaining under the equipment notes and the growth capital term loan are $2,757,000, and 1,922,000, and become due as follows (in thousands):
| As of February 28, 2011 |
As of November 30, 2011 |
|||||||
| (Unaudited) | ||||||||
| Fiscal year-end: |
||||||||
| 2012 |
$ | 1,090 | $ | 255 | ||||
| 2013 |
1,001 | 1,001 | ||||||
| 2014 |
666 | 666 | ||||||
|
|
|
|
|
|||||
| $ | 2,757 | $ | 1,922 | |||||
|
|
|
|
|
|||||
(8) Transactions with Customers
The Company purchased hosting capacity and leased equipment from a vendor, who is also a customer, during the years ended February 28, 2009 and 2010. Total amounts paid to this vendor for the hosting capacity was $680,000, $311,000, and $0 during the years ended February 28, 2009, 2010 and 2011, and $0 and $0 for the nine months ended November 30, 2010 and 2011, and was classified as cost of revenue in the consolidated statements of operations. In addition, the Company financed software purchases from this vendor during fiscal 2010 and fiscal 2011 in the amount of $386,000 and $162,000 with notes payable and capital lease obligations. The Company also earns revenue from this vendor in the normal course of business, and such revenue amounted to $5,259,000, $6,161,000, and $3,724,000 or 13.9%, 13.9%, and 6.7% of total revenue, for the years ended February 28, 2009, 2010 and 2011, and $2,809,000 and $3,292,000 or 7.5% and 7.2% of total revenue for the
F-19
Table of Contents
E2OPEN, INC. AND SUBSIDIARIES
Notes to Consolidated Financial Statements
Years Ended February 28, 2009, 2010 and 2011
and the Nine Months Ended November 30, 2010 and 2011 (Unaudited)
nine months ended November 30, 2010 and 2011 (unaudited). The transactions have been recorded at fair value, and the revenue and services are presented on a gross basis, as the Company received an identifiable benefit in exchange for the consideration, and the fair value of such benefit identified can be reasonably estimated and revenue was collected from the customer in cash.
(9) Related Party Transactions
In August 2004, an employee exercised options for common stock via a full recourse promissory note totaling $106,000 which bore interest at 5.25% compounded annually. The note was secured by shares of the Company’s common stock and was due in 2009. The former employee ceased to be employed by the Company in May 2008. In fiscal 2009, the employee repaid a portion of the note amounting to $13,000, and as of February 28, 2009, the outstanding balance of the note was $93,000. In June 2009, the outstanding balance on the full recourse promissory note of $96,000, including accrued interest, was in default. The Company and the former employee agreed to fully settle the former employee’s obligation to the Company via transfer to the Company of the 2,619,826 shares of the Company’s common stock held by the former employee collateralizing the note. At the time the obligation was settled, the fair market value of the collateral was less than the amount of the obligation, and the Company recorded a loss on extinguishment of the debt obligation in the amount of $67,000.
In September and December 2008, and January 2009, the Company issued Subordinated Unsecured Convertible Promissory Notes (Convertible Notes) to certain existing stockholders and employees (Note Investors) for proceeds of $9,915,000. The Convertible Notes bore interest at 6% per annum. On May 29, 2009, the notes and accrued interest were converted into 102,513,320 shares of Series D preferred stock.
The Convertible Notes included certain options available to the Note Investors that were accounted for as an embedded derivative. The estimated fair value of the embedded derivative was calculated using the Binomial-Lattice model and was $1.2 million at the date of issuance. This amount is included in the Convertible Notes payable balance under current liabilities in the consolidated balance sheet as of February 28, 2009. The assumptions used were: no dividends, contractual life of one year, volatility of 75.4% to 82.9%, a risk-free interest rate of 0.57% to 0.65%, and a 100% premium payout. The change in the fair value of the derivative from the issuance date to the balance sheet date of February 28, 2009 of $78,000 was recorded in other expense in the consolidated statement of operations for the year ended February 28, 2009. In May 2009, the notes were converted to Series D preferred stock, and the options expired unexercised.
(10) Commitments and Contingencies
Leases
The Company leases its primary office space under noncancelable operating leases with various expiration dates through 2013. Rent expense for the years ended February 28, 2009, 2010 and 2011 was $1,971,000, $2,115,000 and $1,812,000, and $1,341,000 and $1,278,000 for the nine months ended November 30, 2010 and 2011(unaudited), respectively.
The Company is also obligated under capital leases covering certain equipment that expire at various dates through 2011.
F-20
Table of Contents
E2OPEN, INC. AND SUBSIDIARIES
Notes to Consolidated Financial Statements
Years Ended February 28, 2009, 2010 and 2011
and the Nine Months Ended November 30, 2010 and 2011 (Unaudited)
Future minimum lease payments under noncancelable operating and capital leases as of February 28, 2011 are as follows (in thousands):
| Operating leases |
Capital leases | |||||||
| Year ending: |
||||||||
| February 29, 2012 |
$ | 1,218 | $ | 37 | ||||
| February 28, 2013 |
1,202 | — | ||||||
| February 28, 2014 |
474 | — | ||||||
| February 28, 2015 |
309 | — | ||||||
|
|
|
|
|
|||||
| Total minimum lease payments |
$ | 3,203 | 37 | |||||
|
|
|
|||||||
| Less finance charges |
(2 | ) | ||||||
|
|
|
|||||||
| Present value of minimum capital lease payments |
35 | |||||||
| Current portion of capital lease obligation |
(35 | ) | ||||||
|
|
|
|||||||
| Capital lease obligation, net of current portion |
$ | — | ||||||
|
|
|
|||||||
Several of the operating lease agreements require the Company to provide security deposits. As of February 28, 2010 and 2011, and November 30, 2011, lease deposits totaled $328,000, $315,000 and $336,000. The deposits are generally refundable at the expiration of the lease, assuming all of the Company’s obligations under the lease agreement have been met, and are included in other assets in the consolidated balance sheets.
Contingencies
From time to time, the Company is subject to contingent liabilities that arise in the ordinary course of business. The Company records an accrual for a contingency when it is both probable that a liability has been incurred and the amount of the loss can be reasonably estimated. The Company does not currently believe the resolution of these actions will have a material adverse effect upon the Company’s financial position, results of operations or cash flows.
(11) Restructuring Charges
In 2009, the Company ceased operations in Japan in an effort to reduce operating costs. Total restructuring charges in 2009 were $1.1 million, consisting of termination benefits, facility closure, and other related costs. As of February 28, 2009 and 2010, accrued restructuring charges amounted to $1,025,777 and $0, comprised of the following:
| Termination benefits |
Facility closure costs |
Other closure costs |
Total | |||||||||||||
| Total FY 2009 restructuring charges: |
||||||||||||||||
| $ | 902 | $ | 240 | $ | 4 | $ | 1,146 | |||||||||
| Amounts paid FY2009 |
— | (120 | ) | — | (120 | ) | ||||||||||
|
|
|
|
|
|
|
|
|
|||||||||
| Balance as of February 28, 2009 |
902 | 120 | 4 | 1,026 | ||||||||||||
| Amounts paid FY2010 |
(902 | ) | (120 | ) | (4 | ) | (1,026 | ) | ||||||||
|
|
|
|
|
|
|
|
|
|||||||||
| Balance as of February 28, 2010 |
$ | — | $ | — | $ | — | $ | — | ||||||||
|
|
|
|
|
|
|
|
|
|||||||||
F-21
Table of Contents
E2OPEN, INC. AND SUBSIDIARIES
Notes to Consolidated Financial Statements
Years Ended February 28, 2009, 2010 and 2011
and the Nine Months Ended November 30, 2010 and 2011 (Unaudited)
The workforce reduction payments were paid out in installments through November 2009 and the facility closure amounts were paid out over the remaining lease term through October 2009.
(12) Income Taxes
The following table presents the income or loss before income taxes for domestic and foreign operations (in thousands):
| 2009 | 2010 | 2011 | ||||||||||
| United States |
$ | (19,020 | ) | $ | (7,684 | ) | $ | 6,458 | ||||
| Foreign |
(763 | ) | 1,385 | 218 | ||||||||
|
|
|
|
|
|
|
|||||||
| $ | (19,783 | ) | $ | (6,299 | ) | $ | 6,676 | |||||
|
|
|
|
|
|
|
|||||||
Income tax expense (benefit) consisted of the following (in thousands):
| 2009 | 2010 | 2011 | ||||||||||
| Current: |
||||||||||||
| Federal |
$ | — | $ | 25 | $ | 7 | ||||||
| Foreign |
58 | 319 | 158 | |||||||||
| State |
2 | 5 | 39 | |||||||||
|
|
|
|
|
|
|
|||||||
| Total current tax expense |
60 | 349 | 204 | |||||||||
|
|
|
|
|
|
|
|||||||
| Deferred: |
||||||||||||
| Federal |
— | — | — | |||||||||
| Foreign |
— | — | (171 | ) | ||||||||
| State |
— | — | — | |||||||||
|
|
|
|
|
|
|
|||||||
| Total deferred tax benefit |
— | — | (171 | ) | ||||||||
|
|
|
|
|
|
|
|||||||
| Total income tax expense |
$ | 60 | $ | 349 | $ | 33 | ||||||
|
|
|
|
|
|
|
|||||||
The income tax expense differed from the amounts computed by applying the U.S. federal income tax rate of 35% to pretax income (loss) as a result of the following (in thousands):
| 2009 | 2010 | 2011 | ||||||||||
| Federal tax expense (benefit) at statutory rate |
$ | (6,924 | ) | $ | (2,205 | ) | $ | 2,322 | ||||
| State taxes |
(632 | ) | (251 | ) | 182 | |||||||
| Foreign rate differential |
(57 | ) | 79 | 23 | ||||||||
| Nondeductible expenses |
193 | 142 | 93 | |||||||||
| Foreign withholding tax |
54 | 106 | 50 | |||||||||
| Loss from dissolution of subsidiary |
— | (737 | ) | — | ||||||||
| Research and development credits |
(384 | ) | (364 | ) | (545 | ) | ||||||
| Expired net operating losses |
4,624 | 1,663 | 247 | |||||||||
| Other |
160 | 182 | 377 | |||||||||
| Change in valuation allowance |
3,026 | 1,734 | (2,716 | ) | ||||||||
|
|
|
|
|
|
|
|||||||
| Total tax expense |
$ | 60 | $ | 349 | $ | 33 | ||||||
|
|
|
|
|
|
|
|||||||
F-22
Table of Contents
E2OPEN, INC. AND SUBSIDIARIES
Notes to Consolidated Financial Statements
Years Ended February 28, 2009, 2010 and 2011
and the Nine Months Ended November 30, 2010 and 2011 (Unaudited)
Deferred income taxes reflect the net tax effects of temporary differences between the carrying amounts of assets and liabilities for financial reporting purposes and the amounts used for income tax purposes. The types of temporary differences that give rise to significant portions of the Company’s deferred tax assets and liabilities for the years ended February 28, 2010 and 2011 are set forth below (in thousands):
| 2010 | 2011 | |||||||
| Deferred tax assets: |
||||||||
| Accruals and reserves |
$ | 737 | $ | 868 | ||||
| Deferred revenue |
7,623 | 4,501 | ||||||
| Stock-based compensation |
134 | 73 | ||||||
| State income taxes |
2 | 14 | ||||||
| Net operating loss carryforwards |
96,038 | 96,342 | ||||||
| Property and equipment |
332 | 236 | ||||||
| Credit carryforwards |
3,780 | 4,105 | ||||||
| Other items |
167 | 151 | ||||||
|
|
|
|
|
|||||
| Gross deferred tax assets |
108,813 | 106,290 | ||||||
| Valuation allowance |
(108,813 | ) | (106,097 | ) | ||||
|
|
|
|
|
|||||
| Total deferred tax assets |
— | 193 | ||||||
|
|
|
|
|
|||||
| Deferred tax liabilities: |
||||||||
| Other |
— | — | ||||||
|
|
|
|
|
|||||
| Total deferred tax liabilities |
— | — | ||||||
|
|
|
|
|
|||||
| Net deferred tax assets |
$ | — | $ | 193 | ||||
|
|
|
|
|
|||||
Recognition of deferred tax assets is appropriate when realization of such assets is more likely than not. Realization of deferred tax assets is dependent upon generating sufficient taxable income, carryback of losses, offsetting deferred tax liabilities, and availability of tax planning strategies. As of February 28, 2011, the Company determined that it is not more likely than not that the Company will ultimately realize the benefit of its net deferred tax assets domestically, and in all but one of its foreign operations and has therefore recorded a valuation allowance to reduce the carrying value of these deferred tax assets to zero. The Company has recorded deferred tax assets in one of its foreign operations for the year ended February 28, 2011, and believes that it is more likely than not that these deferred tax assets will be fully realized.
As of February 28, 2011, the Company has net operating loss, or NOL, carryforwards for federal and state income tax purposes of $306.7 million and $158.5 million, respectively, which begin to expire in the years 2023 and 2012, respectively. These NOL carryforwards are likely subject to an annual limitation in future periods under Internal Revenue Code Section 382 and similar state provisions that impose limitations on a corporation’s ability to utilize its NOLs if the corporation experiences an ownership change. The Company believes that there was an ownership change in a prior year. As a result, utilization of the Company’s NOLs in future periods will likely be subject to an annual limitation. Accordingly, the Company has reduced its deferred tax assets based upon the anticipated net operating losses that are expected to expire unutilized due to the annual limitation. Furthermore, the Company has a NOL carryforward for Japan income tax purposes of $1.7 million, which will begin to expire in 2012. The deferred tax asset associated with the NOLs is $96.3 million.
F-23
Table of Contents
E2OPEN, INC. AND SUBSIDIARIES
Notes to Consolidated Financial Statements
Years Ended February 28, 2009, 2010 and 2011
and the Nine Months Ended November 30, 2010 and 2011 (Unaudited)
As of February 28, 2011, the Company had research and development tax credits of $4.9 million and $5.7 million available to reduce future federal and California income taxes, respectively. Federal credit carryforwards expire beginning in 2023. California research and development tax credits carry forward indefinitely.
As of February 28, 2010, the total amount of gross unrecognized tax benefits was $3.4 million, of which $0.1 million, if recognized, would affect the Company’s effective tax rate. As of February 28, 2011, the total amount of gross unrecognized tax benefits was $3.7 million, of which $0.3 million, if recognized, would affect the Company’s effective tax rate. The Company recognizes interest and penalties related to unrecognized tax benefits as a component of income tax expense. The total amount of gross interest and penalties accrued was $140,000 and $147,000 in 2010 and 2011, and was classified as accounts payable and accrued liabilities in the consolidated balance sheets. Management believes that it has adequately provided for any adjustments that may result from tax examinations. However, the outcome of tax audits cannot be predicted with certainty. The Company is not under examination or audit by any taxing authorities.
A reconciliation of the change in gross unrecognized tax benefits, including interest and penalties, is as follows (in thousands):
| 2010 | 2011 | |||||||||
| Balance as of the beginning of the year |
$ | 3,014 | $ | 3,413 | ||||||
| Tax positions related to the current year: |
||||||||||
| Additions |
452 | 283 | ||||||||
| Reductions |
— | — | ||||||||
| Tax positions related to prior year: |
||||||||||
| Additions |
— | — | ||||||||
| Reductions |
— | — | ||||||||
| Settlements |
(53 | ) | — | |||||||
| Lapses in statutes of limitations |
— | — | ||||||||
|
|
|
|
|
|||||||
| Balance as of the end of the year |
$ | 3,413 | $ | 3,696 | ||||||
|
|
|
|
|
|||||||
There is $224,000 of undistributed earnings of the Company’s foreign subsidiaries at February 28, 2011. Federal income taxes have not been provided for on the unremitted earnings of foreign corporations because such earnings are intended to be indefinitely reinvested.
(13) Stockholders’ Equity
Authorized Capital
In May 2009, the Company’s Certificate of Incorporation was amended and restated to authorize the Company to issue up to 1,489,500,000 shares, of which 877,000,000 shares were designated as common stock and 612,500,000 shares were designated as preferred stock. The authorized preferred stock for all periods presented is as follows: (i) 160,000,000 shares of Series AA preferred stock, (ii) 100,000,000 shares of Series BB preferred stock, (iii) 152,500,000 shares of Series CC preferred stock, and (iv) 200,000,000 shares of Series D preferred stock.
F-24
Table of Contents
E2OPEN, INC. AND SUBSIDIARIES
Notes to Consolidated Financial Statements
Years Ended February 28, 2009, 2010 and 2011
and the Nine Months Ended November 30, 2010 and 2011 (Unaudited)
Convertible Preferred Stock
On May 29, 2009, the Company issued to existing holders of preferred stock 163,474,270 shares of Series D Preferred Stock at a purchase price of $0.10 in exchange for the payment of cash proceeds of $6,085,000, net of issuance costs of $12,000, and the conversion of $10,251,000 of subordinated, unsecured convertible notes (note 8), including accrued interest. As a result of the issuance of Series D preferred stock, an antidilution adjustment was made with respect to the Series BB and Series CC preferred stock. Since the $0.10 price per share of the Series D preferred stock was lower than the $0.32 price per share of the Series BB and Series CC preferred stock, the conversion price was lowered to $0.27 post Series D financing. In addition, pursuant to the special mandatory conversion section of the Company’s Certificate of Incorporation (as amended in May 2009), for those stockholders not participating in the Series D issue, 26,818,031 shares of their Series AA, BB, and CC preferred stock were automatically converted into an equal number of shares of the Company’s common stock.
Preemptive Rights
In connection with any issuance or sale of additional stock by the Company, each stockholder holding preferred stock shall have preemptive rights. These preemptive rights shall not apply to (i) the issuance of options, warrants, or similar rights under equity participation plans approved by the Company’s board of directors; (ii) the issuance of stock or rights to acquire stock pursuant to stock splits, stock dividends, or similar transactions; (iii) the issuance of shares upon the conversion of preferred stock; (iv) the issuance of stock or rights to acquire stock pursuant to currently outstanding securities of the Company; (v) the issuance of stock or rights to acquire stock in connection with a bona fide business acquisition permitted by the Company’s stockholders’ agreement; (vi) the issuance of shares in connection with an Initial Public Offering, or IPO; or (vii) the issuance of stock or rights to acquire stock to banks or equipment lessors for debt financing purposes, provided that such issuances are for other than primarily equity financing purposes.
Voting Rights
The holders of Series AA, BB, CC, and D preferred stock are entitled to the number of votes equal to the number of shares of common stock into which such preferred stock is convertible.
Conversion of Preferred Stock
Each share of Series AA preferred stock shall automatically be converted into shares of common stock at the then-applicable conversion price (i) at the election of the holder at any time after the date of issuance of such shares, (ii) immediately prior to the closing of the Company’s sale of its securities in a firm commitment underwritten IPO, or (iii) at any time upon the written election of holders of a majority of the then outstanding Series AA preferred stock.
Each share of Series BB preferred stock shall automatically be converted into shares of common stock at the then-applicable conversion price (i) at the election of the holder at any time after the date of issuance of such shares, (ii) immediately prior to the closing of the Company’s sale of its securities in a firm commitment underwritten IPO at a price per share of at least two times the Series BB preferred original issue price, and resulting in gross proceeds to the Company of not less than $30,000,000, or (iii) at any time upon the written election of holders of a majority of the then outstanding Series BB preferred stock. The conversion rates for the preferred stock are subject to adjustment for dilution, including, but not limited to, stock splits, stock dividends, and stock combinations.
F-25
Table of Contents
E2OPEN, INC. AND SUBSIDIARIES
Notes to Consolidated Financial Statements
Years Ended February 28, 2009, 2010 and 2011
and the Nine Months Ended November 30, 2010 and 2011 (Unaudited)
Each share of Series CC preferred stock shall automatically be converted into shares of common stock at the then-applicable conversion price (i) at the election of the holder at any time after the date of issuance of such shares, (ii) immediately prior to the closing of the Company’s sale of its securities in a firm commitment underwritten IPO at a price per share of at least two times the Series CC preferred original issue price, and resulting in gross proceeds to the Company of not less than $30,000,000, or (iii) at any time upon the written election of holders of a majority of the then outstanding Series CC preferred stock. The conversion rates for the preferred stock are subject to adjustment for dilution, including, but not limited to, stock splits, stock dividends, and stock combinations.
Each share of Series D preferred stock shall automatically be converted into shares of common stock at the then-applicable conversion price (i) at the election of the holder at any time after the date of issuance of such shares, (ii) immediately prior to the closing of the Company’s sale of its securities in a firm commitment underwritten IPO at a price per share of at least two times the Series D preferred original issue price, and resulting in gross proceeds to the Company of not less than $30,000,000, or (iii) at any time upon the written election of holders of a majority of the then outstanding Series D preferred stock. The conversion rates for the preferred stock are subject to adjustment for dilution, including, but not limited to, stock splits, stock dividends, and stock combinations.
Dividends
Dividends shall be made solely at the discretion of the Company’s board of directors. Any dividends, excluding liquidation distributions, shall be made as follows:
| (a) | First, ratably among holders of shares of (i) Series AA preferred stock, (ii) Series BB preferred stock, (iii) Series CC preferred stock, and (iv) Series D preferred stock in cash or other property, until holders of such shares shall have received in any calendar year an amount per share equal to 8.0% of the Series AA preferred original issue price of $0.38, Series BB preferred original issue price of $0.32, Series CC preferred original issue price of $0.32, and Series D preferred original issue price of $0.10. |
| (b) | Thereafter, ratably among the holders of all shares of both preferred and common stock, in cash or other property. |
| In each case, such distributions shall be based upon the issued and outstanding shares on the record date determined by the board of directors. Any such distributions shall be made when, as, and if declared by the board of directors, and shall not accrue or accumulate if not so declared and paid by the board of directors. The provisions of this section shall not apply to (i) any repurchase of common stock by the Company pursuant to agreements that permit the Company to repurchase such common stock upon the occurrence of certain events, such as termination of services to the Company or the exercise of any right of first refusal or similar right; or (ii) any repurchase of any outstanding securities of the Company that is approved by a disinterested majority of the board of directors of the Company. |
Liquidating Distributions
Any liquidating distributions shall be made as follows:
| (a) | First, ratably among holders of shares of Series D preferred stock, in cash or other property, until holders of such shares shall have received an amount per share equal to the Series D Preferred original issue price. |
F-26
Table of Contents
E2OPEN, INC. AND SUBSIDIARIES
Notes to Consolidated Financial Statements
Years Ended February 28, 2009, 2010 and 2011
and the Nine Months Ended November 30, 2010 and 2011 (Unaudited)
| (b) | Second, ratably among holders of shares of Series CC preferred stock, in cash or other property, until holders of such shares shall have received an amount per share equal to the Series CC Preferred original issue price. |
| (c) | Third, ratably among holders of shares of Series BB preferred stock, in cash or other property, until holders of such shares shall have received an amount per share equal to the Series BB Preferred original issue price. |
| (d) | Fourth, ratably among the holders of Series AA preferred stock, in cash or other property, until the holder of such shares shall have received an amount equal to the Series AA original issue price. |
| (e) | Finally, ratably among holders of common stock, in cash or other property. |
In each case, such distributions shall be based upon the issued and outstanding shares on the record date determined by the board of directors for the liquidating distribution. A liquidating event shall include (i) the sale, transfer, or other disposition of all or substantially all of the Company’s assets in a single transaction or a series of related transactions; (ii) a merger, consolidation, or other business combination of the Company with or into another entity (excluding a transaction in which the holders of capital stock of the Company immediately prior to such transaction continue to hold at least 50% of the voting power of the capital stock of the Company or the surviving or acquiring entity); (iii) the disposition by exclusive license, sale, or assignment of all or substantially all of the Company’s intellectual property rights in a single transaction or a series of related transactions; or (iv) a liquidation, dissolution, or winding up of the Company; provided, however, that such a transaction shall not constitute a liquidation event if (A) its sole purpose is to change the state of the Company’s incorporation or to create a holding company that will be owned in substantially the same proportions by the persons who held the Company’s securities immediately prior to such transaction, or (B) holders of more than 50% of the outstanding (i) Series AA preferred stock, (ii) Series BB preferred stock, and (iii) Series CC preferred stock, in each case voting separately as a single class, elect otherwise.
(14) Warrants
In March 2005, in connection with establishing a line of credit with a commercial bank, a warrant was issued to a commercial bank to purchase 2,460,937 shares of Series BB preferred stock at $0.32 per share. As of February 28, 2010 and 2011, these warrants were still outstanding. These warrants will expire in March 2012.
In April 2005, in exchange for providing a personal guarantee on a promissory note issued by the Company to two stockholders, the Company issued warrants to purchase 937,500 and 2,187,500 shares of Series BB preferred stock at $0.32 per share. As of February 28, 2010 and 2011, these warrants were still outstanding. These warrants will expire in April 2012.
In February 2007, in connection with the Company’s Series CC financing, the Company issued 1,562,502 warrants to purchase Series CC preferred stock at $0.32 per share. In October 2011, warrants were exercised by a stockholder to purchase 452,813 shares of Series CC preferred stock at $0.32 per share. The remaining warrants expired unexercised.
In March 2007, in connection with the Company’s Series CC financing, the Company issued 781,248 warrants to purchase Series CC preferred stock at $0.32 per share. In October 2011, these warrants expired unexercised.
F-27
Table of Contents
E2OPEN, INC. AND SUBSIDIARIES
Notes to Consolidated Financial Statements
Years Ended February 28, 2009, 2010 and 2011
and the Nine Months Ended November 30, 2010 and 2011 (Unaudited)
(15) Stock-based compensation
Options and Awards Granted to Employees
The Company maintains a 2003 Stock Plan, or the Plan, which provides for both the direct award of common stock and for the grant of options to purchase common stock. Options granted under the Plan may include nonstatutory stock options, or NSOs, as well as incentive stock options, or ISOs. Only employees are eligible to receive grants of ISOs.
Options under the Plan may be granted for periods of up to 10 years and at prices no less than 85% of the estimated fair value of the underlying shares of common stock on the date of grant as determined by the board of directors; provided, however, that (i) the exercise price of an ISO and NSO shall not be less than 100% and 85% of the estimated fair value of the shares on the date of grant, and (ii) the exercise price of an ISO granted to a 10% stockholder shall not be less than 110% of the estimated fair value of the shares on the date of grant. Options generally vest 25% on the one-year anniversary of the option grant date, and then monthly for three additional years, and are exercisable for a period of 10 years after the date of grant.
Some options granted are immediately exercisable and any unvested portion of the shares acquired upon early exercise is subject to a right of repurchase by the Company upon the employee’s termination at the original purchase price. The right of repurchase lapses as the options vest, which is generally over the four-year vesting period of the related options. As of February 28, 2010 and 2011, and November 30, 2011 there were 0, 12,241,918 and 6,327,105 shares exercised that were subject to repurchase, respectively. The $122,419 and $63,271 aggregate exercise price of the options subject to repurchase as of February 28, 2011 and November 30, 2011, respectively, is recorded in Other noncurrent liabilities and will be amortized to equity as the options vest.
As of February 28, 2011 and November 30, 2011, there were 56,946,638 and 100,938,405 shares of common stock reserved for issuance under the Plan, respectively. In January 2012, the Company’s board of directors and stockholders approved to an increase to the number of stock reserved for issuance under the Plan by 6,000,000 shares.
In May 2009, the Company’s board of directors approved an option repricing program whereby eligible option holders were given an opportunity to elect to have their eligible options (options with exercise price greater than $0.01) amended so that such eligible options would have an exercise price equal to the current fair value of the Company’s common stock on the date of the repricing. The vesting terms of the repriced options were to remain unchanged; however, the repriced options were to have an expiration date two months earlier than the original expiration date. In June 2009, 93,070,963 eligible options of participating employees were repriced to $0.01 per share. Additional incremental compensation expense of $85,000 was to be recorded over the remaining term of the new grants to reflect the excess of the fair value of the exchanged options prior to the repricing over the fair value of the repriced options.
During fiscal 2010, the Company awarded 6,000,000 shares of restricted common stock to certain employees. Upon termination of employment with the Company, 800,000 of the shares were canceled prior to vesting during fiscal 2010, and the remaining 5,200,000 shares vested on March 1, 2010. Total compensation expense for these awards was $52,000, of which $1,000 and $51,000 was recorded in the consolidated statement of operations for the years ended February 28, 2011 and 2010.
F-28
Table of Contents
E2OPEN, INC. AND SUBSIDIARIES
Notes to Consolidated Financial Statements
Years Ended February 28, 2009, 2010 and 2011
and the Nine Months Ended November 30, 2010 and 2011 (Unaudited)
In July 2011, the Company awarded 26,231,250 stock options that were subject to certain financial-based performance requirements that must be achieved by February 2013, and the employee’s continued employment through February 2013, before vesting can occur. For the nine months ended November 30, 2011, the Company had not recognized compensation expense associated with these grants because the Company believes that, based on current and expected operational results, it is not probable that the associated financial performance requirements will be achieved. If such requirements become probable of achievement, compensation cost will be recognized over the estimated service period. To the extent the Company’s estimate of the timing of achievement of the performance requirements changes in the future, the timing of recognition of the related compensation expense may change.
The determination of the fair value of stock-based payment awards on the date of grant using a pricing model is affected by the Company’s stock price as well as by certain assumptions including the Company’s expected stock price volatility over the term of the awards, actual and projected employee stock option exercise behavior, risk-free interest rates, and expected dividends. The estimated grant date fair values of the employee stock options were calculated using the Black Scholes valuation model, based on the following assumptions:
| Years Ended February 28, | Nine months ended November 30, 2011 | |||||||
| 2009 | 2010 | 2011 | ||||||
| (Unaudited) | ||||||||
| Expected term (in years) |
5.73 | 6.08 | 6.08 | 6.08 | ||||
| Expected stock price volatility |
51.0% – 61.0% | 50.8% – 57.7% | 45.9% – 51.9% | 44.0% – 48.0% | ||||
| Risk-free interest rate |
1.8% – 3.6% | 2.4% – 3.0% | 1.8% – 2.8% | 1.4% – 2.5% | ||||
| Expected dividend yield |
— | — | — | — | ||||
The expected term represents the period that stock-based awards are expected to be outstanding, giving consideration to the contractual terms of the stock-based awards, vesting schedules, and expectations of future employee behavior as influenced by changes to the terms of the Company’s stock-based awards. The Company estimated the expected term, using the simplified method due to limited exercise data, to be the period of time between the date of grant and the midpoint between option vesting and expiration. The Company estimated the expected volatility of its common stock based on the average of historical and implied volatility of comparable companies from a representative peer group based on industry and market capitalization data. The risk-free interest rate represents the yield on a constant maturity U.S. Treasury security with a term equal to the expected term of the options. Expected dividend yield is set at 0% because the Company does not expect to pay dividends during the term of the option, and historically has not paid out any dividends to its stockholders. Management made an estimate of expected forfeitures and is recognizing compensation costs only for those equity awards expected to vest.
As of February 28, 2011 and November 30, 2011, the Company had $716,000 and $788,000 of unrecognized compensation costs, excluding estimated forfeitures, related to unvested stock option awards, which are expected to be recognized over a weighted average period of 2.19 years and 2.85 years, respectively.
As of February 28, 2011 and November 30, 2011, there were 10,841,618 and 2,371,477 shares available for future grants under the Plan.
F-29
Table of Contents
E2OPEN, INC. AND SUBSIDIARIES
Notes to Consolidated Financial Statements
Years Ended February 28, 2009, 2010 and 2011
and the Nine Months Ended November 30, 2010 and 2011 (Unaudited)
Activity under the Plan is as follows:
| Number of shares |
Weighted average exercise price |
Weighted average remaining term |
||||||||||
| Balance of options outstanding, February 28, 2009 |
99,025,431 | $ | 0.05 | 7.43 years | ||||||||
| Options granted |
111,707,963 | 0.01 | ||||||||||
| Options exercised |
(7,329,341 | ) | 0.01 | |||||||||
| Options canceled and forfeited |
(104,666,235 | ) | 0.05 | |||||||||
|
|
|
|
|
|||||||||
| Balance of options outstanding, February 28, 2010 |
98,737,818 | 0.01 | 7.21 years | |||||||||
| Options granted |
6,214,000 | 0.04 | ||||||||||
| Options exercised |
(57,262,470 | ) | 0.01 | |||||||||
| Options canceled and forfeited |
(1,584,328 | ) | 0.01 | |||||||||
|
|
|
|
|
|||||||||
| Balance of options outstanding, February 28, 2011 |
46,105,020 | $ | 0.01 | 6.48 years | ||||||||
|
|
|
|
|
|||||||||
| Options granted |
56,902,250 | 0.09 | ||||||||||
| Options exercised |
(3,008,233 | ) | 0.01 | |||||||||
| Options canceled and forfeited |
(1,432,079 | ) | 0.04 | |||||||||
|
|
|
|
|
|||||||||
| Balance of options outstanding, November 30, 2011 (unaudited) |
98,566,958 | $ | 0.06 | 8.09 years | ||||||||
|
|
|
|
|
|||||||||
| Balance of options expected to vest February 28, 2011 |
42,553,349 | 0.01 | 6.32 years | |||||||||
| Balance of options exercisable February 28, 2011 |
25,914,851 | 0.01 | 5.36 years | |||||||||
| Balance of options expected to vest November 30, 2011 (unaudited) |
75,264,560 | 0.05 | 7.64 years | |||||||||
| Balance of options exercisable November 30, 2011 (unaudited) |
34,150,256 | 0.02 | 5.92 years | |||||||||
The weighted average grant date fair value of the employee stock options granted during the years ended February 28, 2009, 2010 and 2011, and for the nine months ended November 30, 2011 (unaudited) was $0.05, $0.01, $0.02 and $0.09.
The intrinsic values of employee stock options exercised during the years ended February 28, 2009, 2010 and 2011, and the nine months ended November 30, 2010 and 2011 were $21,000, $14,000, $334,000, $195,000 and $247,000. The intrinsic values of vested shares as of February 28, 2010 and 2011, and November 30, 2011 were $0, $1,942,000 and $3,054,000.
As of February 28, 2010 and 2011, and as of November 30, 2011, the number of unvested options was 48,278,453, 20,190,169 and 64,416,702.
Compensation expense recorded for share-based payments amounted to $342,000, $445,000, and $577,000 for the years ended February 28, 2009, 2010 and 2011, respectively, and $311,000 and $410,000 for the nine months ended November 30, 2010 and 2011 (unaudited), respectively. No compensation cost was capitalized during the years ended February 28, 2009, 2010 and 2011, and the nine months ended November 30, 2010 and 2011. Compensation expense for the year ended February 28, 2011 included $165,000 recorded to correct expense not originally recorded for the year ended February 28, 2010.
F-30
Table of Contents
E2OPEN, INC. AND SUBSIDIARIES
Notes to Consolidated Financial Statements
Years Ended February 28, 2009, 2010 and 2011
and the Nine Months Ended November 30, 2010 and 2011 (Unaudited)
The table below sets forth the functional classification of stock-based compensation expense for the years ended February 28, 2009, 2010 and 2011, and the nine months ended November 30, 2010 and 2011 (in thousands):
| Years Ended February 28, | Nine Months Ended November 30, |
|||||||||||||||||||
| 2009 | 2010 | 2011 | 2010 | 2011 | ||||||||||||||||
| (Unaudited) | ||||||||||||||||||||
| Cost of revenue |
$ | 85 | $ | 106 | $ | 223 | $ | 111 | $ | 122 | ||||||||||
| Research and development |
58 | 82 | 108 | 61 | 53 | |||||||||||||||
| Sales and marketing |
107 | 155 | 154 | 80 | 135 | |||||||||||||||
| General and administrative |
92 | 102 | 92 | 59 | 100 | |||||||||||||||
|
|
|
|
|
|
|
|
|
|
|
|||||||||||
| $ | 342 | $ | 445 | $ | 577 | $ | 311 | $ | 410 | |||||||||||
|
|
|
|
|
|
|
|
|
|
|
|||||||||||
(16) Fair Value Measurements
Current accounting guidance defines fair value as an exchange price that would be received for an asset or an exit price, or paid to transfer a liability in an orderly transaction between market participants.
As a basis for considering such assumptions, accounting guidance establishes a three-tier value hierarchy, which prioritizes the inputs used in measuring fair value as follows:
Level 1 — Observable inputs such as quoted prices in an active market;
Level 2 — Inputs other than the quoted prices in active markets that are observable either directly or indirectly; and
Level 3 — Unobservable inputs in which there is little or no market data, which requires the Company to develop its own assumptions.
This hierarchy requires the Company to use observable market data, when available, and to minimize the use of unobservable inputs when determining fair value.
On a recurring basis, the Company measures certain financial assets and liabilities at fair value. The Company’s money market accounts and certificate of deposit are classified as Level 1 of the fair value hierarchy because they are valued using quoted market prices. The following table represents the Company’s fair value hierarchy for its financial assets and liabilities measured at fair value as of February 28, 2010 and 2011 and November 30, 2011 (in thousands):
| As of February 28, 2010 | As of February 28, 2011 | As of November 30, 2011 | ||||||||||||||||||||||||||||||||||
| Level 1 | Level 2 | Level 3 | Level 1 | Level 2 | Level 3 | Level 1 | Level 2 | Level 3 | ||||||||||||||||||||||||||||
| Money market accounts |
$ | 3,024 | — | — | $ | 2,028 | — | — | $ | 2,029 | — | — | ||||||||||||||||||||||||
| Certificate of deposit |
78 | — | — | 79 | — | — | 56 | — | — | |||||||||||||||||||||||||||
Money market accounts are included in cash and cash equivalents as of February 28, 2010 and 2011, and November 30, 2011, and the certificate of deposit is classified as restricted cash included in prepaid expenses and other current assets, and other assets.
F-31
Table of Contents
E2OPEN, INC. AND SUBSIDIARIES
Notes to Consolidated Financial Statements
Years Ended February 28, 2009, 2010 and 2011
and the Nine Months Ended November 30, 2010 and 2011 (Unaudited)
In the nine months ended November 30, 2011, the Company sought to hedge the risks associated with exchange rate fluctuations through entry into forward exchange contracts. The contracts are classified as Level 2. The tables below present the notional amounts (at the contract exchange rates), the weighted-average contractual foreign currency exchange rates, and the estimated fair value of our contracts outstanding as of November 30, 2011.
| Notional Sell (Buy) |
Average Contract Rate |
Estimated Fair Value |
||||||||||
| (In thousands, except average contract rate) | ||||||||||||
| Foreign currency forward exchange contracts: |
||||||||||||
| Euro |
$ | 3,434 | 1.37 | $ | 71 | |||||||
| Malaysian Ringgit |
(3,200 | ) | 3.10 | (73 | ) | |||||||
|
|
|
|
|
|||||||||
| Total |
$ | 234 | $ | (2 | ) | |||||||
|
|
|
|
|
|||||||||
The Company entered into all of the foreign exchange contracts with a single counterparty. Generally, the Company has the right of offset for gains earned and losses incurred under these contracts, and therefore has recorded these contracts on a net basis in the balance sheet.
The Company does not use derivatives for speculative or trading purposes.
(17) Significant Customer Information
Customers accounting for 10% or more of revenue or accounts receivable were as follows:
| Years Ended February 28, | ||||||||||||
| 2009 | 2010 | 2011 | ||||||||||
| Percentage of total revenue |
Percentage of total accounts receivable |
Percentage of total revenue |
Percentage of total accounts receivable |
Percentage of total revenue |
Percentage of total accounts receivable | |||||||
| Customer A |
21% | * | * | 25% | 23% | * | ||||||
| Customer B |
18 | * | * | 14 | 12 | 17 | ||||||
| Customer C |
14 | * | 15% | 12 | * | * | ||||||
| Customer D |
* | * | 14 | 10 | * | * | ||||||
| Customer E |
* | * | 12 | * | * | * | ||||||
| * | Indicates less than 10% |
| Nine Months Ended November 30 | ||||||||
| 2010 | 2011 | |||||||
| (Unaudited) | ||||||||
| Percentage of total revenue |
Percentage of total accounts receivable |
Percentage of total revenue |
Percentage of total accounts receivable | |||||
| Customer A |
13% | 22% | 18% | 14% | ||||
| Customer B |
10 | 22 | 12 | 13 | ||||
| Customer C |
* | 10 | * | 10 | ||||
| Customer D |
* | 10 | * | * | ||||
| Customer E |
* | * | * | * | ||||
| * | Indicates less than 10% |
F-32
Table of Contents
E2OPEN, INC. AND SUBSIDIARIES
Notes to Consolidated Financial Statements
Years Ended February 28, 2009, 2010 and 2011
and the Nine Months Ended November 30, 2010 and 2011 (Unaudited)
The majority of revenue from Customer A in the nine months ended November 30, 2010 and fiscal 2011 is related to arrangements which were executed from fiscal 2008 through fiscal 2011 and treated as a single unit of accounting for revenue recognition purposes. All revenue related to these arrangements was recognized from the acceptance of the final deliverable in November 2010 ratably through February 2011, the remaining term of the on-demand subscription and support arrangements.
Revenue from Customer E in fiscal 2010 was recognized upon cancellation of the arrangement by the customer.
Revenue by geographic region, based on the billing address of the customer, was as follows (in thousands):
| Years Ended February 28, | Nine Months Ended November 30, |
|||||||||||||||||||
| 2009 | 2010 | 2011 | 2010 | 2011 | ||||||||||||||||
| (Unaudited) | ||||||||||||||||||||
| United States |
$ | 26,770 | $ | 34,226 | $ | 35,050 | $ | 21,301 | $ | 27,054 | ||||||||||
| Canada |
1,586 | 2,962 | 7,643 | 5,558 | 8,769 | |||||||||||||||
| Europe |
7,264 | 4,324 | 7,018 | 6,071 | 5,325 | |||||||||||||||
| Asia |
2,095 | 2,555 | 4,540 | 3,465 | 1,202 | |||||||||||||||
| South America |
19 | 310 | 1,272 | 958 | 312 | |||||||||||||||
|
|
|
|
|
|
|
|
|
|
|
|||||||||||
| $ | 37,734 | $ | 44,377 | $ | 55,523 | $ | 37,353 | $ | 42,662 | |||||||||||
|
|
|
|
|
|
|
|
|
|
|
|||||||||||
(18) Subsequent Events
The Company evaluated subsequent events through August 3, 2011, the date the annual consolidated financial statements were issued. For the issuance of the financial statements for the nine months ended November 30, 2011, the unaudited interim period presented here, such evaluation has been performed through February 16, 2012.
F-33
Table of Contents
Through and including, , 2012 (the 25th day after the date of this prospectus), all dealers effecting transactions in these securities, whether or not participating in this offering, may be required to deliver a prospectus. This is in addition to a dealer’s obligation to deliver a prospectus when acting as an underwriter and with respect to an unsold allotment or subscription.
Shares
Common Stock
P R O S P E C T U S
BofA Merrill Lynch
William Blair & Company
Pacific Crest Securities
Canaccord Genuity
Needham & Company
, 2012
Table of Contents
PART II
INFORMATION NOT REQUIRED IN THE PROSPECTUS
Item 13. Other Expenses of Issuance and Distribution.
Estimated expenses, other than underwriting discounts and commissions, payable by the Registrant in connection with the sale of the common stock being registered under this registration statement are as follows:
| SEC registration fee |
$ | 9,884 | ||
| FINRA filing fee |
$ | 9,125 | ||
| Listing fee |
* | |||
| Printing and engraving expenses |
* | |||
| Legal fees and expenses |
* | |||
| Accounting fees and expenses |
* | |||
| Blue Sky fees and expenses (including legal fees) |
* | |||
| Transfer agent and registrar fees and expenses |
* | |||
| Miscellaneous |
* | |||
|
|
|
|||
| Total |
$ | * | ||
|
|
|
| * | To be filed by Amendment. |
Item 14. Indemnification of Directors and Officers.
On completion of this offering, the Registrant’s amended and restated certificate of incorporation will contain provisions that eliminate, to the maximum extent permitted by the General Corporation Law of the State of Delaware, the personal liability of the Registrant’s directors and executive officers for monetary damages for breach of their fiduciary duties as directors or officers. The Registrant’s amended and restated certificate of incorporation and bylaws will provide that the Registrant must indemnify its directors and executive officers and may indemnify its employees and other agents to the fullest extent permitted by the General Corporation Law of the State of Delaware.
Sections 145 and 102(b)(7) of the General Corporation Law of the State of Delaware provide that a corporation may indemnify any person made a party to an action by reason of the fact that he or she was a director, executive officer, employee or agent of the corporation or is or was serving at the request of a corporation against expenses (including attorneys’ fees), judgments, fines and amounts paid in settlement actually and reasonably incurred by him or her in connection with such action if he or she acted in good faith and in a manner he or she reasonably believed to be in, or not opposed to, the best interests of the corporation and, with respect to any criminal action or proceeding, had no reasonable cause to believe his or her conduct was unlawful, except that, in the case of an action by or in right of the corporation, no indemnification may generally be made in respect of any claim as to which such person is adjudged to be liable to the corporation.
The Registrant has entered into indemnification agreements with its directors and executive officers, in addition to the indemnification provided for in its amended and restated certificate of incorporation and bylaws, and intends to enter into indemnification agreements with any new directors and executive officers in the future.
The Registrant has purchased and intend to maintain insurance on behalf of each person who is or was a director or officer of the Registrant against any loss arising from any claim asserted against him or her and incurred by him or her in any such capacity, subject to certain exclusions.
The Underwriting Agreement (Exhibit 1.1 hereto) provides for indemnification by the underwriters of the Registrant and its executive officers and directors, and by the Registrant of the underwriters, for certain liabilities, including liabilities arising under the Securities Act.
II-1
Table of Contents
See also the undertakings set out in response to Item 17 herein.
Item 15. Recent Sales of Unregistered Securities.
During the last three years, we sold the following unregistered securities:
(1) From March 1, 2008 through November 30, 2011, we sold and issued to our employees, consultants or former service providers an aggregate of 76,153,810 shares of common stock pursuant to option exercises under the 2003 Stock Plan, as amended, at prices ranging from $0.01 to $0.09 per share for an aggregate purchase price of $ $1,239,858.60.
(2) From March 1, 2008 through November 30, 2011, we granted options under our 2003 Stock Plan, as amended, to purchase an aggregate of 238,768,713 shares of common stock to our employees, directors and consultants, having exercise prices ranging from $0.01 to $0.11 per share for an aggregate exercise price of $9,756,387.
(3) Between October 2006 and July 2008, we sold and issued 105,974,722 shares of Series CC preferred stock to 15 accredited investors, at $0.32 per share, for a total consideration of $33,911,910, including the conversion of subordinated unsecured convertible debt in the amount of $10,197,261.
(4) In May 2009, we sold and issued 163,474,270 shares of Series D preferred stock to 17 accredited investors, at $0.10 per share, for a total consideration of $16.3 million, including the conversion of subordinated unsecured convertible promissory notes in the aggregate principal amount of $9,914,590.
(5) On February 29, 2008, we sold to an accredited investor a subordinated unsecured convertible note in the principal amount of $10,000,000. On June 27, 2008 the outstanding principal and accrued interest on this note was converted into shares of Series CC Preferred Stock at a conversion price of $0.32 as described above.
(6) In September and December 2008 and January 2009, we sold to 17 accredited investors subordinated unsecured convertible promissory notes in an aggregate principal amount of $9,914,590. On May 29, 2009 the outstanding principal and accrued interest on these notes was converted into shares of Series D preferred stock at a conversion price of $0.10.
None of the foregoing transactions involved any underwriters, underwriting discounts or commissions, or any public offering, and the registrant believes that each transaction was exempt from the registration requirements of the Securities Act in reliance on the following exemptions:
| • | with respect to the transactions described in paragraphs (1) and (2), Rule 701 promulgated under the Securities Act as transactions pursuant to a compensatory benefit plan approved by the registrant’s board of directors; and |
| • | with respect to the transactions described in paragraphs (3), (4) and (6), Section 4(2) of the Securities Act, or Rule 506 of Regulation D promulgated thereunder, as transactions by an issuer not involving a public offering. Each recipient of the securities in these transactions represented his or her intention to acquire the securities for investment only and not with a view to, or for resale in connection with, any distribution thereof, and appropriate legends were affixed to the share certificates issued in each such transaction. In each case, the recipient received adequate information about the Registrant or had adequate access, through his or her relationship with the registrant, to information about the Registrant. |
II-2
Table of Contents
Item 16. Exhibits and Financial Statement Schedules.
(a) Exhibits:
See Exhibit Index immediately following the signature pages.
(b) Financial Statement Schedules.
All other schedules have been omitted because the information required to be presented in them is not applicable or is shown in the consolidated financials statements or related notes.
Item 17. Undertakings.
The undersigned Registrant hereby undertakes to provide to the underwriters at the closing specified in the Underwriting Agreement, certificates in such denominations and registered in such names as required by the underwriters to permit prompt delivery to each purchaser.
Insofar as indemnification for liabilities arising under the Securities Act may be permitted to directors, officers and controlling persons of the Registrant pursuant to the foregoing provisions, or otherwise, the Registrant has been advised that in the opinion of the Securities and Exchange Commission such indemnification is against public policy as expressed in the Securities Act and is, therefore, unenforceable. In the event that a claim for indemnification against such liabilities (other than the payment by the Registrant of expenses incurred or paid by a director, officer or controlling person of the Registrant in the successful defense of any action, suit or proceeding) is asserted by such director, officer or controlling person in connection with the securities being registered, the Registrant will, unless in the opinion of its counsel the matter has been settled by controlling precedent, submit to a court of appropriate jurisdiction the question whether such indemnification by it is against public policy as expressed in the Securities Act and will be governed by the final adjudication of such issue.
The undersigned Registrant hereby undertakes that:
| (1) | For purposes of determining any liability under the Securities Act, the information omitted from the form of prospectus filed as part of this Registration Statement in reliance upon Rule 430A and contained in a form of prospectus filed by the Registrant pursuant to Rule 424(b)(1) or (4) or 497(h) under the Securities Act shall be deemed to be part of this Registration Statement as of the time it was declared effective. |
| (2) | For the purpose of determining any liability under the Securities Act, each post-effective amendment that contains a form of prospectus shall be deemed to be a new registration statement relating to the securities offered therein, and the offering of such securities at that time shall be deemed to be the initial bona fide offering thereof. |
| (3) | That, for the purpose of determining liability of the registrant under the Securities Act of 1933 to any purchaser in the initial distribution of the securities: the undersigned Registrant undertakes that in a primary offering of securities of the undersigned Registrant pursuant to this registration statement, regardless of the underwriting method used to sell the securities to the purchaser, if the securities are offered or sold to such purchaser by means of any of the following communications, the undersigned Registrant will be a seller to the purchaser and will be considered to offer or sell such securities to such purchaser: |
| (i) | Any preliminary prospectus or prospectus of the undersigned Registrant relating to the offering required to be filed pursuant to Rule 424; |
| (ii) | Any free writing prospectus relating to the offering prepared by or on behalf of the undersigned Registrant or used or referred to by the undersigned Registrant; |
II-3
Table of Contents
| (iii) | The portion of any other free writing prospectus relating to the offering containing material information about the undersigned Registrant or its securities provided by or on behalf of the undersigned Registrant; and |
| (iv) | Any other communication that is an offer in the offering made by the undersigned Registrant to the purchaser. |
II-4
Table of Contents
SIGNATURES
Pursuant to the requirements of the Securities Act of 1933, the registrant has duly caused this registration statement to be signed on its behalf by the undersigned, thereunto duly authorized, in the City of Foster City, State of California, on February 16, 2012.
| E2OPEN, INC. | ||
| By: | /s/ Mark E. Woodward | |
| Mark E. Woodward President and Chief Executive Officer | ||
POWER OF ATTORNEY
KNOW ALL MEN BY THESE PRESENTS, that each person whose signature appears below constitutes and appoints Mark E. Woodward and Peter J. Maloney, jointly and severally, as his true and lawful attorneys-in-fact and agents, with full power of substitution and resubstitution, for him and in his name, place and stead, in any and all capacities, to sign the Registration Statement on Form S-1 of E2open, Inc. and any or all amendments (including post-effective amendments) thereto and any new registration statement with respect to the offering contemplated thereby filed pursuant to Rule 462(b) of the Securities Act, and to file the same, with all exhibits thereto, and other documents in connection therewith, with the Securities and Exchange Commission, granting unto said attorneys-in-fact and agents full power and authority to do and perform each and every act and thing requisite or necessary to be done in and about the premises hereby ratifying and confirming all that said attorneys-in-fact and agents, or his or their substitute or substitutes, may lawfully do or cause to be done by virtue hereof.
Pursuant to the requirements of the Securities Act of 1933, this registration statement has been signed by the following persons in the capacities and on the dates indicated.
| Signature |
Title |
Date | ||
| /s/ Mark E. Woodward Mark E. Woodward |
Director, President and Chief Executive Officer (Principal Executive Officer) |
February 16, 2012 | ||
| /s/ Peter J. Maloney Peter J. Maloney |
Chief Financial Officer (Principal Financial and Accounting Officer) |
February 16, 2012 | ||
| /s/ John B. Mumford John B. Mumford |
Chairman of the Board of Directors | February 16, 2012 | ||
| /s/ Carl Bass Carl Bass |
Director | February 16, 2012 | ||
| /s/ Johnston L. Evans Johnston L. Evans |
Director | February 16, 2012 | ||
| /s/ Bernard F. Mathaisel Bernard F. Mathaisel |
Director | February 16, 2012 | ||
| /s/ Nicholas G. Moore Nicholas G. Moore |
Director | February 16, 2012 | ||
| /s/ Patrick J. O’Malley, III Patrick J. O’Malley, III |
Director | February 16, 2012 | ||
| /s/ Stephen M. Ward, Jr Stephen M. Ward, Jr. |
Director | February 16, 2012 | ||
II-5
Table of Contents
EXHIBIT INDEX
| Exhibit |
Exhibit Title | |
| 1.1* | Form of Underwriting Agreement. | |
| 3.1 | Amended and Restated Certificate of Incorporation of the Registrant, as currently in effect. | |
| 3.2* | Form of Amended and Restated Certificate of Incorporation of the Registrant, to be effective upon closing of the offering. | |
| 3.3 | Bylaws of the Registrant, as currently in effect. | |
| 3.4* | Form of Amended and Restated Bylaws of the Registrant, to be effective upon closing of the offering. | |
| 4.1* | Specimen Common Stock Certificate of the Registrant. | |
| 4.2 | Registration Rights Agreement, dated June 27, 2005, as amended. | |
| 4.3 | Second Amended and Restated Stockholders Agreement, dated June 27, 2005, as amended. | |
| 4.4* | Form of Warrant to Purchase Shares of Series BB Preferred Stock. | |
| 5.1* | Opinion of Wilson Sonsini Goodrich & Rosati, Professional Corporation. | |
| 10.1*# | Form of Director and Executive Officer Indemnification Agreement. | |
| 10.2# | 2003 Stock Plan, as amended and forms of option agreements thereunder. | |
| 10.3*# | 2012 Equity Compensation Plan and forms of option agreements thereunder to be in effect upon the closing of this offering. | |
| 10.4*# | Offer Letter to Mark E. Woodward, dated June 20, 2008. | |
| 10.5*# | Offer Letter to Peter J. Maloney, dated December 26, 2007. | |
| 10.6*# | Addendum to Offer Letter to Peter J. Maloney, dated June 10, 2008. | |
| 10.7*# | Change of Control Agreement with Peter J. Maloney, dated August 7, 2009. | |
| 10.8*# | Offer Letter to Lorenzo Martinelli, dated October 8, 2001, as amended. | |
| 10.9*# | Offer Letter to David W. Packer, dated August 18, 2008, as amended. | |
| 10.10*# | Offer Letter to Michael A. Schmitt, dated December 13, 2010. | |
| 10.11*# | Offer Letter to Robert Schoenthaler, dated June 18, 2007. | |
| 10.12*# | Change of Control Agreement with Robert Schoenthaler, dated May 22, 2009. | |
| 10.13* | Lease Agreement by and between Bayside Towers, Inc. and the Registrant, dated May 7, 2009. | |
| 10.14* | Lease Agreement by and between TPG--Great Hills Plaza LLC and Registrant, dated September 2, 2005, as amended. | |
| 10.15* | Lease Agreement by and between Teachers Insurance and Annuity Association of America and Registrant, dated April 27, 2005, as amended. | |
| 10.16* | Lease Agreement by and between Inter Heritage (M) Sdn. Bhd. and Registrant, dated November 19, 2007, as amended. | |
| 10.17* | Lease Agreement by and between Asmec Management Associates Ltd and Registrant, dated April 7, 2011, as amended. | |
| 10.18* | Fourth Amended and Restated Business Financing Agreement by and between Bridge Bank and Registrant, dated April 30, 2010. | |
| 10.19* | Fourth Amended and Restated Intellectual Property Security Agreement by and between Bridge Bank and Registrant, dated April 30, 2010. | |
| 21.1 | List of Subsidiaries of the Registrant. | |
| 23.1 | Consent of KPMG, LLP, Independent Registered Public Accounting Firm. | |
| 23.2* | Consent of Wilson Sonsini Goodrich & Rosati, Professional Corporation (included in Exhibit 5.1). | |
| 24.1 | Power of Attorney (see page II-5 to this registration statement on Form S-1). |
| * | To be filed by amendment. |
| # | Indicates a management contract or compensatory plan. |